Article

Numerical Analysis of Factors Affecting NOx Emissions in Hydrogen-Fueled Micromix Combustors

School of Aerospace and Mechanical Engineering, Korea Aerospace University, Goyang-si 10540, Gyeonggi-do, Republic of Korea
*
Author to whom correspondence should be addressed.
Energies 2025, 18(23), 6168; https://doi.org/10.3390/en18236168
Submission received: 3 November 2025 / Revised: 16 November 2025 / Accepted: 19 November 2025 / Published: 25 November 2025
(This article belongs to the Special Issue Hydrogen Fuel Combustion in Energy Systems)

Abstract

Micromix combustion is a promising approach to addressing issues such as flashback, combustion instability, and nitrogen oxide (NOx) emissions in hydrogen-fueled gas turbines. In this study, a numerical analysis was conducted to investigate key factors influencing NOx emissions in a lab-scale micromix combustor under atmospheric pressure and room temperature. The effects of air flow rate, equivalence ratio, and combustor component surface temperature on NOx formation were systematically evaluated. The results show that increasing the air and hydrogen flow rates at a constant equivalence ratio reduced NOx emissions due to shorter residence times. In addition, higher surface temperatures of combustor components increased flame temperatures and NOx production. Lastly, high equivalence ratios led to partial flame merging, increasing NOx emissions. These findings highlight that the efficient cooling of combustor components and proper selection of air flow rate and equivalence ratio are critical to minimizing NOx emissions in micromix combustors. The study provides design and operational guidelines for the future development of hydrogen-fueled gas turbines.

1. Introduction

Global concerns over greenhouse gas emissions and their environmental impact, such as global warming and climate change, have increased the urgency of transitioning from fossil fuels to carbon-free energy sources. Hydrogen has emerged as a promising alternative due to having zero carbon emissions during combustion. Many governments, including that of the Republic of Korea, have announced carbon neutrality strategies—such as Korea’s ‘2050 Carbon Neutrality Strategy’—and identified hydrogen as a key energy carrier. Developing technologies for hydrogen-fueled gas turbines is a critical step toward achieving these goals [1,2].
Hydrogen combustion offers significant environmental benefits by eliminating carbon dioxide (CO2), carbon monoxide (CO), unburned hydrocarbons, or soot emissions. However, the formation of nitrogen oxides (NOx) remains a major challenge as these originate from the nitrogen (N2) present in the air under high-temperature conditions [3]. NOx is strictly regulated due to its harmful effects on human health and ecosystems. In addition, its contribution to global warming is substantial despite its atmospheric lifetime being shorter than that of carbon dioxide [4].
The evolution of hydrogen gas turbine combustion technology has progressed in three stages. The first-generation of hydrogen turbine combustors adopted the diffusion flame combustion method due to technical problems such as flashback and combustion instability, and issues such as high flame temperature and NOx formation in fuel-rich regions were mitigated by water or nitrogen injections. The second-generation of combustors adopted premixed flame combustion for hydrogen co-firing, with Siemens, MHI (Mitsubishi Heavy Industry), and GE (General Electric) applying co-firing at levels of 10–30%. The third-generation aims for carbon neutrality by 2050, requiring pure-hydrogen combustion as co-firing alone is insufficient [5].
Research on hydrogen turbine combustion is also underway at domestic institutions in Korea. The Korea Institute of Machinery and Materials has been developing 300 MW class gas turbines with a 50% hydrogen co-firing ratio since 2021. Doosan Enerbility is working on 5 MW hydrogen combustion technology and improving 270 MW co-firing and 80 MW medium-scale pure hydrogen turbines [6]. Hanwha Aerospace is developing a 1 MW class small gas turbine for hydrogen power generation derived from its aircraft gas turbine [7].
Once hydrogen co-firing reaches a high level, flashback and NOx control cannot be addressed by modifying existing natural gas combustors. Consequently, new combustor designs are necessary. GE developed a multi-tube mixer to achieve a high co-firing ratio, while FH Aachen in Germany created the micromix combustor for pure hydrogen combustion. Kawasaki Heavy Industry, in collaboration with Aachen University, successfully demonstrated a 1 MW hydrogen micromix gas turbine plant in Kobe [8].
The micromix combustor was first designed at FH Aachen (Aachen University of Applied Sciences) with the goal of ensuring excellent mixing uniformity while preventing auto-ignition and flashback [9]. FH Aachen and B&B-AGEMA GmbH have developed a 335 kW hydrogen micromix combustor with 1600 hydrogen injection holes (0.3 mm diameter), and successfully demonstrated it in an aircraft auxiliary power unit (APU) GTCP 36-300. They performed numerical analyses on three combustion models and additional studies to increase energy density and reduce NOx by varying geometrical parameters, including air gate dimensions, hydrogen injection hole diameters (0.3–1.0 mm), mixing distances, and air guide panel (AGP) heights [10,11,12,13]. A. Giannouloudis et al. at Cranfield University performed numerical analysis using 32 hydrogen injection holes (0.3 mm) under 600 K and 15 bar, then studied variations in hole diameter, air gate height, and momentum flux ratio [14]. Ikerlan Technology Research Centre carried out a study to compare experimental and numerical results for different equivalence ratios in domestic and industrial hydrogen boilers utilizing micromix combustion [15]. A recent numerical study on hydrogen microflames by Dai et al. showed that a V-shaped baffle in a micro planar combustor improves wall temperature uniformity, energy efficiency, and reduces pressure drop, complementing micromix combustor research focused on stable combustion and low NOx emissions [16].
Although several previous studies have confirmed the stability of micromix combustors against flashback and their NOx reduction performance, these studies have mainly focused on specific geometric configurations, limited ranges of operating conditions, or analyses without systematically varying multiple parameters simultaneously. In contrast, the present study systematically investigates the combined effects of air and hydrogen flow rates along with combustor component surface temperatures, providing a more comprehensive understanding of the factors influencing NOx emissions.
In this study, numerical analysis study was conducted on a research micromix hydrogen combustor designed and fabricated at Korea Aerospace University which has not been previously analyzed in the literature. The objective is to identify key factors affecting NOx emissions by varying air and hydrogen flow rates and combustor component surface temperatures. The results provide insight into optimal operating conditions and design considerations for low-NOx micromix hydrogen combustors.

2. Methods

2.1. Hydrogen Combustion Background

Hydrogen has a low density and high mass-specific heating value, but its volumetric heating value is lower than hydrocarbons, posing storage challenges. Advanced hydrogen storage technologies can mitigate these challenges and offer significant benefits by reducing the weight of fuel in transportation vehicles, including aircraft. The high diffusivity and reactivity of hydrogen compared to hydrocarbon fuels such as kerosene or methane present both advantages and disadvantages. Lean hydrogen combustion, with its wide flammability range (4% to 75% in air), can achieve lower NOx emissions due to broader flame stability [4]. On the other hand, hydrogen also has a very high flame speed which can lead to combustion instability, pressure fluctuations, and flashback [12]. Due to these unique characteristics of hydrogen, conventional combustor designs for hydrocarbon fuels have inherent limitations when applied to hydrogen. Therefore, a completely new combustion approach and combustor design are required to utilize hydrogen as a gas turbine fuel while mitigating these unfavorable phenomena.
Depending on the formation mechanism, NOx is largely divided into fuel NOx, prompt NOx, and thermal NOx. For hydrogen combustors, reducing thermal NOx is particularly important. Fuel NOx is formed from fuel-bound nitrogen present in hydrocarbon fuels such as coal or crude oil. In this process, the nitrogen-containing components react almost completely to form NO. Prompt NOx is formed under stoichiometric or rich conditions (1 < φ < 1.6) when methylidyne radicals (CH) react with nitrogen (N2) to form cyanide (HCN), which then undergoes several steps to form NO. Since hydrogen fuel is not a hydrocarbon fuel, it is not related to the two formation mechanisms mentioned above. Thermal NOx refers to nitrogen oxides that are generated when nitrogen present in the atmosphere participates in a reaction at high temperatures, and its formation is explained by the following extended Zeldovich mechanism reaction formula [12,17].
N 2 + O     N O   +   O N   +   O 2     N O   +   O N   +   O H     N O   +   H
Formation of thermal NOx is very sensitive to temperature, especially under high-temperature conditions, and it also depends on the fuel–air ratio and the residence time of the reactants in high-temperature regions. Thermal NOx emissions increase exponentially with flame temperature and are proportional to the residence time of the reactants in high-temperature regions. Among the three formation mechanisms above, only thermal NOx is relevant when pure hydrogen is used as fuel.
Common methods used to reduce thermal NOx in gas turbine combustors include lowering the combustion temperature or reducing the residence time of reactants in high-temperature regions. A typical example is water injections along with fuel in a diffusion flame-type combustor, which directly lowers the flame temperature, thereby reducing thermal NOx formation. Another example is the lean premixed combustion method, known as DLN (dry low NOx), which can lower the flame temperature without injecting water vapor and is mainly used for natural gas combustion. In a DLN combustor, fuel and air are premixed and burned at a low equivalence ratio, increasing the amount of air in the combustor. This excess air cools the flame, reducing the flame temperature and, consequently, thermal NOx emissions. However, both of the above NOx reduction methods have drawbacks. The water vapor injection method reduces combustion efficiency, while the lean premixed combustion method is not suitable for hydrogen combustors due to the high flammability and flame speed of hydrogen which increase the risk of flashback. Flashback occurs when the flame ignites in the mixing area, leading to uncontrolled combustion in unintended regions, potentially causing combustor damage [12]. For this reason, it is difficult to control combustion instability as the stable combustion range is relatively narrow.

2.2. Principles of Micromix Combustion

Micromix combustors are based on the ‘jet-in-crossflow mixing’ principle and are designed to reduce NOx emissions during the combustion process. In a micromix combustor, many small-sized diffusion flames, called microflames, are formed, distributing heat release inside the combustor through multiple small, short flames rather than a large single flame. During this process, NOx emissions are reduced by the rapid and intense mixing of air and fuel, which minimizes the size of the locally stoichiometric high-temperature regions and shortens the residence time of combustion reactants within the high-temperature flame zone [2,14].
Figure 1 illustrates the flow structure inside a micromix combustor. Airflow is guided by an air guiding panel (AGP), which contains several small air gates. Hydrogen fuel is supplied perpendicularly to the airflow, forming a mixture through jet-in-crossflow mixing. Inner recirculation vortices are generated by the air jets passing through the air gates, while outer recirculation vortices form due to the recirculation of hot combustion gases. Shear layers develop between these two recirculation vortices, and fine micromix flames are anchored and stabilized along the shear layer [10]. Preventing the merging of microflames is a critical aspect of micromix combustor design. The merging of adjacent flames can potentially form larger flames, which increases both local peak flame temperatures and the residence time of combustion reactants in the flame, leading to higher NOx emissions [4].

2.3. Micromix Combustor Geometry

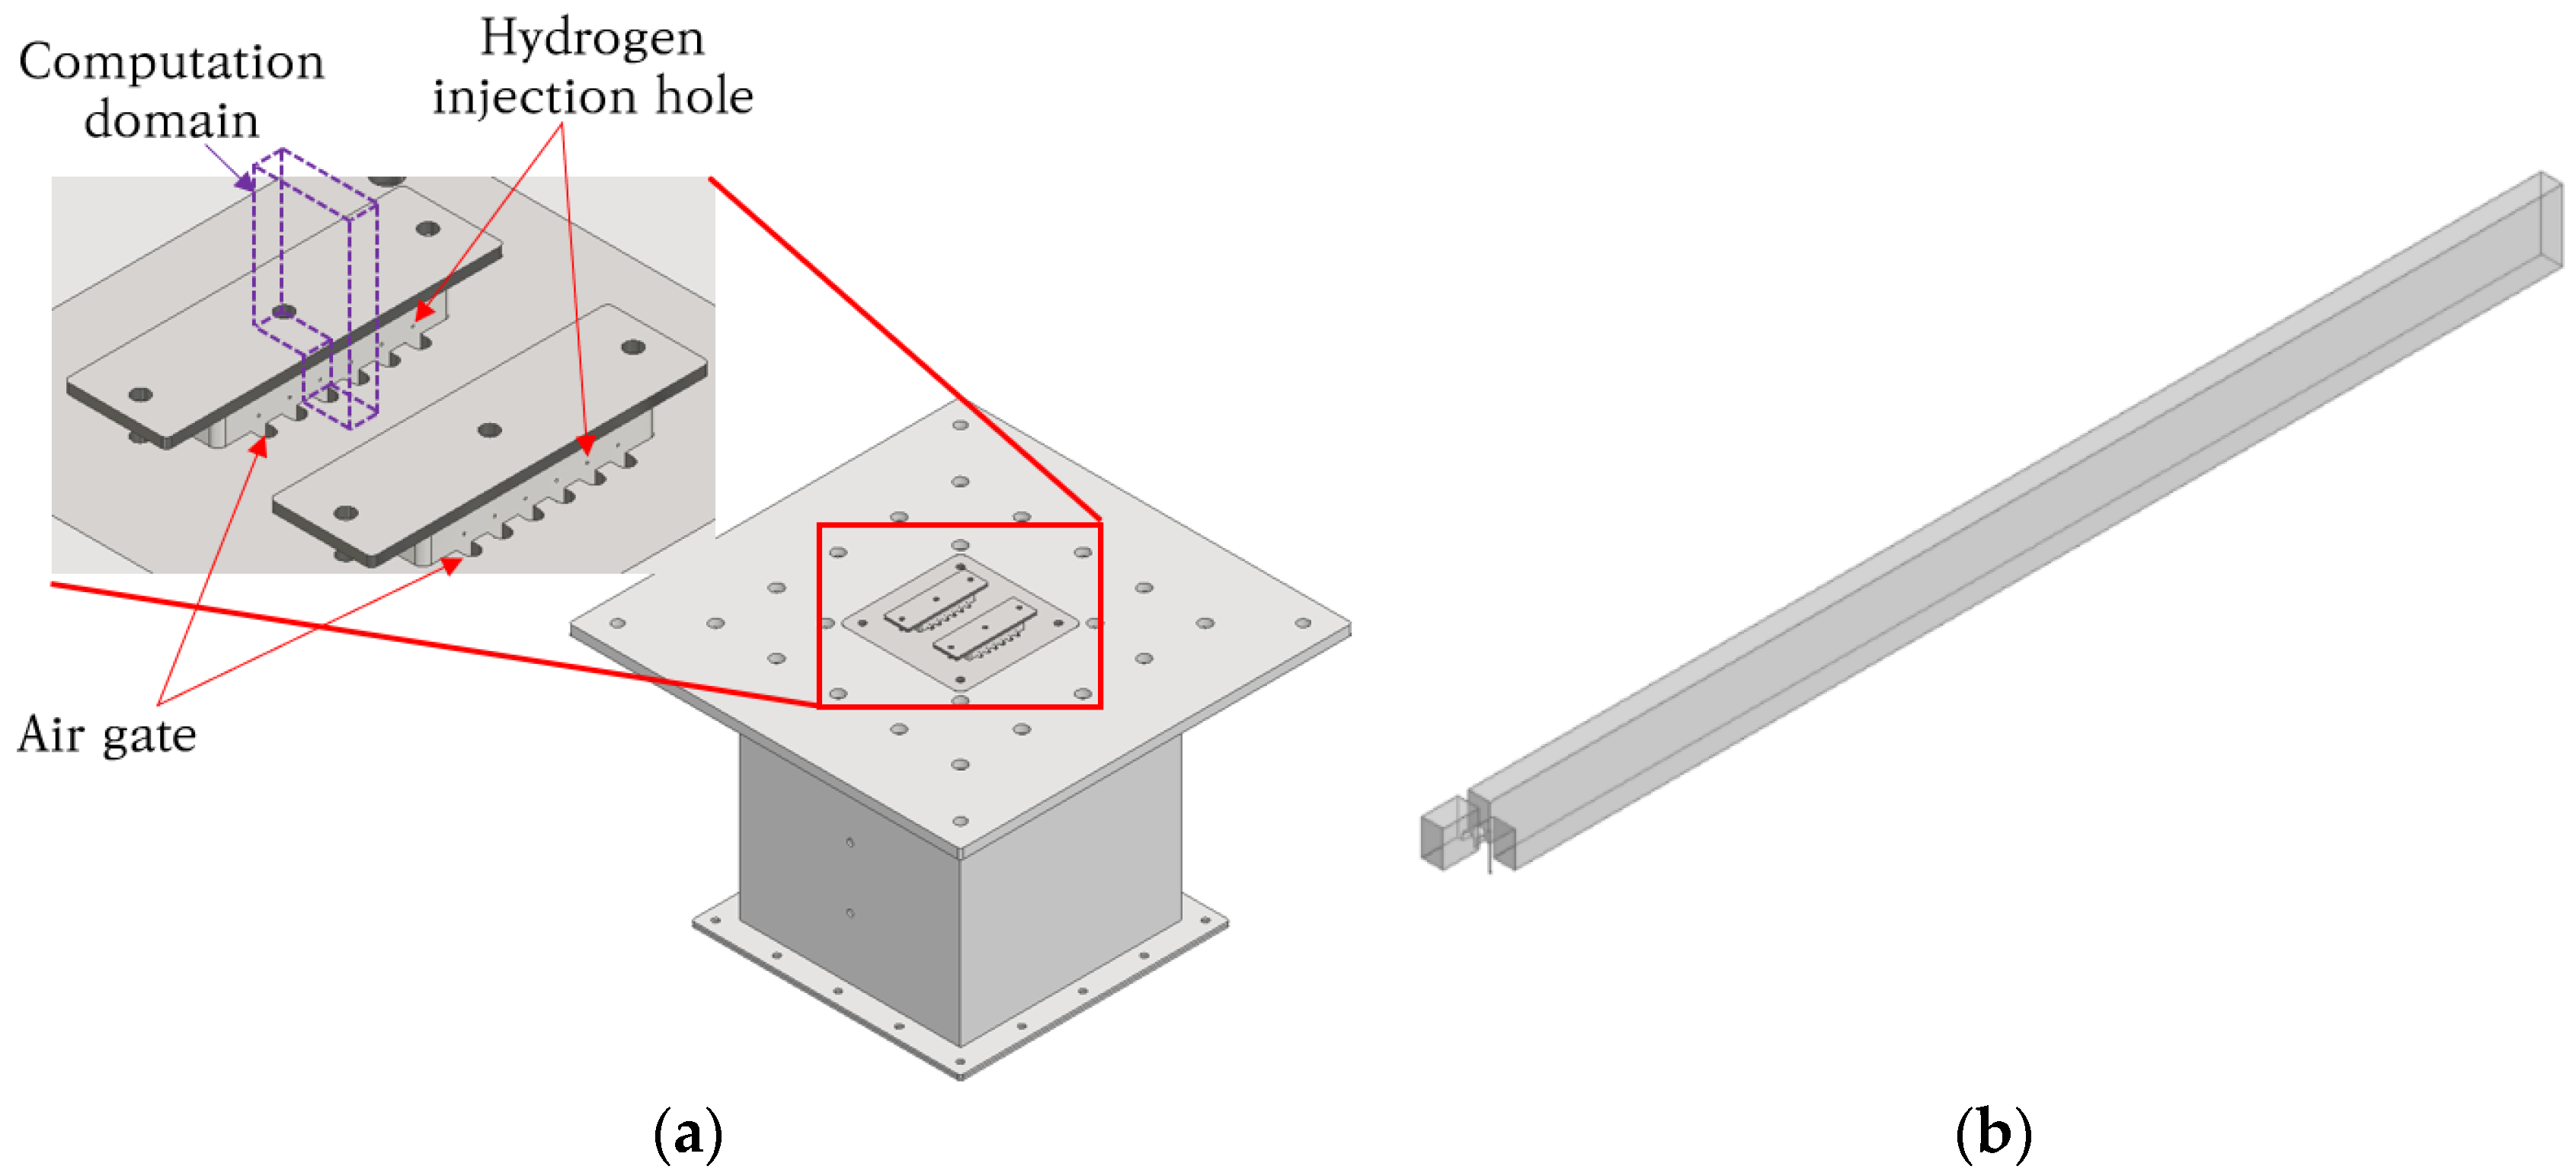
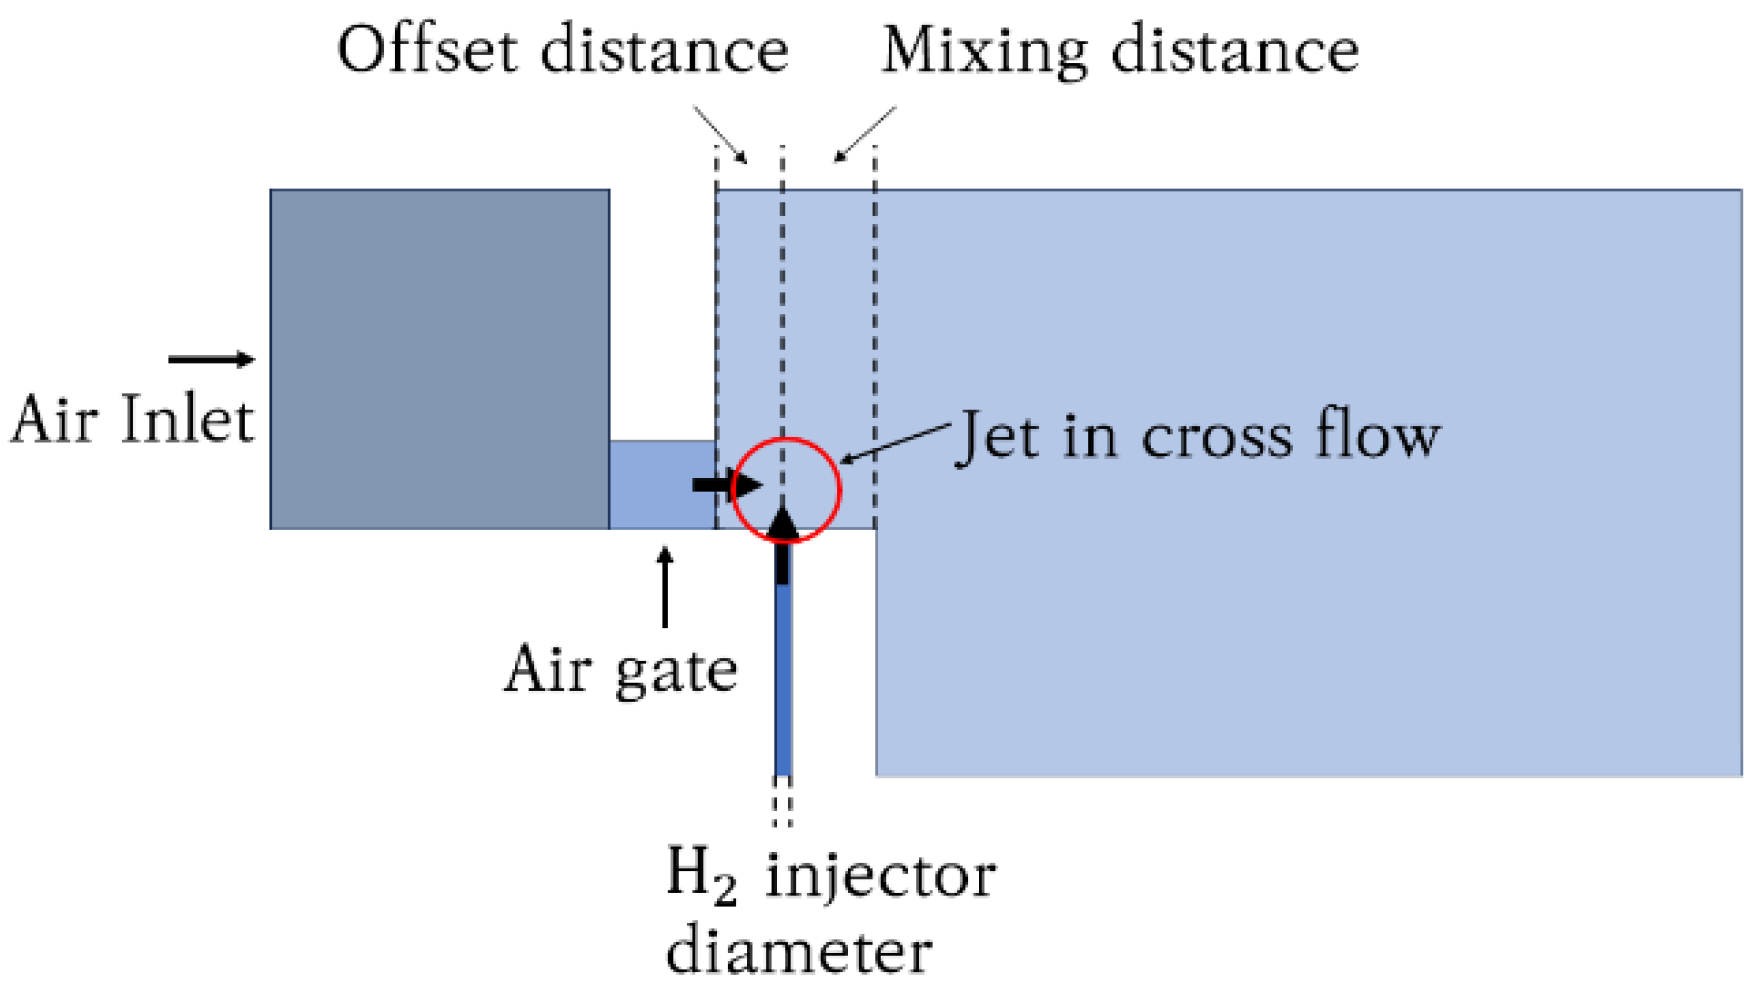
The combustor geometry is as shown in Figure 2. The air is supplied through 3 mm × 3 mm air gates, and hydrogen fuel is injected at a perpendicular angle to the airflow through small hydrogen injection holes with a diameter of 0.5 mm. There are a total of 24 air gates and 24 hydrogen injection holes, forming 24 microflames. The overall geometry of the combustor assembly is presented in Figure 2a, and the computation domain was defined for a single air gate and a single hydrogen injection hole as shown in Figure 2b. Geometrical parameters are shown in Figure 3 and Table 1.
Several important design variables should be noted. The offset distance is the distance to the center of the hydrogen injection hole from the air gate exit where the air flow enters the combustor. The effect of the momentum of the air accelerated from the air gate varies depending on the offset distance. The mixing distance is the distance from the center of the hydrogen injection hole to the tip of the fuel injector assembly. By adjusting this distance, the degree of mixing between air and hydrogen can be controlled. The air jet flow is formed by air gate geometry, and the aspect ratio is one of the key factors. The flame shape and characteristics change depending on the air gate aspect ratio. The diameter of the hydrogen injection hole directly affects the hydrogen flow characteristics even at the same mass flow rate. A small hole diameter, with supply pressure compensation, increases the momentum of the hydrogen flow. The momentum flux ratio (MFR, J ) represents the ratio of hydrogen to air momentum and is defined as follows.
J = ρ H 2 u H 2 2 ρ a i r u a i r 2
The momentum flux ratio affects the hydrogen injection depth and the relation can be expressed as following equation [18]. In the equation, y H 2 is the hydrogen injection depth and d H 2 is the hydrogen injection hole diameter. This relationship allows fir determination of the valid momentum flux ratio range with respect to the hydrogen injection hole diameter.
y H 2 = 1.15   d H 2 J
Increasing the momentum flux ratio enhances the hydrogen injection depth into the crossing airflow, thereby improving mixing characteristics. However, if the injection depth y H 2 exceeds a critical value, hydrogen may penetrate into the hot internal recirculating vortex region, further increasing the reactant residence time and leading to higher NOx emissions [2,4].

2.4. Governing Equations and Numerical Model

The numerical simulations were carried out using the finite volume method implemented in ANSYS Fluent 2023 R2. The governing equations solved include the continuity, momentum, energy, and species transport equations under steady-state conditions. The pressure–velocity coupling was treated using the SIMPLE algorithm. For discretization, a second-order upwind scheme was applied for the convective terms, while the pressure term was treated with a second-order scheme to minimize numerical diffusion. Turbulence was modeled using the SST k–ω model, which is known to provide better performance in swirling and recirculating flows compared with the standard k–ε model.
In this study, a non-premixed combustion framework was adopted, which assumes that the flame is governed by diffusion-controlled mixing of fuel and oxidizer. The Eddy Dissipation (ED) model was employed to evaluate the reaction rate, where the turbulence-controlled mixing rate is considered as the limiting factor for combustion. This approach accurately captures the NOx formation pathway, especially thermal NO [19,20]. For NOx formation, both the thermal NO pathway (extended Zeldovich mechanism) and the prompt NO pathway (Fenimore mechanism) were considered. The N2O intermediate pathway was not included, as its contribution under the present operating conditions (small length scales and temperatures below 2000 K) is expected to be minor.

2.5. Boundary Conditions and Operating Ranges for Numerical Analysis

The computational domain corresponds to a single micromix combustor element, extracted from the KAU hydrogen micromix combustor geometry (Figure 2 and Figure 3). Symmetry was assumed along the lateral boundaries to reduce computational cost allowing for only a single microflame to be simulated. The equivalence ratio was set within the range of 0.25 to 0.4 in increments of 0.05. Mass flow rate boundary conditions were specified for the air inlet and hydrogen inlet, respectively, based on the calculated equivalence ratio. Mass flow rates of air were varied, ranging from 0.0471 to 0.942 g/s (2.41–48.2 L/min), and for hydrogen they ranged from 0.000343 to 0.0011 g/s (0.246–7.88 L/min). At the inlet, a uniform velocity profile and specified equivalence ratio were imposed, with air and hydrogen inlet conditions set as follows: temperature of 300 K, absolute pressure of 101.325 kPa, and turbulence intensity of 10%. The outlet was set to a pressure outlet boundary condition at 1 atm. All combustor walls, including surfaces of components such as the fuel injector and air gate, were treated as no-slip boundaries with isothermal conditions varying from 300 to 900 K in 150 K intervals to assess the influence of combustor component surface temperature. Table 2 summarizes the specified boundary conditions and operating ranges for numerical analysis, including air and fuel inlets, wall surfaces, and the combustor outlet. Table 3 shows air velocities and flow rates of air and hydrogen under the conditions selected for the simulations.

2.6. Mesh Generation Setup

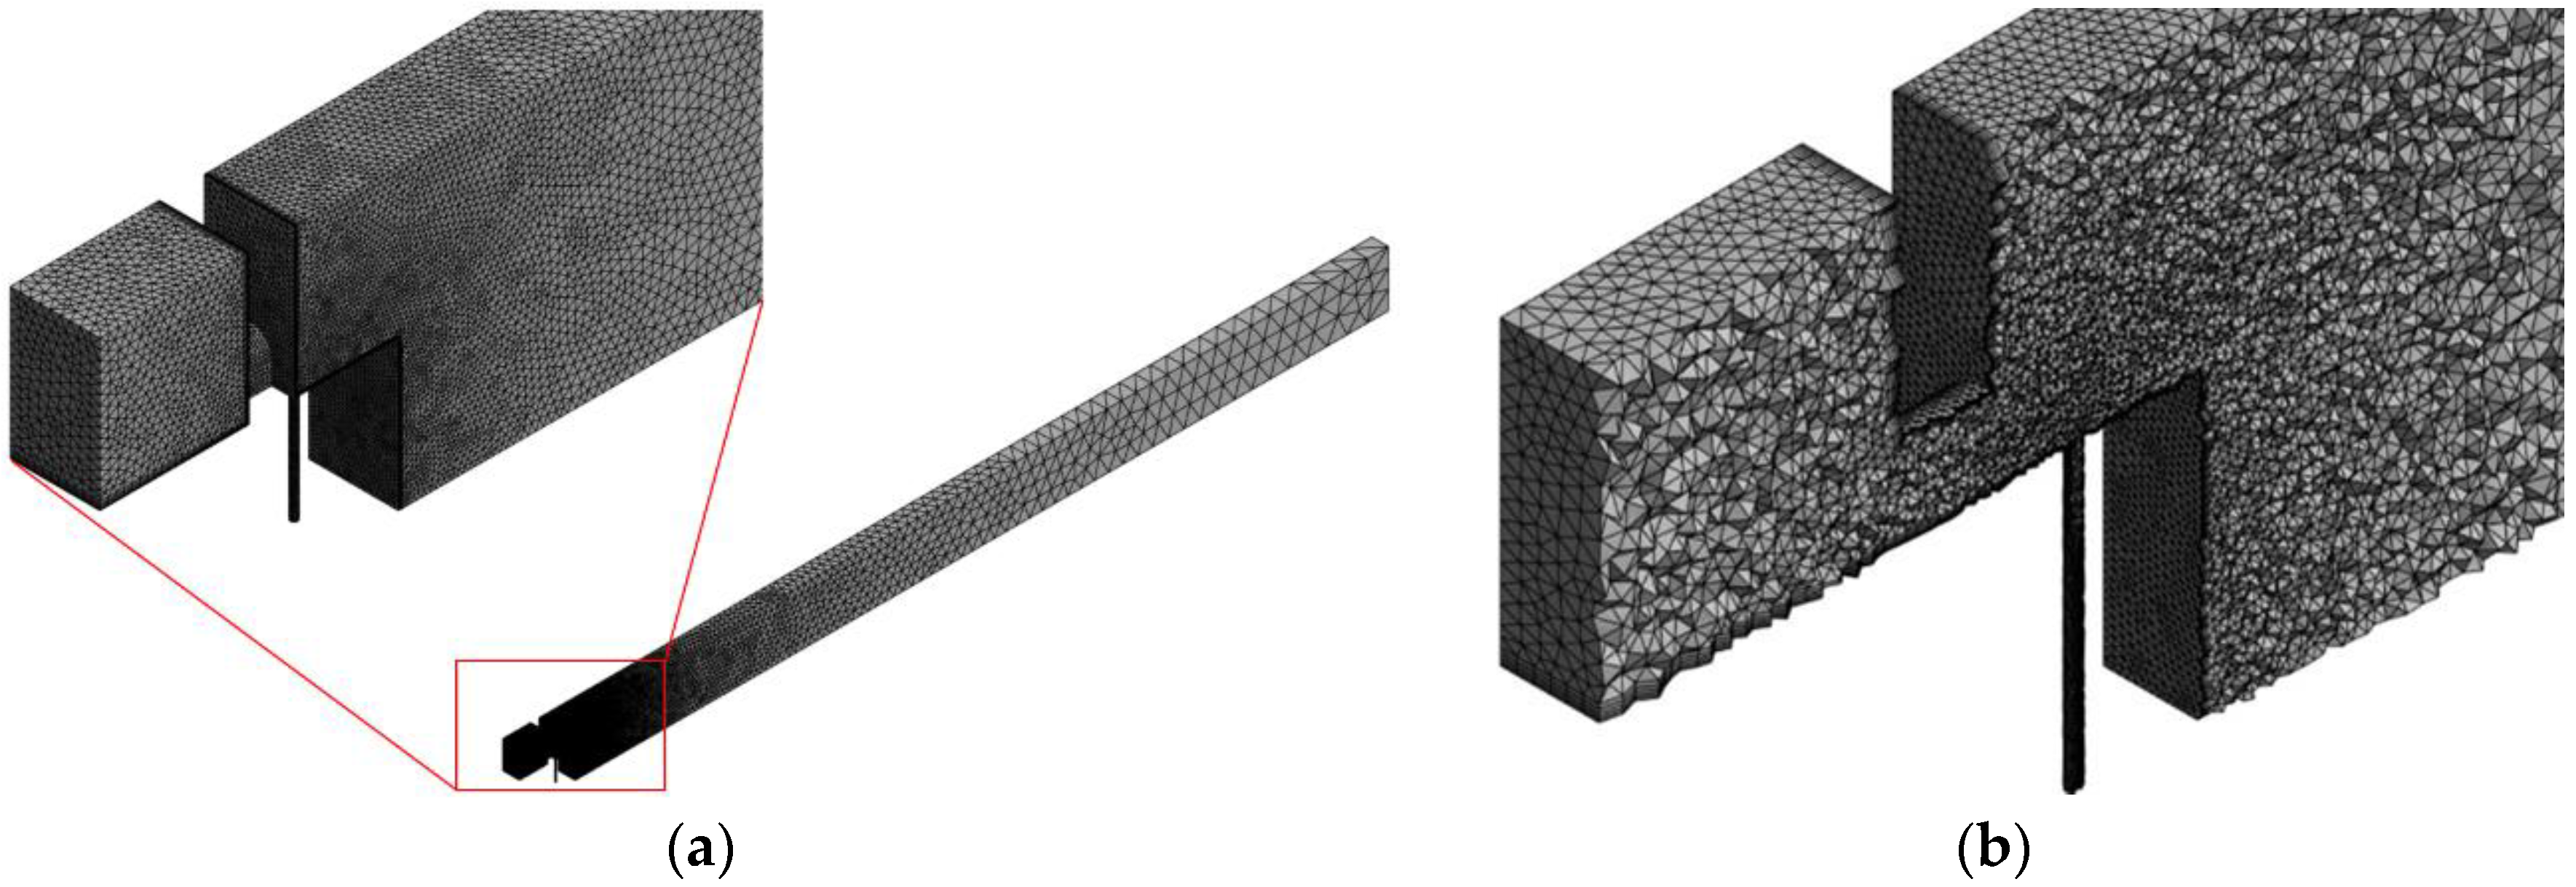
The mesh structure for the single microflame analysis geometry using ANSYS Meshing is shown in Figure 4. The grid primarily consists of tetrahedrons. The grid size was set to be the densest in the region where air and hydrogen meet and a combustion reaction occurs, and it gradually increased toward the combustion chamber outlet. This approach ensures that the region where a combustion reaction occurs can be examined in detail while maintaining efficiency with a limited number of grids. To improve resolution in the analysis, five inflation layers were generated on the surfaces near the air gate and fuel injector, where no-slip wall boundary conditions were applied.
In numerical analysis, mesh quality significantly influences the results. In this study, grid quality was verified based on skewness and orthogonal quality. The closer the skewness is to 0 and the closer the orthogonal quality is to 1, the better the grid quality. In general, a grid is considered acceptable when the maximum skewness is less than 0.95 and the minimum orthogonal quality is greater than 0.15. In this study, the maximum skewness of the generated grid was 0.85, and the minimum orthogonal quality was 0.2, both of which are acceptable according to the criteria. The total number of grids used was 480,000. Grid independence was checked using three different mesh sizes (0.2 M, 0.5 M, and 1.0 M cells), and less than a 5 K variation in temperature and less than a 2 PPM variation in NO were observed in the predicted combustor exit temperature and total NO formation value between the two finest meshes.

3. Results and Discussion

3.1. Numerical Analysis Results According to Air Flow Rate Changes

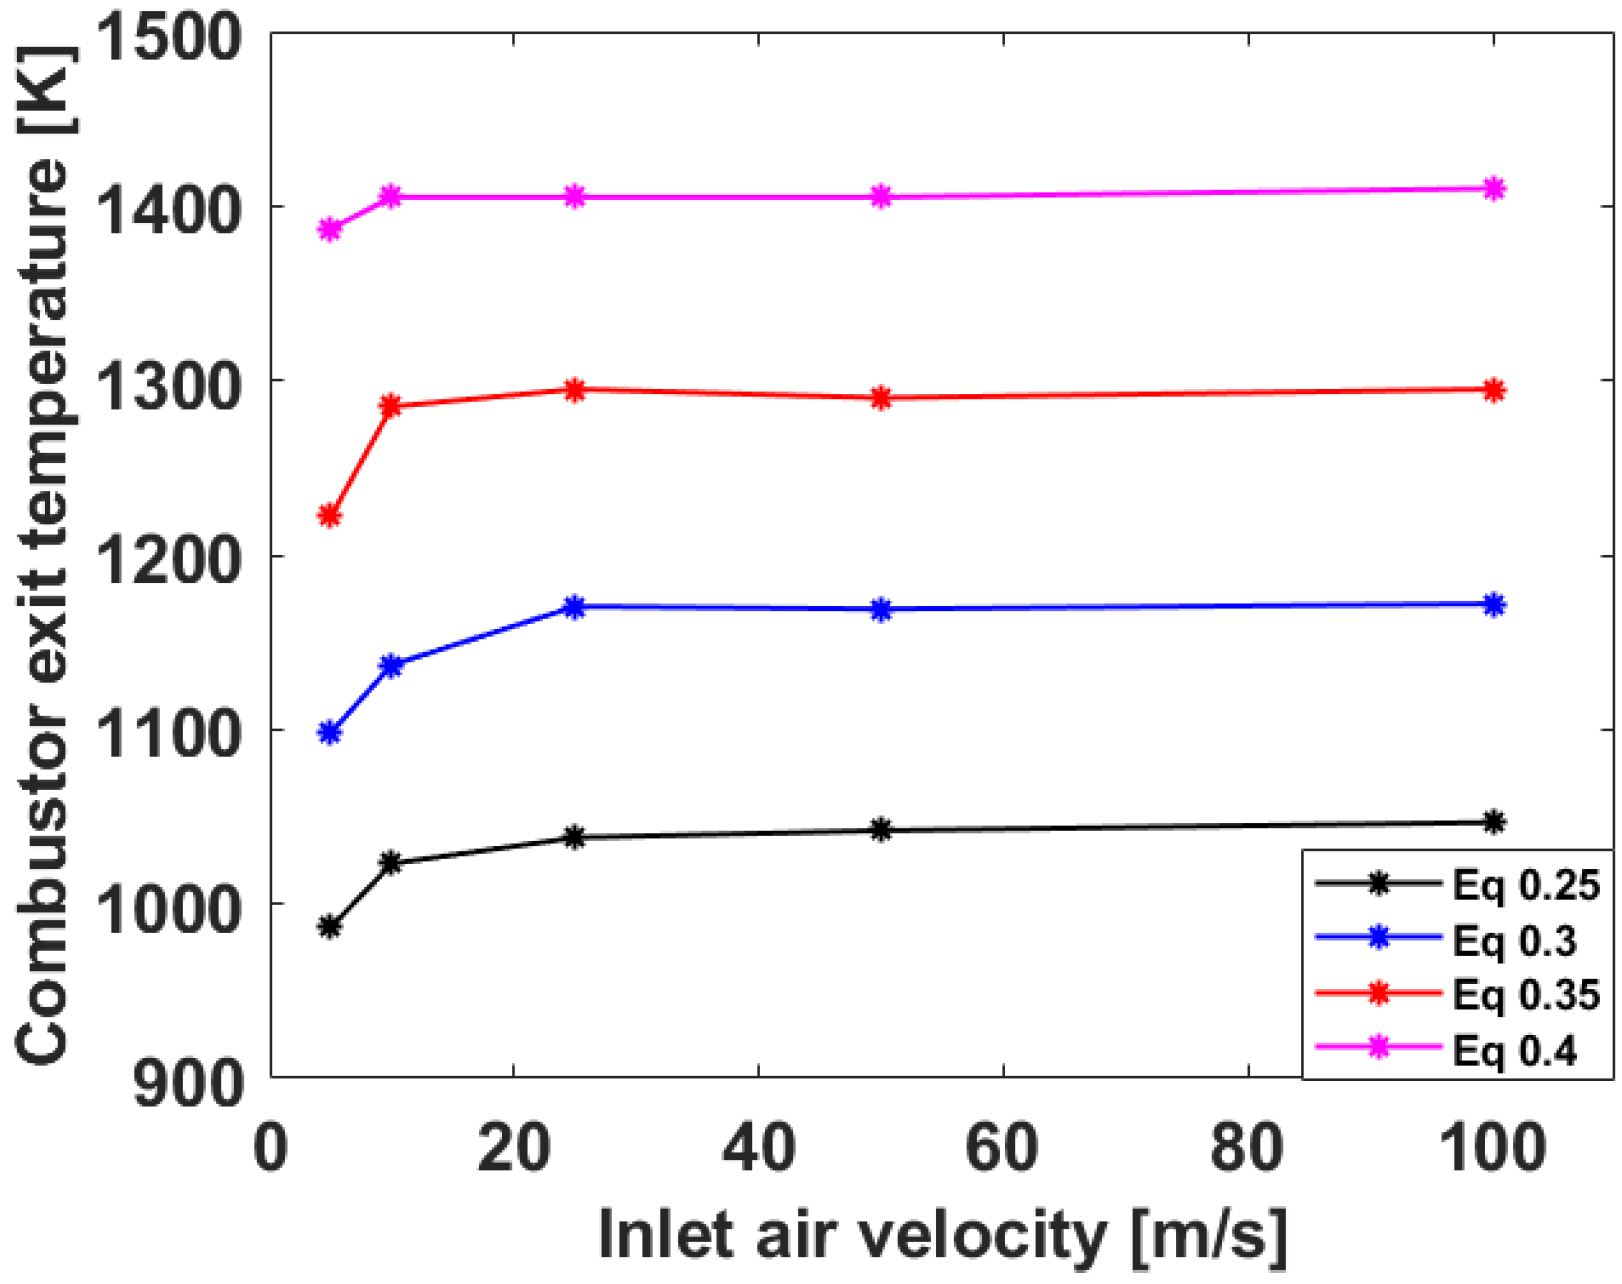
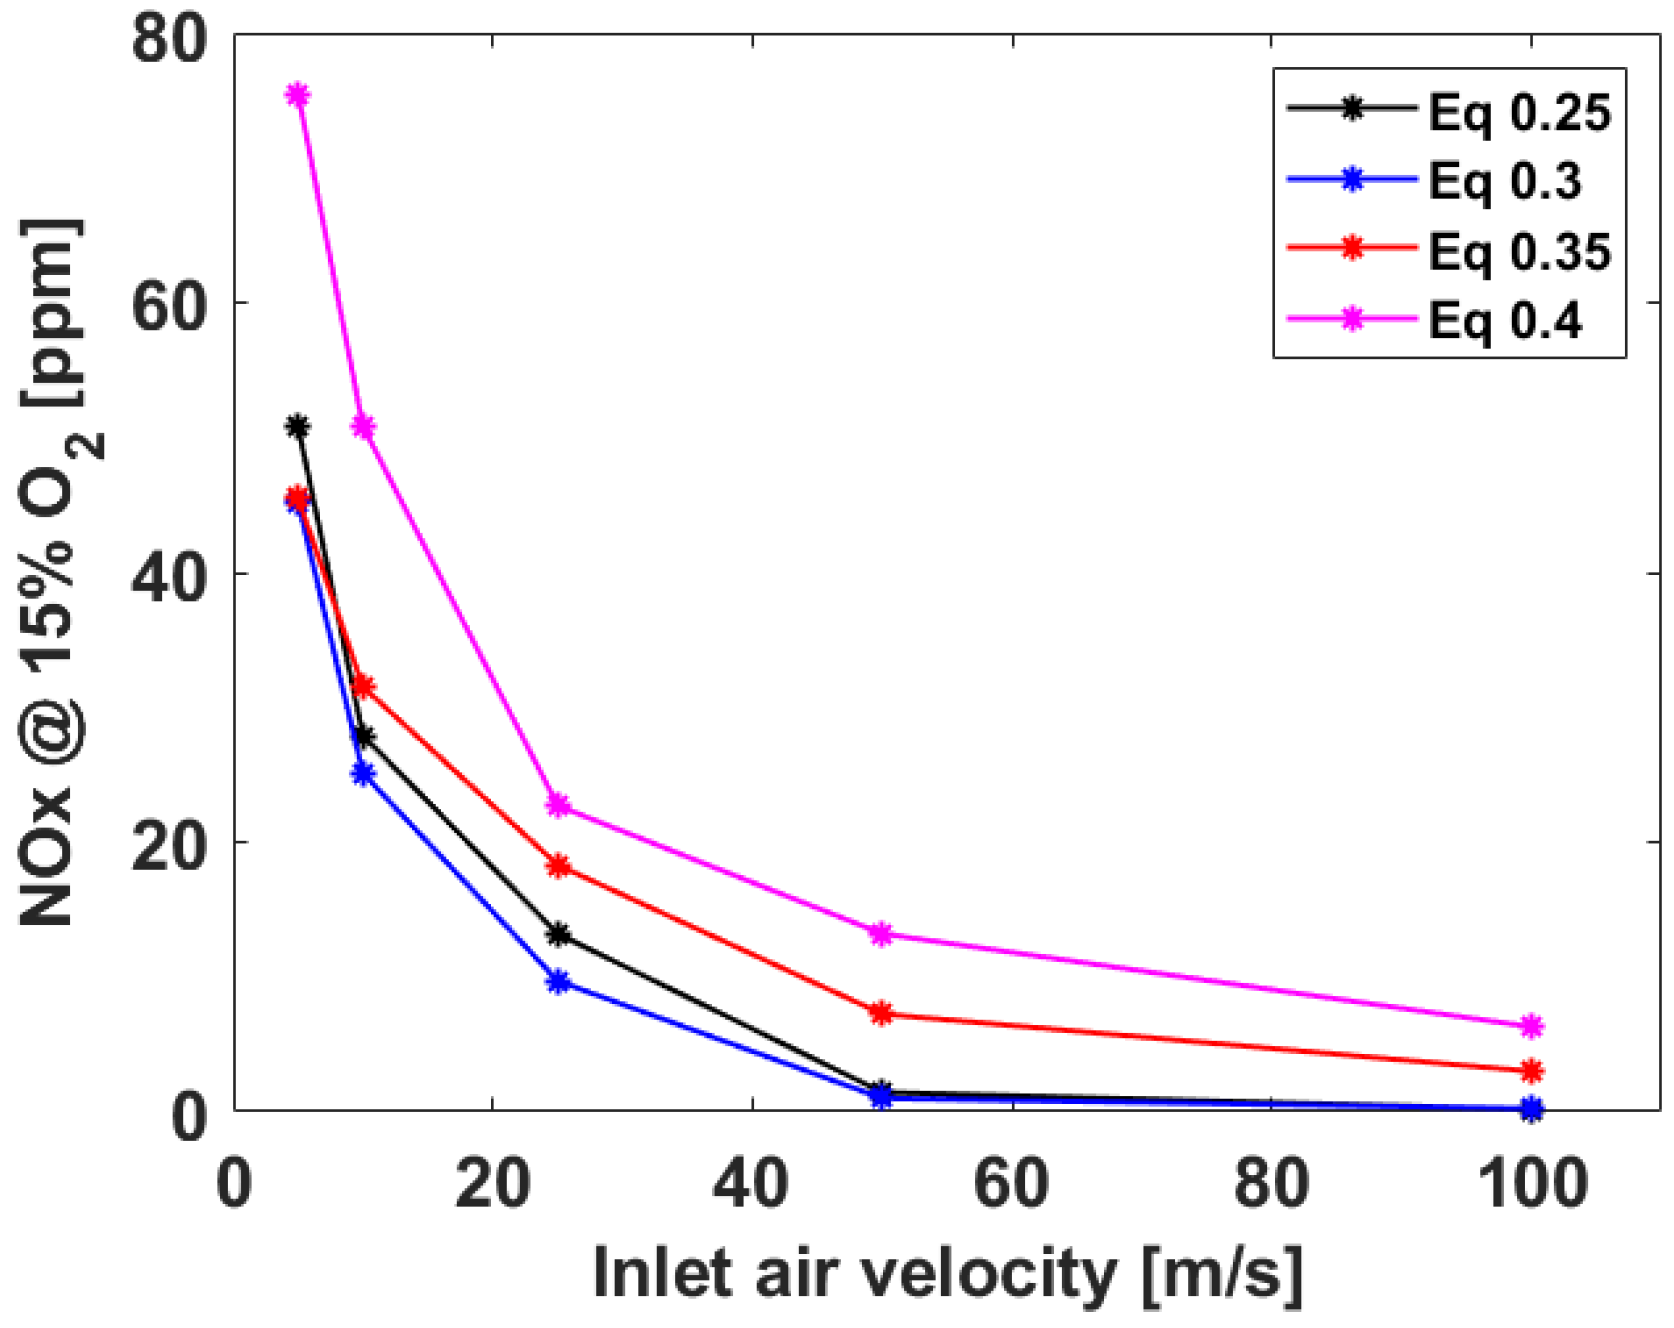
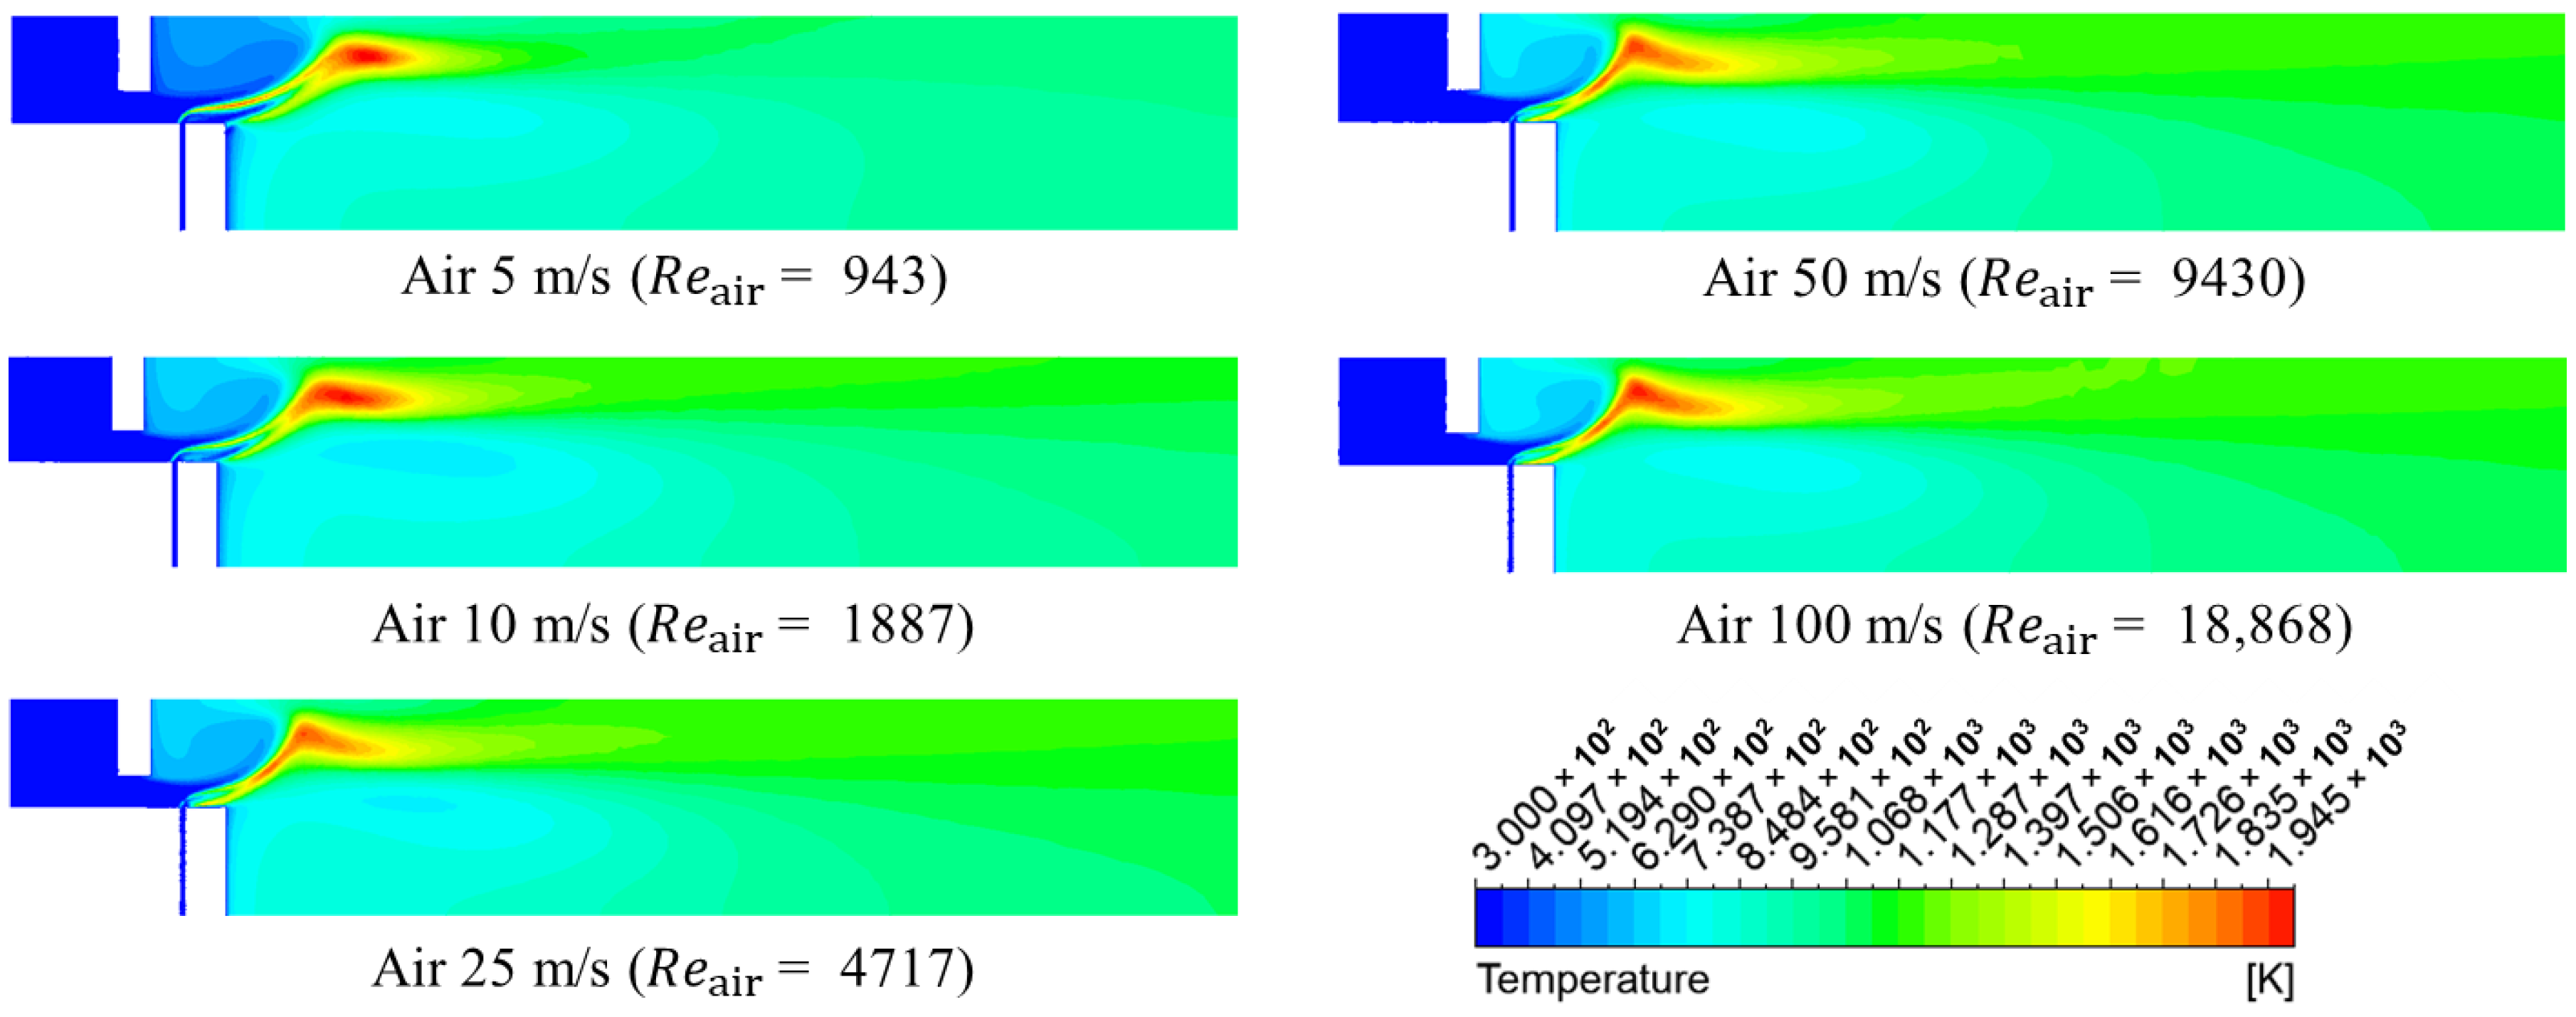
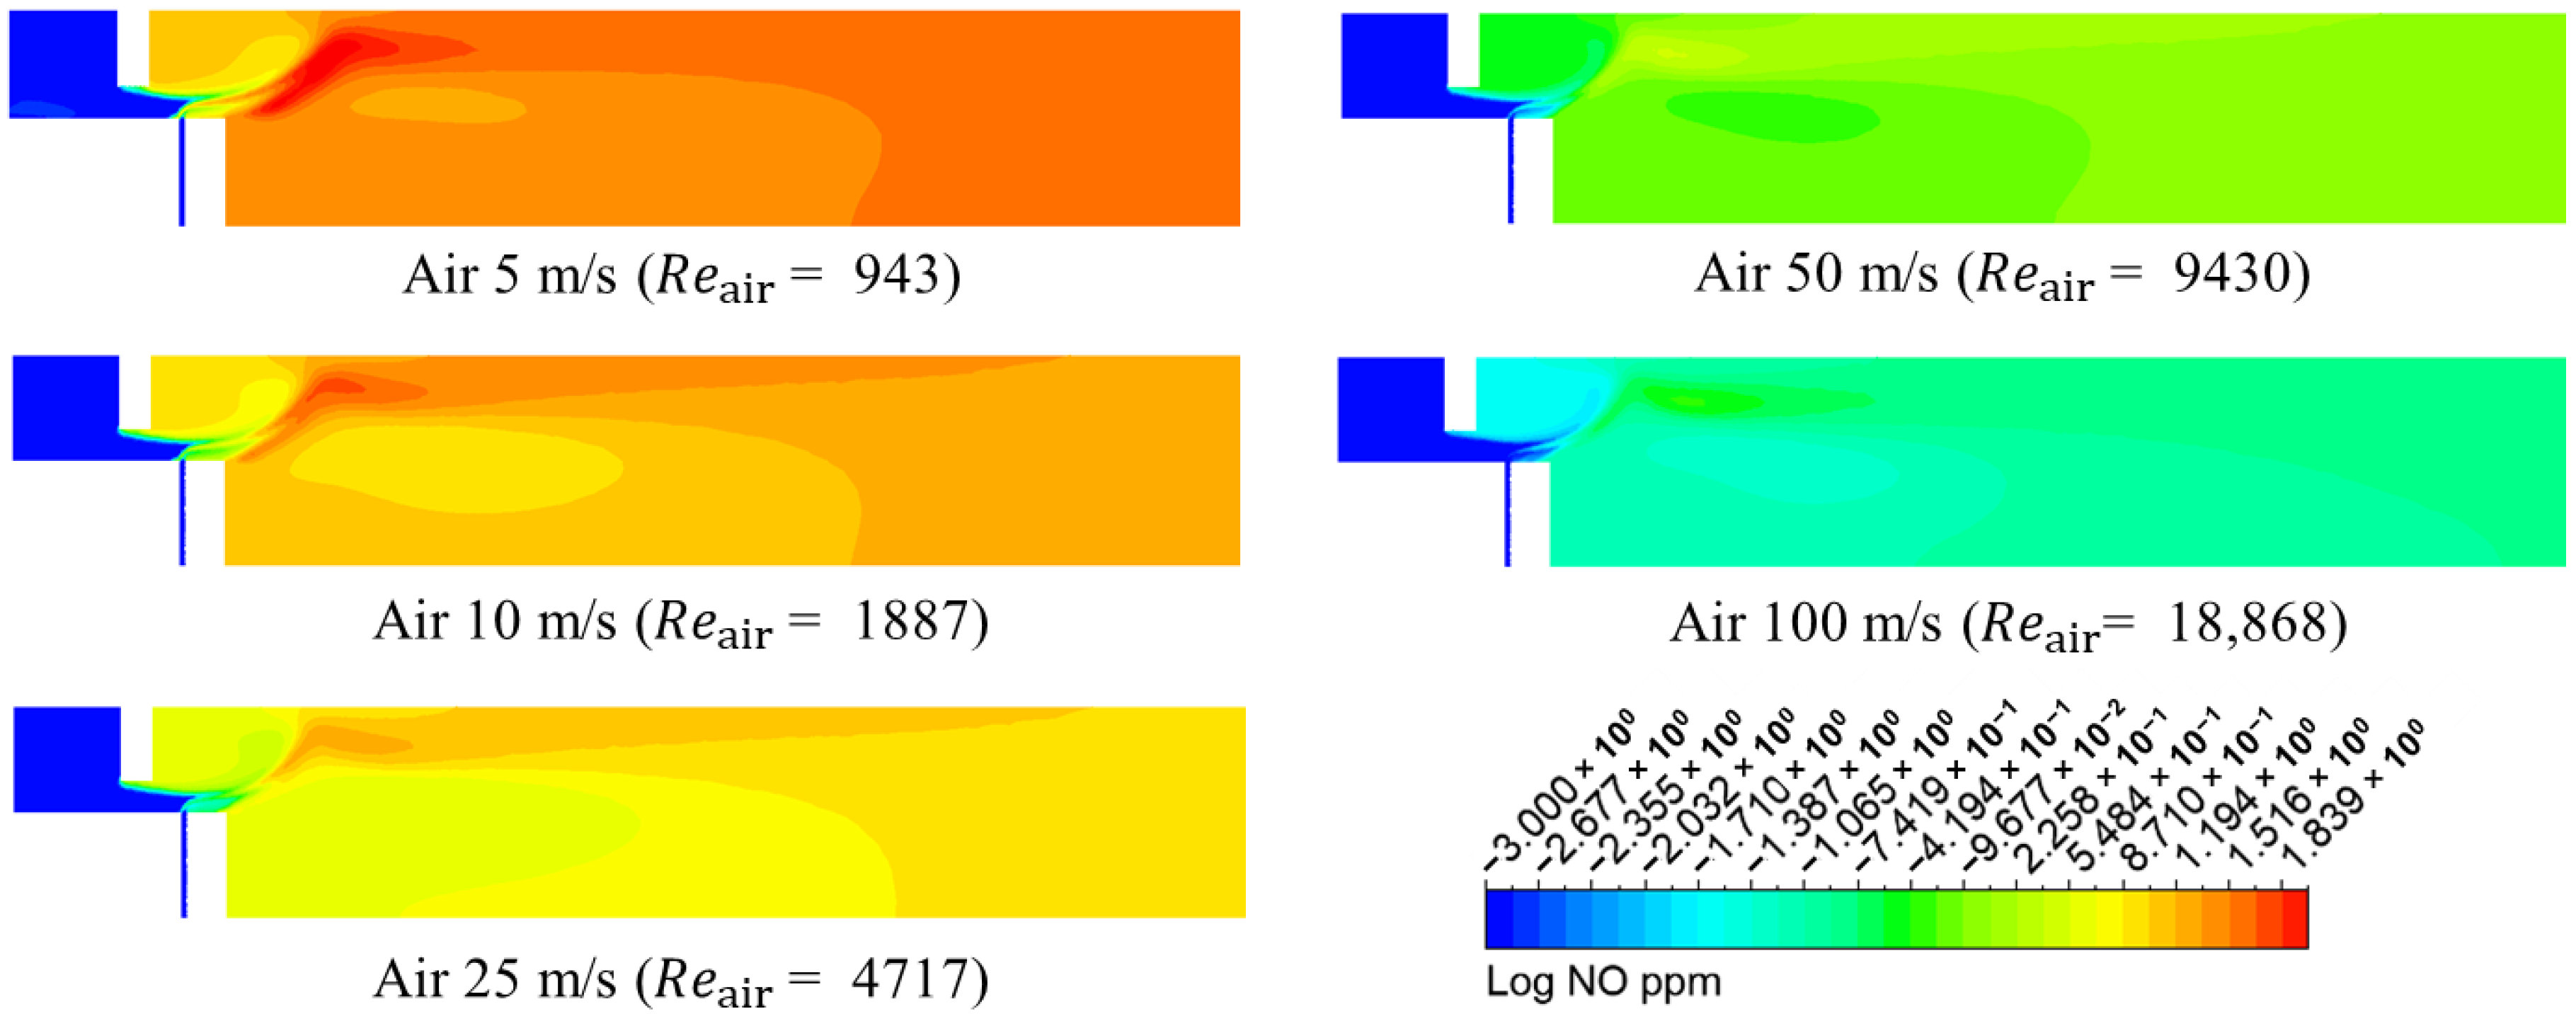
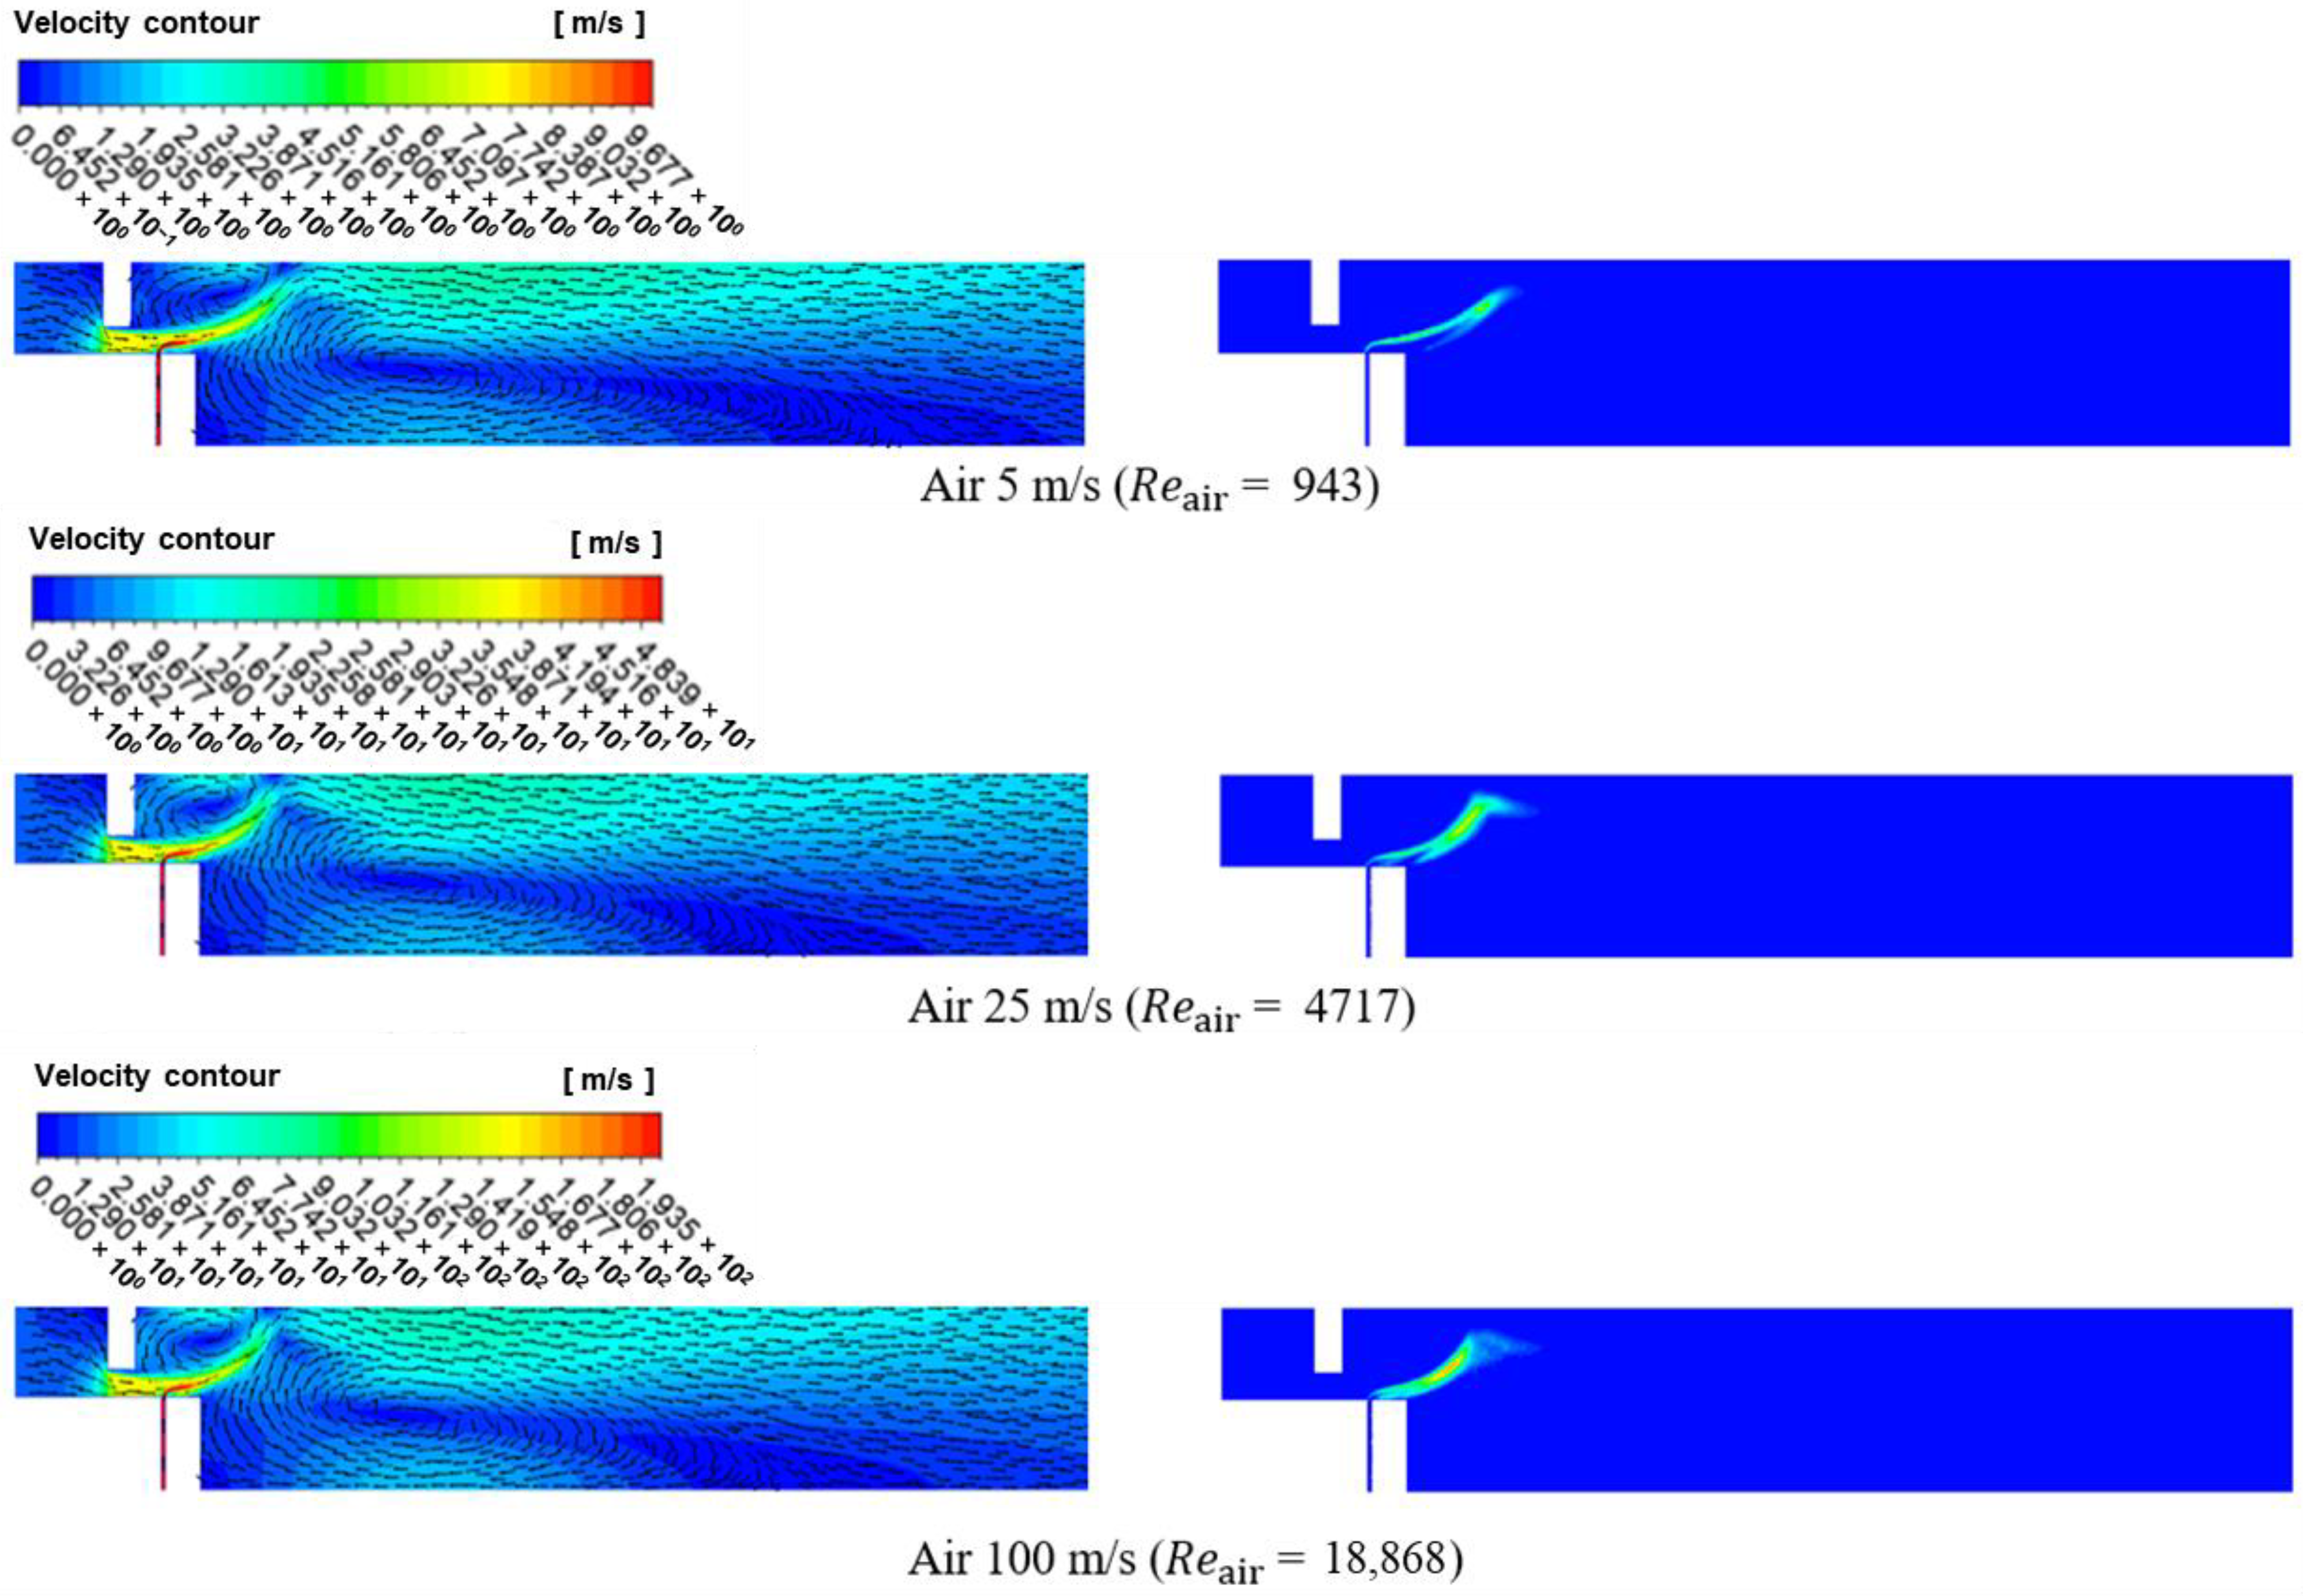
Figure 5 and Figure 6 present the results showing the combustor outlet temperature and NOx generation as a function of the inflow air flow rate under the condition where the combustor component surface temperature is 450 K. For Figure 5 and Figure 6, the air and hydrogen flow rates were varied simultaneously, while the equivalence ratio was kept constant. For five values of inlet air velocity, the corresponding hydrogen flow was calculated to obtain the target equivalence ratio, as shown in Table 3. Different curves represent different equivalence ratios. Figure 7, Figure 8 and Figure 9 depict the temperature and NO distributions, and the velocity vector and OH distributions in the central cross-section of the combustor under the same conditions. To represent the NO distribution, the NO mole fraction, expressed in ppm, was plotted using its common logarithm as shown in Equation (4).
L o g   N O   p p m = l o g 10 X N O 1 X H 2 O × 10 6 0.001
The velocity and OH distribution in Figure 9 shows that an internal recirculation vortex is formed by the air jet flow passing through the air gate. Meanwhile, an external recirculation vortex developed due to the recirculation of hot combustion gas, with a micromix flame anchored on the shear layer between the two vortices. Furthermore, as the inflow air flow rate increases, the size of the internal recirculation vortex decreases, and the flame becomes shorter and more concentrated toward the upper region of the figure. This difference arises because the Reynolds number at the air gate remains low at an air velocity of 5 m/s, resulting in laminar rather than turbulent flow, which alters the overall flow structure.
The internal recirculation vortex and the combustor outlet region, shown in Figure 5 and Figure 7, exhibit a higher temperature zone as the incoming air flow rate increases at a constant equivalence ratio. As the flow rates of air and hydrogen increase, the residence time of the combustion gas near the combustor surfaces gradually decreases, allowing the gas to exit more quickly. Consequently, the temperature of the gas mixture within the internal recirculation vortex near the combustor surfaces rises, with less time for the hot combustion gas to cool, as does the combustor outlet temperature. In other words, heat flux from the gas to the solid surface is primarily driven by turbulent forced convection and increases slightly with flow velocity. In contrast, the amount of air interacting with the surface rises linearly, unlike the heat flux.
In Figure 6 and Figure 8, NOx production was observed to decrease as the air flow rate increased. Additionally, at a given flow rate, a higher equivalence ratio resulted in greater NOx production. In particular, the NOx emissions were significantly lower when the equivalence ratio was 0.3 or less and the air velocity was 50 m/s or higher. This result is related to the residence time of the reactants in the high-temperature region, a key factor influencing thermal NOx formation. As air and hydrogen momentum increased, the residence time of combustion reactants in the flame and recirculation vortex regions within the high-temperature zone decreased sharply, leading to a significant reduction in NO emissions at higher flow rates. Furthermore, thermal NO production is highly sensitive to overall flame temperature. The temperature distribution analysis confirmed that the maximum temperature of the flame region decreased as the air flow rate increased. Consequently, thermal NO production declined as reactants spent less time in high-temperature regions.

3.2. Numerical Analysis Results According to Equivalence Ratio and Surface Temperature Change of Combustor Parts

The amount of fuel supplied to the combustion chamber has a significant impact on both flame temperature and NOx production. To investigate how the surface temperatures of combustor parts affect NOx emissions, a simulation was conducted by varying the surface temperature of the combustor components and the equivalence ratio, while keeping the air flow rate constant.
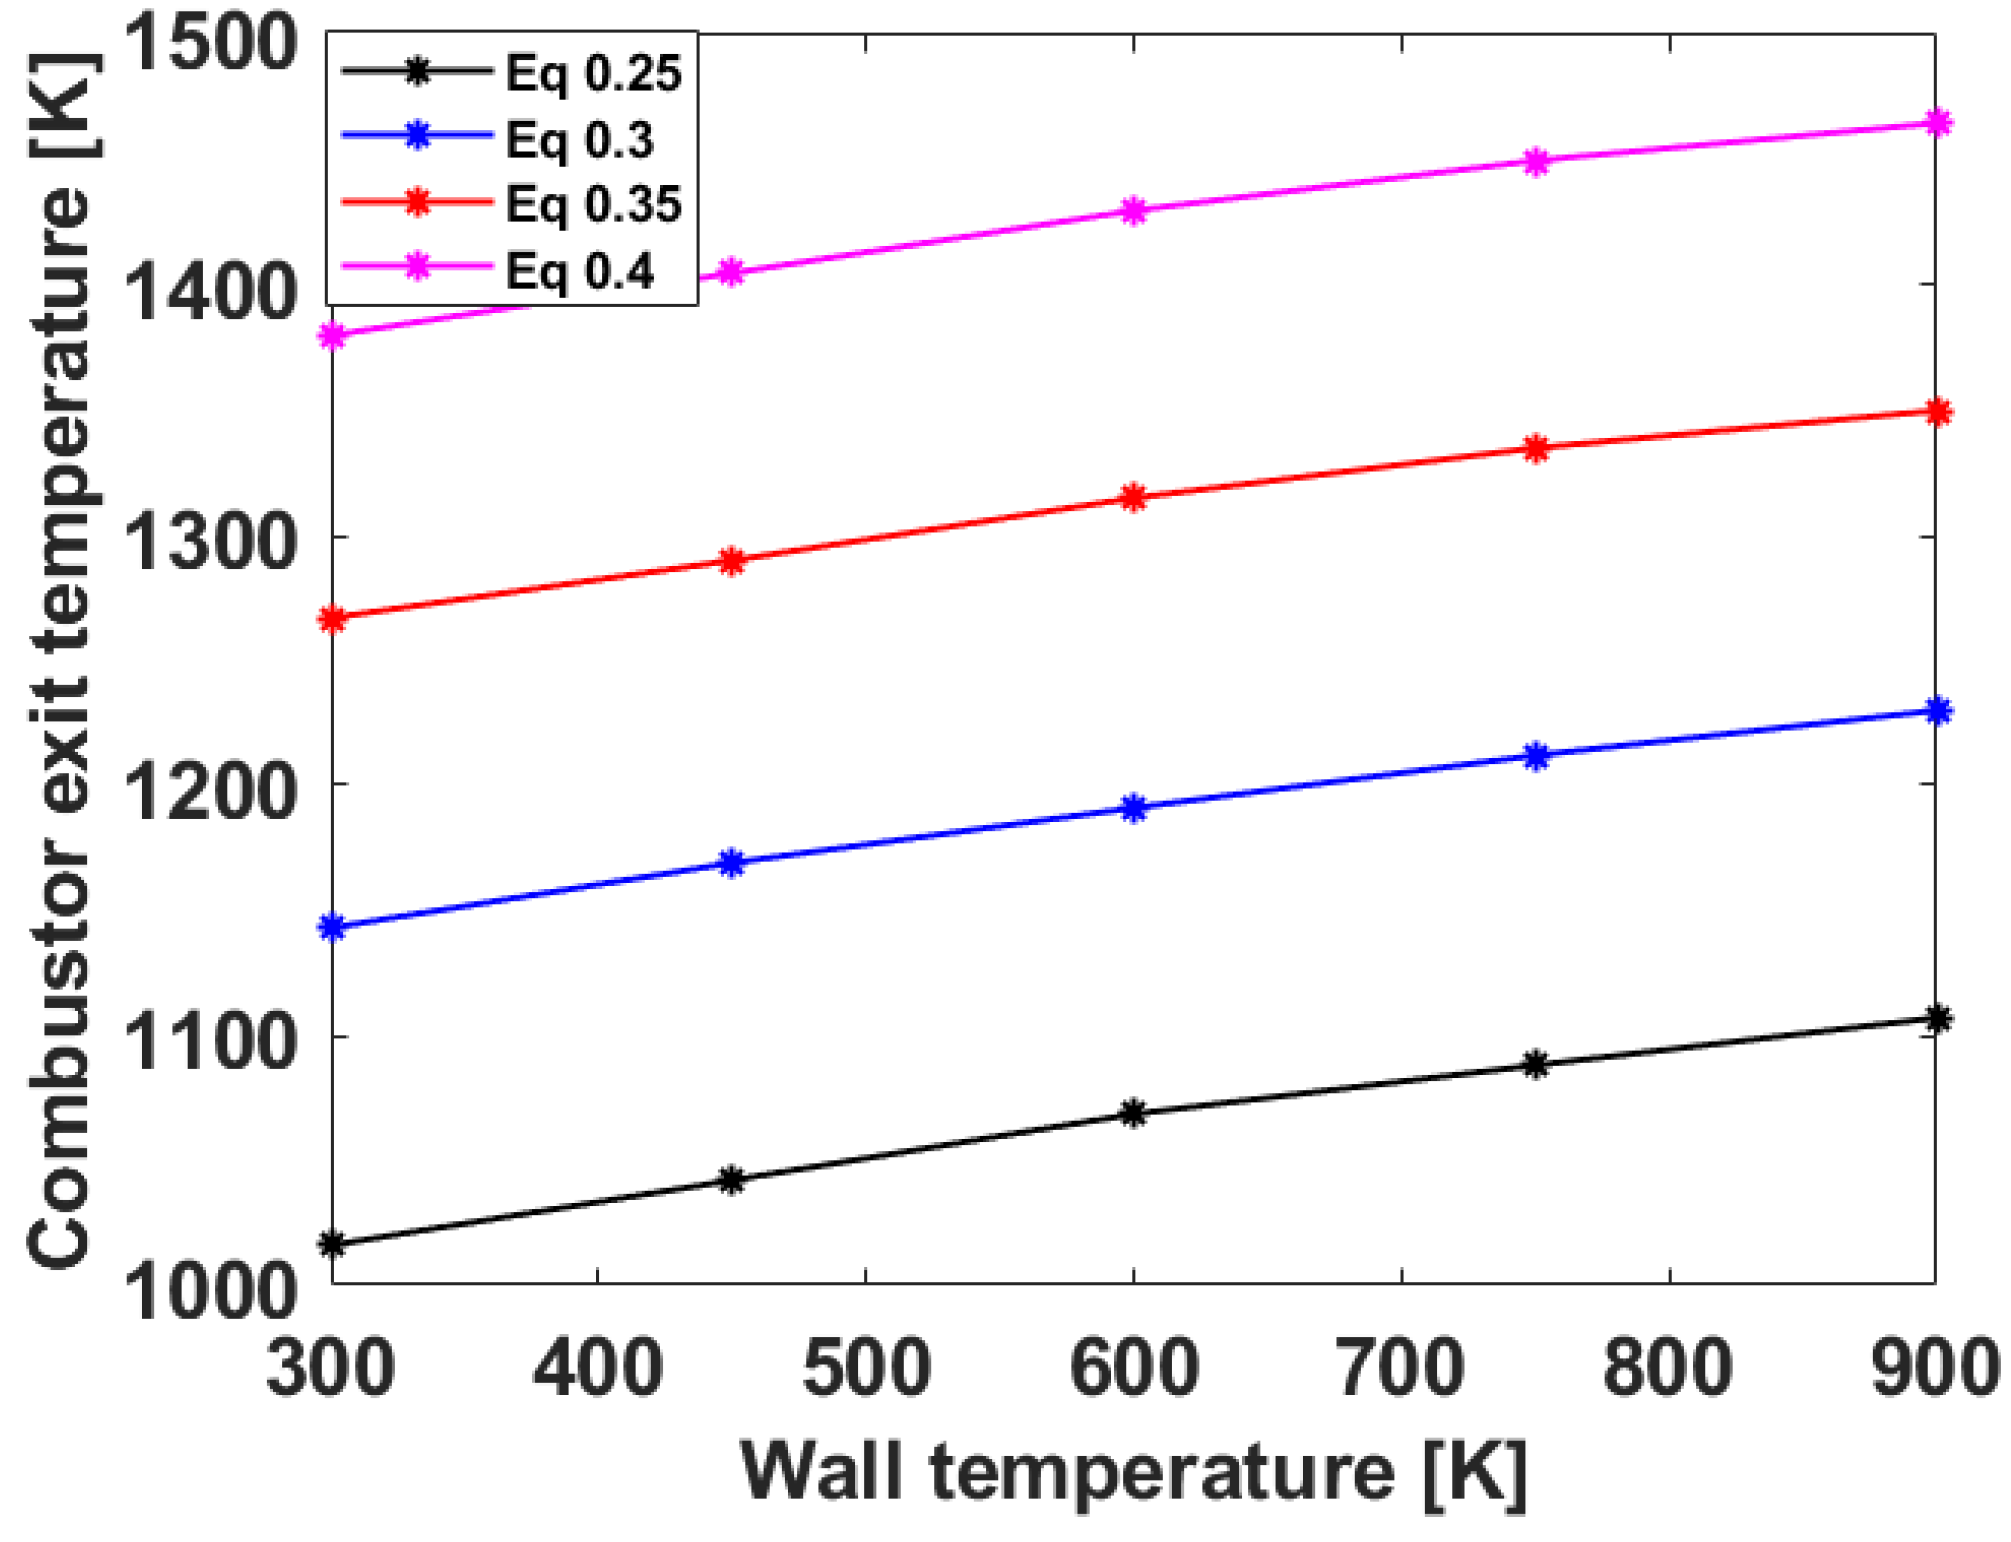
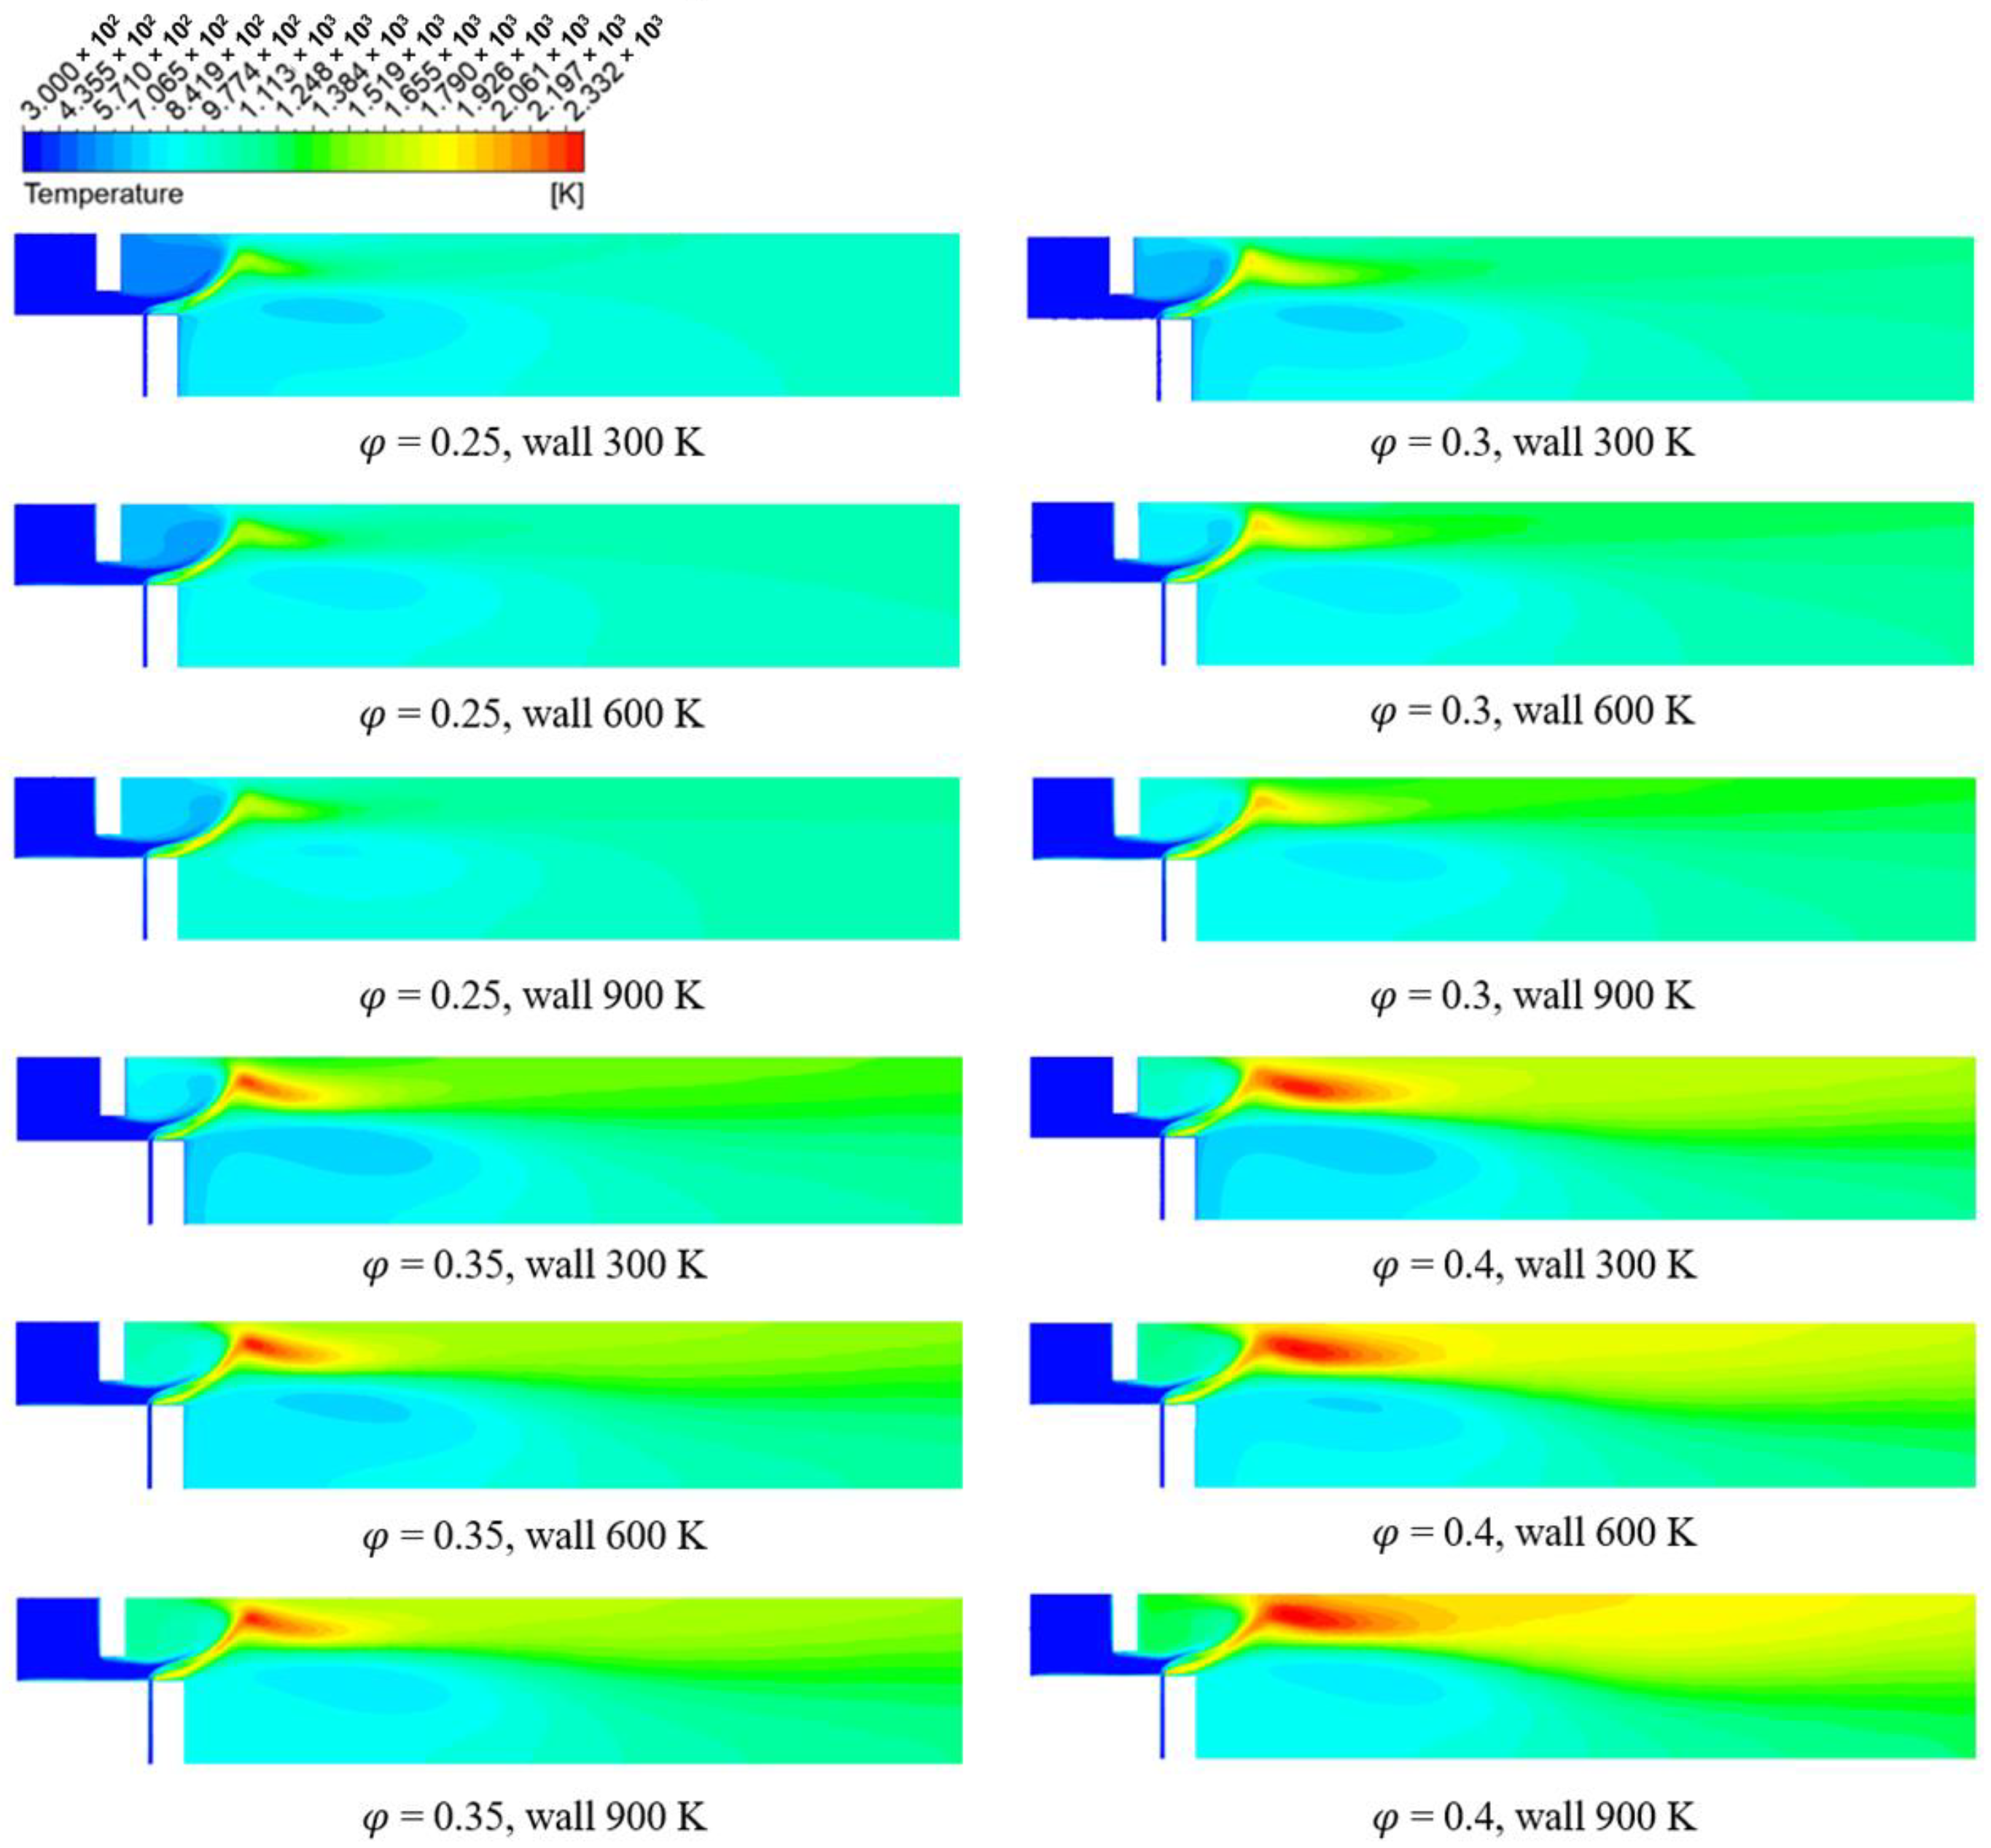
Figure 10 and Figure 11 present combustor exit temperature and NOx emissions as functions of the equivalence ratio and the surface temperature. Meanwhile, Figure 12, Figure 13 and Figure 14 illustrate the temperature, NO, and OH distributions at surface temperatures of 300, 600, and 900 K, respectively, for different equivalence ratios under an air velocity of 50 m/s. As shown in Figure 10 and Figure 12, an increase in the equivalence ratio leads to a rise in overall temperature distribution, particularly in the combustor outlet and internal recirculation vortex regions, regardless of surface temperature conditions. Figure 10 shows that higher surface temperatures result in a linear increase in combustor outlet temperature, with similar trends across all equivalence ratios. This indicates the reduced cooling effect, as heat transfer between the hot gases and the walls decreased with increasing surface temperature.
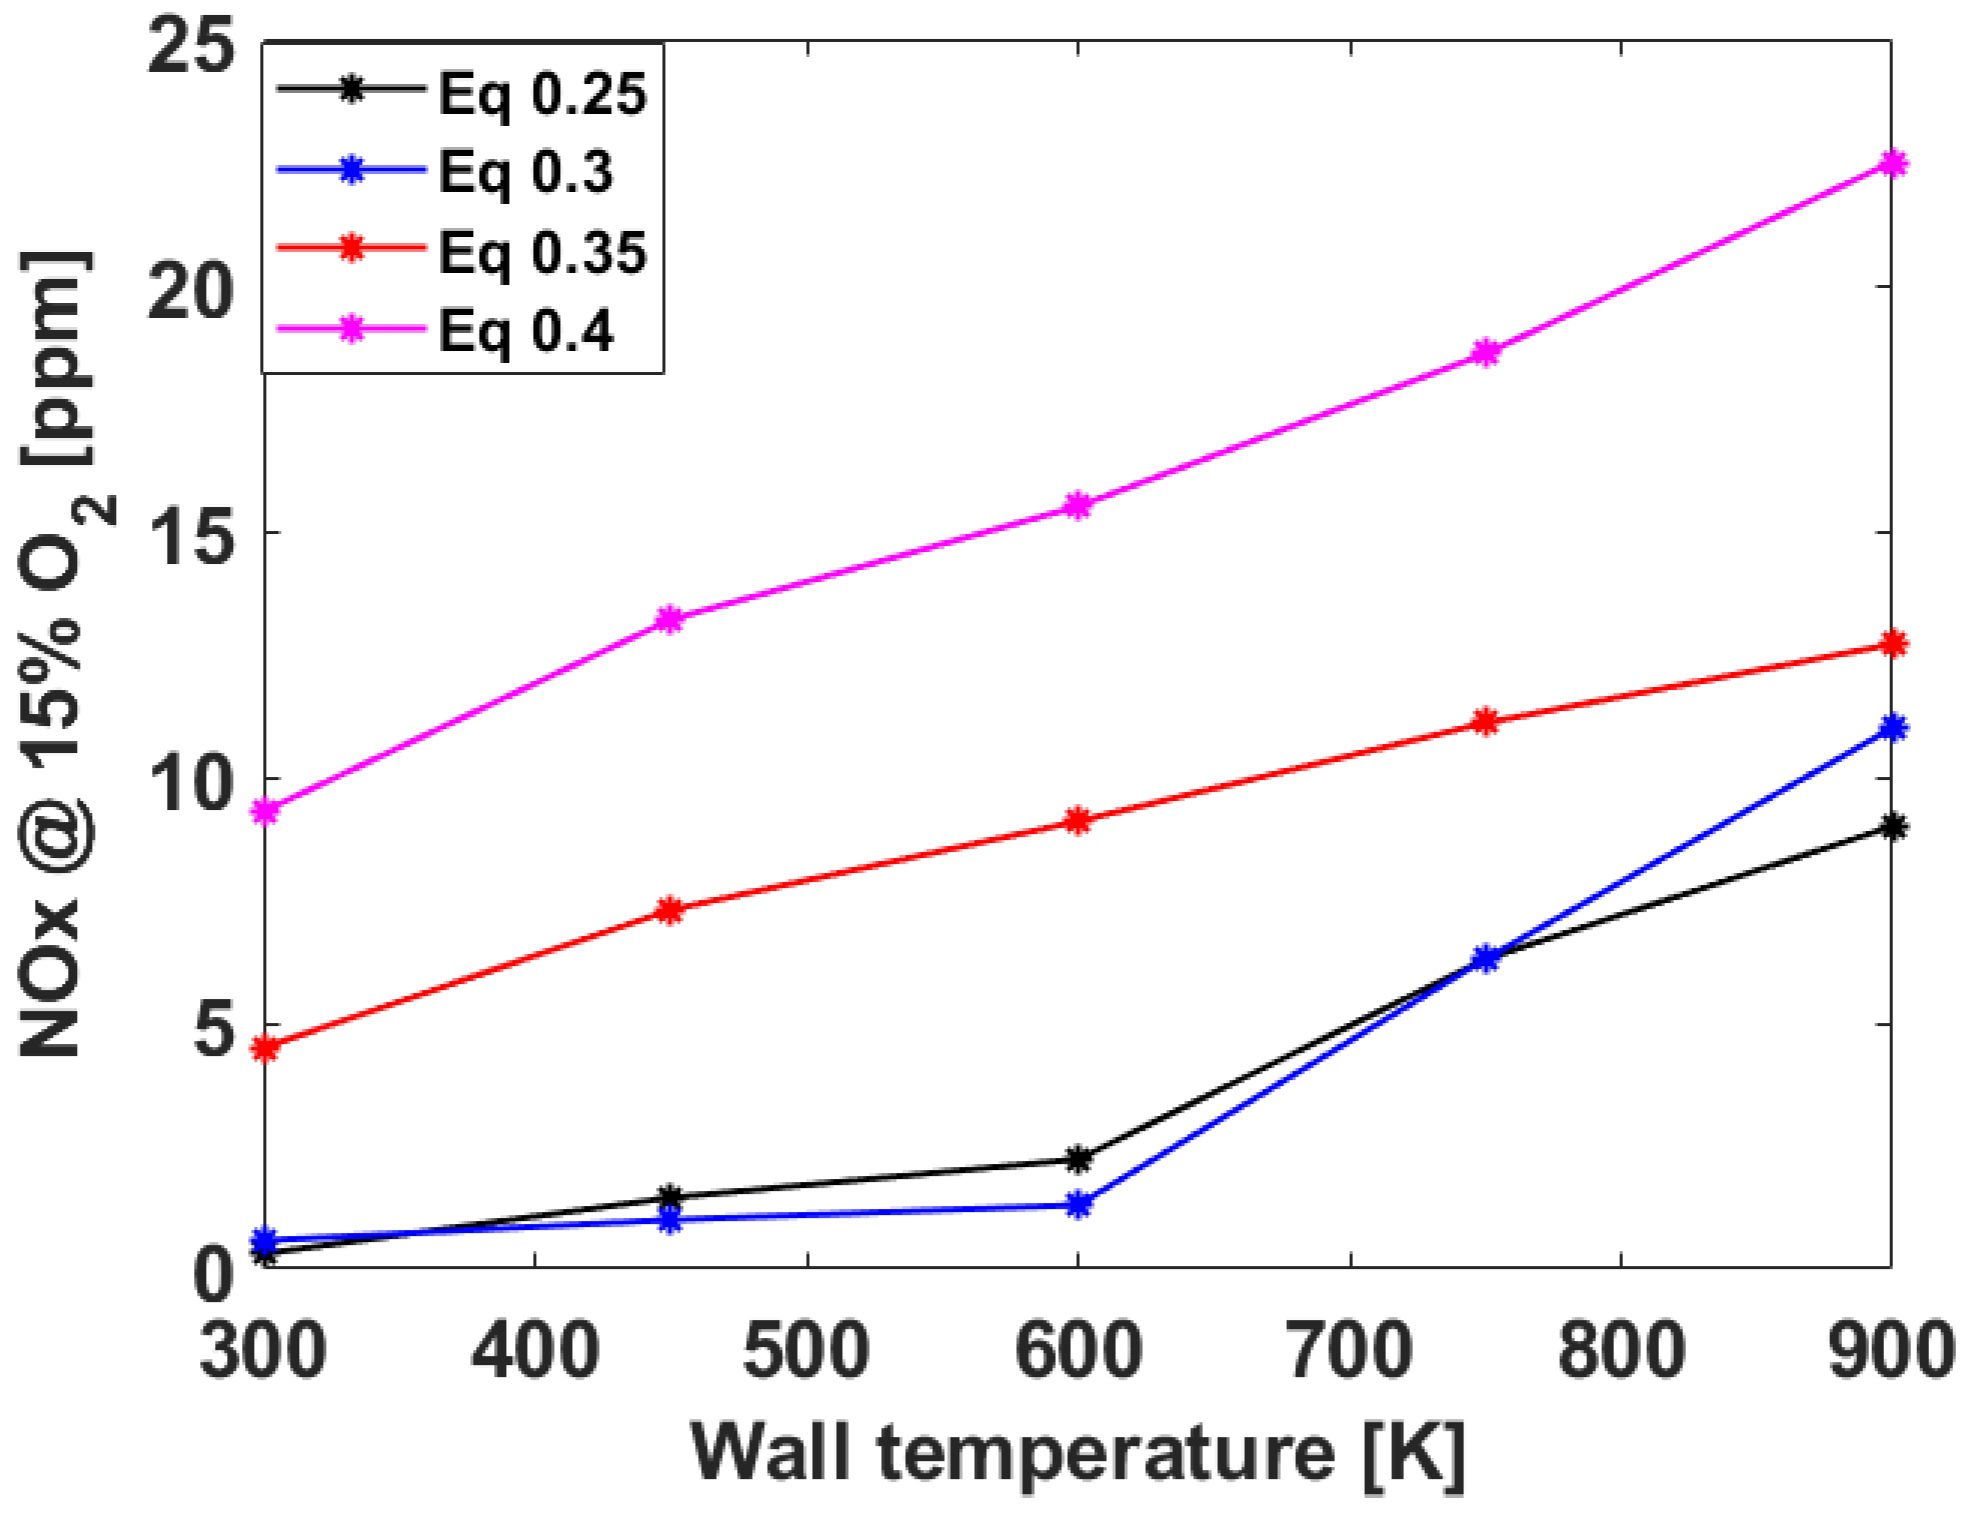
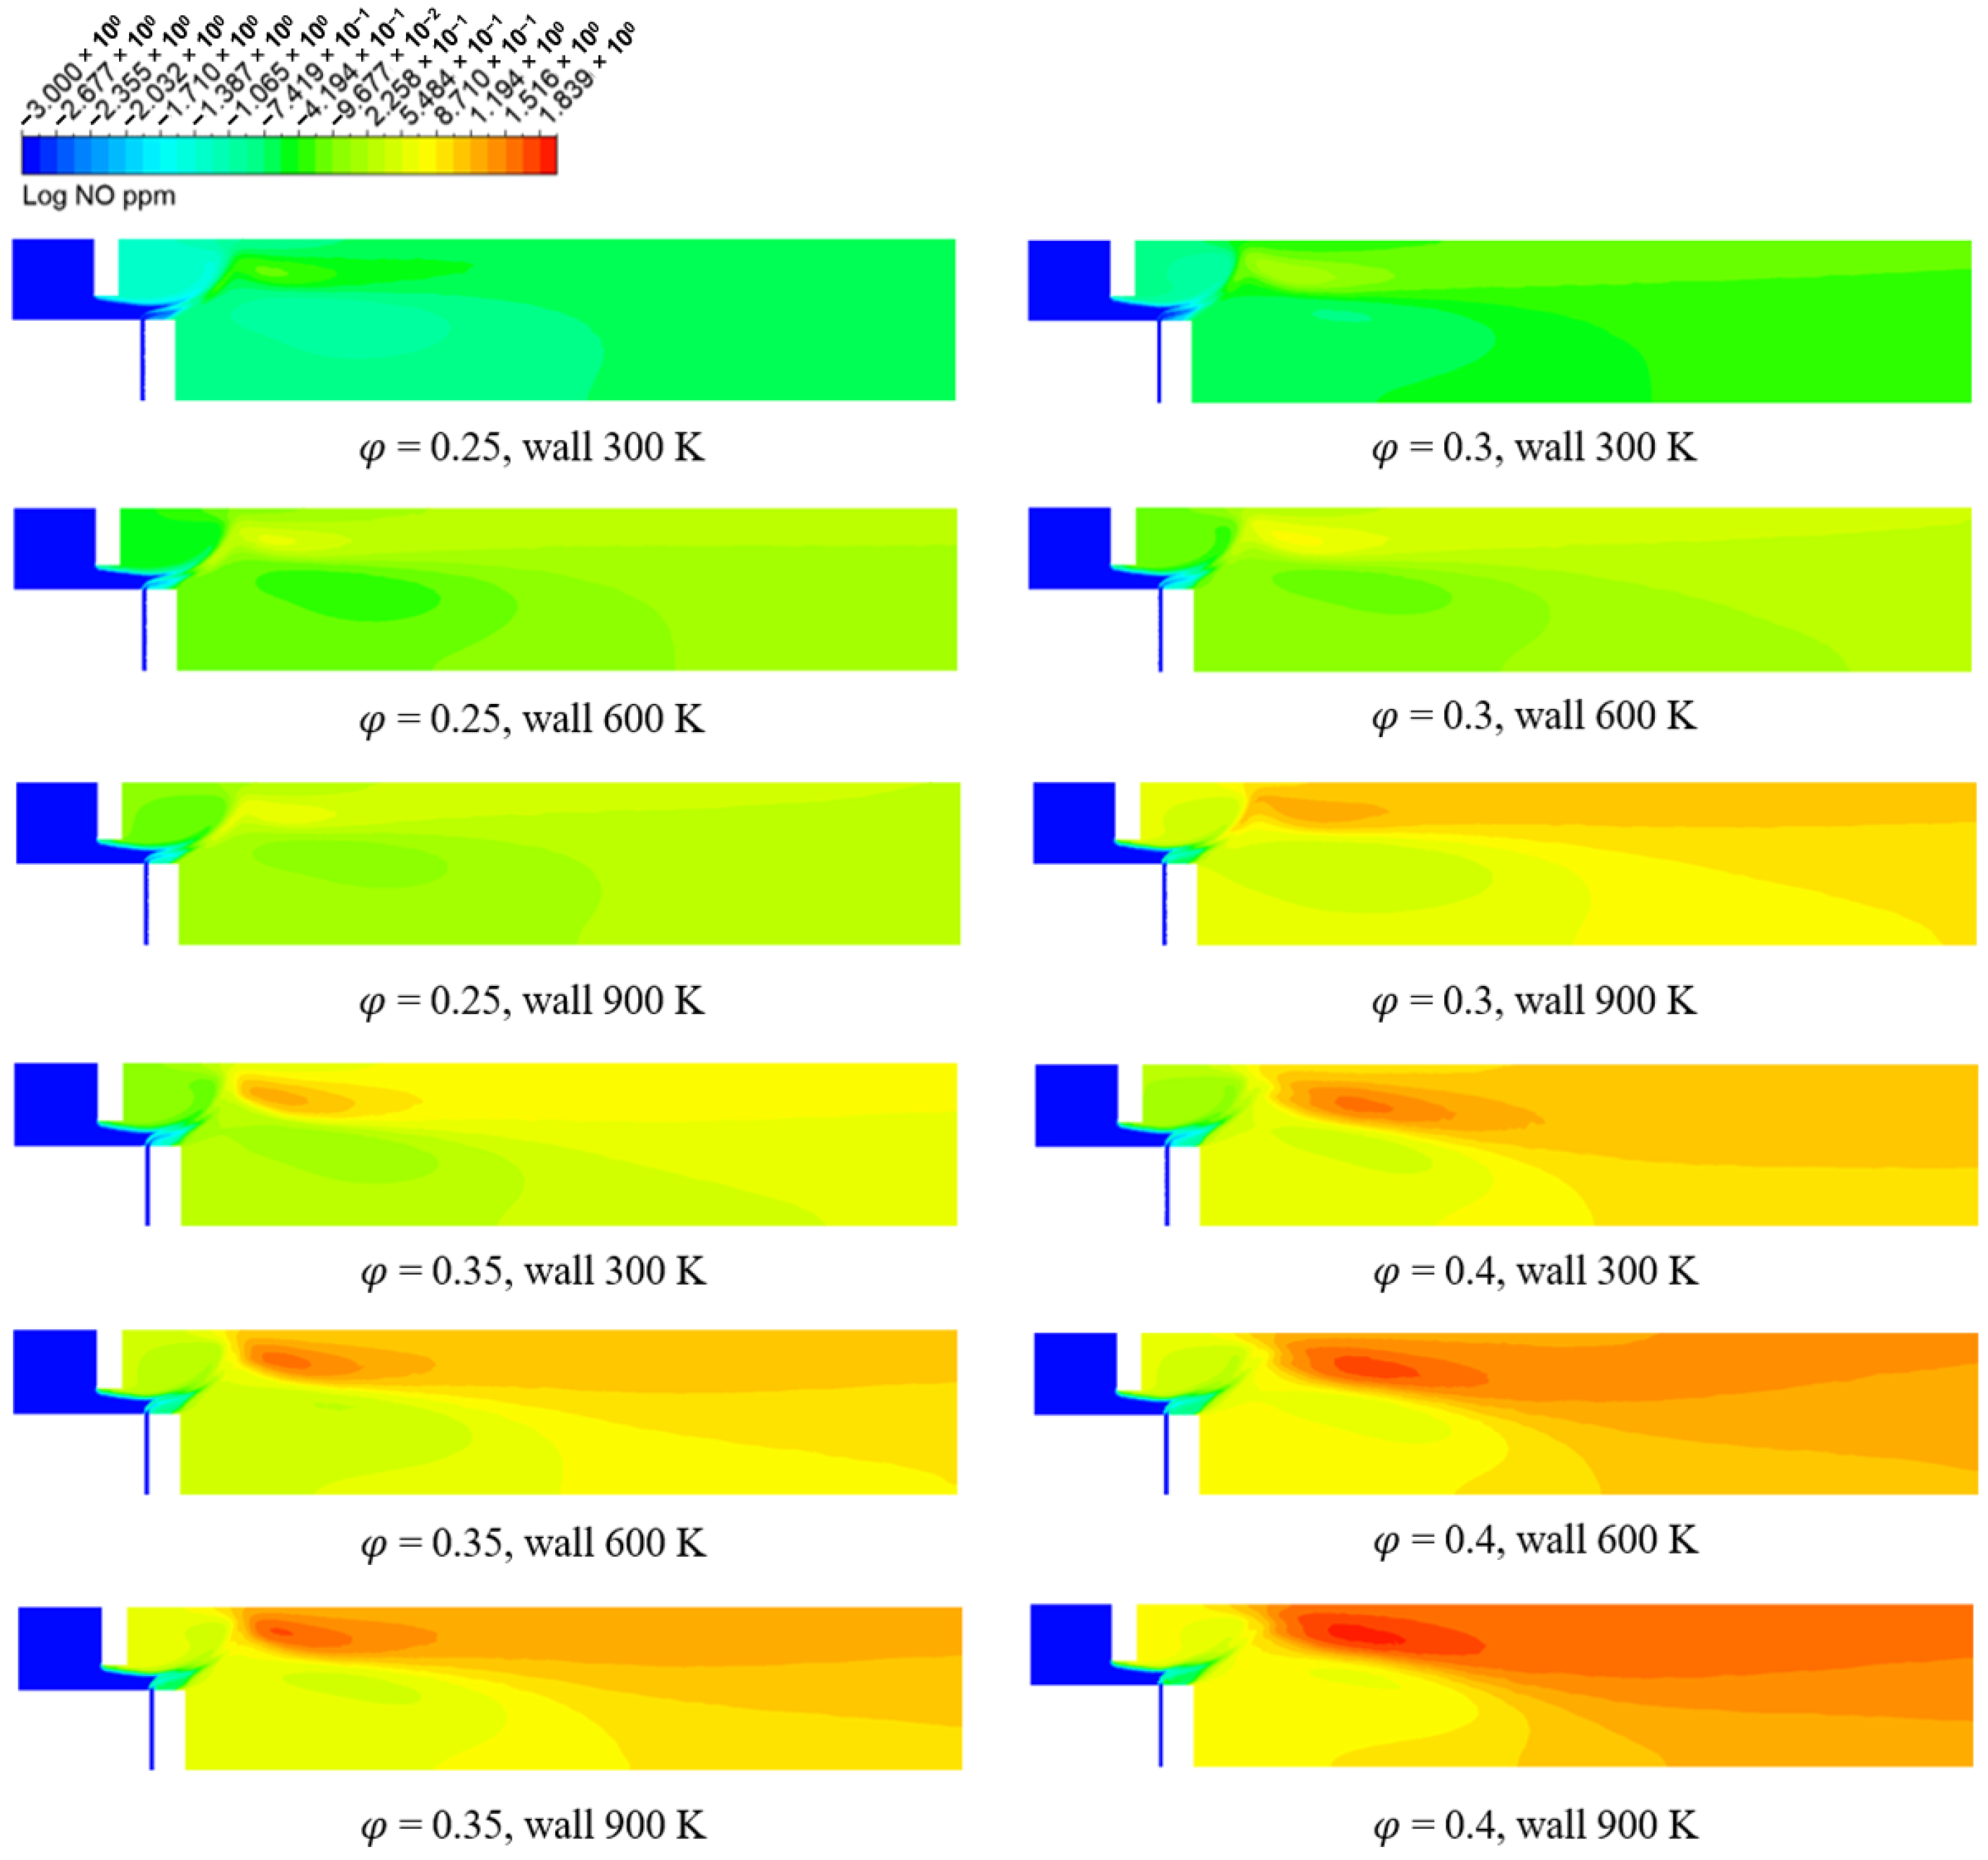
Figure 11 and Figure 13 show that NOx emissions increase as the combustor surface temperature rises across all equivalence ratio conditions, and it remains similar at equivalence ratios of 0.25 and 0.3 but increases significantly when the equivalence ratio reaches 0.35 and 0.4. As in Figure 12, a higher equivalence ratio result in increased overall flame and recirculation zone temperatures, leading to higher thermal NO emissions. Notably, a substantial reduction in NO emissions is observed at equivalence ratios of 0.25 and 0.3 when the combustor surface temperature is below 600 K. These findings highlight the importance of an effective cooling system that can maintain a stable combustor component surface temperature to minimize NOx emissions.
The influence of the surface temperature of the components on NO distribution is shown in Figure 13. NO production is more sensitive to changes in the equivalence ratio, emphasizing the importance of supplying properly balanced air and hydrogen flow rates to maintain stable equivalence ratios and to achieve the desired NO emission levels. This argument is also valid for a full-scale combustor with multiple microflames in which the uniformity of the local equivalence ratio plays an important role.
For a wall temperature of 900 K, Figure 11 shows exit NOx values at equivalence ratios of 0.25 and 0.3 being 9 ppm and 11 ppm, respectively. This observation is consistent with the NO distribution in Figure 12 and Figure 13, where a higher equivalence ratio leads to higher peak temperatures and increased overall NOx formation. However, the trend for a wall temperature of 600 K in Figure 11 is the opposite of what is suggested by Figure 12. A possible explanation is related to dynamic stability of the flame for cases with an equivalence ratio of 0.25. The flames in the lowest tested cases may undergo fluctuations or minor temporal instabilities due to quenching effects near the wall, which can generate instantaneous high peak temperatures. The time-averaged distributions may not accurately capture this temporal effect, especially with the low equivalence ratio cases. The inherent limitation of RANS simulations makes them less suitable for quantitatively comparing the NOx values under low equivalence ratio conditions. Nevertheless, we believe that expecting a single-digit PPM level of NOx under such conditions is reasonable, although significant uncertainties remain.
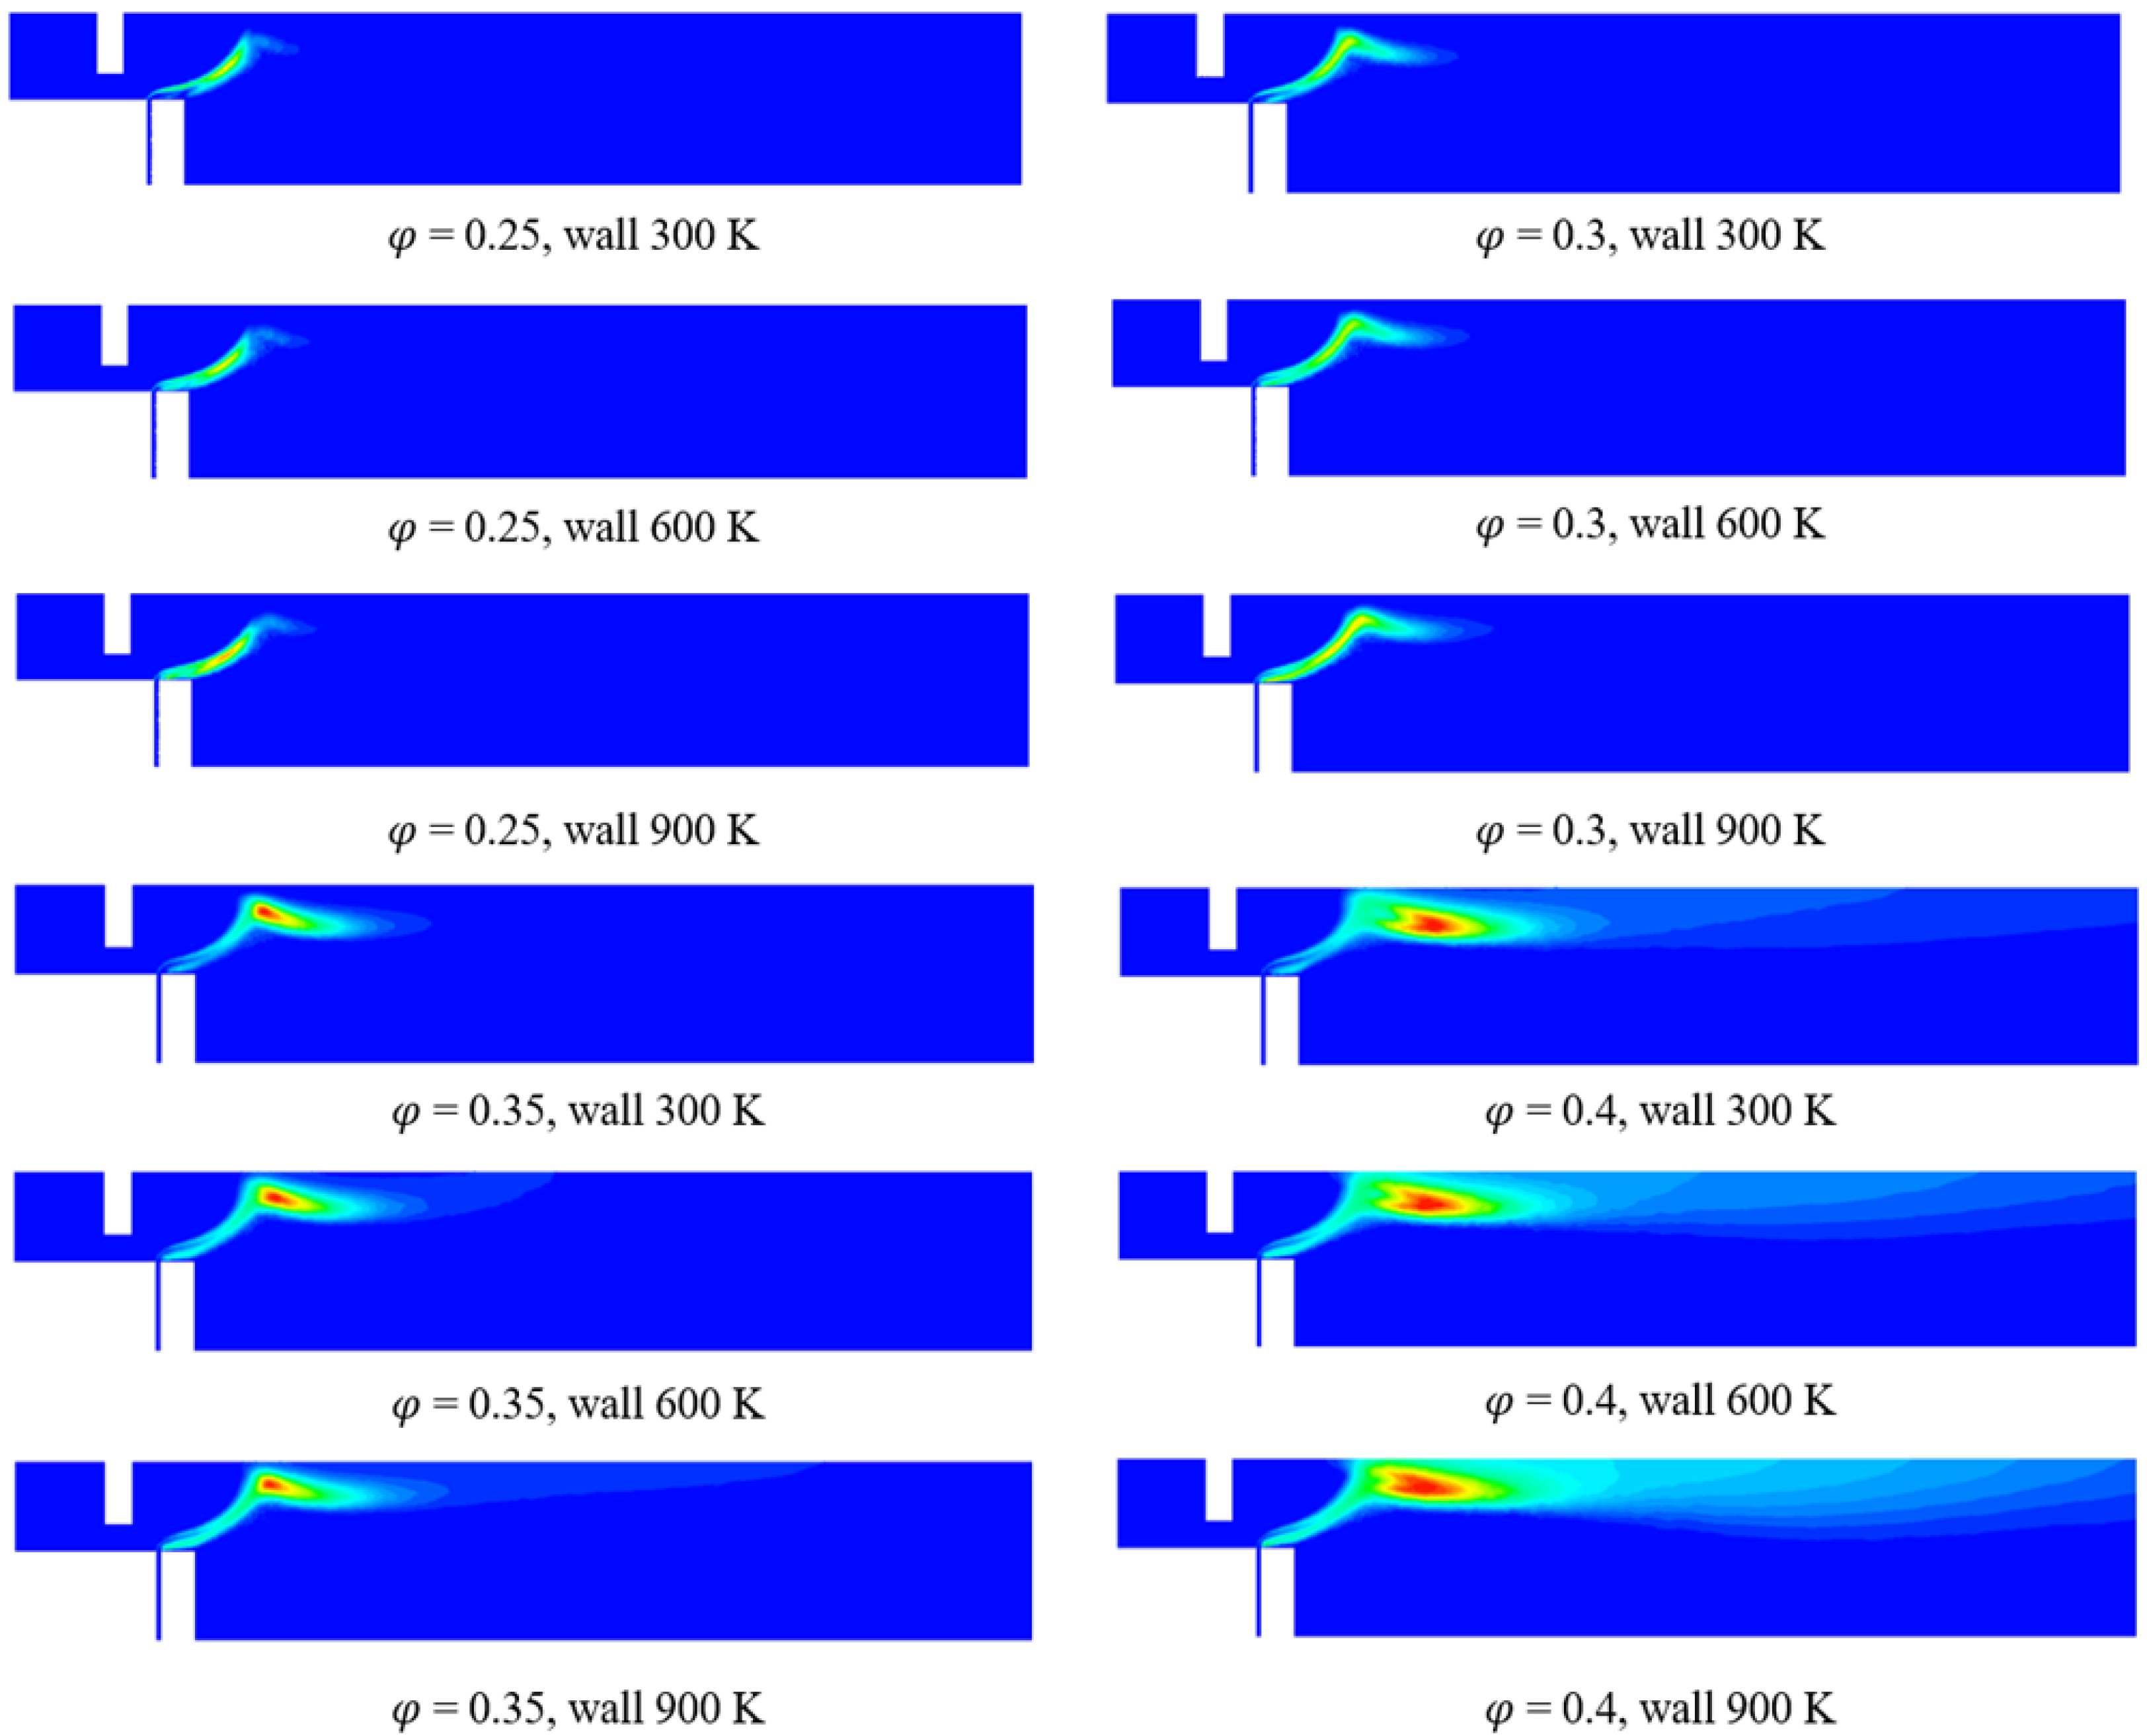
Figure 14 shows the OH distribution formed during the combustion process. The OH distribution is an indicator of active combustion regions. Under low equivalence ratio conditions such as 0.25 and 0.3, the micromix flame structure is visible through the OH distribution on the shear layers between the two recirculating vortices. However, at high equivalence ratios such as 0.35 and 0.4, the OH radicals present even beyond the shear layer regions. As the equivalence ratio increases under constant combustor component surface temperature conditions, active combustion occurs in the downstream region beyond the shear layer between the two recirculating vortices, resulting in a high OH concentration. This suggests that the hydrogen supplied at a high equivalence ratio is not completely burned in the shear layer region, leading to additional combustion in the downstream region.
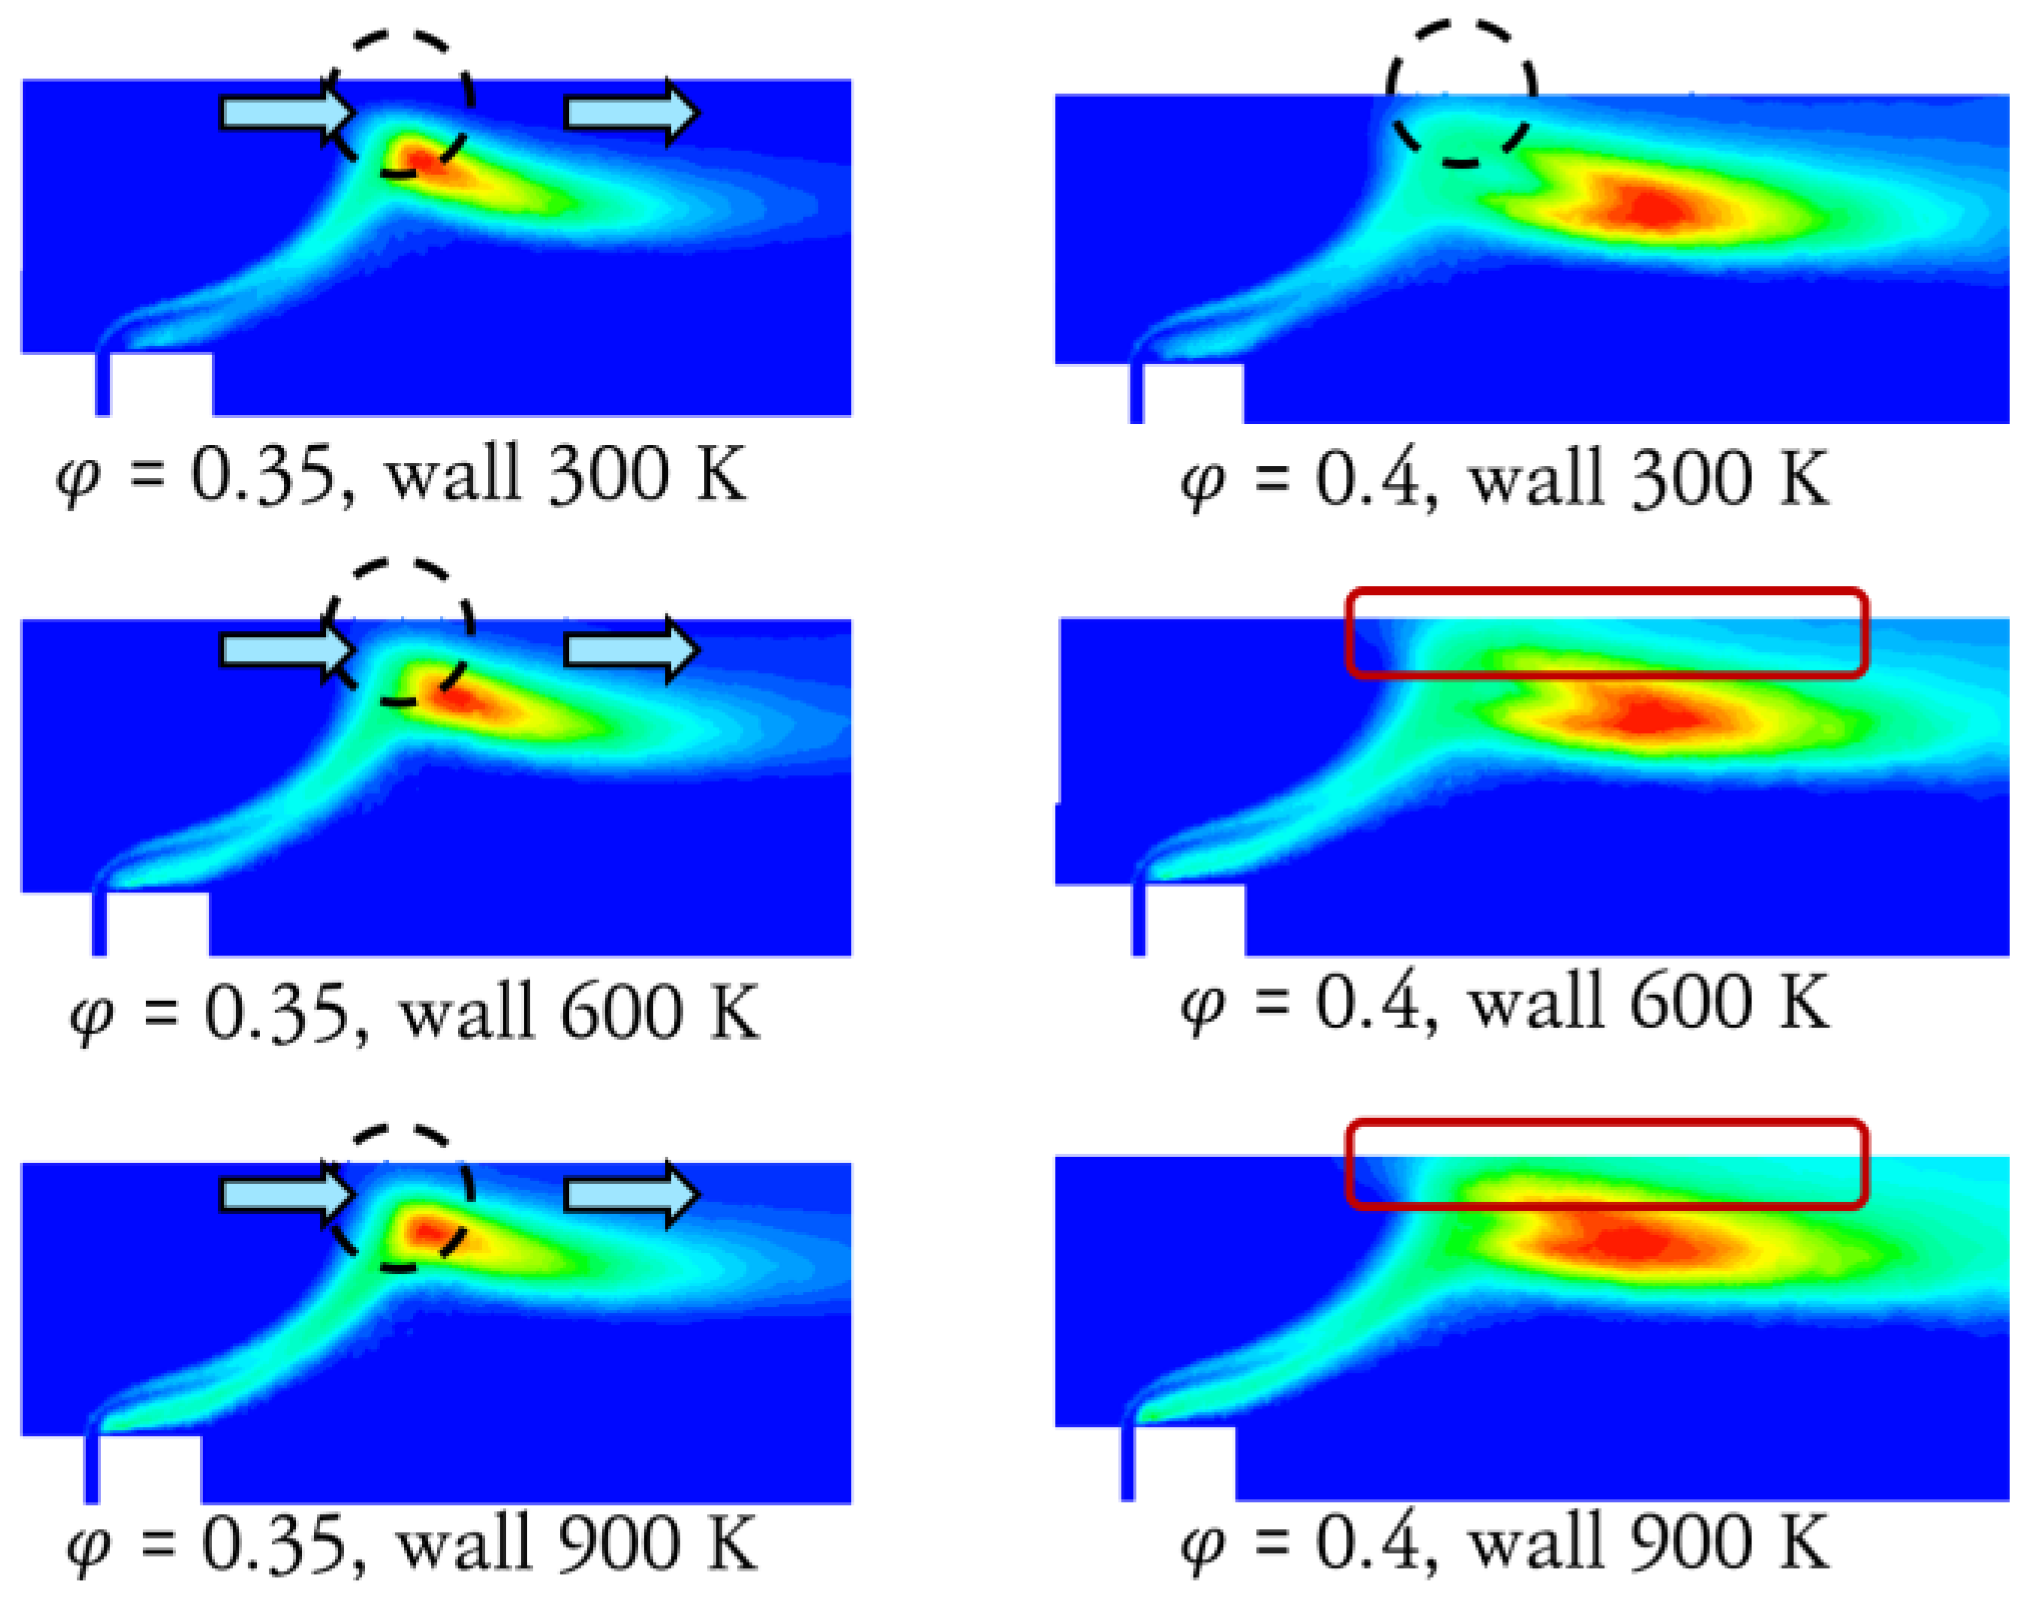
Additionally, at equivalence ratios of 0.35 and 0.4, the OH distribution appears more concentrated near the upper region of the figure, unlike in lower equivalence ratio cases. This indicates that adjacent microflames are close to merging, and there is a possibility of forming a larger coalesced flame. Flame merging is determined by the presence of quenching cold air flow between two flames. Zoomed-in views of OH distribution at the flames are shown in Figure 15. The arrows represent the cold air flow passing through a narrow passage, and the red boxes indicate the regions where flame merging occurs. When a large, coalesced flame develops, the residence time of combustion reactants in the high-temperature zone increases, and the peak temperature also rises due to insufficient cooling. As a result, nitrogen oxide production is significantly increased, making these conditions undesirable.
In summary, numerical results confirmed that the micromix combustor generated very low NOx, typically single-digit PPM levels under most of the conditions studied in this research. The lowest NOx level was achieved with equivalence ratios of 0.25 or 0.3 and an air velocity of 50 m/s or higher, when component surface temperature did not exceed 600 K.

4. Conclusions

In this study, numerical analysis was conducted on a research micromix combustor, focusing on the factors influencing nitrogen oxide emissions. It was confirmed that optimizing the air flow rate, equivalence ratio, and component surface temperature is crucial for reducing nitrogen oxide emissions.
Increasing air and hydrogen flow rates at a fixed equivalence ratio significantly reduced NOx by shortening reactant residence time in the high-temperature combustion region. To investigate the effect of component cooling performance, simulations were conducted by varying the wall surface temperature and the equivalence ratio under constant air flow conditions. As the surface temperature of the combustor components increased, the internal recirculation vortex and flame region temperature rose, leading to a corresponding increase in NOx emissions. Furthermore, as the equivalence ratio and the fuel flow rate increased, the overall flame temperature rose, resulting in higher NOx production. In some cases with high equivalence ratios, the flame regions were extended because incomplete hydrogen combustion within the shear layer led to nearly merged flames. Since flame merging enhances nitrogen oxide formation, numerical analysis suggests that operating the combustor at a lower equivalence ratio than the threshold would be preferable. In this study, the threshold was found to be an equivalence ratio of 0.35, and wall temperature along with other secondary factors may influence the onset of merging.
Subsequent experimental hydrogen combustion studies are currently in progress. Additional equipment will be installed, and optical measurement devices will be used to analyze flow velocity, exhaust gas composition, and temperature distribution. By comparing the measured values with the numerical analysis results, the validity of the numerical analysis can be assessed, facilitating a better understanding of combustor operating conditions. Further studies based on this research will contribute to the advancement of hydrogen gas turbine technology.

Author Contributions

Conceptualization, S.P.; methodology, S.O. and S.P.; validation, M.K. and S.P.; formal analysis, M.K. and S.O.; investigation, M.K.; resources, S.P.; writing—original draft preparation, M.K.; writing—review and editing, S.P.; visualization, M.K. and S.O.; supervision, S.P.; project administration, S.P.; funding acquisition, S.P. All authors have read and agreed to the published version of the manuscript.

Funding

This research was supported by Basic Science Research Program through the National Research Foundation of Korea (NRF) funded by the Ministry of Education (No. RS-2022-NR070875), and also by a 2022 Start-up Grant and a 2023 Research Foundation Grant by Korea Aerospace University.

Data Availability Statement

The data that support the findings of this study are available from the corresponding author on reasonable request.

Acknowledgments

The authors would like to express their gratitude to Jae Su Kwak and the researchers of the Heat and Flow Control Laboratory for their invaluable support in conducting the experiments.

Conflicts of Interest

The authors declare no conflicts of interest.

References

  1. Kim, J.; Lee, T. A Case Study on the Use of Low-Carbon Energy for Korean Energy Policy; Korea Energy Economics Institute Regular Research Report: Ulsan, Republic of Korea, 2021; pp. 1–77. [Google Scholar]
  2. Ock, S.; Kim, M.; Park, S. Development of a 30 kW Hydrogen-Fueled Micromix Combustor for Research. J. Aerosp. Syst. Eng. 2023, 17, 72–81. [Google Scholar]
  3. Fumey, B.; Buetler, T.; Vogt, U.F. Ultra-Low NOx Emissions from Catalytic Hydrogen Combustion. Appl. Energy 2018, 213, 334–342. [Google Scholar] [CrossRef]
  4. Sun, X.; Agarwal, P.; Carbonara, F.; Abbott, D.; Gauthier, P.; Sethi, B. Numerical Investigation into the Impact of Injector Geometrical Design Parameters on Hydrogen Micromix Combustion Characteristics. In Volume 3: Ceramics; Coal, Biomass, Hydrogen, and Alternative Fuels, Proceedings of the ASME Turbo Expo 2020: Turbomachinery Technical Conference and Exposition, Virtual, Online, 21 September 2020; American Society of Mechanical Engineers: London, UK, 2020; p. V003T03A015. [Google Scholar]
  5. Kim, D. Review on the Development Trend of Hydrogen Gas Turbine Combustion Technology. JKSC 2019, 24, 1–10. [Google Scholar] [CrossRef]
  6. Shin, Y.; Choi, C.; Jeong, H.; Jo, S.; Cho, E.-S. Study on Combustion Characteristics of Multi-tube H2 Nozzles. JKSC 2023, 28, 57–66. [Google Scholar] [CrossRef]
  7. Kim, J.; Kim, S.; Park, H.; Kim, S. Hydrogen Combustion Gas Turbine of Hanwha Aerospace; Korean Society for Fluid Machinery: Pyeongchang, Republic of Korea, 2021; pp. 5–6. [Google Scholar]
  8. Kim, D. Hydrogen Turbine Combustion Technology. J. KSME 2022, 62, 43–49. [Google Scholar]
  9. Dahl, G.; Suttrop, F. Engine Control and Low- NOx Combustion for Hydrogen Fuelled Aircraft Gas Turbines. Int. J. Hydrogen Energy 1998, 23, 695–704. [Google Scholar] [CrossRef]
  10. Haj Ayed, A.; Kusterer, K.; Funke, H.H.-W.; Keinz, J.; Striegan, C.; Bohn, D. Experimental and Numerical Investigations of the Dry-Low-NOx Hydrogen Micromix Combustion Chamber of an Industrial Gas Turbine. Propuls. Power Res. 2015, 4, 123–131. [Google Scholar] [CrossRef]
  11. Haj Ayed, A.; Kusterer, K.; Funke, H.H.-W.; Keinz, J.; Bohn, D. CFD Based Exploration of the Dry-Low-NOx Hydrogen Micromix Combustion Technology at Increased Energy Densities. Propuls. Power Res. 2017, 6, 15–24. [Google Scholar] [CrossRef]
  12. Haj Ayed, A. Numerical Characterization and Development of the Dry Low NOx High Hydrogen Content Fuel Micromix Combustion for Gas Turbine Applications. Ph.D. Dissertation, RWTH Aachen University, Aachen, Germany, 2017. [Google Scholar]
  13. Funke, H.H.-W.; Beckmann, N.; Abanteriba, S. An Overview on Dry Low NOx Micromix Combustor Development for Hydrogen-Rich Gas Turbine Applications. Int. J. Hydrogen Energy 2019, 44, 6978–6990. [Google Scholar] [CrossRef]
  14. Giannouloudis, A.; Sun, X.; Corsar, M.R.; Booden, S.J.; Singh, G.; Abbott, D.; Nalianda, D.; Sethi, B. On the Development of an Experimental Rig for Hydrogen Micromix Combustion Testing. In Proceedings of the 10th European Combustion Meeting, Naples, Italy, 14–15 April 2021. [Google Scholar]
  15. Lopez-Ruiz, G.; Alava, I.; Blanco, J.M. Study on the Feasibility of the Micromix Combustion Principle in Low NO H2 Burners for Domestic and Industrial Boilers: A Numerical Approach. Energy 2021, 236, 121456. [Google Scholar] [CrossRef]
  16. Dai, C.; Zuo, W.; Li, Q.; Zhou, K.; Huang, Y.; Zhang, G.; E, J. Numerical Investigations on the Performance of a Hydrogen-Fueled Micro Planar Combustor with V-Shaped Baffle for Thermophotovoltaic Applications. Energy 2025, 326, 136270. [Google Scholar] [CrossRef]
  17. Nicol, D.G.; Steele, R.C.; Marinov, N.M.; Malte, P.C. The Importance of the Nitrous Oxide Pathway to NOx in Lean-Premixed Combustion. J. Eng. Gas Turbines Power 1995, 117, 100–111. [Google Scholar] [CrossRef]
  18. Lefebvre, A.H.; Ballal, D.R. Gas Turbine Combustion: Alternative Fuels and Emissions, 3rd ed.; Taylor & Francis: Boca Raton, FL, USA, 2010; ISBN 978-1-4200-8604-1. [Google Scholar]
  19. Tamang, S.; Park, H. A Numerical Investigation on Temperature Uniformity Factor and Thermal NOx Concentration in 1.15MW Hydrogen Combustor. J. Comput. Fluids Eng. 2023, 28, 67–75. [Google Scholar] [CrossRef]
  20. Smith, G. Gri-Mech.—An Optimized Detailed Chemical Reaction Mechanism for Methane Combustion. 1999. Available online: http://www.me.berkeley.edu/gri_mech (accessed on 18 November 2025).
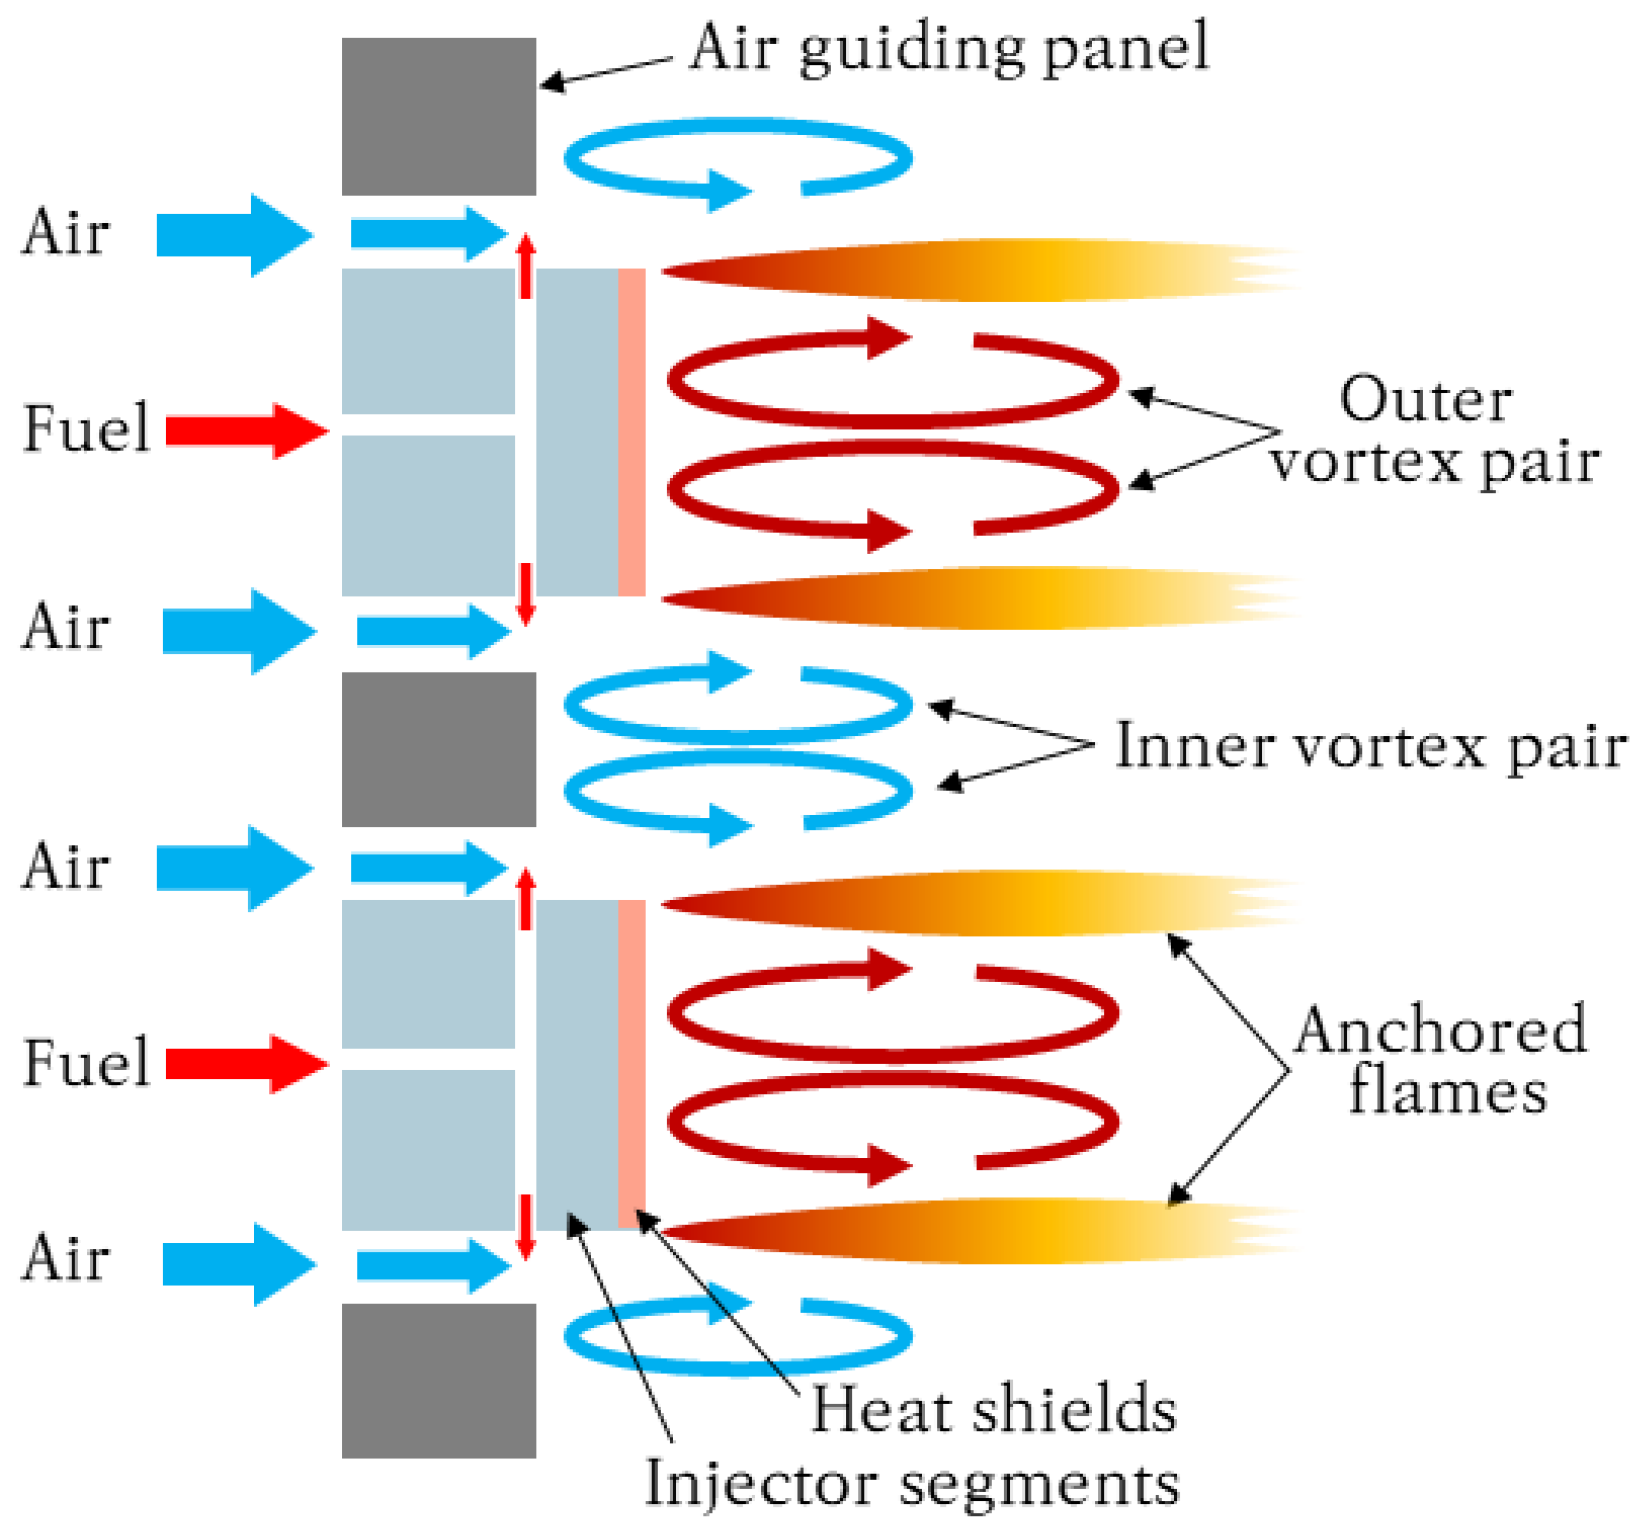
Figure 1. Schematic of flow structure inside a micromix combustor [2].
Energies 18 06168 g001
Figure 2. Designed research micromix combustor (KAU Hydrogen Micromix Combustor): (a) overall assembly, (b) computation domain for a single micromix flame.
Energies 18 06168 g002
Figure 3. Cutaway view of the fluid body geometry of a micromix fuel injector.
Energies 18 06168 g003
Figure 4. Mesh for micromix combustor simulation: (a) overall domain, (b) zoomed-in cross-section.
Energies 18 06168 g004
Figure 5. Combustor exit temperature as a function of air mass flow rate with different equivalence ratios.
Energies 18 06168 g005
Figure 6. NOx emissions as a function of air mass flow rates with different equivalence ratios.
Energies 18 06168 g006
Figure 7. Temperature distribution with varied air mass flow rates and a fixed equivalence ratio.
Energies 18 06168 g007
Figure 8. Logarithmic (base 10) NO distributions in PPM with varied air mass flow rates and a fixed equivalence ratio.
Energies 18 06168 g008
Figure 9. Velocity and OH distributions with varied air mass flow rates and a fixed equivalence ratio.
Energies 18 06168 g009
Figure 10. Combustor exit temperature with different equivalence ratios as a function of combustor component surface temperature.
Energies 18 06168 g010
Figure 11. NOx emission with different equivalence ratios as a function of combustor component surface temperature.
Energies 18 06168 g011
Figure 12. Temperature distributions with varied equivalence ratios and combustor surface temperatures.
Energies 18 06168 g012
Figure 13. Logarithmic (base 10) NO distributions in PPM with varied equivalence ratios and combustor surface temperatures.
Energies 18 06168 g013
Figure 14. OH distributions with varied equivalence ratios and combustor surface temperatures.
Energies 18 06168 g014
Figure 15. Zoomed-in views of OH distributions and merged flames at equivalence ratio of 0.4 and wall temperatures of 600 K and 900 K. Arrows: quenching cold air flows; dot line circle: quenching air passage, red boxes: flame merging area.
Energies 18 06168 g015
Table 1. Geometrical parameters of KAU hydrogen micromix combustor.
Geometrical ParametersValue
Offset distance3 mm
Mixing distance4 mm
Air gate aspect ratio1
H2 injection hole diameter0.5 mm
Air gate area8.034 mm2
Table 2. Summary of boundary conditions and operating ranges for numerical analysis.
Boundary ConditionsValue/Range
T a i r 300 K
P a i r 101.325 kPa
T H 2 300 K
P H 2 101.325 kPa
V a i r 5–100 m/s
m ˙ a i r 0.0471–0.942 g/s
R e a i r 943–18,868
m ˙ H 2 0.000343–0.011 g/s
J 1.247–2.444
φ 0.25–0.4
T w a l l 300–900 K
Table 3. Air velocities and flow rates of air and hydrogen under selected test conditions.
V a i r
(kg/s)
R e a i r m ˙ a i r
(kg/s)
m ˙ H 2 (kg/s)
φ = 0.25 φ = 0.3 φ = 0.35 φ = 0.4
59436.80 × 10−54.95 × 10−75.94 × 10−76.93 × 10−77.92 × 10−7
1018861.36 × 10−49.89 × 10−71.19 × 10−61.39 × 10−61.58 × 10−6
2547173.40 × 10−42.47 × 10−62.97 × 10−63.46 × 10−63.96 × 10−6
5094346.80 × 10−44.95 × 10−65.94 × 10−66.93 × 10−67.92 × 10−6
10018,8681.36 × 10−39.90 × 10−61.19 × 10−51.39 × 10−51.58 × 10−5
Disclaimer/Publisher’s Note: The statements, opinions and data contained in all publications are solely those of the individual author(s) and contributor(s) and not of MDPI and/or the editor(s). MDPI and/or the editor(s) disclaim responsibility for any injury to people or property resulting from any ideas, methods, instructions or products referred to in the content.