Performance Prediction of a Vertical Downward Supply Direct Expansion Cooling System for Large Spaces Through Field Experiments
Abstract
1. Introduction
1.1. Background
1.2. Literature Review
1.3. Research Gap and Objectives
2. Materials and Methods
2.1. Overview
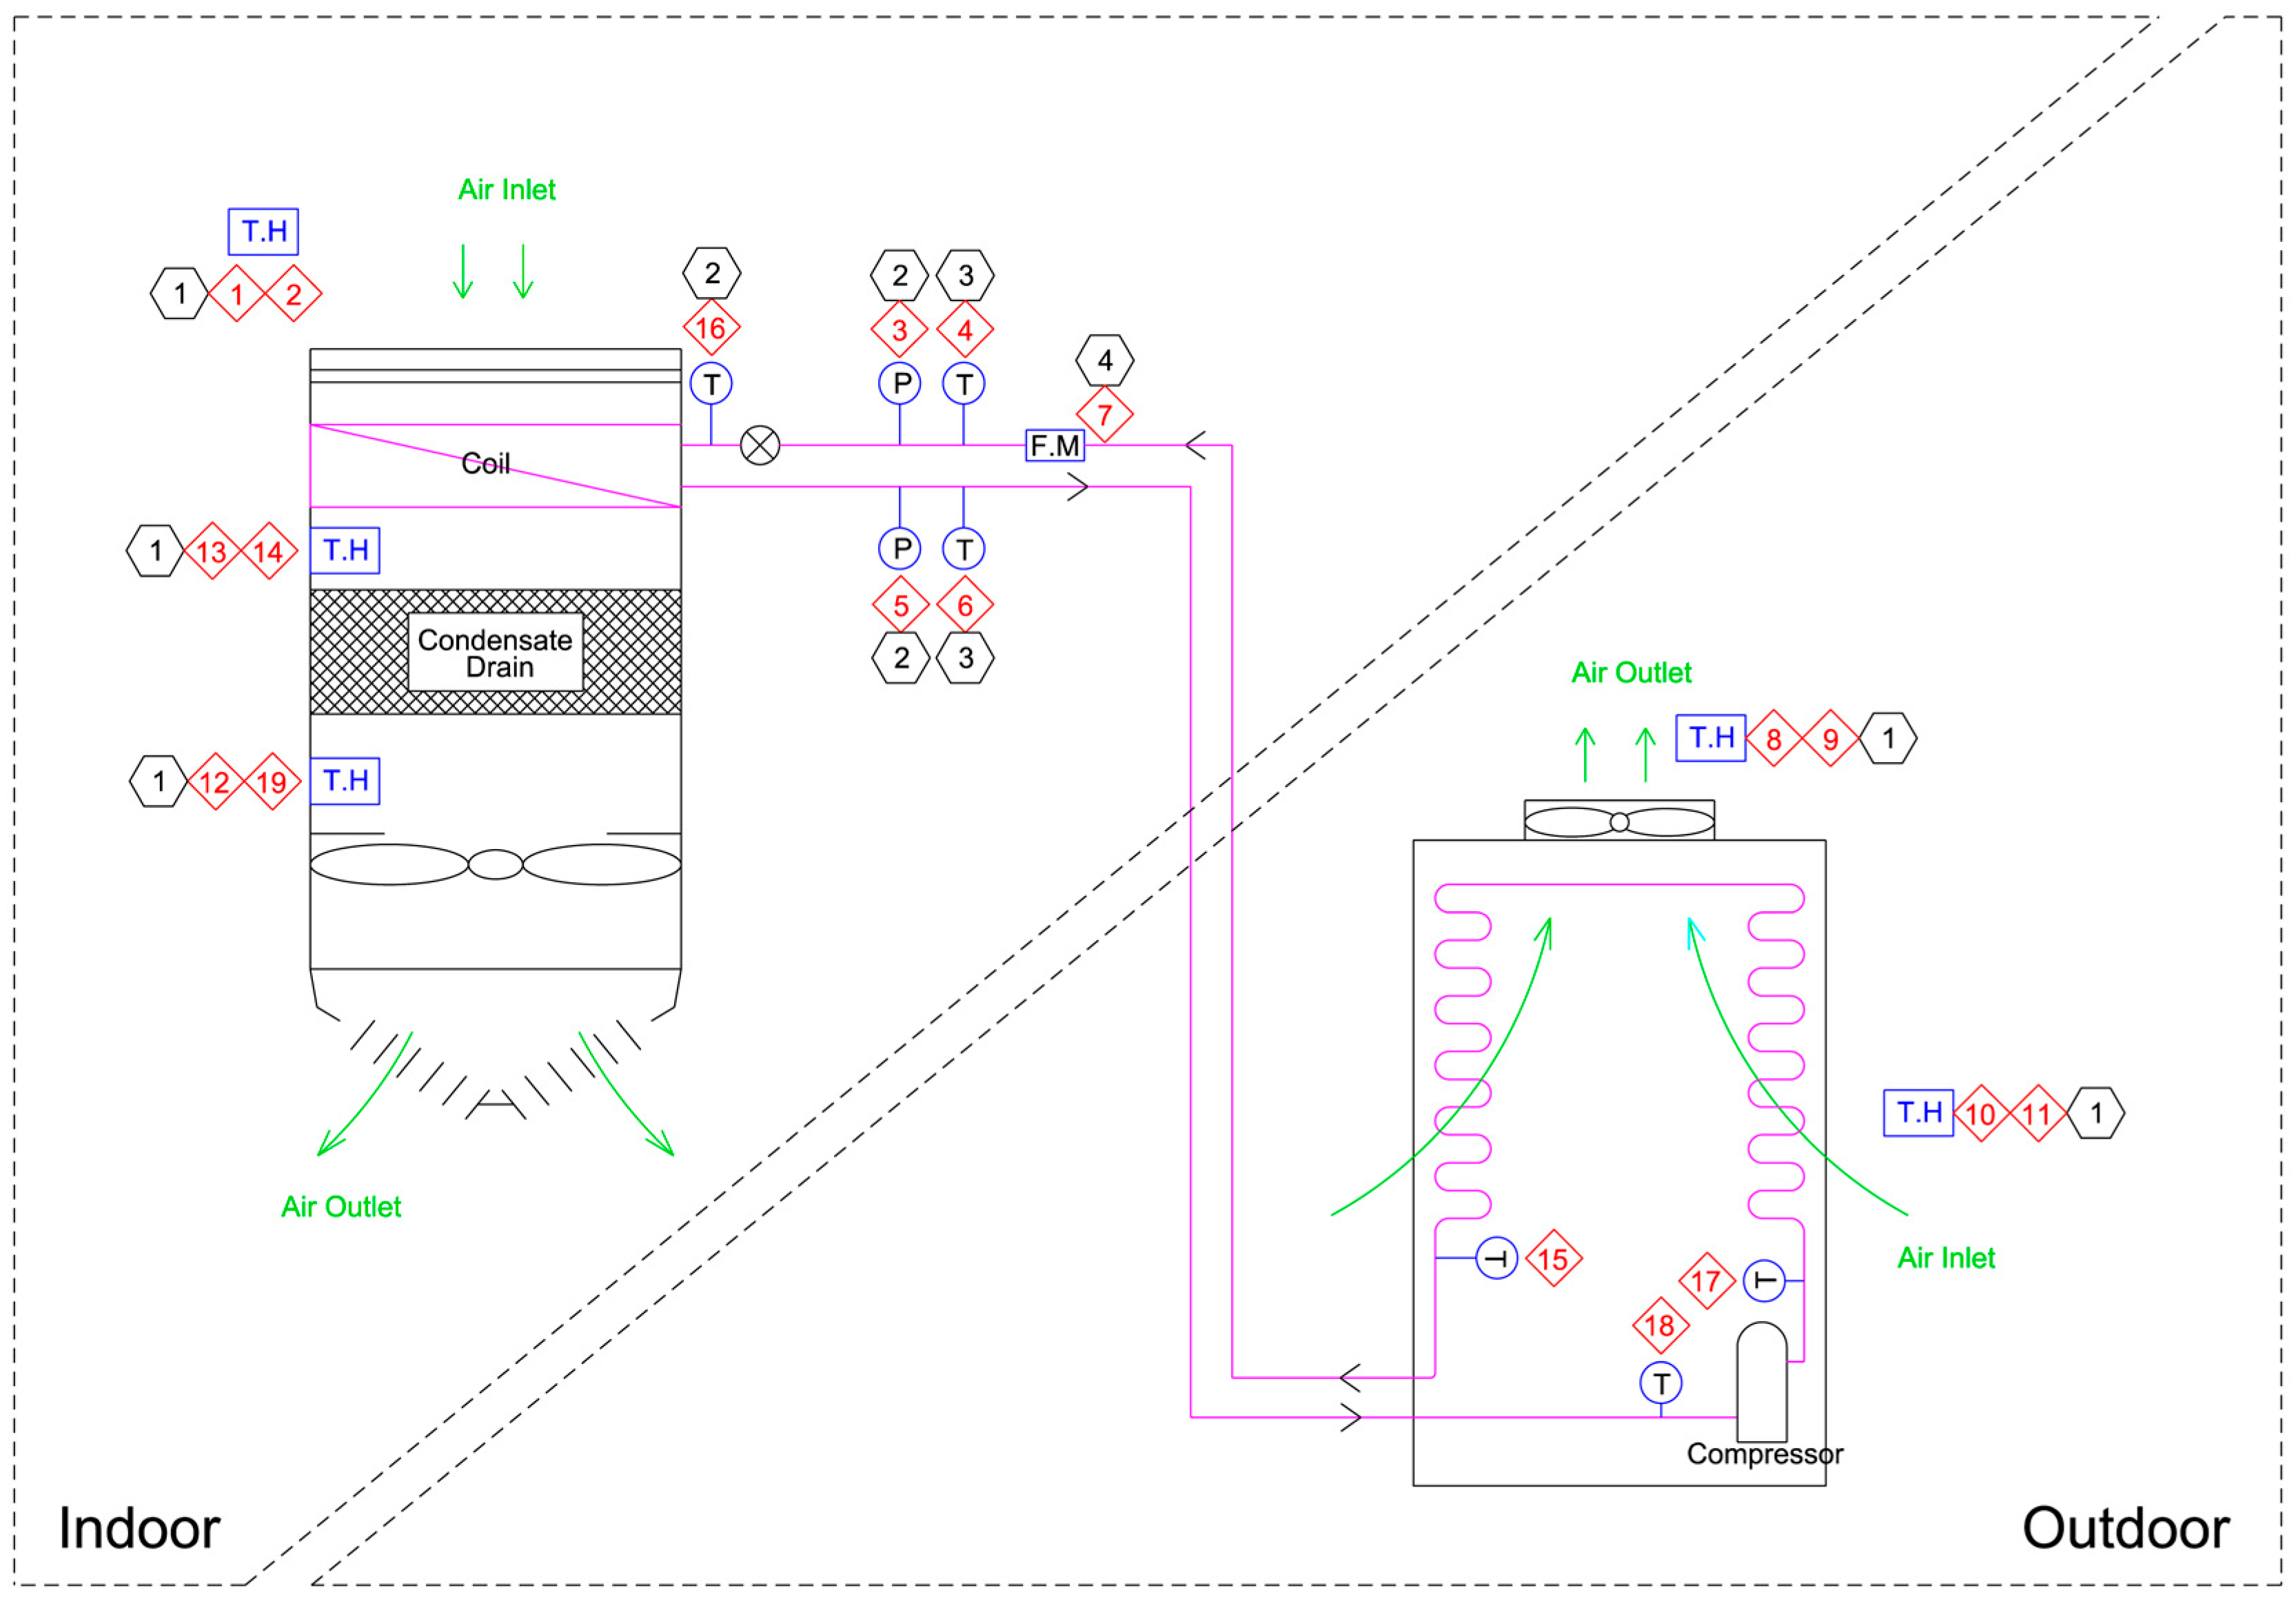
2.2. Experimental Setup and Data Measurement
2.2.1. Experimental Equipment and Test Site
2.2.2. Measuring Instrument and Uncertainty Estimation
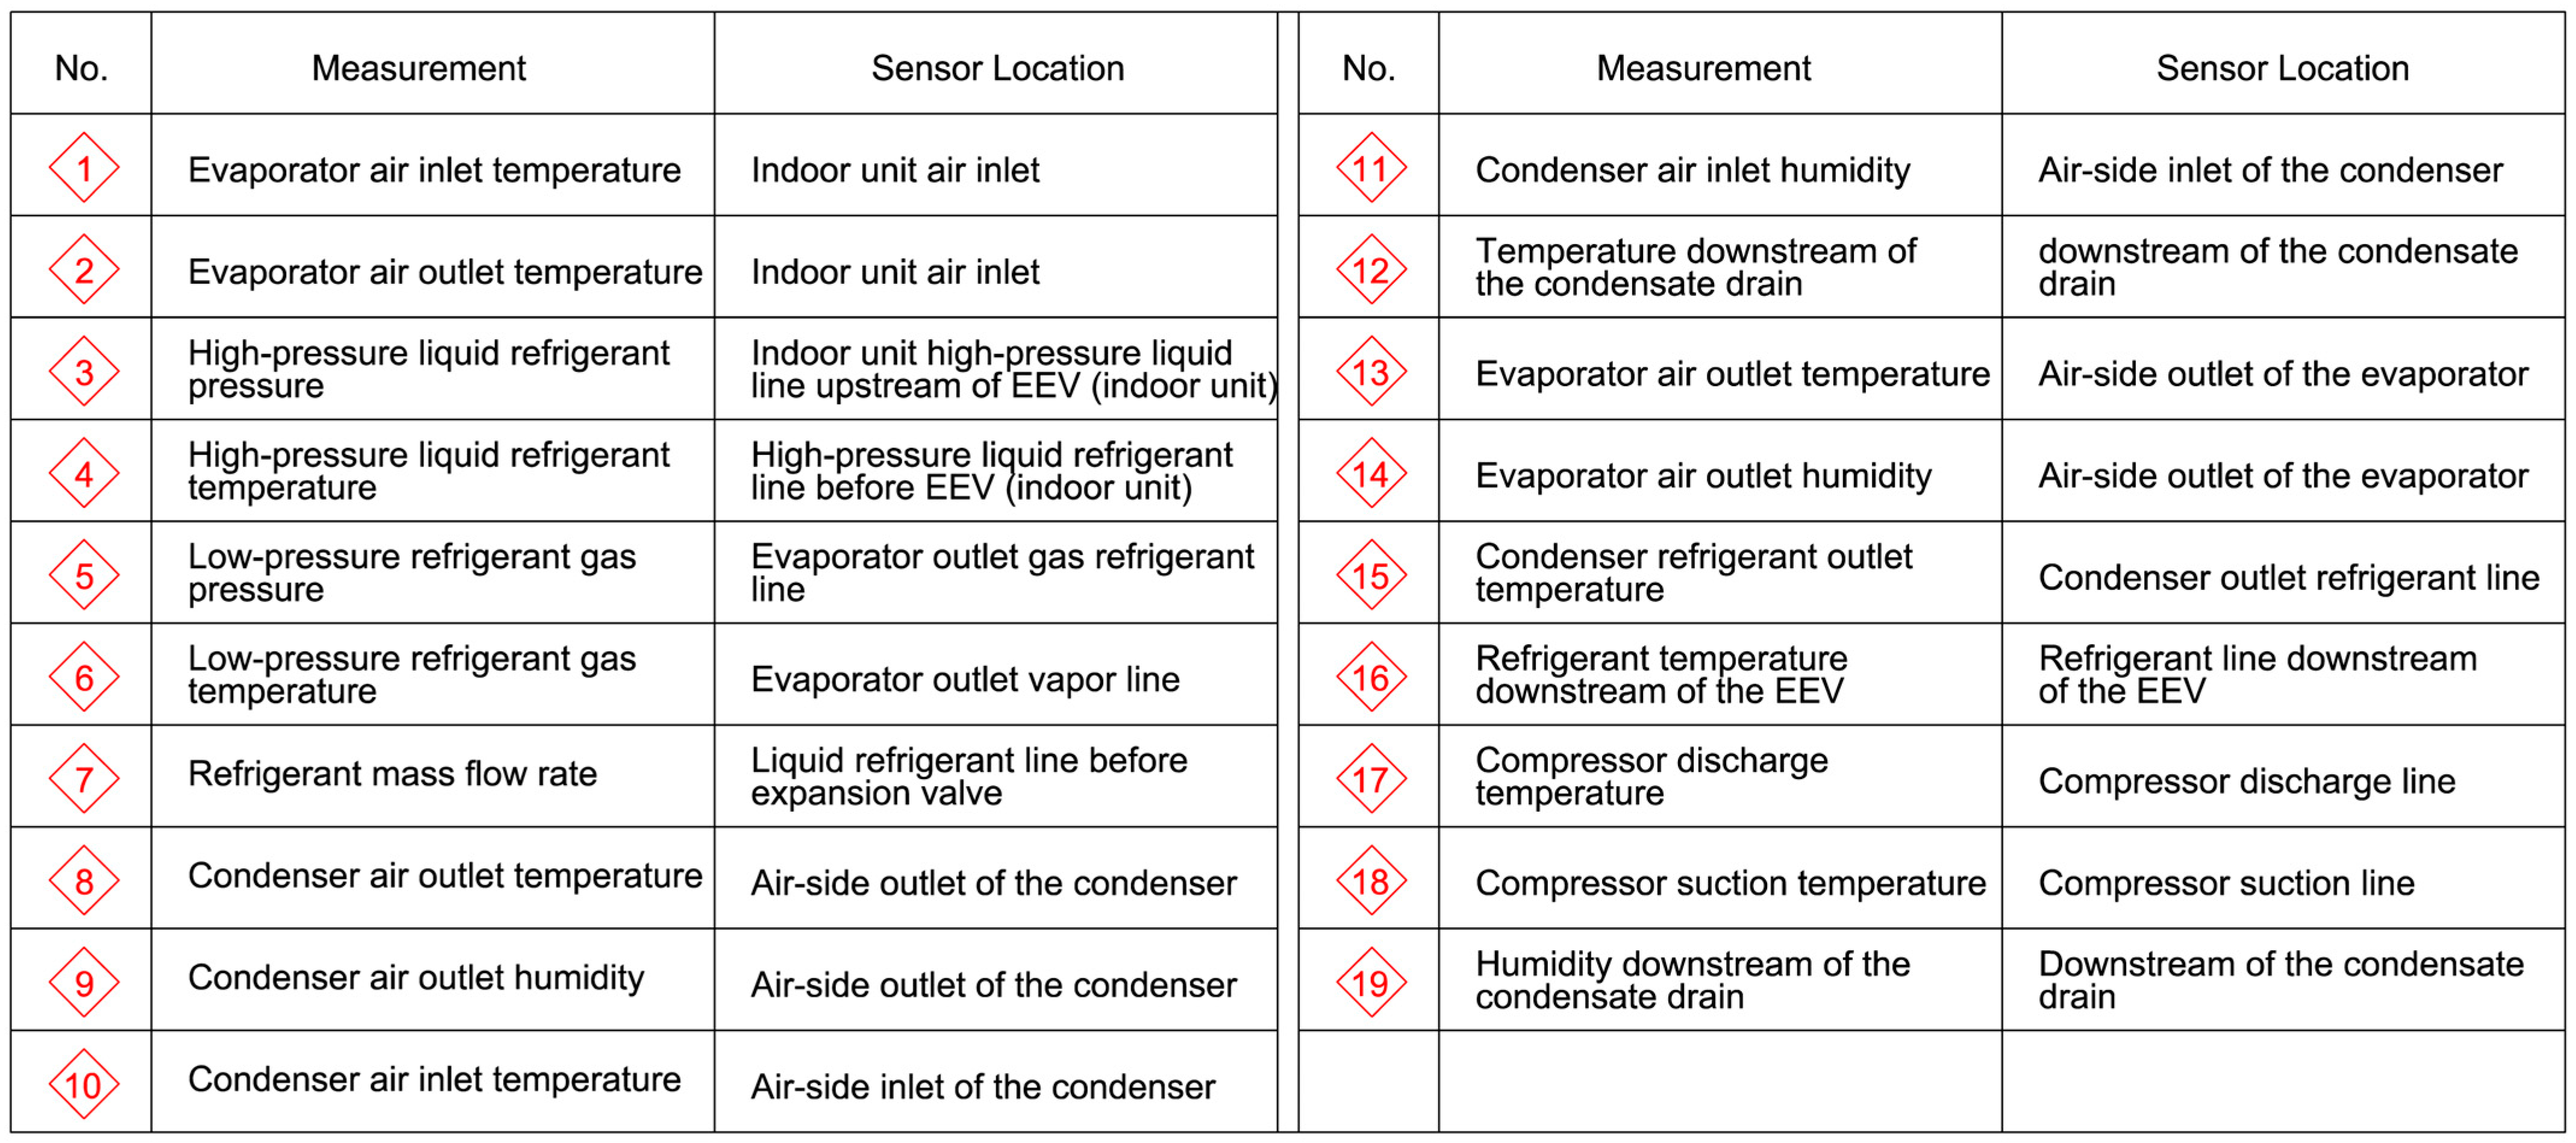
2.2.3. Installation of Measuring Instruments
2.2.4. Data Measurement and Acquisition
2.3. Data Processing and Filtering
2.3.1. Cooling Capacity Calculation
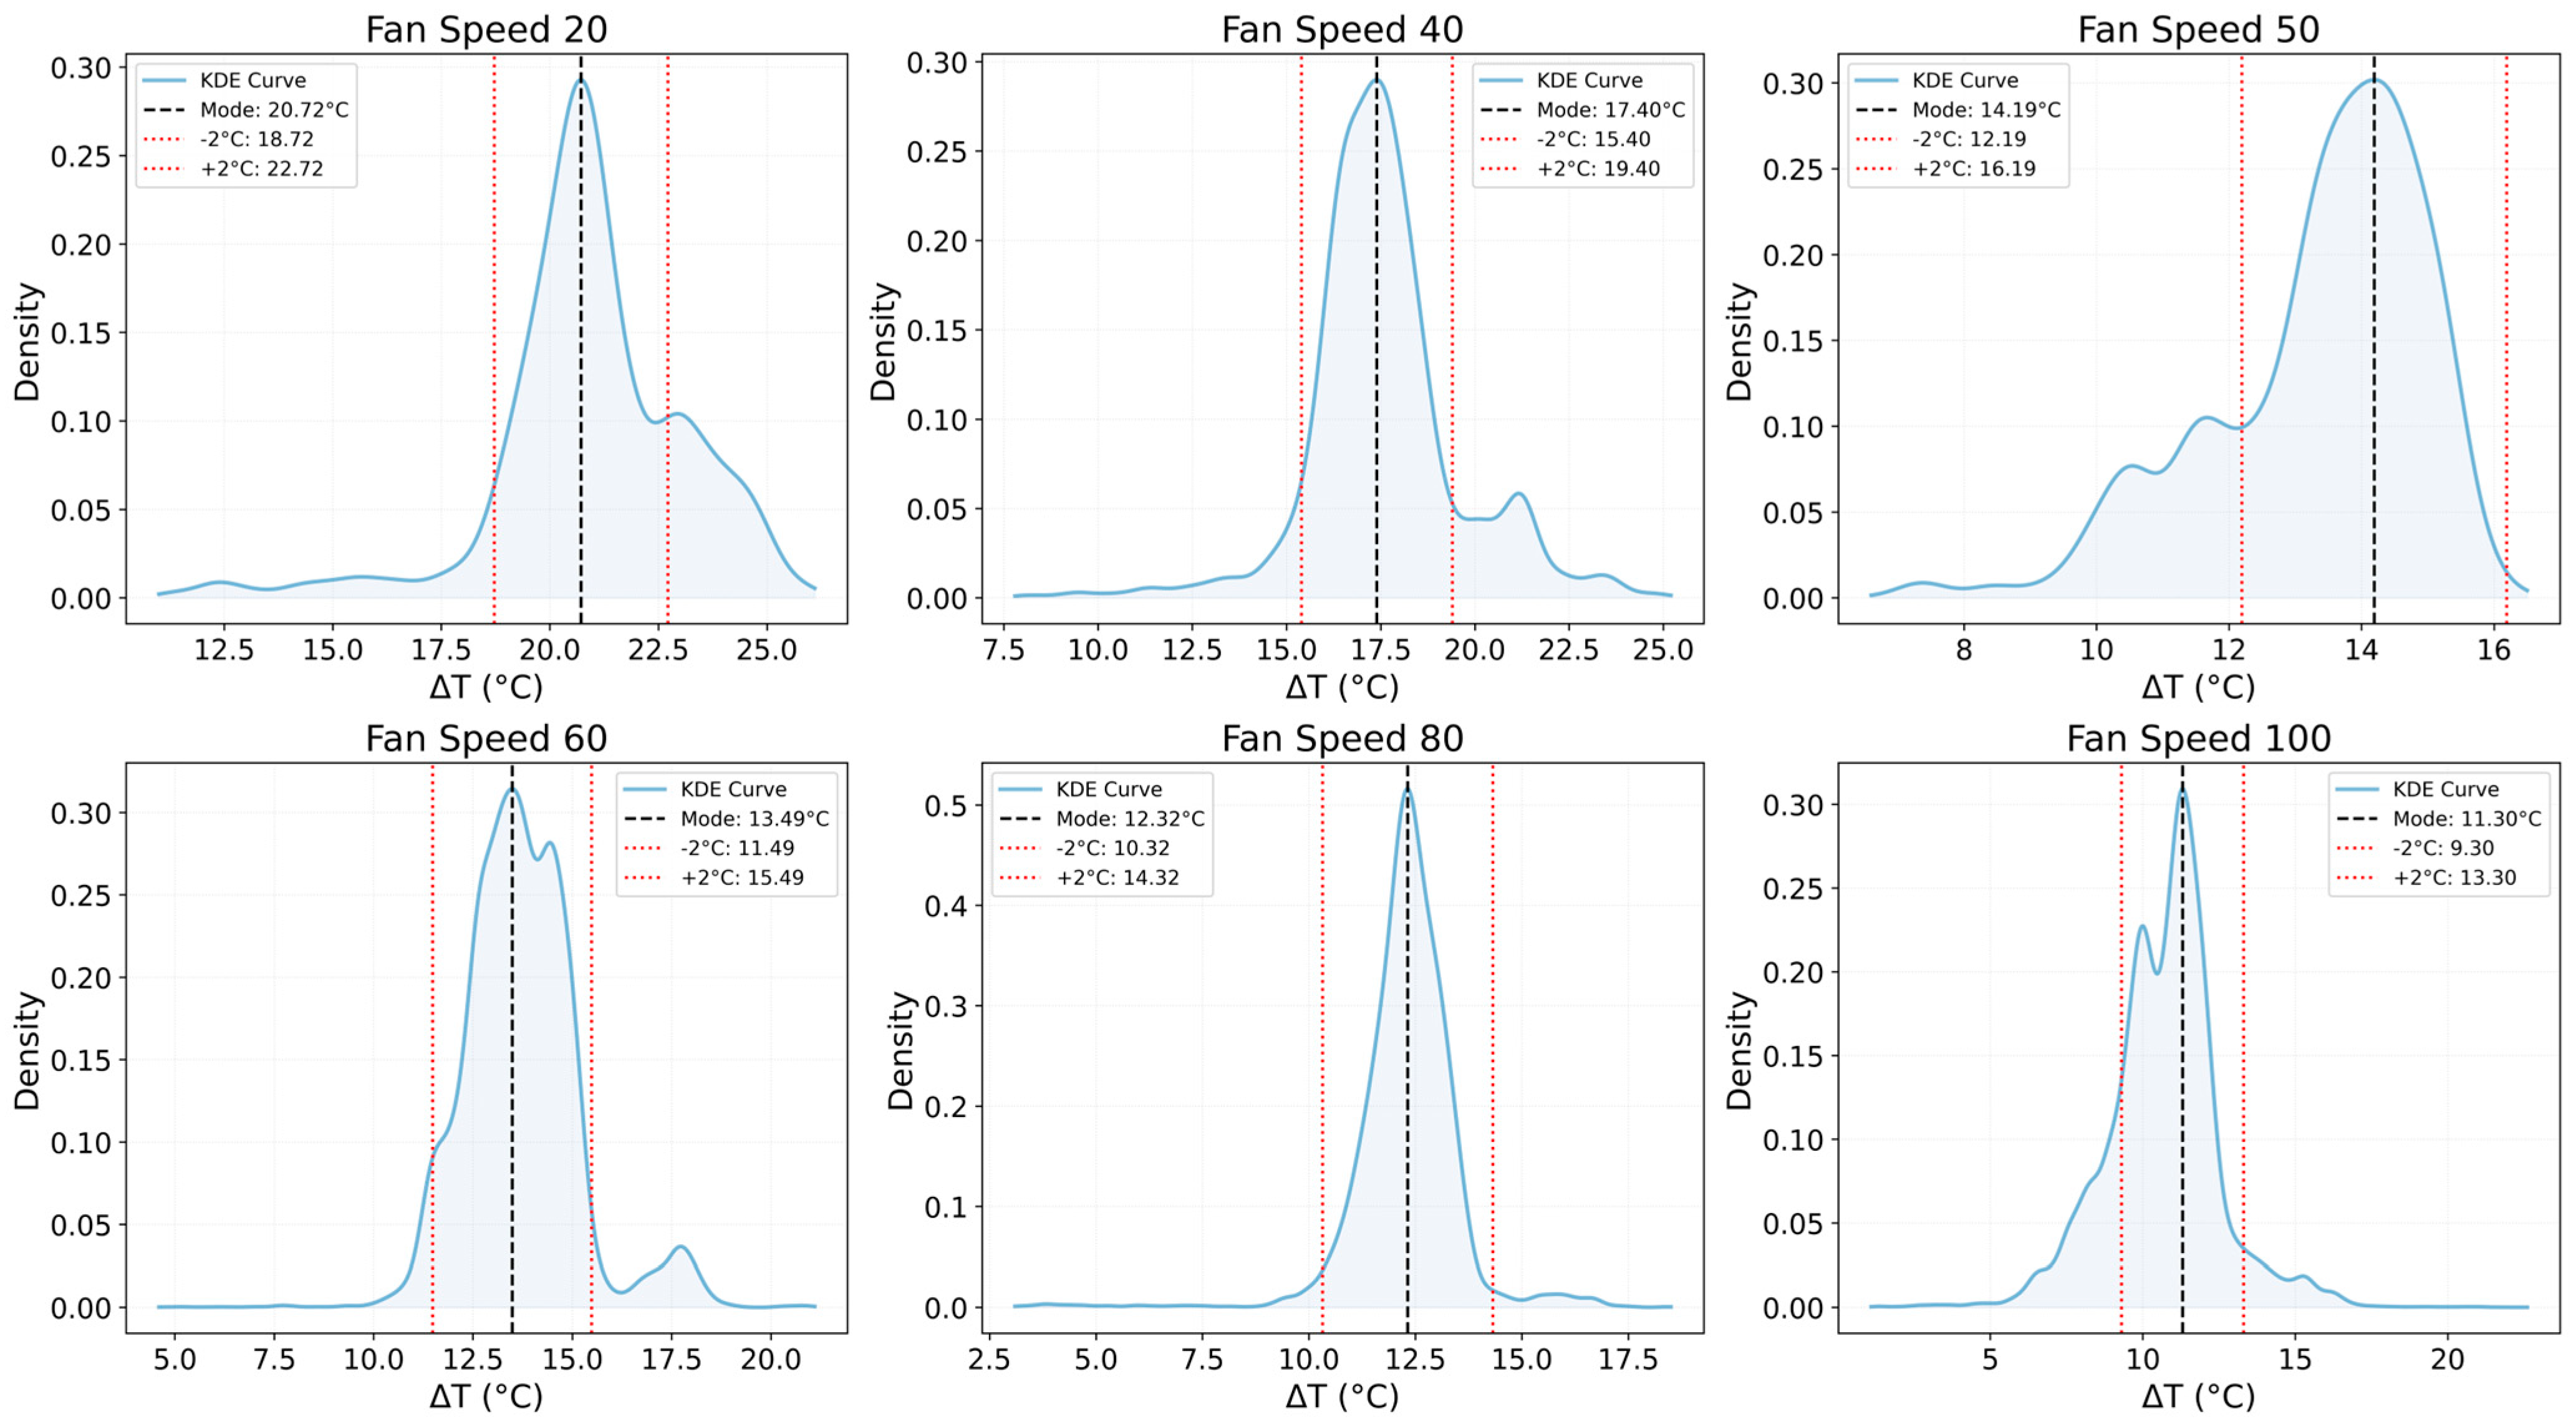
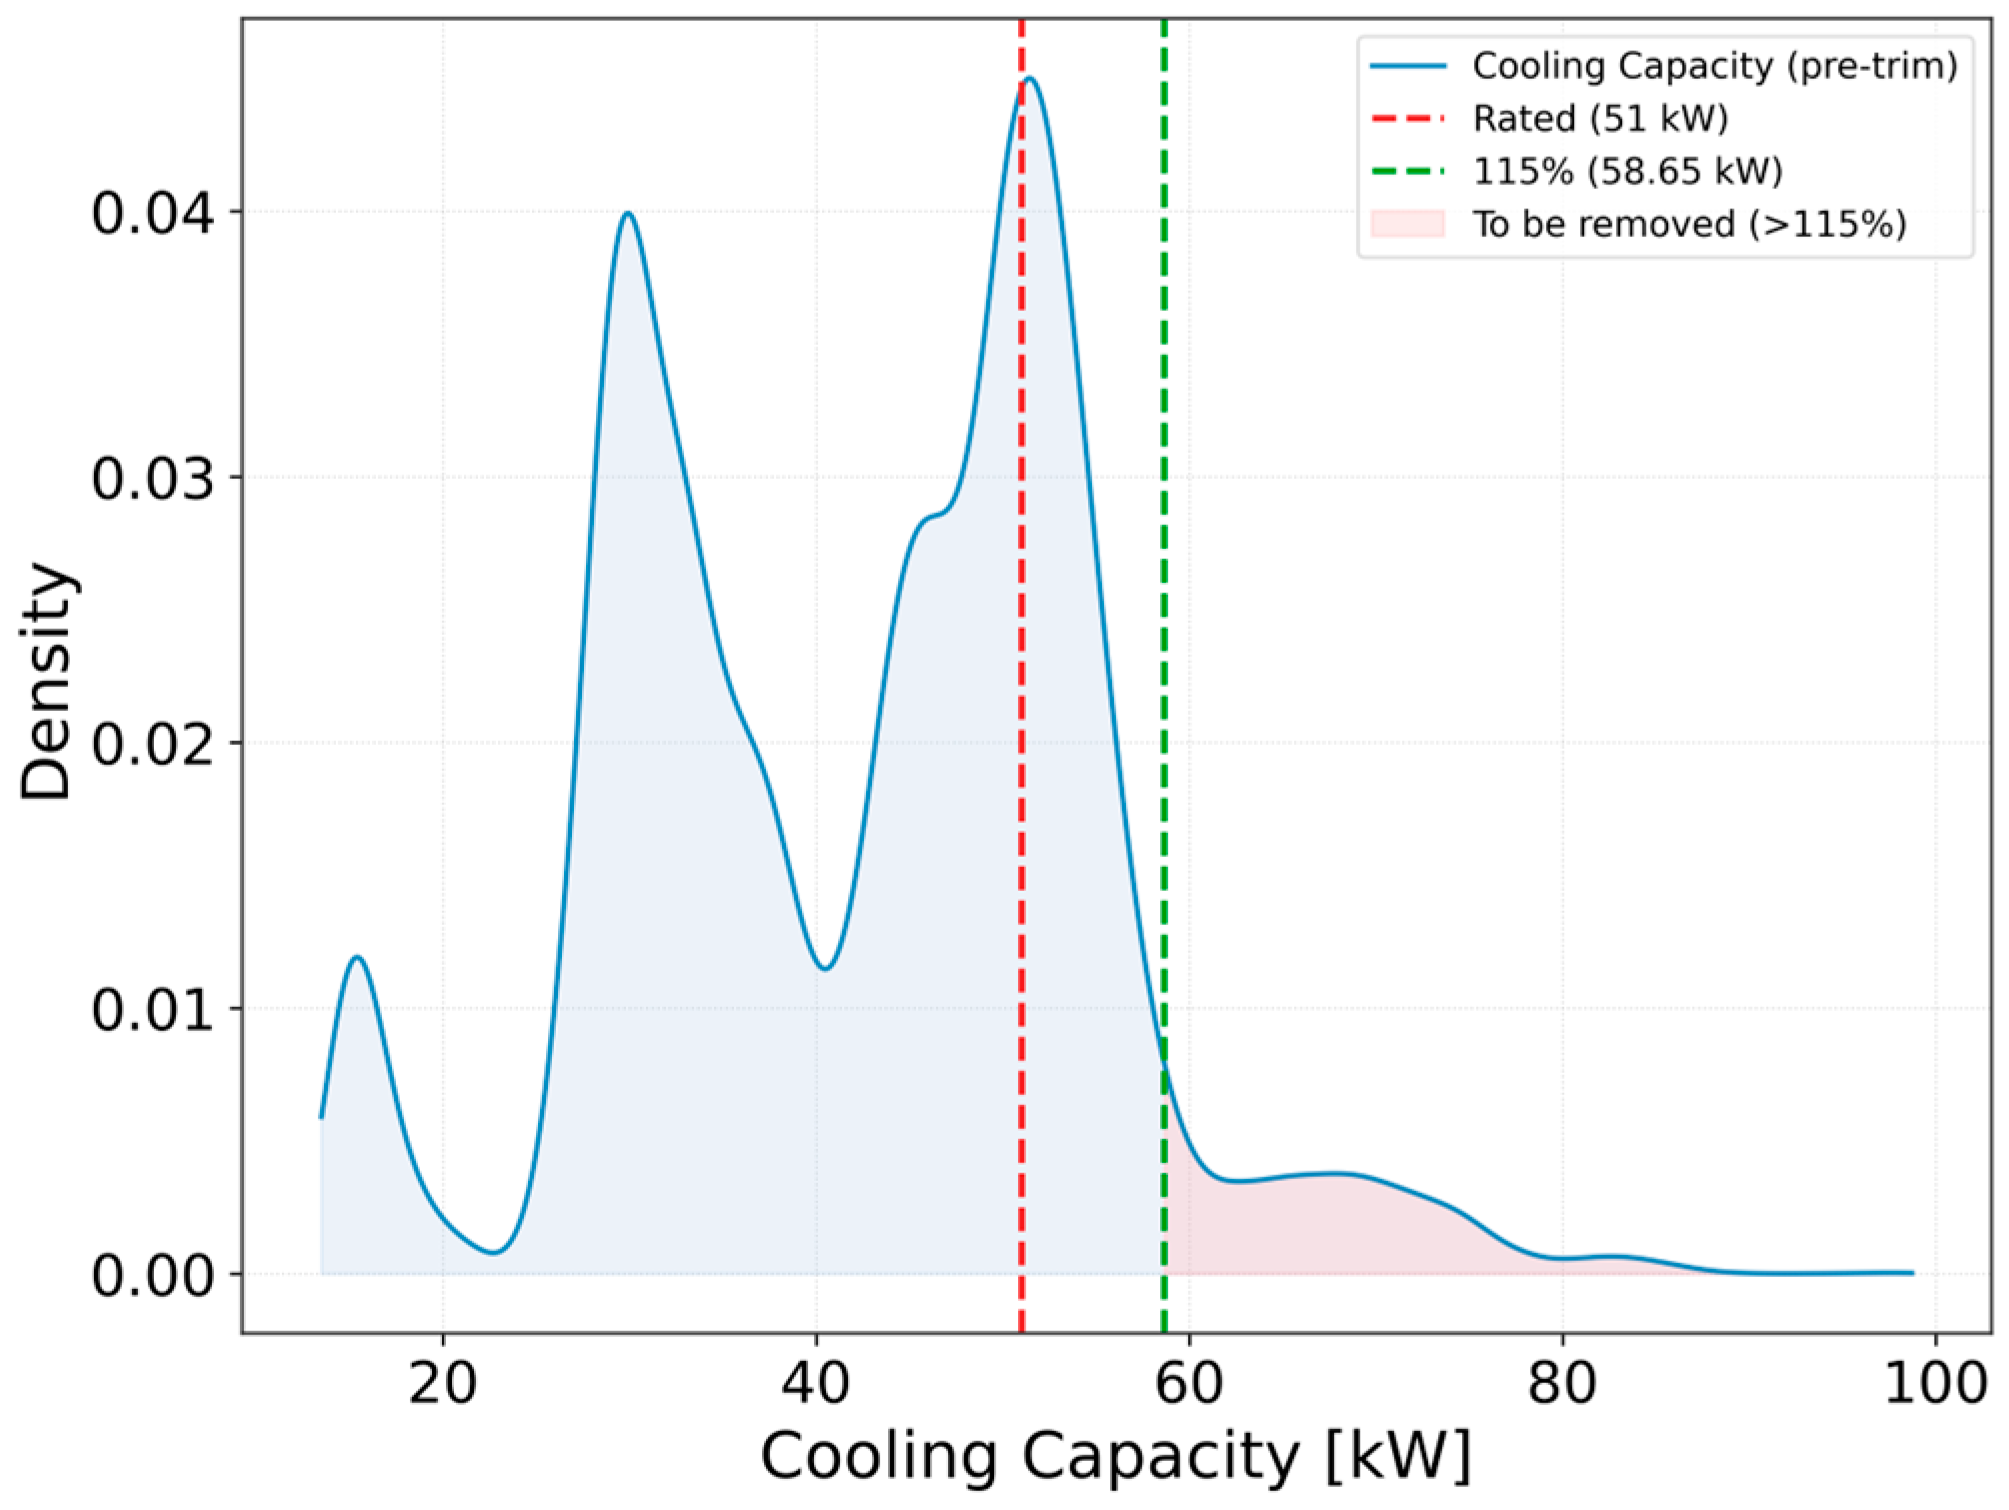
2.3.2. Data Filtering
- 1.
- Step 1. Compressor outlet temperature threshold (≥70 °C)
- 2.
- Step 2. Refrigerant flow validation (expansion valve closure removal)
- 3.
- Step 3. Outdoor air inlet temperature threshold (≤40 °C)
- 4.
- Step 4. Outdoor unit ΔT stability (≥5.5 °C)
- 5.
- Step 5. Indoor unit ΔT stability (±2 °C from KDE mode)
- 6.
- Step 6. Stable cooling capacities (≤115% of rated value)
2.4. Data Splitting for Training and Validation
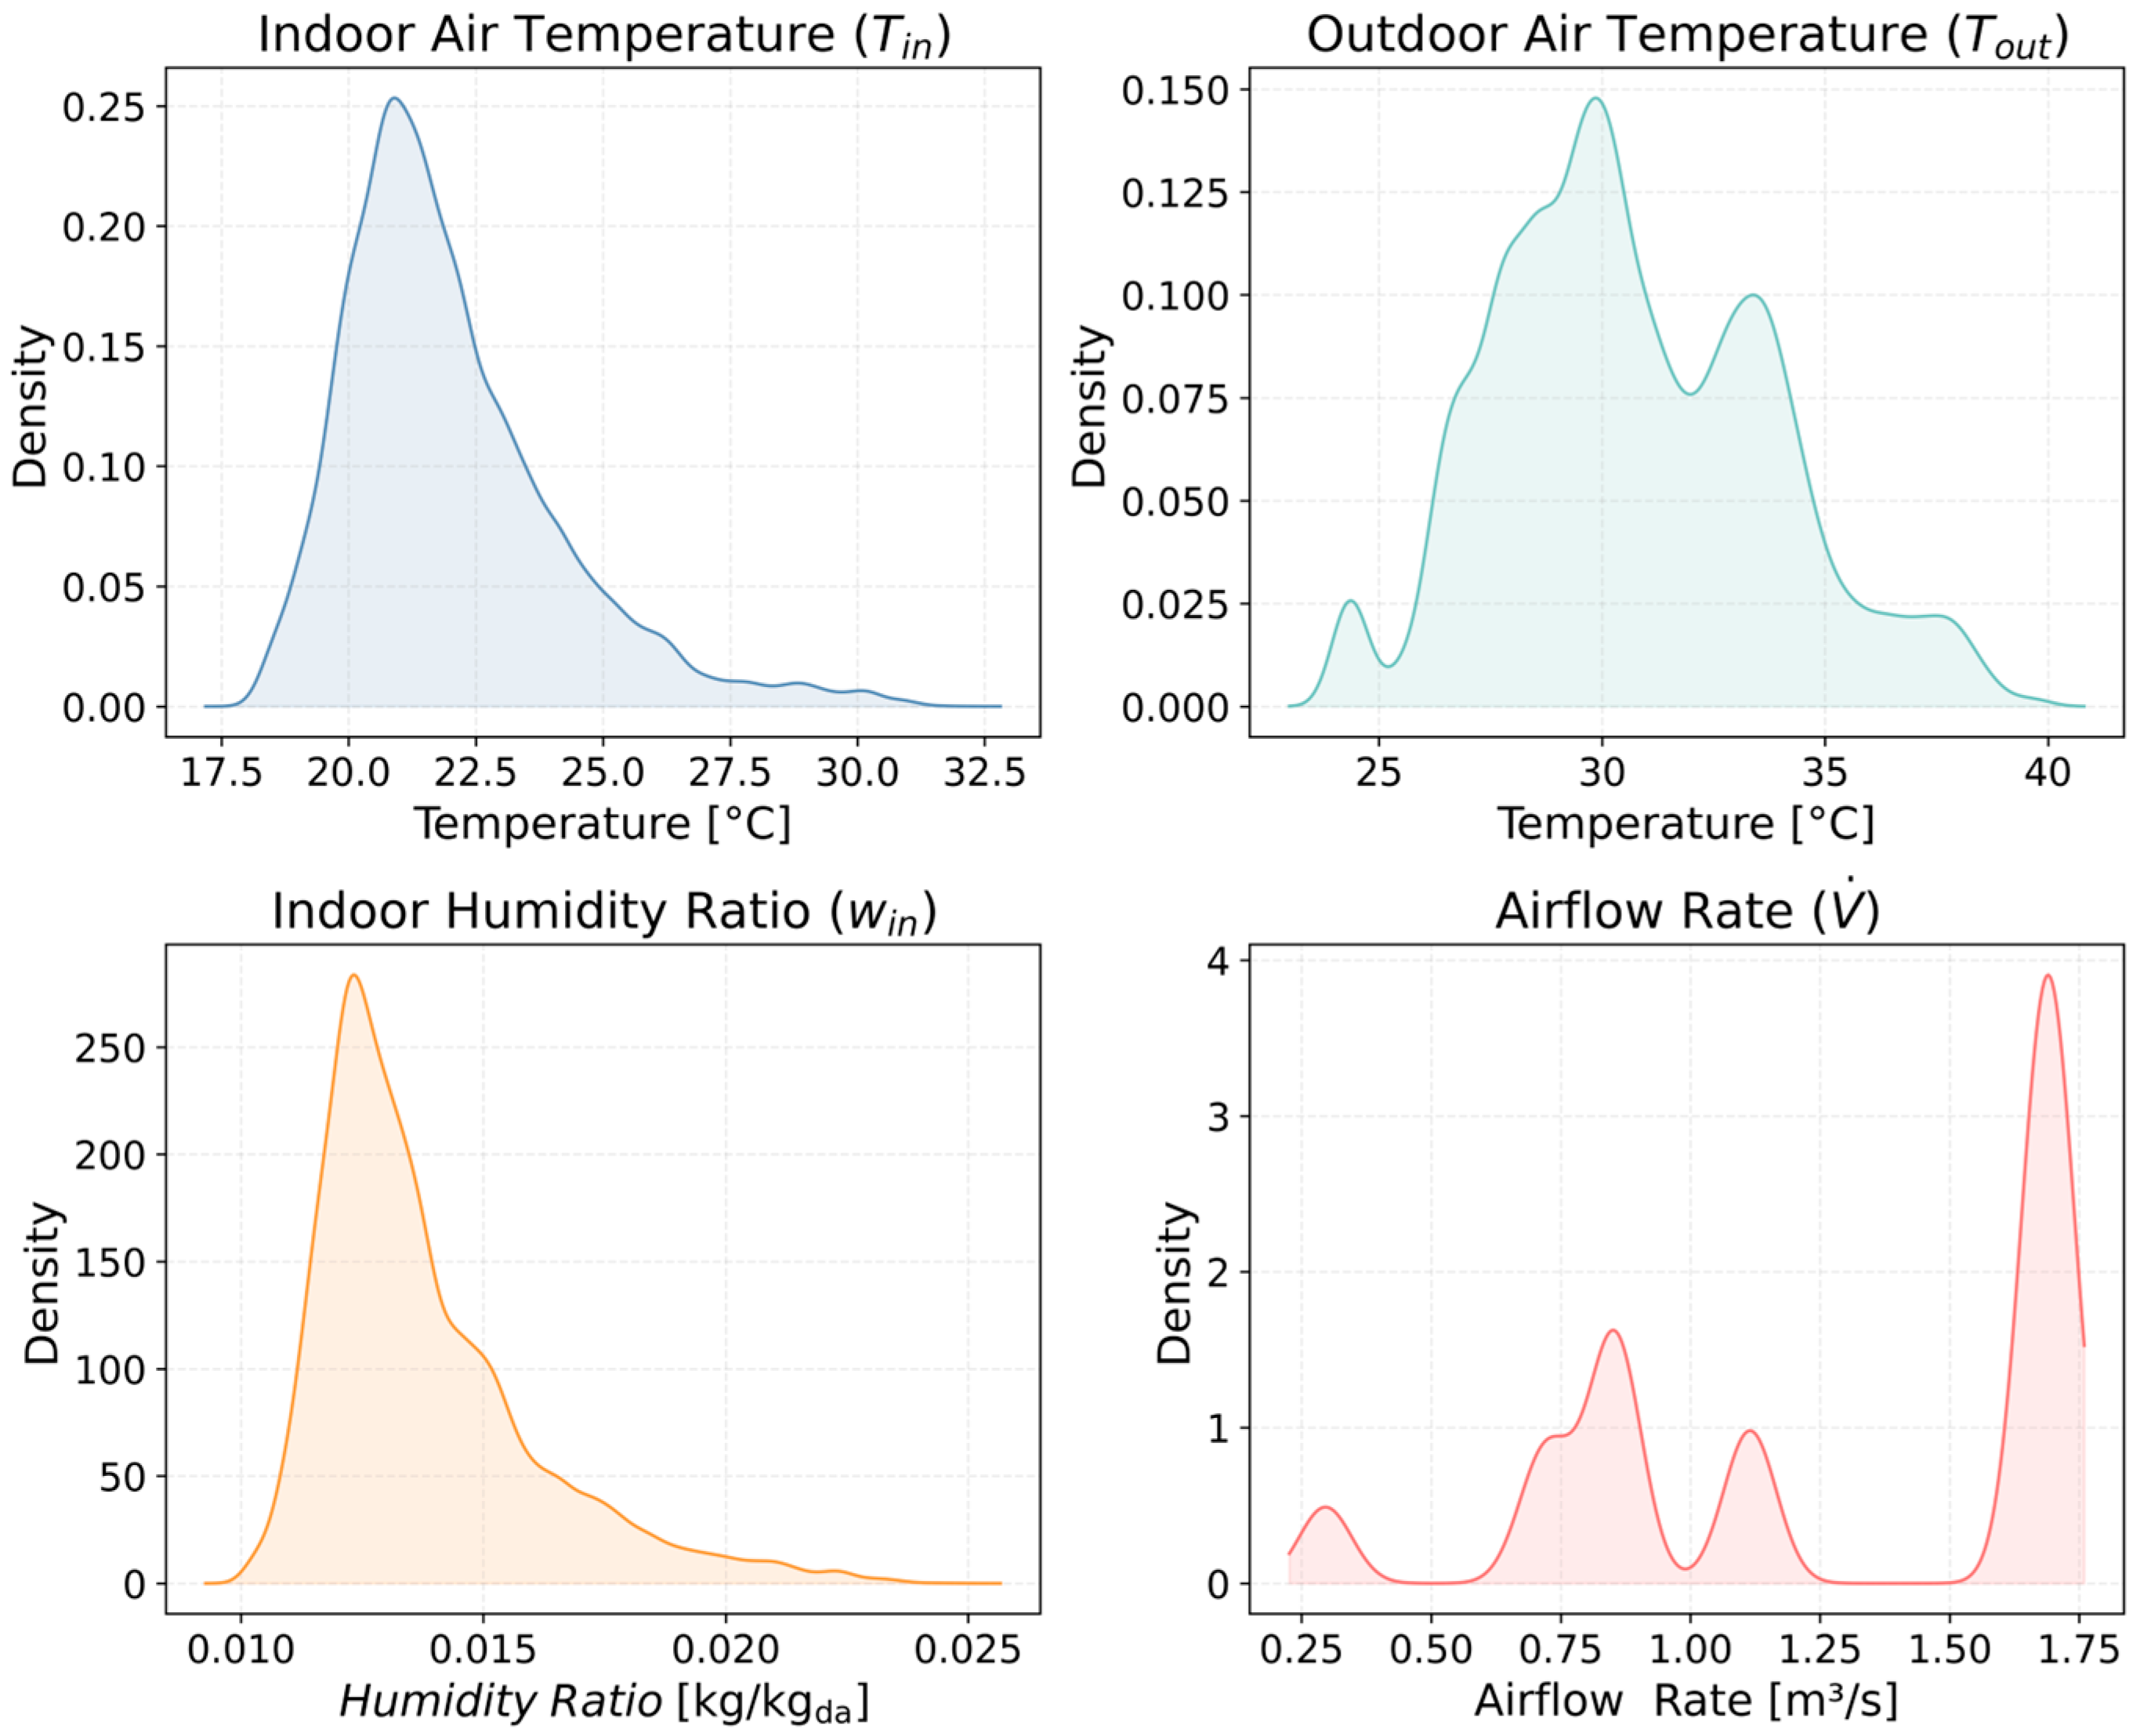
2.5. Selection of Variables
2.5.1. Selection and Rationale of Variables
2.5.2. Key Independent Variables
- 1.
- Indoor temperature (Tin, °C)
- 2.
- Outdoor temperature (Tout, °C)
- 3.
- Indoor humidity ratio (win, kg/kgda)
- 4.
- Airflow rate (, m3/s)
2.5.3. Variable Combinations
2.6. Regression Analysis and Validation Method
2.6.1. Regression Models Considered
2.6.2. Evaluation Metrics
2.6.3. Validation of Regression Models
3. Results
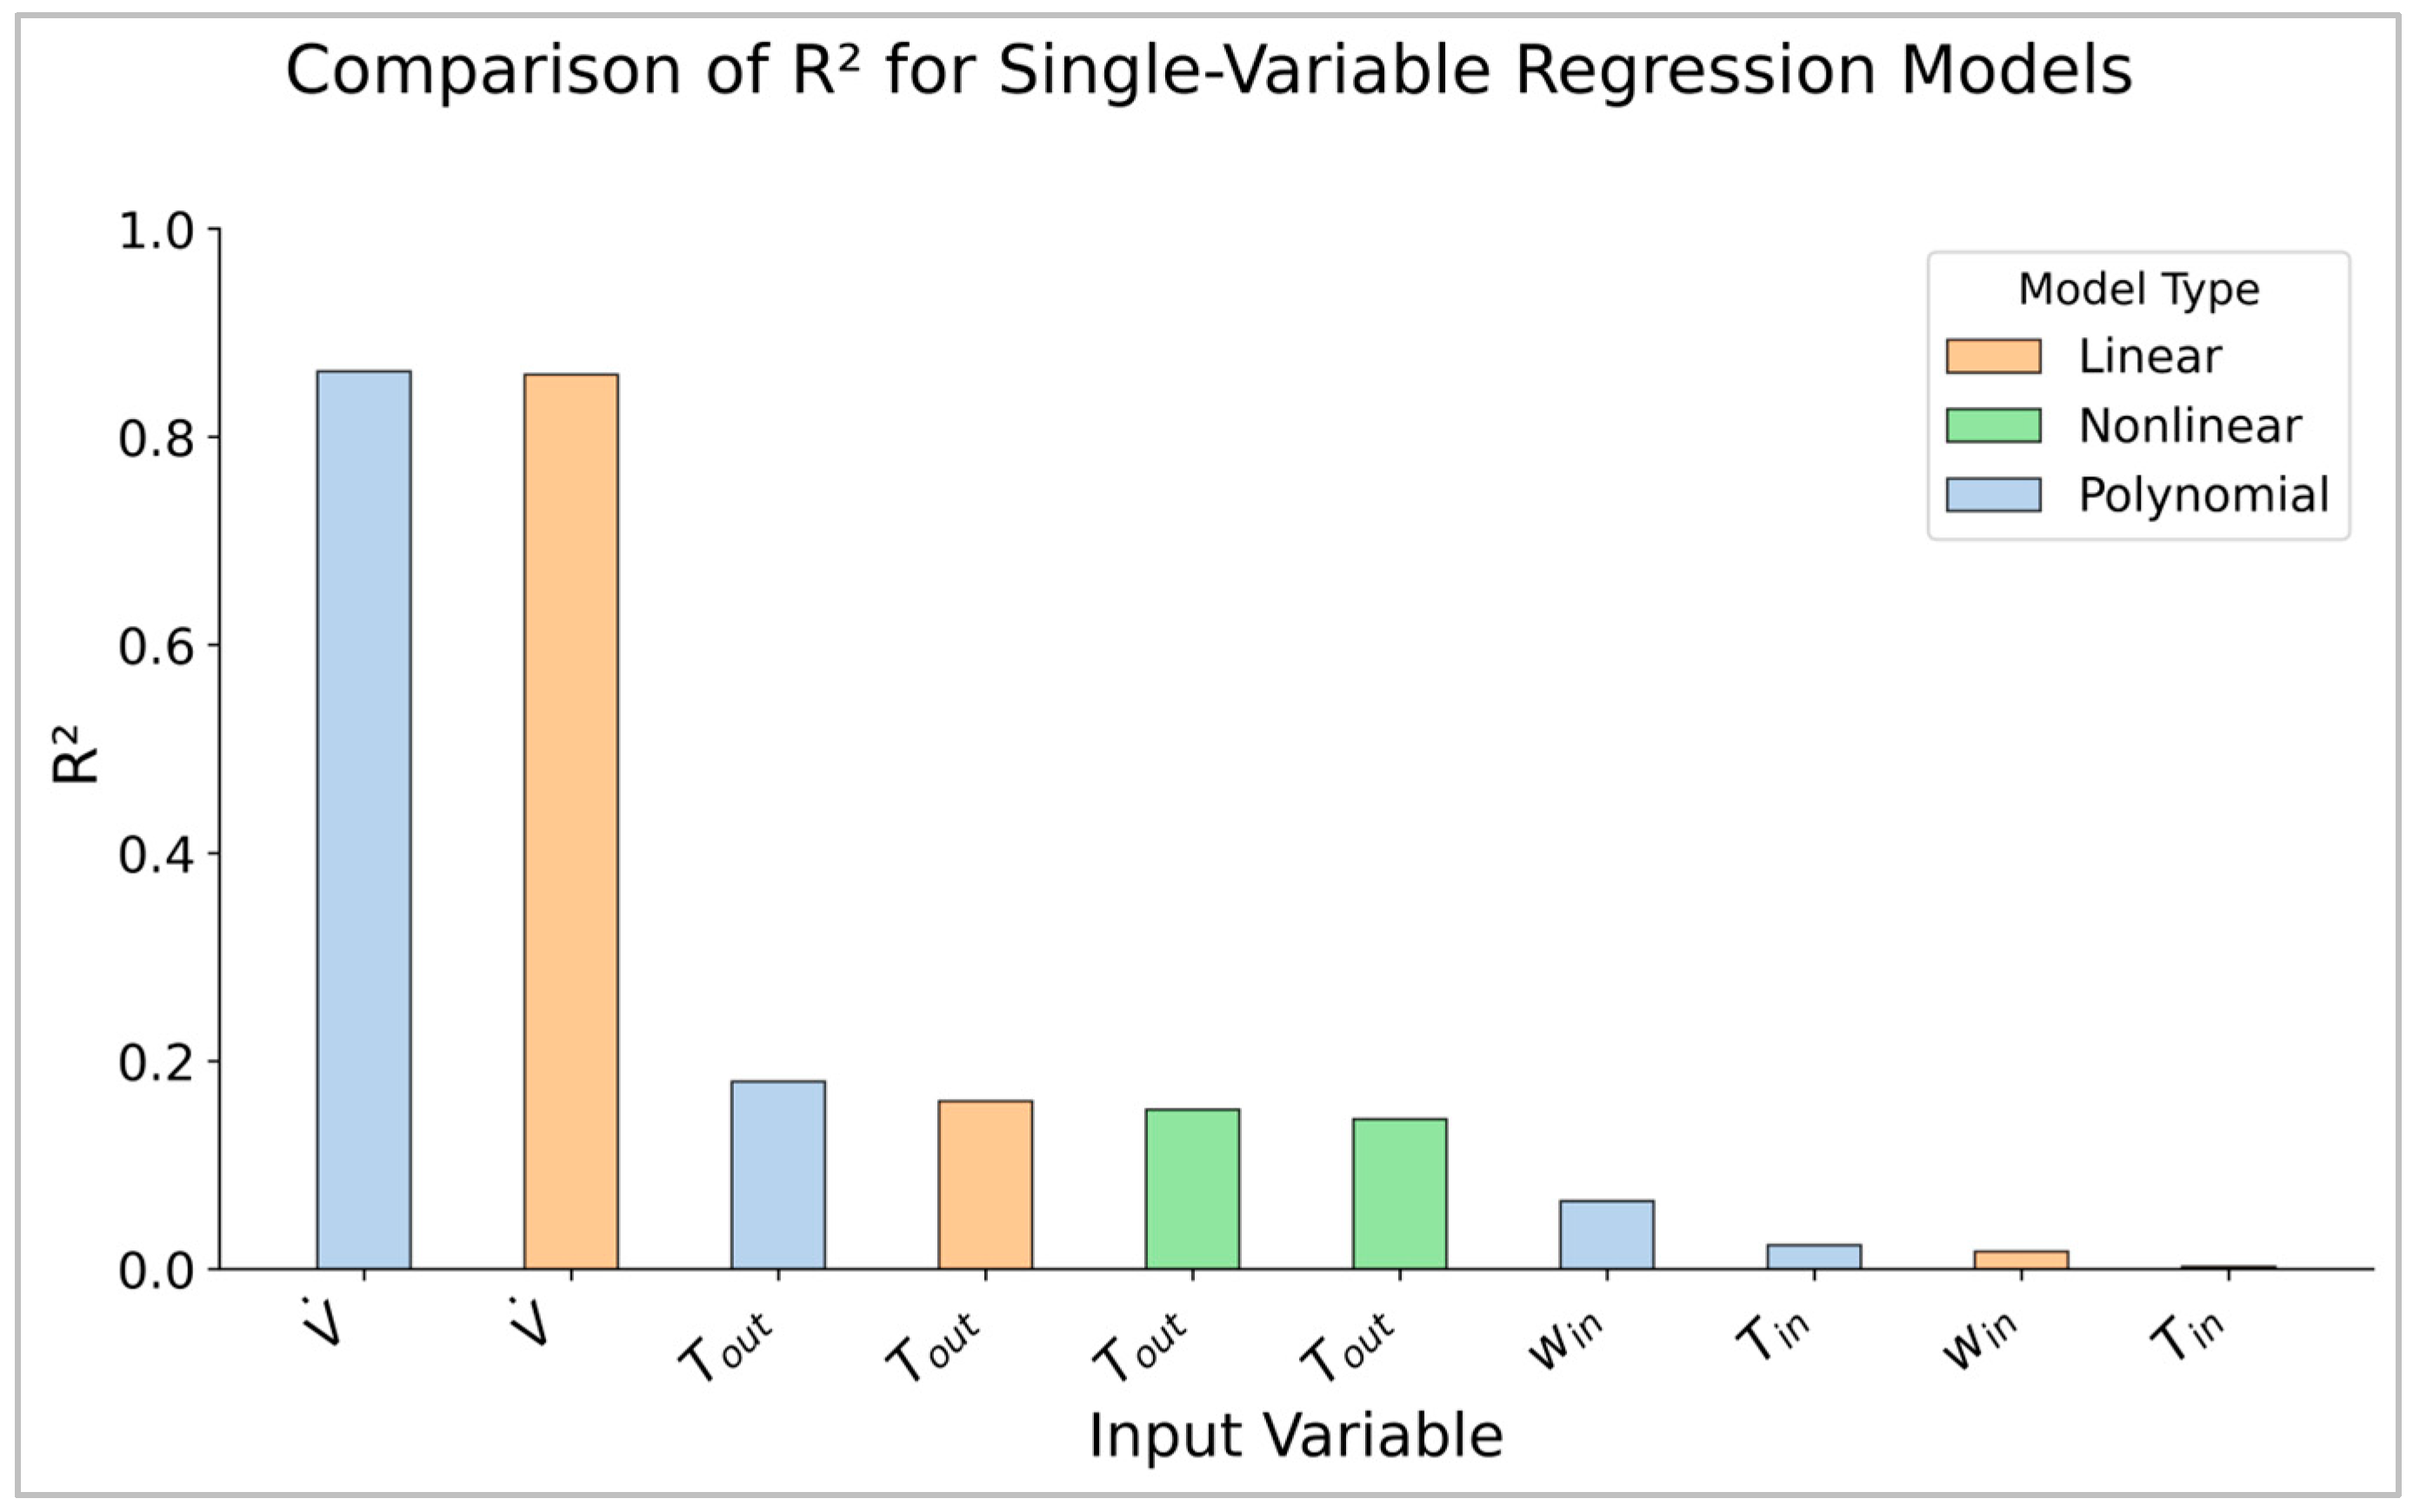
3.1. Influence of Individual Variables
- (1)
- The air-side mass-flow term governs capacity most strongly in our dataset, so is the principal control-oriented predictor. This aligns with the enthalpy-difference formulation and the observed near-linearity of –c relations.
- (2)
- The outdoor-temperature effect exists physically (capacity tends to decline with higher Tout), but on-board compensation flattens the univariate trend; hence Tout contributes more as a moderating/interaction variable than as a lone predictor.
- (3)
- Although the univariate R2 of Tin is small, it remains operationally critical: it reflects the current indoor state and serves as the primary control target/setpoint for capacity delivery. Thus, Tin must be retained in minimal practical models and in any control discussion, even if its isolated statistical contribution appears small in a univariate screen.
- (4)
- win can be treated as supplementary: it helps interpret latent-load conditions and tail behaviors, but is not essential for a compact, control-ready baseline.
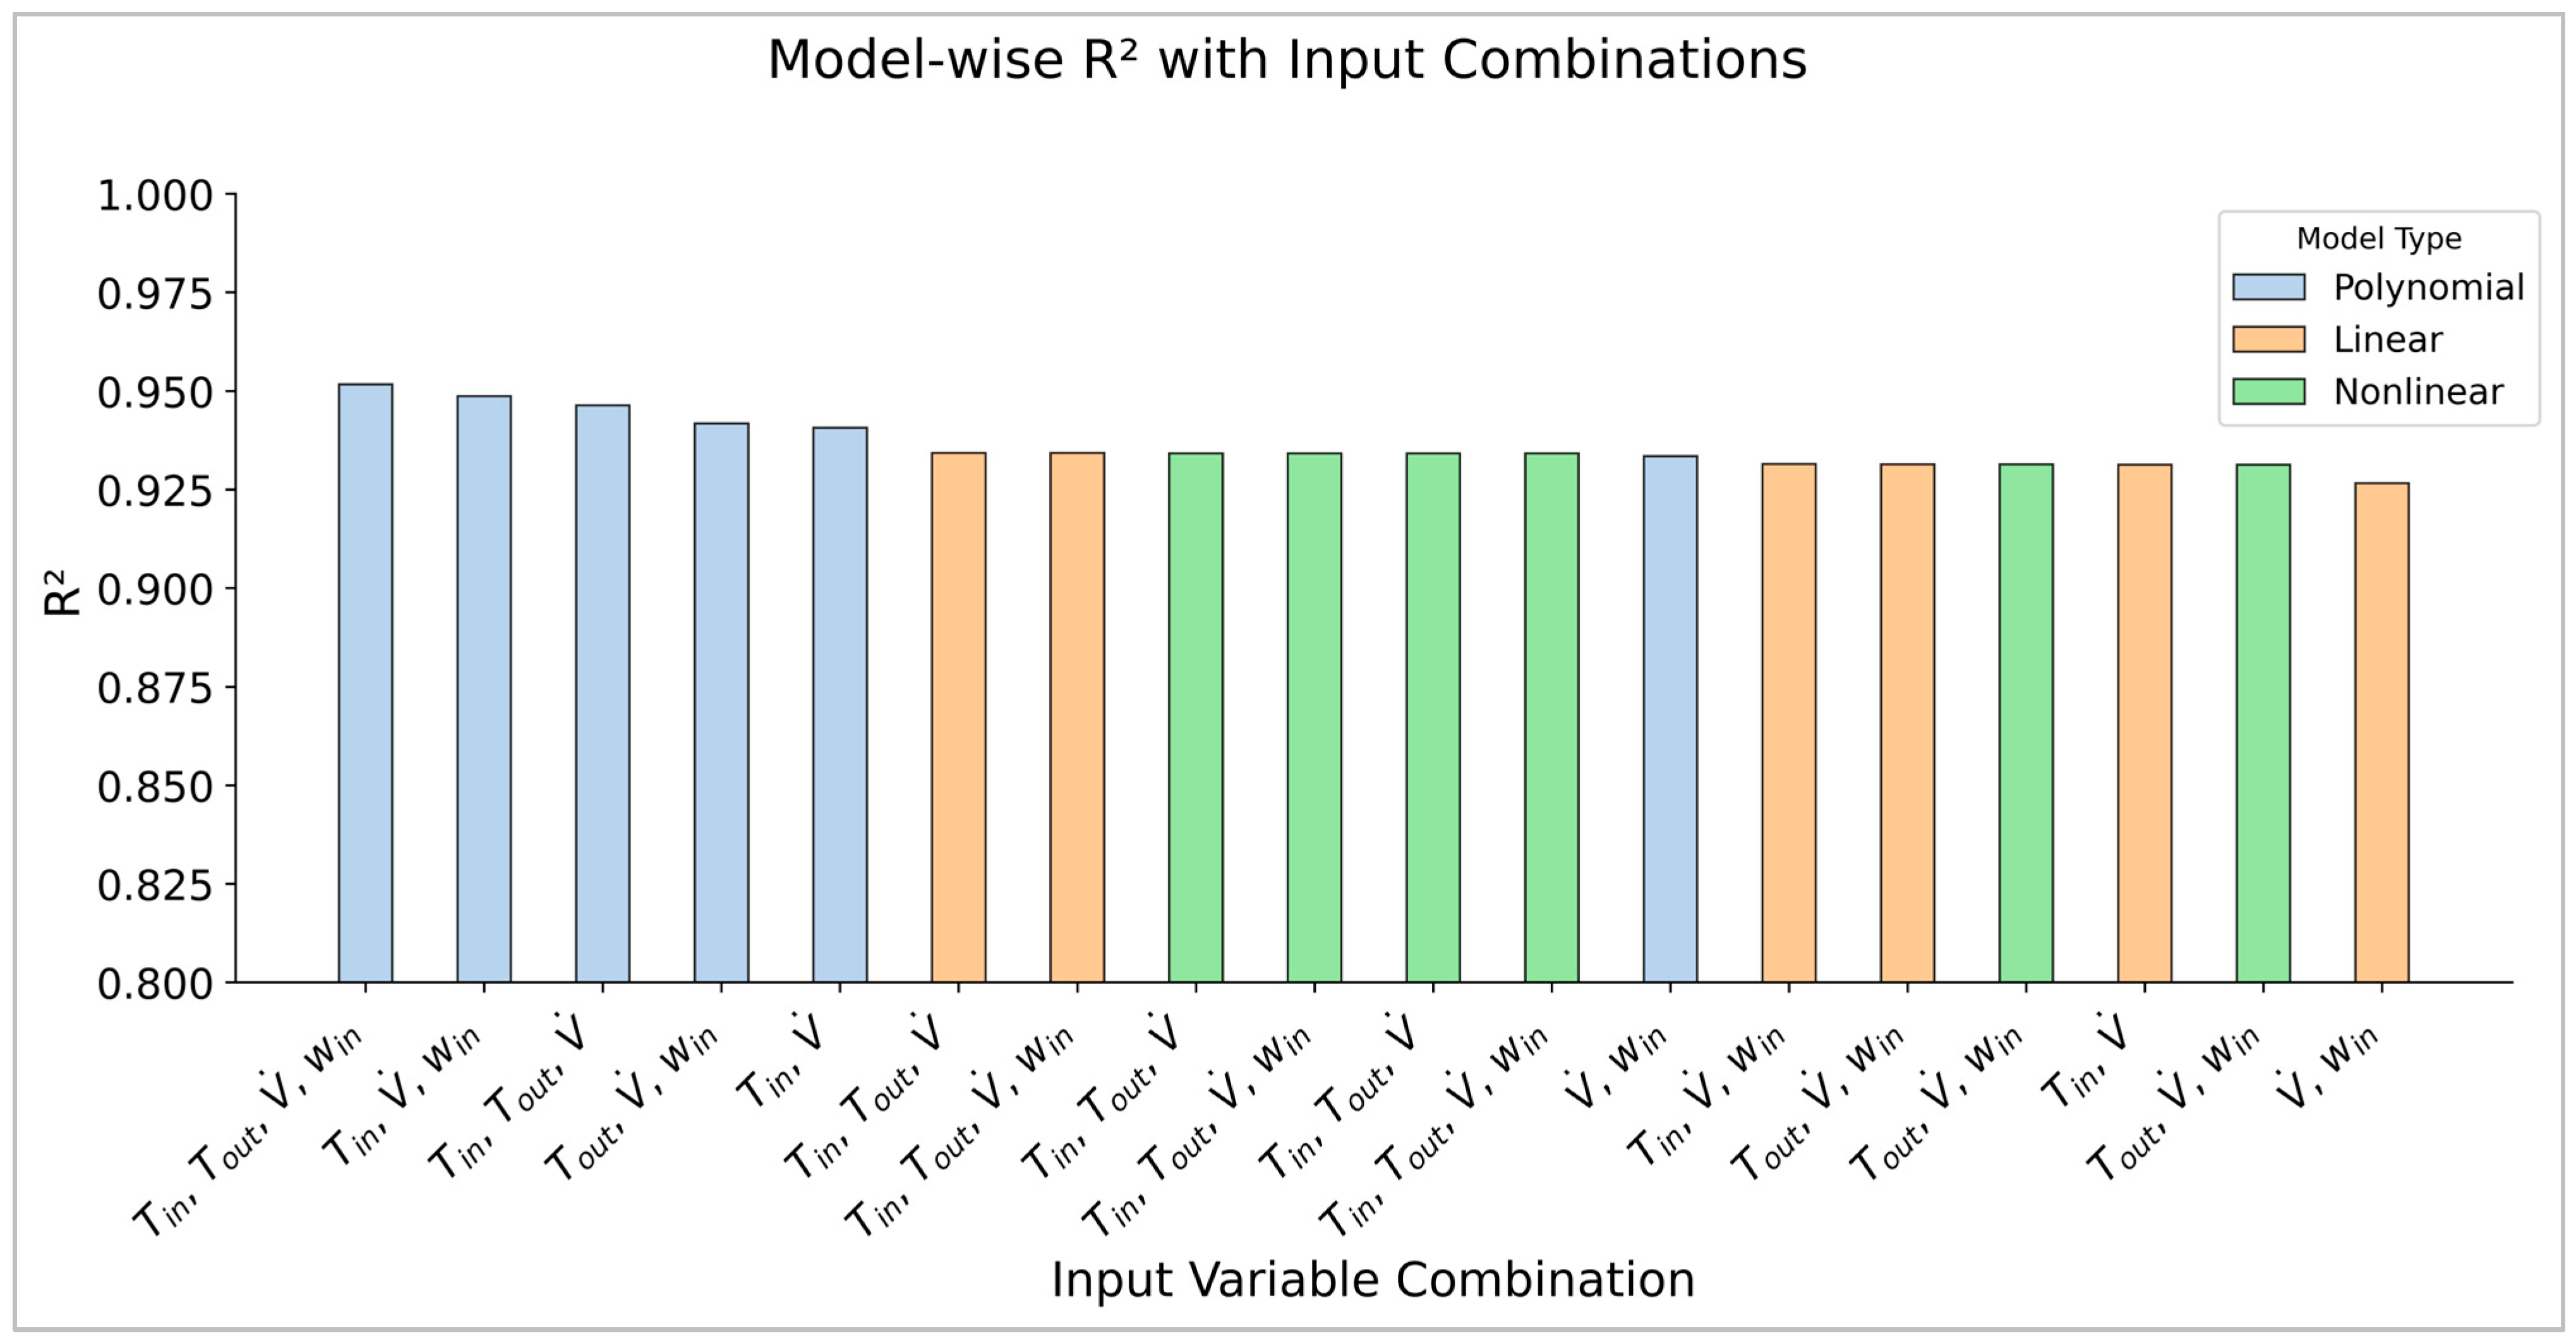
3.2. Review of Models with High Prediction Accuracy (R2 > 0.90)
3.3. Physical Interpretation of the Coefficient
3.4. Validation of the Prediction Model
3.5. Analysis of the Coefficient of Performance (COP)
4. Discussion
4.1. Physical Interpretation and Model Behavior
4.2. Comparison with AI-Based Models
4.3. Limitations
4.4. Practical and Methodological Implications
5. Conclusions
- A three-variable linear model consisting of indoor temperature (Tin), outdoor temperature (Tout), and airflow rate () achieved R2 ≈ 0.93 on field data; on the independent validation set, R2 = 0.9341, RMSE = 2.86 kW, MAE = 2.31 kW, corresponding to about ±6% deviation near rated conditions.
- Graphical diagnostics (parity, residuals-vs-fitted, normal QQ) indicate a narrow 1:1 band without systematic bias, approximately normal zero-mean residuals, and no visible heteroscedasticity, supporting model adequacy across the observed envelope.
- In model form comparison, second-order polynomial and simple nonlinear alternatives (e.g., 1/Tout, ln Tout) yielded only marginal gains (ΔR2 < 0.02), showing that a linear form already captures the dominant relationships among Tin, Tout, and .
- Indoor humidity ratio (win) provided only minor improvement (ΔR2 < 0.02); under the test SHR conditions, latent effects were effectively reflected through temperature-related terms and airflow, making win redundant for a compact baseline model.
- Coefficient interpretation is physically consistent: capacity scales most strongly with ; Tin shows positive sensitivity (indoor load), while Tout’s small apparent effect reflects field control compensation, consistent with the operating envelope.
- Limitations include partial power-data loss (precluding a robust COP regression), non-season-long sampling (under-representation at extreme humidity/temperature), single-unit testing (no system-level interactions), and fixed sensor placement; nonetheless, the dataset spans frequent real-world operating ranges.
Author Contributions
Funding
Data Availability Statement
Conflicts of Interest
Abbreviations
| Abbreviation | |
| A | Area [m2] |
| Adj R2 | Adjusted R2 |
| ANN | Artificial Neural Network |
| ASHRAE | American Society of Heating Refrigerating and Airconditioning Engineers |
| BAS | Beetle Antennae Search algorithm |
| COP | Coefficient of Performance |
| CNN | Convolutional Neural Network |
| DNN | Deep Neural Network |
| da | Dry air |
| DELM | Deep Extreme Learning Machine |
| DOAS | Dedicated Outdoor Air Systems |
| GA | Genetic Algorithm |
| GPR | Gaussian Process Regression |
| GRNN | Generalized Regression Neural Network |
| HVAC | Heating, Ventilation, and Air-Conditioning |
| KDE | Kernel Density Estimation |
| IPSO | Improved Particle Swarm Optimization |
| LSSVM | Least Squares Support Vector Machine |
| LSTM | Long Short-Term Memory |
| MAE | Mean Absolute Error |
| MAPE | Mean Absolute Percentage Error |
| MLR | Multiple Linear Regression |
| MPC | Model Predictive Control |
| PSO-LSSVM | Particle Swarm Optimization–Least Squares Support Vector Machine |
| R2 | Coefficient of determination |
| RMSE | Root Mean Squared Error |
| SLR | Simple Linear Regression |
| SSA | Singular Spectrum Analysis |
| VAV | Variable Air Volume |
| VRF | Variable Refrigerant Flow |
| XGB | Extreme Gradient Boost |
| Nomenclature | |
| Specific heat at constant pressure [kJ/kg·K] | |
| Mass flow rate [kg/s] | |
| Density [kg/m3] | |
| Cooling capacity [kW] | |
| Latent heat [kW] | |
| Sensible heat [kW] | |
| Total heat [kW] | |
| Indoor unit evaporator inlet temperature [°C] = Indoor temperature | |
| Indoor unit evaporator outlet temperature [°C] | |
| Temperature difference | |
| Indoor unit airflow rate (volumetric flow rate) [m3/s] | |
| Indoor unit evaporator inlet humidity ratio [kg/kgda] = Indoor humidity ratio | |
Appendix A
Appendix A.1
| Ref. | Study | Model Type | Target System/Focus | No. of Input Variables | Reported Accuracy (R2/RMSE/MAPE) | Interpretability |
|---|---|---|---|---|---|---|
| [10] | Fan et al. (2017) | Deep Learning (ANN) | Short-term building cooling load | 7 | CV-RMSE ≈ 17.8% | Low |
| [11] | Chen et al. (2024) | SSA + CNN-Transformer | Airport terminal cooling load | 24 h cooling load data | MAPE 2.16% | Low |
| [12] | Gao et al. (2024) | Hybrid NN (GRNN + LSTM) | Complex building load | 14 | R2 > 0.99/MAPE = 1.96% | Low |
| [13] | Cui et al. (2025) | Hybrid ANN–Control | DOAS prediction-control | 6 | R2 > 0.99 | Medium |
| [14] | Jiang et al. (2025) | LSTM | DX system evaporation temp. | 3 | MSE = 0.16 | Low |
| [15] | Serrano et al. (2024) | ANN vs. Poppe’s model | Cooling tower performance | 5 | Poppe’s: R2 > 0.97 ANN: R2 > 0.98 | Medium |
| [16] | Aruta et al. (2025) | ANN + Climate Indices | Building energy resilience | 4–5 | R2 > 0.98 | Low |
| [17] | Sadeghi et al. (2020) | DNN | Residential building | 8 | R2 > 0.9987 (highest) | Low |
| [18] | Feng et al. (2022) | GPR | Office load prediction | ≥7 | R2 > 0.99/CV-RMSE = 0.1% | Medium |
| [19] | Zhang et al. (2024) | IPSO-LSSVM | Building load prediction | 6 | R2 > 0.912 | Low |
| [20] | Lei & Shao (2023) | DELM + Rough set | Commercial building cooling | 14 | MAPE = 0.99% (highest) | Low |
| [21] | Yu et al. (2023) | XGB / LSTM-Attn | District energy system | 11 | R2 > 0.958 | Medium |
| [22] | Ding et al. (2023) | Transfer Learning | Short-term load forecast | 9 | R2 = 0.93 | Medium |
| [23] | Kajewska-Szkudlarek et al. (2023) | Polynomial Regression | Degree-hour indexes | 11 | R2 = 0.981 | High |
| [24] | Guo et al. (2015) | Multivariable Linear Regression | Office cooling load | 4 | MARE < 8.0% | High |
| [25] | He et al. (2023) | PSO–ANN | VRF system | 11 | MAPE = 1.95% | Medium |
| [26] | Mohanraj et al. (2009) | ANN | Solar-assisted HP | 2 | R2 > 0.99 | Medium |
| [27] | Ra et al. (2023) | MPC | Factory HVAC control | 10+ | NMBE = 1.2% | High |
| [28] | Terzi et al. (2020) | Learning-based MPC | Business center HVAC | 7+ | Power 14% Saved | High |
| [29] | Ma & Wang (2011) | Adaptive + GA Control | Chiller plant | 3 | Max. 2.55% Energy Saved | High |
| [30] | Tahmasebinia et al. (2023) | Linear Regression | Building energy modeling | 13 | Various | High |
| [31] | Storcz et al. (2023) | Regression + Shape Descriptors | Energy & comfort estimation | 18 | R2 > 0.95 (highest) | High |
| [32] | Korolija et al. (2013) | Linear Regression | UK office building | 13 | R2 > 0.95 | High |
| [33] | Chengliang et al. (2019) | Multiple Nonlinear Regression | HVAC operation | 27 | R2 = 0.958 (highest) | High |
| [34] | Lan et al. (2025) | Multivariate Nonlinear Regression | Hybrid hydronic GSHP | 4 | R2 = 0.963 | High |
| [35] | Hu et al. (2026) | Random Forest-optimized | Ammonia Concentration Measurement | 8–10 | R2 = 0.916 | Medium |
Appendix A.2
| Device | Image | Model | Measurement Range | Accuracy | Notes |
|---|---|---|---|---|---|
| T/RH sensor |  | Testo 6621 | 0–60 °C; 0–100%RH | 2.5%RH (<90%) | Indoor/outdoor air |
| Thermocouple |  | T-type | −200–350 °C | 0.1 °C or 0.75% | Air/refrigerant |
| Pressure transducer |  | D451508 (T1) | 0–250 psig, 0–500 psig | 0.13% FS (Full Scale) | Refrigerant pressure |
| Mass flow meter |  | RHM 08 GNT | 0–50 kg/min; −20–120 °C | 0.16% | Refrigerant mass flow |
| Data logger |  | GL-820 | 20 mV–50 V; thermocouple | 16-bit resolution | Data acquisition system |
| Power meter |  | CW-240 | 45–60 Hz; 10–110% rated | 1% typical | Compressor, fans |
Appendix A.3
Appendix A.4
Appendix A.5

Appendix A.6

Appendix A.7
| No. | Combo | Model | Equation | R2 | Adj R2 | RMSE | MAE |
|---|---|---|---|---|---|---|---|
| 1 | , win | Polynomial (deg = 2) | ·win + 641,483.80·win2 | 0.9517 | 0.9517 | 2.4732 | 1.9286 |
| 2 | , win | Polynomial (deg = 2) | ·win + 61,4954.90·win2 | 0.9487 | 0.9487 | 2.5495 | 1.9865 |
| 3 | Polynomial (deg = 2) | 2 | 0.9464 | 0.9464 | 2.6054 | 2.0478 | |
| 4 | , win | Polynomial (deg = 2) | ·win + 81,593.66·win2 | 0.9418 | 0.9418 | 2.7155 | 2.1347 |
| 5 | Polynomial (deg = 2) | 2 | 0.9407 | 0.9407 | 2.7404 | 2.1934 | |
| 6 | Linear (SLR/MLR) | 0.9343 | 0.9343 | 2.8848 | 2.3303 | ||
| 7 | , win | Linear (SLR/MLR) | + −13.52·win | 0.9343 | 0.9343 | 2.8848 | 2.33 |
| 8 | Nonlinear (ln Tout) | 0.9342 | 0.9342 | 2.8855 | 2.3289 | ||
| 9 | , win | Nonlinear (ln Tout) | + −13.48·win | 0.9342 | 0.9342 | 2.8855 | 2.3286 |
| 10 | Nonlinear (1/Tout) | 0.9342 | 0.9342 | 2.8864 | 2.3276 | ||
| 11 | , win | Nonlinear (1/Tout) | + −14.85·win | 0.9342 | 0.9342 | 2.8864 | 2.3272 |
| 12 | , win | Polynomial (deg = 2) | ·win + 85,384.05·win2 | 0.9335 | 0.9335 | 2.9022 | 2.3229 |
| 13 | , win | Linear (SLR/MLR) | + −335.77·win | 0.9315 | 0.9315 | 2.9442 | 2.3958 |
| 14 | , win | Linear (SLR/MLR) | + 1278.05·win | 0.9314 | 0.9314 | 2.9469 | 2.3916 |
| 15 | , win | Nonlinear (ln Tout) | + 1277.88·win | 0.9314 | 0.9314 | 2.9475 | 2.3901 |
| 16 | Linear (SLR/MLR) | 0.9313 | 0.9313 | 2.9485 | 2.4062 | ||
| 17 | , win | Nonlinear (1/Tout) | + 1277.55·win | 0.9313 | 0.9313 | 2.9485 | 2.3885 |
| 18 | , win | Linear (SLR/MLR) | + 1303.25·win | 0.9266 | 0.9266 | 3.0483 | 2.4915 |
| 19 | Polynomial (deg = 2) | 2 | 0.8756 | 0.8756 | 3.9685 | 3.0208 | |
| 20 | Linear (SLR/MLR) | 0.8676 | 0.8676 | 4.0941 | 3.1681 | ||
| 21 | Nonlinear (1/Tout) | 0.8676 | 0.8676 | 4.0942 | 3.171 | ||
| 22 | Nonlinear (ln Tout) | 0.8676 | 0.8676 | 4.0942 | 3.1698 | ||
| 23 | Polynomial (deg = 2) | 2 | 0.8629 | 0.8629 | 4.1669 | 3.2578 | |
| 24 | Linear (SLR/MLR) | 0.8599 | 0.8599 | 4.2113 | 3.2739 | ||
| 25 | Tin, Tout, win | Polynomial (deg = 2) | = 120.23 + 17.24·Tin + −8.84·Tout + −18,733.34·win + −3.25·Tin2 + 0.66·Tin·Tout + 7097.95·Tin·win + 0.04·Tout2 + −503.10·Tout·win + −4,105,628.31·win2 | 0.3999 | 0.3998 | 8.7174 | 7.0772 |
| 26 | Tin, Tout, win | Linear (SLR/MLR) | = 64.98 + −8.72·Tin + 1.56·Tout + 8666.96·win | 0.3169 | 0.3169 | 9.3005 | 7.752 |
| 27 | Tin, Tout, win | Nonlinear (ln Tout) | = −48.76 + 47.47·(ln Tout) + −8.78·Tin + 8712.39·win | 0.3105 | 0.3104 | 9.3442 | 7.8179 |
| 28 | Tin, Tout, win | Nonlinear (1/Tout) | = 160.71 + −1415.75·(1/Tout) + −8.83·Tin + 8755.41·win | 0.3026 | 0.3025 | 9.3976 | 7.8934 |
| 29 | Tin, win | Polynomial (deg = 2) | = −218.05 + 61.83·Tin + −58,046.14·win + −4.96·Tin2 + 10,816.34·Tin·win + −6,198,708.44·win2 | 0.271 | 0.271 | 9.6078 | 7.9234 |
| 30 | Tout, win | Polynomial (deg = 2) | = 56.10 + −5.94·Tout + 6,857.48·win + 0.11·Tout2 + 24.47·Tout·win + −226,895.74·win2 | 0.2176 | 0.2176 | 9.9534 | 8.2977 |
| 31 | Tin, Tout | Polynomial (deg = 2) | = 99.61 + 2.64·Tin + −7.50·Tout + −0.12·Tin2 + 0.11·Tin·Tout + 0.10·Tout2 | 0.1906 | 0.1905 | 10.1239 | 8.5305 |
| 32 | Tout | Polynomial (deg = 2) | = 119.14 + −6.52·Tout + 0.13·Tout2 | 0.1802 | 0.1802 | 10.1888 | 8.5718 |
| 33 | Tout, win | Linear (SLR/MLR) | = −12.37 + 1.46·Tout + 609.27·win | 0.1763 | 0.1763 | 10.2131 | 8.5478 |
| 34 | Tout, win | Nonlinear (ln Tout) | = −117.40 + 43.80·(ln Tout) + 605.56·win | 0.1683 | 0.1682 | 10.2627 | 8.6211 |
| 35 | Tin, Tout | Linear (SLR/MLR) | = −8.00 + 0.18·Tin + 1.46·Tout | 0.1626 | 0.1625 | 10.2977 | 8.6112 |
| 36 | Tout | Linear (SLR/MLR) | = −4.24 + 1.46·Tout | 0.1614 | 0.1614 | 10.3047 | 8.6272 |
| 37 | Tout, win | Nonlinear (1/Tout) | = 74.97 + −1293.19·(1/Tout) + 600.67·win | 0.1588 | 0.1588 | 10.3207 | 8.7124 |
| 38 | Tin, Tout | Nonlinear (ln Tout) | = −113.34 + 43.95·(ln Tout) + 0.17·Tin | 0.1547 | 0.1546 | 10.3463 | 8.6799 |
| 39 | Tout | Nonlinear (ln Tout) | = −110.09 + 44.10·(ln Tout) | 0.1536 | 0.1536 | 10.3527 | 8.6931 |
| 40 | Tin, Tout | Nonlinear (1/Tout) | = 79.83 + −1298.86·(1/Tout) + 0.16·Tin | 0.1454 | 0.1454 | 10.4029 | 8.7658 |
| 41 | Tout | Nonlinear (1/Tout) | = 83.60 + −1303.82·(1/Tout) | 0.1444 | 0.1444 | 10.4088 | 8.7759 |
| 42 | Tin, win | Linear (SLR/MLR) | = 105.07 + −7.93·Tin + 7979.79·win | 0.1339 | 0.1339 | 10.4725 | 8.9113 |
| 43 | win | Polynomial (deg = 2) | = −44.84 + 10,949.41·win + −335,392.12·win2 | 0.0655 | 0.0655 | 10.8779 | 9.3839 |
| 44 | Tin | Polynomial (deg = 2) | = −87.12 + 10.87·Tin + −0.23·Tin2 | 0.0231 | 0.023 | 11.1225 | 9.7618 |
| 45 | win | Linear (SLR/MLR) | = 31.72 + 649.25·win | 0.0169 | 0.0168 | 11.1577 | 9.8327 |
| 46 | Tin | Linear (SLR/MLR) | = 35.04 + 0.26·Tin | 0.0024 | 0.0024 | 11.2396 | 9.8664 |
References
- Tu, D.; Tang, J.; Zhang, Z.; Sun, H. Thermal environment optimization in a large space building for energy-saving. Case Stud. Therm. Eng. 2023, 51, 103649. [Google Scholar] [CrossRef]
- Zhao, Y.; Zhao, K.; Ge, J. Predicting the temperature distribution of a non-enclosed atrium and adjacent zones based on the Block model. Build. Environ. 2022, 214, 108952. [Google Scholar] [CrossRef]
- Shi, K.; Ren, J.; Cao, X.; Kong, X. Optimizing thermal comfort in an atrium-structure library: On-site measurement and TRNSYS-CONTAM co-simulation. Build. Environ. 2024, 266, 112041. [Google Scholar] [CrossRef]
- Liu, X.; Liu, X.; Zhang, T. Dimensionless correlations of indoor thermal stratification in a non-enclosed large-space building under heating and cooling conditions. Build. Environ. 2024, 254, 111387. [Google Scholar] [CrossRef]
- Du, H.; Shi, J.; Chen, J.; Cheng, S.; Chen, Z. Energy consumption of a novel floor radiant cooling system in large space buildings. Appl. Therm. Eng. 2024, 257 Pt B, 124336. [Google Scholar] [CrossRef]
- Yu, X.; Yan, D.; Sun, K.; Hong, T.; Zhu, D. Comparative study of the cooling energy performance of variable refrigerant flow systems and variable air volume systems in office buildings. Appl. Energy 2016, 183, 725–736. [Google Scholar] [CrossRef]
- Seo, B.; Yoon, Y.B.; Yu, B.H.; Cho, S.; Lee, K.H. Comparative analysis of cooling energy performance between water-cooled VRF and conventional AHU systems in a commercial building. Appl. Therm. Eng. 2020, 170, 114992. [Google Scholar] [CrossRef]
- Naeem, A.; Benson, S.M.; Chalendar, J.A. Data-driven characterization of cooling needs in a portfolio of co-located commercial buildings. iScience 2024, 27, 110398. [Google Scholar] [CrossRef]
- Huang, X.; Zhou, X.; Yan, J.; Huang, X. Cooling load forecasting method for central air conditioning systems in manufacturing plants based on iTransformer-BiLSTM. Appl. Sci. 2025, 15, 5214. [Google Scholar] [CrossRef]
- Fan, C.; Xiao, F.; Zhao, Y. A short-term building cooling load prediction method using deep learning algorithms. Appl. Energy 2017, 195, 222–233. [Google Scholar] [CrossRef]
- Chen, B.; Yang, W.; Yan, B.; Zhang, K. An advanced airport terminal cooling load forecasting model integrating SSA and CNN-Transformer. Energy Build. 2024, 309, 114000. [Google Scholar] [CrossRef]
- Gao, Z.; Yang, S.; Yu, J.; Zhao, A. Hybrid forecasting model of building cooling load based on combined neural network. Energy 2024, 297, 131317. [Google Scholar] [CrossRef]
- Cui, Y.; Fan, C.; Zhang, W.; Zhou, X. Decoupling prediction of cooling load and optimizing control for dedicated outdoor air systems by using a hybrid artificial neural network method. Case Stud. Therm. Eng. 2025, 69, 106046. [Google Scholar] [CrossRef]
- Jiang, T.; Zheng, C.; Wang, H.; You, S.; Zhang, H.; Wang, Y.; Sun, J.; Wu, Z.; Zhao, W.; Zheng, J. Evaporation temperature prediction of the refrigerant-direct convective-radiant cooling system based on LSTM neural network. Appl. Therm. Eng. 2025, 258 Pt C, 124693. [Google Scholar] [CrossRef]
- Serrano, J.M.; Navarro, P.; Ruiz, J.; Palenzuela, P.; Lucas, M.; Roca, L. Wet cooling tower performance prediction in CSP plants: A comparison between artificial neural networks and Poppe’s model. Energy 2024, 303, 131844. [Google Scholar] [CrossRef]
- Aruta, G.; Ascione, F.; Bianco, N.; Mauro, G.M.; Villano, F. Artificial neural networks to forecast building heating/cooling demand and climate resilience based on envelope parameters and new climatic stress indices. J. Build. Eng. 2025, 108, 112849. [Google Scholar] [CrossRef]
- Sadeghi, A.; Sinaki, R.Y.; Young II, W.A.; Weckman, G.R. An Intelligent Model to Predict Energy Performances of Residential Buildings Based on Deep Neural Networks. Energies 2020, 13, 571. [Google Scholar] [CrossRef]
- Feng, Y.; Huang, Y.; Shang, H.; Lou, J.; Knefaty, A.; Yao, J.; Zheng, R. Prediction of Hourly Air-Conditioning Energy Consumption in Office Buildings Based on Gaussian Process Regression. Energies 2022, 15, 4626. [Google Scholar] [CrossRef]
- Zhang, S.; Chang, Y.; Li, H.; You, G. Research on Building Energy Consumption Prediction Based on Improved PSO Fusion LSSVM Model. Energies 2024, 17, 4329. [Google Scholar] [CrossRef]
- Lei, L.; Shao, S. Prediction model of the large commercial building cooling loads based on rough set and deep extreme learning machine. J. Build. Eng. 2023, 80, 107958. [Google Scholar] [CrossRef]
- Yu, H.; Zhong, F.; Du, Y.; Xie, X.; Wang, Y.; Zhang, X.; Huang, S. Short-term cooling and heating loads forecasting of building district energy system based on data-driven models. Energy Build. 2023, 298, 113513. [Google Scholar] [CrossRef]
- Ding, Y.; Huang, C.; Liu, L.; Li, P.; You, W. Short-term forecasting of building cooling load based on data integrity judgment and feature transfer. Energy Build. 2023, 283, 112826. [Google Scholar] [CrossRef]
- Kajewska-Szkudlarek, J. Predictive modelling of heating and cooling degree hour indexes for residential buildings based on outdoor air temperature variability. Sci. Rep. 2023, 13, 17411. Available online: https://www.nature.com/articles/s41598-023-44380-4 (accessed on 19 April 2025). [CrossRef] [PubMed]
- Guo, Q.; Tian, Z.; Ding, Y.; Zhu, N. An improved office building cooling load prediction model based on multivariable linear regression. Energy Build. 2015, 107, 445–455. [Google Scholar] [CrossRef]
- He, Y.; Gong, Q.; Zhou, Z.; Chen, H. Development of a hybrid VRF system energy consumption prediction model based on data partitioning and swarm intelligence algorithm. J. Build. Eng. 2023, 74, 106868. [Google Scholar] [CrossRef]
- Mohanraj, M.; Jayaraj, S.; Muraleedharan, C. Performance prediction of a direct expansion solar assisted heat pump using artificial neural networks. Appl. Energy 2009, 86, 1442–1449. [Google Scholar] [CrossRef]
- Ra, S.J.; Kim, J.H.; Park, C.S. Real-time model predictive cooling control for an HVAC system in a factory building. Energy Build. 2023, 285, 112860. [Google Scholar] [CrossRef]
- Terzi, E.; Bonetti, T.; Saccani, D.; Farina, M.; Fagiano, L.; Scattolini, R. Learning-based predictive control of the cooling system of a large business centre. Control Eng. Pract. 2020, 97, 104348. [Google Scholar] [CrossRef]
- Ma, Z.; Wang, S. Supervisory and optimal control of central chiller plants using simplified adaptive models and genetic algorithm. Appl. Energy 2011, 88, 198–211. [Google Scholar] [CrossRef]
- Tahmasebinia, F.; He, R.; Chen, J.; Wang, S.; Sepasgozar, S.M. Building energy performance modeling through regression analysis: A case of tyree energy technologies building at UNSW Sydney. Buildings 2023, 13, 1089. [Google Scholar] [CrossRef]
- Storcz, T.; Várady, G.; Kistelegdi, I.; Ercsey, Z. Regression models and shape descriptors for building energy demand and comfort estimation. Energies 2023, 16, 5896. [Google Scholar] [CrossRef]
- Korolija, I.; Zhang, Y.; Marjanovic-Halburd, L.; Hanby, V.I. Regression models for predicting UK office building energy consumption from heating and cooling demands. Energy Build. 2013, 59, 214–227. [Google Scholar] [CrossRef]
- Chengliang, F.; Yunfei, D. Cooling load prediction and optimal operation of HVAC systems using a multiple nonlinear regression model. Energy Build. 2019, 197, 7–17. [Google Scholar] [CrossRef]
- Lan, T.; Hu, R.; Tang, Q.; Han, M.; Wu, S.; Liu, G. A multivariate nonlinear regression prediction model for the performance of cooling tower assisted ground source heat pump system. Energy Convers. Manag. 2025, 325, 119333. [Google Scholar] [CrossRef]
- Hu, L.; Peng, Y.; Yan, H.; Qiu, F.; Cheng, Z. A random forest-optimized sensor fusion approach for non-invasive ammonia measurement: Enhancing performance in jet impact-negative pressure reactors. Measurement 2026, 258 Pt A, 119121. [Google Scholar] [CrossRef]
- ASHRAE Standard 37; Methods of Testing for Rating Electrically Driven Unitary Air-Conditioning and Heat-Pump Equipment. American Society of Heating, Refrigerating and Air-Conditioning Engineers, Inc.: Atlanta, GA, USA, 2019.
- ASHRAE Standard 111; Measurement, Testing, Adjusting, and Balancing of Building HVAC Systems. American Society of Heating, Refrigerating and Air-Conditioning Engineers, Inc.: Atlanta, GA, USA, 2017.
- ISO 3966; Measurement of Fluid Flow in Closed Conduits—Velocity Area Method Using Pitot Static Tubes. International Organization for Standardization: Geneva, Switzerland, 2020.
- Sartori, I.; Walnum, H.T.; Skeie, K.S.; Georges, L.; Knudsen, M.D.; Bacher, P.; Candanedo, J.; Sigounis, A.; Prakash, A.K.; Pritoni, M.; et al. Sub-hourly measurement datasets from 6 real buildings: Energy use and indoor climate. Data Brief 2023, 48, 109149. [Google Scholar] [CrossRef]
- Li, P.; Zhao, X.; Wang, S.; Parkinson, T.; Dear, R.; Shi, X. Evidence-based strategies for optimizing long-term temperature monitoring in offices. Indoor Environ. 2024, 1, 100059. [Google Scholar] [CrossRef]
- Zhang, Y.; Lu, J.; Jiang, X.; Shen, S.; Wang, X. A study on heat transfer load in large space buildings with stratified air-conditioning systems based on building energy modeling: Model validation and load analysis. Sage J. 2021, 104, 00368504211036133. [Google Scholar] [CrossRef]
- Owen, M.S. (Ed.) ASHRAE Handbook 2009: Fundamentals; American Society of Heating, Refrigerating and Air-Conditioning Engineers, Inc.: Atlanta, GA, USA, 2009. [Google Scholar]
- ASHRAE Standard 41.9; Standard Methods for Refrigerant Mass Flow Measurement Using Calorimeters. American Society of Heating, Refrigerating and Air-Conditioning Engineers, Inc.: Atlanta, GA, USA, 2000.
- AHRI Standard 210/240; Performance Rating of Unitary Air-Conditioning & Air-Source Heat Pump Equipment. Air-Conditioning, Heating, and Refrigeration Institute: Arlington, VA, USA, 2008. Available online: https://www.ahrinet.org/system/files/2023-09/AHRI%20Standard%20210.240-2023%20%282020%29.pdf (accessed on 1 March 2025).
- ASHRAE Standard 41.2; Standard Methods for Air Velocity and Airflow Measurement. American Society of Heating, Refrigerating and Air-Conditioning Engineers, Inc.: Atlanta, GA, USA, 2018.
- Mitsubishi Electric. Submittal Data: MSZ-FH18NA2 & MUZ-FH18NAH2; Mitsubishi Electric: Tokyo, Japan, 2024; Available online: https://www.mitsubishitechinfo.ca/sites/default/files/SB_MSZ-FH18NA2_MUZ-FH18NAH2_202403.pdf (accessed on 13 June 2025).
- Daikin. Submittal Data Sheet: FTX12BXVJU/RX12BXVJU (1.0-Ton Mini-Split); Daikin Industries: Osaka, Japan, 2023; Available online: https://backend.daikincomfort.com/docs/default-source/product-documents/residential/submittal/ftx12bxvjurx12bxvju.pdf (accessed on 13 June 2025).
- LG Electronics. Single Zone Wall Mounted Art Cool™ Premier Engineering Manual (HYV3); LG Electronics U.S.A., Inc.: Englewood Cliffs, NJ, USA, 2022; Available online: https://media.us.lg.com/m/2ee10c92127a0e2b/original/EM_SZ_ArtCoolPremier_HYV3-pdf.pdf (accessed on 14 June 2025).
- Cummings, J.B.; Withers, C.R. Making the Case for Oversizing Variable-Capacity Heat Pumps. In Proceedings of the 2014 ACEEE Summer Study on Energy Efficiency in Buildings, Washington, DC, USA, 20 August 2014; p. FSEC-PF-459-14. Available online: https://publications.energyresearch.ucf.edu/wp-content/uploads/2018/06/FSEC-PF-459-14.pdf (accessed on 13 April 2025).
- Cummings, J.; Withers, C. Energy Savings and Peak Demand Reduction of a SEER 21 Heat Pump vs. a SEER 13 Heat Pump with Attic and Indoor Duct Systems; National Renewable Energy Laboratory (NREL): Golden, CO, USA, 2014; Report No. KNDJ-0-40339-02. [Google Scholar] [CrossRef]
- Chaganti, R.; Rustam, F.; Daghriri, T.; Díez, I.T.; Mazón, J.L.; Carmen Lili Rodríguez, C.L.; Imran Ashraf, I. Building Heating and Cooling Load Prediction Using Ensemble Machine Learning Model. Sensors 2022, 22, 7692. [Google Scholar] [CrossRef]
- Abdel-Jaber, F.; Dirks, K.N. A Review of Cooling and Heating Loads Predictions of Residential Buildings Using Data-Driven Techniques. Buildings 2024, 14, 752. [Google Scholar] [CrossRef]
- Wefki, H.; Khallaf, R.; Ebid, A.M. Estimating the energy consumption for residential buildings in semiarid and arid desert climate using artificial intelligence. Sci. Rep. 2024, 14, 13648. [Google Scholar] [CrossRef] [PubMed]




| Category | Item | Description |
|---|---|---|
| Equipment | System | Modular vertical DX cooling system |
| Refrigerant | R410A | |
| Rated cooling capacity | 51 kW | |
| Rated power consumption | 16.6 kW | |
| Dimensions | 900 mm × 931 mm × 1713 mm (width × depth × height) | |
| Test space | Type | Small factory building with office |
| Envelope material | Sandwich panel | |
| Insulation | Polystyrene foam (thickness: 150 mm) | |
| Size | 19.5 m × 10 m × 7.35 m | |
| Effective cooling volume | 866 m3 (excluding office space on 2nd floor) | |
| Operating scenarios | Operating conditions | Multi-condition field measurements: varying indoor/outdoor temperatures, airflow rate steps (20–100%), opening and closing door to change indoor temperature condition and cooling loads |
| Fan Speed (%) | Airflow Rate (m3/s) |
|---|---|
| 20 | 0.296 |
| 40 | 0.714 |
| 50 | 0.732 |
| 60 | 0.854 |
| 80 | 1.115 |
| 100 | 1.690 |
| Step | Filtering Criteria | Referenced Standard | Removal Criteria Description |
|---|---|---|---|
| Step 1 | Compressor outlet temperature ≥ 70 °C | ASHRAE Std. 37 [36] | Ensure stabilized operation consistent with ≥30 min steady-state requirement; remove start-up data |
| Step 2 | Zero refrigerant flow (EEV fully closed) | ASHRAE Std. 41.9 [43] | Exclude non-cooling conditions (compressor off-cycle, safety logic) |
| Step 3 | Outdoor air inlet temperature > 40 °C | AHRI 210/240 [44] | Remove data outside typical rating condition (35 °C), likely sensor error or extreme condition |
| Step 4 | Outdoor coil ΔT < 5.5 °C | ASHRAE Std. 41.2 [45] | Exclude fan-off/inactive heat rejection periods |
| Step 5 | 2 °C (per fan speed) | ASHRAE Std. 37 [36] | Remove transient disturbances (door opening, airflow fluctuation) inconsistent with steady state |
| Step 6 | Top 5% of cooling capacity values | ASHRAE Std. 37 [36] | Exclude unrealistic values beyond rated envelope; retain physically plausible performance |
| Combination No. | Independent Variable Set | Description of Variable Selection | Expected Contribution |
|---|---|---|---|
| 1 | Tin | Represents indoor load conditions | Baseline performance reference |
| 2 | Tout | Evaluates outdoor condition as a single factor | Verifies outdoor sensitivity |
| 3 | win | Reflects indoor humidity → latent load contribution | Compensates limitation of sensible-only models |
| 4 | Represents controllable fan speed | Captures control input effect | |
| 5 | Tin, Tout | Considers both indoor and outdoor thermal environment | Evaluates combined influence of indoor and outdoor temperature variations |
| 6 | Tin, win | Considers indoor temperature and humidity together | Represents both sensible and latent load |
| 7 | Combines indoor load with control input | Strengthens applicability to control | |
| 8 | Combines outdoor condition with control input | Assesses performance response to outdoor stress under varying airflow | |
| 9 | Tin, Tout, win | Considers temperature difference and humidity | Comprehensive representation of sensible and latent load |
| 10 | Core 3-variable minimal model | Balances simplicity and predictive accuracy | |
| 11 | , win | Core 4-variable extended model | Includes sensible, latent, and control variables |
| Method | Purpose | Mathematical Form | Remarks |
|---|---|---|---|
| Simple Linear Regression (SLR) | Identify the first-order relationship between each independent variable and cooling capacity (c) | c = a + b·X (X ∈ {Tin, Tout, , win}) | Verify individual effects of variables |
| Multiple Linear Regression (MLR) | Estimate combined effects of major independent variables | c = a + b1·Tin + b2·Tout + b3· + b4·win | Basic multivariable prediction model |
| Polynomial Regression (degree = 2) | Reflect nonlinear effects and interactions between variables | c = a + b1·Tin +b2·Tout + b3·+b4·win + b11·Tin2 + b22·Tout2 + b12·(Tin·Tout) | Constructed up to second order; higher orders avoided due to overfitting risk |
| Nonlinear Regression | Capture diminishing performance trend under increasing outdoor temperature | Form A (rational): c = a + b·(1/Tout) + c1·Tin + c2· (+ c3· win) Form B (logarithmic): c = a + b·(ln Tout) + c1·Tin + c2· (+ c3·win) | Reflects thermodynamic behavior; initial coefficients set from linear regression; domain restrictions for both rational form (1/Tout) and logarithmic form (ln Tout) were considered, and small shifts were applied to ensure numerical stability. |
| Metric | Value |
|---|---|
| R2 [-] | 0.9341 |
| RMSE [kW] | 2.8614 |
| MAE [kW] | 2.3139 |
| Label | Tin (°C) | Tout (°C) | (m3/s) | c (kW) | (kW) | COP |
|---|---|---|---|---|---|---|
| Observed @ Tout = 28.8 °C | 26.7 | 28.8 | 1.7 | 57.5 | 13.7 | 4.2 |
| Model @ Tout = 28.8 °C | 26.7 | 28.8 | 1.7 | 57.1 | 16.5 | 3.5 |
| Model @ Tout = 35 °C | 26.7 | 35.0 | 1.7 | 58.4 | 18.0 | 3.2 |
| Model @ Tout = 40 °C | 26.7 | 40.0 | 1.7 | 59.4 | 19.1 | 3.1 |
Disclaimer/Publisher’s Note: The statements, opinions and data contained in all publications are solely those of the individual author(s) and contributor(s) and not of MDPI and/or the editor(s). MDPI and/or the editor(s) disclaim responsibility for any injury to people or property resulting from any ideas, methods, instructions or products referred to in the content. |
© 2025 by the authors. Licensee MDPI, Basel, Switzerland. This article is an open access article distributed under the terms and conditions of the Creative Commons Attribution (CC BY) license (https://creativecommons.org/licenses/by/4.0/).
Share and Cite
Min, T.U.; Kim, Y.I. Performance Prediction of a Vertical Downward Supply Direct Expansion Cooling System for Large Spaces Through Field Experiments. Energies 2025, 18, 6160. https://doi.org/10.3390/en18236160
Min TU, Kim YI. Performance Prediction of a Vertical Downward Supply Direct Expansion Cooling System for Large Spaces Through Field Experiments. Energies. 2025; 18(23):6160. https://doi.org/10.3390/en18236160
Chicago/Turabian StyleMin, Tong Un, and Young Il Kim. 2025. "Performance Prediction of a Vertical Downward Supply Direct Expansion Cooling System for Large Spaces Through Field Experiments" Energies 18, no. 23: 6160. https://doi.org/10.3390/en18236160
APA StyleMin, T. U., & Kim, Y. I. (2025). Performance Prediction of a Vertical Downward Supply Direct Expansion Cooling System for Large Spaces Through Field Experiments. Energies, 18(23), 6160. https://doi.org/10.3390/en18236160


