Article

Optimising Behavioural Control Based on Actual HVAC Use in Naturally Ventilated Buildings

1
Department of Architecture, School of Spatial Planning and Design, Hangzhou City University, Hangzhou 310015, China
2
Zhejiang Engineering Research Center of Building’s Digital Carbon Neutral Technology, Hangzhou 310015, China
3
Department of Architecture, College of Civil Engineering and Architecture, Zhejiang University, Hangzhou 310058, China
4
Department of Architecture, The College of Urban Construction, Zhejiang Shuren University, Hangzhou 310015, China
*
Author to whom correspondence should be addressed.
Energies 2025, 18(23), 6130; https://doi.org/10.3390/en18236130 (registering DOI)
Submission received: 30 September 2025 / Revised: 14 November 2025 / Accepted: 18 November 2025 / Published: 23 November 2025
(This article belongs to the Special Issue Energy Efficiency and Energy Saving in Buildings)

Abstract

Multi-objective optimisation is essential for balancing building energy efficiency and thermal comfort. Existing research primarily focuses on passive optimisation strategies that assume fixed behavioural patterns of a ‘rational occupant’. However, these studies often overlook the impact of stochastic occupant behaviour on building energy efficiency and thermal comfort. Furthermore, they fail to consider the inherent randomness, variability, dynamic nature, and feedback mechanisms of individual actions. As a result, this oversight can lead to suboptimal energy efficiency, insufficient thermal comfort, and a poor user experience. This study examines a naturally ventilated research building equipped with split-type air conditioning in China’s hot summer and cold winter climate zone. The research develops a rapid prediction model for air conditioning (AC) energy consumption and thermal comfort based on actual HVAC behaviours, incorporating the AC and natural ventilation (NV) operation schedules. The model utilises Artificial Neural Networks (ANNs), importance analysis, and batch simulation. Furthermore, a multi-objective optimisation decision-making model is developed to balance building AC energy consumption and indoor environmental thermal comfort, using the NSGA-II algorithm. The results indicate that when building design parameters comply with the current energy-saving design standards, behavioural optimisation can lead to a 31.4% reduction in energy use for building AC systems while enhancing thermal comfort by 37.5%. Furthermore, by implementing integrated optimisation strategies, comfort can be improved by as much as 92.6% without raising energy consumption.

1. Introduction

Public buildings are major contributors to urban architectural energy consumption, significantly impacting city-wide energy efficiency and total carbon emissions. Research findings from the Building Energy Conservation Research Center of Tsinghua University indicate that in 2020, China’s total energy consumption for public buildings (excluding heating in northern regions) amounted to 346 million tons of standard coal equivalent, accounting for 33% of total building energy consumption, while associated electricity consumption was 102.21 billion kWh [1]. In 2021, the total energy consumption throughout the entire life cycle of China’s building sector (encompassing material production, construction, operation, and demolition) increased by 5.0% compared to 2020, while carbon emissions rose by 4.8%. These statistics reveal a striking growth rate in energy consumption and carbon emissions [2].
Research efforts to reduce building energy consumption have gained considerable attention due to increasing energy consumption and emissions. An expanding group of scholars focused on practical approaches to decreasing building energy consumption from various angles [3,4]. For instance, Ding et al. [5] developed an urban-level energy consumption database based on residential and office building prototypes. Their research commenced with creating typical building energy consumption models using EnergyPlus v8.8.0, followed by integrating stochastic simulation and data-driven regression analysis to generate the energy consumption database. Accordingly, a web platform was designed to provide energy-saving solutions for urban planning and existing building retrofits.
Meanwhile, as people’s living standards improve, research has increasingly shifted toward enhancing building thermal comfort [6,7,8]. Consequently, scholars have investigated approaches integrating multi-objective optimisation with building simulation software, including energy conservation, thermal comfort, building envelope performance, and carbon emissions reduction [9,10]. Specific methodologies involve applying tools such as DOE-2 simulation [11], machine learning [12,13,14], and optimisation algorithms [15,16] to achieve multi-objective optimisation of buildings. For example, Wang et al. [17] proposed a multi-objective optimisation framework based on SVR-NSGA-II: it combines support vector regression (SVR) modelling with the NSGA-II algorithm to optimise building performance after generating energy consumption data through OpenStudio. The results show that the optimised building significantly improves energy efficiency and thermal comfort. Liu et al. [18] conducted multi-objective optimisation design research on a university activity centre in China, using Grasshopper modelling and the Ladybug and Honeybee plugins to simulate energy consumption and thermal comfort, and applying the Octopus algorithm for optimisation. As a result, a 58.8% reduction in annual energy consumption and a 53.0% increase in thermal comfort duration were achieved.
Despite progress in studying traditional multi-objective optimisation problems (MOPs), many shortcomings remain. Traditional research is based on the ‘rational person’ assumption, simplifying individual behaviour patterns into fixed and regular schedules for building simulations [19,20]. However, this approach neglects critical factors such as the randomness, variability, dynamic nature, and feedback mechanisms of human behaviours. As a result, it becomes challenging to reflect the complexity of human behaviour in real-world scenarios accurately. Consequently, significant discrepancies arise between the simulated values for building energy consumption and indoor thermal environments—derived from fixed schedules [21,22]—and the actual measured values. This gap ultimately leads to suboptimal outcomes when implementing multi-objective optimisation strategies.
To address the aforementioned issues, scholars have begun to focus on behavioural model research, exploring methods for more precise energy consumption optimisation [23]. Various models have been proposed to describe the HVAC behaviours, including deterministic models [24], statistical models, stochastic models, and occupant behaviour action models [25]. Among these, the stochastic model has been shown to offer a superior simulation of human energy consumption patterns [26,27], thereby significantly enhancing the accuracy of energy consumption and thermal comfort predictions [28,29,30].
Furthermore, in traditional multi-objective optimisation research, the predominant focus has been on passive strategies, often overlooking the effective management of individual behaviours [31]. This limited viewpoint does not adequately address issues such as energy wastage, excessive comfort, and low energy efficiency. Jeong et al. [32] and Azar et al. [33] have indicated that relying solely on passive strategies and equipment optimisation is insufficient for achieving optimal energy savings, as user behaviour significantly impacts building energy consumption. Optimising user behaviour patterns has been shown to reduce building energy consumption while enhancing thermal comfort. For example, Hamed et al. [34] achieved significant energy savings by optimising household energy consumption behaviours, such as adjusting clothing choices, increasing natural ventilation, promptly turning off lights, and effectively managing air conditioning usage times. These efforts resulted in an overall energy consumption reduction of 19.39% while improving thermal comfort. However, many of these studies are based on fixed behavioural patterns. To align research outcomes more closely with actual energy consumption, Haidar et al. [35] explored multi-objective optimisation strategies that consider real HVAC behavioural characteristics. Xiang et al. [36] developed an HVAC behaviour model to describe the behavioural characteristics of a real-world HVAC, including air conditioning and window operation. Using this model, they implemented behaviour optimisation strategies through simulation. The results showed that these optimised solutions could reduce energy demand by 50.2% to 60.2% while decreasing the duration of indoor thermal discomfort by 3.52% to 11.09% compared to the benchmark case.
In general, passive multi-objective optimisation strategies based on the “rational agent” (which uses fixed schedules) have produced significant results, but these strategies remain limited. Most studies on behavioural optimisation rely on the rational-agent assumption, treating user behaviour as a predictable process. However, there is a notable oversight regarding users’ stochastic actions and dynamic adaptations in real-world scenarios. Furthermore, research on multi-objective optimisation problems (MOPs) for behavioural optimisation using real-world behavioural data is even more scarce.
Based on the stochastic sequence of HVAC behaviour for a research building, which reflects actual behavioural characteristics (proposed in the preliminary research [37]), this study identifies the important influencing factors of building AC energy consumption and indoor thermal comfort as decision variables. These factors were extracted from three aspects: building design scheme, internal disturbance elements, and adaptive behaviours. A rapid multi-objective prediction model for building AC energy consumption and indoor thermal comfort is constructed using EnergyPlus batch simulation and an artificial neural network approach. Combining the NSGA-II genetic algorithm with the control parameter method, a multi-objective optimisation decision-making model is established for generating optimisation strategies. This study proposes a multi-objective optimisation method that comprehensively considers actual HVAC behavioural characteristics and user demands, aiming to significantly improve indoor thermal comfort while reducing air conditioning energy consumption.
In terms of content, this study innovatively adopts the coupling of air conditioning and natural ventilation (specifically, window operation) as a pivotal indicator for behavioural optimisation. This approach accurately captures the effects of the occupants’ combined HVAC behaviours on building energy consumption and the indoor thermal environment. A comprehensive technical framework is established for the methodology, encompassing data acquisition, model training, and optimisation decision-making. A rapid prediction model is developed using an artificial neural network (ANN) based on EnergyPlus (E+) batch simulation results. This provides a scientifically rigorous and computationally efficient basis for formulating multi-objective optimisation strategies. This integrated approach enhances the practicality and forward-looking value of the research.

2. Methodology

The research technical route of the paper is shown in Figure 1. This study proposes a multi-objective optimisation method based on actual HVAC behaviours to optimise energy consumption and thermal comfort for air conditioning (AC) in naturally ventilated research buildings in China’s hot summer and cold winter climates. The research quantitatively represents real HVAC behaviours in EnergyPlus simulations [37] by developing a model for predicting HVAC stochastic behaviours. A rapid prediction model for building AC energy consumption and indoor thermal comfort was developed using a BP neural network based on batch simulations. Using the NSGA-II algorithm, a multi-objective optimisation decision-making model was established for energy conservation and enhanced thermal comfort. This model effectively generates traditional passive optimisation strategies while providing users with behavioural optimisation strategies and integrated recommendations. This approach offers comprehensive and scientific support for making energy-saving retrofits and operational management decisions, delivering significant practical value.

2.1. Construction of a Multi-Objective Database

The multi-objective database, constructed under the various operating scenarios, is the foundation for developing a rapid prediction model for AC energy consumption and indoor environmental thermal comfort. This study begins by quantifying actual HVAC behaviours in building simulations using measured values. This approach helps to avoid the prediction errors arising from traditional fixed-schedule methods and enhances simulation accuracy. Subsequently, an importance analysis is performed to identify the key factors influencing building AC energy consumption and thermal comfort. Finally, batch simulations are executed using jEPlus v2.1.0 to create a ‘decision variable—target variable’ mapping database across different operating scenarios.

2.1.1. Methods of Quantifying and Characterising Actual HVAC Behaviours in Building Simulation

This paper is based on preliminary research conducted at a naturally ventilated research building in Hangzhou, China, which created a stochastic prediction model to accurately represent the HVAC system’s actual behaviours. This model was developed by analysing indoor thermal environment parameters, AC energy consumption data, and window opening/closing behaviour metrics. These measurements were collected from January 2017 to January 2018.
This study divides the year into seven characteristic stages of AC usage to effectively capture the seasonal variations in HVAC behaviours induced by annual climate changes, as presented in Table 1 [37]. The k-means clustering analysis generates typical operation schedules and their probabilities of occurrence for different functional rooms (e.g., collective offices and individual offices) within each characteristic stage of AC usage. Subsequently, annual stochastic HVAC operation sequences are generated via Monte Carlo simulation. Stochastic behaviour sequences are transformed into EnergyPlus-compatible stochastic behavioural schedules using Python 3.7. This establishes a method for quantifying real HVAC behaviours in building simulations. The study demonstrates a significant improvement in prediction accuracy by simulating the annual AC energy consumption of the case building under stochastic behavioural and fixed schedules, then comparing the results with measured values. This finding underscores the efficacy and necessity of the proposed methodology.

2.1.2. Proposal of Decision Variables Based on Importance Analysis

An excessive number of input items can lead to neural network instability and reduced prediction accuracy. Therefore, it is crucial to carefully select decision variables when developing rapid prediction models for AC energy consumption and indoor thermal comfort. The preliminary study [37] identified 28 initial influencing factors across three dimensions: building design scheme, internal building disturbance elements, and adaptive behaviours. These factors were used to identify the key influencing factors of the target variables—AC energy consumption and indoor thermal comfort—which will serve as the decision variables for the rapid prediction model.
Measurements obtained from the case building revealed interactions and mutual influences between the air conditioning (AC) and the natural ventilation (NV) operations in practical operation, and these coupling patterns significantly impact the target variables. Consequently, the preliminary study incorporated the coupling pattern between AC and NV operation as an initial influencing factor within the adaptive behaviour category. Five typical coupling modes were proposed, as shown in Table 2.
The 28 initial influencing factors were considered independent variables, and batch simulations were performed using EnergyPlus with the assistance of jEPlus for parameter management. Specifically, the AC cooling and heating loads, as well as the uncomfortable hours of each air-conditioning zone, were simulated. The uncomfortable hours in this study refer to the duration during which the Predicted Mean Vote (PMV) index within the corresponding air-conditioning zone falls outside the comfort range while occupants are present. Based on the thermal sensation vote results from 1471 valid questionnaires (distributed and collected in the research building over 34 seasonal typical days from January 2017 to January 2018) and real-time thermal environment parameters, the actual Mean Thermal Sensation Vote (TSV) and the PMV were calculated and compared. Result analysis indicated that the PMV index specified in ASHRAE Standard 55-2017 [38] is suitable for assessing the subjective thermal sensation of occupants in research buildings in Hangzhou. Accordingly, this study adopted [−0.5, 0.5] as the PMV comfort range for the simulation.
The total AC load of the entire building can be directly summed and output from the simulation results. However, the uncomfortable hours of individual zones cannot be directly used to characterise the thermal comfort of the entire building. To quantitatively evaluate the indoor thermal comfort of the entire building, this study proposed the “comprehensive uncomfortable hours” as a discomfort index, which is calculated using Equation (1). A higher value of this index indicates poorer thermal comfort. The target variables, namely the annual AC load per unit area and annual comprehensive uncomfortable hours (UCH) of the case building, were then derived through simulation and calculations, quantifying the building’s AC energy consumption and indoor thermal comfort, respectively.
T u = i = 1 n S i · t i i = 1 n S i ,
where
T u is the comprehensive uncomfortable hours (UCH) for the entire building;
n is the number of air-conditioned rooms in the building;
S i is the area of the ith room;
t i is the simulated uncomfortable hours in the ith room.
Through batch simulations and calculations under 2000 multiple operating conditions, the target variables (i.e., building AC load per unit area and comprehensive uncomfortable hours) of the case building were obtained. Utilising random forest regression and residual mean methods, the importance scores of each independent variable (initial influencing factor) concerning each target variable were determined, and relative importance was calculated via normalisation. As shown in Table 3, 14 important influencing factors were selected as decision variables for the target variables based on a numerical analysis of their relative importance, with each factor demonstrating a relative importance greater than 0.5%. The remaining 14 factors were classified as non-important influencing factors; their values were set as fixed optimal values based on correlation analysis results and were not treated as variables.
A multi-objective database was constructed under the various operating scenarios based on the aforementioned decision variables. Artificial neural networks utilised the database to develop and validate a rapid prediction model for target variables.

2.1.3. Construction of a “Decision Variable-Target Variable” Mapping Database Based on Batch Simulation

The study uses the decision variables shown in Table 3 as input variables, setting each variable as a dynamic parameter with the value ranges shown in Table 2, as defined by jEPlus’s parameter management. The Sobol’ sequence method is then employed to generate 5000 random samples, with each sample recording the values of the input variables.
The target variable serves as the output vector and, together with the corresponding input vector, forms a complete data sample. Ultimately, 4000 samples were randomly selected for the train set and the remaining 1000 for the test set. As the input variables have different units and their numerical values vary significantly, the original data must undergo normalisation preprocessing to avoid issues such as increased error and reduced convergence during neural network learning. This involves uniformly quantising the values into the [0, 1] range using Equation (2).
x i = x i m i n ( x i ) m a x ( x i ) m i n ( x i ) ,
where
x i is the value of the ith input variable after preprocessing;
x i is the original value of the ith input variable before processing;
m a x ( x i ) and m i n ( x i ) are the maximum and minimum values of the ith input variable in all data samples.

2.2. Construction of a Multi-Objective Rapid Prediction Model Based on ANN

Due to the limitations of the parameter setting mechanism in EnergyPlus software, specific parameters that significantly influence building AC energy consumption and thermal comfort cannot be varied continuously. Therefore, when these dynamic parameters are combined within their specified ranges to generate multiple operating conditions, these non-continuous variables inevitably result in ‘interval values’ that cannot be fully covered. Exploring optimisation strategies for building AC energy-saving and indoor thermal comfort is time-consuming and labour-intensive compared to traditional simulation methods. Therefore, it is necessary to construct a rapid prediction model with sufficient accuracy, based on the ‘decision variable—target variable’ mapping database established in Section 2.1.3. This approach reduces CPU runtime and human resource costs while addressing EnergyPlus’ limitations; EnergyPlus has difficulty simulating results directly when dynamic parameters are set to ‘interval values’.
According to the characteristic stage division of AC usage defined in Section 2.1.1, the following six stages are identified: mid-summer, early and late summer, late spring and early autumn, early spring and late autumn, early and late winter, and mid-winter, and rapid prediction models for each characteristic stage are developed with the corresponding dates representing the prediction cycle.
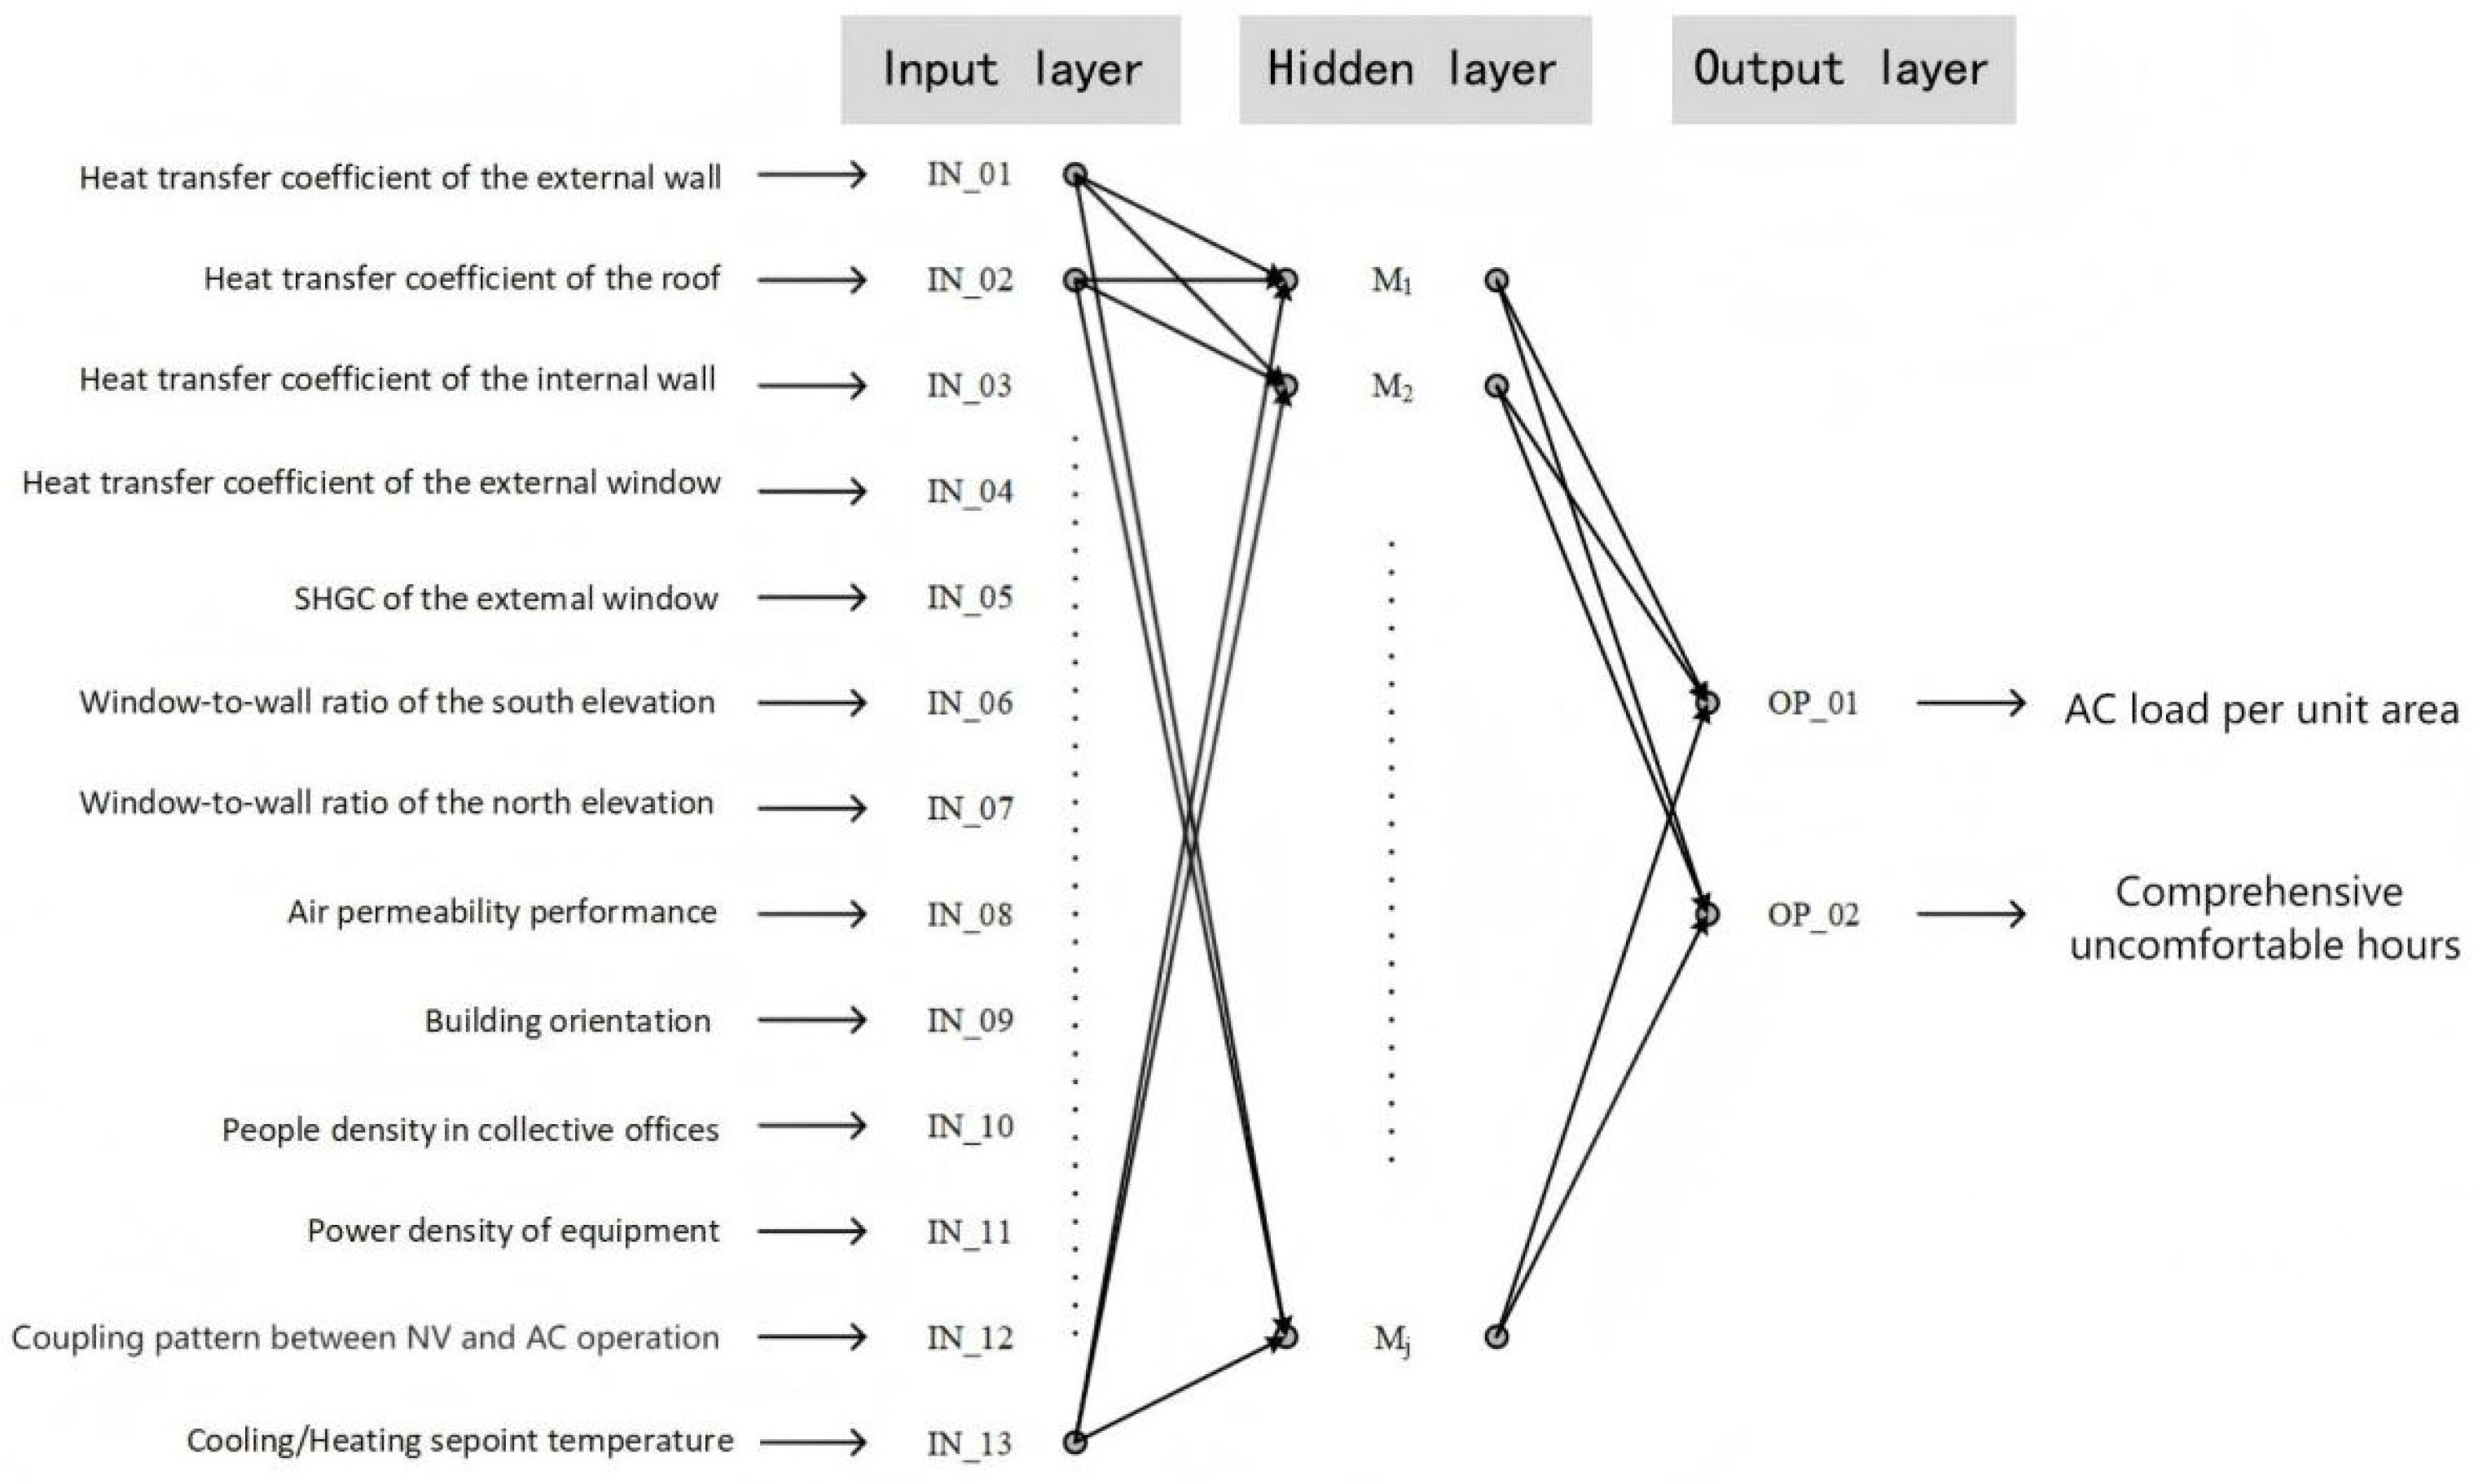
The prediction model is developed based on the BP neural network and consists of an input, hidden, and output layer. The input layer comprises 13 nodes, and the output layer comprises two nodes, corresponding to the 14 decision variables and two target variables shown in Table 3. Figure 2 shows the structural diagram of the neural network model.
According to Equation (3), the boundary values of the reference number of hidden layer nodes n1 are calculated. Trial calculations are performed starting from the minimum number of nodes, min(n1), and are gradually increased to the maximum number of nodes, max(n1). The relative error results of the test set after each training session are compared to select the optimal number of hidden layer nodes.
n 1 = n + m + a ,
where
n is the number of input nodes;
m is the number of output nodes;
a is a constant with a value between [1, 10].
Rapid prediction models are constructed based on the BP neural network for different characteristic stages of AC usage. The input and output variables and their functional mapping relationships are shown in Table 4. The influencing factors corresponding to input items 1 to 11 are derived from the building design scheme and internal disturbance elements. These values are consistent in the rapid prediction model for different characteristic stages, i.e., ∀i ∈ [1, 11], xi,H1 = xi,H2 = xi,H3 = xi,C1 = xi,C2 = xi,C3. However, the influence factors corresponding to input items 12 and 13 are derived from the adaptive behaviours. They take independent values within their respective ranges in the prediction models for different characteristic stages.
The study uses a BP neural network to develop a prediction model. JAVA SE 9 is applied as the programming language for the development platform. The BP neural network’s error tolerance is set to 1 × 10⁻⁵, and the Adam optimiser [39,40] is used for training. The maximum number of iterations is set to 2000.

2.3. Multi-Objective Optimisation Strategy Decision-Making Model Based on NSGA-II

Reducing AC energy consumption while improving indoor thermal comfort is a multi-objective minimisation problem, with building AC load per unit area and comprehensive uncomfortable hours as the optimisation targets.
This paper takes a naturally ventilated research building in a hot summer and cold winter climate zone in China as its case study. It explores AC energy-saving and thermal comfort optimisation strategies from three perspectives: passive optimisation strategies during the building design phase, behavioural optimisation strategies during the building operation phase, and integrated optimisation strategies considering both phases. It provides a specific technical chain for the multi-objective optimisation of similar buildings.

2.3.1. Proposal of the Fitness Function

(1)
Construction of the Fitness Function
This paper proposes a decision-making model to conserve AC energy while enhancing indoor thermal comfort. The model uses a fitness function to quantify energy consumption and thermal comfort performance in different operating conditions throughout the year. This provides a basis for accurately evaluating different optimisation strategies. The optimisation strategy for case building comprises the optimised values of various decision variables. Therefore, the fitness function is constructed based on the rapid prediction model developed in Section 2.2. The decision variables act as the independent variables, while the target variables (annual AC load per unit area and the comprehensive uncomfortable hours) act as the dependent variables.
While decision variables related to building design scheme and internal disturbance elements typically remain unchanged, occupants’ adaptive behaviour changes with climate variations across different characteristic stages of AC usage. Therefore, the values of the decision variables related to occupants’ adaptive behaviours vary within their respective ranges at each stage.
Equation (4) outlines the fitness function used to evaluate the target variables. The equation is based on the rapid prediction model’s fundamental information and functional mapping relations, as described in Table 4, and it employs the NSGA-II algorithm.
{ y 1 = y 1 , H 1 + y 1 , H 2 + y 1 , H 3 + y 1 , C 1 + y 1 , C 2 + y 1 , C 3 y 2 = y 2 , H 1 + y 2 , H 2 + y 2 , H 3 + y 2 , C 1 + y 2 , C 2 + y 2 , C 3 ,
where
y 1 is the total annual AC load per unit area of the case building;
y 2 is the annual comprehensive uncomfortable hours of the case building.
(2)
Range of Values for Decision Variables
In multi-objective optimisation problems, the range of values for the decision variables defines the space where optimisation strategies can be adjusted. This paper studies multi-objective optimisation strategies using the energy-saving renovation of a case building. As a result, certain variables must be fixed based on the actual characteristics of the case building, and the remaining decision variables must be searched for the optimal combination.
The main façade of the case building is oriented north–south, with a window-to-wall ratio of 0.4 for south and north elevations. The aforementioned default parameters remain unchanged. Referring to the typical values for internal disturbance elements provided in the appendix of the current Design standard for energy efficiency of public buildings (GB 50189-2015) [41], the people density in collective offices is set to 10 m2/person and the power density of equipment to 150 W/person.
The upper limits of the decision variables related to the building design scheme are based on the actual characteristics of the case building and a reference public building typical of a hot summer and cold winter climate zone in the 1980s. This consideration applies except for the building orientation and window-to-wall ratio of the north and south elevations. The lower limits are set under the thermal performance requirements for the building envelope specified in the Technical standard for nearly zero energy buildings (GB/T 51350-2019) [42]. The range is based on technical measures currently used for parameters not explicitly addressed by existing energy-saving regulations and standards. The decision variables and their corresponding ranges required to optimise AC energy savings and indoor thermal comfort in the case building are presented in Table 5.
(3)
Acquisition of Reference Values for Optimisation Objectives
To systematically evaluate the effectiveness of different optimisation strategies in improving energy conservation and indoor thermal comfort in the case building, this study conducts a comparative analysis based on the following standards and methods:
  • The thermal performance limits for building envelopes specified in the Design standard for energy efficiency of public buildings (GB 50189-2015) [41] and the Technical standard for nearly zero energy buildings (GB/T 51350-2019) [42] are used as the baseline;
  • The reference standards of occupants’ behaviour are based on the typical fixed schedule of 08:00–17:00 and the stochastic behavioural schedules generated with the method described in Section 2.1.1. The method was established in the preliminary research [37];
  • Based on the two types of building envelope structure and HVAC behavioural patterns, the AC load per unit area and the comprehensive uncomfortable hours of the case building are worked out by EnergyPlus simulation and calculation. Equation (5) transforms the total uncomfortable hours into a proportion of those hours to enable comparative analysis. As shown in Table 6, the optimisation target for comparative analysis is set using four typical reference points: B1, B2, B3, and B4.
    P u = i = 1 n S i · t i i = 1 n S i · k i ,
    where
    P u  is the proportion of uncomfortable hours;
    n is the number of air-conditioned rooms in the building;
    S i  is the area of the ith room;
    t i  is the simulated uncomfortable hours in the ith room;
    t i  is the number of hours occupied by occupants in the ith room.

2.3.2. Algorithm Implementation of the Decision-Making Model Based on NSGA-II

The paper utilises the JAVA platform to develop a decision-making model for multi-objective optimisation based on NSGA-II to improve energy conservation and indoor thermal comfort. The model features an interactive interface designed to meet user needs and includes the following functionality:
(1)
Evaluation of target variables;
(2)
Control of the range of values of decision variables;
(3)
Control of the range of values of target variables;
(4)
Configuration of NSGA-II parameters.
Applying the NSGA-II algorithm with a population size of N and only one iteration is equivalent to randomly sampling N solutions from the function space. As the number of iterations increases, the population continuously approaches the actual Pareto front, and the final Pareto solution set is typically considered the global optimum.
The paper employs the NSGA-II algorithm, repeatedly adjusting the population size and the number of iterations to obtain different distributions of the objective variable across the entire function space. Examining how the objective variable is distributed across various iterations helps determine the optimisation potential within the decision variable value range.

3. Results

3.1. Construction and Calibration of the Multi-Objective Rapid Prediction Model

This study employs a BP neural network to create a rapid prediction model for building AC energy consumption and indoor thermal comfort. Subsequently, it is used to propose a fitness function. This fitness function is closely related to various characteristic stages of AC usage. Notably, the input variables (particularly those relating to adaptive behaviours) vary independently across different stages. Consequently, it is essential to create independent rapid prediction models for each stage to accurately reflect the corresponding AC energy consumption and thermal comfort characteristics.
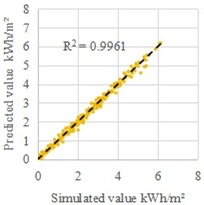
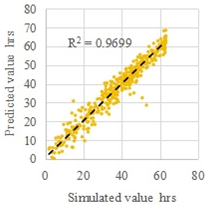
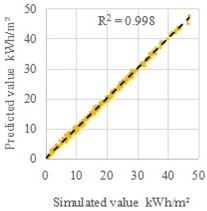
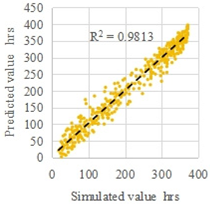
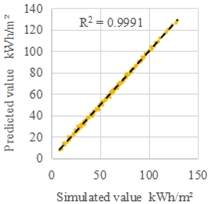
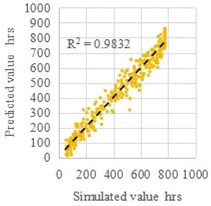
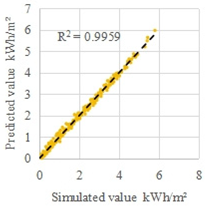
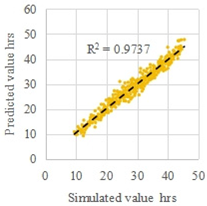
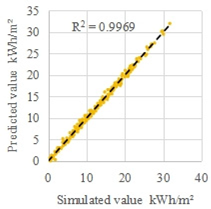
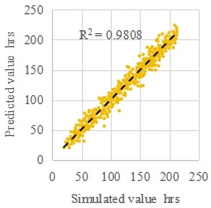
The ‘decision variable—target variable’ mapping database constructed in Section 2.1.3 trains six rapid prediction models using the BP neural network for different characteristic stages of AC usage, as described in Section 2.2. Table 7 displays the findings of the linear fitting of the predicted and simulated results. The mean relative error is calculated using Equation (6) for verification.
y = 1 N i = 1 N | x m x m | x m × 100 % ,
where
N is the total number of samples in the test set;
y is the mean relative error (MRE);
x m is the predicted AC load per unit area, or the predicted comprehensive uncomfortable hours, worked out by the rapid prediction model based on the input vector in the test set;
x m is the corresponding AC load per unit area, or comprehensive uncomfortable hours, of the input vector in the test set.
As shown in Table 7, the verification results of the multi-objective rapid prediction model indicate that at different characteristic stages of AC usage, the mean relative error for AC load per unit area is below 5%, while the mean relative error for comprehensive uncomfortable hours is under 10%. Consequently, the rapid prediction model developed in this study, based on the BP neural network, can accurately predict the case building’s AC energy consumption and indoor thermal comfort levels.

3.2. Construction of the Multi-Objective Optimisation Decision-Making Model

As outlined in Section 2.3, the study employs the JAVA platform to construct a multi-objective optimisation decision-making model for AC energy conservation and indoor thermal comfort, utilising the NSGA-II method. This model is the basis for analysing the case building, which is presented as an example. The resulting optimisation strategies are classified into three categories: passive, behavioural, and integrated optimisation strategies. Passive optimisation strategies are primarily applied during the building design phase. They optimise decision variables derived from the building design scheme, such as heat transfer coefficients of the exterior walls and the roofs, and air permeability performance. The goal is to reduce AC energy consumption and enhance thermal comfort. At the same time, decision variables related to the adaptive behaviours (such as cooling/heating setpoint temperatures and coupling pattern between NV and AC operation) remain fixed. Behavioural optimisation strategies focus on the building operation phase. These strategies aim to achieve energy-saving goals by optimising users’ HVAC behaviours while keeping decision variables related to the building design scheme unchanged. Integrated optimisation strategies combine passive and behavioural approaches, allowing for the simultaneous optimisation of decision variables associated with building design and adaptive behaviours. These strategies have proven effective for retrofitting existing buildings and designing new ones comprehensively, facilitating optimal energy savings and improved thermal comfort throughout a building’s entire lifecycle.
In the context of multi-objective optimisation strategies during the operation phase of buildings, the decision variables derived from adaptive behaviours are designated as independent variables, while those originating from the building design scheme are assigned as fixed values. While investigating integrated optimisation strategies, decision variables derived from the building design scheme and adaptive behaviours are designated as independent variables. The range of values for the decision variables is defined in Table 8. When applying the aforementioned decision-making model to actual scheme decision-making, upper and lower limits can be assigned to the values of the decision variables. These limits can be adjusted based on each item’s optimisation potential and economic costs.

4. Discussion

4.1. Generation of Behavioural Optimisation Strategies Based on the Decision-Making Model

This section explores multi-objective behavioural optimisation strategies. Consequently, the decision variables associated with this process are designated independent variables, while those derived from the building design scheme are assigned as fixed values.
This section references the building’s actual conditions, baseline conditions in the 1980s, baseline conditions in the 2000s, standard conditions from the 2015 edition of the ‘Design standard for energy efficiency of public buildings (GB 50189)’ [41], and high and low standard conditions from the ‘Technical standard for nearly zero energy buildings (GB/T 51350-2019)’ [42]. The use of these references is essential in establishing six typical operating conditions. Subsequently, these conditions assess the potential for AC energy conservation and thermal comfort optimisation of the case building under behavioural strategies. The fixed values of the decision variables derived from the building design scheme corresponding to these six operating conditions are shown in Table 9.
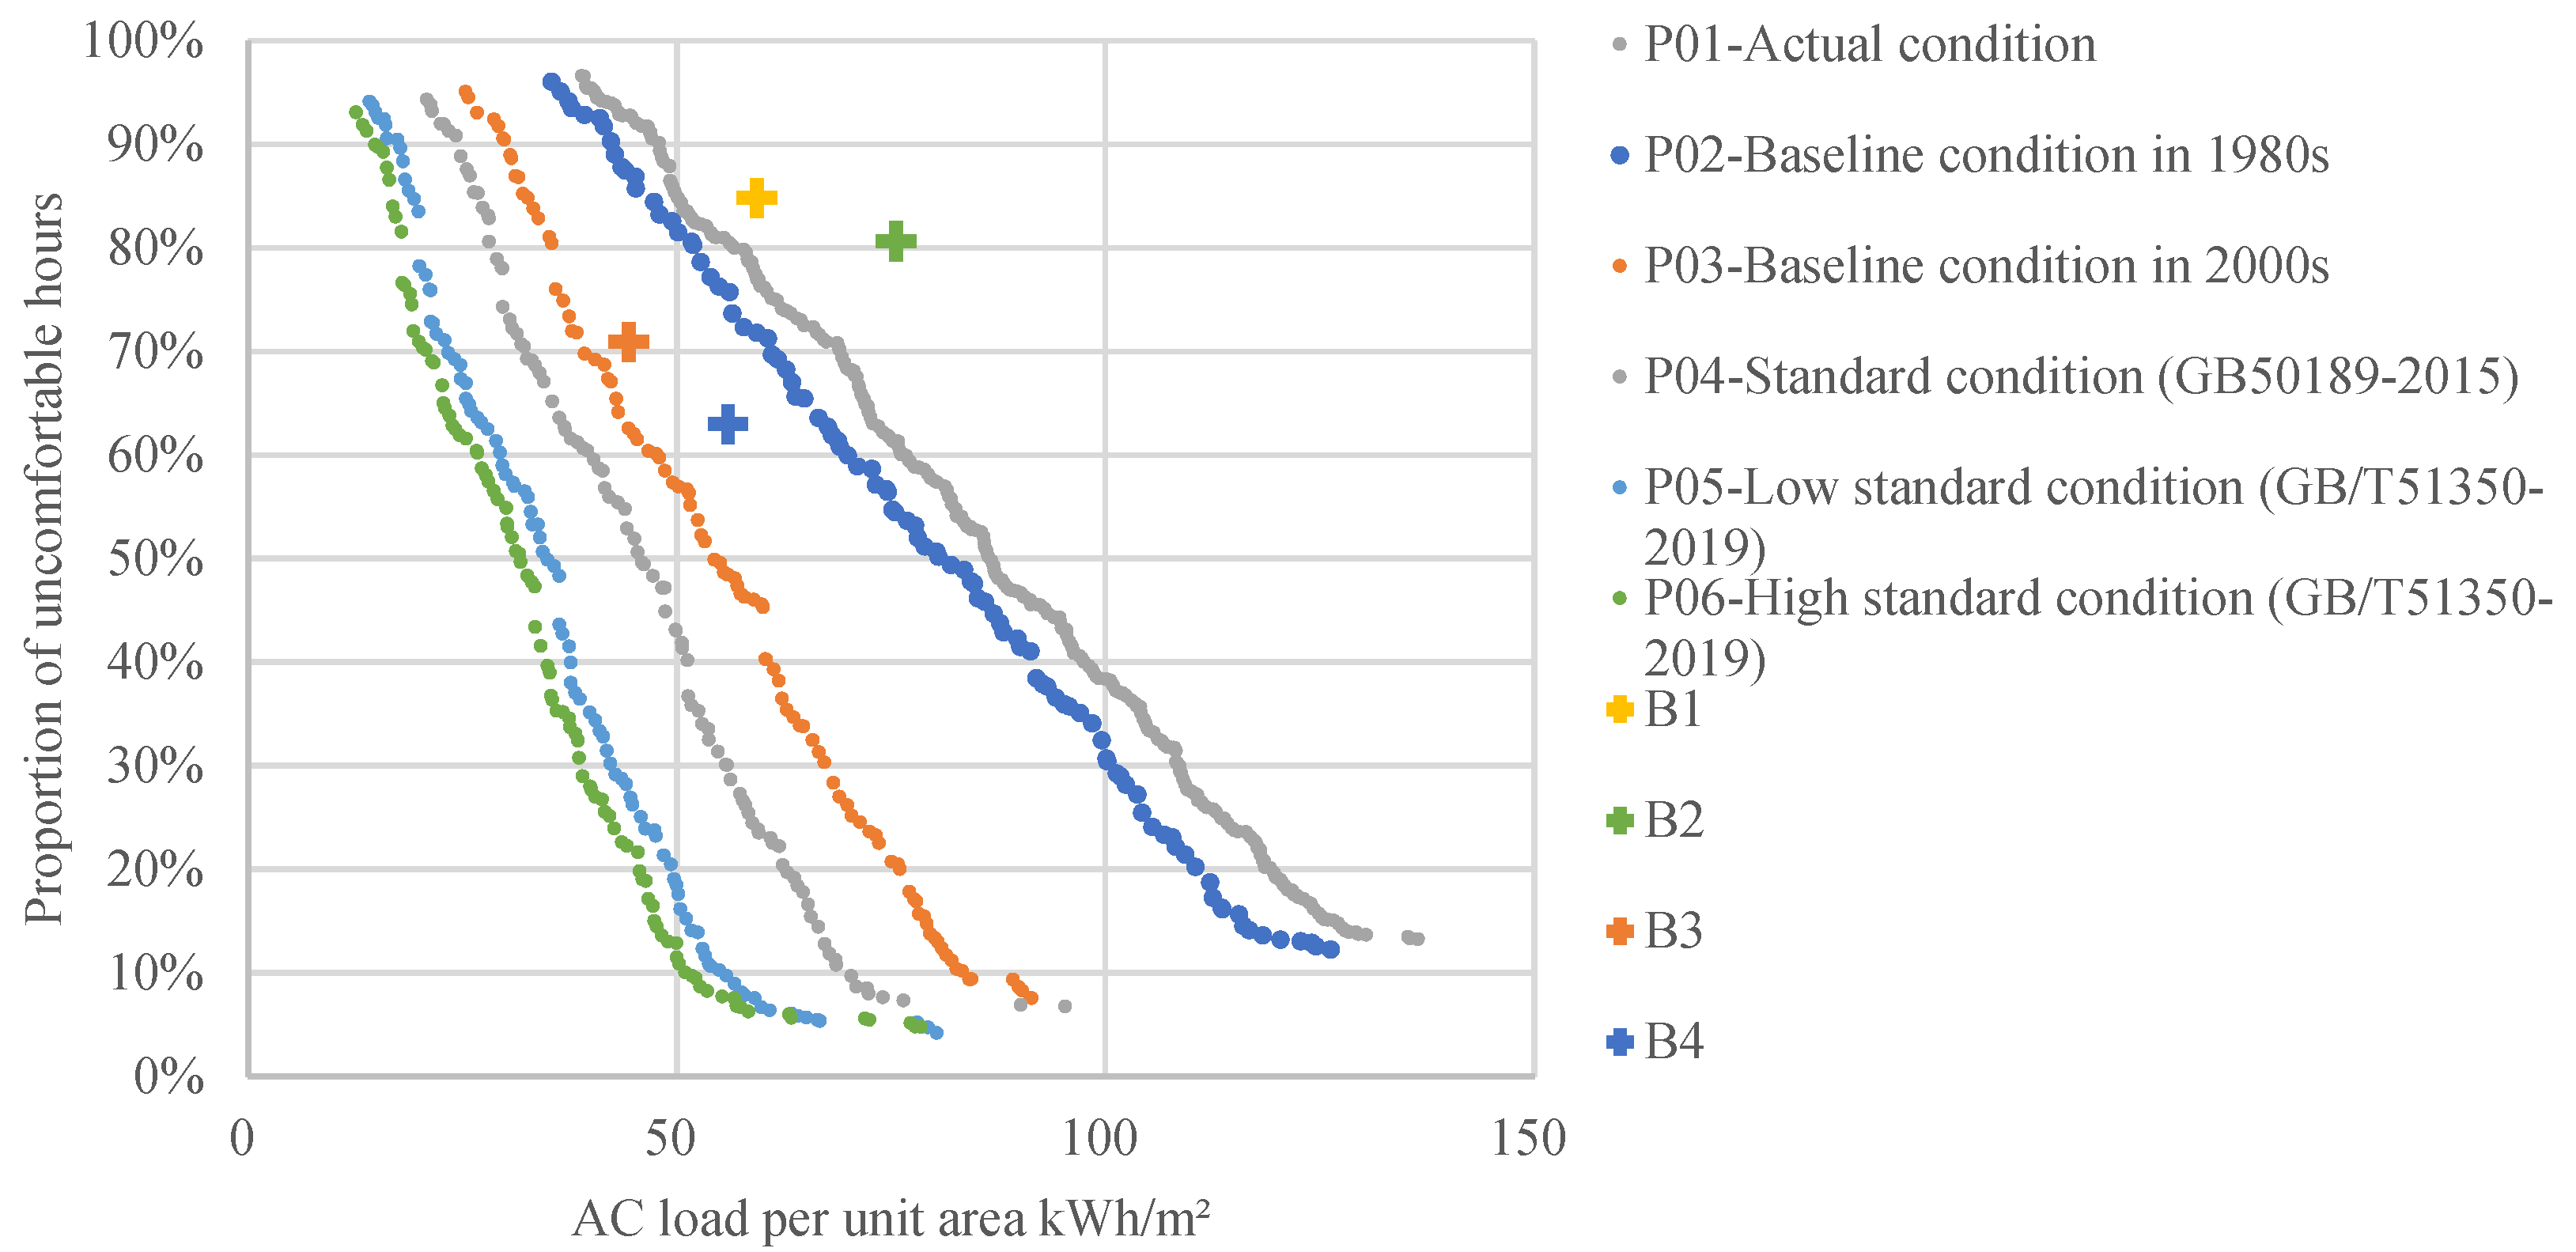
In implementing the behavioural optimisation strategy, only two decision variables are utilised as independent variables: the coupling pattern between NV and AC operation and the cooling/heating setpoint temperature. The values of these two variables vary across the six characteristic stages of AC usage, resulting in the execution of distinct behavioural strategies for each stage, as opposed to their consistent application within the computational cycle. The multi-objective optimisation decision-making model using the NSGA-II algorithm is executed multiple times with various population sizes and iteration counts. This approach aims to assess the optimisation potential of the target variables while implementing a behavioural optimisation strategy across six typical operating conditions, as shown in Figure 3.
Table 5 illustrates how the optimisation potential of behavioural strategies varies under six typical operating conditions and across four reference points. It has been demonstrated that in the actual condition P01 and the baseline condition P02, the behavioural strategies can be employed to achieve the optimisation targets of reference points B1 and B2. However, they cannot exert dominance over reference points B3 and B4. In the standard conditions P03, P04, P05, and P06, the behavioural strategies can achieve the optimisation objectives of reference points B1, B2, B3, and B4. In each typical operating condition, the implementation effectiveness of the behavioural optimisation strategies is analysed with reference points as optimisation objectives. The quantitative characterisation of the optimisation potential of the target variables is shown in Table 10.
Among the six typical operating conditions, P04 indicates the thermal performance limits for building envelopes in current public buildings, as specified in the Design standard for energy efficiency of public buildings (GB 50189-2015) [41]. It is a widely utilised metric in the design of such buildings. This study thus employs the P04 condition as a case study, assuming that the primary optimisation objective is to ensure indoor thermal comfort. By analysing the Pareto frontier, optimal strategies can be obtained for different thermal comfort levels. Furthermore, the relationships between these optimal solutions and the four optimisation reference points can be identified. This study employs 10% intervals to explore optimal strategies for maximising AC energy savings through behavioural modification at different thermal comfort levels, specifically when the case building is in P04 conditions, as shown in Table 11.
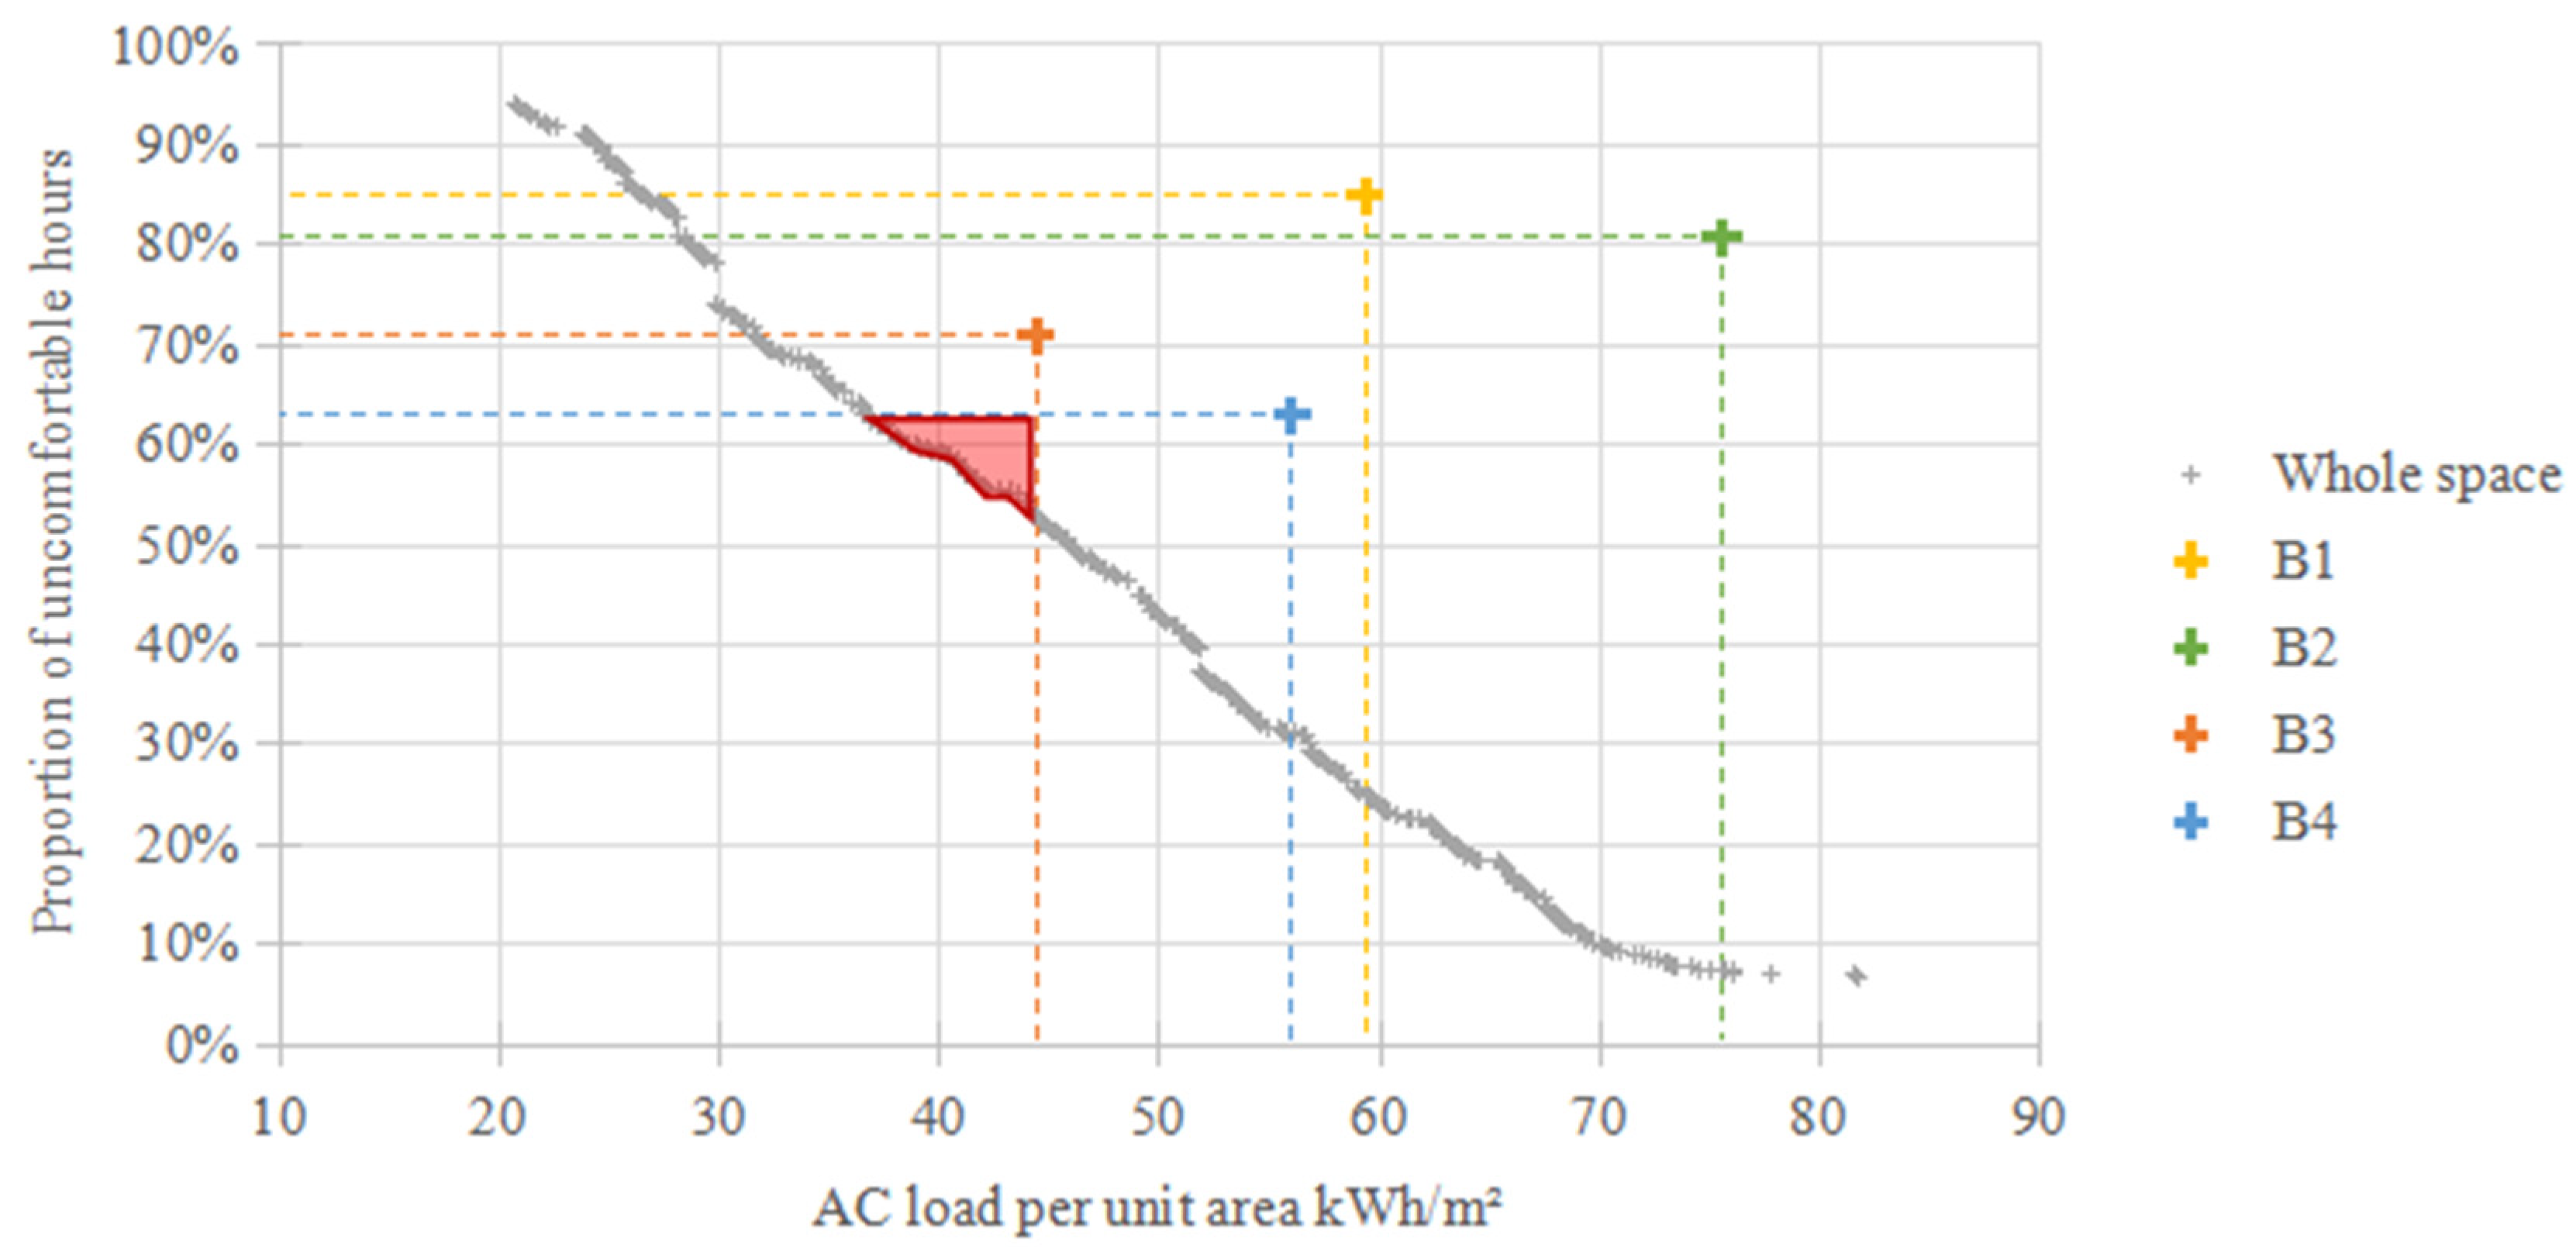
As illustrated in Table 11, the dominance relationship between the optimal strategy and the four reference points varies depending on the optimisation objective. In the P04 operating condition, the appropriate behavioural strategy can dominate all four reference points. This means the target variables should ensure that the AC load per unit area does not exceed 44.37 kWh/m2, and the proportion of uncomfortable hours remains below 63.00%. The area of the function space where these target variables meet the requirements is highlighted in red in Figure 4. Executing the multi-objective decision-making model based on the NSGA-II algorithm is essential to clarify the solution set within this function space. The optimisation objectives are defined by controlling the range of values for the target variables. We modify the population size and iteration number to conduct multiple calculations, and Table 12 presents the portion of the behavioural strategies that satisfy these objectives.
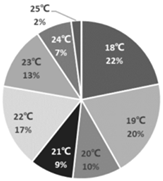
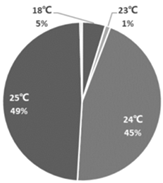
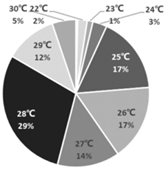
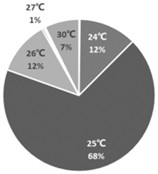
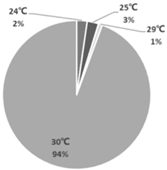
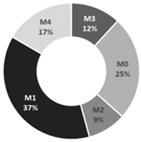
Decision-making models and multiple rounds of iteration allowed the identification of 481 non-overlapping solutions within the optimisation objective range (as shown by the red area in Figure 4). Each solution represents a distinct behavioural optimisation strategy. The numerical distribution of these target variable solutions is summarised and analysed, providing insights into the characteristics of the optimised value for two decision variables derived from adaptive behaviours at different characteristic stages of AC usage. These characteristics are demonstrated in Table 13 and Table 14.
The AC system’s set temperature is limited in different characteristic stages of AC usage to achieve the optimisation objective of simultaneously dominating four reference points. In heating conditions, air conditioning should be set to the following temperatures: 19–23 °C during the late autumn and early spring, 18–24 °C during the early and late winter, and 24–25 °C during the mid-winter stage. In cooling conditions, air conditioning should be adjusted to these temperatures: 25–29 °C during late spring and early autumn, 24–26 °C during early and late summer, and 30 °C during mid-summer.
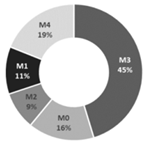
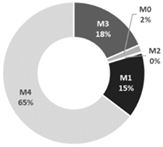
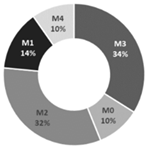
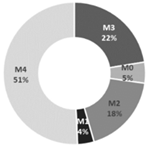
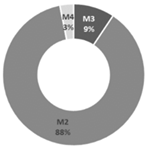
In order to meet the optimisation objectives of simultaneously dominating four reference points, the suitability of different coupling patterns between NV and AC operation varies at different characteristic stages of AC usage. In heating conditions, the M1 pattern (fixed ventilation in the morning) is recommended during the late autumn and early spring, the M3 pattern (opposition all-day) is recommended during the early and late winter, and the M4 pattern (opposition overnight) is recommended during the mid-winter stage. In cooling conditions, the M3 or M2 pattern (fixed ventilation overnight) is recommended during late spring and early autumn, the M4 pattern is recommended during early summer and late summer, and the M2 pattern is recommended during mid-summer.

4.2. Generation of Integrated Optimisation Strategies Based on the Decision-Making Model

Behavioural optimisation strategies involve exploring the optimal combinations of stochastic HVAC behaviours while maintaining fixed thermal performance conditions of the building envelope. The focus is on behavioural management during the case building’s operational phase. When implementing integrated optimisation strategies, the objective is to identify the optimal solutions for the thermal performance of the building envelope during the design phase and to encourage behavioural adjustments from occupants during the operational phase. Consequently, all decision variables derived from the building design scheme and the adaptive behaviours are considered independent variables. The parameters under consideration are as follows: the heat transfer coefficient of the external wall, the roof, the internal wall, and the external window; the solar heat gain coefficient (SHGC) of the external window; air permeability performance; and the coupling pattern between NV and AC operation. The ranges of values for decision variables are defined in Table 8.
To explore integrated optimisation strategies, it is necessary first to establish specific optimisation objectives. For instance, the coordinates of a reference point (C) can be defined as (xC, yC) with the optimisation objective tailored according to this reference point. Configuring different population sizes and iteration numbers is possible based on different control ranges within the target variable’s value domain. As demonstrated, integrated optimisation strategies that meet these objectives can be obtained by repeatedly utilising the multi-objective optimisation decision-making model based on the NSGA-II algorithm.
This study adopts the annual AC load per unit area corresponding to reference point C as the AC energy-saving target and investigates optimisation strategies for indoor thermal comfort at the corresponding AC energy consumption level. Therefore, the range of the target variable, the annual AC load per unit area (OP_01), is controlled, while the comprehensive uncomfortable hours (OP_02) range remains unrestricted. Specifically, the upper limit of the AC load per unit area, max_OP_01, is set to (xC + k), and the lower limit, min_OP_01, is set to (xC − k). It is crucial to note that the upper and lower limits must be distinct; hence, they are set to similar but different values, with k defined as necessary for the solution.
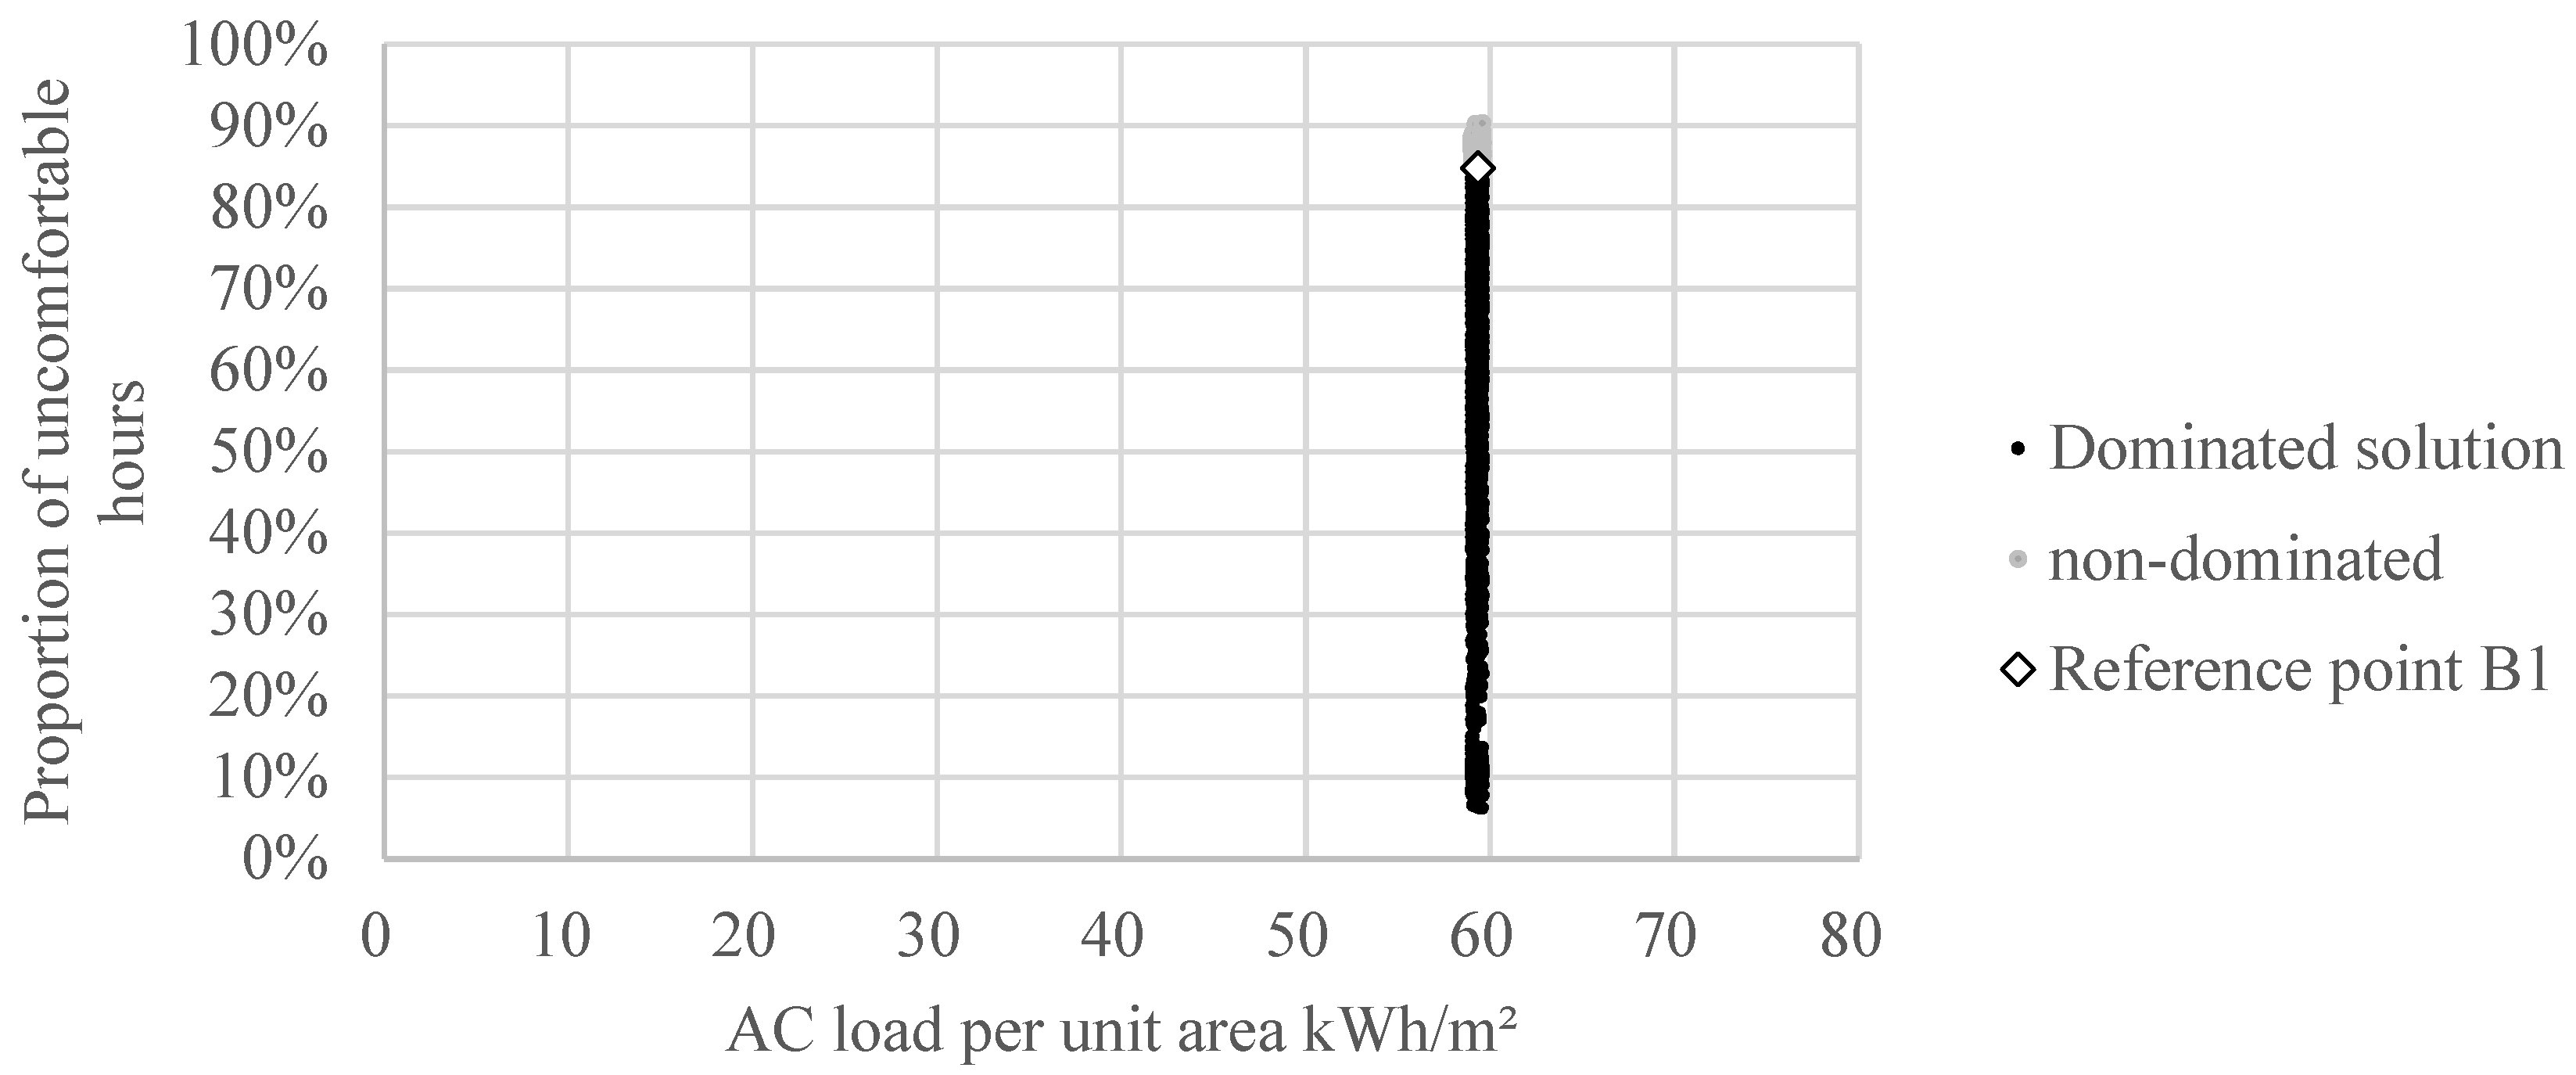
Taking reference point B1 in the optimisation objective as an example, a value is designated to reference point C. The annual AC load per unit area corresponding to B1 is 59.33 kWh/m2; therefore, OP_01 is assigned the value of 59.33 kWh/m2. With k1 defined as 0.5, the upper and lower bounds of the target variable domain are adjusted as follows: max_OP_01 = −59.83, min_OP_01 = 58.83, max_OP_02 = 2000, and min_OP_02 = 0. The optimisation potential of the integrated optimisation strategy that can dominate reference point B1 is demonstrated in Figure 5 under this optimisation objective.
Under the optimisation objective, implementing integrated strategies will achieve the optimal indoor thermal comfort level, characterised by a proportion of uncomfortable hours of 6.23%. As shown in Table 15, delineating disparate thermal comfort optimisation objectives at 10% intervals achieves the integrated optimisation strategies for distinct thermal comfort levels.
Establishing clear optimisation objectives, implementing a multi-objective optimisation decision-making model based on the NSGA-II algorithm for building AC energy consumption and indoor thermal comfort, and deriving integrated strategies that meet these optimisation objectives are all possible. This model provides a framework for designing the thermal performance of building envelopes during the building design phase and managing occupants’ HVAC behaviour during the building operation phase.

5. Conclusions

The paper focuses on constructing and applying a multi-objective optimisation decision-making model for AC energy consumption and indoor thermal comfort. A stochastic prediction model of HVAC behaviour has been developed, and the influencing factors have been identified through preliminary studies. Based on these findings, the paper proposes a multi-objective optimisation decision-making model. The model aims to provide scientific foundations and practical tools for the AC energy conservation and thermal comfort optimisation strategies for naturally ventilated research buildings in China’s hot summer and cold winter climate zones.
(1)
Take the case building as an example. A rapid prediction model for building air conditioning (AC) energy consumption and indoor thermal comfort was constructed based on a BP neural network. Using important influencing factors of the target variables as decision variables, the model efficiently and accurately predicts the AC load per unit area and the comprehensive uncomfortable hours for the case building under the various operating scenarios, providing data support for multi-objective optimisation decision-making.
(2)
A multi-objective optimisation decision-making model regarding AC energy consumption and indoor thermal comfort was constructed. Implementing the model generates passive optimisation strategies for the design phase, behavioural optimisation strategies for the operational phase, and integrated optimisation strategies for both phases of the case building. Furthermore, it can output corresponding strategy combinations based on predefined optimisation objectives, providing a scientific basis for building energy retrofitting and operational management.
(3)
Research was conducted on the application of multi-objective optimisation decision-making models, examining behavioural and integrated optimisation strategies under different operating conditions:
  • The P04 operating condition, as outlined in the current Design standard for energy efficiency of public buildings, serves as a case study. Substantial AC energy savings and improvements in thermal comfort can be realised by adjusting the stage-based cooling/heating setpoint temperature and the coupling pattern between NV and AC operations. This has led to meeting the optimisation objectives for B1, B2, B3, and B4. Additionally, it has been demonstrated that reducing AC energy consumption to 40.7 kWh/m2 is possible while reducing the proportion of uncomfortable hours to 53%.
  • Utilising B1 as the reference point, the multi-objective optimisation decision-making model regulates AC energy consumption limits. It combines passive and behavioural strategies to create integrated optimisation strategies for varying indoor thermal comfort levels. Consequently, the proportion of uncomfortable hours has been reduced to 6.23%.
However, the study does have limitations. These primarily involve the lack of general applicability of the multi-objective optimisation decision-making model, the incompleteness of the behaviour prediction model, the overlooking of the impact of individual temperature regimes on indoor setpoint temperature, and the absence of a practical value assessment of the optimisation strategy. First, the model mainly focuses on small and medium-sized research buildings in specific regions, necessitating improvements to its general applicability. Second, the behaviour prediction model does not adequately consider the various occupant behaviour patterns, such as spatial movement and clothing adjustment, which impact accuracy. Third, the setpoint temperatures of all AC zones are set as a single uniform variable, resulting in consistent target temperatures across all rooms and disregarding the differentiated thermal environment needs of different individuals. Finally, the optimisation strategies lacked a cost–benefit analysis, limiting their feasibility in practical applications.
Future work will take three approaches to address these limitations. First, the model’s applicability will be expanded to cover more regions and building types, and in-depth research will be conducted on the behavioural characteristics of different users. Second, improving the accuracy of behavioural prediction models requires capturing the diversity of user behaviour through a broader range of actual measurement data. Third, for different AC zones, separate variables for cooling/heating setpoint temperatures will be established, and variables for PMV thermal comfort range limits will be added, aiming to achieve differentiated control of indoor thermal requirements. Finally, cost analysis will be incorporated into evaluating optimisation strategies to ensure their economic feasibility and practical value. This will provide more comprehensive guidance for practical applications.

Author Contributions

Conceptualisation, J.W.; methodology, S.C.; software, J.W.; validation, R.Q. and J.W.; formal analysis, X.Y.; investigation, R.Q.; resources, X.Y.; data curation, J.W. and S.C.; writing—original draft, J.W.; writing—review and editing, X.Y. and R.Q.; visualisation, J.W. and X.Z.; supervision, X.Y.; project administration, S.C.; funding acquisition, J.W. and X.Z. All authors have read and agreed to the published version of the manuscript.

Funding

This research was supported by the Hangzhou Joint Fund of the Zhejiang Provincial Natural Science Foundation of China under Grant No. LHZY24A010003, the University Cultivation Fund of the Hangzhou City University under Grant No. J-202311, the 2023 Zhejiang Provincial Department of Education General Research Project under Grant No. Y202351545, and the Key Research Project in the Fields of High-end Equipment, New Materials, and Green Energy in Hangzhou under Grant No. 2023SZD0070.

Data Availability Statement

The data presented in this study are available on request from the corresponding author.

Conflicts of Interest

The authors declare no conflicts of interest.

References

  1. Tsinghua University, Building Energy Research Center. Annual Research Report on Building Energy Efficiency in China: Public Buildings; China Architecture & Building Press: Beijing, China, 2022. [Google Scholar]
  2. Tsinghua University, Building Energy Research Center. Annual Research Report on Building Energy Efficiency in China: Urban Residential Buildings; China Architecture & Building Press: Beijing, China, 2023. [Google Scholar]
  3. Dang, Y.C.; Yao, J. Multi-Objective Optimization Study of Residential Energy Consumption Based on Edh and the Stochastic Operation of Air Conditioning. J. Green Build. 2024, 19, 195–220. [Google Scholar] [CrossRef]
  4. Zhang, L.; Zhong, B. Partition-based building energy analysis and optimization of energy conservation. In Proceedings of the 1st International Conference on Computational Intelligence, Theory, Systems and Applications (CCITSA), Shanghai, China, 24–27 August 2015; pp. 171–176. [Google Scholar] [CrossRef]
  5. Ding, C.; Zhou, N. Using residential and office building archetypes for energy-efficiency solutions in an Urban Scale: A China Case Study. Energies 2020, 13, 3210. [Google Scholar] [CrossRef]
  6. Carlucci, S.; Pagliano, L. A review of indices for the long-term evaluation of general thermal comfort conditions in buildings. Energy Build. 2012, 53, 194–205. [Google Scholar] [CrossRef]
  7. Balbis-Morejón, M.; Rey-Hernández, J.M.; Amaris-Castilla, C.; Velasco-Gómez, E.; San José-Alonso, J.F.; Rey-Martínez, F.J. Experimental study and analysis of thermal comfort in a university campus building in tropical climate. Sustainability 2020, 12, 8886. [Google Scholar] [CrossRef]
  8. Tian, X.-Y.; Liu, W.-W.; Liu, J.-W.; Yu, B.; Zhang, J. Effects of personal heating on thermal comfort: A review. J. Cent. South Univ. 2022, 29, 2279–2300. [Google Scholar] [CrossRef]
  9. Shakeel, H.M.; Iram, S.; Hill, R.; Farid, H.M.A.; Sheikh-Akbari, A.; Saleem, F. A machine learning-based intelligent framework for predicting energy efficiency in next-generation residential buildings. Buildings 2025, 15, 1275. [Google Scholar] [CrossRef]
  10. Al-Tamimi, N. Passive design strategies for energy-efficient buildings in the Arabian desert. Front. Built Environ. 2022, 7, 805603. [Google Scholar] [CrossRef]
  11. Duan, Y.; Zhang, T.; Yang, Y.; Li, P.; Mo, W.; Jiao, Z.; Gao, W. A multi-objective approach to optimizing the geometry and envelope of rural dwellings for energy demand, thermal comfort, and daylight in cold regions of China: A case study of Shandong province. Energy Convers. Manag. 2024, 322, 119128. [Google Scholar] [CrossRef]
  12. Yaman, G.Ö. Determination of optimum passive design parameters for industrial buildings in different climate zones using an ANN–PSO energy-performance optimization model. Sustainability 2025, 17, 2357. [Google Scholar] [CrossRef]
  13. Xu, S.; Chen, Y.Z.; Liu, J.L.; Kang, J.; Gao, J.F.; Qin, Y.C.; Tan, W.J.; Li, G.M. Comprehensive improvement of energy efficiency and indoor environmental quality for university library atrium—A multi-objective fast optimization framework. Front. Archit. Res. 2025, 14, 449–470. [Google Scholar] [CrossRef]
  14. Hosamo, H.H.; Tingstveit, M.S.; Nielsen, H.K.; Svennevig, P.R.; Svidt, K. Multi-objective optimization of building energy consumption and thermal comfort based on integrated BIM framework with machine learning-NSGA II. Energy Build. 2022, 277, 112479. [Google Scholar] [CrossRef]
  15. Shao, T.; Zheng, W.X.; Zhang, K. Research on the establishment of rural house optimal design pattern in northwest cold region under multi-objective conditions. J. Therm. Sci. Technol. 2024, 23, 300–310. [Google Scholar] [CrossRef]
  16. Song, L.W. Performance optimization of high-rise residential buildings in cold regions considering energy consumption. Discov. Appl. Sci. 2025, 7, 105. [Google Scholar] [CrossRef]
  17. Wang, A.; Xiao, Y.; Liu, C.; Zhao, Y.; Sun, S. Multi-objective optimization of building energy consumption and thermal comfort based on SVR-NSGA-II. Case Stud. Therm. Eng. 2024, 50, 105368. [Google Scholar] [CrossRef]
  18. Liu, M.; Que, Y.F.; Yang, N.X.; Yan, C.Y.; Liu, Q.B. Research on Multi-Objective Optimization Design of University Student Center in China Based on Low Energy Consumption and Thermal Comfort. Energies 2024, 17, 2082. [Google Scholar] [CrossRef]
  19. Liu, X.B.; Wu, Y.Y.; Wu, H. Enhancing HVAC energy management through multi-zone occupant-centric approach: A multi-agent deep reinforcement learning solution. Energy Build. 2024, 303, 113770. [Google Scholar] [CrossRef]
  20. Li, W.; Koo, C.; Hong, T.; Oh, J.; Cha, S.H.; Wang, S.W. A novel operation approach for the energy efficiency improvement of the HVAC system in office spaces through real-time big data analytics. Renew. Sustain. Energy Rev. 2020, 127, 109885. [Google Scholar] [CrossRef]
  21. Ao, J.Y.; Du, C.Q.; Jing, M.Y.; Li, B.Z.; Chen, Z.Y. A method of integrating air-conditioning usage models into building simulations for predicting residential cooling energy consumption. Buildings 2024, 14, 2026. [Google Scholar] [CrossRef]
  22. Yao, J. Modelling and simulating occupant behaviour on air conditioning in residential buildings. Energy Build. 2018, 175, 1–10. [Google Scholar] [CrossRef]
  23. Virote, J.; Neves-Silva, R. Stochastic models for building energy prediction based on occupant behavior assessment. Energy Build. 2012, 53, 183–193. [Google Scholar] [CrossRef]
  24. Uddin, M.N.; Wei, H.-H.; Chi, H.L.; Ni, M. Influence of occupant behavior for building energy conservation: A systematic review study of diverse modeling and simulation approach. Buildings 2021, 11, 41. [Google Scholar] [CrossRef]
  25. Diao, L.; Sun, Y.; Chen, Z.; Chen, J. Modeling energy consumption in residential buildings: A bottom-up analysis based on occupant behavior pattern clustering and stochastic simulation. Energy Build. 2017, 147, 47–66. [Google Scholar] [CrossRef]
  26. Fabi, V.; Andersen, R.K.; Corgnati, S. Verification of stochastic behavioural models of occupants’ interactions with windows in residential buildings. Build. Environ. 2015, 94, 394–404. [Google Scholar] [CrossRef]
  27. Ren, X.; Yan, D.; Hong, T. Air-conditioning usage conditional probability model for residential buildings. Energy Build. 2020, 206, 109571. [Google Scholar] [CrossRef]
  28. Luo, M.H.; Jiang, K.Y.; Wang, J.L.; Feng, W.; Ma, L.; Shi, X.D.; Zhou, X. Data-driven thermal preference prediction model with embodied air-conditioning sensors and historical usage behaviors. Build. Environ. 2022, 220, 109269. [Google Scholar] [CrossRef]
  29. Chen, S.; Zhang, H.; Pan, Y.; Zhang, X.; Fang, F. Research on simulation methodology of stochastic usage behavior of air conditioners in residential buildings by agent-based modeling. Build. Sci. 2017, 33, 37–44. [Google Scholar]
  30. Zhang, Z.C.; Yao, J.; Zheng, R.Y. Multi-objective optimization of building energy saving based on the randomness of energy-related occupant behavior. Sustainability 2024, 16, 1935. [Google Scholar] [CrossRef]
  31. Li, R.; Shari, Z.; Ab Kadir, M.Z.A. A Review of Multi-objective Optimization Research on Building Performance from the Perspective of Bibliometric Analysis. Energy Build. 2024, 11, e42480. [Google Scholar] [CrossRef]
  32. Jeong, B.; Kim, J.; Ma, Z.; Cooper, P.; de Dear, R. Identification of environmental and contextual driving factors of air-conditioning usage behaviour in Sydney residential buildings. Buildings 2021, 11, 122. [Google Scholar] [CrossRef]
  33. Azar, E.; O’Brien, W.; Carlucci, S.; Hong, T.; Sonta, A.; Kim, J.; Andargie, M.S.; Abuimara, T.; El Asmar, M.; Jain, R.K.; et al. Simulation-aided occupant-centric building design: A critical review of tools, methods, and applications. Energy Build. 2020, 224, 110292. [Google Scholar] [CrossRef]
  34. Hamed, M.M.; Alkhreasha, A.; Alshaer, A.; Olabi, A.G. Promoting sustainable development goals through energy-related behaviors of household occupants: Fostering sustainable energy solutions in developing countries. Renew. Sustain. Energy Rev. 2025, 213, 115511. [Google Scholar] [CrossRef]
  35. Haidar, N.; Tamani, N.; Ghamri-Doudane, Y.; Bouju, A. Towards a new graph-based occupant behavior modeling in smart buildings. In Proceedings of the 15th International Wireless Communications & Mobile Computing Conference (IWCMC), Tangier, Morocco, 24–28 June 2019; pp. 1413–1418. [Google Scholar] [CrossRef]
  36. Xiang, J.; Liu, H.; Li, X.; Jones, P.; Perisoglou, E. Multi-objective optimization of ultra-low energy housing in the hot-summer cold-winter climate zone of China based on a probabilistic behavioral model. Buildings 2023, 13, 1172. [Google Scholar] [CrossRef]
  37. Wu, J.J.; Chen, S.Q.; Ying, X.Y.; Shu, J.B. Influencing Factors on Air Conditioning Energy Consumption of Naturally Ventilated Research Buildings Based on Actual HVAC Behaviours. Buildings 2023, 13, 2710. [Google Scholar] [CrossRef]
  38. ANSI/ASHRAE Standard 55-2017; Thermal Environmental Conditions for Human Occupancy. American Society of Heating, Refrigerating and Air-Conditioning Engineers (ASHRAE): Atlanta, GA, USA, 2017.
  39. Feng, Y.; Li, Y. An Overview of Deep Learning Optimization Methods and Learning Rate Attenuation Methods. Hans J. Data Min. 2018, 8, 186–200. [Google Scholar] [CrossRef]
  40. Kingma, D.P.; Ba, J. Adam: A Method for Stochastic Optimization. In Proceedings of the 3rd International Conference on Learning Representations (ICLR), San Diego, CA, USA, 7–9 May 2015. [Google Scholar]
  41. GB 50189-2015; Design Standard for Energy Efficiency of Public Buildings. China Architecture & Building Press: Beijing, China, 2015.
  42. GB/T 51350-2019; Technical Standard for Nearly Zero Energy Buildings. China Standards Press: Beijing, China, 2019.
Figure 1. The research technical route.
Energies 18 06130 g001
Figure 2. BP neural network model structure.
Energies 18 06130 g002
Figure 3. Optimisation potential of target variables under behavioural optimisation strategies controlled for typical operating conditions.
Energies 18 06130 g003
Figure 4. The function space of target variables dominating the four reference points in the P04 operation condition.
Energies 18 06130 g004
Figure 5. Optimisation potential of the integrated optimisation based on the AC energy consumption of the reference point B1.
Energies 18 06130 g005
Table 1. Characteristic stage division of AC usage [37].
Characteristic Stages of AC UsageDuration Date
Cooling seasonMid-summer21 June~10 September
Early and late summer11 May~20 June
11 September~30 September
Late spring and early autumn21 April~10 May
1 October~20 October
Transitional period11 April~20 April
21 October~31 October
Heating seasonEarly spring and late autumn1 November~20 November
21 March~10 April
Early and late winter11 February~20 March
21 November~10 December
Mid-winter11 December~10 February
Table 2. The description of coupling patterns between NV and AC operation.
Coupling PatternFeature Description
M0A default pattern, reflecting the actual operational characteristics of AC and NV operation.
M1Fixed ventilation in the morning: From 8:00 to 9:00, regardless of whether the air conditioner is on or off, the exterior windows are opened for a fixed period
M2Fixed ventilation overnight: From 17:00 to 8:00 the following day, regardless of whether the air conditioner is on or off, the exterior windows are open for a fixed period.
M3Opposition all day: The opening status of exterior windows and air conditioning is always in opposition between 0:00 and 24:00.
M4Opposition overnight: From 17:00 to 8:00 the following day, the opening status of exterior windows and air conditioning is always in opposition; from 8:00 to 17:00, regardless of whether the air conditioner is on or off, the exterior windows remain closed.
Table 3. Decision variables and their relative importance [37].
CodeDecision VariableUnitRelative Importance of AC Energy ConsumptionRelative Importance of Thermal Comfort
1Cooling setpoint temperature°C100.0%100.0%
2Air permeability performanceach67.0%4.7%
3Heating setpoint temperature°C46.6%33.7%
4People density in collective officesm2/person17.3%0.3%
5Coupling pattern between NV and AC operation-7.8%0.9%
6SHGC of the external window-4.5%2.8%
7Power density of equipmentW/person2.9%1.0%
8Heat transfer coefficient of the external wallW/(m2·K)2.5%1.4%
9Heat transfer coefficient of the external windowW/(m2·K)1.8%0.8%
10Heat transfer coefficient of the roofW/(m2·K)1.5%1.3%
11Window-to-wall ratio of the south elevation-1.3%0.7%
12Window-to-wall ratio of the north elevation-1.2%0.5%
13Heat transfer coefficient of the internal wallW/(m2·K)0.9%0.9%
14Building orientation°0.8%0.7%
Table 4. Inputs, outputs, and function mapping relationships of the rapid prediction model at each characteristic stage of AC usage.
Characteristic Stages of AC UsageCodeInputAC Load per Unit AreaComprehensive Uncomfortable Hours
OutputFunction Mapping
Relationship
OutputFunction Mapping Relationship
Late spring and early autumnC1xi,C1,
i ∈ [1, 13]
y1,C1y1,C1 = FC1(x1,C1,x2,C1,…,x13,C1)y2,C1y2,C1 = PC1(x1,C1,x2,C1,…,x13,C1)
Early and late summerC2xi,C2,
i ∈ [1, 13]
y1,C2y1,C2 = FC2(x1,C2,x2,C2,…,x13,C2)y2,C2y2,C2 = PC2(x1,C2,x2,C2,…,x13,C2)
Mid-summerC3xi,C3,
i ∈ [1, 13]
y1,C3y1,C3 = FC3(x1,C3,x2,C3,…,x13,C3)y2,C3y2,C3 = PC3(x1,C3,x2,C3,…,x13,C3)
Early spring and late autumnH1xi,H1,
i ∈ [1, 13]
y1,H1y1,H1 = FH1(x1,H1,x2,H1,…,x13,H1)y2,H1y2,H1 = PH1(x1,H1,x2,H1,…,x13,H1)
Early and late winter H2xi,H2,
i ∈ [1, 13]
y1,H2y1,H2 = FH2(x1,H2,x2,H2,…,x13,H2)y2,H2y2,H2 = PH2(x1,H2,x2,H2,…,x13,H2)
Mid-winterH3xi,H3,
i ∈ [1, 13]
y1,H3y1,H3 = FH3(x1,H3,x2,H3,…,x13,H3)y2,H3y2,H3 = PH3(x1,H3,x2,H3,…,x13,H3)
Table 5. Description of decision variables.
TypeIDDecision VariableUnitRange of Values
Building design schemeIN_01Heat transfer coefficient of the external wallW/(m2·K)[0.15, 2.50]
IN_02Heat transfer coefficient of the roofW/(m2·K)[0.15, 3.00]
IN_03Heat transfer coefficient of the internal wallW/(m2·K)[1.00, 5.00]
IN_04Heat transfer coefficient of the external windowW/(m2·K)[2.20, 6.40]
IN_05SHGC of the external window-[0.15, 1.00]
IN_06Window-to-wall ratio of the south elevation-{0.4}
IN_07Window-to-wall ratio of the north elevation-{0.4}
IN_08Air permeability performance ach[0.1, 0.8]
IN_09Building orientation°{0}
Internal disturbance elementsIN_10People density in collective officesm2/person{10}
IN_11Power density of equipmentW/person{150}
Occupants’ adaptive behavioursIN_12Coupling pattern between NV and AC operation-{M0, M1, M2, M3, M4}
IN_13Cooling/heating setpoint temperature°C[18, 30]
Table 6. Basic information about the reference points of optimisation objectives.
Reference PointReference Standard for Thermal
Performance of Building Envelopes
HVAC Behavioural PatternAC Load per Unit Area (kWh/m2)Proportion of
Uncomfortable Hours
B1Design standard for energy efficiency of public buildings (GB 50189-2015) Stochastic behavioural schedule59.32684.82%
B2Fixed schedule75.53680.65%
B3Technical standard for nearly zero energy buildings (GB/T 51350-2019)Stochastic behavioural schedule44.36670.93%
B4Fixed schedule55.94263.00%
Table 7. Linear fitting of the predicted and simulated results at different characteristic stages of AC usage.
Code of the Prediction ModelCharacteristic Stages of AC UsageHidden Layer NodesNumber of
Iterations
Linear Fitting of the Predicted and the Simulated Results
AC load per unit areaComprehensive uncomfortable hours
C1Late spring and early autumn131900Energies 18 06130 i001Energies 18 06130 i002
MRE4.1%6.9%
C2Early and late summer91000Energies 18 06130 i003Energies 18 06130 i004
MRE3.1%8.1%
C3Mid-summer112000Energies 18 06130 i005Energies 18 06130 i006
MRE1.1%7.9%
H1Early spring and late autumn101610Energies 18 06130 i007Energies 18 06130 i008
MRE4.4%4.0%
H2Early and late winter111000Energies 18 06130 i009Energies 18 06130 i010
MRE4.3%6.1%
H3Mid-winter101850Energies 18 06130 i011Energies 18 06130 i012
MRE4.0%9.7%
Table 8. Range of values for the decision variables.
TypeDecision VariableCodeUnitRange of Values
For Behavioural
Optimisation
For Integrated
Optimisation
Building design schemeHeat transfer coefficient of the external wallIN_01W/(m2·K)Fixed values under different operating conditions[0.15, 2.50]
Heat transfer coefficient of the roofIN_02W/(m2·K)[0.15, 3.00]
Heat transfer coefficient of the internal wallIN_03W/(m2·K)[1.00, 5.00]
Heat transfer coefficient of the external windowIN_04W/(m2·K)[2.20, 6.40]
SHCG of the external windowIN_05-[0.15, 1.00]
Window-to-wall ratio of the south elevationIN_06-{0.4}{0.4}
Window-to-wall ratio of the north elevationIN_07-{0.4}{0.4}
Air permeability performanceIN_08achFixed values under different operating conditions[0.1, 0.8]
Building orientation (northwards deflection)IN_09°{0}{0}
Internal disturbance elementsPeople density in collective officesIN_09m2/person{10}{10}
Power density of equipmentIN_10W/person{150}{150}
Adaptive behavioursCoupling pattern between NV and AC operationIN_12-{M0, M1, M2, M3, M4}{M0, M1, M2, M3, M4}
Cooling setpoint temperatureIN_13°C[18, 30][18, 30]
Heating setpoint temperature°C[18, 30][18, 30]
Table 9. Fixed values of decision variables derived from the building design scheme under typical operating conditions.
Building Design ParametersIN_01IN_02IN_03IN_04IN_05IN_08
Heat Transfer Coefficient [W/(m2·K)]SHGC of the External WindowAir Permeability (ach)
CodeOperating ConditionExternal WallRoofInternal WallExternal Window
P01Actual condition of the case building2.422.983.935.780.8190.7
P02Baseline condition of typical buildings in the 1980s2.01.52.06.40.80.8
P03Baseline condition of typical buildings in the 2000s1.00.72.03.00.50.5
P04Standard condition from GB 50189-20150.80.52.02.60.40.3
P05Low standard condition from GB/T 51350-20190.40.352.02.20.150.1
P06High standard condition from GB/T 51350-20190.150.152.02.20.150.1
Table 10. Quantitative characterisation of the multi-objective optimisation potential in six typical operating conditions.
ParameterReference PointReference ValueOptimisation Potential Compared with the Reference Point
P01P02P03P04P05P06
AC load per unit areaB159.326 kWh/m252.86%40.30%56.75%34.06%76.22%78.85%
B275.536 kWh/m262.97%53.11%66.03%48.21%81.32%83.39%
B344.366 kWh/m236.96%20.17%42.17%11.83%68.20%71.72%
B455.942 kWh/m250.00%36.68%54.13%30.07%74.78%77.57%
Proportion of uncomfortable hoursB184.82%92.01%85.58%90.98%84.27%95.01%94.29%
B280.65%91.59%84.84%90.51%83.46%94.76%94.00%
B370.93%90.44%82.76%89.21%81.19%94.04%93.18%
B463.00%89.24%80.59%87.86%78.83%93.29%92.32%
Table 11. Optimal behavioural optimisation strategies for thermal comfort levels in the P04 operating condition.
Optimisation ObjectiveOptimal Behavioural Strategy:
Cooling/Heating Setpoint Temperature (°C)|Coupling Pattern Between NV and AC Operation
Reference Point Dominance
(“√” for Dominated, “×” for Non-Dominated)
Proportion of
Uncomfortable Hours
AC Load per Unit Area
(kWh/m2)
H1H2H3C1C2C3B1B2B3B4
10%69.7224|M425|M325|M426|M325|M424|M3×××
20%63.2819|M118|M425|M426|M325|M424|M4×××
30%56.7623|M123|M424|M426|M330|M224|M3××
40%51.4519|M418|M425|M425|M330|M225|M4
50%45.9919|M424|M425|M427|M425|M430|M2×
60%38.6224|M425|M325|M425|M030|M230|M2
70%31.8419|M318|M025|M426|M330|M230|M2×
80%28.5219|M418|M323|M426|M330|M230|M2××
90%24.3824|M425|M325|M426|M325|M424|M3××××
Table 12. Samples of the behavioural strategies meeting the optimisation objectives in the P04 operating condition.
Optimisation ObjectiveBehavioural Optimisation Strategy:
Cooling/Heating Setpoint Temperature (°C)|Coupling Pattern Between NV and AC Operation
Reference Point Dominance
(“√” for Dominated)
Proportion of Uncomfortable HoursAC Load per Unit Area
(kWh/m2)
H1H2H3C1C2C3B1B2B3B4
53%44.3219|M124|M324|M427|M025|M430|M2
55%44.2320|M122|M325|M426|M025|M330|M2
57%43.4821|M218|M018|M027|M130|M224|M3
60%44.0520|M018|M018|M329|M130|M424|M2
62%40.722|M120|M325|M429|M226|M430|M2
Table 13. Numerical distribution of the cooling/heating setpoint temperatures in different characteristic stages of AC usage when the optimisation objective is satisfied.
Operating
Condition
Numerical Distribution of the Cooling/Heating Setpoint Temperature
HeatingEnergies 18 06130 i013Energies 18 06130 i014Energies 18 06130 i015
H1: Early spring and late autumnH2: Early and late winterH3: Mid-winter
CoolingEnergies 18 06130 i016Energies 18 06130 i017Energies 18 06130 i018
C1: Late spring and early autumnC2: Early and late summerC3: Mid-summer
Table 14. Numerical distribution of the coupling pattern between NV and AC operation in different characteristic stages of AC usage when the optimisation objective is satisfied.
Operating
Condition
Numerical Distribution of the Coupling Pattern Between NV and AC Operation
HeatingEnergies 18 06130 i019Energies 18 06130 i020Energies 18 06130 i021
H1: Early spring and late autumnH2: Early and late winterH3: Mid-winter
CoolingEnergies 18 06130 i022Energies 18 06130 i023Energies 18 06130 i024
C1: Late spring and early autumnC2: Early and late summerC3: Mid-summer
Table 15. Samples of the integrated optimisation strategies for different thermal comfort levels (based on the AC energy consumption of reference point B1).
Proportion of
Uncomfortable Hours
Integrated Optimisation StrategyBehavioural Optimisation Strategy
Heat Transfer Coefficient [W/(m2·K)]SHGC of the External WindowAir
Permeability (ach)
Cooling/Heating Setpoint Temperature (°C)|Coupling Pattern Between NV and AC Operation
External WallRoofInternal WallExternal WindowH1H2H3C1C2C3
6.23%0.150.151.062.20.330.124|M024|M424|M225|M024|M124|M1
10.00%0.150.312.812.850.290.1226|M325|M124|M026|M325|M424|M1
20.00%0.360.313.372.770.290.1127|M222|M224|M027|M025|M224|M1
30.00%0.410.514.242.40.220.1827|M321|M124|M420|M325|M024|M1
40.00%0.720.483.883.940.530.129|M022|M419|M027|M424|M024|M2
50.00%1.60.491.063.340.590.2929|M125|M418|M026|M129|M424|M4
60.00%1.690.673.273.110.930.2620|M023|M118|M027|M029|M224|M2
70.00%0.421.111.23.680.250.5928|M019|M222|M123|M329|M225|M2
80.00%0.910.691.283.780.620.5324|M418|M121|M325|M426|M326|M3
84.82%1.381.614.453.10.470.1528|M120|M229|M425|M428|M430|M1
Disclaimer/Publisher’s Note: The statements, opinions and data contained in all publications are solely those of the individual author(s) and contributor(s) and not of MDPI and/or the editor(s). MDPI and/or the editor(s) disclaim responsibility for any injury to people or property resulting from any ideas, methods, instructions or products referred to in the content.