1. Introduction
Power quality is an essential aspect in the efficient and safe operation of industrial equipment, especially in sectors with fluctuating loads and high power, such as the steel industry. The rolling mill is one of the most demanding installations in terms of energy, generating significant imbalances, harmonic distortions, and reactive power variations due to the dynamic operating cycles of high-power motors [
1,
2].
In addition to harmonic distortions and voltage fluctuations, an often-ignored phenomenon, but with a major impact on sensitive equipment, is the imbalance of voltages between phases. This can lead to additional losses, overheating in three-phase equipment, and even unjustified tripping of protections. The imbalance is accentuated in networks with unevenly distributed loads, especially in the industrial context, where load cycles vary rapidly and asymmetrically [
3].
In this context, the identification, measurement, and correction of power quality parameters—such as THD (total harmonic distortion), the power factor, and voltage unbalance—become operational and strategic priorities [
4]. The implementation of compensation systems, such as static reactive power compensators (SVCs), can contribute not only to optimizing energy efficiency but also to reducing voltage unbalance, thus improving the stability and symmetry of internal and external distribution networks [
5]. Power quality monitoring, especially in converter-dominated systems, is increasingly recognized not only as a reliability measure but also as a strategic approach to reduce power losses and improve energy efficiency at the facility level.
This paper analyzes the behavior of the power supply system of a metallurgical rolling mill, focusing on the influence of installing an SVC on power quality parameters. A comparison is made between situations with and without compensation using a set of relevant experimental measurements on voltages, currents, and active/reactive powers at different points of the system. In addition, the impact of the SVC on the symmetry of line voltages is evaluated by estimating the unbalance in real operating conditions.
This paper presents results based on experimental data acquired from a real industrial environment, where the load is highly fluctuating and there are many nonlinear phenomena. This type of research is rarely published in the specialized literature.
The novelty consists in the following:
Validation of the effectiveness of using an SVC in reducing voltage fluctuations, improving the power factor, and reducing harmonics in an industrial network where converters are present.
Analysis of the measurement results before and after compensation, showing the effect of introducing an SVC on power quality indices.
The study also identifies several limitations related to the available measurement equipment and procedure. The authors demonstrated that the absence of comprehensive three-phase current measurements limits the estimation of system parameters.
Unlike most simulation-based studies, this research brings experimental evidence from a real metallurgical plant to engineers dealing with similar situations and interventions. In addition, the detailed evaluation of the compensation system performance contributes to the comparative understanding of the effectiveness of SVCs in industrial power plants that have converter components.
This paper is not just a compliance study; the research addresses a practical and less presented gap in the literature on how SVCs perform under real, harsh industrial conditions—especially in metallurgical plants where rapid load changes and large voltage variations are present.
2. Related Works
Power quality disturbances in industrial electrical systems have been extensively studied, with particular emphasis on harmonic distortion, reactive power variation, and voltage unbalance. These issues are especially prominent in steel mills due to high-power nonlinear loads, such as reversible rolling mill drives and induction furnaces.
One study [
1] provides a foundational classification of voltage sags, interruptions, and other power quality problems in distribution systems, while article presented in [
2] offers a broad overview of both traditional and modern methods for mitigating such disturbances. Standards such as IEEE 519-2014 [
3] and EN 50160 [
4] establish clear thresholds for harmonic distortion and voltage asymmetry, making them essential guidelines for industrial network design and monitoring.
A number of studies have proposed solutions involving Static Var Compensators (SVCs). In the article [
5], the performance of active filters for harmonic compensation was reviewed, and their complementary role with reactive power devices was emphasized. The research [
6] presented a detailed classification of reactive compensation technologies based on control strategies and energy efficiency.
Recent works have demonstrated the efficacy of SVCs in stabilizing grid voltage and reducing losses. The study presented in [
7] analyzed SVC deployment in transmission systems and reported significant improvements in voltage profiles. The study presented in [
8] proposed a fuzzy logic approach to optimally size and control SVCs, improving performance in dynamic environments. Similarly, paper [
9] employed hybrid metaheuristic algorithms to determine optimal SVC placement in distribution networks.
Application-focused studies confirm the real-world benefits of SVCs. The research presented in [
10] examined SVC use in industrial distribution feeders and reported measurable gains in the power factor and harmonic mitigation. Study [
11] applied mixed-integer conic programming for optimal allocation of SVCs in power transmission systems. The article [
12] presented a case study from a steel mill using passive filters, showing improvements in THD and voltage regulation.
Several authors have explored enhanced topologies and hybrid configurations. The research in [
13] integrated active filters with SVCs to handle higher-order harmonics more effectively. The research [
14] introduced an advanced static var generator (ASVG) in mining applications, which showed robust performance in both reactive power and harmonic control.
Industrial case studies such as the modernization project at Arcelor Mittal Warszawa [
15] underscore the operational impact of upgrading existing SVC systems—particularly under high-load variability caused by arc furnaces. Broader reviews, like the one presented in [
16], compare compensation techniques across diverse industrial environments.
From a modelling and simulation standpoint, the study presented in [
17] applied SVCs in hybrid renewable grid systems and demonstrated their ability to smooth load flow and stabilize bus voltages. The study [
18] provided a valuable open-access dataset from a steel mill’s PCC, offering a detailed account of real-world harmonic and voltage unbalance measurements.
More specialized studies have targeted advanced features and digital integration. The research presented in [
19] evaluated IoT-enabled SVCs and their performance under time-varying loads. The study presented in [
20] performed a dynamic comparative analysis of SVCs versus STATCOMs in mining operations, concluding that STATCOMs offer a faster transient response but at a higher cost.
The study [
21] expanded the comparison to include TCSC and UPFC devices, using performance metrics like voltage stability and power loss reduction in meshed networks. The research presented in [
22] provided a comprehensive review of FACTS technologies, contextualizing SVCs among more advanced power flow controllers.
The research [
23] addressed harmonic control in the Yili rolling mill, offering practical mitigation measures aligned with the standards discussed earlier. Study [
24] conducted a theoretical study on regenerative braking and energy recovery—an important phenomenon in reversible rolling mill motors, where power may be injected back into the grid under deceleration conditions.
The research presented in [
25] highlights the application of regenerative braking in steel rolling mills, where the mechanical energy dissipated during braking is recovered by power electronic drives. The results highlight the economic and energy efficiency benefits of this approach.
In the research presented in [
26], the occurrence of unfavorable reactive power flows in rolling mill operations was analyzed, highlighting how rapid load changes and high-power drives contribute to significant inductive behavior and power quality deterioration, particularly in the absence of compensation systems.
Recent relevant research includes analyses of SVC effects in dynamic industrial situations. For example, ref. [
14] investigates an automatic reactive power compensation system in an underground mine with a variable load (cable hoist), and it is reported that the implementation of an advanced static generator (ASVG) improved overall power quality (harmonic reduction, voltage stabilization) under varying load conditions. The authors of ref. [
20] presented a case study of a copper mine expansion with new toothless motors. They found that a properly installed SVC (SVS) reduces voltage drop by approximately 2%, attenuates voltage peaks (the first oscillation decreased by ~3.5%), and limits overvoltages (~1%) during disturbances, improving system stability.
These studies collectively underline the potential of SVCs for mitigating both harmonic- and unbalance-related disturbances in heavy industry. The present paper contributes to this body of work by analyzing the real-world impact of an SVC system installed in a roughing mill power supply, assessing its effects on harmonic content, voltage symmetry, and reactive power compensation under dynamic load conditions.
Research Gaps and Contributions of the Study
Although numerous studies have analyzed SVCs in various power grids and industrial consumer power supply systems, such as EAF [
6,
21], there is a limited body of research addressing measurement-based analysis under the specific dynamic conditions of hot rolling mills. Unlike electric arc furnaces, rolling mill drives exhibit periodic torque reversals and regenerative braking, producing rapid and asymmetric fluctuations in reactive power and voltage unbalance [
23,
26].
Furthermore, most existing studies are based on simulation-based or steady-state analyses, while field measurements in real environments such as real metallurgical ones remain rare [
18,
20].
To address these gaps, this study provides the following:
Experimental field measurements in the power supply installation of an active hot rolling mill, comparing power quality indicators with and without SVC compensation.
Quantitative evaluation of total harmonic distortion (THD), reactive power, and voltage unbalance in real dynamic duty cycles.
Evaluation of the effectiveness of an SVC in voltage stabilization and improving grid symmetry at the common coupling point (PCC).
These contributions extend the current literature by correlating real-world industrial measurements with analytical interpretations of power quality improvement mechanisms in modern power installations where converters are present [
7,
9,
18].
3. Materials and Methods
This study was conducted at a metallurgical plant within the rolling mill section, with the aim of evaluating the impact of a reactive power compensation system—namely a Static Var Compensator (SVC)—on power quality indicators. The analysis focused on the electrical supply to the roughing stand and relied on direct experimental measurements under normal operating conditions. The recorded data serve not only to assess power quality but also as a critical input for strategic energy-saving decisions, such as tuning compensation systems or identifying load imbalances that generate excessive losses.
3.1. System Configuration
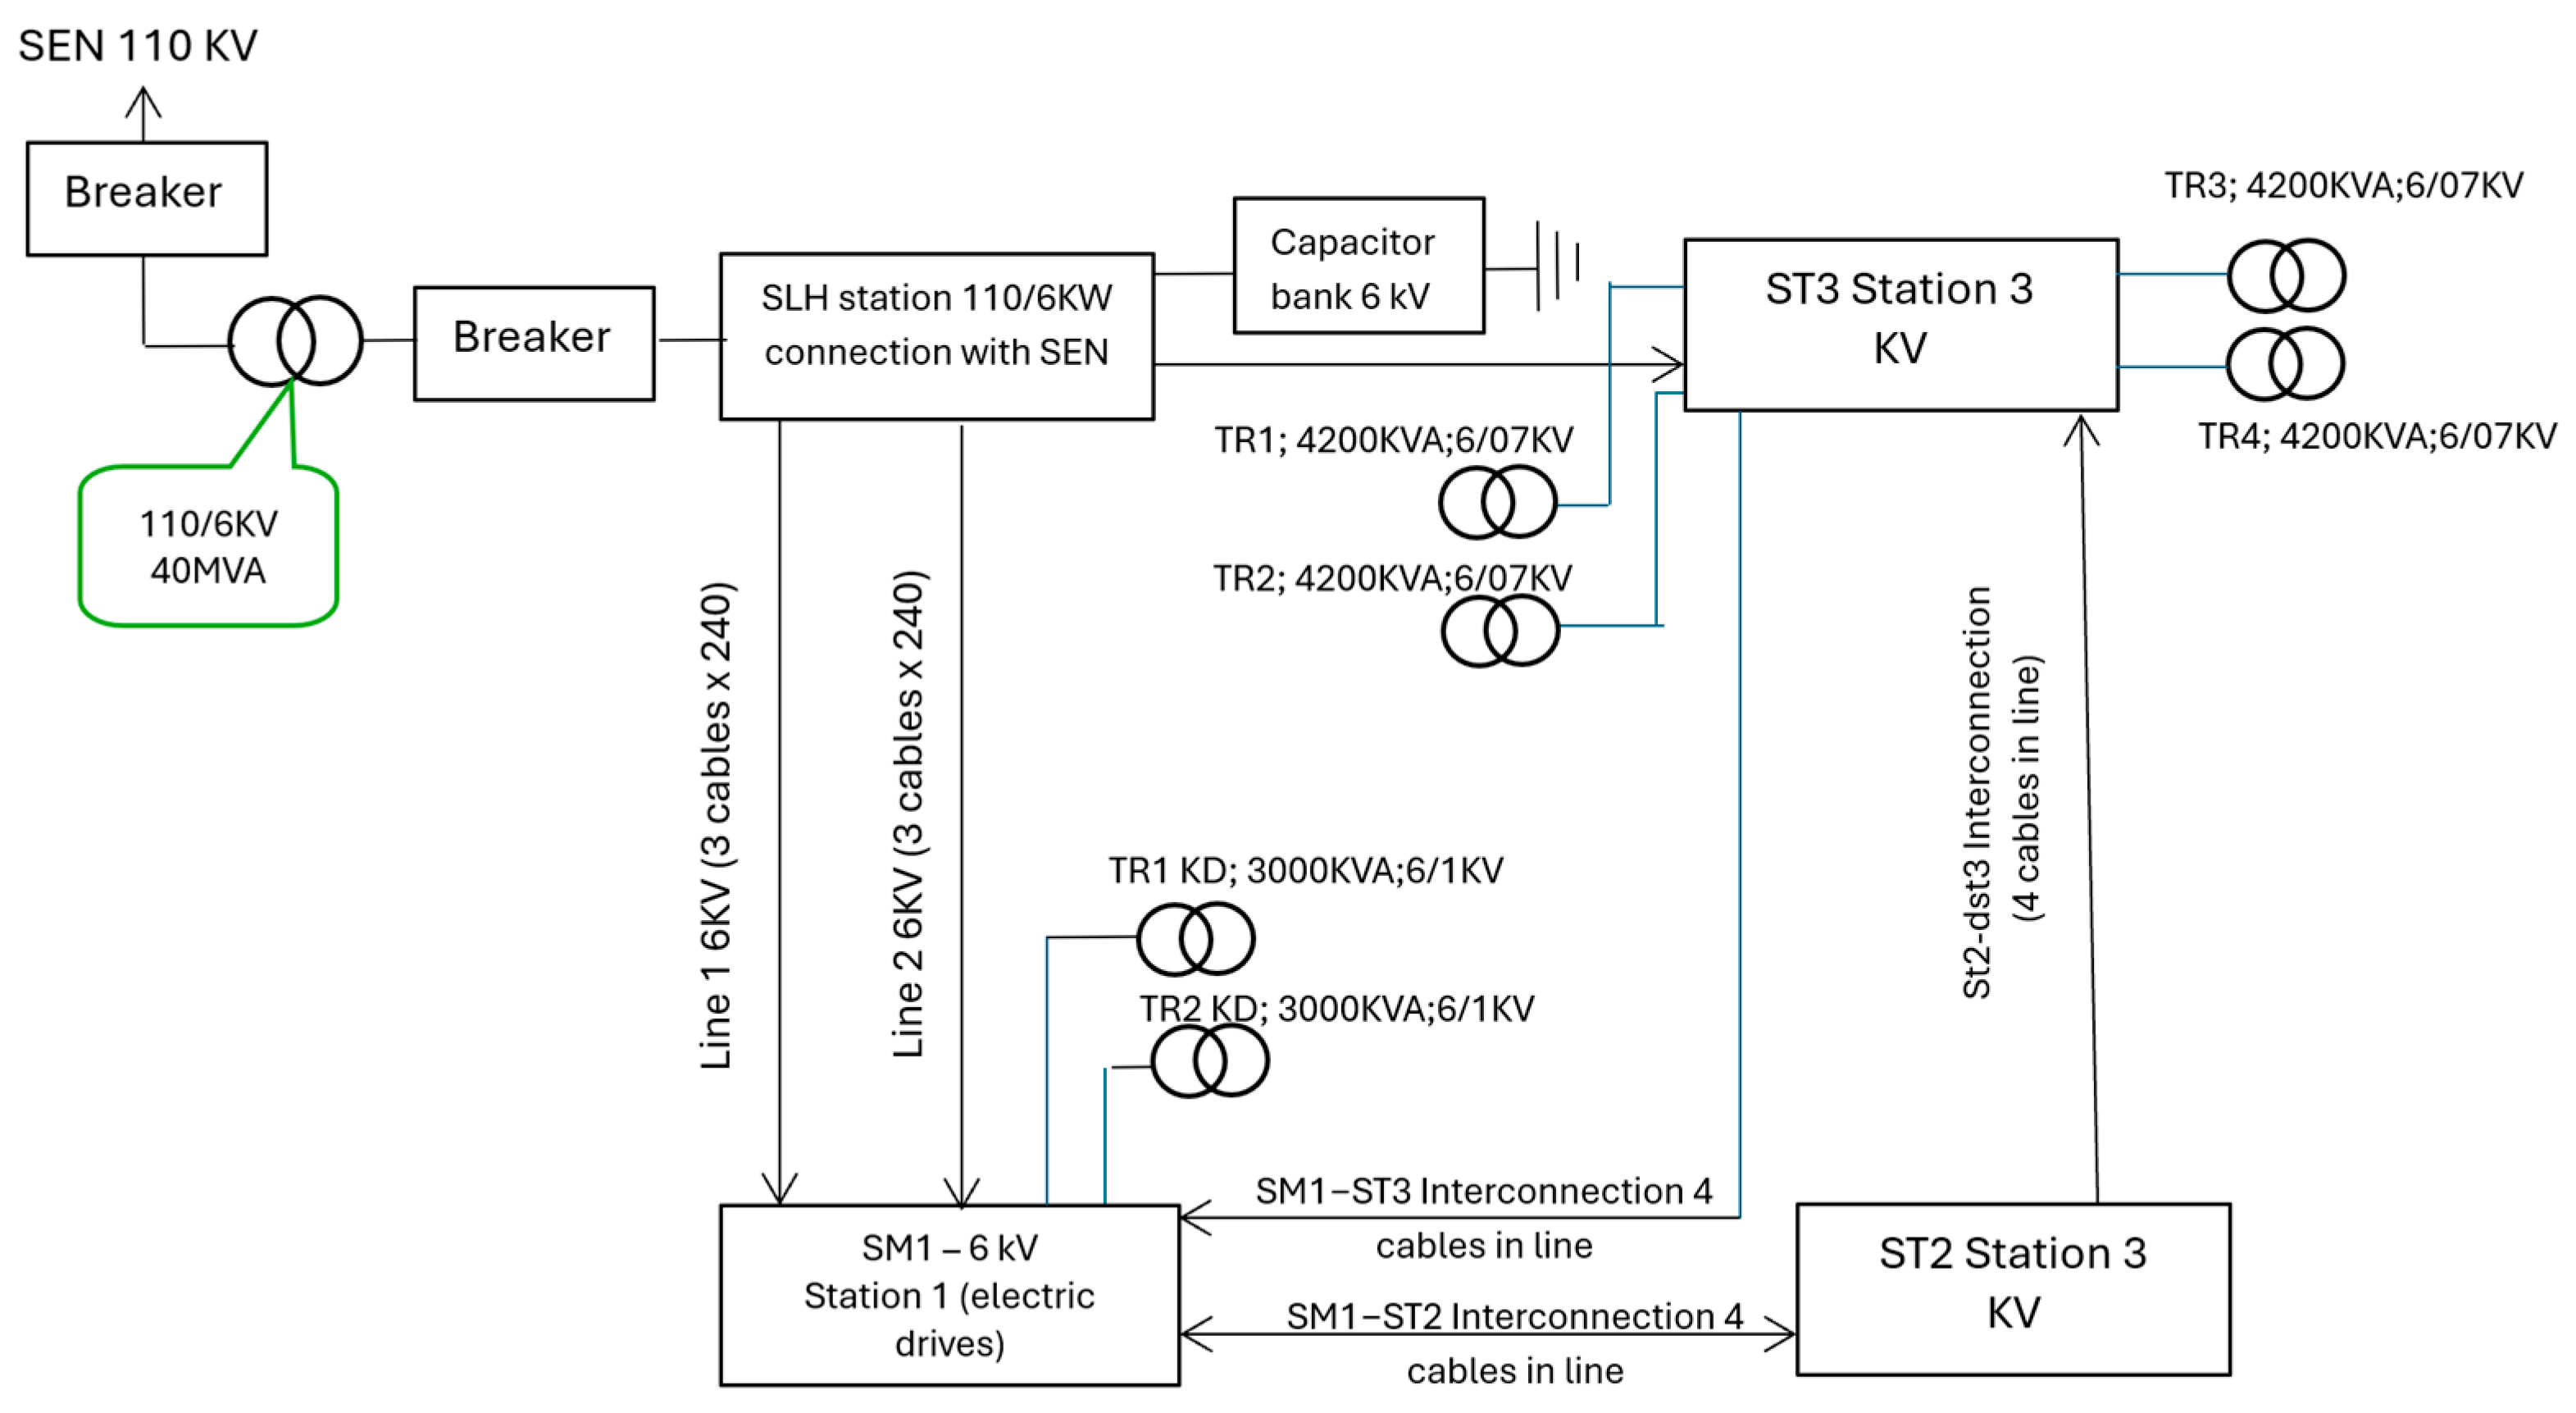
Power is supplied from the SLH substation (an internal high-voltage supply station connected to the national grid), which is connected to the national power transmission network via a 110/6 kV transformer. Three 6 kV lines depart from this substation, supplying three internal substations (ST1–ST3). Each substation includes two 6/0.4 kV transformers (one active, one reserve). The area of interest is substation ST1, specifically transformer TR1 (6/1 kV), which supplies the electric drives for the roughing stand. The SLH station is equipped with a capacitor bank of 5 MVAR connected in double star to the 6 kV bus bar.
The structure of the power system feeding the rolling mill, including the transformers and internal substations, is illustrated in
Figure 1, which shows the connection of various substations to the grid and the specific supply paths to the roughing mill.
Figure 1 illustrates the electrical configuration of the rolling mill power supply system, with a focus on the connections relevant for the analysis of power quality phenomena. The power supply originates from the national electricity grid (SEN) through a 110/6 kV, 40 MVA transformer. This transformer feeds into the SLH substation, which ensures the interconnection between the national grid and the internal medium-voltage network.
From the SLH station, two main power lines—Line 1 and Line 2, each composed of 3 × 240 mm2 cables—connect to SM1 (Station 1), which supplies electric drives. Within this station, two transformers (TR1 and TR2 KD, rated at 3000 kVA, 6/1 kV) feed the rolling mill’s thickening box, one of the largest and most dynamically loaded consumers in the facility. The operation of the roughing stand introduces significant disturbances in the power system, particularly with regard to voltage unbalance and reactive power variation.
The ST3 station contains four transformers (TR1, TR2, TR3, TR4—each 4200 kVA, 6/0.7 kV), which supply the rolling mill train and its auxiliary systems. Due to their critical role in the rolling process, SM1 and ST3 are considered the most important consumers in terms of power demand and influence on power quality. The ST2 station, in contrast, supplies the adjustment and finishing area of the mill, operating at 6/0.4 kV, with lower but still significant consumption levels.
A capacitor bank (6 kV) is installed in the secondary circuit of the SLH 110/6 kV transformer, serving as a static reactive power compensator (SVC). This bank plays a key role in improving voltage stability and reducing unbalance under varying load conditions.
The experimental measurements presented in this study were conducted along Lines and 2, the feeders connecting SLH to SM1, to capture the impact of roughing mill operation on network parameters. Since the roughing mill’s load cycles are known to cause the highest levels of imbalance, data were recorded with the capacitor bank alternately connected and disconnected, allowing for comparative analysis of compensation effectiveness under real industrial operating conditions.
More detailed electrical schematics of the distribution panels and transformer supply systems involved in the roughing stand section are provided in
Figure 2 and
Figure 3, offering an overview of the instrumentation and protection systems present in the supply lines.
3.2. Instrumentation and Measurement Setup
The measurements were conducted using a Chauvin-Arnoux C.A. 8334B three-phase power and quality analyzer with AmpFLEX A195 flexible current sensors. The front panel is presented in
Figure 4, capable of recording RMS voltages and currents, active and reactive power, total harmonic distortion (THD), the power factor (PF), and energy consumption.
Acquisition settings were as follows:
- ➢
Software: standard software with USB export and Windows-based post-processing suite;
- ➢
Accuracy class: <1% for current inputs with AmpFLEX A195 sensors (range 0.5–3000 A, Chauvin Arnoux, Asnières-sur-Seine, France), according to EN 50160 and IEC 61000-3-2-2014 [
27], standards;
- ➢
Voltage input range: up to 2 kVpp;
- ➢
Sampling rate: 6.4 kS/s per channel (25 kS/s transient), with a recording frequency of 1 Hz;
- ➢
Averaging window: RMS and THD values were calculated over 200 ms intervals according to IEC 61000-3-2-2014, Class A;
- ➢
THD definition: harmonics up to the 50th order, expressed as a percentage of fundamental;
- ➢
The instrument performs internal harmonic analysis using Fast Fourier Transform (FFT) techniques and applies programmable averaging windows for RMS and THD computation. Harmonic direction (IN/OUT) is also identified during acquisition.
This configuration ensures compliance with international standards (EN 50160, IEC 61000-3-2-2014), which makes the measurements presented representative for comparative assessment of power quality.
The device was configured to perform real-time measurements with a sampling interval of one second. The specific measurement point analyzed in this study was located at substation ST1, downstream of transformer TR1 (6/1 kV, 3600 kVA), which supplies the roughing stand. The SLH station includes a fixed capacitor bank rated at 5 MVAR, connected in double star at the 6 kV level using TSC topology.
Figure 1 shows the same design with the capacitor bank connected. In the second phase of the study, dynamic compensation was performed using an SVC connected at the same supply point under the condition of variable load.
The power supply of the industrial installations in the “rolling mill” section is carried out through the SLH power station, connected to the national transmission system through a 110/6 kV transformer. Three 6 kV lines depart from this station, which supply three internal substations. Each substation serves industrial consumers through two 6/0.4 kV transformers (one active and one backup). The analyzed area is that of the ST1 station, namely the TR1 transformer (6/1 kV), which supplies the drive equipment of the coarse feeder (KD).
The analyzer was installed inside the transformer cell, using the protection and control circuit’s measurement infrastructure:
Two current transformers (CTs) with a 400/5 A ratio, available only on phases R and T;
One voltage transformer (VT) with a 6000/100 V ratio, available on all three phases (R, S, T).
Due to physical constraints, only the phase currents (R and T) were directly measured, while all three phase voltages were acquired. This limitation restricts the calculation of the system-wide power factor and current unbalance indicators. Therefore, only per-phase values were presented, and no power factor was calculated. Although estimation techniques (e.g., symmetrical component reconstruction or machine-learning-based inference) could be used to approximate the missing current waveform, they were not applied in the present study. This remains a proposed direction for future work.
Due to the absence of a CT on phase S, the current probe for that phase remained disconnected; thus, the analyzer recorded zero current on phase S. However, the voltage was still monitored for all three phases. The analyzer’s clamps were connected to the CTs on phases R and T, while the voltage inputs were taken from the VT output on phases R, S, and T.
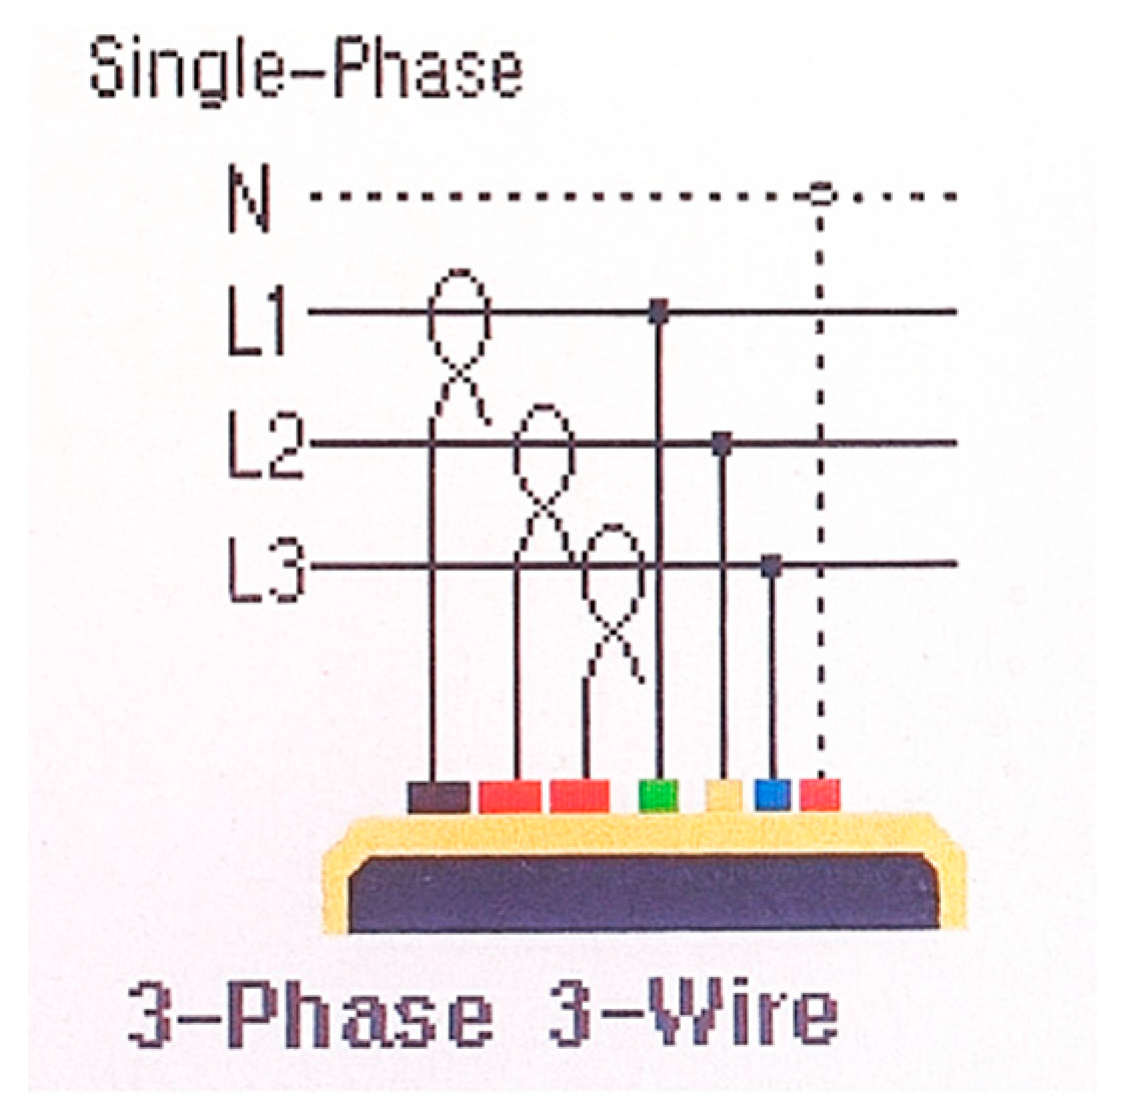
This limitation was considered in the data analysis, particularly when interpreting the current imbalance and power factor on phase S. In the plant configuration, protection systems operate between phases R–S and S–T, and phase S is internally grounded in a star configuration with phases R and T, as shown in
Figure 5.
This connection was applied using the appropriate voltage terminals (L1, L2, L3) and current clamps.
Figure 6 shows the input terminal configuration of the analyzer, which ensures galvanic isolation and safe probing.
The SLH station is equipped with a reactive power compensation system consisting of a capacitor bank with a nominal power of 5 MVAR, currently connected in a double-star configuration at a voltage of 6 kV. In the second phase of the study, the same power supply point was analyzed with the SVC turned on in order to compare the influence of reactive compensation on the measured values.
Measurements were collected in two operational modes:
The analyzer was installed in both cases in the same location and under the same loading conditions so that a direct comparative analysis could be performed. Each recording session lasted approximately one hour, and a detailed 300 s window was extracted to allow for further investigation into short-term stability and symmetry.
A secondary field measurement configuration, including current transformers, overcurrent protection relays, and auxiliary coils for the transformer protection, was documented and used to validate the measurement points.
Although the EN 50160:2010 standard [
4], states that power quality assessments at the common coupling point (PCC) should be based on measurements over a continuous period of 7 days, this approach mainly concerns verification in public distribution networks under steady-state conditions. However, in industrial environments—especially in the case of dynamic, high-load electrical networks such as rolling mills or electric arc furnaces—such long-term monitoring is not always the most appropriate or practical strategy. Due to the cyclical and non-stationary nature of the load in such cases, shorter but higher-resolution measurement windows are more useful for analyzing disturbances and compensation effects.
Thus, many technical studies and industrial research in the literature have been based on shorter data acquisition periods tailored to specific operating regimes. For example, paper [
23] investigated the harmonic mitigation performance of SVC installations in a steel mill using specific measurements covering representative load cycles rather than continuous monitoring on several days. Similarly, in [
26], the research focuses on the reactive power behavior and compensation effects during specific periods of operation without extending the measurements to a full week. These precedents highlight that, in practice, short-term recordings can provide sufficient relevant results for the analysis of compensation effects in power systems that include converters.
In our study, although the measurements were performed over several days, we selected representative one-hour time windows for the analysis, both in compensated and non-compensated operating modes. This approach allows for a better comparison of the impact of the SVC under equivalent load conditions. In addition, all measurements were performed using certified power quality analyzers, ensuring the reliability of the determined indicators.
The choice of a Static Variable Compensator (SVC) was motivated by the fact that in the hot rolling mill, rapid variations in reactive power and voltage fluctuations are due to the specifics of the production process. Unlike fixed capacitor banks, an SVC offers continuous and fast compensation of reactive power, important for stabilizing voltage levels and reducing flicker. In addition, when combined with harmonic filters, an SVC contributes to the attenuation of distortions caused by nonlinear loads. Thus, taking into account the efficiency/cost ratio, an SVC was considered more suitable and economically viable than other advanced solutions.
3.3. Measured Parameters and Analysis Objectives
For both scenarios (with and without an SVC), the following electrical parameters were continuously recorded:
Line and phase voltages (RMS) for all three phases;
Line currents (RMS);
Total active power (W), averaged over time;
Total reactive power (VAR);
Power factor (PF);
Voltage THD (VTHD) and current THD (ATHD);
Total active and reactive energy consumption over the measurement period.
The collected data will be used in the following section to provide a quantitative and visual comparison of the electrical behavior of the system under uncompensated and compensated conditions, highlighting the performance of the SVC unit and its influence on power quality, including the phase imbalance effects.
The power quality parameters analyzed in this study were computed based on standard definitions from IEEE 1459-2010 [
28] and IEC 61000-3-2-2014 [
27]. The apparent power
S, active power
P, reactive power
Q, and deforming power D were used to derive the power factor (
PF) using relationships (1) and (2) in sinusoidal conditions. For nonsinusoidal conditions, relations (1.b) and (2.b) are used.
For nonsinusoidal conditions, relations (3) and (4) are used.
Because nonsinusoidal conditions exist in the process of production, relations (3) and (4) are used in this paper.
This formulation allows the
PF to be negative when active power flow is reversed, such as during regenerative braking. In addition, the total harmonic distortion (
THD) for both voltage and current was calculated as follows:
where
X1 is the RMS value of the fundamental component, and
Xn are the RMS values of the higher-order harmonics up to the
Nth harmonic.
THD was separately calculated for voltage (VTHD) and current (ATHD), following the harmonic limits set by IEEE 519-2014 [
3].
The plant’s rolling mill section is powered through the SLH substation, connected to the national transmission grid via a 110/6 kV transformer. From SLH, three 6 kV feeders supply three internal substations. Each substation serves the industrial loads via two 6/0.4 kV transformers (one active, one backup).
The specific measurement point analyzed in this study was located at substation ST1, downstream of transformer TR1 (6/1 kV, 3600 kVA), which supplies the roughing stand. The SLH station includes a fixed capacitor bank rated at 5 MVAR, wired in a double-star configuration at a 6 kV level. In the second phase of the study, dynamic compensation was performed using an SVC connected at the same supply point.
The power supply of the industrial installations of the rolling mill section is carried out through the SLH power station, connected to the national transmission system through a 110/6 kV transformer. Three 6 kV lines depart from this station, which supply three internal substations. Each substation serves industrial consumers through two 6/0.4 kV transformers (one active and one backup). The analyzed area is that of the ST1 station, namely the TR1 transformer (6/1 kV), which supplies the drive equipment of the coarse feeder (KD).
The SLH station is equipped with a reactive power compensation system consisting of a capacitor bank with a nominal power of 5 MVAR, currently connected in a double-star configuration at a voltage of 6 kV. In the second phase of the study, the same power supply point was analyzed with the SVC turned on in order to compare the influence of dynamic reactive compensation on the measured values.
Although measurements were performed at multiple locations in the power supply system, the present study focuses on the common coupling point (PCC) where the SVC is installed. This point was chosen because it best shows the direct influence of the compensation system on the power quality indicators. Measurements at other locations served as internal current checks and are not included in this analysis to maintain the clarity of the study.
4. Results
This section presents and analyzes the results of experimental measurements performed at transformer TR1 in substation ST1 for two different configurations: with the Static Var Compensator (SVC) disconnected and connected. The objective is to assess the SVC’s impact on power quality indicators such as voltage and current symmetry, harmonic distortion, the power factor, and reactive energy.
The power quality measurements were made over a period of approximately one hour during continuous steady-state operation of the rolling mill (i.e., not during start-up or braking). During this period, the rolling mill load was variable but remained within the normal operating range. Thus, the recorded data represent rolling cycles, including both partial and near-full load conditions. This operating regime was intentionally selected to reproduce the real-world operating conditions that most affect power quality (such as voltage fluctuations, unbalance, and harmonic distortion). In particular, rolling mill loads are known to generate significant reactive current and harmonics.
Total harmonic distortion (THD) was monitored as an important indicator of waveform quality, in accordance with power quality standards, e.g., IEEE 519-2014, [
3], which recommends keeping voltage THD below approximately 5% to avoid harmful effects.
4.1. Voltage Profile Analysis
Figure 7 and
Figure 8 illustrate the variation in phase voltages (V1, V2, and V3) during a one-hour interval for the uncompensated scenario. In the absence of the SVC, as shown in
Figure 7, the voltages remain stable across all three phases, ranging between 58.4 V and 61.2 V. Here, V1, V2, and V3 represent the RMS values of phase voltages, as measured at the main bus bar supplying the rolling mill section. However, minor imbalances are noticeable during transient loading periods, which are typical in rolling mill operations. The detailed zoom over a 5 min interval, presented in
Figure 8, confirms that although phase voltages fluctuate due to the dynamic nature of the loads, the system maintains reasonable voltage symmetry.
Figure 9 presents the phase voltages’ crisp factor observed during the measurement. Although the system uses a three-wire configuration (without neutral), the reconstructed phase voltages show slightly more pronounced unbalance. These results reinforce the importance of real-time reactive power support during motor braking sequences and start-up cycles.
4.2. Power Flow and Reactive Behavior
Figure 10 illustrates the total active power measured at the transformer terminals. The negative mean value of −1436 W indicates that the motor occasionally operates as a generator during braking, injecting power back into the network. This regenerative behavior is a well-known characteristic of AC regenerative electric drives (AC REDs) used in rolling mill applications [
24,
25].
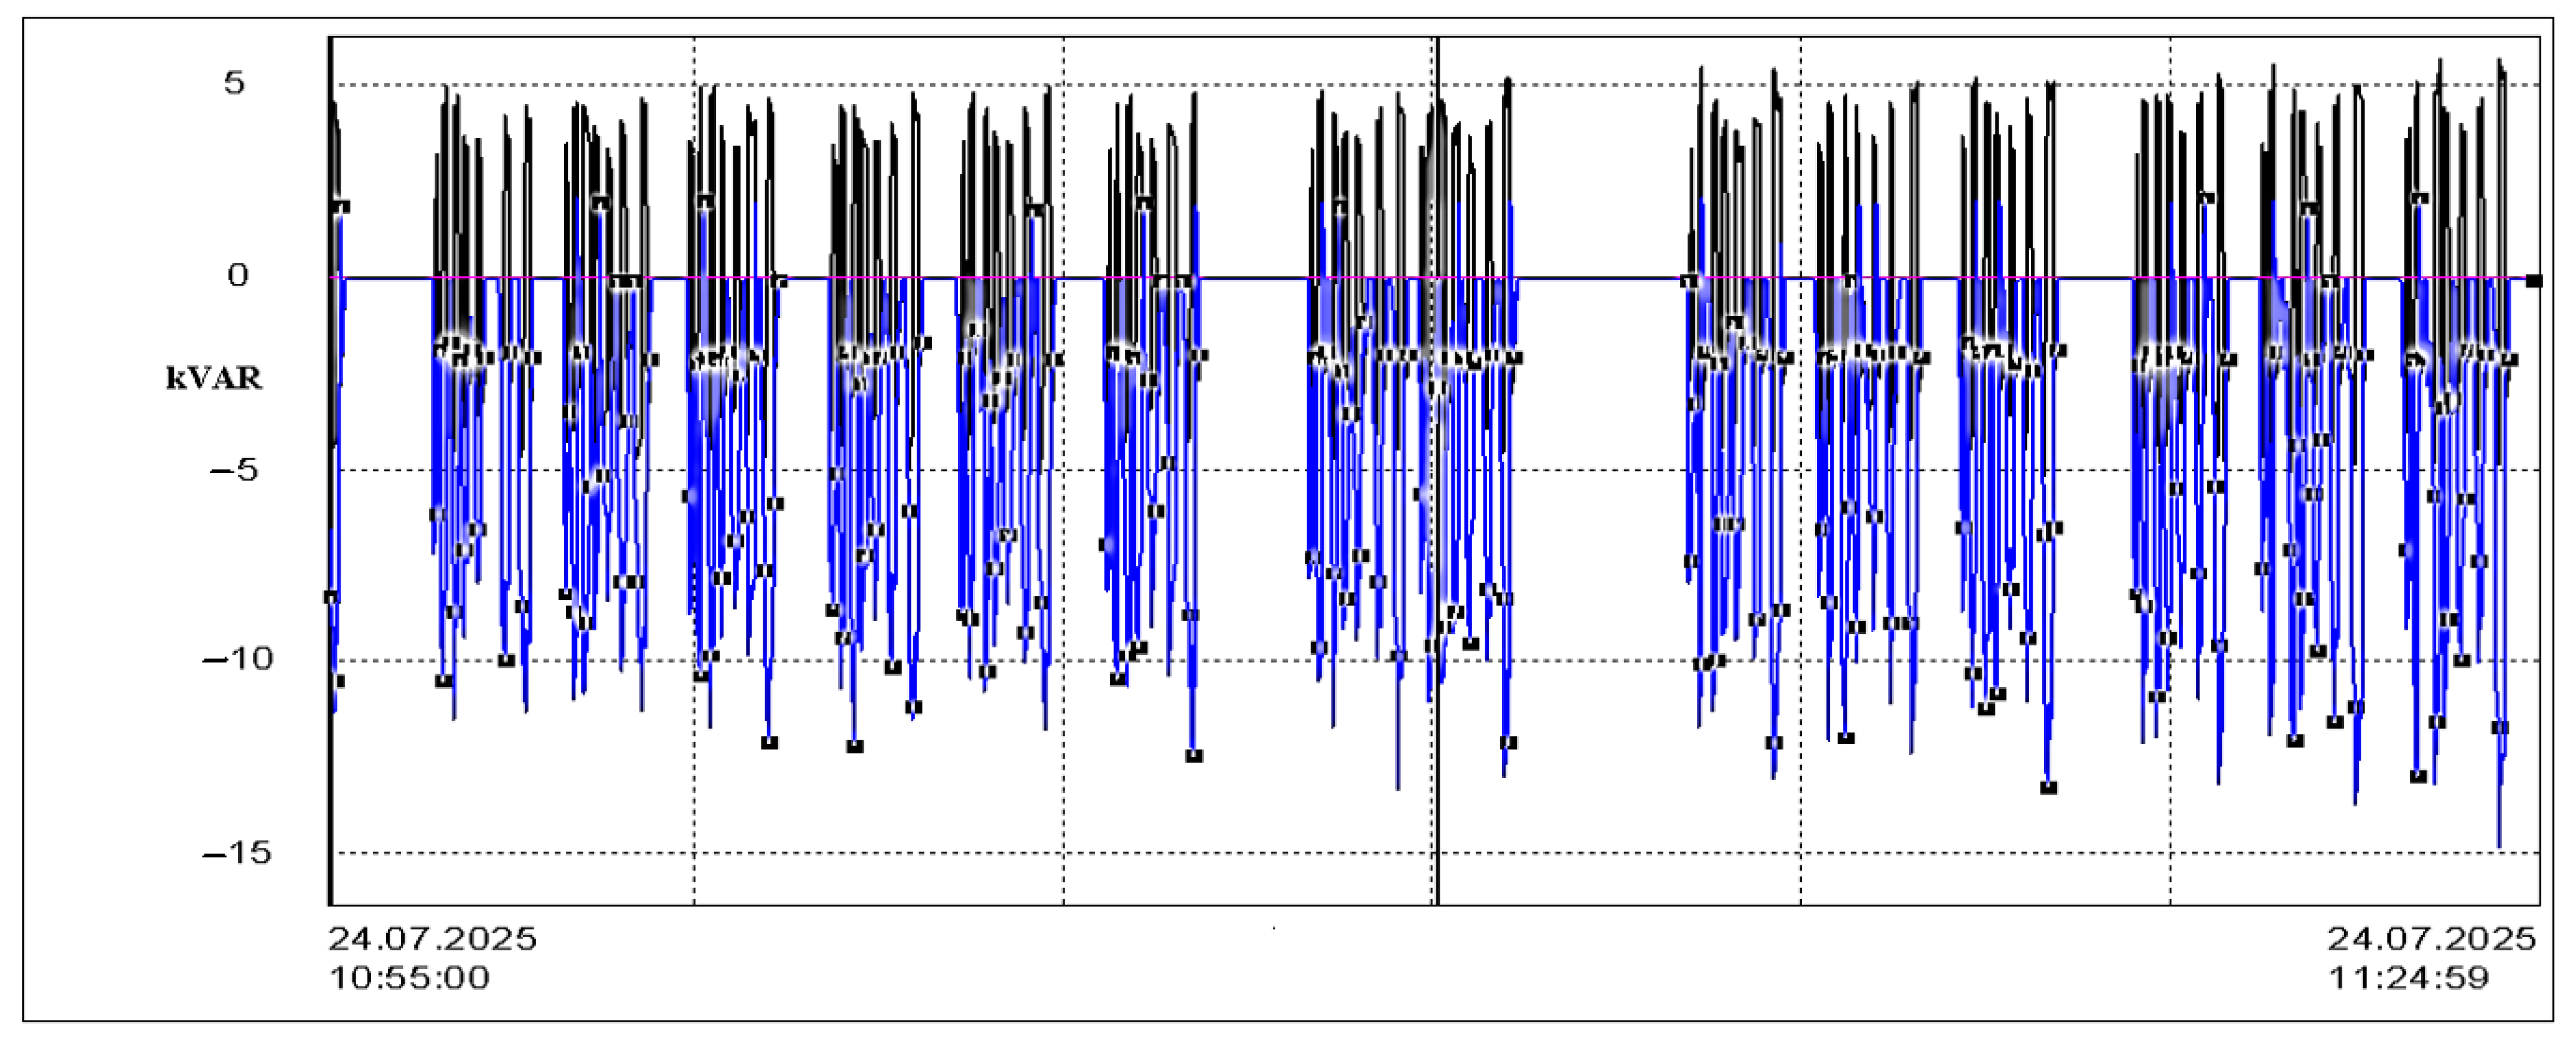
The evolution of reactive power is shown in
Figure 11. In the absence of the SVC, the reactive power injected by the load into the system remains negative, with a mean value of −3.324 kVAR. This reflects the highly inductive behavior of the rolling mill converters and the associated filtering components. Similar behavior has been observed in operational rolling mills, where the rolling mill drives consume not only active but also reactive inductive power, which must be compensated directly [
24].
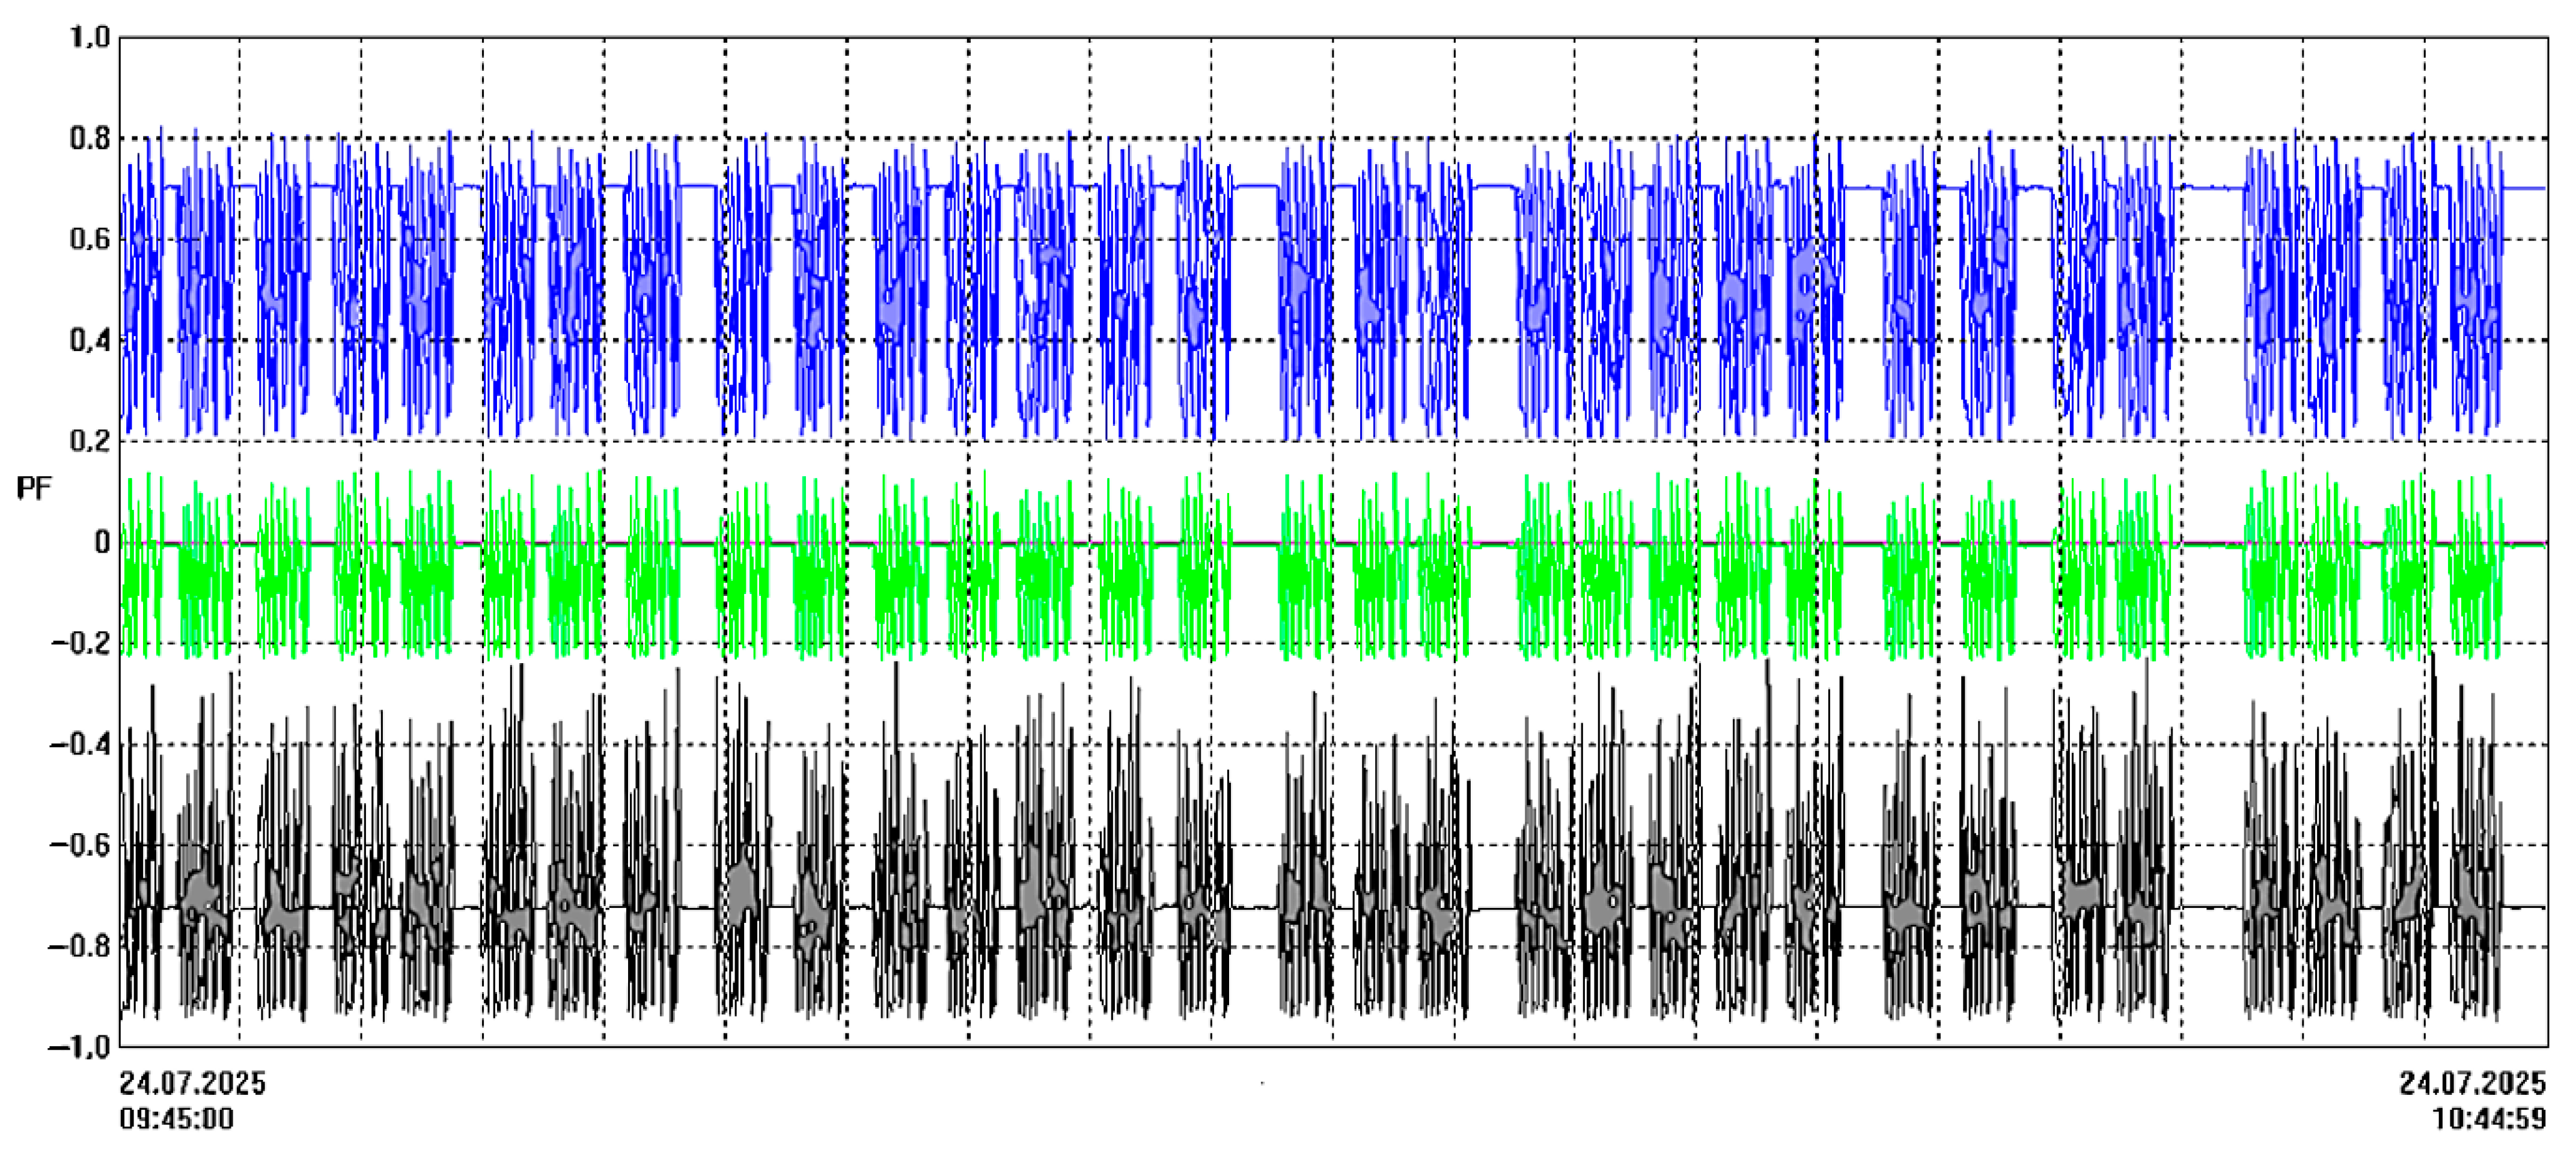
The power factor behavior is illustrated in
Figure 12, which presents the evolution for phases 1 and 2. The individual values recorded were −0.7251 for phase 1 and 0.5799 for phase 2, highlighting inefficient utilization of active power and significant reactive power exchange. The strongly negative value observed for phase 1 suggests instances of power flow reversal—indicative of regenerative braking phases in the rolling mill’s drive system. It should be noted that phase 3 was not monitored, and therefore, no total power factor for the three-phase system was computed. In this context, reporting an arithmetic average across the two measured phases would not yield a technically meaningful result, given the inherently unbalanced nature of the system and the presence of directional power flow in one phase.
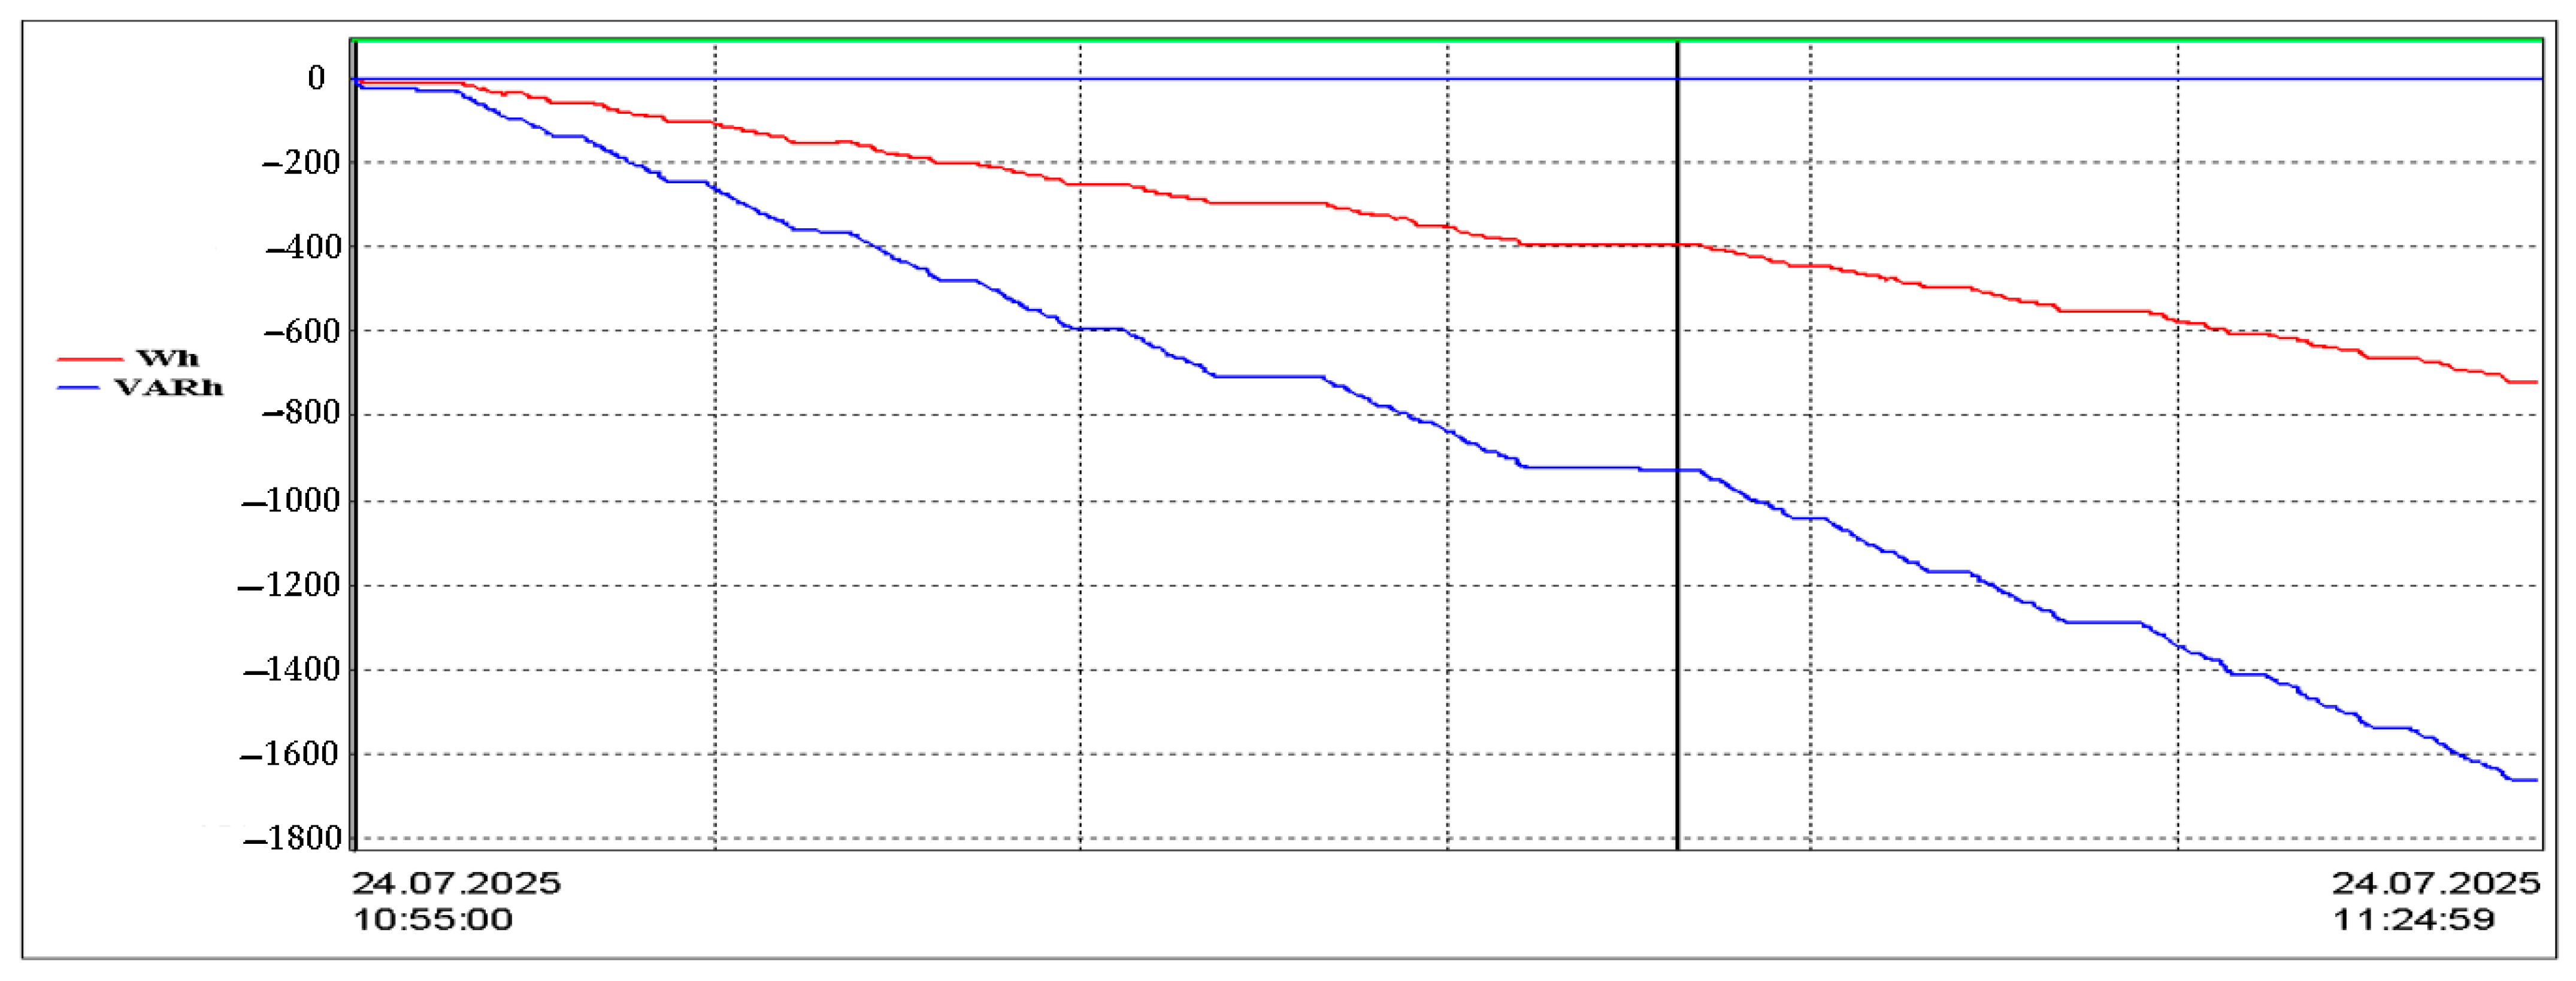
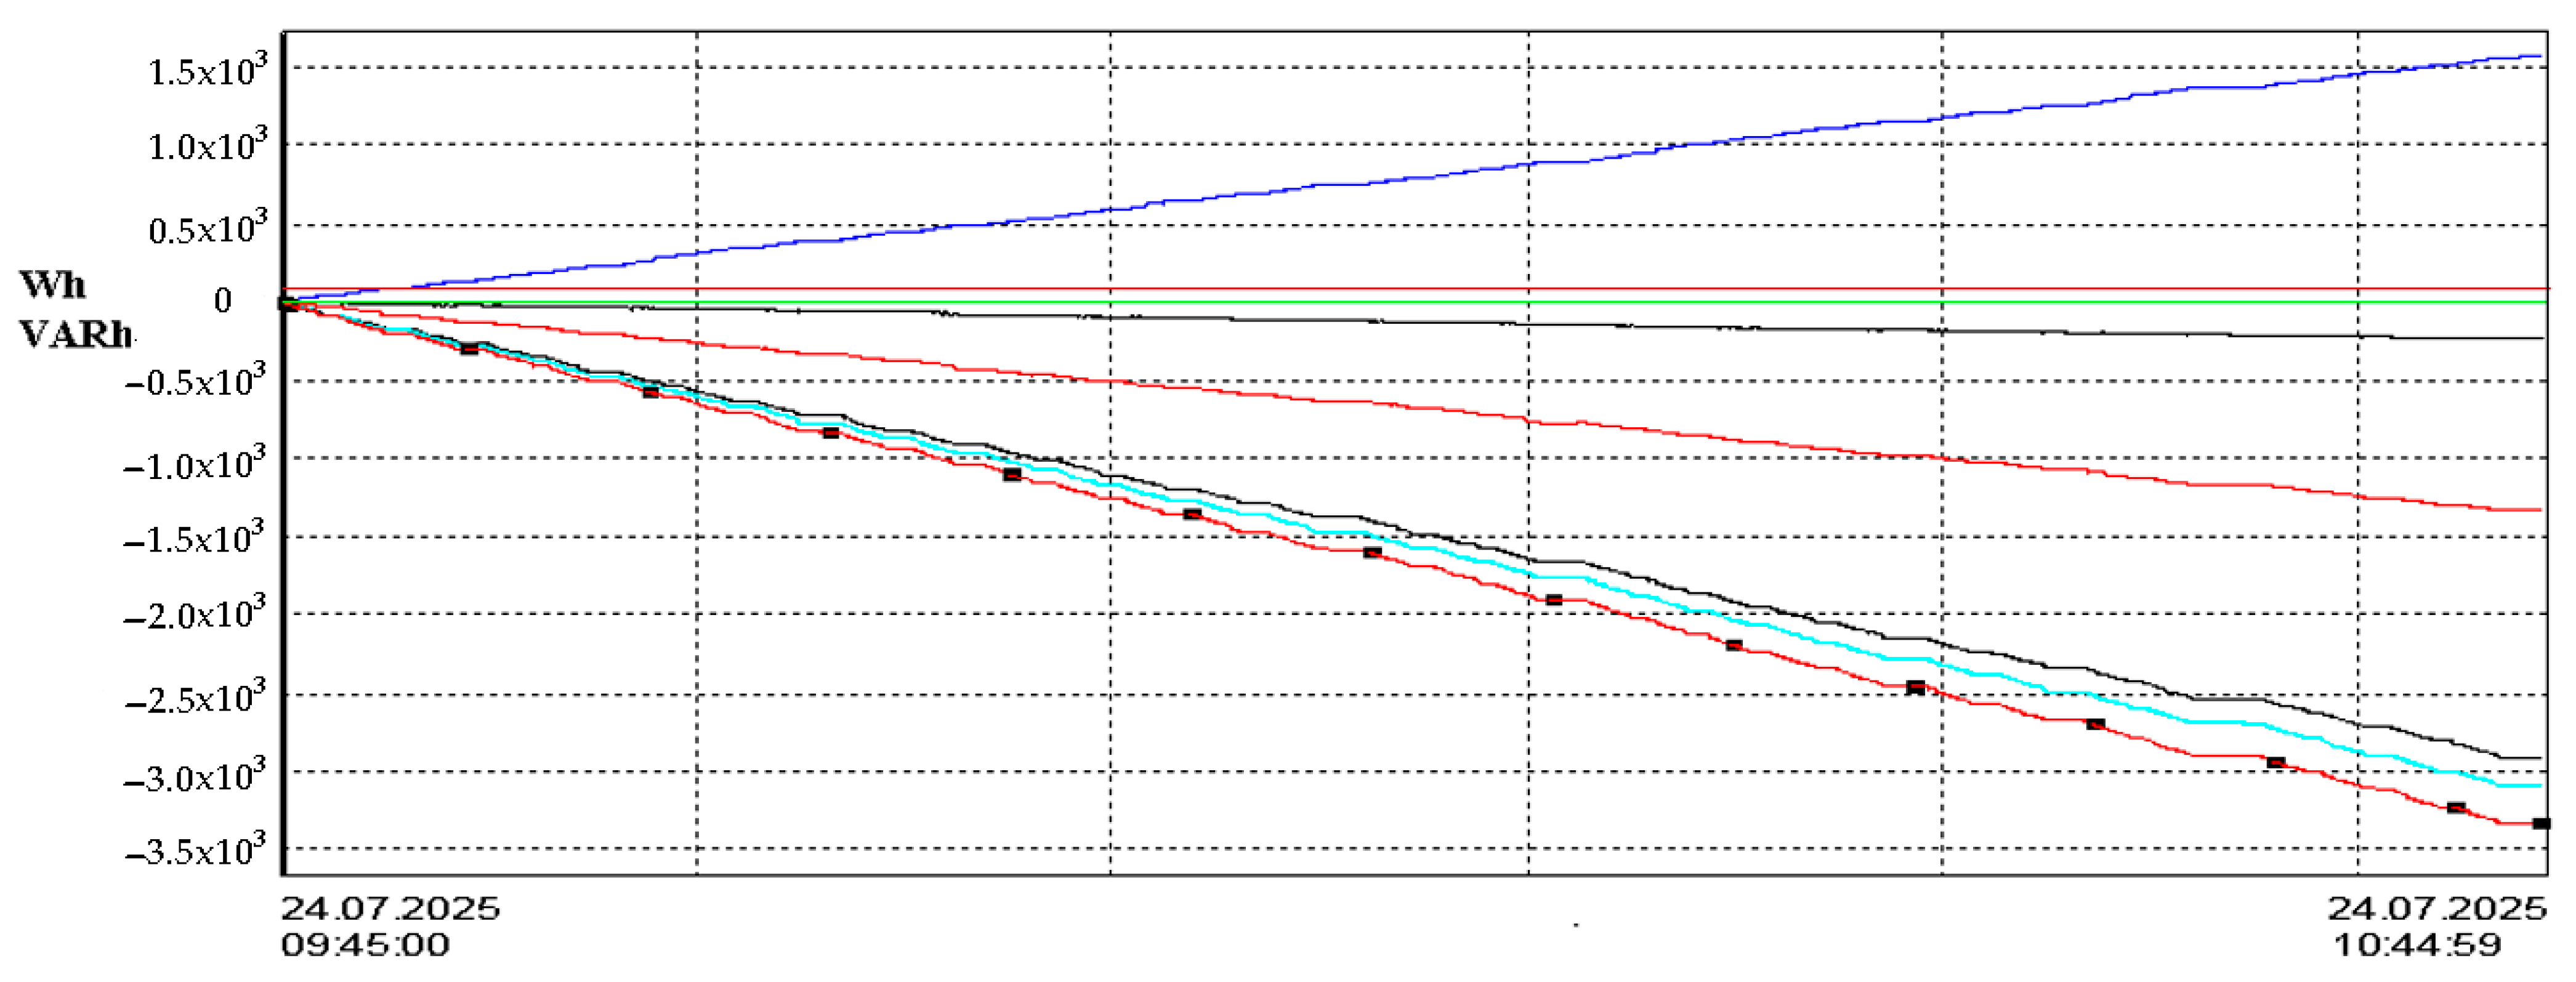
Energy consumption during the measurement interval is depicted in
Figure 13. Although active energy registers negative values (due to motor regeneration), the reactive energy consumed remains significant, further emphasizing the need for effective compensation strategies.
4.3. Harmonic Distortion and Power Quality with SVC Activated
Following activation of the SVC, a new set of measurements were performed. The voltage waveform analysis presented in
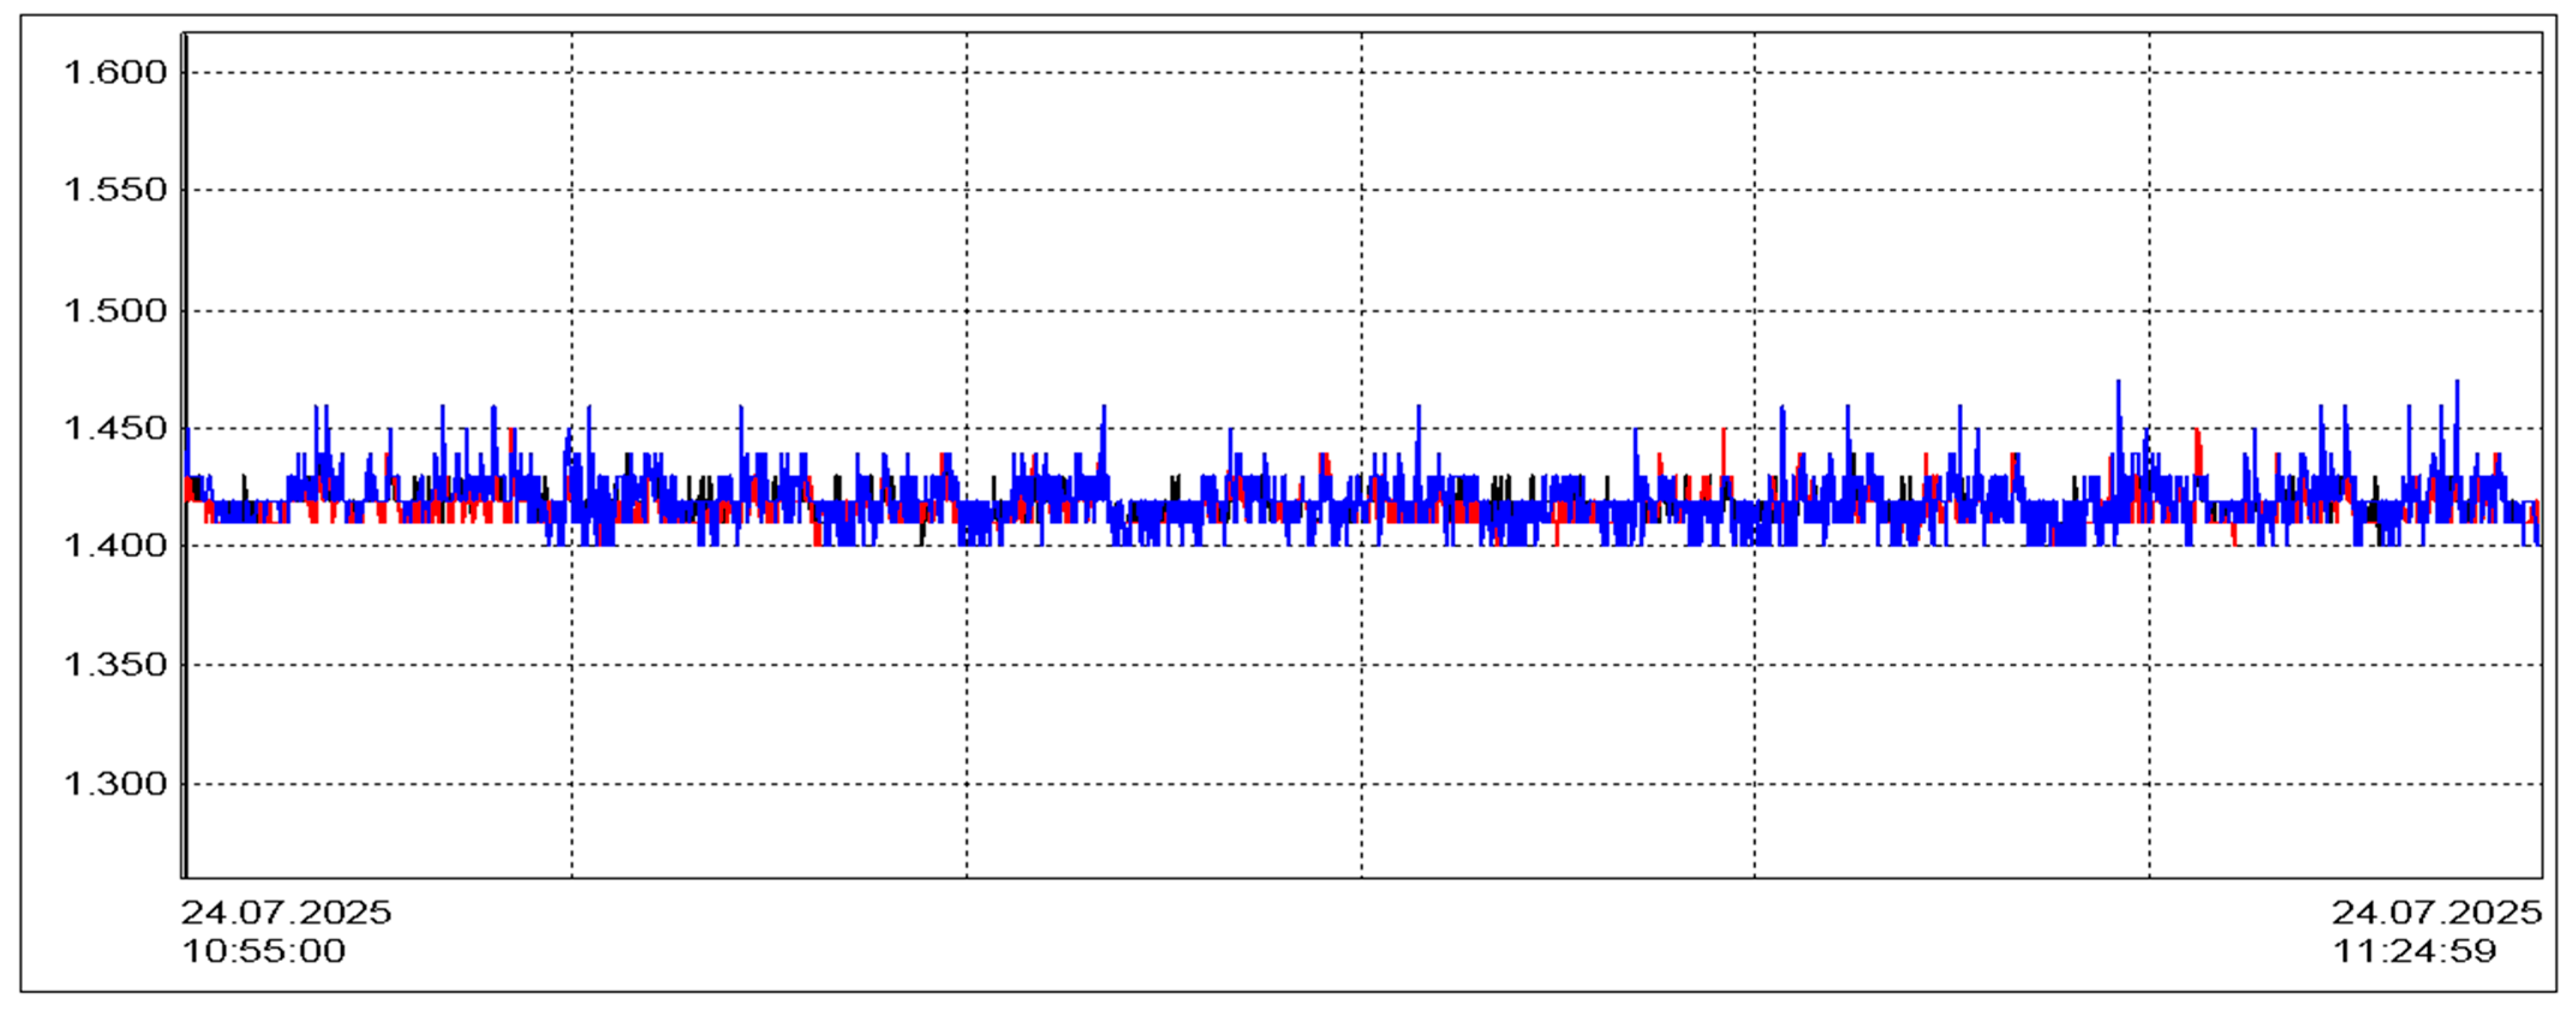
Figure 14 confirms improved balance and stability across the three phases, despite slight remaining variations caused by load dynamics. The crisp factor of the phase voltages shown in
Figure 15 are similarly stable, maintaining values within the 1.4–1.45 kV range, though minor unbalances persist.
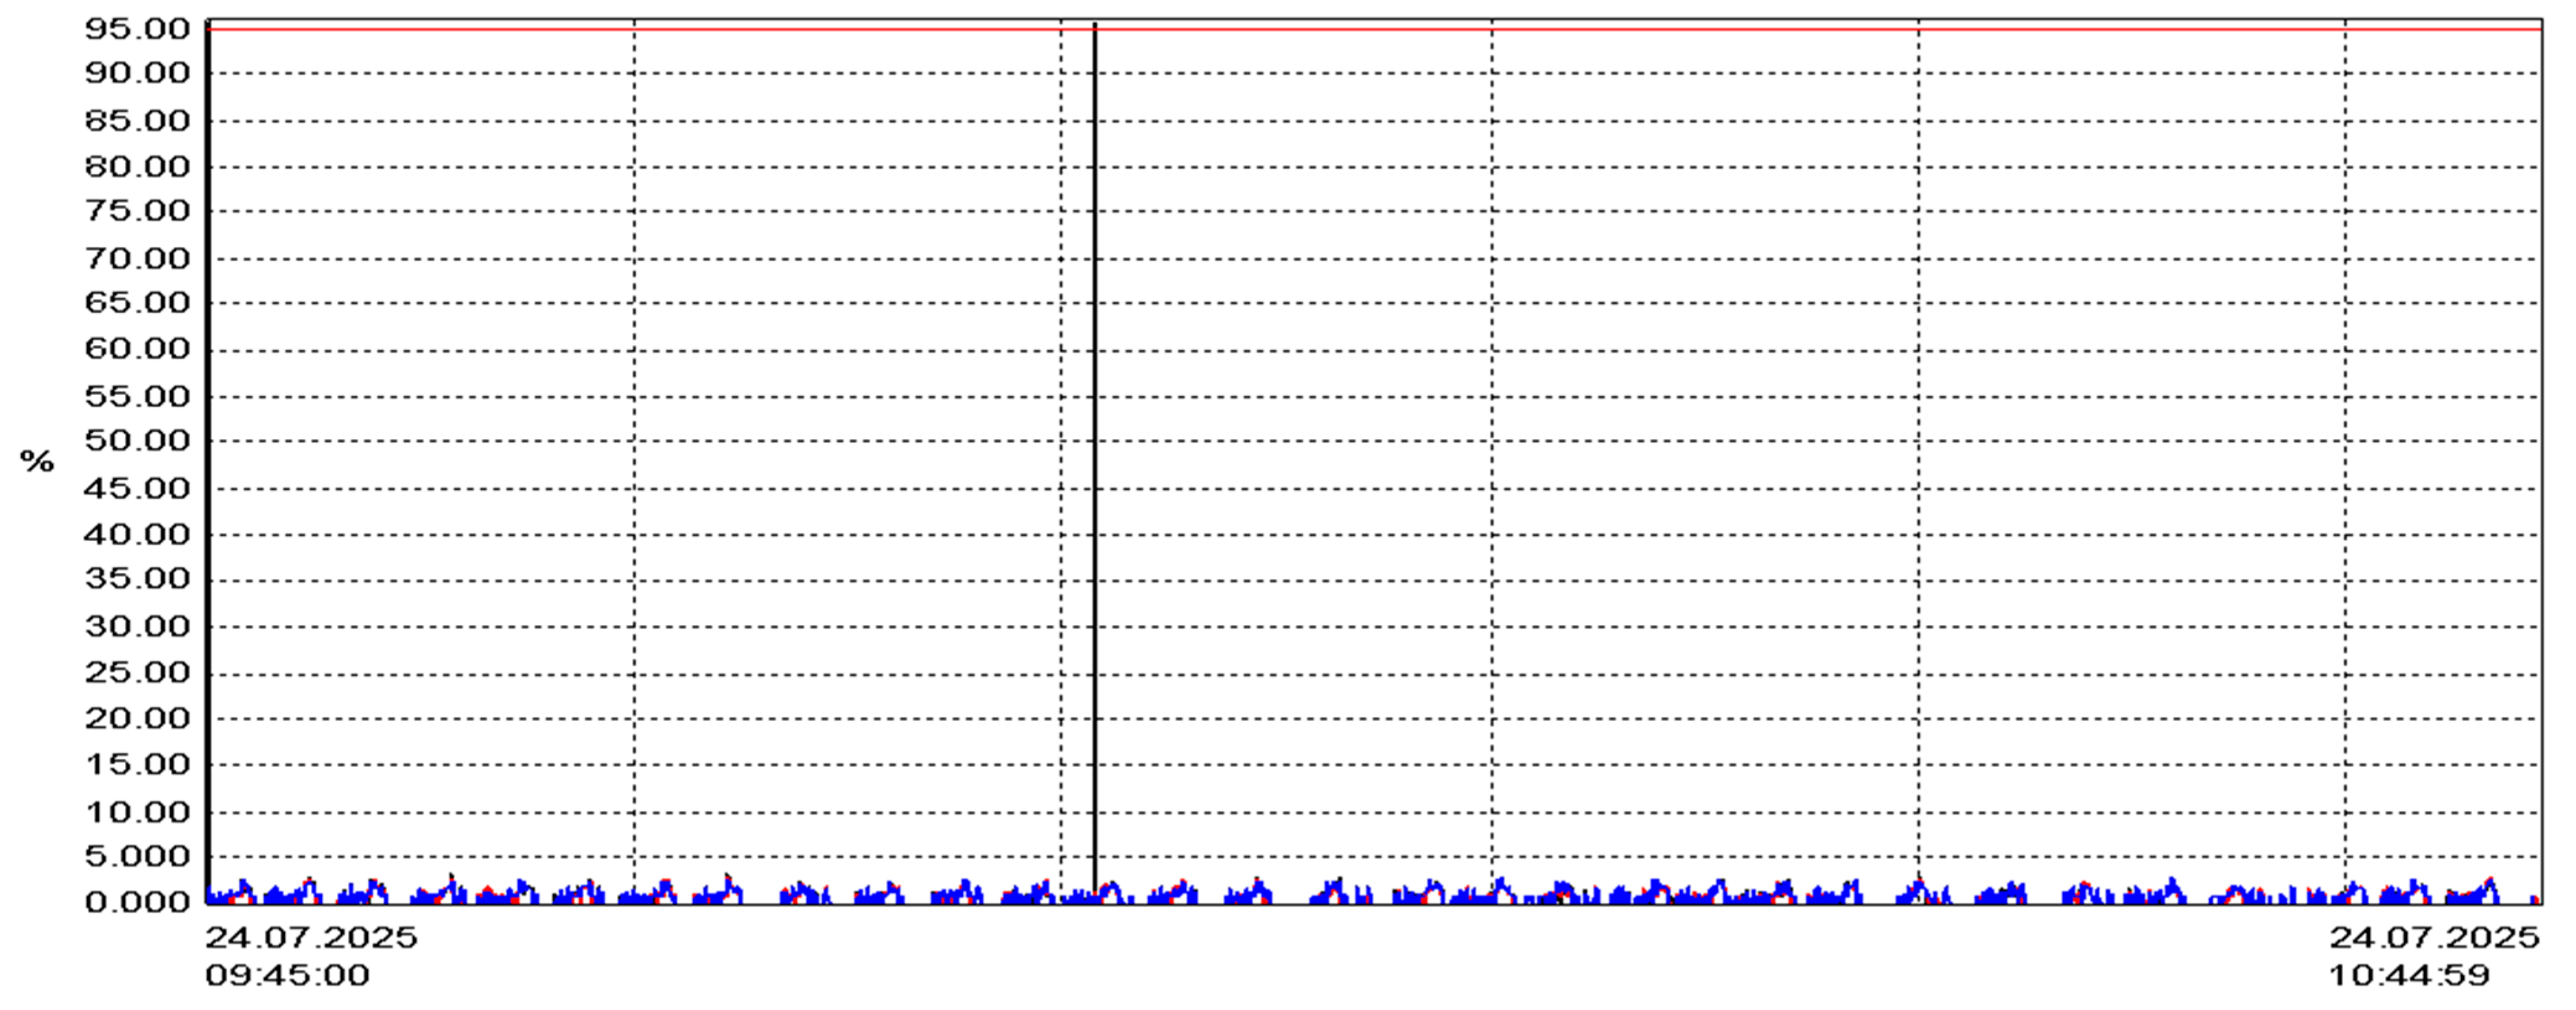
More critical are the observations on harmonic distortion.
Figure 16 presents the current total harmonic distortion (ATHD) for the two phases with the SVC in operation. Alarmingly, values between 34.60% and 49.64% are recorded—significantly higher than the IEEE 519-2014 [
3], recommended limit of 8%. This confirms that while the SVC addresses reactive power compensation, it does not mitigate the current harmonics generated by power electronic drives.
Figure 17, which displays the voltage THD (VTHD), provides a reassuring contrast: values remain under 0.6% in all phases. This suggests that the system’s voltage waveform quality is maintained despite high current distortion thanks to the stiff upstream network and transformer impedance characteristics.
4.4. Comparative Performance of SVC Implementation
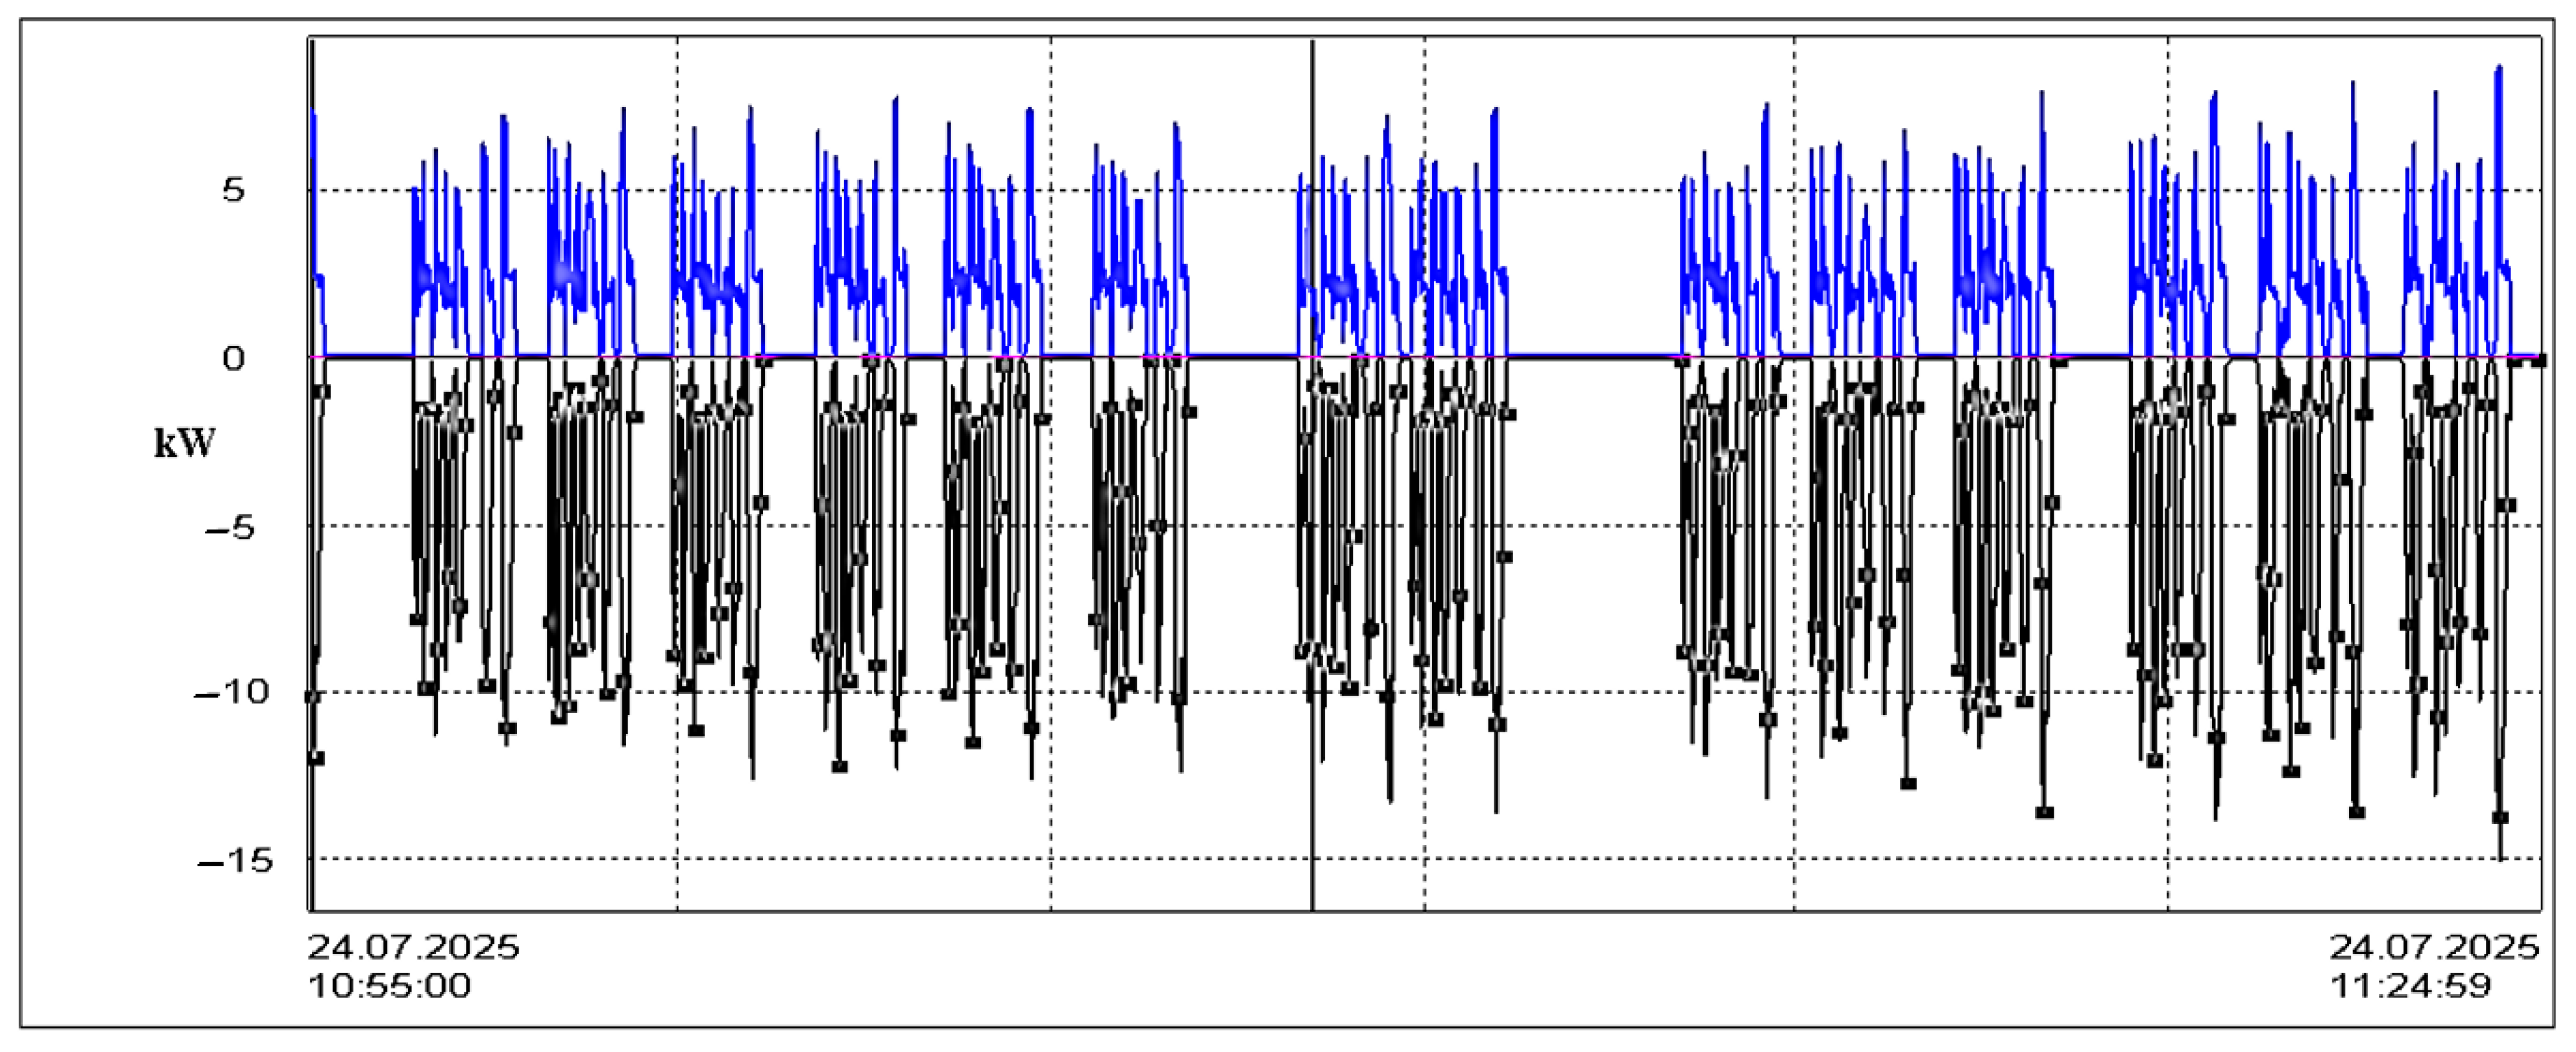
Post-compensation active power behavior is shown in
Figure 18, where the average value of −1335 W indicates a slight reduction in energy feedback compared to the uncompensated case. The influence of the SVC on reactive power is detailed in
Figure 19, with values slightly increasing to −3.334 kVAR. This suggests that the dynamic compensation is able to absorb or inject reactive power more responsively, reducing stress on upstream equipment.
Figure 20 compares energy consumption in both scenarios, revealing a clear decrease in both active and reactive energy with the SVC online. This confirms its role in optimizing energy usage under fluctuating industrial loads.
Finally,
Figure 21 illustrates the power factor under SVC compensation. While the values remain suboptimal, their stability and predictability improve, which is essential for maintaining supply quality and reducing network losses.
Overall, the results validate that the installation of the SVC contributes positively to voltage stabilization and reactive power management, although current harmonic distortion remains a major issue that requires complementary filtering solutions.
4.5. Normalized Indicators of Active and Reactive Power
To enable generalization and comparison with other industrial systems and the literature, normalized indicators of active and reactive power were introduced. According to IEEE Std. 1459-2010 [
28], the apparent power
S of a load is given by Equation (3).
Based on this definition, the following normalized indicators are defined:
These quantities are interpreted as the reactive power per unit of apparent load power (expressed as MVAR/MVA), thus allowing for comparisons between systems with different ratings.
The concept is used in the analysis of power systems, where active and reactive powers are expressed as fractions [
29]. Using the measured total active and reactive powers the following statistics were obtained, as presented in
Table 1.
Phase 1 shows a negative mean (−0.73 ± 0.15) and , indicating a capacitive regime with low active power flow. Phase 3 exhibits and , corresponding to a dominant reactive component but with higher active load.
Using the results in a normalized form allows for a direct comparison with other industrial electrical installations, as presented, for example, in [
30,
31], where compensation capacities are typically in the range of 1.0–1.8 MVAR per MVA of load.
Although the current study focuses on the impact of a 5 MVAR SVC, an initial evaluation of its relevance shows that this classification includes the normal range of reactive power variation measured in the rolling mill during full-load operation. However, under low or very dynamic load conditions, there may be some under- or over-compensation. As a result, future research will conduct an analysis of the sensitivity of the compensation capacity under various production regimes to determine whether a different classification or modular architecture might increase performance and flexibility.
5. Discussion
The experimental analysis carried out in this study confirms the substantial impact of reactive power compensation on power quality indicators in industrial environments, particularly in hot rolling mills characterized by highly dynamic and asymmetrical load profiles.
Without the Static Var Compensator (SVC), the system exhibited pronounced reactive power consumption and voltage asymmetry. The recorded reactive power remained persistently negative, with an average value of −3.324 kVAR, confirming the highly inductive nature of the load. This behavior is consistent with previous findings in steel plants, where rolling mill drives and associated filtering systems act as significant sources of reactive power demand [
24]. Although voltage magnitudes remained within acceptable ranges, transient fluctuations and minor imbalances were evident during load changes—emphasizing the sensitivity of the voltage profile to rapid load cycling.
Furthermore, the power factor analysis highlighted inefficient energy utilization, with highly negative values on certain phases (e.g., PF = −0.7251 on phase 1), indicating power reversal due to regenerative braking events. The asymmetrical values across the monitored phases also reflect the non-uniform loading conditions typical of industrial motor drives.
During regenerative braking in rolling mills, motors act as generators and inject active power back into the grid, resulting in a temporary reverse power flow and negative phase power values. Such a reversal can cause sudden voltage fluctuations at the point of common coupling (PCC). According to papers [
32,
33], installing an SVC in a distribution feeder suppressed the voltage surge due to reverse flow. Furthermore, in study [
6], it was present that shunt reactive power compensation devices are essential for voltage stabilization under bidirectional power flow conditions. In the present study, the SVC regulates the reactive power exchange—either by absorbing or supplying reactive energy—during periods of reverse power flow, thus contributing to voltage stabilization.
However, due to the absence of current measurement on phase S, a complete assessment of the three-phase power factor could not be performed. This limitation further underscores the importance of full-phase monitoring for accurate energy auditing in unbalanced systems.
After activating the SVC, several improvements were observed. Voltage symmetry improved modestly, and reactive energy consumption showed a measurable decrease. This confirms the SVC’s ability to inject or absorb reactive power dynamically, thereby supporting voltage stability under real load conditions. Nevertheless, one of the most critical findings was the persistence of high current total harmonic distortion (ATHD), with values ranging from 34.60% to 49.64%—well beyond the 8% threshold recommended by IEEE 519-2014 [
3]. These results clearly indicate that SVCs, although effective for reactive compensation, do not provide harmonic mitigation capabilities and should be complemented by active filtering solutions.
The voltage total harmonic distortion (VTHD), on the other hand, remained under 0.6% in all scenarios, likely due to the stiff upstream network and transformer impedance. This decoupling between current and voltage harmonic behavior has been similarly observed in other industrial studies, where the source impedance plays a key role in limiting voltage waveform distortion despite nonlinear load currents.
Overall, the results demonstrate that while SVCs improve reactive power balance and energy efficiency, their deployment must be part of a broader strategy that includes harmonic filtering and phase load balancing. The implementation of the SVC led to clear improvements: voltage symmetry was enhanced, harmonic distortion was reduced, and both active and reactive power losses were minimized across the industrial power system.
In industrial power quality compensation, Static Variability Compensators (SVCs) and Synchronous Static Compensators (STATCOMs) are the main methods used. According to comparative studies, STATCOMs exhibit superior dynamic behavior [
34].
However, SVC systems are a cost-effective and robust solution in heavy industrial environments, where high reactive power requirements and long duty cycles dominate. The SVC configuration used in our work was specifically selected to match the characteristics of the rolling mill process, where load variations are pronounced but occur on the order of seconds rather than milliseconds.
Previous analyses confirm that, for such medium-speed dynamic regimes, SVCs provide adequate flicker mitigation, voltage stabilization, and harmonic mitigation while having high reliability [
35]. Although STATCOM or hybrid SVC–STATCOM systems could theoretically provide faster compensation and improved low-voltage performance, their investment costs are higher
Operation with the SVC led to significant improvements in voltage symmetry and a reduction in total harmonic current distortion (ATHD), which decreased from values exceeding 40% to below 15% in certain operating ranges.
These improvements are not only important for power quality but also have the effect of reducing energy losses in the power system. It is known from other specialized works that, due to high harmonic values and phase imbalance, losses of up to 3–5% can occur in power networks [
1,
3,
36].
Given the ATHD reductions from our measurements, we estimate a potential energy loss reduction of approximately 1.5–2.5% by using an SVC. This implies a proportional decrease in energy consumption, resulting in direct economic benefits.
While the main objective was to improve power quality, a valuable side effect is greater energy efficiency—reflected in a better power factor and less strain on upstream transformers. These advantages result in long-term energy savings and extended equipment lifespan, especially in facilities with highly dynamic loads, such as rolling mills.
Improving the power factor reduces phase currents, which contributes to lower energy losses. Based on this effect, transformer life spans increase, while unexpected protection trips decrease. All of these factors help to improve the electrical rolling mill installation.
Our results, although focused on active and reactive power, have broader implications for equipment protection and longevity. SVC compensation greatly improves the power factor by shifting from inductive reactive power to capacitive reactive power. This confirms that the SVC has reduced the load on the supply transformer. In effect, the transformer and the supply transformers now carry less reactive current, which means lower copper and heating losses, as also demonstrated in [
37]. In particular, overheating is an important factor in the aging of transformer insulation. For example, constant operation above approximately 80% of the rated load of a transformer is known to shorten its life [
21].
SVCs can also maintain the equivalent load of the transformer within safe limits. In a recent case study [
21], adding an SVC to a substation improved the transformer load from ~94.5% to ~76.6%, bringing it below the ~80% threshold recommended by IEC standards to avoid excessive aging.
Consistent with these findings, our SVC maintained voltage stability (preventing deep voltage sags) and minimized reactive currents, which reduces thermal stress on the transformer and helps protect against accidental relay operations. These power factor improvements suggest a lower risk of false relay trips and a positive impact on transformer health, consistent with the established understanding of the benefits of SVCs [
38].
Therefore, the role of the SVC in our hot rolling case is to not only to meet power quality objectives but also to enhance the reliability and durability of the electrical installation, indirectly extending the transformer life and preventing costly downtime caused by unjustified protection trips.
The improvements presented in our case study align well with the literature [
21,
38,
39].
6. Conclusions
This paper presented an experimental evaluation of power quality in an industrial hot rolling mill, focusing on the impact of implementing a Static Var Compensator (SVC) under real operating conditions. Measurements conducted both before and after the activation of the SVC revealed notable improvements in reactive power behavior and voltage stability, validating the compensator’s effectiveness in dynamic industrial environments.
The SVC reduced the net reactive power drawn by the load and corrected specific cases of under-compensation, contributing to a more stable voltage profile. However, the persistent presence of high current total harmonic distortion (ATHD), exceeding 40% in some scenarios, suggests that SVCs are unable to reduce harmonics.
As expected, voltage THD (VTHD) remained low due to the high short-circuit power of the upstream grid, confirming the system’s ability to absorb harmonic currents without significant waveform distortion.
Power factor measurements indicated poor active power utilization and reverse power flow on certain phases, likely caused by regenerative braking processes. These effects, combined with the observed unbalanced load behavior, emphasize the need for a comprehensive power quality management strategy beyond reactive compensation alone.
The study also highlights several challenges and limitations. The absence of full three-phase current measurements restricted the computation of aggregate system parameters, while the influence of non-simultaneous events during the acquisition interval introduced variability in the data. Future work should focus on three-phase synchronized measurement systems, the integration of active filters, and the adoption of hybrid SVC–STATCOM solutions to address both reactive and harmonic issues in heavy industrial contexts.
Under the circumstances of only having access to two phases, as in this study, a data acquisition system capable of measuring active and reactive power can be developed by sampling three-phase voltages and two-phase currents. An estimated value for the third current can be calculated using samples from the first two. This method allows for the determination of active and reactive powers.
In conclusion, SVCs remain a valuable tool for voltage regulation and reactive power support in metallurgical facilities. However, their deployment should be complemented by advanced monitoring and filtering technologies to fully meet modern power quality standards in converter-dominated systems.
Based on the information provided, plant engineers must select the SVC system based on its benefits, such as economic factors, costs, and adaptability. However, it is worth mentioning that, despite the higher cost, the usage of, say, a STATCOM is economically justified because it assures reliable and steady network functioning, particularly in emergency situations. Furthermore, in low-voltage situations, a STATCOM can offer more power than an SVC, which is especially important for the varied loads of a rolling mill.
Future studies will investigate the use of improved reactive power compensation methods and technologies, such as hybrid SVC–STATCOM systems or active filters. The current SVC technology significantly improves reactive power distribution and voltage stability, but total harmonic distortion (ATHD) remains high. Hybrid methods that include STATCOMs and filters could better adjust for both steady-state and transient distortions. Similarly, active power filters have been effective in suppressing specific harmonic orders.
