Article

Heat Dissipation and Structural Optimization of Cylindrical Lithium-Ion Batteries with Phase Change Material–Liquid Hybrid Cooling: A Numerical Study

1
Electric Power Research Institute of Guizhou Power Grid Co., Ltd., Guiyang 550002, China
2
State Key Laboratory of Public Big Data, College of Computer Science and Technology, Guizhou University, Guiyang 550025, China
*
Author to whom correspondence should be addressed.
Energies 2025, 18(23), 6108; https://doi.org/10.3390/en18236108 (registering DOI)
Submission received: 10 October 2025 / Revised: 16 November 2025 / Accepted: 17 November 2025 / Published: 22 November 2025

Abstract

This work explores the thermal management of cylindrical lithium-ion batteries used in electric vehicles by introducing a combined cooling approach that couples phase-change materials (PCM) with a liquid-based cooling loop. Fluent-based numerical simulations are conducted to first examine the effects of battery spacing and ambient temperature on PCM cooling performance, from which the optimal spacing is identified. Building on this foundation, a coupled PCM–liquid cooling model is developed to evaluate the impacts of liquid-channel inlet configuration, coolant flow velocity, and inlet temperature. Results show that varying the inlet position has little impact when the outlet is fixed. Increasing coolant velocity lowers the peak cell temperature and the extent of PCM melting but enlarges the temperature difference, reaching 5.03 °C at 0.0075 m/s, which exceeds the recommended safety threshold. Lowering the coolant inlet temperature further decreases the peak temperature but also deteriorates temperature uniformity. To simultaneously suppress both the maximum temperature (Tmaxi) and temperature gradient, two structural optimization schemes are proposed. Among them, distributing liquid cooling plates evenly above and below the battery pack achieves the best overall performance. The findings demonstrate the strong cooling potential of the PCM–liquid hybrid system and offer theoretical support for the design and optimization of advanced battery thermal management systems.

1. Introduction

Against the backdrop of dual carbon goals, electric vehicles powered by renewable energy have emerged as a key focus and cutting-edge direction in the energy and transportation sectors. Since power batteries are the primary energy carriers in electric vehicles and energy storage applications, their reliable and efficient performance is essential for advancing the high-quality development of the new energy vehicle industry. Owing to their high operating voltage, remarkable energy density, and long cycling durability [1,2], lithium-ion batteries (LIBs) remain the most advantageous choice among current power battery technologies. Nevertheless, LIBs are highly sensitive to temperature variations, and their efficiency, reliability, and safety can be significantly compromised under inappropriate thermal conditions [3]. In extreme cases, this may trigger hazardous phenomena such as thermal runaway. Generally, LIBs operate most effectively within 25~50 °C [4], while the Tmaxi difference among cells in a module should be limited to within 5 °C [5,6]. Therefore, the design and optimization of high-efficiency battery thermal management systems (BTMS) have become a critical research focus to ensure optimal performance and operational safety of LIBs [7].
Air, liquid, phase-change, and hybrid cooling represent the primary strategies currently used for LIB thermal management [8]. Among them, phase change materials (PCM) have attracted considerable attention due to their intrinsic temperature-regulating capacity, which allows for efficient heat dissipation and a stable thermal environment for electronic devices [9]. Pioneering work by Hallaj and Selman [10] introduced PCM into battery thermal management and confirmed that PCM integration could reduce the battery’s peak operating temperature by about 8 K compared with air cooling. Xu et al. [11] and Fan et al. [12] presented metal-fin-enhanced PCM cooling schemes, where the fin geometry promotes heat transfer and leads to notable improvements in system thermal performance. However, with the continuous increase in the energy density of lithium-ion batteries, research has gradually shifted toward hybrid phase change cooling technologies that integrate both active and passive strategies. Such approaches are increasingly replacing conventional single-mode cooling methods and have become an important direction of development. Among various active cooling techniques, liquid cooling is generally considered superior to forced air cooling due to its higher convective heat transfer coefficient [13,14,15,16]. Consequently, coupling PCM with liquid cooling is regarded as a promising strategy for improving the heat dissipation capability and overall thermal safety of lithium-ion batteries.
Recent technological advances also highlight the importance of high-precision thermal monitoring and multi-physics coupling in BTMS development. For instance, newly proposed in situ sensor calibration methods based on virtual samples and autoencoder frameworks significantly improve the accuracy and reliability of thermal measurements in complex thermal systems [17]. Moreover, frontier studies on multi-field-coupled particle-flow dynamic behaviors in microreactors, together with emerging ultrasonic control methods, offer new insights into designing next-generation hybrid thermal management architectures [18]. These frontier developments underscore the importance of integrating advanced sensing, modeling, and multi-physics strategies into BTMS research. Huang et al. [8] developed a new cell-based composite cooling configuration. Their analysis indicated that thicker PCM increases the latent heat buffering period, but elevated coolant flow rates may degrade system efficiency and are therefore not recommended. Li et al. [19] proposed a hybrid thermal management system coupling PCM with corrugated microchannel liquid cooling. They found that higher coolant flow rates substantially reduce temperature gradients in the module and cells, and that enhancing PCM thermal conductivity lowers the maximum pack temperature. Weng et al. [20] developed a 5 × 5 cylindrical battery pack model using a PCM–liquid hybrid cooling system. Simulation results showed that coolant flow rate and ambient temperature notably affect thermal performance; at 0.05 m/s, both peak temperature and temperature uniformity remained within safety thresholds, with Tmaxi rising as ambient temperature increased. Zheng et al. [21] conducted simulations of a hybrid PCM–liquid cooling configuration, revealing that composite PCMs significantly improve heat transfer to prismatic cells and illustrating the importance of optimizing PCM thermal conductivity for effective thermal management. Zhang et al. [22] proposed an innovative hybrid system that integrates a Chinese knot–shaped liquid cooling plate with PCM. Their study demonstrated superior cooling performance compared with traditional hybrid systems: when the channel spacing (LL) increased from 3 mm to 6 mm, the Tmaxi and temperature difference were reduced by 0.63 K and 0.15 K, respectively, while maintaining a constant coefficient of performance (COP). Overall, the findings indicate that optimized composite cooling designs are essential for enhancing BTMS efficiency.
This study focuses on 18,650 cylindrical lithium-ion batteries and develops a 1 × 2 battery pack heat generation model. Numerical simulations are performed using Fluent (2024.R1) software in combination with a controlled variable method to investigate the thermal behavior of a hybrid PCM–liquid cooling system. First, a pure PCM model is employed to analyze the effects of cell spacing and ambient temperature on the heat dissipation performance of the battery pack. Building on these findings, a coupled PCM–liquid cooling system is developed to study the effect of flow rate, coolant inlet location, and inlet temperature on overall thermal performance. Finally, structural optimization is performed to determine the configuration that maximizes the heat dissipation efficiency of cylindrical lithium-ion batteries.

2. Numerical Simulation

2.1. Geometrical Model

Referring to Figure 1, the study uses 18,650 cylindrical lithium-ion batteries and constructs two physical models: a PCM cooling model and a hybrid PCM–liquid cooling model. The battery module consists of two cells arranged with a spacing d = 5 mm. The PCM section adopts a rectangular cavity structure filled with paraffin, where the gap between the PCM and the battery surface is equal to the cell spacing. In Figure 1a, the overall system dimensions are 51 mm × 28 mm × 65 mm. Figure 1b shows the coupled model, in which a liquid cooling plate is added beneath the phase change cooling structure. With length and width identical to those of the PCM battery pack and a height of 6 mm, the plate is designed with an internal rectangular flow channel. Both the inlet and outlet cross-sections have dimensions of 2 mm × 2 mm. This work uses paraffin as the phase change material, aluminum for the liquid cooling plate, and water as the coolant. The thermophysical parameters of the battery and associated materials are summarized in Table 1 and Table 2.

2.2. Thermal Model

2.2.1. Battery Model

In this study, the numerical simulations employ the following assumptions to reduce the complexity of the lithium-ion battery thermal model and facilitate computation:
(1)
The battery is represented as a homogeneous solid with a constant heat generation rate per unit volume, and its thermal conductivity is defined as anisotropic [26];
(2)
The battery’s thermophysical properties are considered constant and independent of external factors;
(3)
The battery’s internal heat generation is treated as uniformly distributed.
(4)
Thermal radiation effects are neglected.
With the aforementioned assumptions, the governing energy conservation equation for the battery is formulated as:
ρ b C p , b T b t = λ b 2 T b + q b
where the subscript b represents the physical properties of the battery. ρ b , C p , b , T b , λ b and q b correspond to the density, specific heat, temperature, thermal conductivity, and volumetric heat generation, respectively.

2.2.2. Phase Change Material Cooling Model

In this study, the Solidification/Melting model in ANSYS Fluent (2024.R1), based on the enthalpy method, was employed to address the phase change problems. Given the complexity of heat transfer during phase change, the following assumptions were introduced to simplify the simulation [27,28,29,30]:
(1)
The liquid PCM after melting is considered incompressible.
(2)
The PCM’s thermophysical properties are considered constant and independent of external conditions.
(3)
Thermal radiation is neglected.
(4)
The PCM is assumed to undergo no volume change during the phase transition process.
This model satisfies the three fundamental conservation laws, and the energy conservation equation is expressed as:
ρ p c m H t = λ p c m 2 T p c m
H = β L + T 0 T p c m C p c m d T
β 0 T p c m < T s T p c m T s T l T s T s T p c m 1 T l < T p c m
Here, ρ p c m , λ p c m , T p c m and C p c m are density, thermal conductivity, temperature, and specific heat, respectively; H , β , and L are phase-change enthalpy, liquid fraction, and latent heat of phase change, respectively; T s and T l are the melting temperature of PCM.

2.2.3. Liquid Cooling Model

Water was selected as the coolant, flowing through the liquid-cooling channels. For computational simplicity, the following assumptions were made:
(1)
Thermal contact resistance at the interfaces among the battery pack, PCM, and the liquid-cooling plate is neglected.
(2)
The coolant is treated as a single-phase, incompressible fluid under steady conditions.
(3)
The thermophysical properties of the liquid-cooling plate and coolant are assumed constant and temperature-independent.
Under these assumptions, the coolant is governed by the continuity, momentum, and energy equations, given as follows:
V w = 0
ρ w V w t + ρ w V w V w = P + μ w 2 V w
ρ w C p , w T w t + ρ w C p , w V w T w = λ w 2 T w
The energy equation of the liquid cooling plate is:
ρ A l C p , A l T A l t = λ A l 2 T A l
where the subscript w denotes the coolant. ρ w , V w , μ w , C p , w , λ w , T w are density, velocity vector, dynamic viscosity, specific heat capacity, thermal conductivity, and temperature, respectively. The subscript A l denotes the aluminum material (Al). ρ A l , λ A l and T A l are density, specific heat capacity, thermal conductivity, and temperature, respectively. Meanwhile, based on the selected coolant parameters and the chosen maximum flow velocity of 0.0075 m/s, calculations using Equations (9) and (10) yield a Reynolds number below 2000, indicating that the coolant flow remains laminar.
Re = ρ c υ c d c μ c
d c = 4 A c x c = 4 b c h c 2 b c + h c = 2 b c h c b c + h c
where d c , A c , h c , and b c are the length of the pipe, cross-sectional area, length, and width, respectively.

2.3. Initial Conditions and Boundary Conditions

The outer surface of the thermal management system undergoes convection with the surrounding air, and heat transfer coefficient is specified as 5 W/(m2·K) with an ambient temperature of 25 °C. The coolant enters through a velocity inlet with an imposed temperature of 25 °C, while the outlet is defined by a pressure boundary condition set to 0 Pa gauge. Initially, the battery, PCM, and liquid-cooling plate are considered thermally equilibrated, sharing an initial temperature of 25 °C.
The interface between the battery and the PCM is subject to the following boundary condition:
λ T b n = λ p c m T p c m n
Boundary conditions at the battery–liquid plate and PCM–liquid plate interfaces are defined as:
λ b T b n = λ A l T A l n
λ p c m T p c m n = λ A l T A l n
Convection governs heat transfer at the coolant–liquid channel interface, described by the following equation:
λ A l T A l n = h T A l T w
where T n is the temperature gradient in the Cartesian coordinate system, h is the convective heat transfer coefficient.

2.4. Grid Independence and Time-Step Independence Verification

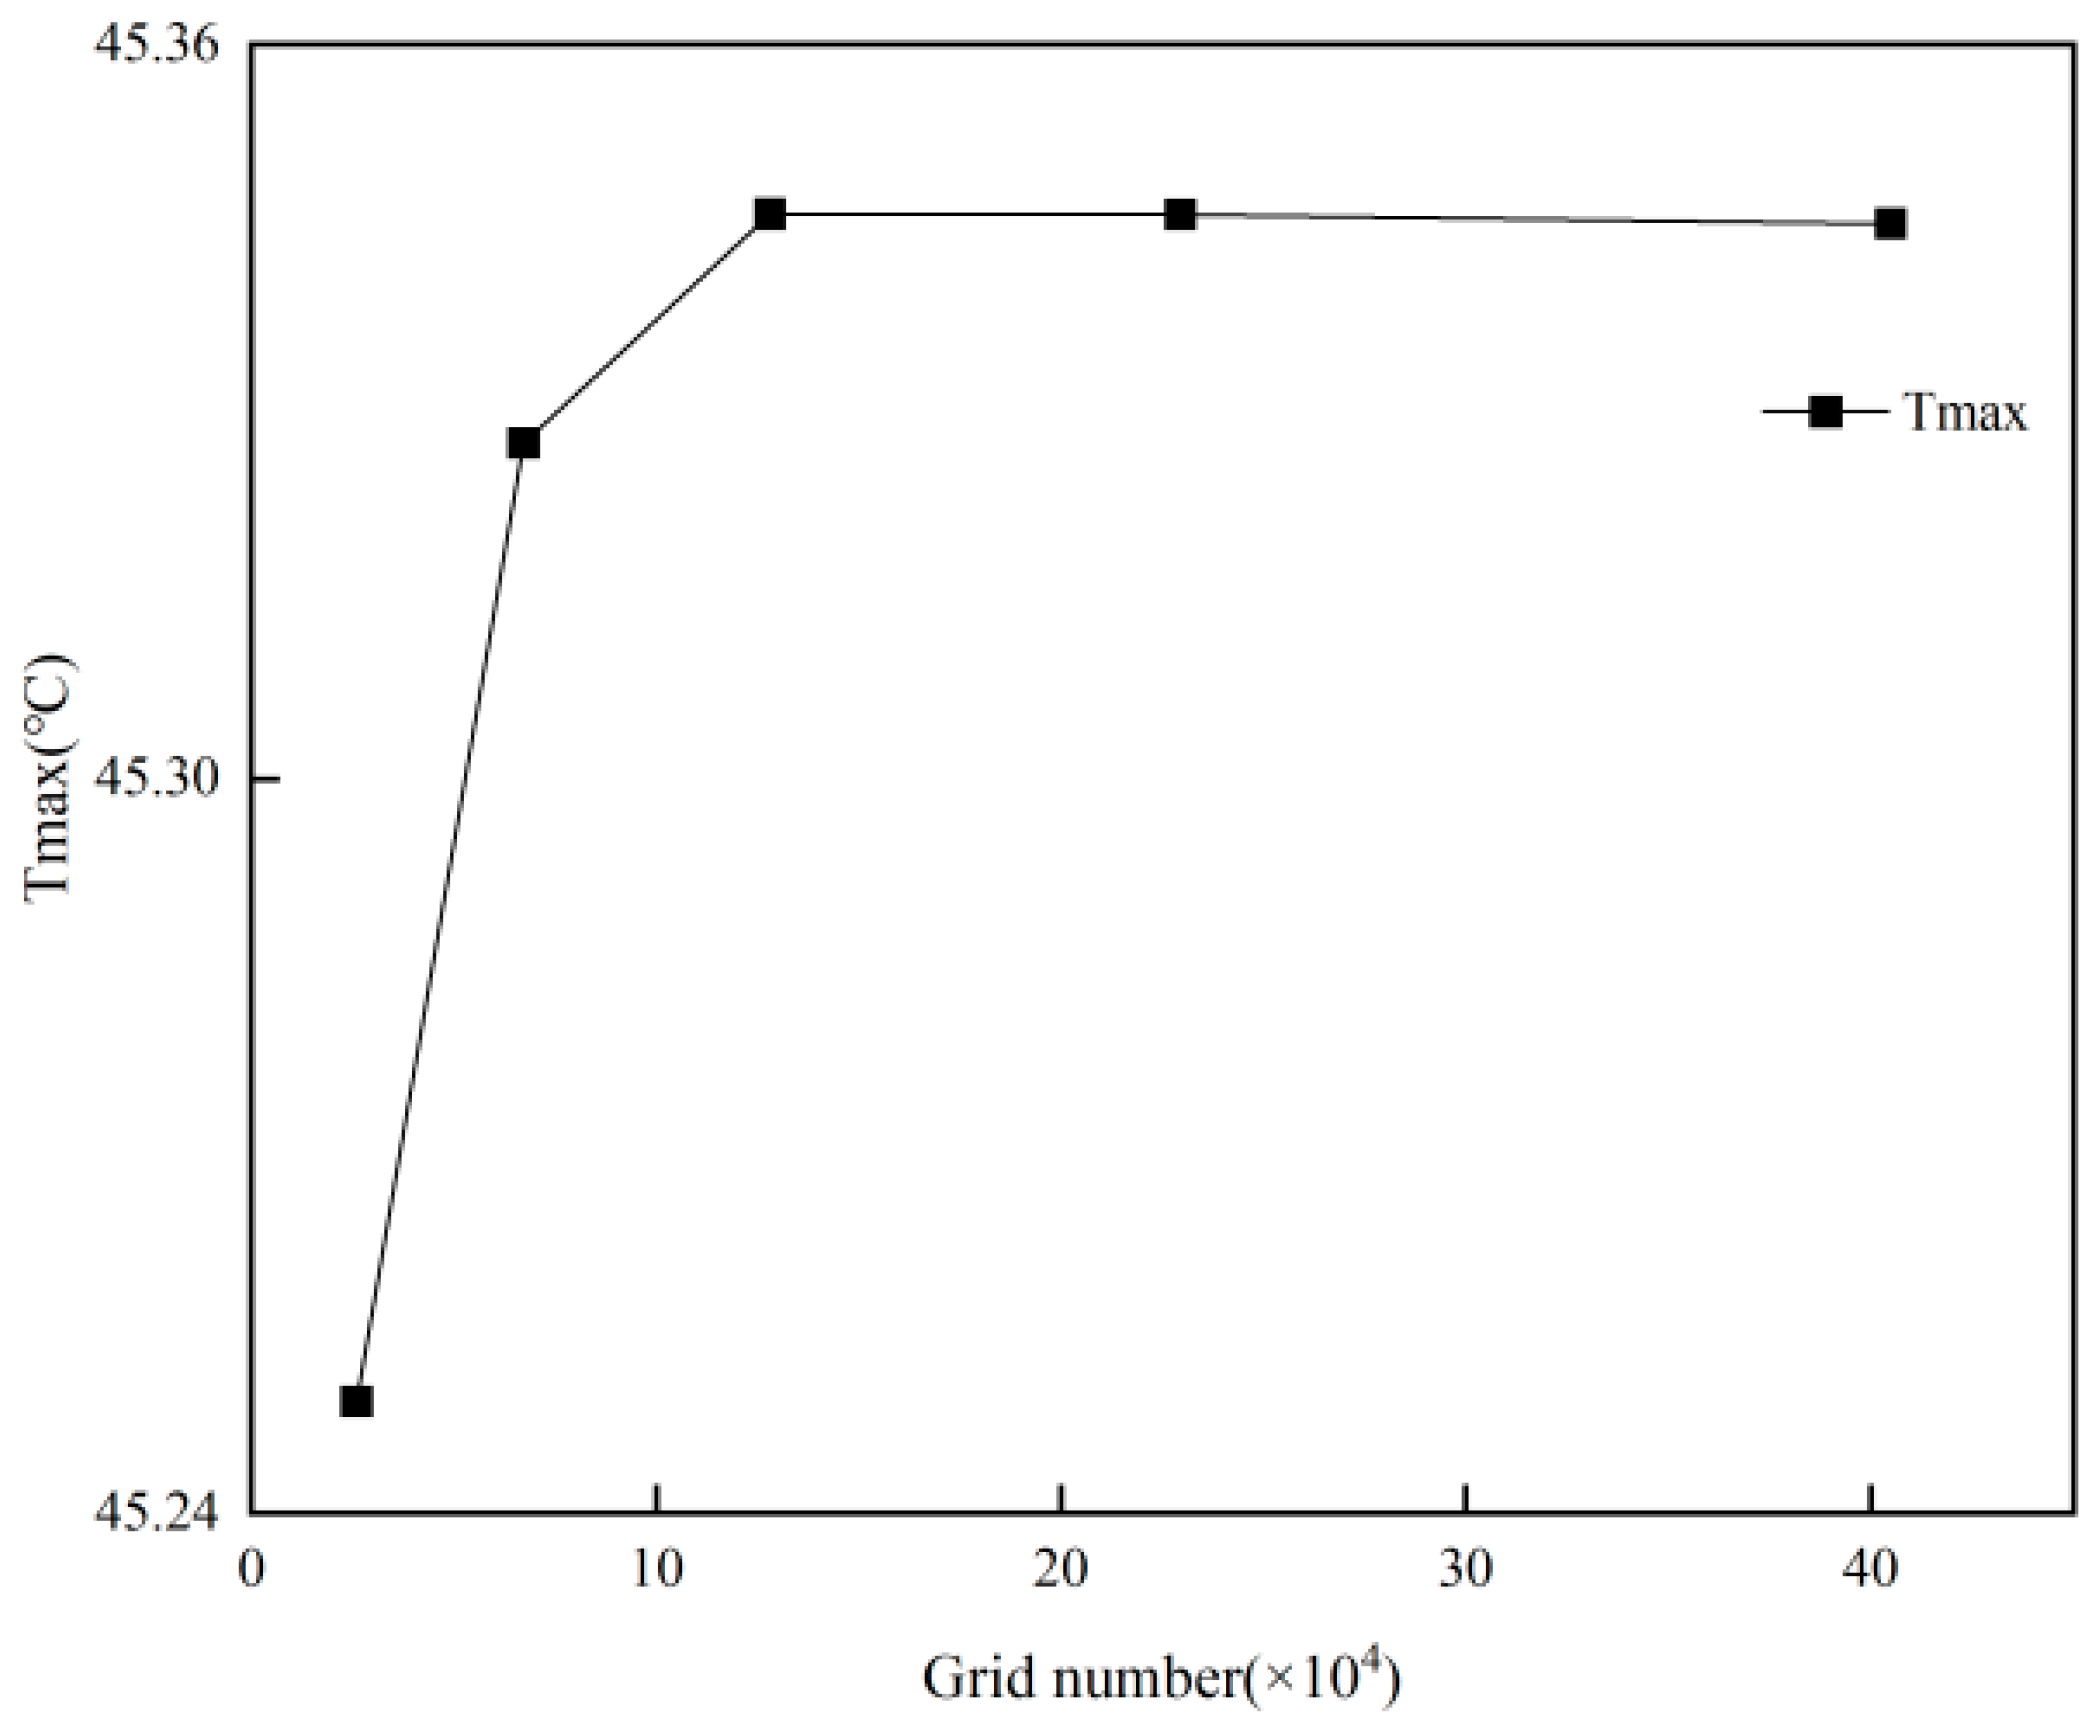
Following mesh generation, a grid independence test was performed to guarantee the accuracy of the lithium-ion battery simulation results. Taking the phase change cooling battery pack model as an example, five different mesh sizes—2.0 mm, 1.5 mm, 1.2 mm, 1.0 mm, and 0.8 mm—were tested, corresponding to mesh counts of 25,938; 67,144; 127,875; 229,020; and 403,686, respectively. Figure 2 illustrates the variation of the battery pack’s temperature with mesh count after discharging at a 3C rate for 2000 s. It can be observed that when the mesh count reaches 127,875, further refinement leads to negligible changes in the maximum battery temperature, indicating that the mesh size has little impact on the thermal results. Therefore, to balance computational accuracy and efficiency, the mesh size and node configuration corresponding to a mesh count of 127,875 were adopted for all subsequent simulations in this study.
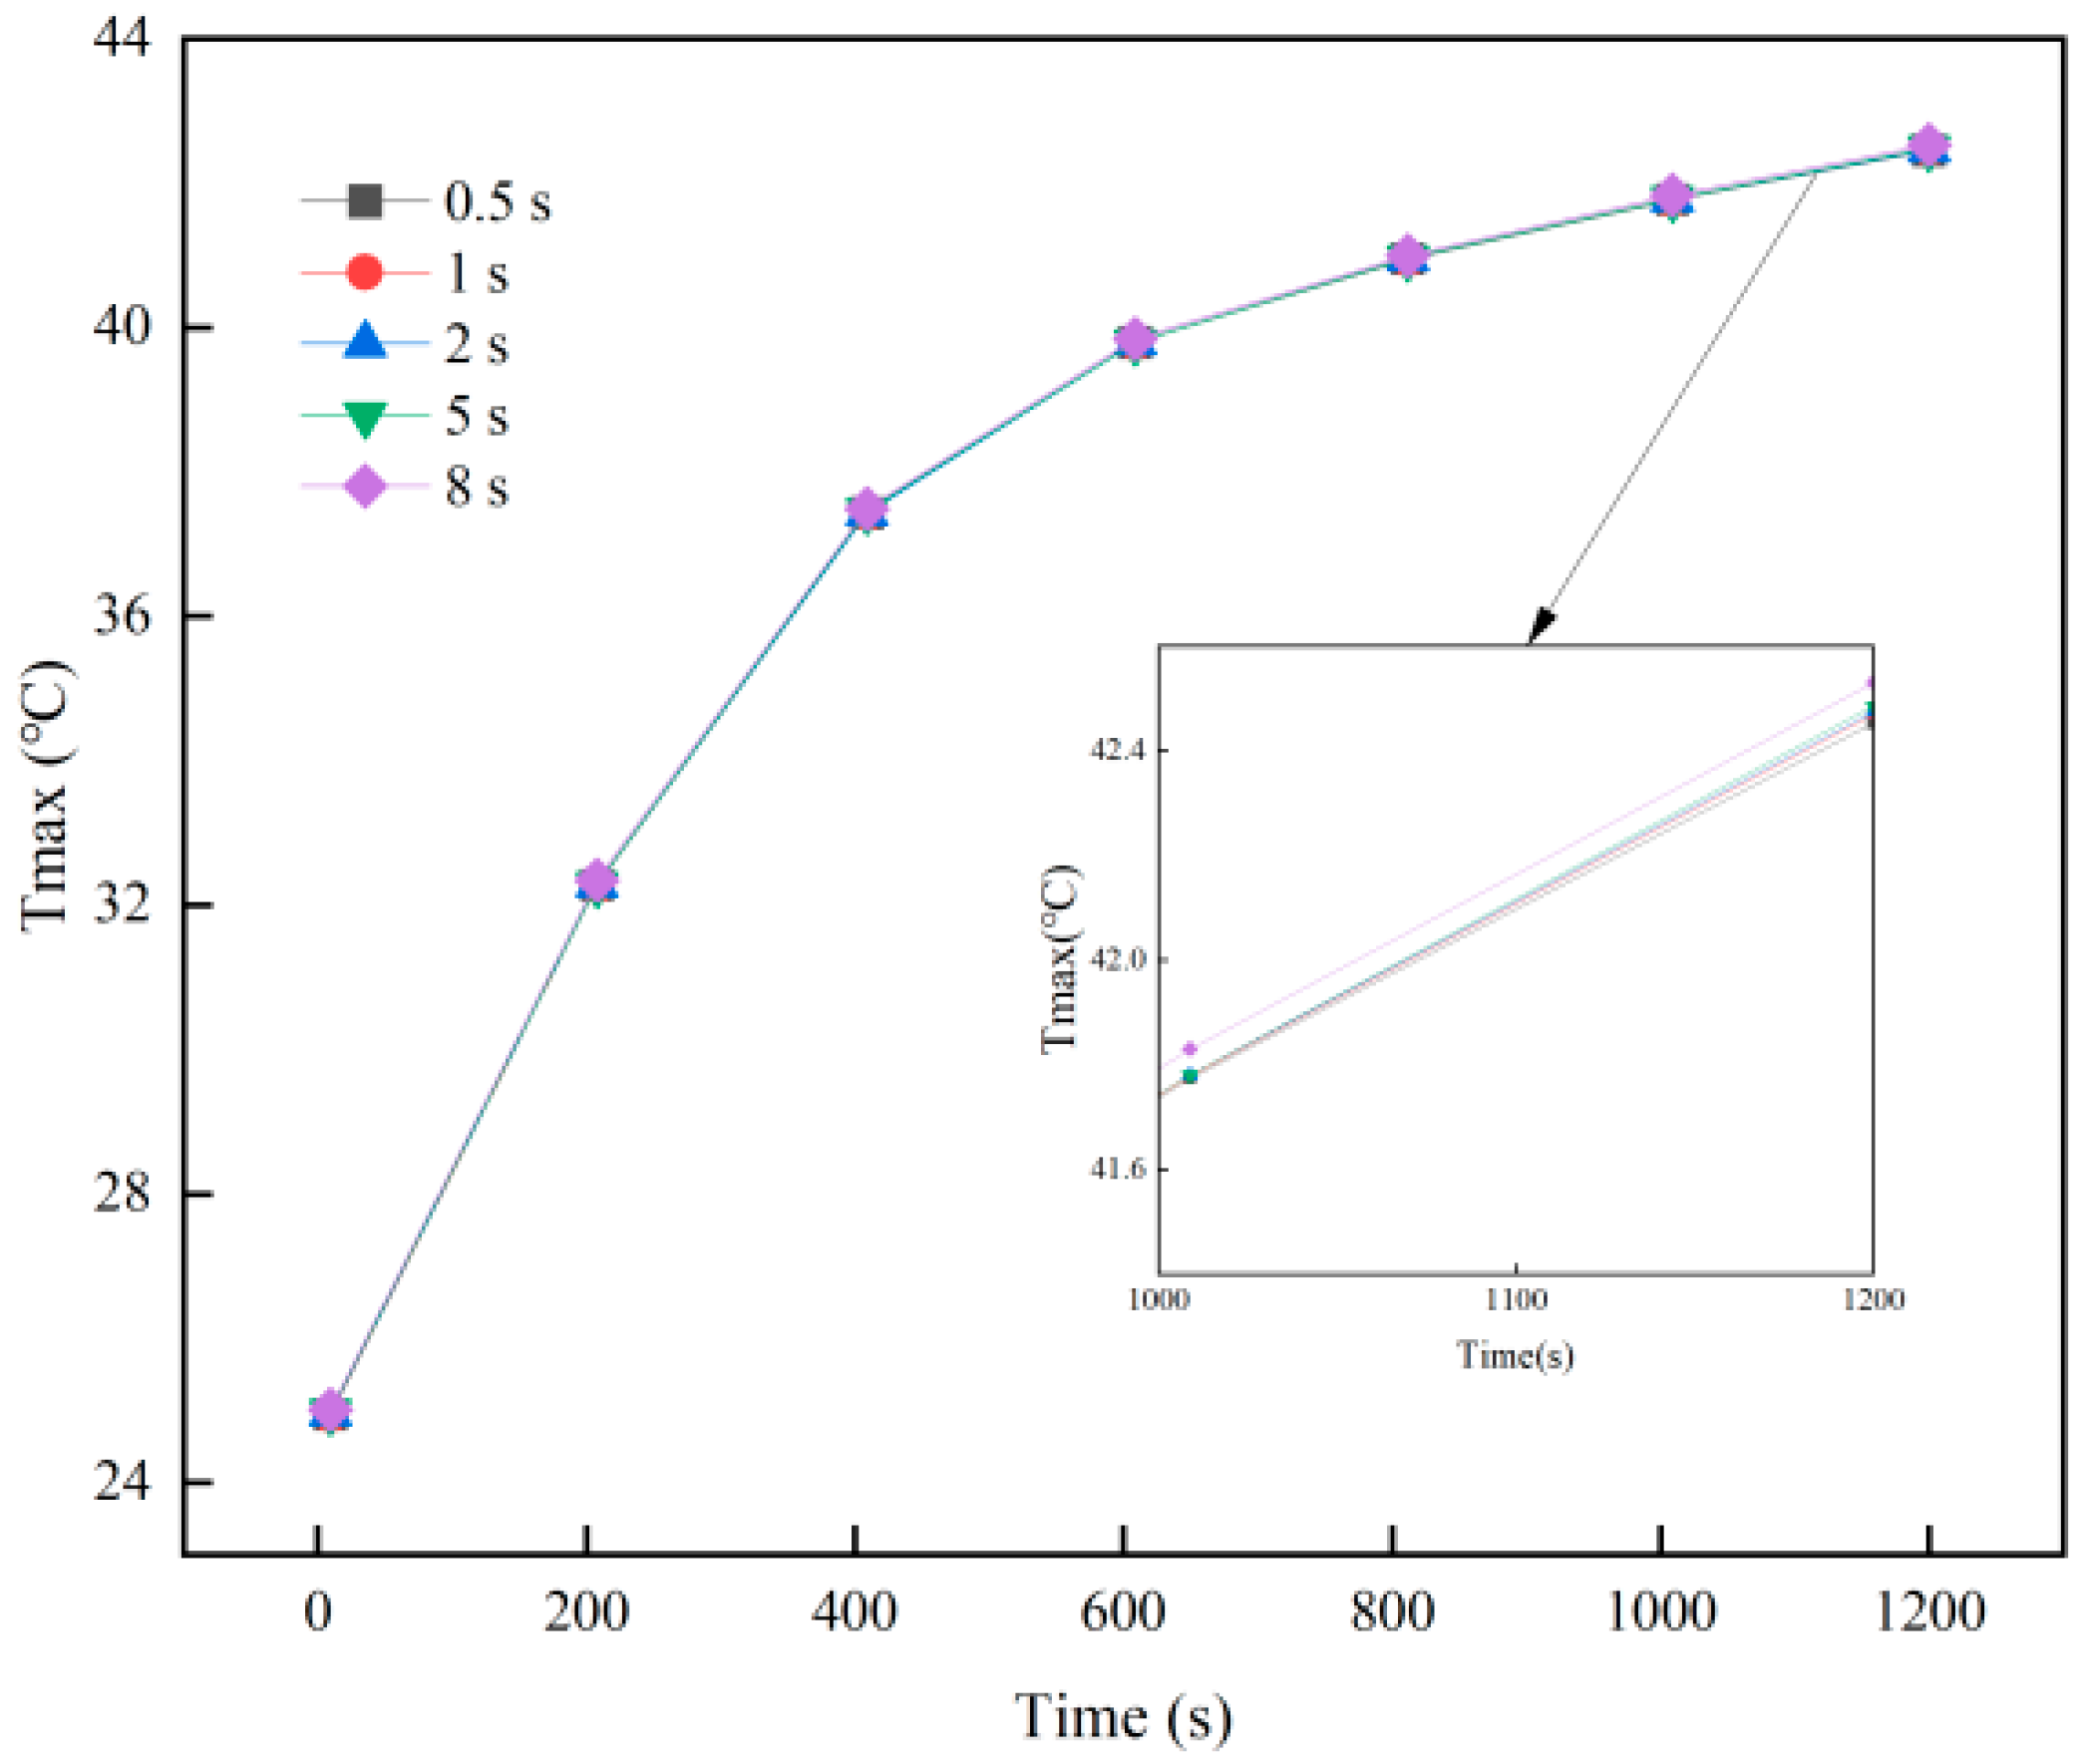
Under the determined mesh count of 127,875, a time-step independence test was conducted while keeping all other settings unchanged. Time steps of 0.5 s, 1 s, 2 s, 5 s, 8 s, and 20 s were used for simulation, with the results presented in Figure 3. The ΔTmaxi of the battery pack is not significantly affected by increasing the time step, and the ΔTmaxi deviation always below 0.01 °C, confirming the independence of the results with respect to time step. To optimize both accuracy and computational cost, a 2 s time step was applied throughout the simulations.

3. Results and Discussion

3.1. Effect of Battery Spacing on PCM–Battery Pack Cooling Performance

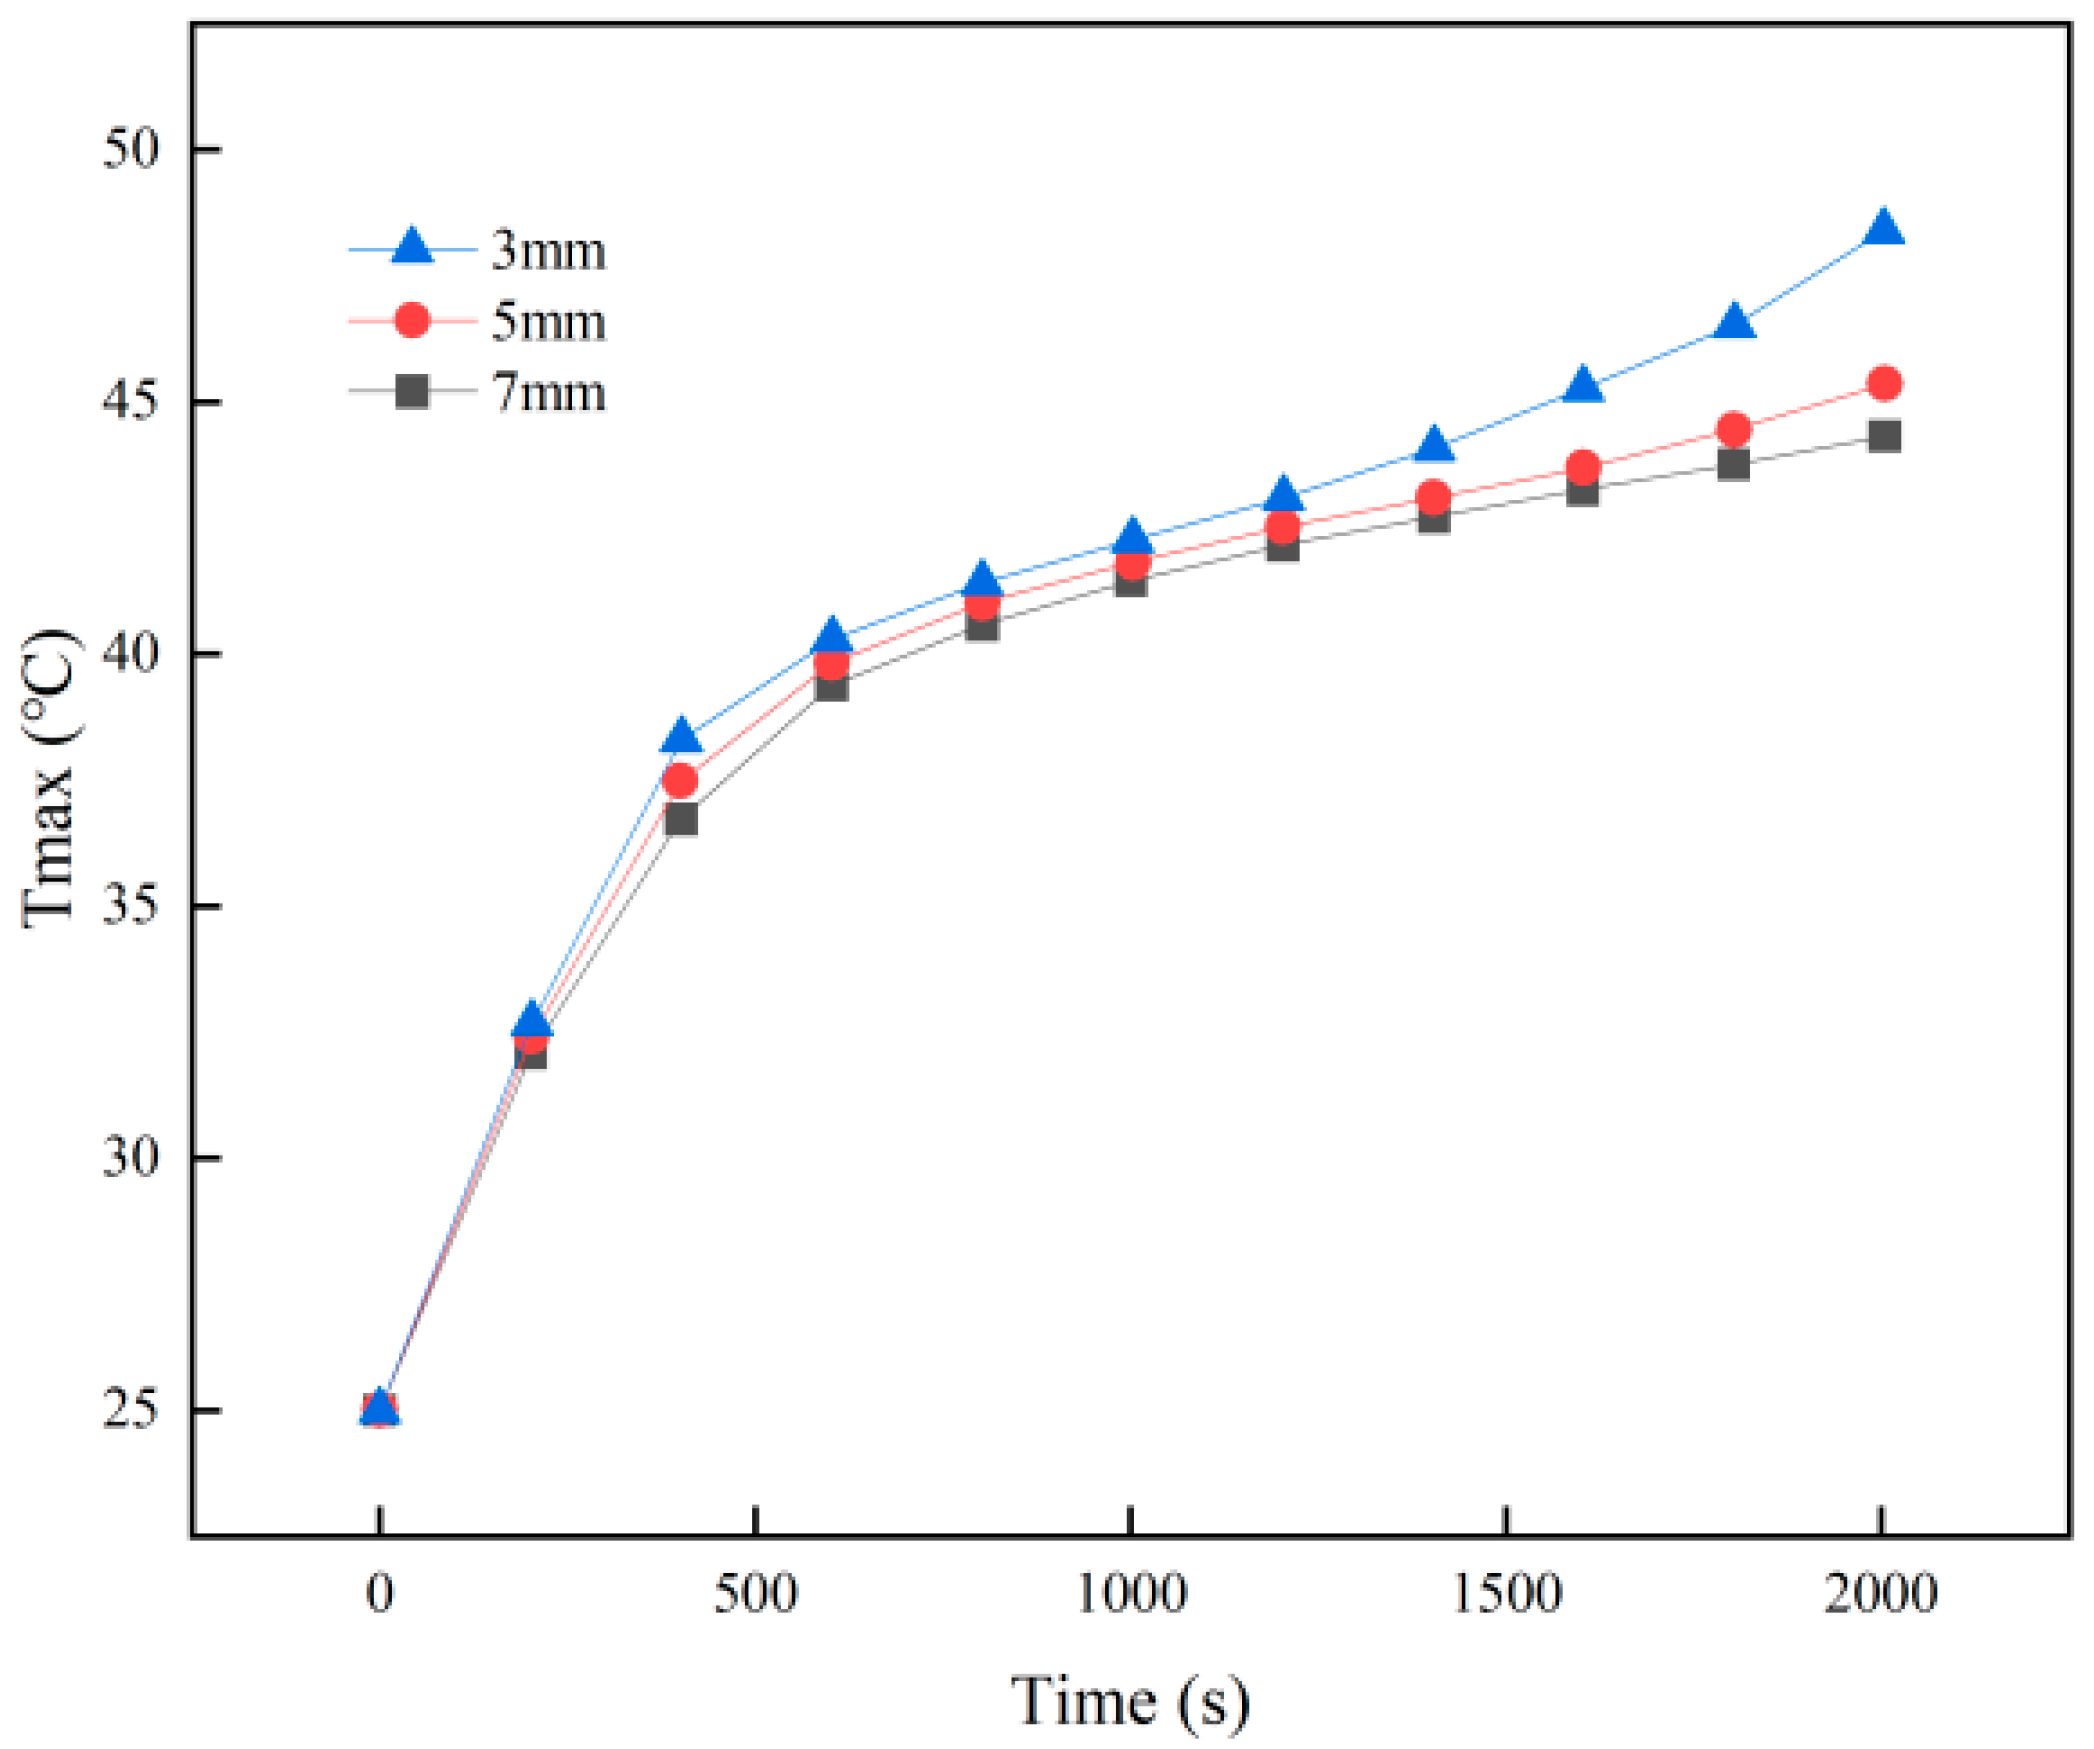
Figure 4 and Figure 5 present the temporal evolution of the Tmaxi and temperature difference of the battery pack for cell spacings of 3 mm, 5 mm, and 7 mm under 25 °C ambient temperature and a 3C discharge rate over 2000 s. At the early stage, the battery temperature rises quickly, and the PCM absorbs heat mainly via sensible heat. Once the battery reaches the PCM’s phase change temperature, latent heat absorption slows the rate of temperature rise. For a 3 mm cell spacing, the Tmaxi increases more sharply in the later stage because the PCM has largely melted, depleting its heat absorption capacity. At the end of discharge, the Tmaxi are 48.33 °C, 45.34 °C, and 44.33 °C for 3 mm, 5 mm, and 7 mm spacings, respectively, indicating that larger spacing effectively reduces peak temperatures. Correspondingly, the ΔTmaxi decrease from 3.93 °C to 2.95 °C as spacing increases, reflecting improved thermal uniformity within the battery pack.
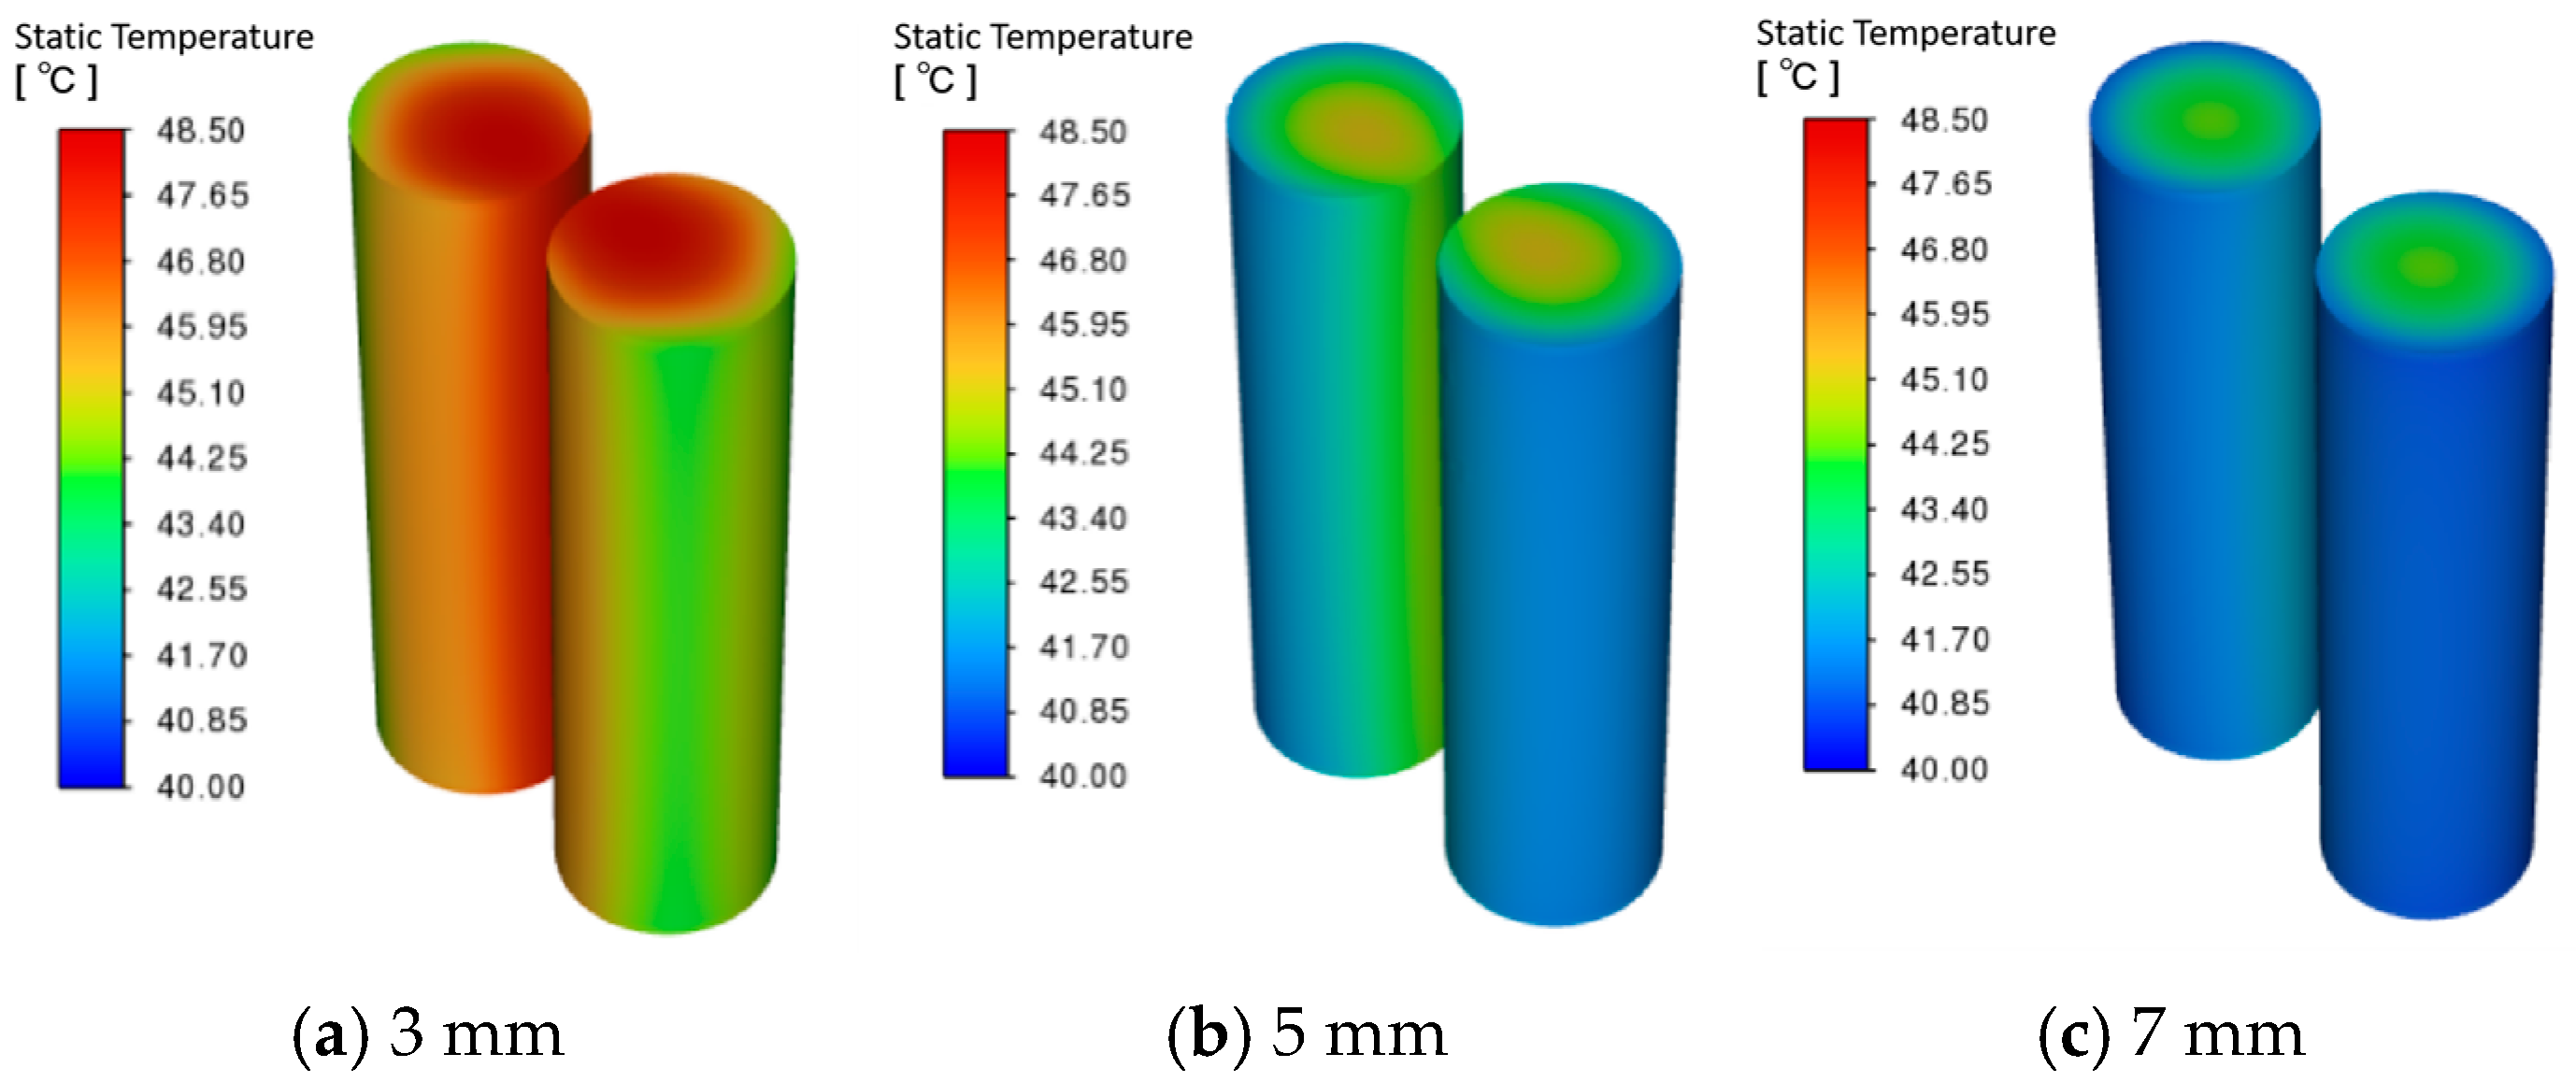
As illustrated in Figure 6, the batteries display comparable temperature distribution patterns across the three configurations. Tmaxi are observed at the cell centers and at locations where cells are nearest to each other, with a gradual radial temperature decrease. An increase in cell spacing leads to a thicker PCM layer, thereby promoting a progressive reduction in the battery pack’s Tmaxi.
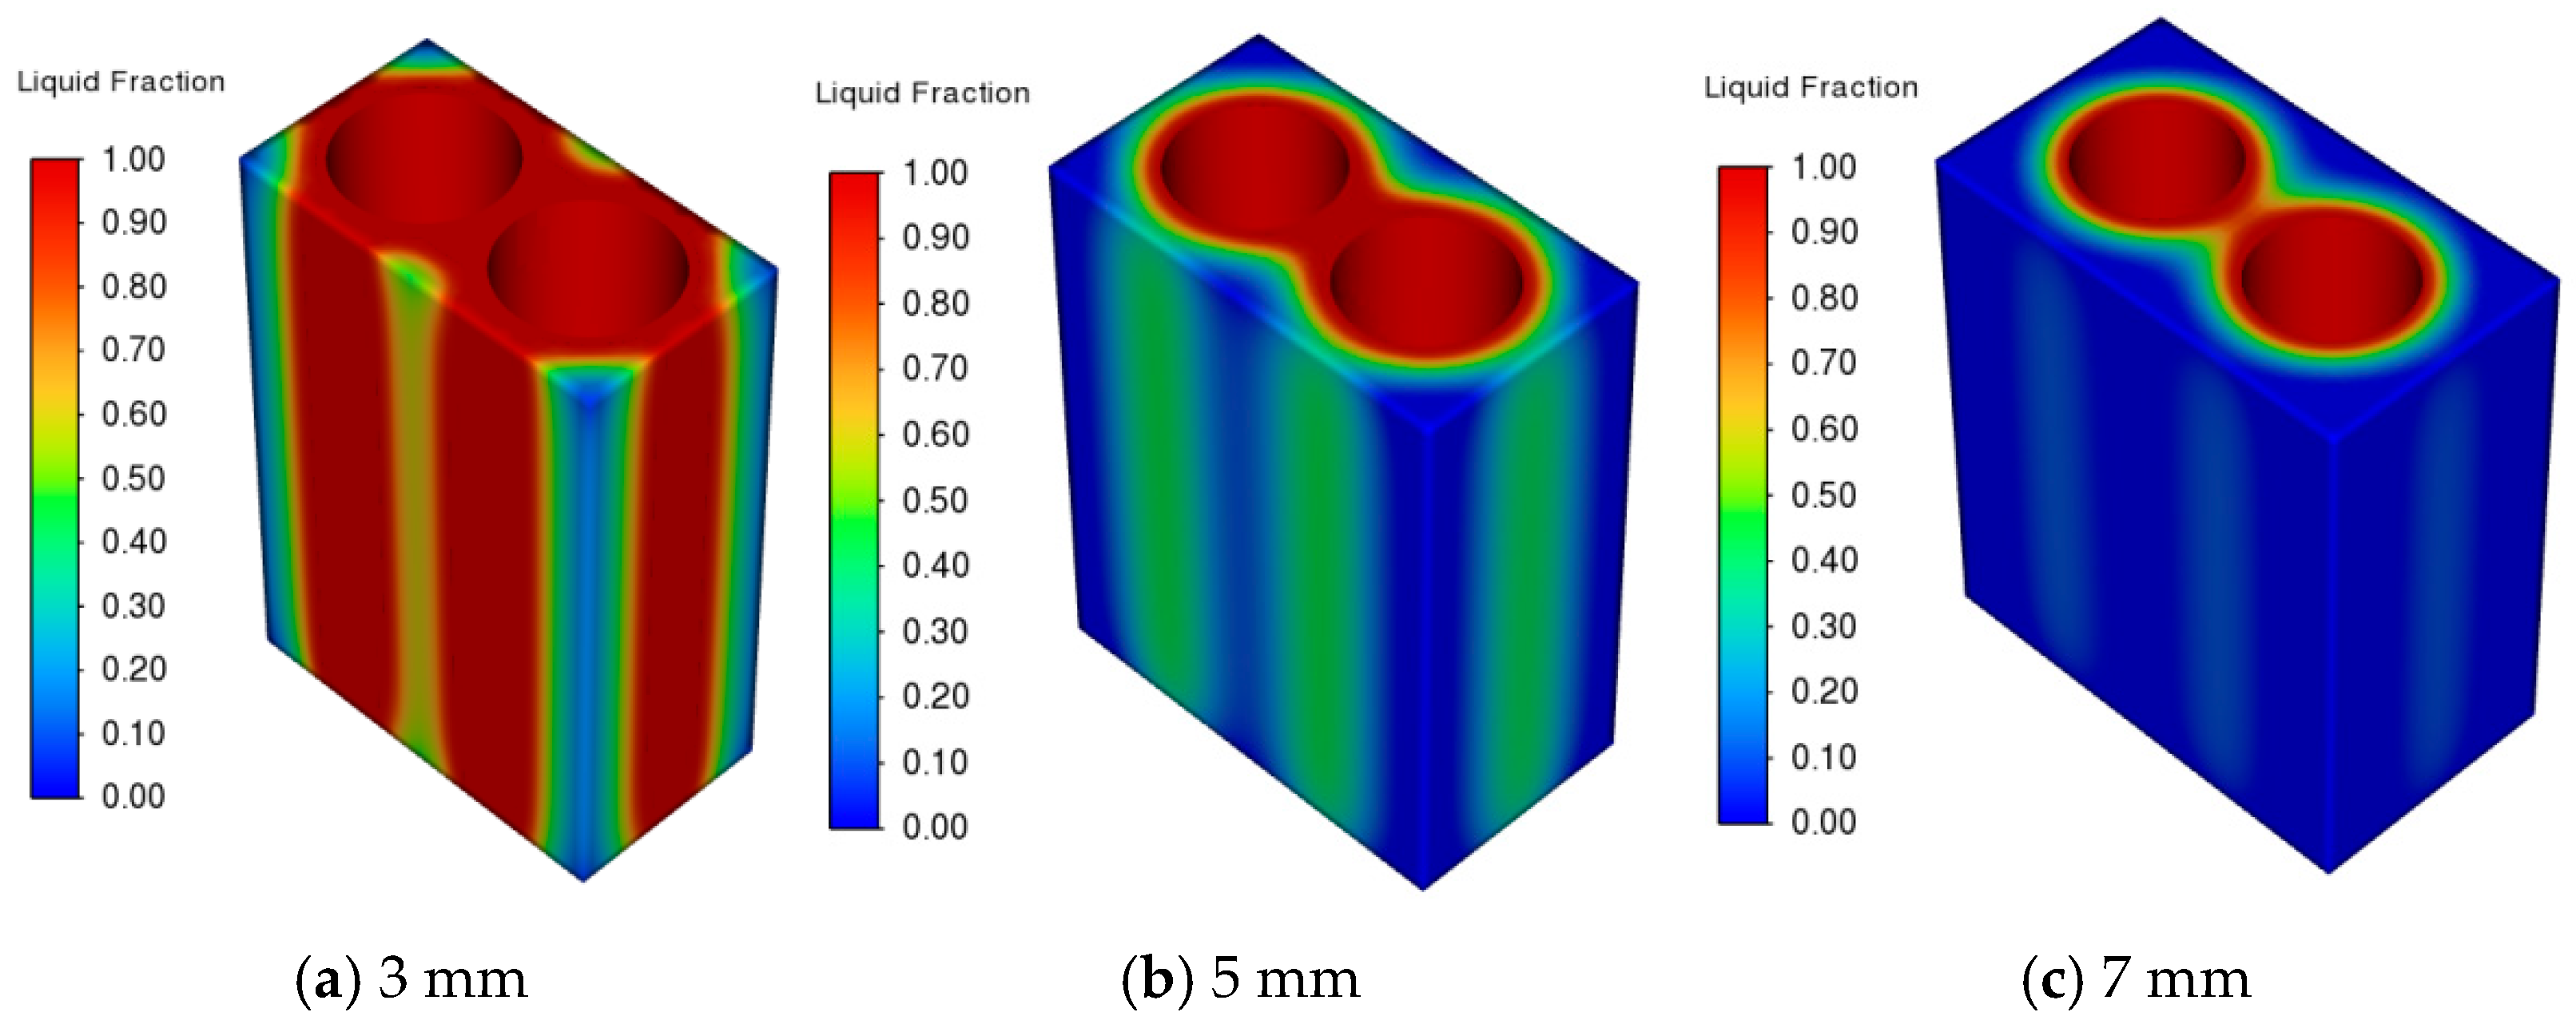
Figure 7 presents the PCM liquid fraction contours. Under all three configurations, the PCM in the inner region of the module exhibits a higher degree of melting compared to the outer region, as the batteries act as heat sources, causing the PCM adjacent to their surfaces to undergo more pronounced phase changes. For a cell spacing of 3 mm, the average liquid fraction at the end of discharge reaches 88.35%, indicating that a substantial portion of the PCM has fully melted and its remaining heat absorption capacity is limited. Reduced cooling performance can threaten the battery pack’s thermal stability and safety, possibly shortening its operational lifespan. Conversely, at a spacing of 7 mm, only a small fraction of the PCM melts, leaving much of its latent heat capacity unused. Additionally, the increased PCM volume increases material usage and the overall mass of the system, thereby reducing energy density. Considering both thermal performance and material efficiency, a cell spacing of 5 mm achieves good temperature uniformity and effective thermal management. Therefore, a spacing of 5 mm is adopted for subsequent studies.

3.2. Effect of Ambient Temperature on PCM–Battery Pack Cooling Performance

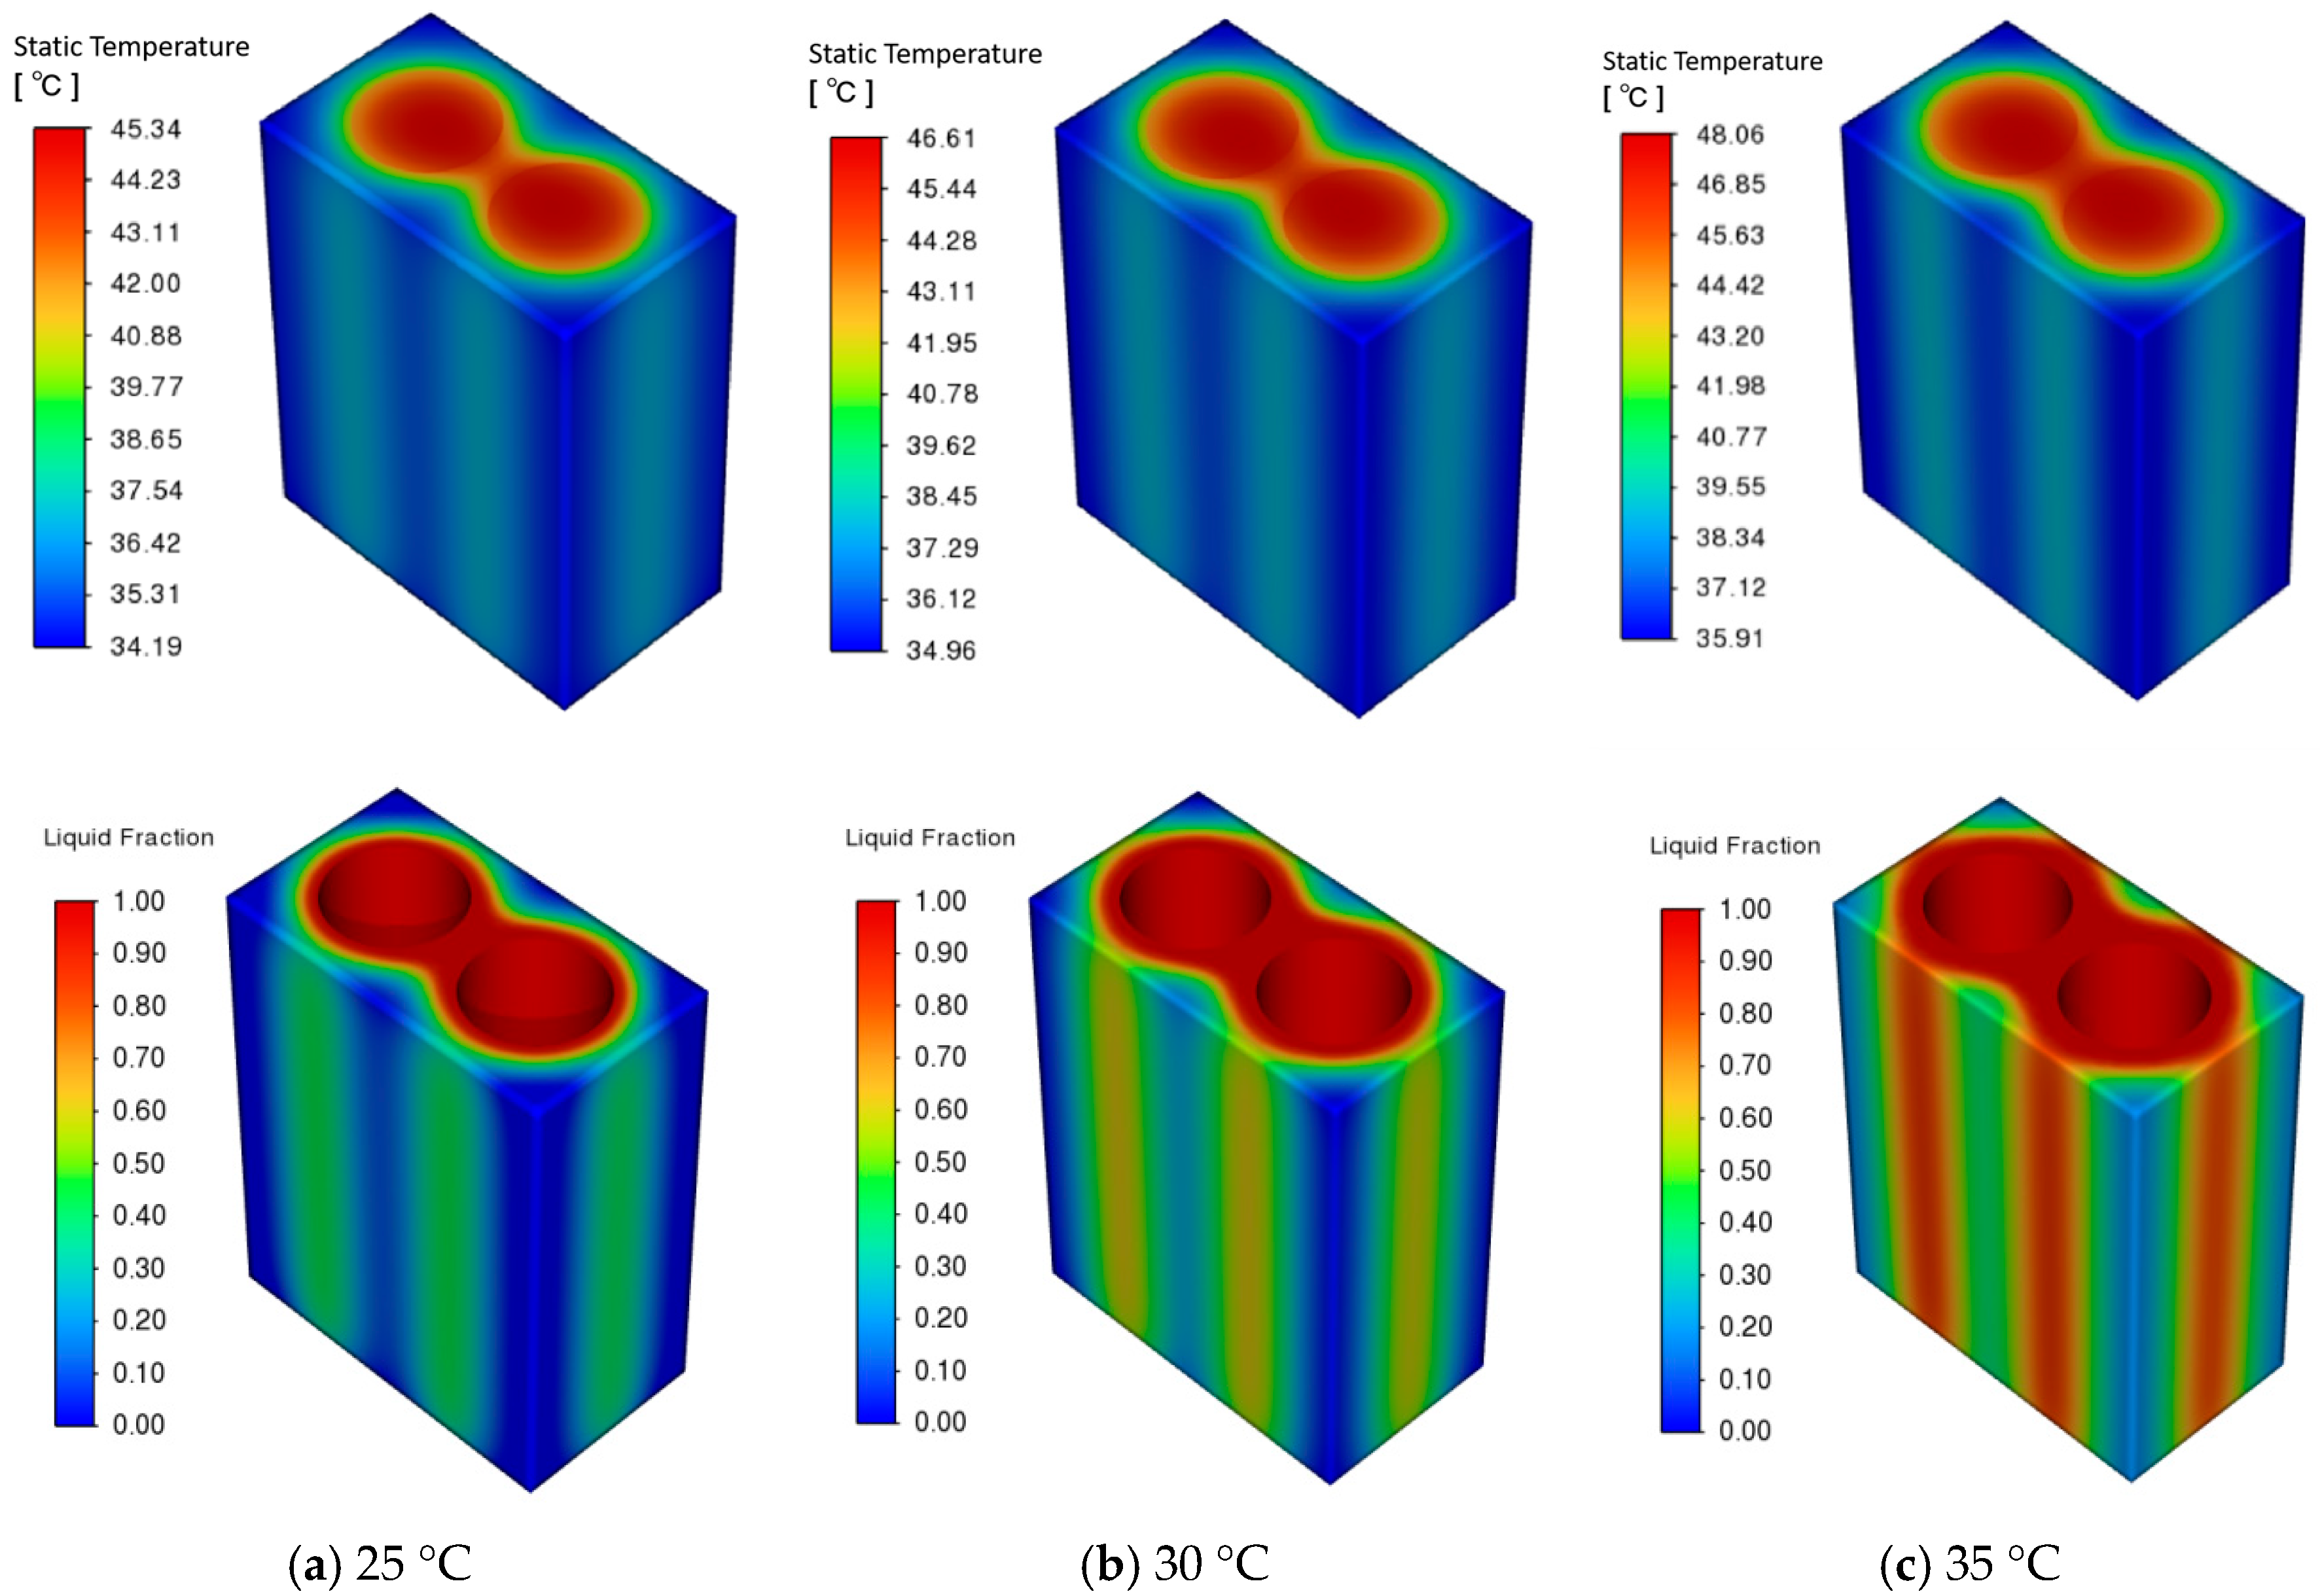
Based on the previously determined battery arrangement, numerical simulations were conducted under three ambient temperatures: 25 °C, 30 °C, and 35 °C. Under a 3C discharge for the 2000 s, with all other parameters held constant, the variations of the battery pack temperature and the PCM average liquid fraction over time were analyzed. As shown in Figure 8, the maximum battery temperature increases with ambient temperature. At the end of discharge, the Tmaxi reach 45.34 °C, 46.61 °C, and 48.06 °C for ambient temperatures of 25 °C, 30 °C, and 35 °C, respectively, all remaining within the safe operating range. The highest temperature occurs slightly offset from the battery center, due to conduction-dominated heat transfer that causes heat to converge in this region during discharge. The PCM liquid fraction contours indicate that the PCM near the battery surface is almost fully melted, significantly reducing its heat absorption capacity. As a result, heat dissipation in this region is limited, leading to a rapid local temperature rise.
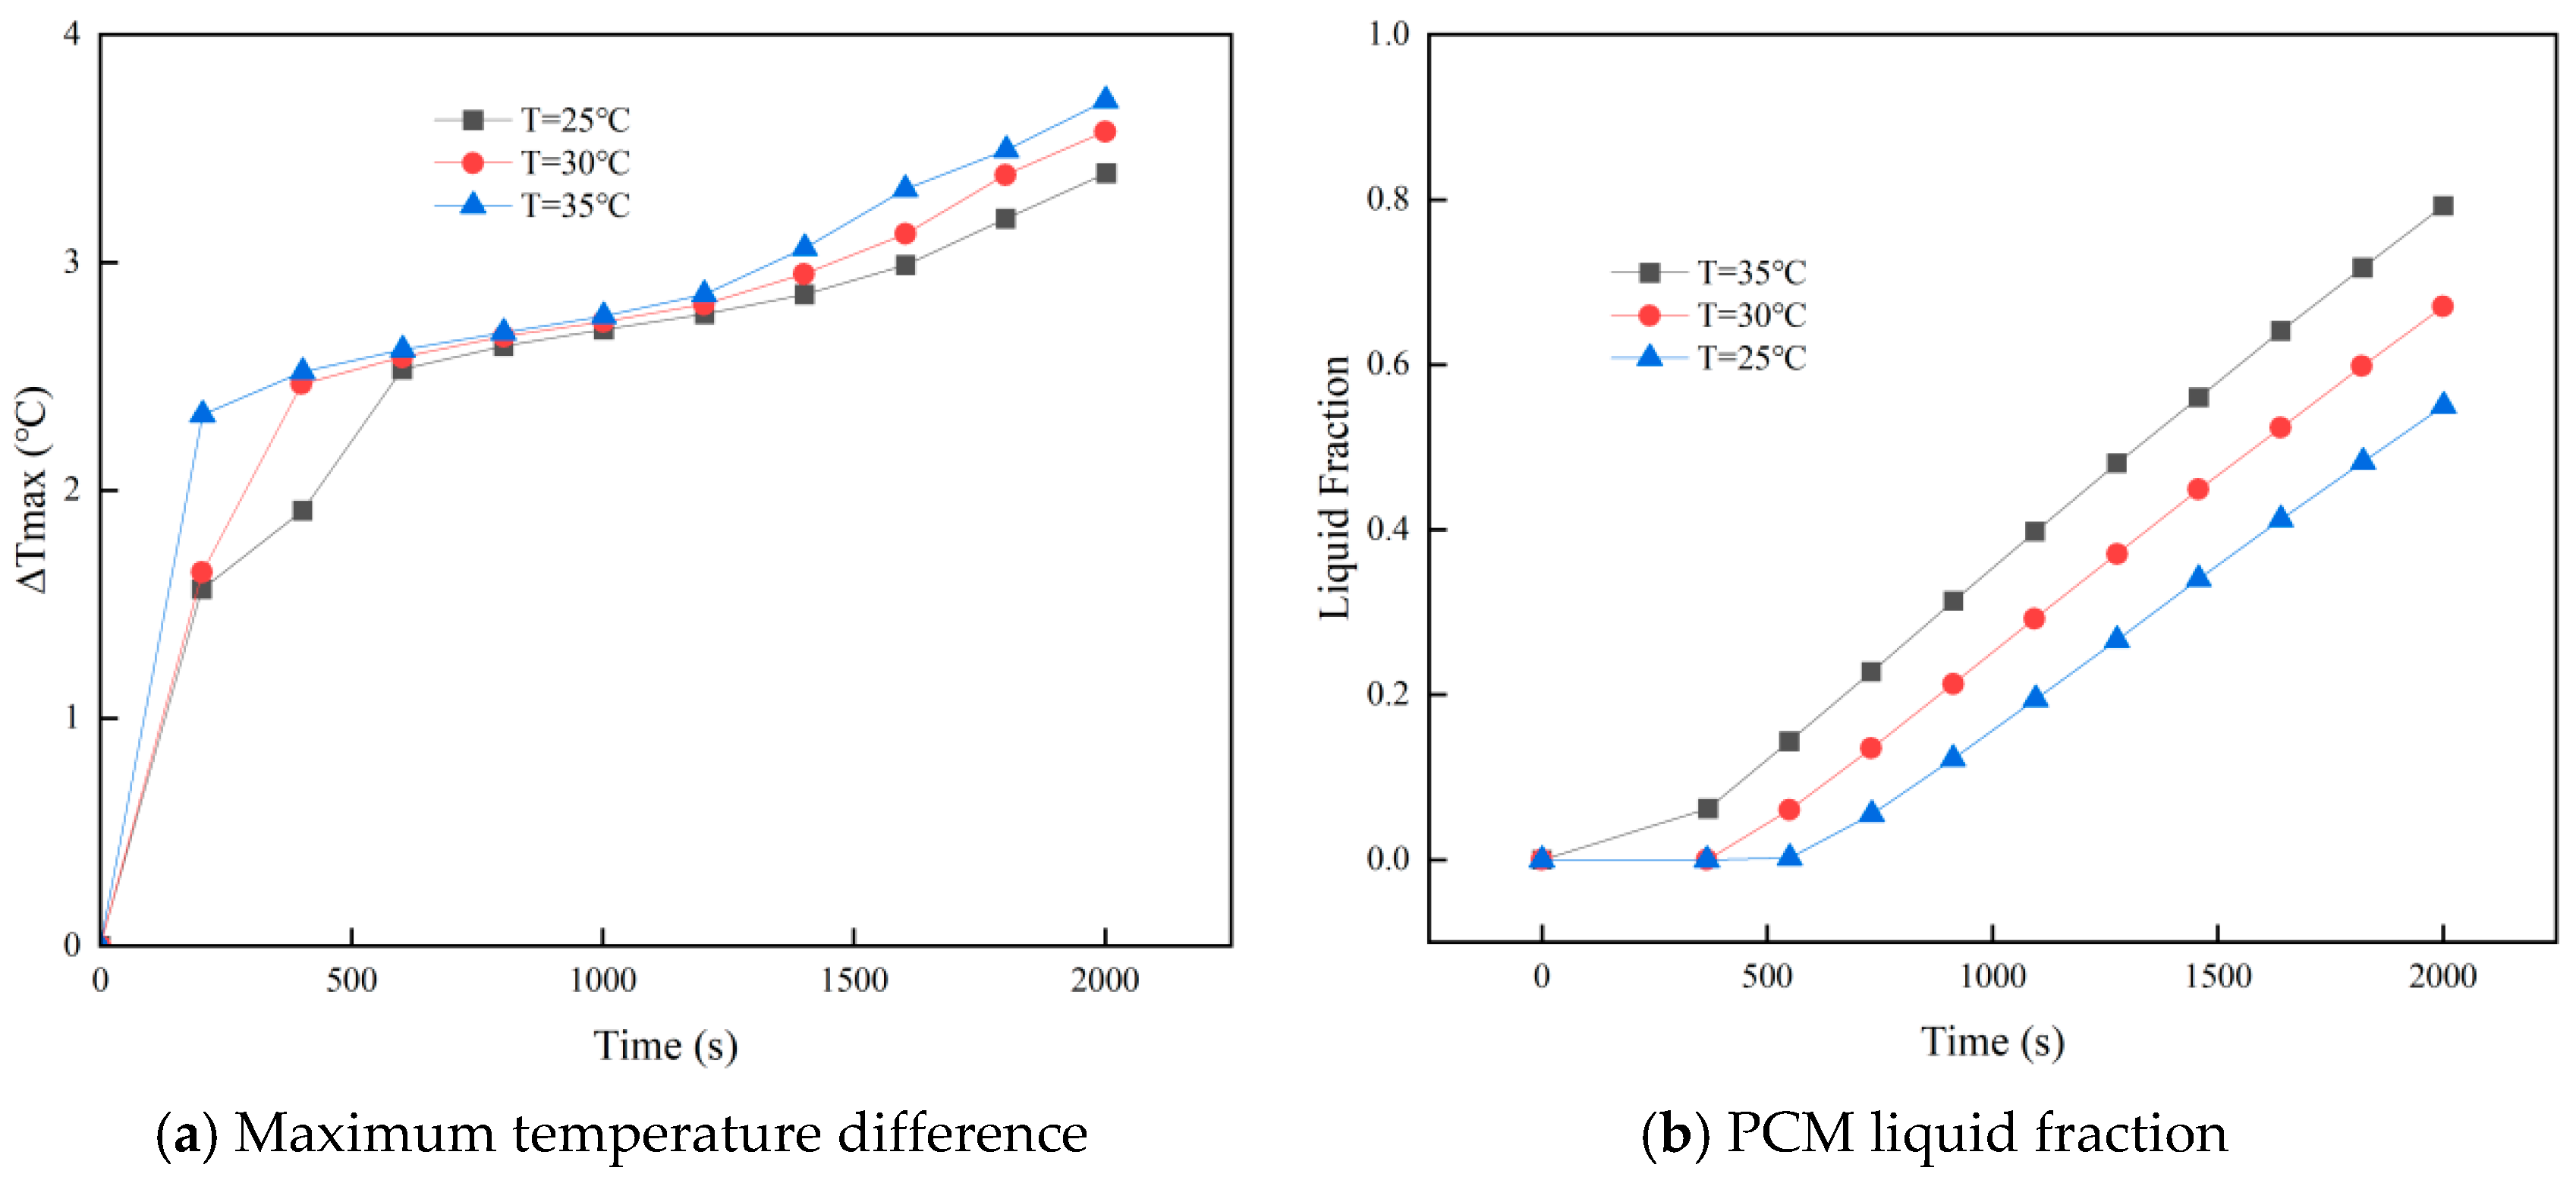
As shown in Figure 9a, at the end of discharge, the ΔTmaxi of the battery pack are 3.39 °C, 3.57 °C, and 3.71 °C for ambient temperatures of 25 °C, 30 °C, and 35 °C, respectively, indicating that higher ambient temperatures lead to larger temperature differences. The phenomenon arises from the PCM’s heat uptake associated with the solid–liquid phase change. As the ambient temperature rises, the initial PCM temperature increases, reducing the temperature gradient between the PCM and the battery and thereby decreasing the heat dissipation rate. Combined with the previously mentioned heat accumulation effect and the relatively low thermal conductivity of the PCM, heat absorption in other regions is delayed, resulting in an increased temperature difference across the battery pack. As shown in Figure 9b, higher ambient temperatures cause the PCM to reach its phase change threshold earlier, accelerating the phase change rate. This is because elevated ambient temperatures lead the battery system to generate heat more rapidly, reaching the phase change conditions sooner. Overall, an increase in ambient temperature results in higher maximum battery temperatures, a larger PCM liquid fraction, and greater temperature nonuniformity at the end of discharge.
Based on the previous analysis, the PCM–liquid cooling battery system was simulated under 5 mm cell spacing, 25 °C ambient temperature, and a 3C discharge rate. The study investigates the effects of the liquid cooling plate inlet position, coolant flow rate, and coolant temperature on the battery pack’s heat dissipation performance. Based on these results, structural optimization is performed to determine the configuration that achieves maximum cooling efficiency.

3.3. Effect of Inlet Position of the Liquid Cooling Plate on Battery Pack Heat Removal

Within the liquid cooling system, the layout of the cooling plate’s inlet and outlet plays a key role in determining the thermal performance of the battery pack. In this section, the outlet position of the liquid cooling plate is fixed, while the inlet position is varied for investigation. The structural schematics of the three configurations are shown in Figure 10. Under a 3C discharge rate for the 2000 s, with both ambient and coolant temperatures set at 25 °C, and a coolant flow velocity of 0.0025 m/s, all other parameters are kept consistent with the previous section. The simulation results are presented in Table 3.
As shown in Table 3, when the cross-sectional dimensions of the liquid cooling channel and the outlet position are kept constant, varying the inlet position under the same flow rate produces only minor changes in thermal performance. Specifically, the maximum battery temperature in Schemes 2 and 3 decreases by only 0.02 °C and 0.03 °C, respectively, compared with Scheme 1. The PCM liquid fraction decreases by 0.0072 and 0.0098, while the maximum temperature difference slightly increases by 0.09 °C and 0.10 °C. These results indicate that merely changing the inlet position of the liquid cooling channel has a negligible effect on the system’s heat dissipation performance. Considering all factors comprehensively, Scheme 2 is selected for subsequent analyses.

3.4. Effect of Coolant Flow Rate on Battery Pack Heat Removal

The heat dissipation performance of a liquid cooling system is strongly influenced by the coolant flow rate. In liquid-cooled systems, increasing the flow rate can effectively mitigate battery temperature rise. Accordingly, four flow rates—0.001 m/s, 0.0025 m/s, 0.005 m/s, and 0.0075 m/s—were selected for numerical simulation, with all other conditions kept consistent.
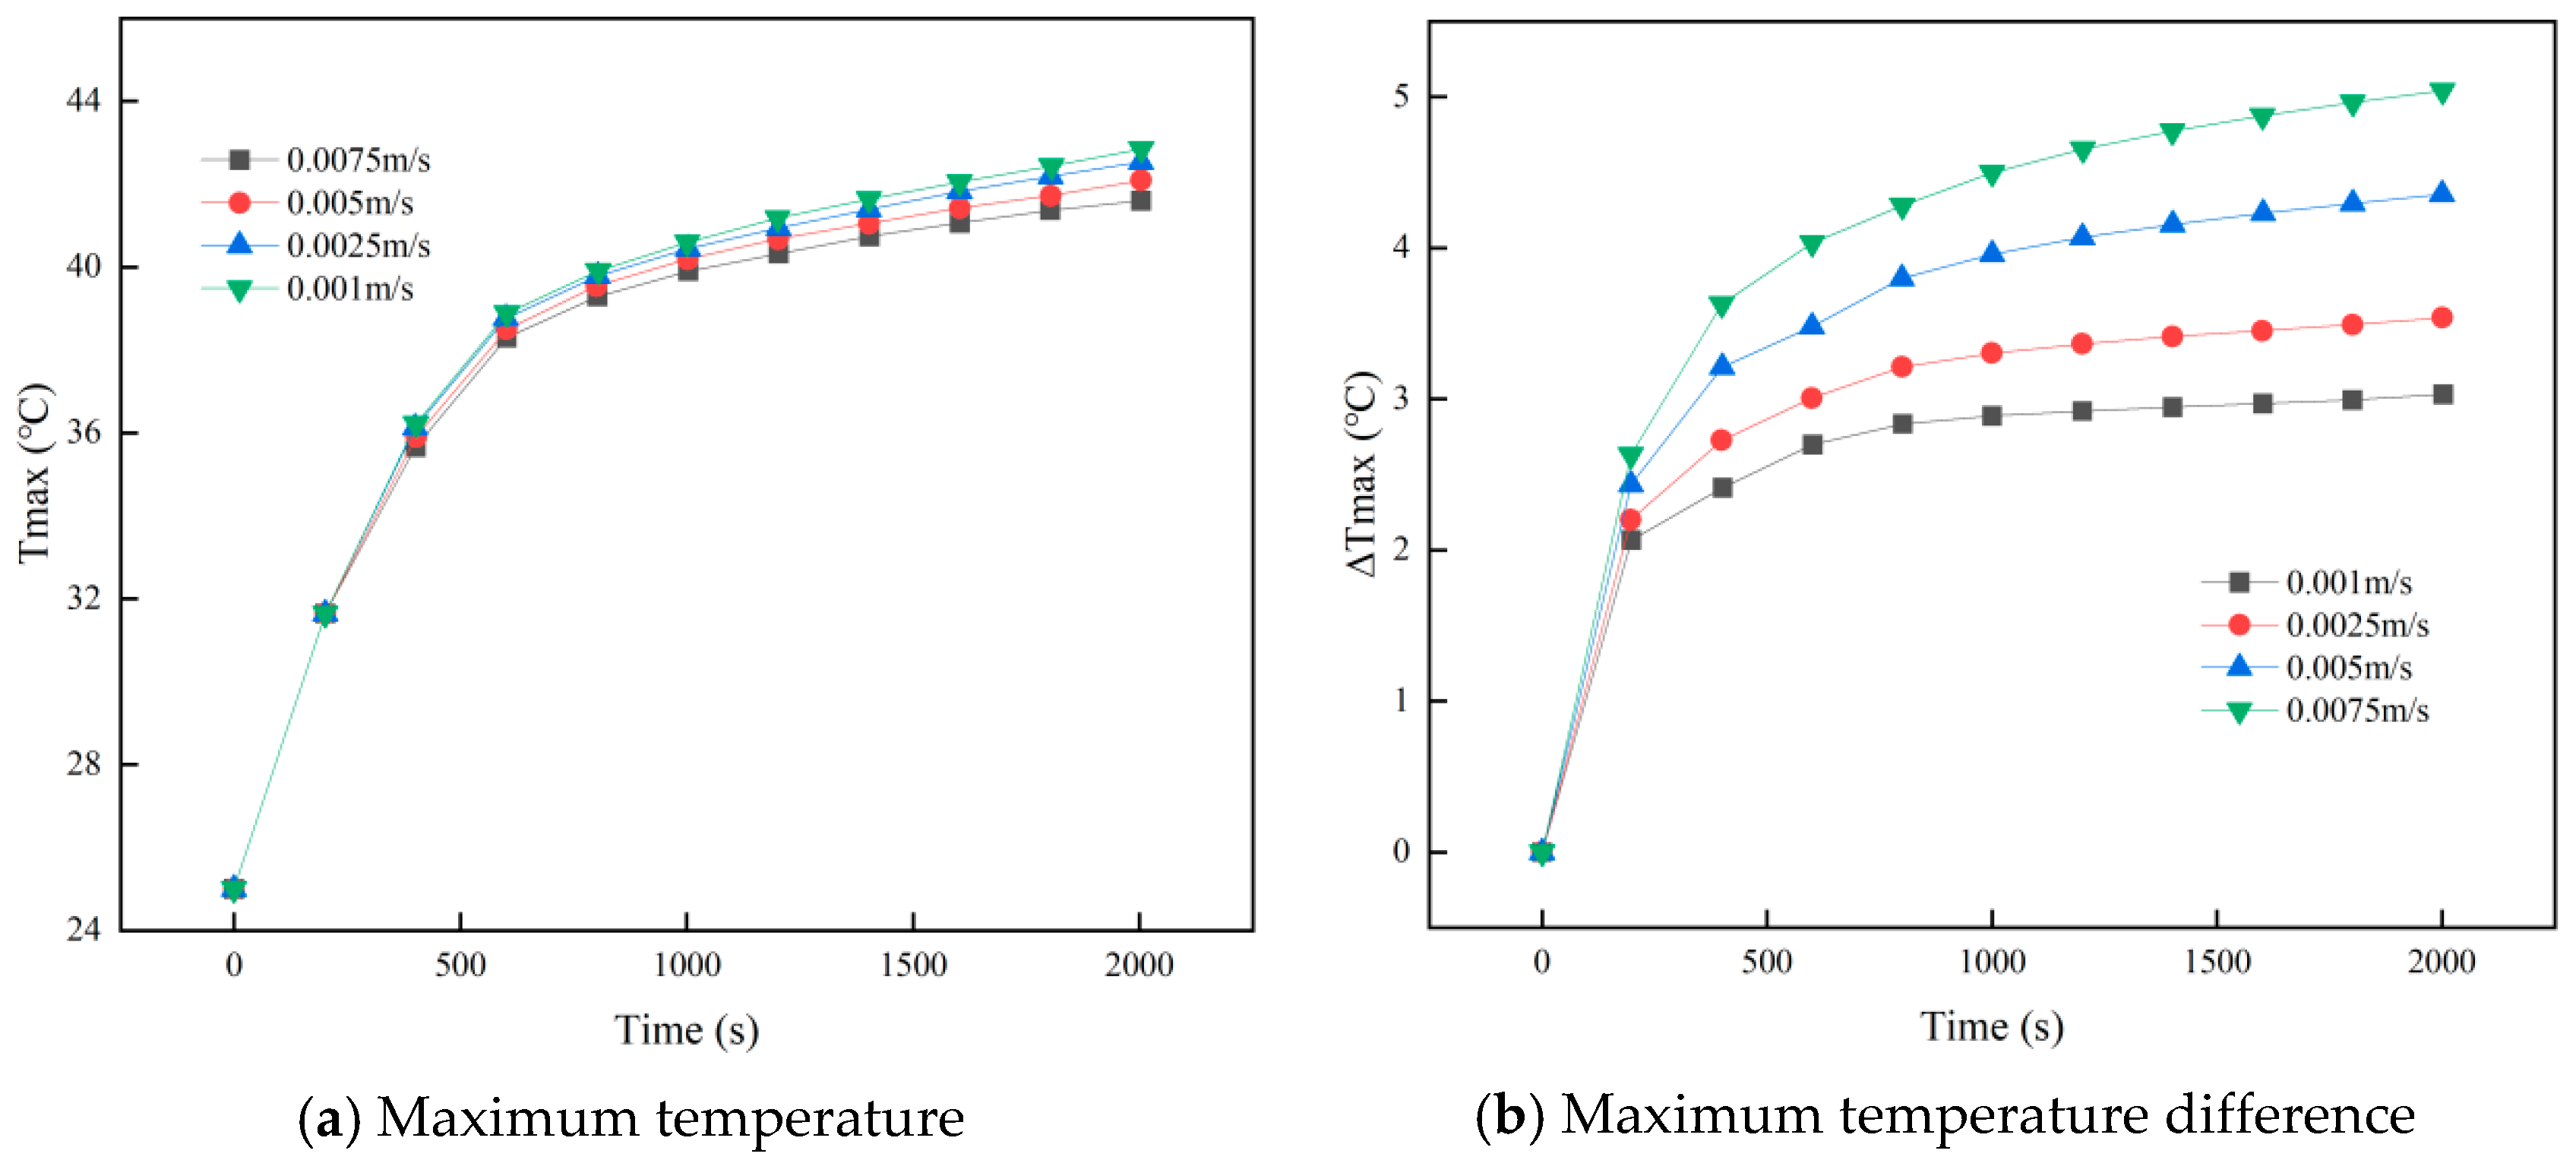
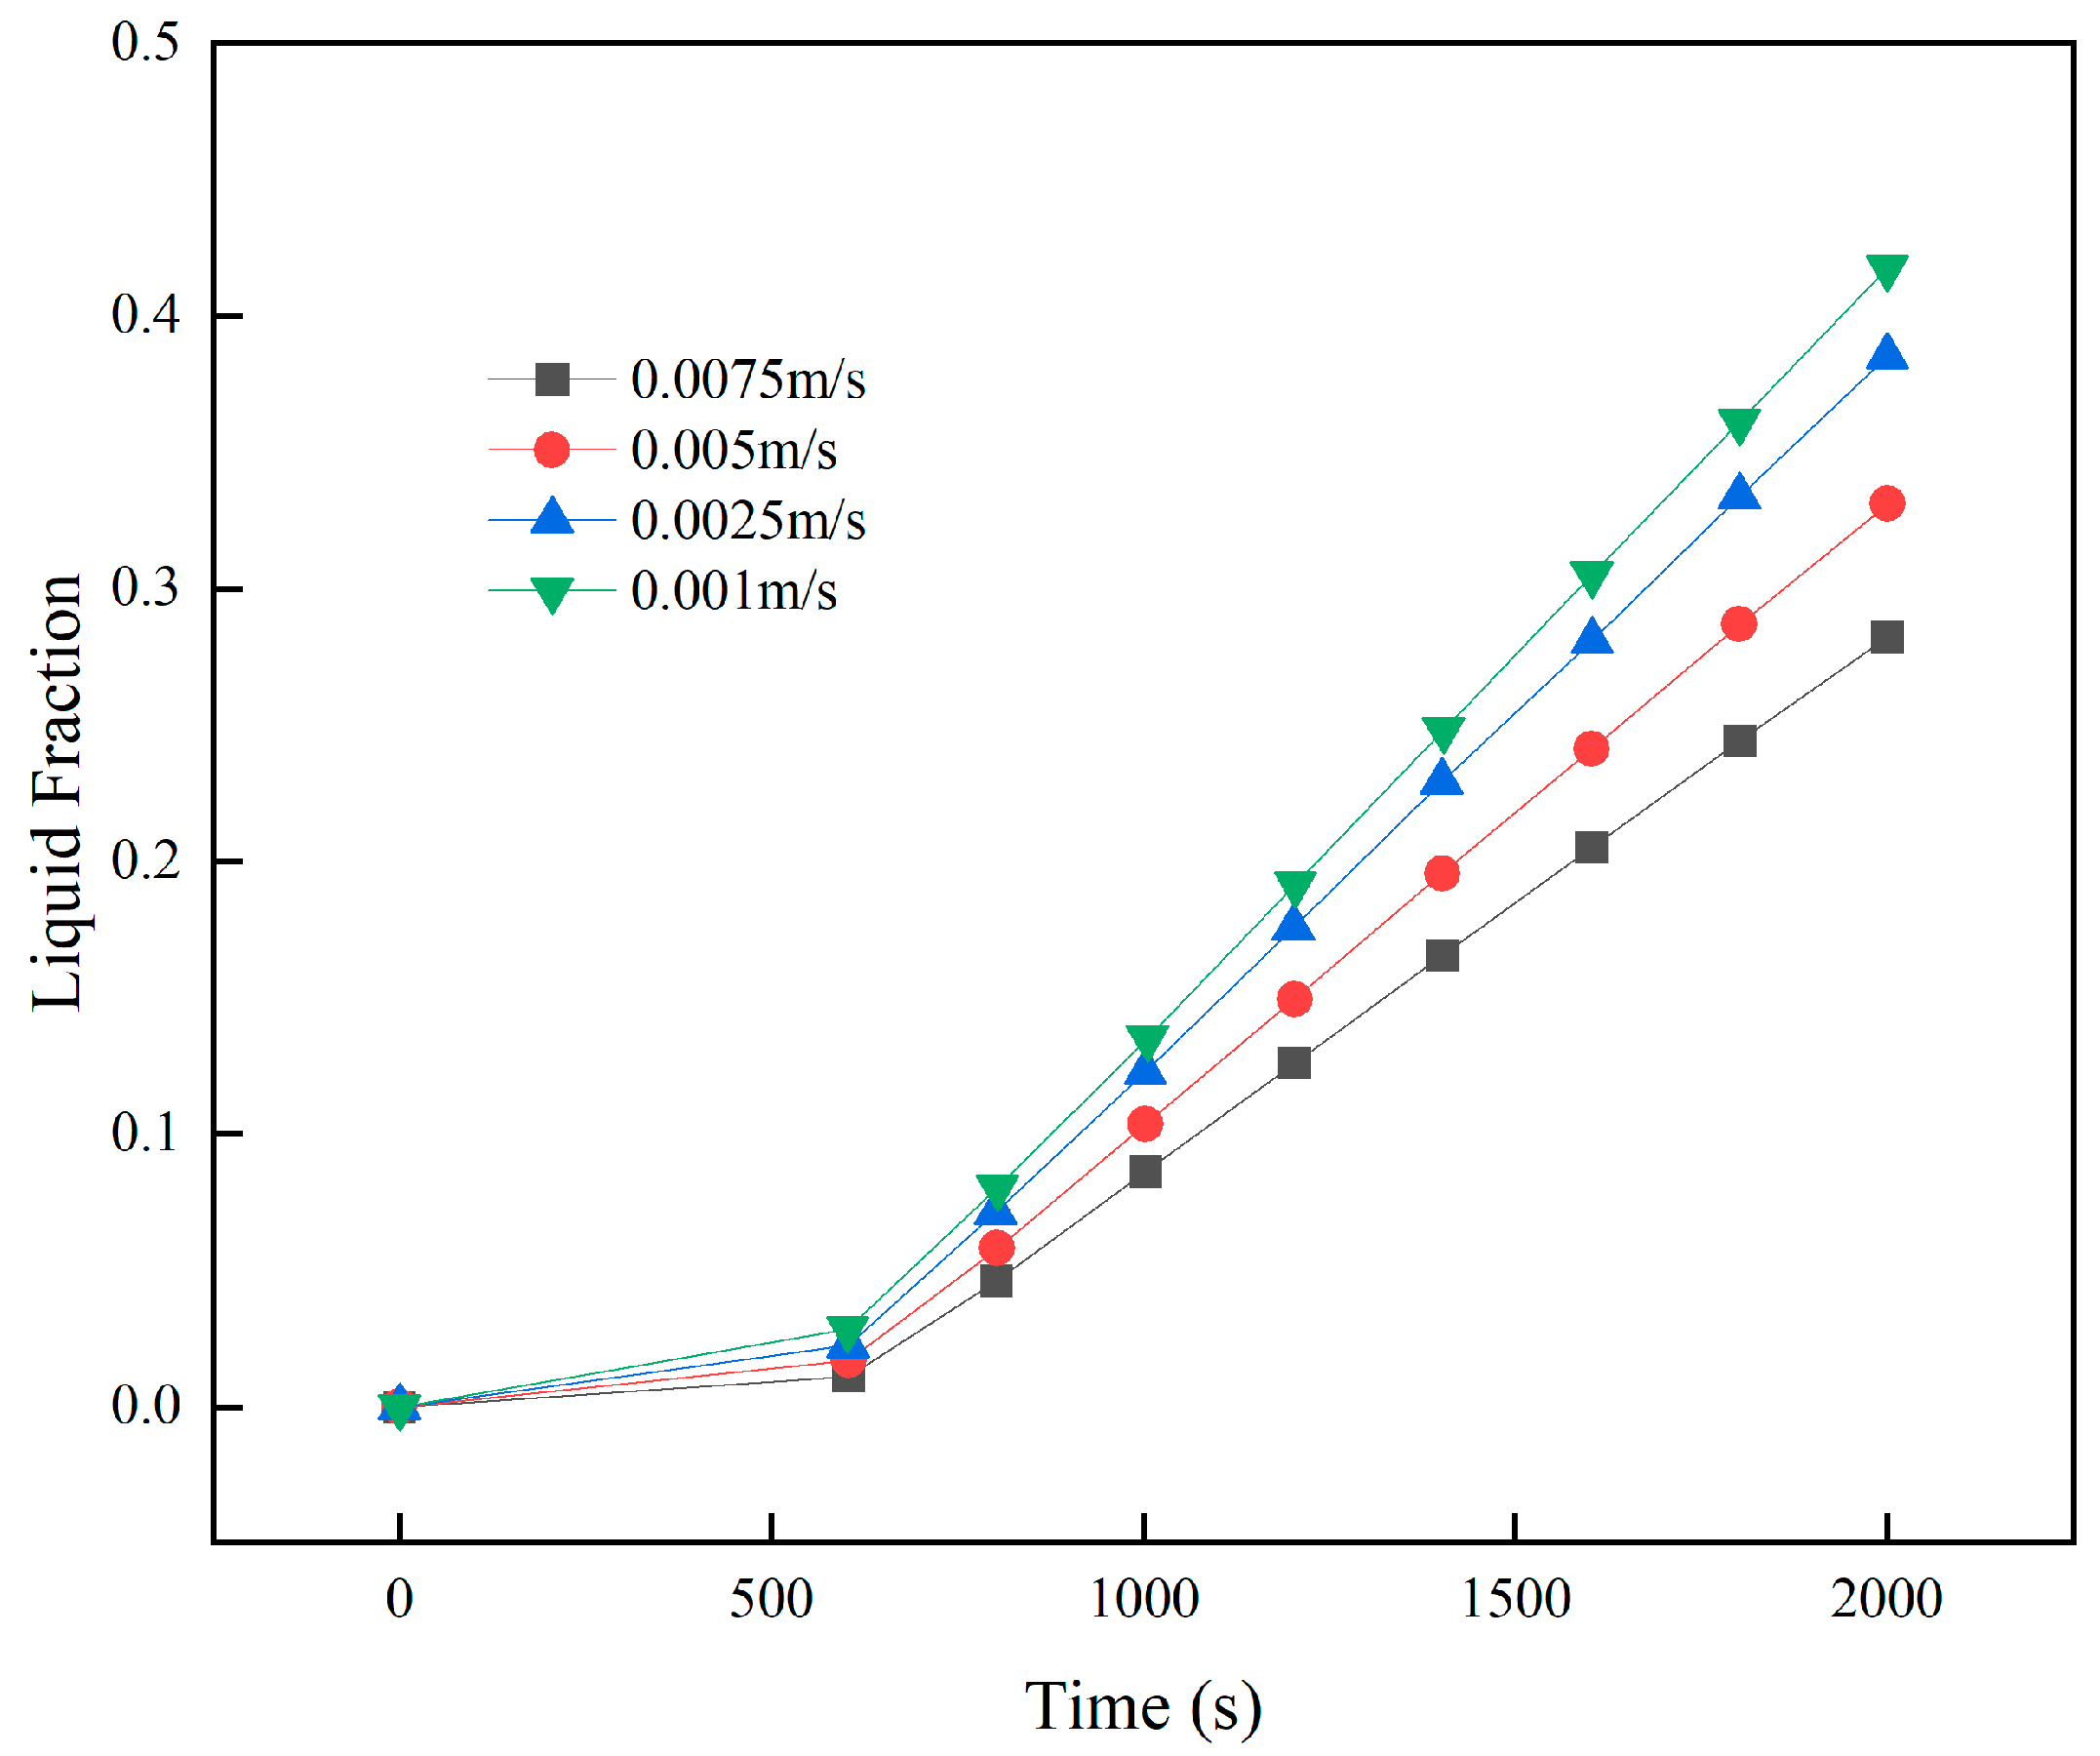
Figure 11 shows the temperature variation of the battery pack under different flow rates. As the flow rate increases, the maximum battery temperature decreases, while the ΔTmaxi rises. At a flow rate of 0.001 m/s, the maximum battery temperature is 42.79 °C, which is 2.55 °C lower than that without liquid cooling, demonstrating the effectiveness of the liquid cooling system. The rate of decrease in Tmaxi diminishes with higher flow rates; when the flow rate increases from 0.0025 m/s to 0.0075 m/s, the Tmaxi at the end of discharge are 42.50 °C, 42.01 °C, and 41.57 °C, corresponding to incremental reductions of 0.29 °C, 0.49 °C, and 0.44 °C, respectively. However, at 0.0075 m/s, the ΔTmaxi reaches 5.03 °C, exceeding the battery’s uniformity requirements. Therefore, increasing the flow rate beyond 0.0075 m/s provides negligible improvement in peak temperature while compromising temperature uniformity, rendering it unsuitable for practical operation.
As shown in the temperature contours in Figure 12, the battery’s lower region stays comparatively cool due to its direct interface with the liquid cooling plate, which forms an efficient heat conduction path and facilitates swift heat dissipation. In contrast, the upper portion of the battery transfers heat to the cooling system indirectly, resulting in higher thermal resistance and noticeable heat accumulation, thereby creating an axial temperature gradient. Additionally, the figure illustrates that an increase in coolant flow rate decreases battery temperature, confirming the superior cooling capability of the liquid-cooling system.
Figure 13 illustrates the variation of the PCM liquid fraction under different coolant flow rates. With higher coolant flow rates, the PCM liquid fraction declines markedly. At the end of discharge, increasing the flow rate from 0.001 m/s to 0.0075 m/s lowers the average PCM liquid fraction from 0.418 to 0.240. The findings indicate that higher coolant flow rates, while enhancing the battery thermal management system’s heat dissipation capability, concurrently limit PCM phase change, preventing complete utilization of its latent heat.
Although increasing the coolant flow rate reduces the maximum battery temperature, it concurrently decreases the PCM liquid fraction. At a flow rate of 0.0075 m/s, the ΔTmaxi reaches 5.03 °C, exceeding the safe operating threshold and affecting temperature uniformity. Excessively high coolant flow rates lead to increased pump energy consumption. Considering both thermal performance and energy efficiency, a flow rate of 0.005 m/s is selected as optimal, ensuring safe battery temperatures and full utilization of the PCM’s latent heat capacity.

3.5. Effect of Coolant Temperature on Battery Pack Thermal Performance

To investigate the effect of coolant temperature on the hybrid battery thermal management system, simulations were conducted at coolant temperatures of 25 °C, 20 °C, 15 °C, 10 °C, and 5 °C, with a 3C discharge rate and 0.005 m/s flow velocity.
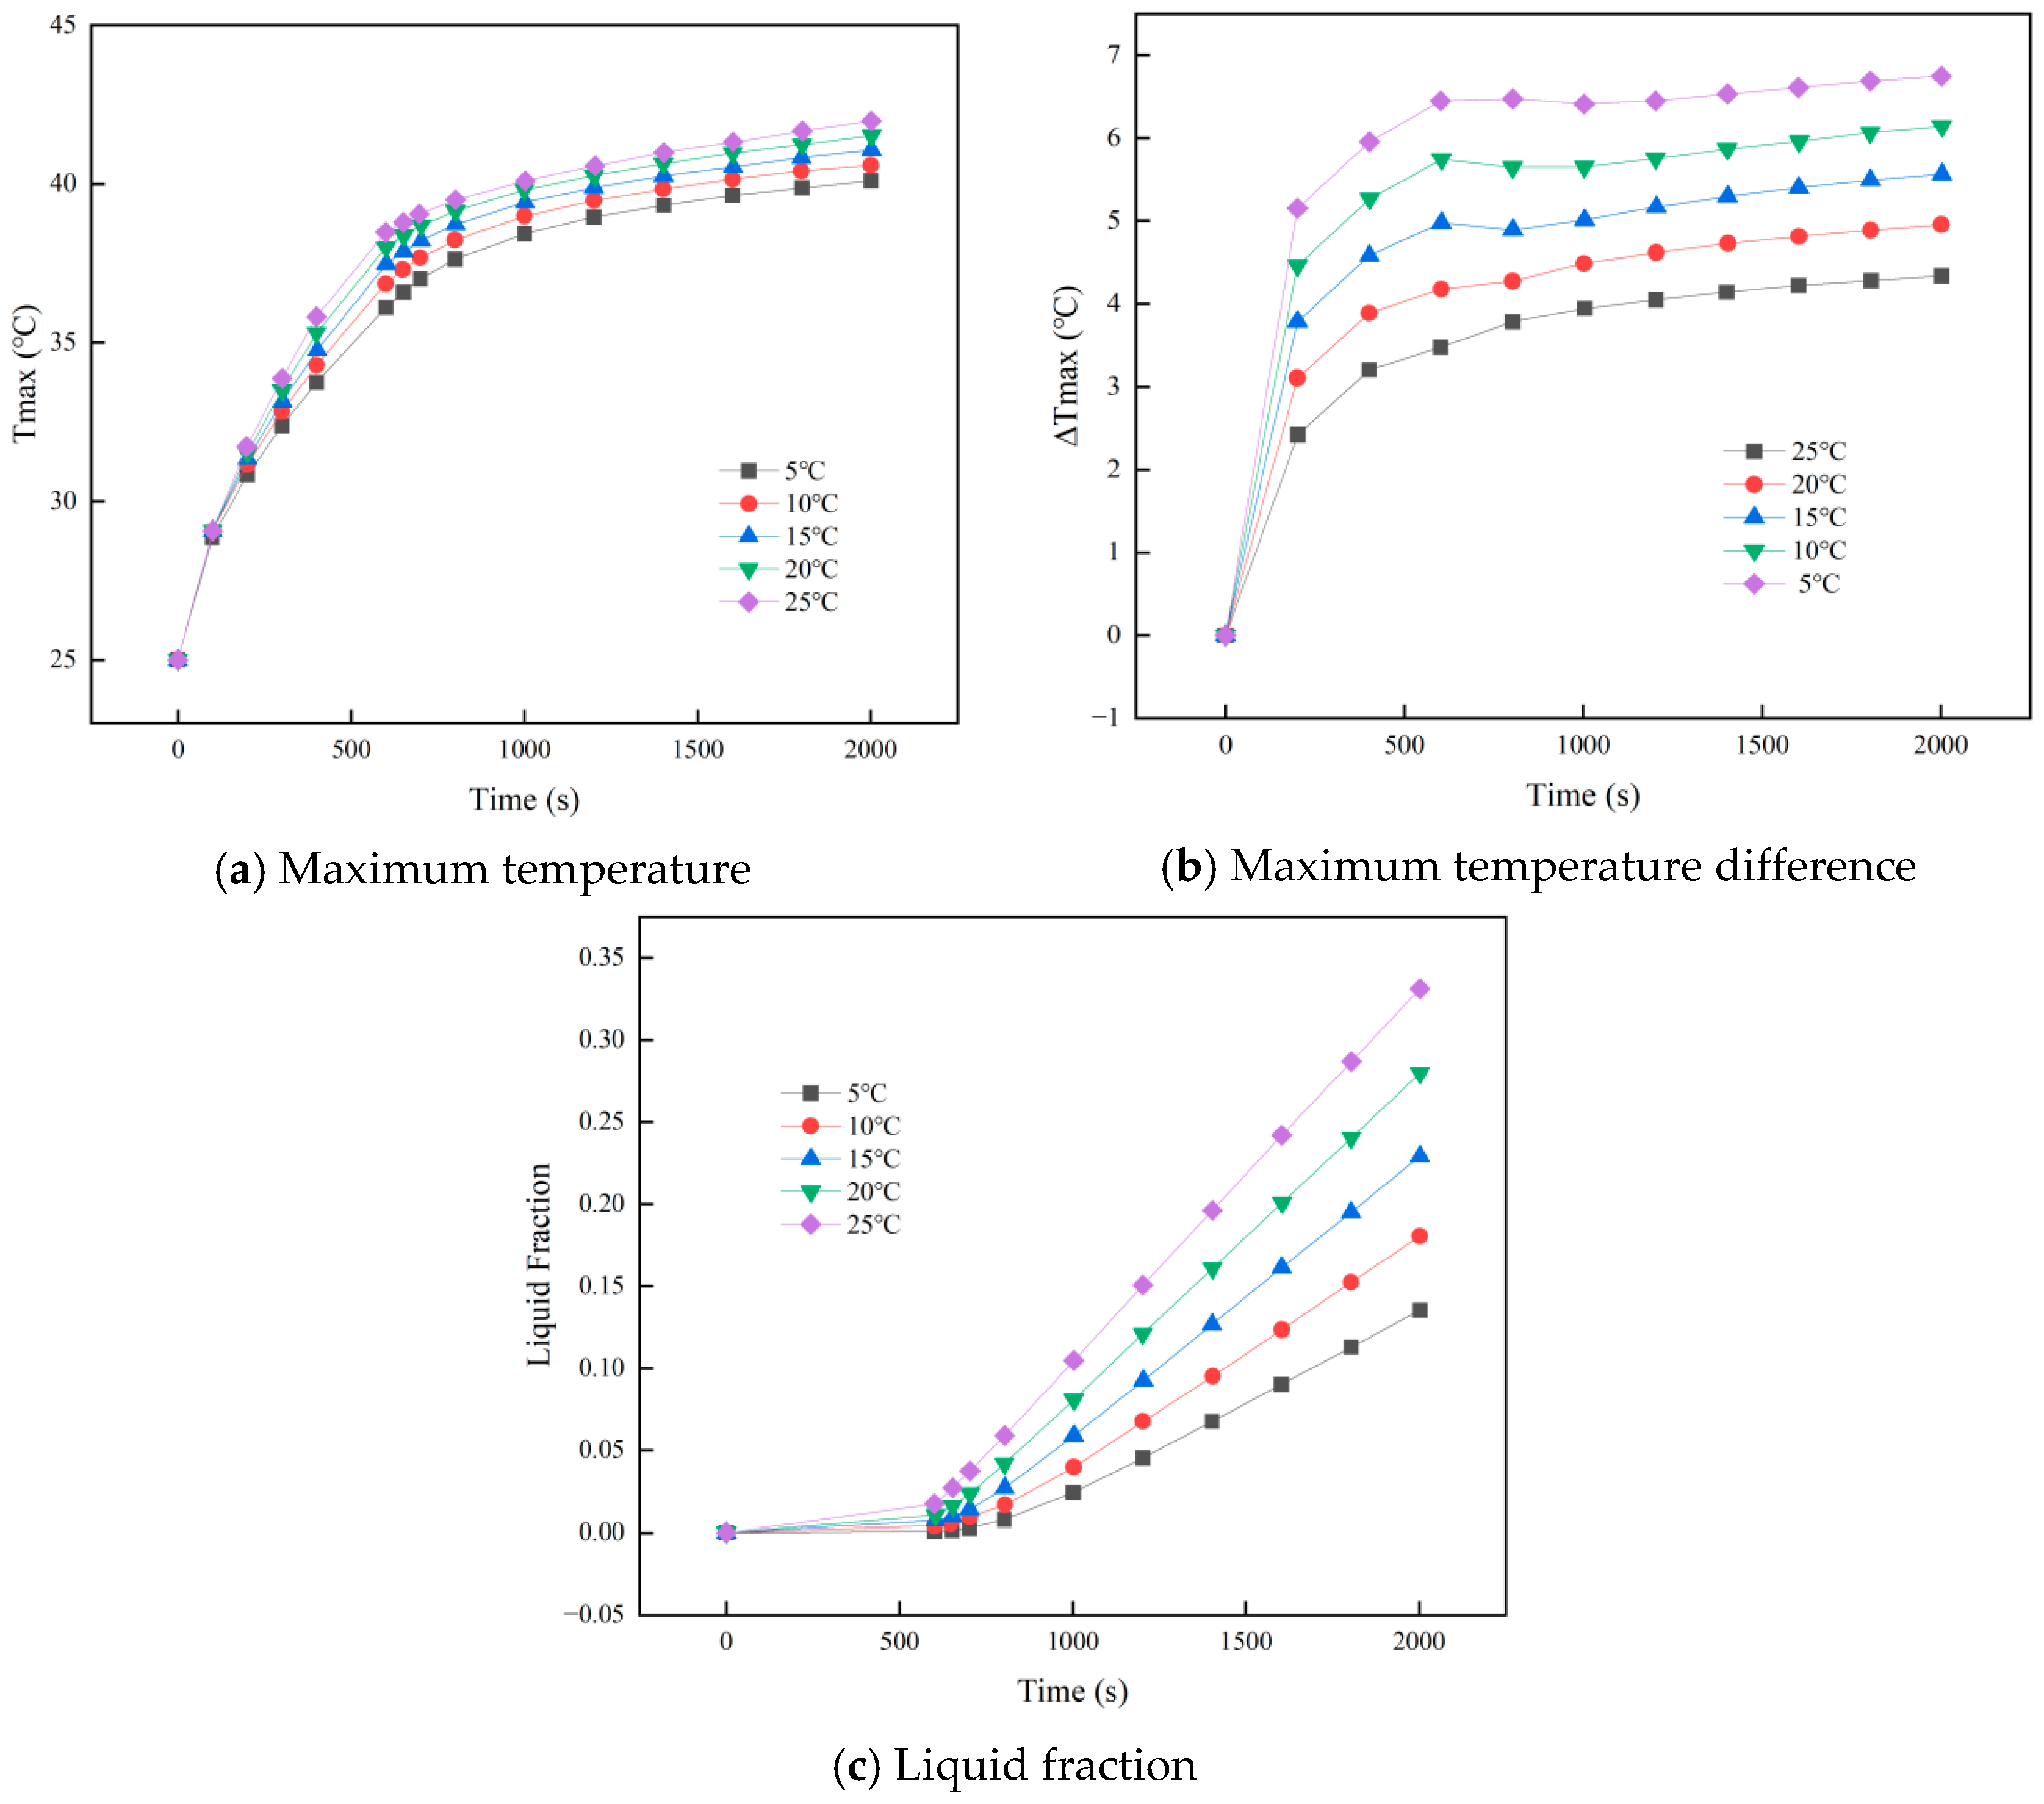
As shown in Figure 14a, higher coolant temperatures lead to a faster rise in the maximum battery temperature. Around 600 s of discharge, the PCM starts melting, slowing the temperature rise. At discharge completion, the maximum battery temperatures are 42.01 °C and 40.14 °C for coolant temperatures of 25 °C and 5 °C, respectively, showing that lower coolant temperatures decrease peak battery temperature. This is because a lower coolant temperature increases the temperature difference between the battery and the coolant, enhancing heat transfer and promoting effective heat dissipation. Figure 14b shows that in the early discharge stage, lower coolant temperatures accelerate the rise in the battery pack’s ΔTmaxi. At the end of discharge, the ΔTmaxi for coolant temperatures of 15 °C, 10 °C, and 5 °C reach 5.57 °C, 6.16 °C, and 6.77 °C, respectively, all exceeding the battery’s safe operating range. This effect arises from the system’s initial thermal equilibrium: the cold coolant quickly cools the battery surface in contact with the plate, while the core retains heat, producing a larger temperature gradient. Figure 14c indicates that decreasing the coolant temperature delays PCM melting and reduces the final liquid fraction at the end of discharge, reflecting partial underutilization of latent heat at lower coolant temperatures.
In summary, while lowering the coolant temperature reduces the battery pack’s Tmaxi, temperatures below 15 °C significantly increase the internal temperature difference, compromising uniformity and underutilizing PCM latent heat. At 20 °C and 25 °C, the Tmaxi are similar, with 25 °C providing a more uniform temperature distribution. Therefore, 25 °C is selected for subsequent simulations.

3.6. Design Optimization of the PCM–Liquid Cooling Thermal Management System for Batteries

The simulations show that the PCM–liquid cooling system provides superior heat dissipation, but the addition of liquid cooling notably enlarges the temperature difference across the battery module. To address this issue, two structural optimization schemes are proposed:
Scheme 1: Increase the number of liquid-cooling channels without altering other conditions.
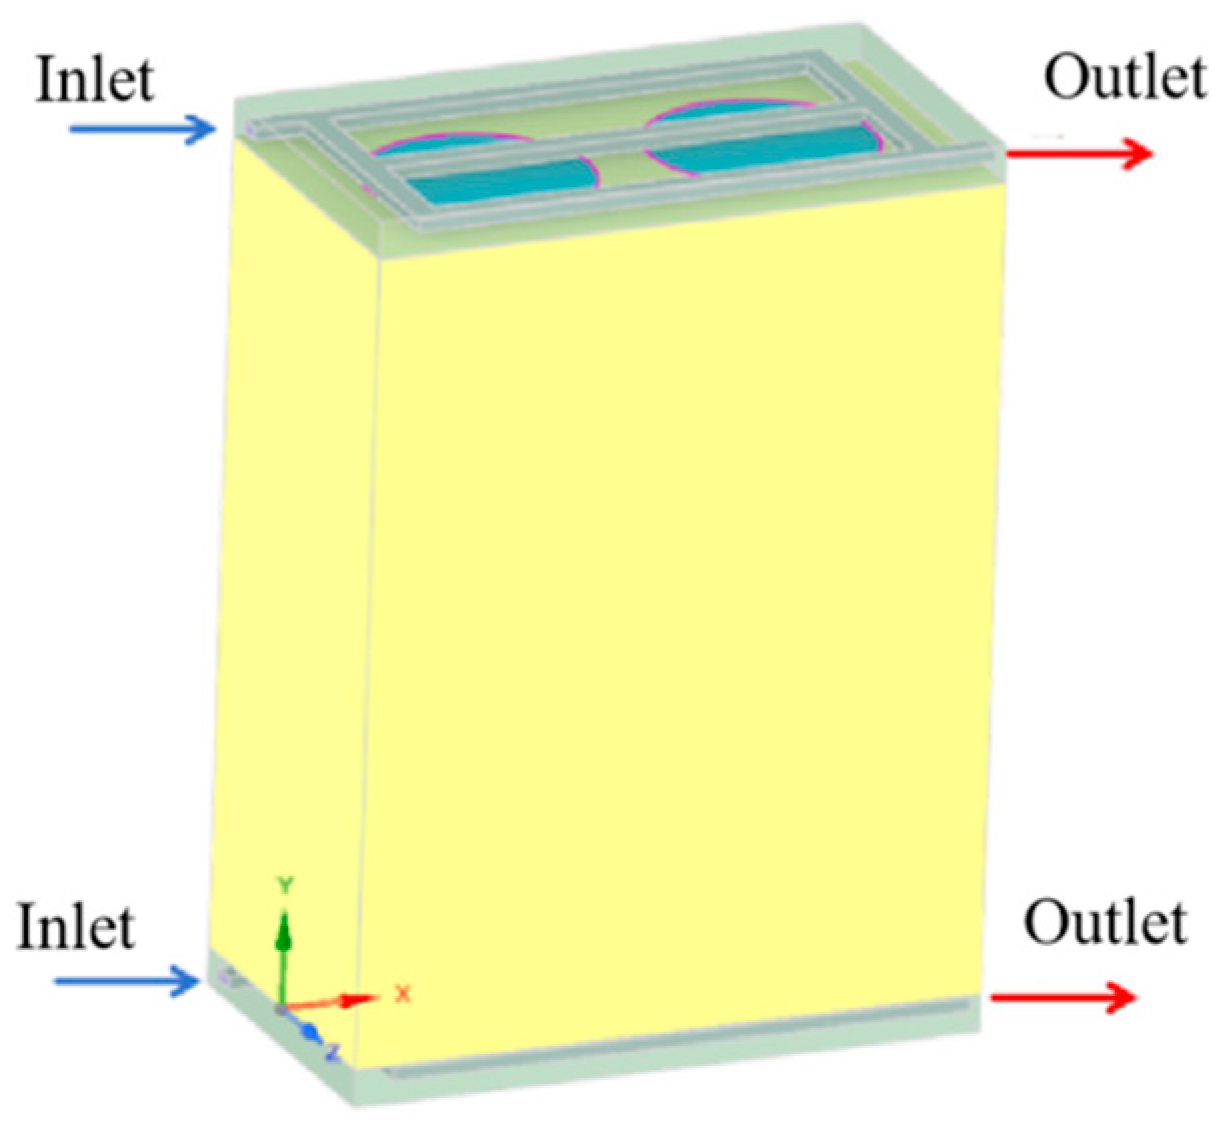
Scheme 2: Split the liquid cooling plate into two equal parts and place them above and below the battery module, respectively, while keeping the total volume unchanged; the flow directions of the upper and lower plates are the same.
For Scheme 1, two designs with different numbers of cooling channels were considered, referred to as Case 2 and Case 3, with Case 1 representing the baseline structure. The structural schematics are shown in Figure 15. At a 3C discharge rate, simulations were performed with coolant and ambient temperatures of 25 °C and a flow velocity of 0.005 m/s, while all other conditions remained unchanged. The parameter results at the end of discharge are summarized in Table 4.
As shown in Table 4, increasing the number of liquid-cooling channels has a negligible impact on the battery pack’s Tmaxi and PCM liquid fraction, while causing a modest increase in the ΔTmaxi. At the end of discharge, the Tmaxi for Case 2 and Case 3 decreased by only 0.01 °C and 0.03 °C compared with Case 1, whereas the ΔTmaxi increased by 0.05 °C and 0.11 °C, respectively. These results suggest that adding more cooling channels does not significantly enhance thermal performance and may slightly worsen temperature uniformity.
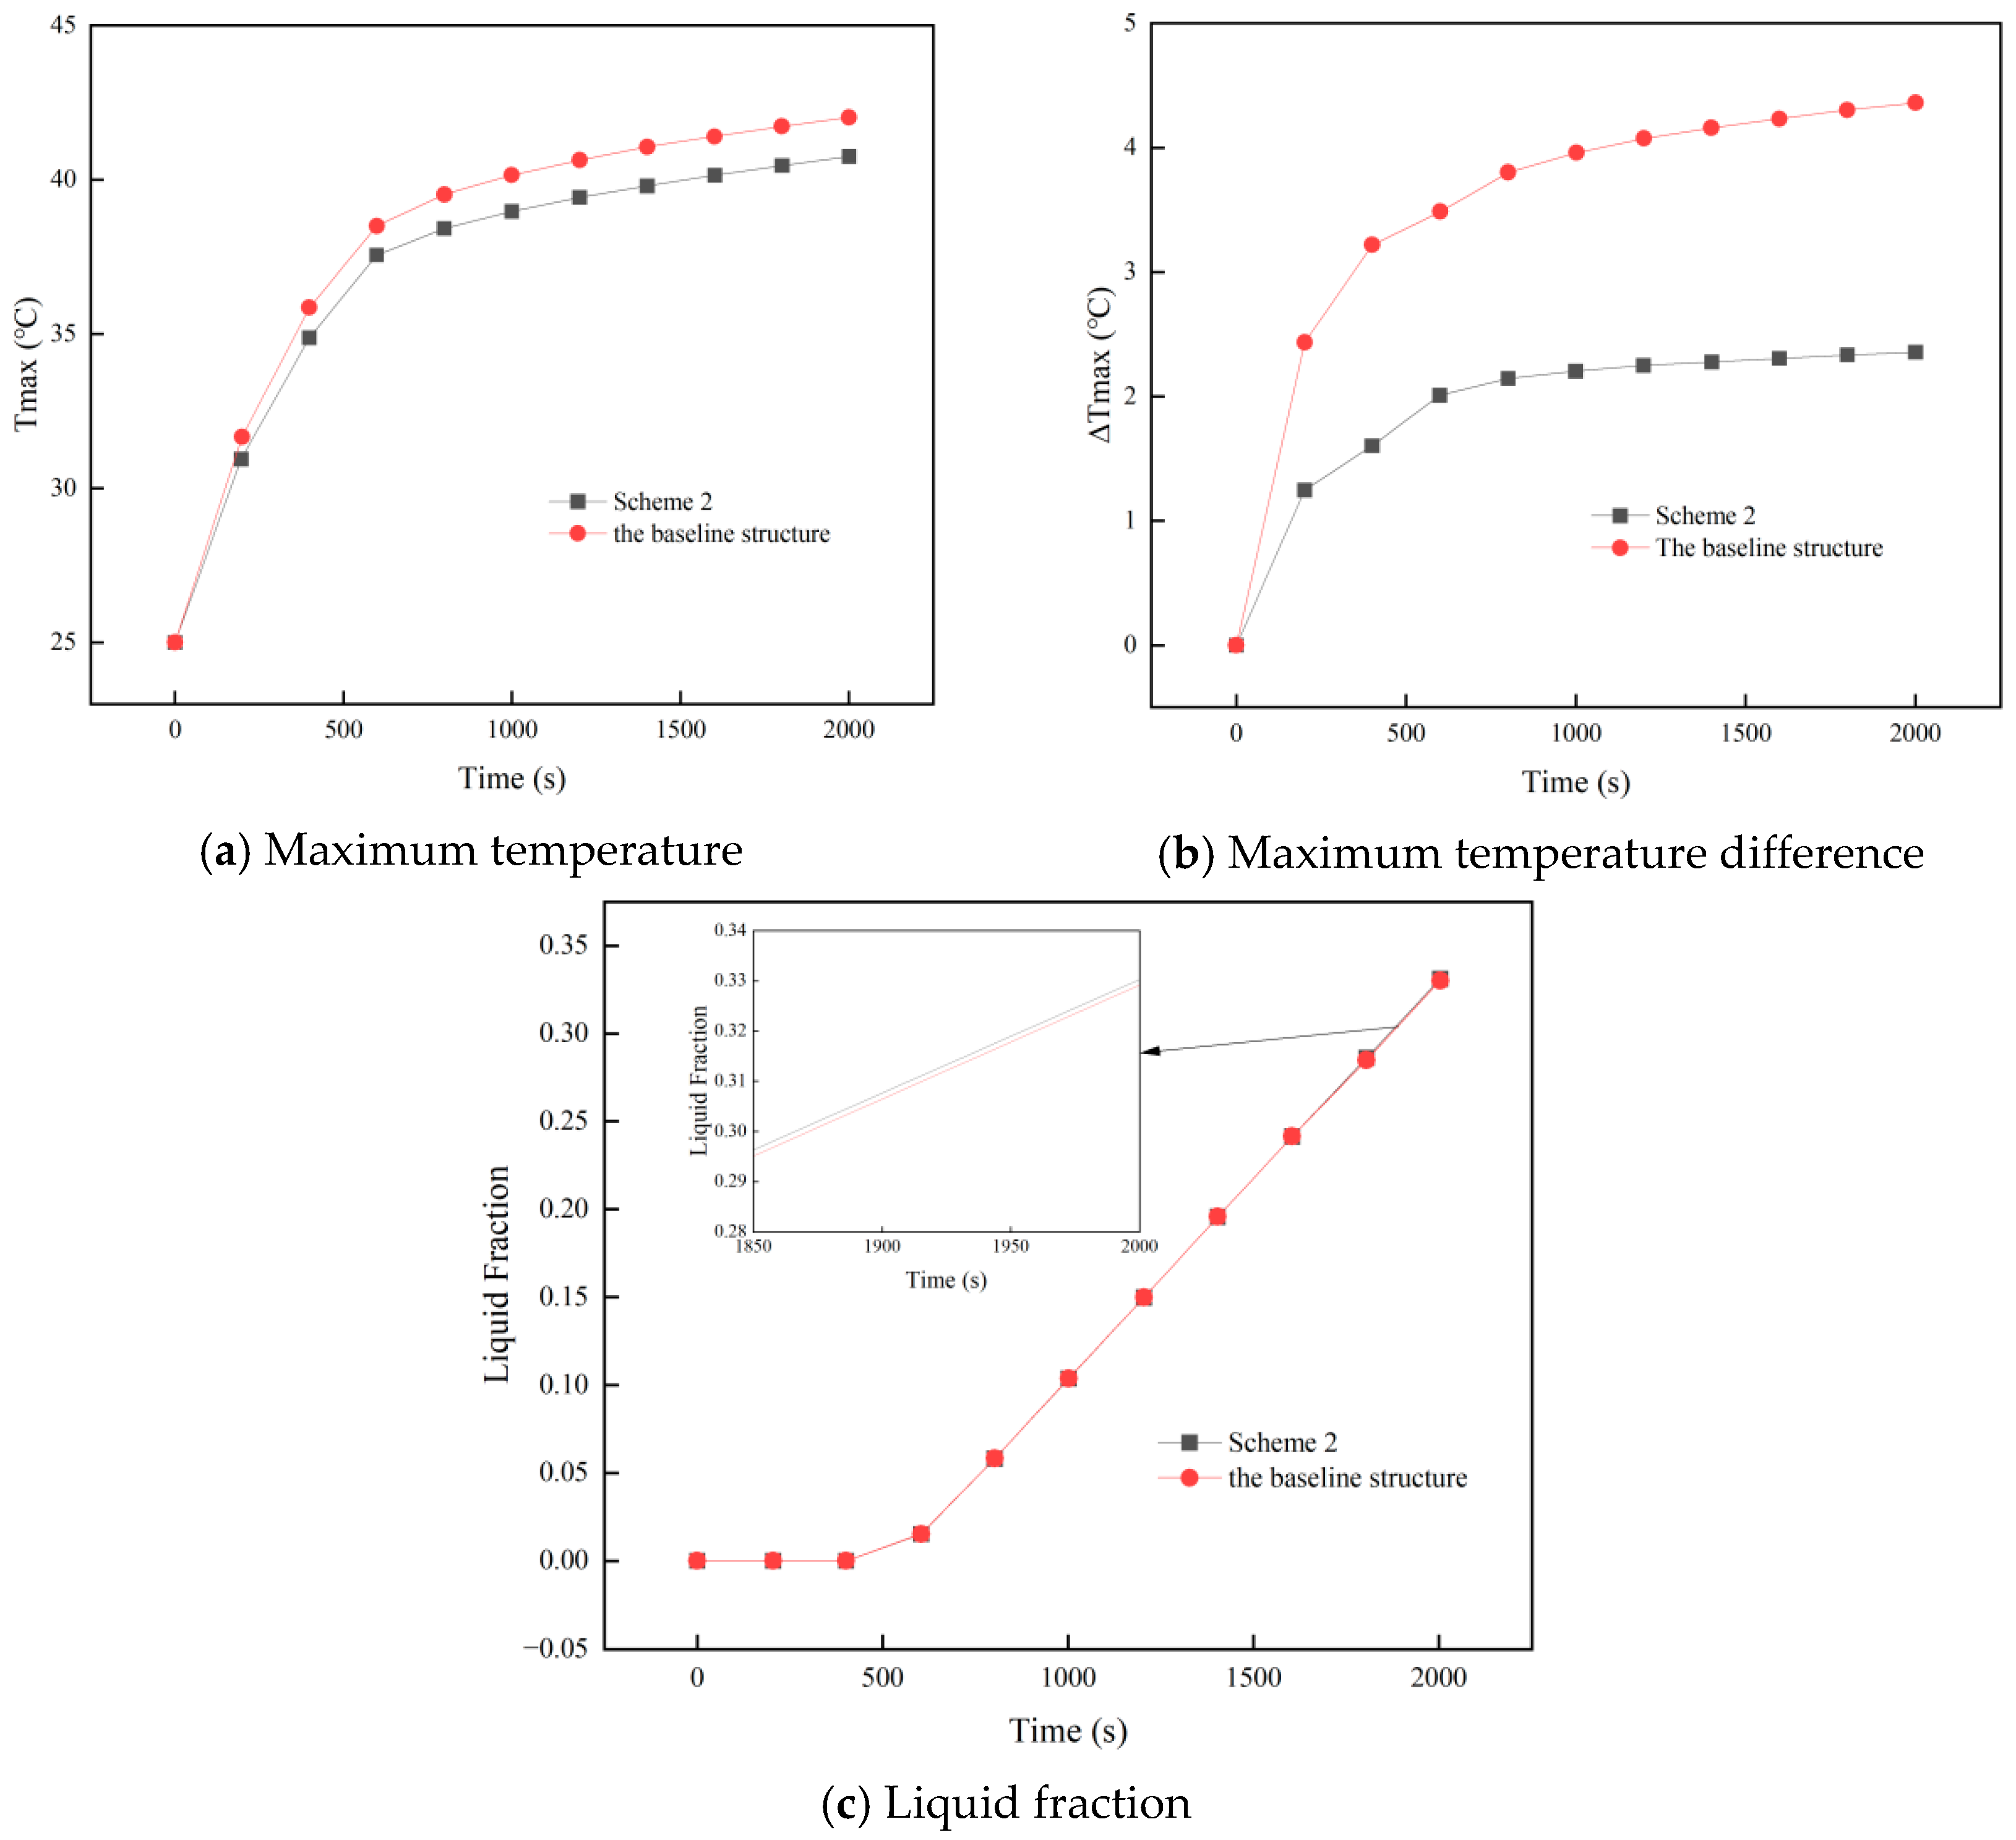
The schematic of Scheme 2 is shown in Figure 16. Numerical simulations were conducted in Fluent with a 3C discharge rate, an ambient and coolant temperature of 25 °C, and a coolant flow velocity of 0.005 m/s. The temperature contours at the end of discharge are presented in Figure 17. The Tmaxi for the baseline and Scheme 2 are 42.01 °C and 40.73 °C, respectively, indicating a reduction of 1.28 °C. The baseline structure shows a significant temperature difference between the top and bottom of the battery, with the center being the hottest. Scheme 2, however, achieves more uniform temperatures, significantly enhancing the battery pack’s cooling efficiency.
To further analyze the results, the variations of battery pack temperature and PCM liquid fraction with discharge time are shown in Figure 18. In Scheme 2, both the Tmaxi and the Tmaxi of the battery pack are significantly reduced compared to the baseline, with the reduction in temperature difference being particularly notable. During the early stage of discharge, the temperature difference rises rapidly in both cases; once the PCM begins to melt, it enters a plateau phase. At the end of discharge, the ΔTmaxi are 4.35 °C for the baseline and 2.35 °C for Scheme 2, indicating a reduction of 2 °C and a more uniform temperature distribution.
This improvement is primarily due to the even distribution of liquid cooling plates above and below the battery pack in Scheme 2, which increases the contact area and enhances heat exchange. The high axial thermal conductivity of the 18,650 cells further facilitates efficient heat transfer, improving cooling performance and temperature uniformity. The PCM liquid fraction shows no significant difference between the baseline and Scheme 2, indicating that the PCM’s latent heat is effectively utilized in both cases. Therefore, in a PCM–liquid cooling coupled system, placing the liquid cooling plates evenly above and below the battery pack provides optimal thermal management.

4. Conclusions

A lithium battery thermal management system (BTMS) incorporating PCM and liquid cooling was developed and numerically analyzed using Fluent. The study first assessed the influence of cell spacing and ambient temperature on the performance of a battery pack cooled solely by PCM. The effects of inlet position, coolant flow rate, and coolant temperature were analyzed for the PCM–liquid cooling BTMS. Two structural optimization schemes were then tested to identify the optimal cooling design. The key conclusions are:
  • Larger cell spacing improves PCM filling, lowering the battery pack’s peak temperature and temperature difference while increasing the PCM liquid fraction. In contrast, higher ambient temperatures raise all three metrics under identical conditions.
  • When the outlet position is fixed, changing the inlet location has minimal impact on cooling performance. Higher coolant velocities reduce peak battery temperature and PCM liquid fraction, but velocities ≥ 0.0075 m/s cause the maximum temperature difference to exceed safe limits. At 0.005 m/s, lowering the coolant temperature below 15 °C further reduces the maximum temperature and PCM liquid fraction, yet increases the temperature difference beyond safe levels. Thus, coolant parameters must balance overall thermal performance.
  • Of the two structural optimization schemes (Scheme 1: more liquid-cooling channels; Scheme 2: evenly distributed cooling plates above and below the battery module), Scheme 2 performs better. It lowers both the peak temperature and the maximum temperature difference, enhancing thermal uniformity while maintaining PCM utilization.

Author Contributions

Conceptualization, Z.C.; Methodology, Z.T.; Software, Z.T.; Validation, Z.T. and J.X.; Formal analysis, J.X.; Investigation, Z.T.; Data curation, J.X. and S.Y.; Writing—original draft, Z.T.; Writing—review & editing, X.W., Z.C. and S.Y.; Visualization, X.W. and S.Y.; Supervision, Z.C.; Project administration, X.W.; Funding acquisition, Z.C. All authors have read and agreed to the published version of the manuscript.

Funding

This work was supported by the key technology project of China Southern Power Grid Corporation (GZKJXM20240009).

Data Availability Statement

The data supporting the findings of this study are available within the article.

Conflicts of Interest

All authors were employed by the company Electric Power Research Institute of Guizhou Power Grid Co., Ltd. The remaining authors declare that the research was conducted in the absence of any commercial or financial relationships that could be construed as a potential conflict of interest. The authors declare that this study received funding from China Southern Power Grid Corporation. The funder was not involved in the study design, collection, analysis, interpretation of data, the writing of this article or the decision to submit it for publication.

References

  1. Li, M.; Ma, S.; Jin, H.; Wang, R.; Jiang, Y. Performance Analysis of Liquid Cooling Battery Thermal Management System in Different Cooling Cases. J. Energy Storage 2023, 72, 108651. [Google Scholar] [CrossRef]
  2. Theodore, A.M. Promising Cathode Materials for Rechargeable Lithium-Ion Batteries: A Review. J. Sustain. Energy 2023, 14, 51–58. [Google Scholar] [CrossRef]
  3. Qaderi, A.; Veysi, F. Investigation of a Water-NEPCM Cooling Thermal Management System for Cylindrical 18650 Li-Ion Batteries. Energy 2022, 244, 122570. [Google Scholar] [CrossRef]
  4. Huang, Y.; Mei, P.; Lu, Y.; Huang, R.; Yu, X.; Chen, Z.; Roskilly, A.P. A Novel Approach for Lithium-Ion Battery Thermal Management with Streamline Shape Mini Channel Cooling Plates. Appl. Therm. Eng. 2019, 157, 113623. [Google Scholar] [CrossRef]
  5. Zhao, Y.; Zhang, X.; Yang, B.; Cai, S. A Review of Battery Thermal Management Systems Using Liquid Cooling and PCM. J. Energy Storage 2024, 76, 109836. [Google Scholar] [CrossRef]
  6. Ge, X.; Li, X.; Jin, Y.; Zhang, G.; Deng, J.; Ge, J. Experimental Investigation on Thermal Management System of Composite Phase Change Material Coupled with Serpentine Tubes for Battery Module. Appl. Therm. Eng. 2023, 219, 119501. [Google Scholar] [CrossRef]
  7. Akbarzadeh, M.; Kalogiannis, T.; Jaguemont, J.; Jin, L.; Behi, H.; Karimi, D.; Beheshti, H.; Van Mierlo, J.; Berecibar, M. A Comparative Study between Air Cooling and Liquid Cooling Thermal Management Systems for a High-Energy Lithium-Ion Battery Module. Appl. Therm. Eng. 2021, 198, 117503. [Google Scholar] [CrossRef]
  8. Huang, R.; Li, Z.; Hong, W.; Wu, Q.; Yu, X. Experimental and Numerical Study of PCM Thermophysical Parameters on Lithium-Ion Battery Thermal Management. Energy Rep. 2020, 6, 8–19. [Google Scholar] [CrossRef]
  9. Li, Z.; Zhang, Y.; Zhang, S.; Tang, B. Phase Change Materials for Lithium-Ion Battery Thermal Management Systems: A Review. J. Energy Storage 2024, 80, 110259. [Google Scholar] [CrossRef]
  10. Al Hallaj, S.; Selman, J.R. A Novel Thermal Management System for Electric Vehicle Batteries Using Phase-Change Material. J. Electrochem. Soc. 2000, 147, 3231. [Google Scholar] [CrossRef]
  11. Xu, Q.; Huang, H.; Gu, Y.; Lin, X.-M.; Zhu, K.; Yin, M.; Li, L.; Wang, X.; Zheng, K. Performance Comparison of Phase Change Material/Liquid Cooling Hybrid Battery Thermal Management System under Different Cyclic Charging-Discharging Mode Designs. Appl. Therm. Eng. 2025, 266, 125639. [Google Scholar] [CrossRef]
  12. Fan, R.; Zheng, N.; Sun, Z. Evaluation of Fin Intensified Phase Change Material Systems for Thermal Management of Li-Ion Battery Modules. Int. J. Heat Mass Transf. 2021, 166, 120753. [Google Scholar] [CrossRef]
  13. Fan, Y.; Wang, Z.; Xiong, X.; Zhu, J.; Gao, Q.; Wang, H.; Wu, H. Novel Concept Design of Low Energy Hybrid Battery Thermal Management System Using PCM and Multistage Tesla Valve Liquid Cooling. Appl. Therm. Eng. 2023, 220, 119680. [Google Scholar] [CrossRef]
  14. Patil, M.S.; Seo, J.-H.; Lee, M.-Y. A Novel Dielectric Fluid Immersion Cooling Technology for Li-Ion Battery Thermal Management. Energy Convers. Manag. 2021, 229, 113715. [Google Scholar] [CrossRef]
  15. Li, Y.; Zhu, C.; Li, X.; Yang, B. A Review of Non-Uniform Load Distribution and Solutions in Data Centers: Micro-Scale Liquid Cooling and Large-Scale Air Cooling. Energies 2025, 18, 149. [Google Scholar] [CrossRef]
  16. Meier, M.; Strangas, E.G. Cooling Systems for High-Speed Machines—Review and Design Considerations. Energies 2025, 18, 3954. [Google Scholar] [CrossRef]
  17. Sun, Z.; Yao, Q.; Jin, H.; Xu, Y.; Hang, W.; Chen, H.; Li, K.; Shi, L.; Gu, J.; Zhang, Q. A Novel In-Situ Sensor Calibration Method for Building Thermal Systems Based on Virtual Samples and Autoencoder. Energy 2024, 297, 131314. [Google Scholar] [CrossRef]
  18. Li, L.; Xu, P.; Li, Q.; Yin, Z.; Zheng, R.; Wu, J.; Bao, J.; Bai, W.; Qi, H.; Tan, D. Multi-Field Coupling Particle Flow Dynamic Behaviors of the Microreactor and Ultrasonic Control Method. Powder Technol. 2025, 454, 120731. [Google Scholar] [CrossRef]
  19. Li, C.; Ding, Y.; Zhou, Z.; Jin, Y.; Ren, X.; Cao, C.; Hu, H. Parameter Optimization and Sensitivity Analysis of a Lithium-Ion Battery Thermal Management System Integrated with Composite Phase Change Material. Appl. Therm. Eng. 2023, 228, 120530. [Google Scholar] [CrossRef]
  20. Weng, J.; Xiao, C.; Yang, X.; Ouyang, D.; Chen, M.; Zhang, G.; Waiming, E.L.; Yuen, R.K.K.; Wang, J. An Energy-Saving Battery Thermal Management Strategy Coupling Tubular Phase-Change-Material with Dynamic Liquid Cooling under Different Ambient Temperatures. Renew. Energy 2022, 195, 918–930. [Google Scholar] [CrossRef]
  21. Zheng, Y.; Shi, Y.; Huang, Y. Optimisation with Adiabatic Interlayers for Liquid-Dominated Cooling System on Fast Charging Battery Packs. Appl. Therm. Eng. 2019, 147, 636–646. [Google Scholar] [CrossRef]
  22. Zhang, N.; Zhang, Z.; Li, J.; Cao, X. Performance Analysis and Optimization of a Hybrid Battery Thermal Management System Integrating PCM with Chinese Knot-Shaped Liquid Cooling Plate. Int. Commun. Heat Mass Transf. 2024, 159, 108261. [Google Scholar] [CrossRef]
  23. Wu, W.; Wang, S.; Wu, W.; Chen, K.; Hong, S.; Lai, Y. A Critical Review of Battery Thermal Performance and Liquid Based Battery Thermal Management. Energy Convers. Manag. 2019, 182, 262–281. [Google Scholar] [CrossRef]
  24. Zhao, J.; Rao, Z.; Li, Y. Thermal Performance of Mini-Channel Liquid Cooled Cylinder Based Battery Thermal Management for Cylindrical Lithium-Ion Power Battery. Energy Convers. Manag. 2015, 103, 157–165. [Google Scholar] [CrossRef]
  25. Mousavi, S.; Siavashi, M.; Zadehkabir, A. A New Design for Hybrid Cooling of Li-Ion Battery Pack Utilizing PCM and Mini Channel Cold Plates. Appl. Therm. Eng. 2021, 197, 117398. [Google Scholar] [CrossRef]
  26. Tang, Y.; Wu, L.; Wei, W.; Wen, D.; Guo, Q.; Liang, W.; Xiao, L. Study of the Thermal Properties during the Cyclic Process of Lithium Ion Power Batteries Using the Electrochemical-Thermal Coupling Model. Appl. Therm. Eng. 2018, 137, 11–22. [Google Scholar] [CrossRef]
  27. Pilali, E.; Soltani, M.; Hatefi, M.; Shafiei, S.; Salimi, M.; Amidpour, M. Passive Thermal Management Systems with Phase Change Material-Based Methods for Lithium-Ion Batteries: A State-of-the-Art Review. J. Power Sources 2025, 632, 236345. [Google Scholar] [CrossRef]
  28. Khan, S.A.; Xiangrong, L.I.; Lau, K.T.; Dong, K.; He, S.; Wabaidur, S.M.; Thakur, A.K.; Zhao, J. Metallic PCM-Based Battery Thermal Management System for Fast Charging/Discharging Applications. Int. Commun. Heat Mass Transf. 2024, 155, 107473. [Google Scholar] [CrossRef]
  29. He, R.; Song, K.; Wu, X.; Zhang, Q.; Zhang, K.; Su, M.; Hou, Q. Effectiveness Analysis of Novel Battery Thermal Management Systems Combining Phase Change Material and Air-Cooled Technologies. Appl. Therm. Eng. 2025, 264, 125499. [Google Scholar] [CrossRef]
  30. Chen, X.; Zhou, F.; Yang, W.; Gui, Y.; Zhang, Y. A Hybrid Thermal Management System with Liquid Cooling and Composite Phase Change Materials Containing Various Expanded Graphite Contents for Cylindrical Lithium-Ion Batteries. Appl. Therm. Eng. 2022, 200, 117702. [Google Scholar] [CrossRef]
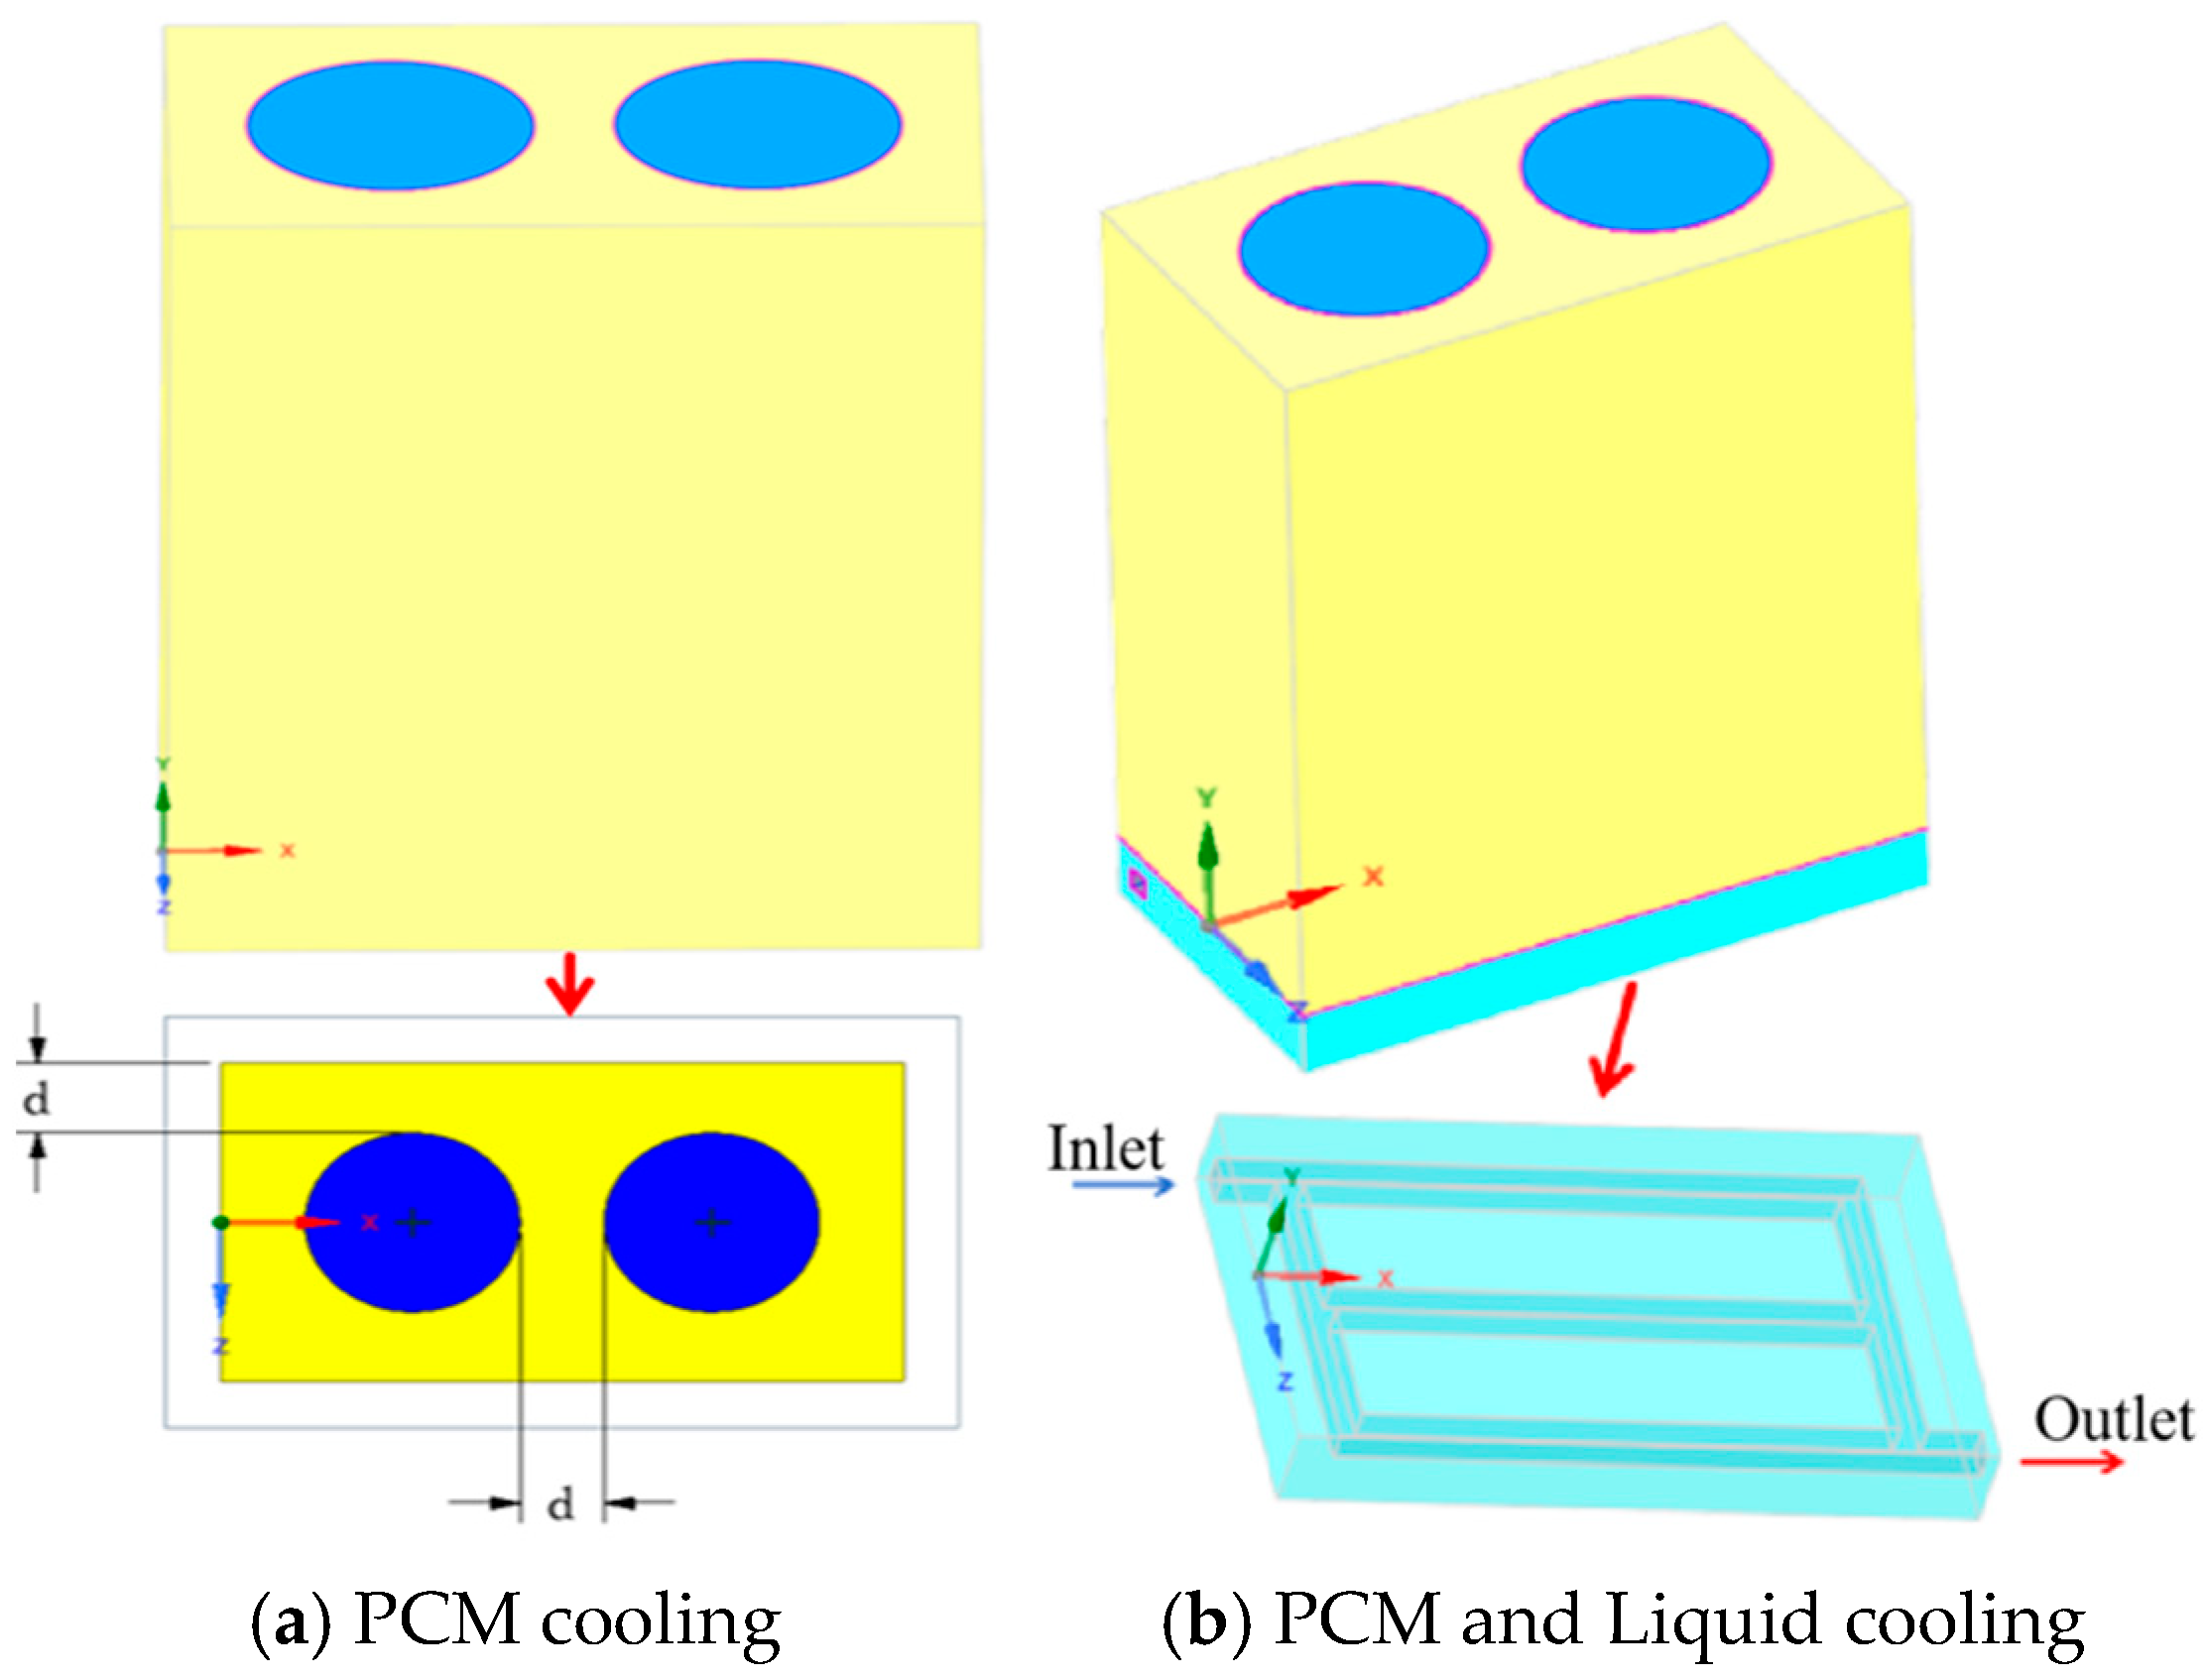
Figure 1. Physical model.
Energies 18 06108 g001
Figure 2. Independence check of the grid number.
Energies 18 06108 g002
Figure 3. Time step independence test.
Energies 18 06108 g003
Figure 4. Tmaxi of the battery pack at different cell spacings.
Energies 18 06108 g004
Figure 5. Variation of the Tmaxi difference of the battery pack under different conditions.
Energies 18 06108 g005
Figure 6. Temperature contour plots of the battery pack under different cell spacings.
Energies 18 06108 g006
Figure 7. Liquid phase fraction contour plots of PCM under different cell spacings.
Energies 18 06108 g007
Figure 8. Temperature contours of the battery pack and PCM liquid fraction under different ambient temperatures.
Energies 18 06108 g008
Figure 9. ΔTmaxi of the battery pack under different ambient temperatures (a) and Liquid phase fraction contour plots of PCM (b).
Energies 18 06108 g009
Figure 10. Diagram of liquid cooling plate inlet positions.
Energies 18 06108 g010
Figure 11. Battery pack temperature profiles at different coolant flow rates.
Energies 18 06108 g011
Figure 12. Temperature contours of the battery pack at different coolant flow rates.
Energies 18 06108 g012
Figure 13. Effect of coolant flow rate on PCM liquid fraction contours.
Energies 18 06108 g013
Figure 14. Battery pack temperature and PCM liquid fraction under different coolant temperatures.
Energies 18 06108 g014
Figure 15. Schematic of PCM–liquid cooling structural optimization (Scheme 1).
Energies 18 06108 g015
Figure 16. Diagram of PCM–liquid cooling structural optimization (Scheme 2).
Energies 18 06108 g016
Figure 17. Temperature contours of the baseline and Scheme 2 structures.
Energies 18 06108 g017
Figure 18. Battery pack temperature and PCM liquid fraction for the baseline and Scheme 2.
Energies 18 06108 g018
Table 1. Thermophysical properties of lithium-ion batteries [23].
Thermal PropertiesValue
Density (kg/m3)2055
Specific heat capacity (J/(kg·K))1299
Thermal conductivity (W/(m·K))kx: 0.9
kz: 29.6
Volumetric heat source17,460 (1C)
70,182 (2C)
140,418 (3C)
280,706 (4C)
Table 2. Thermo-physical parameters of PCM, Al, and Water [24,25].
PCMAlWater
Density (kg/m3)8222719998.2
Specific heat capacity (J/(kg·K))17708714182
Thermal conductivity (W/(m·K))0.36202.40.6
Dynamic viscosity (μPa/s)0.00365-0.001003
Melting temperature (°C)35/40
Table 3. Summary of simulation results for Schemes 1, 2, and 3 at an inlet velocity of 0.0025 m/s.
Tmax (°C)∆Tmax (°C)Liquid Fraction
Schemes 142.503.530.3856
Schemes 242.483.620.3784
Schemes 342.473.630.3758
Table 4. Simulation results for Cases 1–3.
Tmax (°C)∆Tmax (°C)Liquid Fraction
Case 142.014.350.329
Case 242.004.400.331
Case 341.984.460.327
Disclaimer/Publisher’s Note: The statements, opinions and data contained in all publications are solely those of the individual author(s) and contributor(s) and not of MDPI and/or the editor(s). MDPI and/or the editor(s) disclaim responsibility for any injury to people or property resulting from any ideas, methods, instructions or products referred to in the content.