Article

Multi-Objective Optimization Strategy for Integrated Energy System Considering Mixed Participation of Aluminum Electrolysis and Hydrogen Production Industries

by
Jinkun Wang
1,
Wei Liu
1,
Baohua He
1,
Zhendong Cao
1,
Gang Liu
1,
Bin Chuan
1,
Qiang Zhang
2,* and
Yue Cao
3
1
Inner Mongolia Huomei Hongjun Aluminum and Electricity Co., Ltd., Holingol 029200, China
2
Shanghai Power Equipment Research Institute Co., Ltd., Shanghai 200240, China
3
Key Laboratory of Energy Thermal Conversion and Control of Ministry of Education, School of Energy and Environment, Southeast University, Nanjing 210096, China
*
Author to whom correspondence should be addressed.
Energies 2025, 18(23), 6109; https://doi.org/10.3390/en18236109 (registering DOI)
Submission received: 24 April 2025 / Revised: 11 August 2025 / Accepted: 27 August 2025 / Published: 22 November 2025
(This article belongs to the Section F1: Electrical Power System)

Abstract

Industrial parks engaged in energy-intensive processes, such as aluminum electrolysis and hydrogen production, face significant challenges in enhancing cost-effectiveness and reducing carbon emissions. While integrated energy systems (IESs) have been widely studied, most research has focused on residential or commercial areas, leaving a gap in addressing the unique complexities of industrial parks. Addressing the above issues, this paper establishes a novel IES for industrial parks with aluminum electrolysis and hydrogen production as the main activities. In order to better absorb new energy sources and reduce carbon emissions, the proposed model introduces hydrogen production in electrolysis tanks, hydrogen storage tanks, and hydrogen fuel cells. Additionally, an optimization method for aluminum electrolysis load curves is developed, which significantly reduces system operating costs by optimizing load distribution. In some cases, this approach can lower operating costs by up to 7.62%. This paper also proposes an objective function with a penalty weight, which can flexibly adjust carbon emissions and operating costs according to actual needs. Under an appropriate weight, carbon emissions decrease by 11.61% and operating costs drop by 34.53% versus their peak values. Simulation results show that the proposed method is flexible enough to achieve a balanced operation of the industrial park in terms of operating costs and carbon emissions.

1. Introduction

The industrial sector is a major contributor to global carbon emissions, accounting for a significant portion of energy consumption worldwide [1,2]. As the world transitions towards a low-carbon future, the integration of renewable energy sources, such as wind and solar power, has become a critical strategy for reducing greenhouse gas emissions [3,4]. However, the intermittent nature of these renewable sources poses challenges for energy systems, particularly in energy-intensive industries. To address these challenges, integrated energy systems (IESs) have emerged as a promising solution, enabling the efficient coordination of multiple energy sources, storage technologies, and demand-side management [5]. Industrial parks, which often host energy-intensive processes, represent a key area where IESs can be applied to optimize energy use, reduce costs, and minimize environmental impact [6]. Therefore, studying the optimization of energy dispatch strategies in power-consuming industrial parks will help achieve a sustainable and cost-effective energy system [7].
In recent years, significant research efforts have been devoted to the optimization of integrated energy dispatch. However, much of this work has focused on residential areas or commercial districts, where the primary loads consist of household electricity consumption, data centers, and small-scale industrial activities. Li et al. [8] conducted an optimization study on the energy consumption of central air conditioners in residential areas. Lin et al. [9] optimized a regional energy system consisting of residential buildings, commercial buildings, and shopping malls. While these studies have provided valuable insights into the coordination of renewable energy sources, energy storage, and demand response, they often overlook the unique characteristics and challenges of industrial parks [10]. Industrial parks, particularly those engaged in energy-intensive processes such as aluminum electrolysis and hydrogen production, have distinct energy consumption patterns and operational requirements that differ significantly from residential or commercial settings [11]. Liu et al. [12] studied carbon capture technology in electrolysis systems, and the results confirmed the particularity of industrial parks in energy optimization. Despite the growing importance of industrial energy optimization, there remains a notable gap in the literature regarding the application of integrated energy dispatch models to such industrial contexts.
This paper addresses this gap by proposing a novel energy dispatch optimization model tailored to industrial parks with a focus on aluminum electrolysis and hydrogen production. Aluminum electrolysis is one of the most energy-intensive industrial processes, requiring a stable and substantial power supply [13]. Traditional energy systems often rely on fossil fuels to meet this demand, resulting in high carbon emissions [14]. Previous studies rarely integrated the electrolytic aluminum industry into the comprehensive energy system and involved it in scheduling optimization. Han et al. [15] regarded electrolytic aluminum as a simple dispatchable load and participated in the optimization together with other loads, but they did not optimize the load curve of electrolytic aluminum itself. Therefore, previous studies are insufficient. By optimizing the aluminum electrolysis load curve and integrating renewable energy sources, this paper demonstrates how industrial parks can achieve a balance between operational cost reduction and carbon emission minimization. Furthermore, the integration of hydrogen production via electrolyzers adds another layer of complexity and opportunity, as hydrogen can serve as both an energy carrier and a storage medium, enhancing the flexibility and sustainability of the energy system.
As a clean secondary energy with high energy density, hydrogen has the advantages of zero pollution and zero carbon emissions [16]. Hydrogen production by an electrolyzer can be regarded as the load of the energy system, and the produced hydrogen can be used for hydrogen fuel cell power generation [17]. Therefore, integrating the production, storage, and use of hydrogen can help improve the economy and low-carbon nature of the entire energy system [18]. At present, many studies have regarded hydrogen as playing an important role in the integrated energy system. Xiang et al. [19] studied the economic optimization strategy of industrial parks with electrolytic cell hydrogen production, and the results showed that the hydrogen production industry can effectively improve the economy. Li et al. [20] studied the coupling operation strategy of hydrogen production and thermal power units. In addition, the hydrogen production industry is also coupled with ports [21], communities [22], and solar power plants [23]. However, existing studies have not considered the coupling process between hydrogen and the electrolytic aluminum industry. On the other hand, the intermittent nature of renewable energy may lead to inefficiencies and curtailments, thereby weakening the economic and environmental benefits of hydrogen production. Therefore, how to effectively plan the production, storage, and utilization of hydrogen to improve the benefits of the electrolytic aluminum industry and further improve the economy and environmental protection of the entire energy system is a key issue to be addressed in this paper.
In summary, research on IESs is still insufficient in terms of industrial park economy and carbon emission reduction, especially in the comprehensive consideration of electrolytic aluminum and hydrogen production industry load optimization. In order to solve the above problems, this paper proposes a multi-objective flexible optimization strategy for electrolytic aluminum and hydrogen production industrial parks. The main contributions of this paper are as follows:
(1)
A comprehensive energy-scheduling optimization model specifically designed for industrial parks engaged in aluminum electrolysis and hydrogen production is established. The proposed IES considers the power grid, thermal power units, new energy, electrolytic aluminum load, and ordinary load, as well as the manufacture, storage, and utilization of hydrogen.
(2)
An optimal scheduling method for aluminum electrolytic load is proposed. By optimizing the electrolytic aluminum load curve for the next day, the operating costs of the industrial park can be significantly reduced.
(3)
An objective function with a penalty term is proposed, which can adjust the total carbon emissions and operating costs according to actual conditions, greatly improving the flexibility of the system.
The rest of this paper is organized as follows: Section 2 describes the framework of the integrated energy system. Section 3 presents the modeling of aluminum electrolysis and hydrogen production, including the optimization objectives and constraints. Section 4 presents the analysis results and discussions. Finally, Section 5 discusses the conclusions and gives future prospects.

2. Integrated Energy Systems Framework

This section mainly introduces the components of the entire IES. To reduce the power generation cost and carbon emissions of industrial parks with electrolytic aluminum load (EAL) as the main power load, this paper establishes an IES including electricity and hydrogen energy. The power load in the proposed IES includes two types: ordinary power load (OPL) and EAL. At present, electrolytic aluminum is often made using hydropower [24]. However, the research object of this paper is located in Inner Mongolia, China, where water resources are scarce. There are abundant photovoltaic, wind, and coal resources in the area, so the power supply equipment includes coal-fired power plants (CPP), wind power plants (WPP), and photovoltaic power plants (PV). In response to the requirements of the national and International Aluminium Institute associations for carbon emission reduction, hydrogen fuel cells (HFCs) are also used as power supply equipment. The system is equipped with an electrolytic cell for hydrogen production (HP) and a hydrogen storage tank (HST) for hydrogen storage. The system can also purchase hydrogen (PH) from the outside when necessary. At the same time, when the system has a surplus of electricity, it can sell electricity to the large power grid, and when the electricity is insufficient, it can purchase electricity from the large power grid. Since more than 50% of the heat in the electrolyzer is lost and the tail gas is only about 100 °C, waste heat recovery is very difficult and requires additional professional equipment [25]. This article does not involve equipment modification, so heat load optimization is not considered. The energy flow diagram of the IES is shown in Figure 1.

3. Modeling

This section mainly completes the mathematical modeling of each device of the IES proposed in this study. The established IES can be divided into power supply equipment, controllable load, and hydrogen production equipment.

3.1. Power Supply Equipment

First, PV and WPP are the main equipment used for renewable energy power generation. Their output expressions are shown in Equations (1) and (2), respectively:
0 P pv t P pv , pre t
0 P wpp t P wpp , pre t
where P pv t and P wpp t are the actual outputs of PV and WPP at time t , MW ; P pv , pre t and P wt , pre t are the day-ahead predicted outputs of PV and WPP at time t , MW . Considering the day-ahead scheduling optimization, t is taken hourly.
The output constraint of the CPP is shown in Equation (3). At the same time, the load change rate constraint of the CPP is shown in Equation (4).
P i min P t , i P i max
P i down P t 1 , i P t , i P i up
where P t , i is the output power of the i -th CPP at time t , MW ; P i max and P i min are the upper and lower limits of the output power of the i -th CPP, MW ; P i up and P i down are the upper and lower limits of the ramp of the i -th CPP, MW .
A HFC is a power generation device that directly converts the chemical energy of hydrogen and oxygen into electrical energy. Its principle is shown in Equation (5):
P hc , t = P gas , t η h
where P hc , t is the output electrical power of the HFC at time t , MW ; P gas , t is the hydrogen consumption power, MW ; η h is the energy conversion efficiency of the HFC.
Finally, the established IES and the power grid maintain a bidirectional flow of power. Therefore, the system power satisfies the constraints shown in Equation (6):
P grid min P grid t P grid max
where P grid t is the amount of electricity exchanged between the IES and the large power grid at time t , MW . If P grid t > 0 , the system purchases electricity from the large power grid. If P grid t < 0 , it means that the system sells excess electricity to the large power grid. P grid max and P grid min represent the upper and lower limits of the system’s purchase and sale of electricity from the large power grid, MW .

3.2. Controllable Load Modeling

This part mainly completes the modeling of two different controllable power loads, including electrolytic aluminum load and ordinary load.

3.2.1. Electrolytic Aluminum Load

Electrolytic aluminum is an important high energy-consuming industrial load. It has a long working cycle throughout the day and a high demand for electricity. Therefore, the cost can be reduced by flexibly adjusting the EAL in different periods according to the renewable energy power generation and electricity prices. The aluminum electrolysis load can be defined as shown in Equation (7):
P A L , t = P AL , t 0 + P shift , t
where P AL , t is the actual EAL of the system at time t , MW ; P AL , t 0 is the benchmark EAL, MW ; P shift , t is the adjustment amount, MW . A production sequence often exceeds several months, and the cost of restarting is as high as millions of dollars. Therefore, P AL , t will be limited to a certain range, which can be achieved by limiting P shift , t through Equation (8):
t = 1 T P shift , t = 0
P shift min P shift , t P shift max
where T represents the total number of time periods scheduled; P shift min and P shift max represent the upper and lower limits of the adjustment amount, MW . The load of auxiliary systems such as the cooling system and feeding system is very small compared to that of the electrolytic cell, and this part of the impact will be ignored [26].

3.2.2. Ordinary Power Load

The OPL of the system mainly refers to some non-critical power-consuming equipment that can be reduced or temporarily stopped. For example, during periods of low power consumption, some lighting, air conditioning, and other equipment can be suspended to reduce the load on the power system. Therefore, the total system load is defined as shown in Equation (10):
P L , t = P e , t + P AL , t
where P L , t and P e , t are the total system load and OPL of the system at time t , MW .

3.3. Hydrogen Production Equipment

This part mainly completes the modeling of hydrogen power generation, including hydrogen fuel cells, hydrogen storage, and hydrogen purchase.

3.3.1. Electrolytic Cell

Hydrogen production by an electrolytic cell is an important way to produce clean energy by electrolyzing water into hydrogen. The model of the electrolytic cell can be defined as shown in Equation (11):
H gas , t = P e c , t η e c
where H gas , t is the hydrogen output power of the electrolyzer at time t , MW ; P e c , t is the electrical energy consumed by the electrolyzer, MW ; η e c is the energy conversion efficiency of the electrolyzer.

3.3.2. Hydrogen Storage Tank

The HST can store hydrogen produced by electrolyzers, which can effectively improve the flexibility of IESs. HST can also convert excess wind and solar resources into hydrogen, improving the IES’s absorption of renewable energy power generation. The model of the HST can be defined as shown in Equation (12):
S H t = S H t 1 + H cha , t η cha Δ t H dis , t   /   η dis Δ t
where S H t is the amount of hydrogen stored in the hydrogen storage tank at time t . The hydrogen storage is regarded as the available power generation capacity, so its unit is MW , like other loads. H dis and H cha the power of hydrogen discharged or charged, MW ; η cha and η dis are the efficiency of storing and releasing hydrogen in the HST, respectively.

3.3.3. Hydrogen Purchase

Integrating hydrogen purchased from external sources into the integrated energy system can enhance the flexibility, resilience, and overall efficiency of the IES. The impact of purchased hydrogen is primarily reflected in the cost function in the next section and will not be described in this section.

3.4. Optimization Scheduling Model

To reduce the operating costs and carbon emissions of the established industrial park, this study focuses on the day-ahead scheduling framework. The day-ahead scheduling plan is made 24 h in advance with a time scale of 1 h. In the day-ahead stage, it is necessary to determine the start and stop plans for various power generation equipment, as well as the scheduling of electrolytic aluminum load and general power load.

3.4.1. Objective Function

The objective function of the day-ahead scheduling stage is to minimize all costs of the entire IES within 24 h. The cost function is shown in Equation (13).
o b j 1 = C buy C cell + C pen + C cpp + C m + C h
(1)
Cost of buying electricity C buy and selling electricity C cell : The difference between C buy from the grid and C cell constitutes the grid interaction cost of this IES, which is a cost that must take into account. This cost can be expressed as follows:
C buy = t = 1 T c buy , t P buy , t
C cell = t = 1 T c sell , t P sell , t
where c buy , t and c sell , t are the purchase price and sales price of electricity between the IES and the large power grid at time t , $ / MWh ; P buy , t and P sell , t are the purchase power and sales power between the IES and the large power grid at time, MW ; T = 24 is the time range for optimization, hour .
(2)
Penalty cost of wind and solar power abandonment C pen This cost refers to the economic losses caused by being forced to abandon wind and solar power generation due to insufficient system absorption capacity, which can be defined as shown in Equation (16):
C pen = t = 1 T c pen ( P pv , pre t P pv t + P wt , pre t P wt t )
where c pen is the penalty weight of wind and solar abandonment [24].
(3)
Cost of the CPP C cpp : This cost refers to the power generation cost of CPP, including the nonlinear part and the advance part, defined as shown in Equation (17):
C cpp = i = 1 m t = 1 T a i P t , i 2 + b i P t , i + c i
where a i , b i , and c i are the coal-fired coefficients of the i -th CPP, $ / MWh 2 , $ / MWh , $ ; m represents the number of CPP units.
(4)
Hydrogen power generation cost C m : This part includes the daily use and maintenance costs of HFCs, HP, and HSTs, which can be defined as shown in Equation (18):
C m = t = 1 T c hfc P hfc , t + c hp P hp , t + c hst H dis + H cha
where c hfc , c hp , and c hst are the unit maintenance costs of HFCs, electrolyzers, and HSTs, $ / MWh [27].
(5)
Hydrogen purchase cost C h : This part is due to the cost of purchasing hydrogen from outside, which can be defined as shown in Equation (19):
C h = t = 1 T c h , t H buy , t
where c h , t is the price of hydrogen purchased from the outside by the system, $ / MWh .
About 70% of the electrolytic aluminum industrial park’s carbon emissions come from coal combustion in the power generation process [28]. Therefore, the total carbon emission objective function of the integrated energy system is shown in Equation (20):
o b j 2 = i = 1 m t = 1 T P t , i γ c + t = 1 T P buy , t γ c t = 1 T P sell , t γ c
where γ c is the carbon emission coefficient per unit of electrical power, which is taken as 1.06 t/MW in this paper.
IESs may have different requirements at different times in real scenarios. For example, during the energy transition period, the focus may be on carbon emissions at the expense of certain economic efficiency. This paper adds Equations (13) and (20) to obtain a multi-objective loss function. A penalty coefficient is also introduced to implement the operation template in different scenarios. The objective function used in this paper is shown in Equation (21):
min o b j = min c * o b j 1 + 1 c * o b j 2
where c 0 c 1 is a constant.

3.4.2. Constraints

The IES established in this paper has two forms of energy: hydrogen and electricity. Therefore, the system should consider the balance of these two forms of energy when it is running. Equations (22) and (23) are the balance expressions of electricity and hydrogen, respectively.
P grid t + P pv t + P wt t + i = 1 m P t , i + P hc , t = P e c , t + P L , t
P gas , t + H cha , t = H gas , t + H dis , t + H buy , t
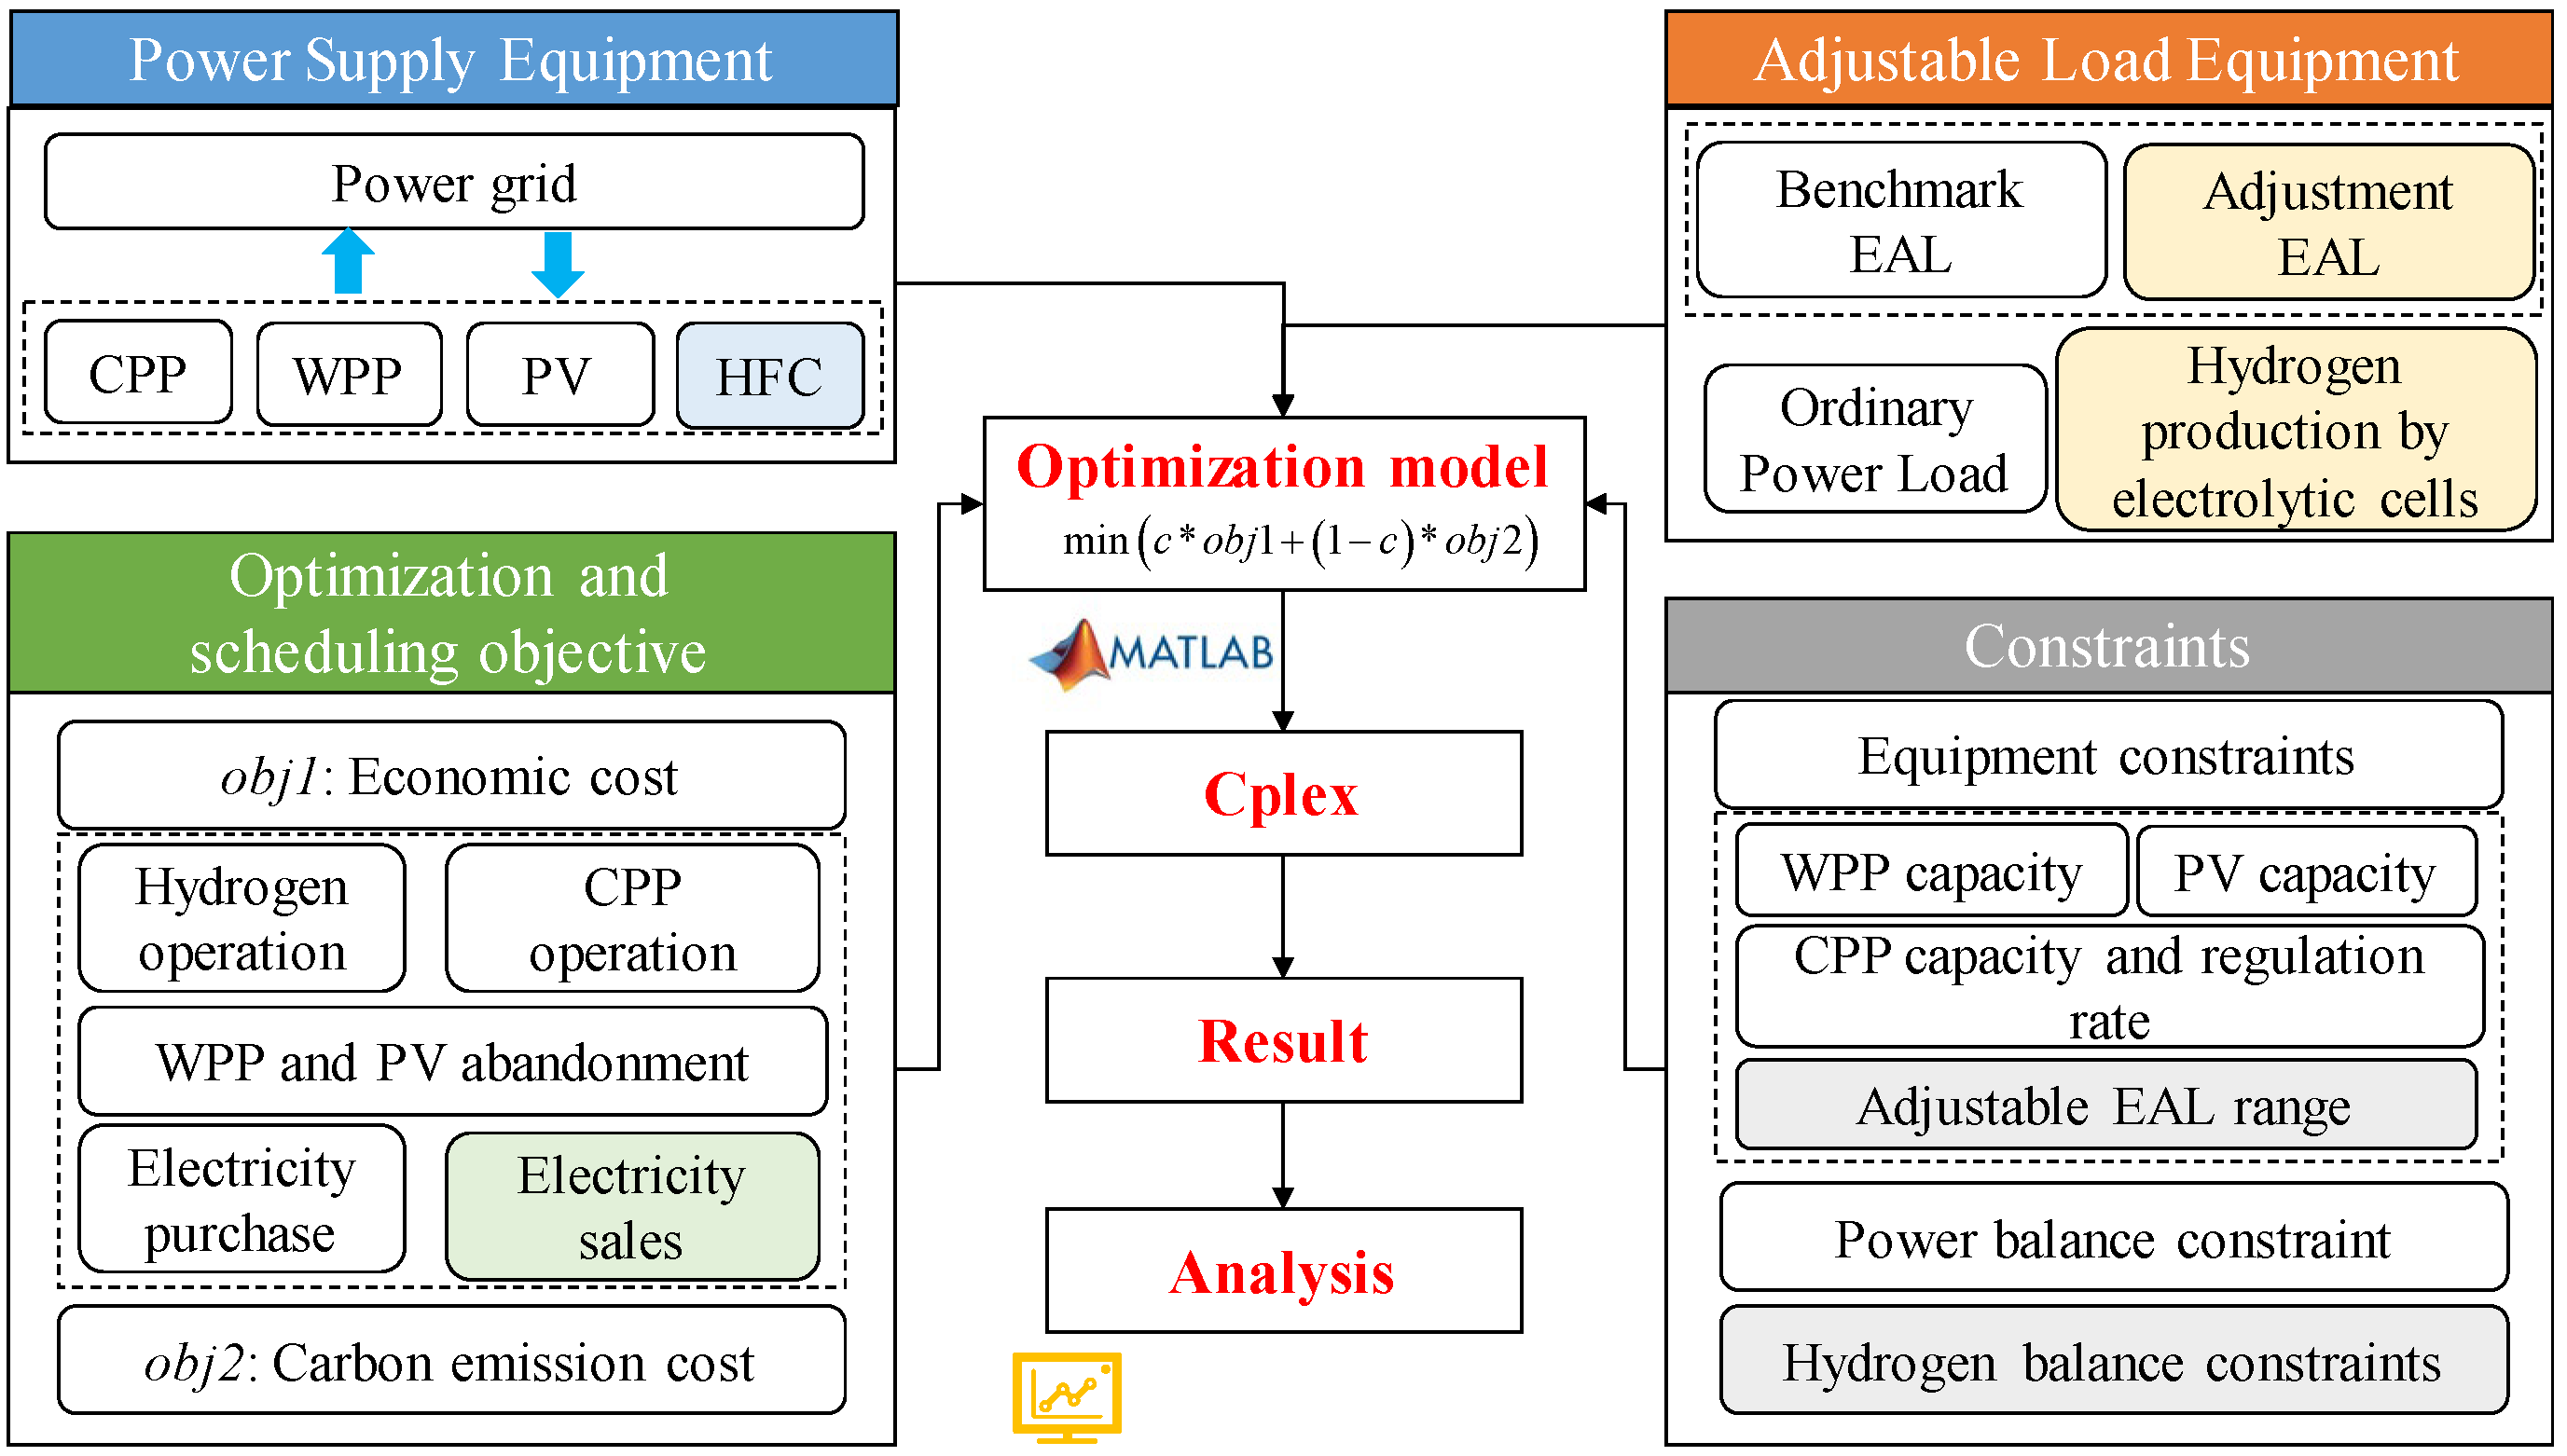
where m is the number of CPP units, and H buy , t is the amount of hydrogen purchased by the system from the outside. In addition, the system energy changes must also satisfy the physical constraints of Equation (1) to Equation (12). The optimization framework of this article is shown in Figure 2.

4. Results and Discussion

This section completes the introduction of the parameters and data of the IES used in this study, the case settings, and the analysis of the scheduling results.

4.1. Data Description and Case Settings

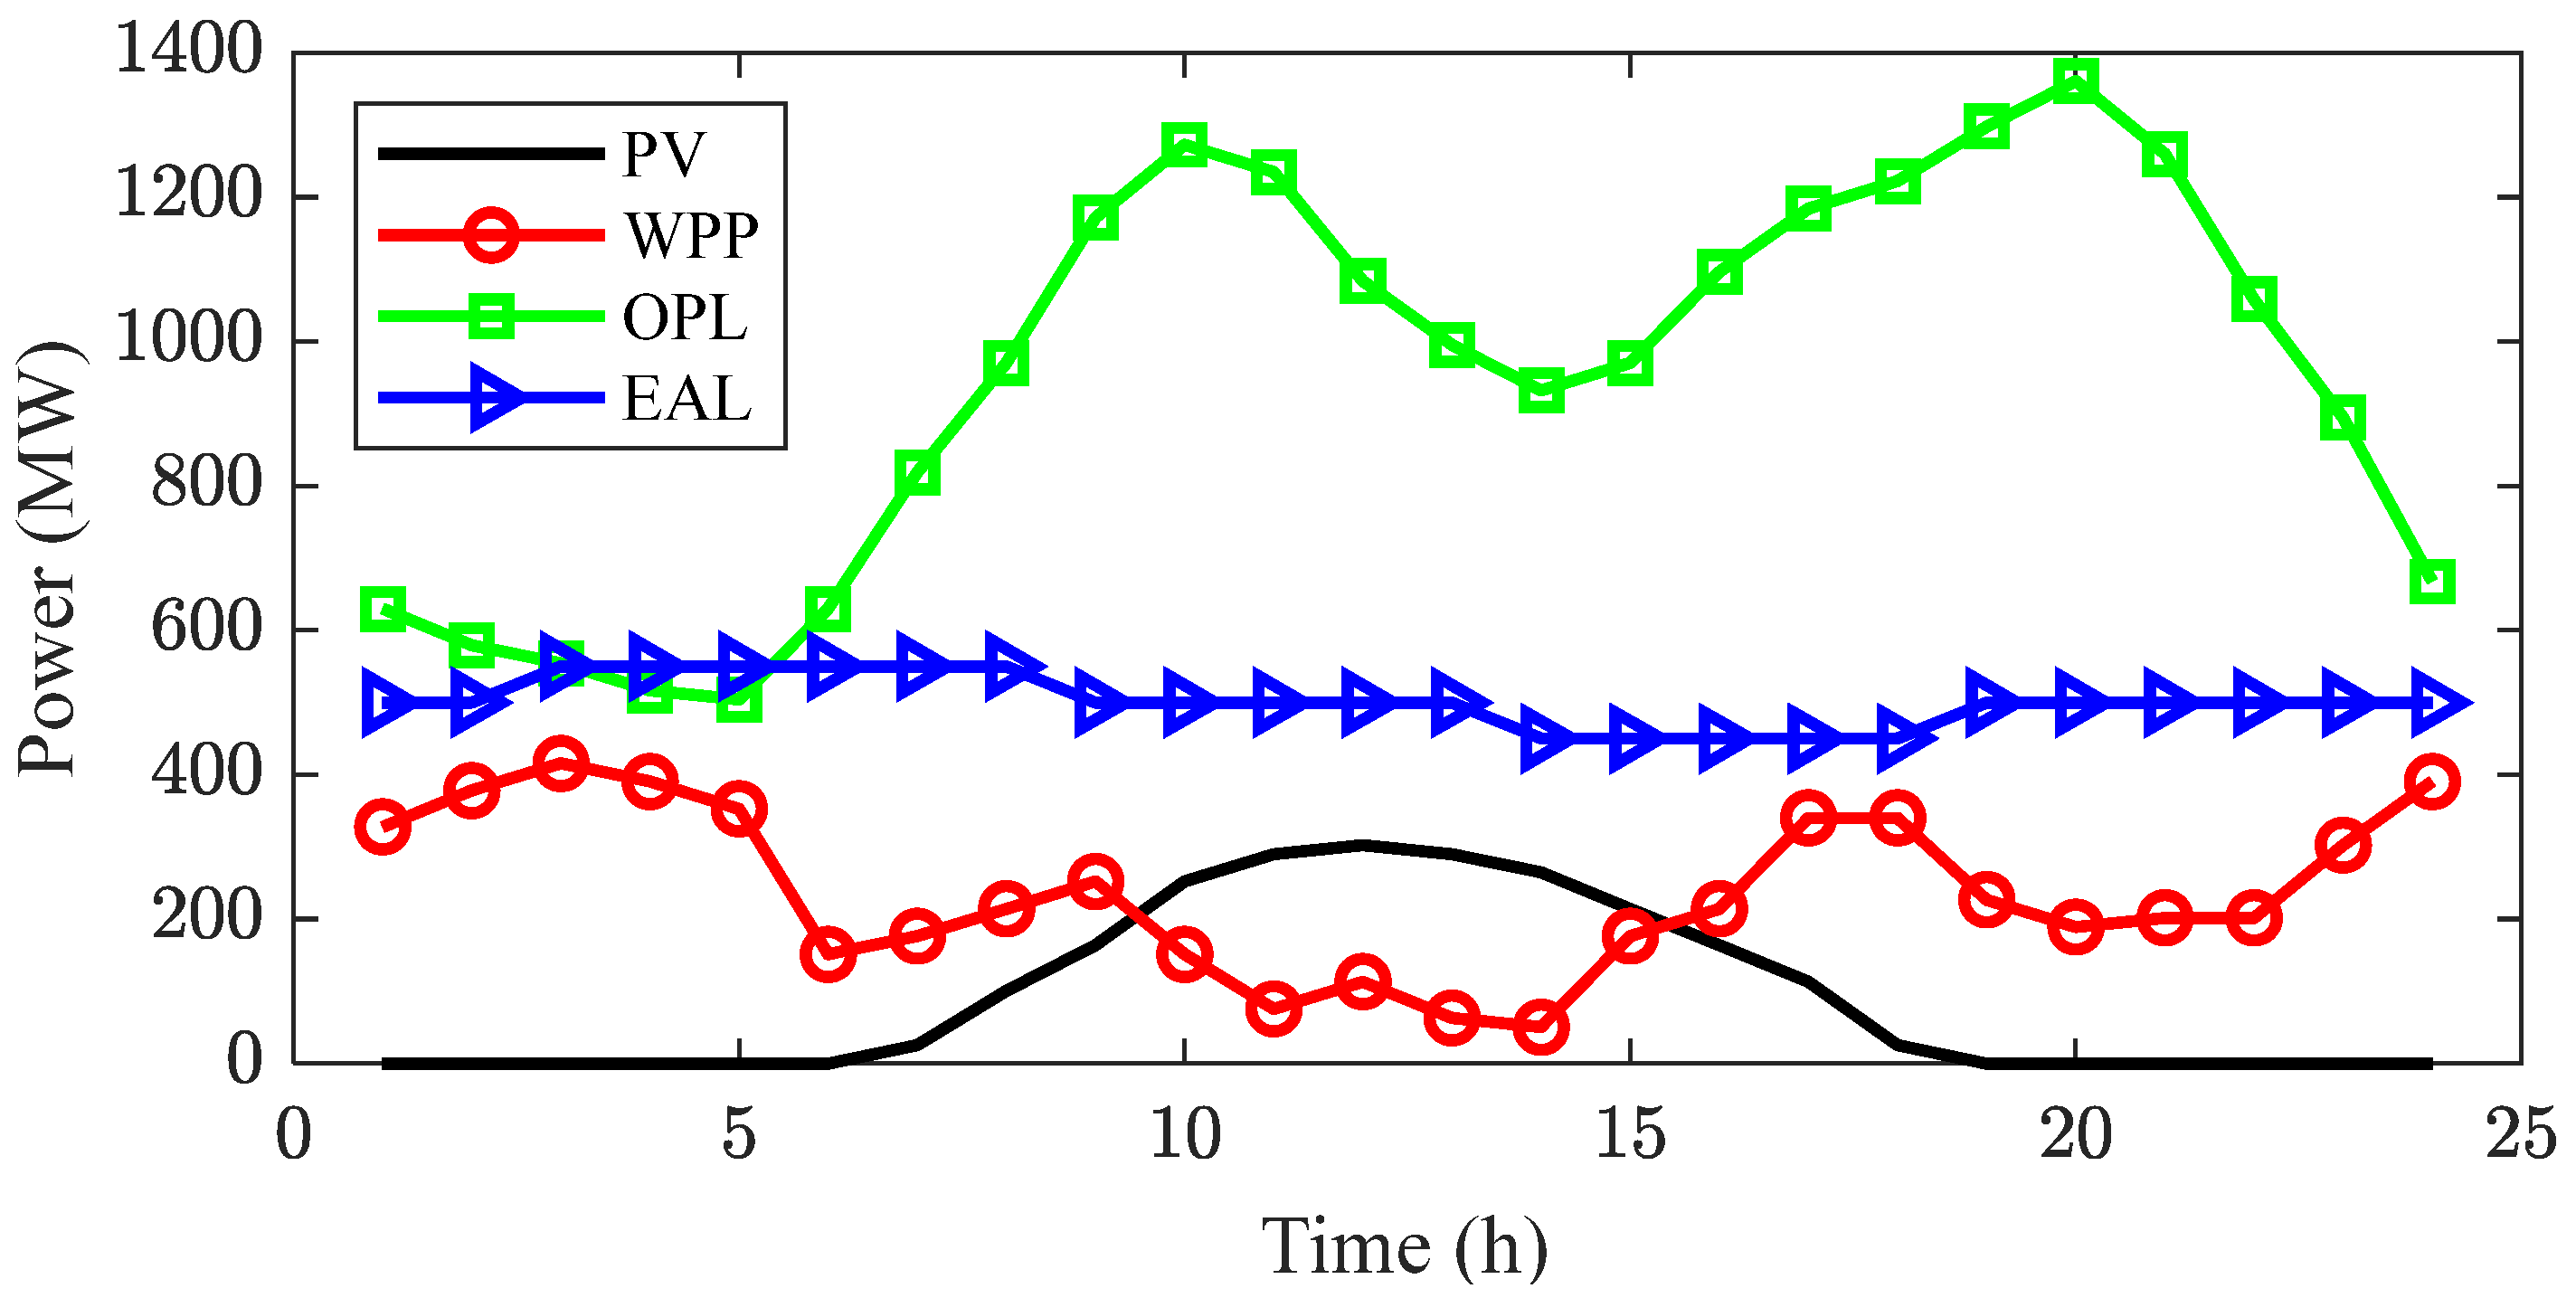
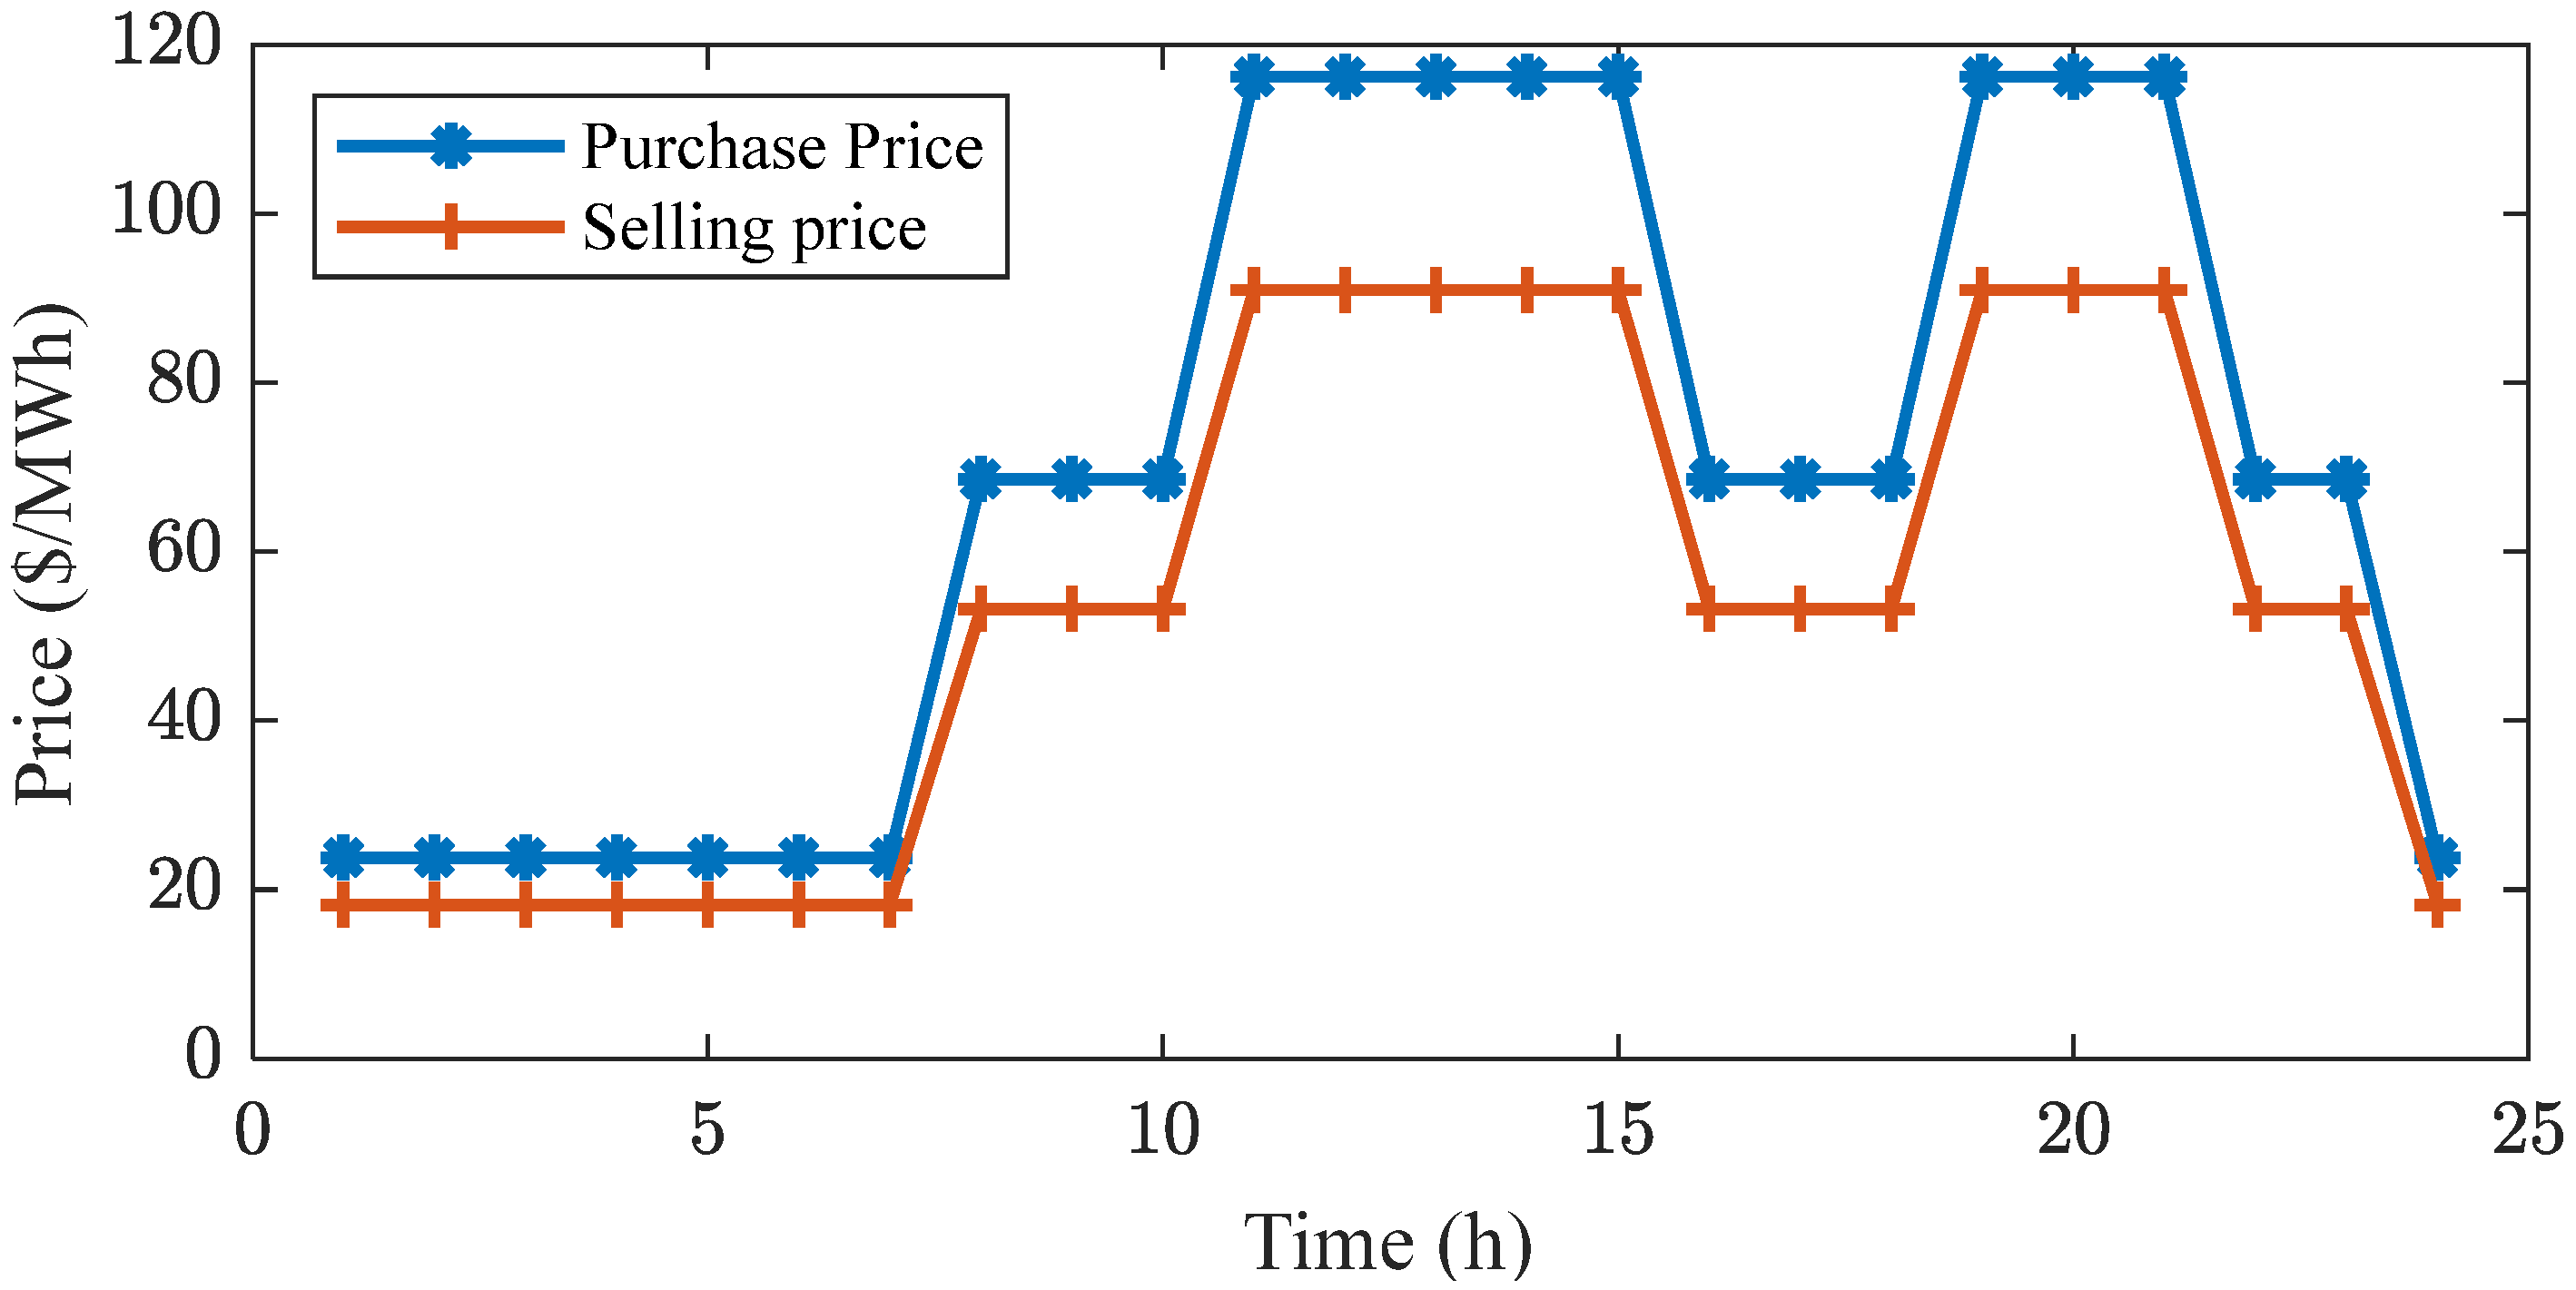
This study employs an 600 MW WPP and 400 MW PV. The WPP, PV, and power load values in the day-ahead phase are shown in Figure 3. The time-of-day buying and selling electricity prices used in this study are shown in Figure 4.
This study uses three coal-fired units, and their detailed parameters are shown in Table 1. In order to be more in line with the actual situation, the three CPP units differ in power range, ramping capability, and operating costs.
The efficiency of hydrogen storage and release in the hydrogen storage tank is set to 90%. The efficiency of hydrogen production by an electrolyzer is set to 75%. The energy conversion efficiency of the hydrogen fuel cell is set to 85%. The unit maintenance costs of the hydrogen fuel cell, electrolyzer, and hydrogen storage tank are set to 70 $ / MWh , 84 $ / MWh , and 56 $ / MWh , respectively. The price of purchasing hydrogen from the outside is 500 $ / MWh . The maximum capacity of the hydrogen storage tank is 5000 MW, and the maximum power of the hydrogen fuel cell is 1000 MW. Meanwhile, the penalty coefficient for wind and solar power abandonment is set to 14 $ / MWh .
Finally, four scenarios are set up in this paper to demonstrate the effectiveness of the proposed optimization model. Case 1 and Case 2 are used to explore the impact of penalty coefficients in different objective functions on the results. Case 3 and Case 4 are used to explore the impact of optimizing EAL under different penalty weights. All simulation cases are performed using the Cplex solver, and the simulation environment is a desktop computer with 2.50 GHz CPU and 32 GB of RAM.

4.2. Optimization Results Analysis

This paper considers the operating cost and carbon emissions of the integrated energy system to establish an optimal scheduling model based on the cost function Equation (21) proposed in Section 3, which aims to minimize costs as the optimization objective, and using Equation (1) to Equation (12), Equation (22), and Equation (23) as constraints.

4.2.1. Analysis of Case 1 Results

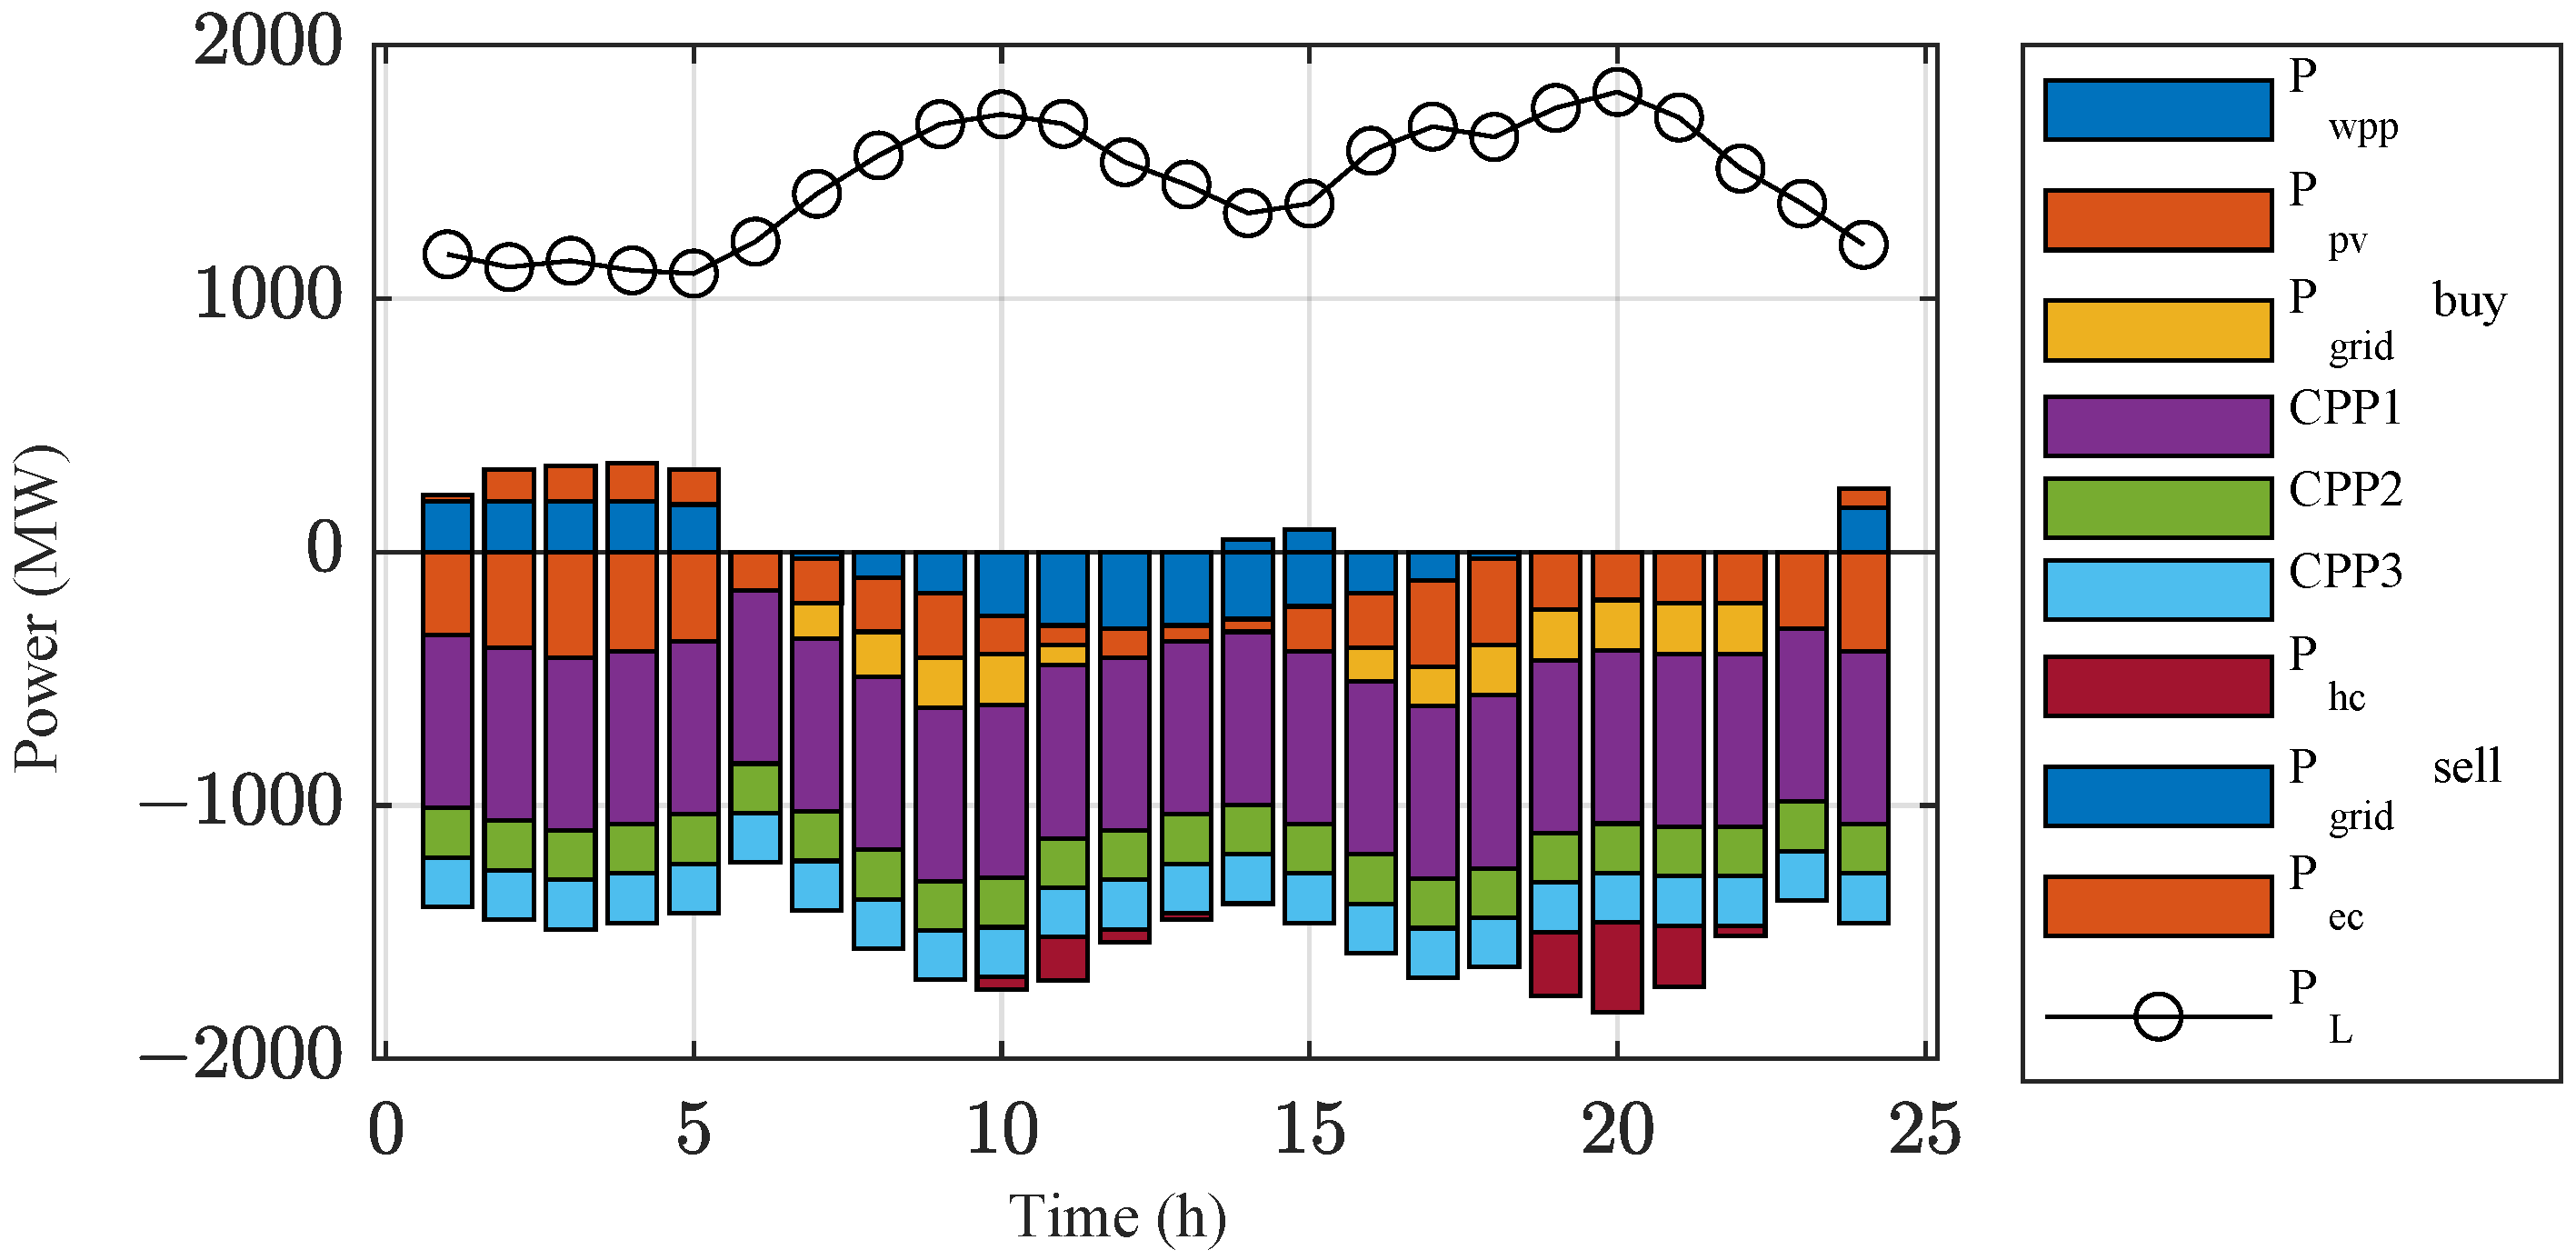
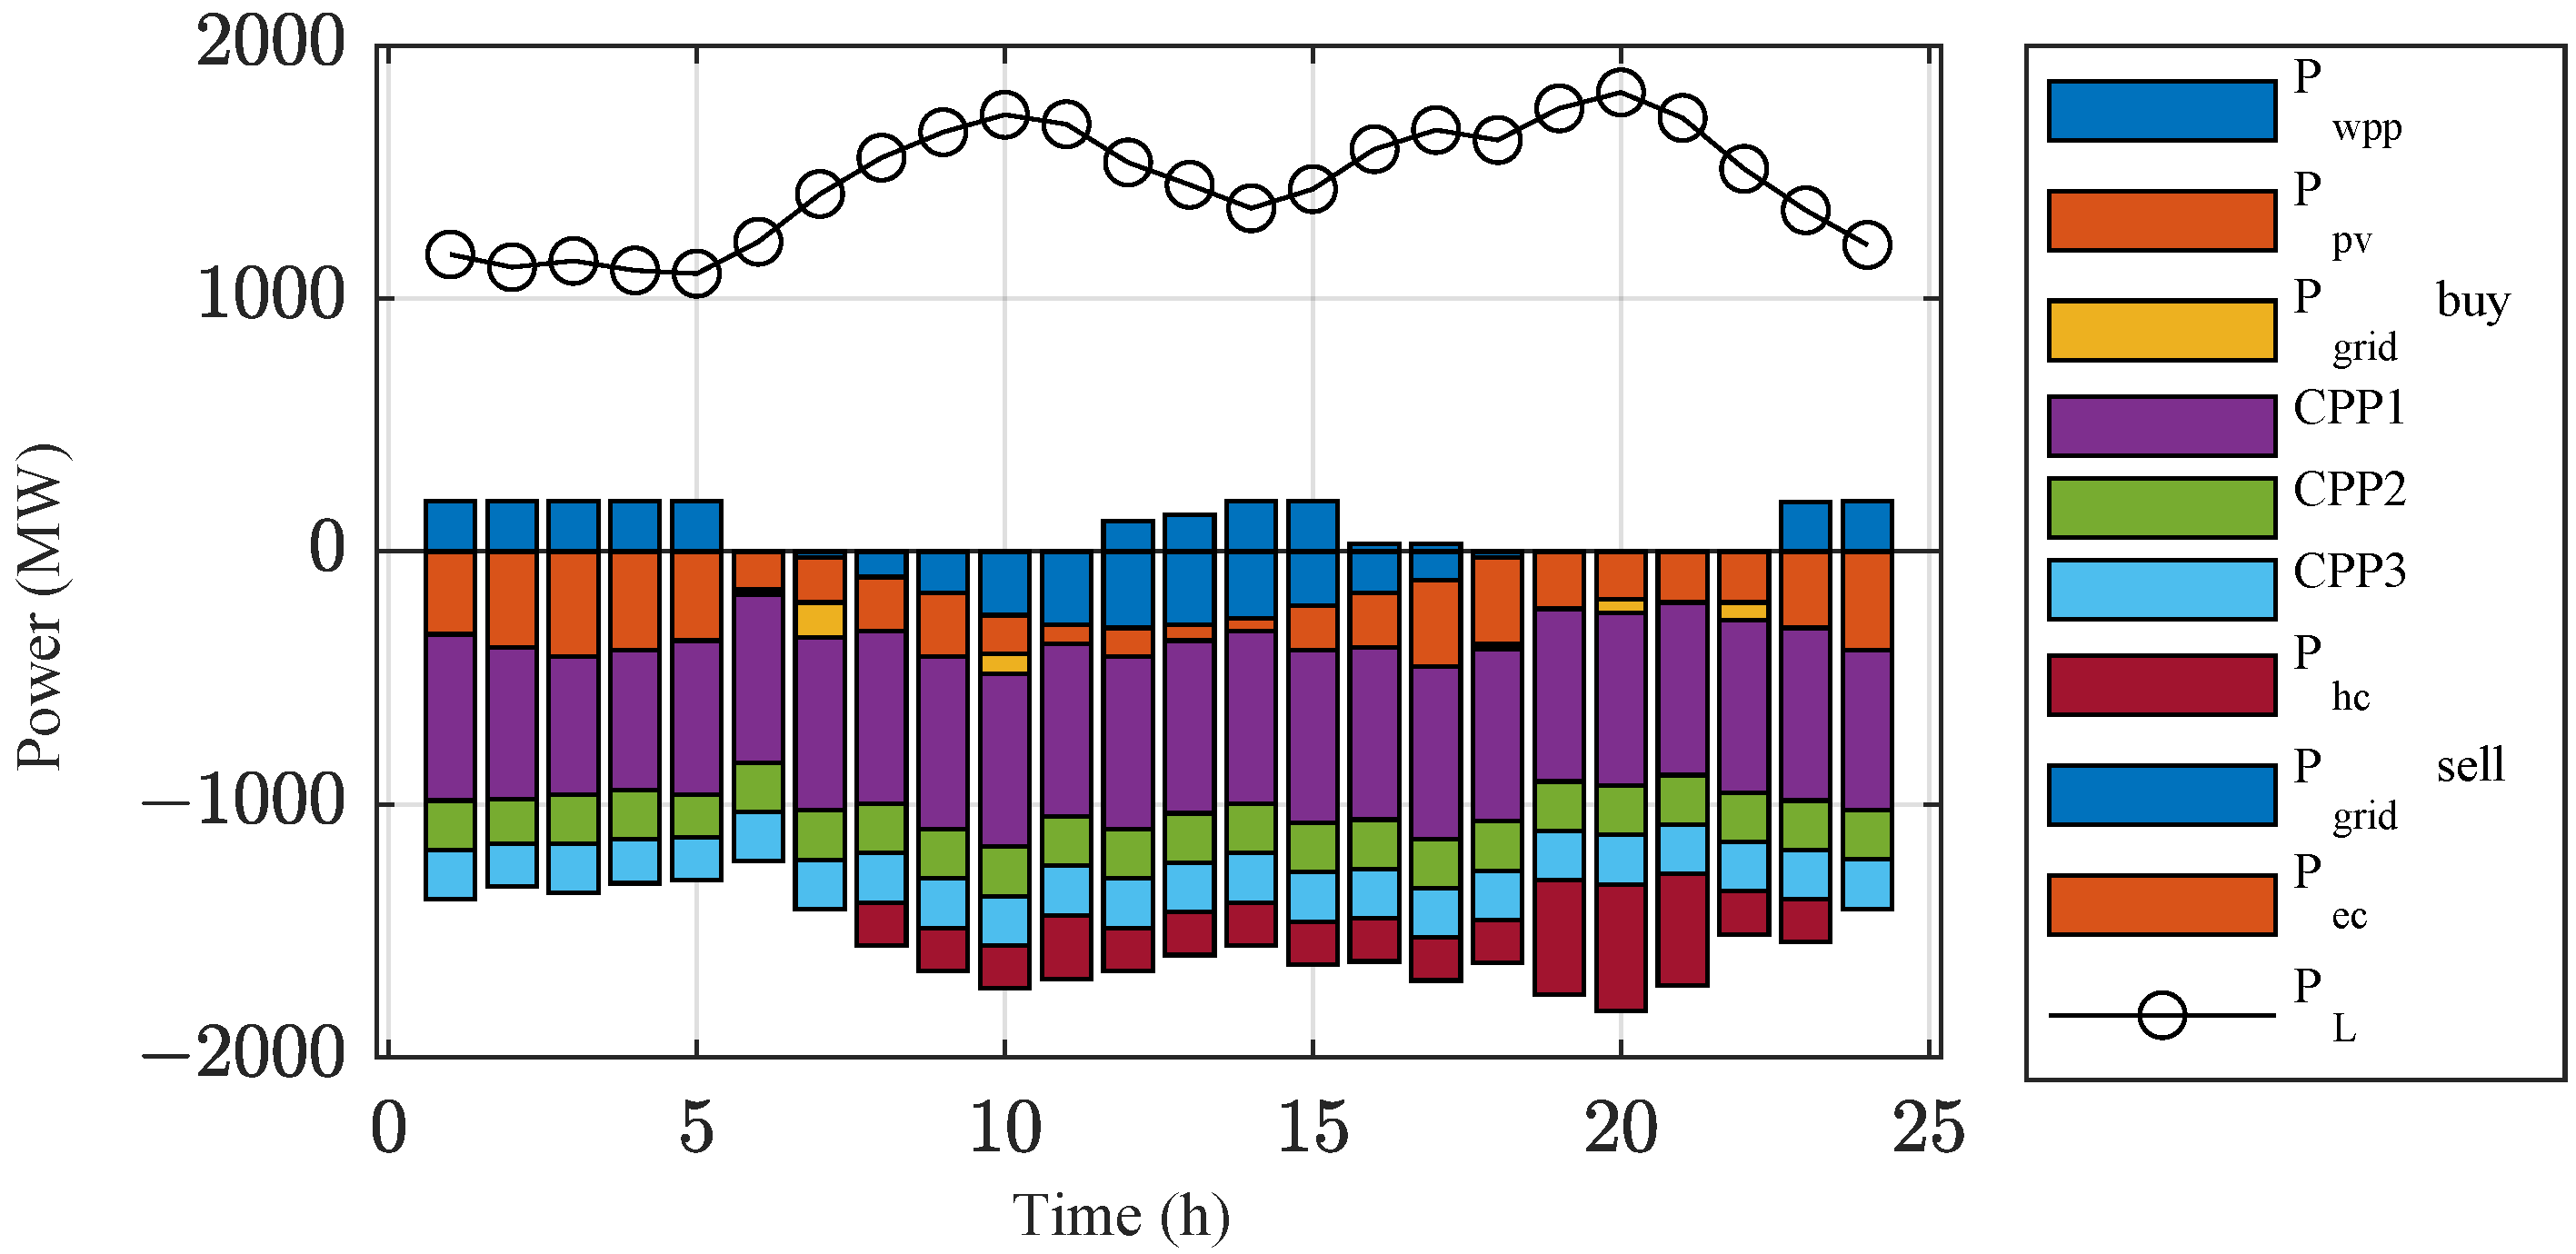
In Case 1, the weight of the operating cost in the objective function is taken as 0.2 for simulation. After calculation, the power dispatch results of each device in the integrated energy system are shown in Figure 5.
As shown in Figure 5, the thermal power units remain in working condition throughout the entire dispatch cycle. Between 24:00 and 5:00, the IES is in a low load period. The power in the system is relatively surplus, and the excess power in the system is input into the electrolyzer for hydrogen production. In the periods of 10:00–13:00 and 19:00–22:00, the load of the IES is at a peak. To maintain the power balance of the system, in addition to purchasing power from the large power grid, the system also converts hydrogen energy into power through HFC to maintain the power balance of the system. During the periods of 14:00–15:00 and 24:00–5:00, when the system has surplus power, it sells this excess to the large power grid to generate revenue. In the two time periods of 7:00–11:00 and 16:00–23:00, the system purchases electricity from the large power grid to maintain the power balance. According to statistics, the system generates a total of 1184.2 MW of electricity through HFC. The above results demonstrate the flexibility of the established IES, enabling it to fully utilize the hydrogen production industry and the large power grid for real-time optimal operation.
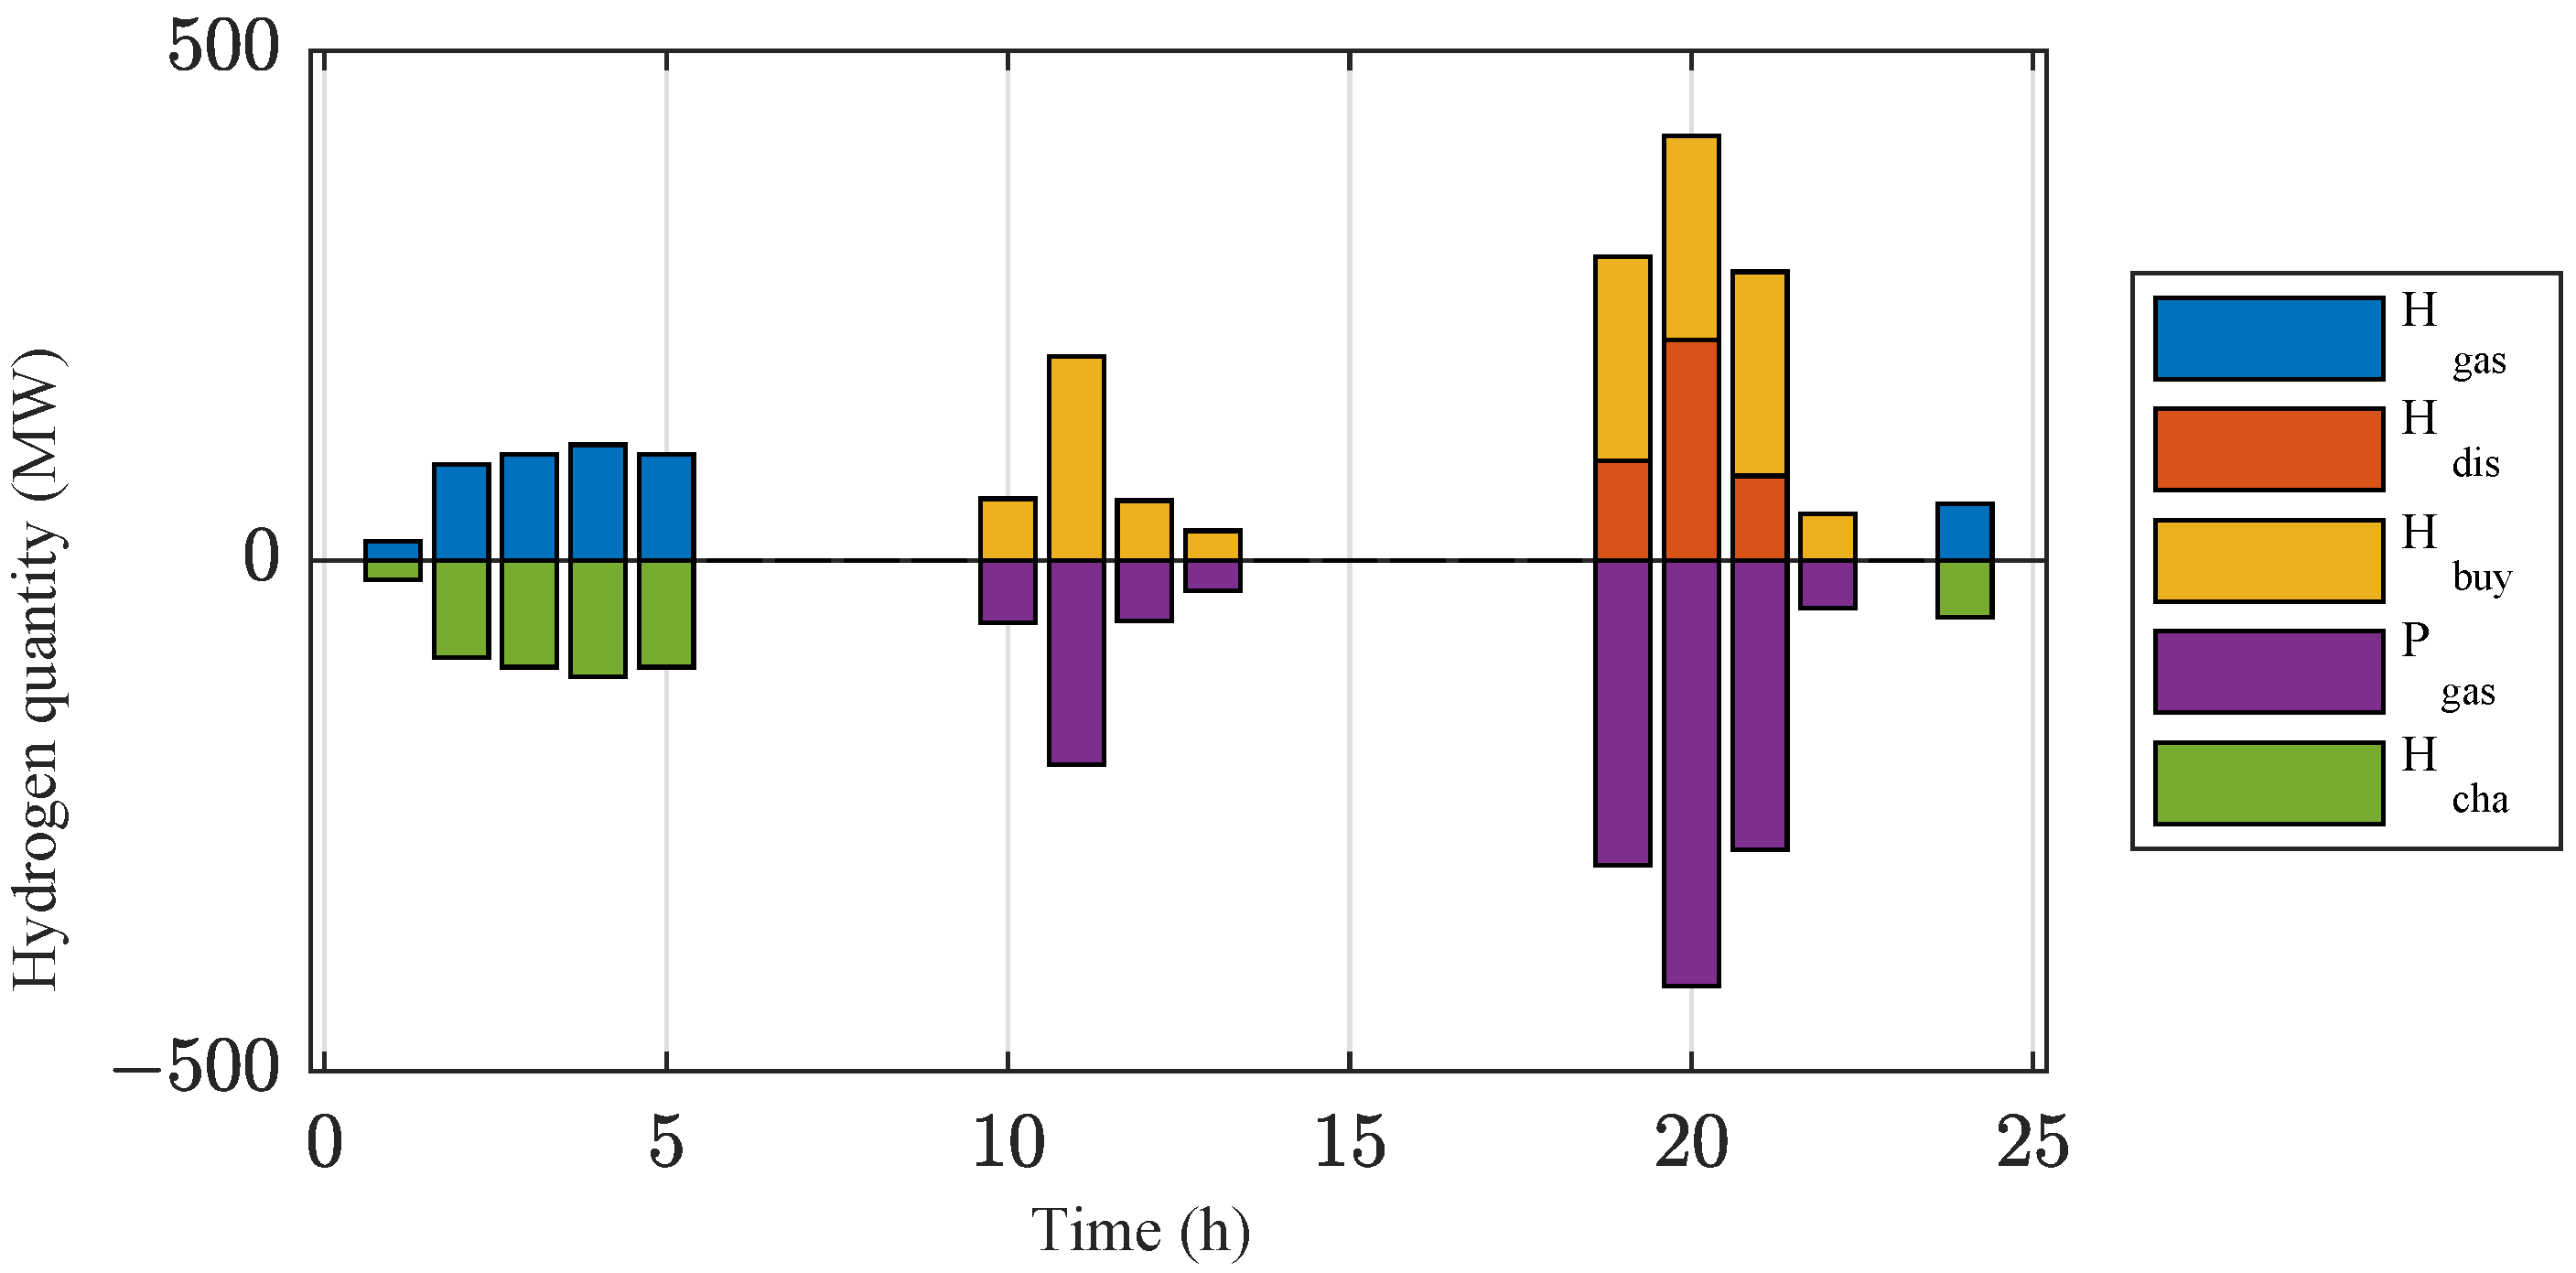
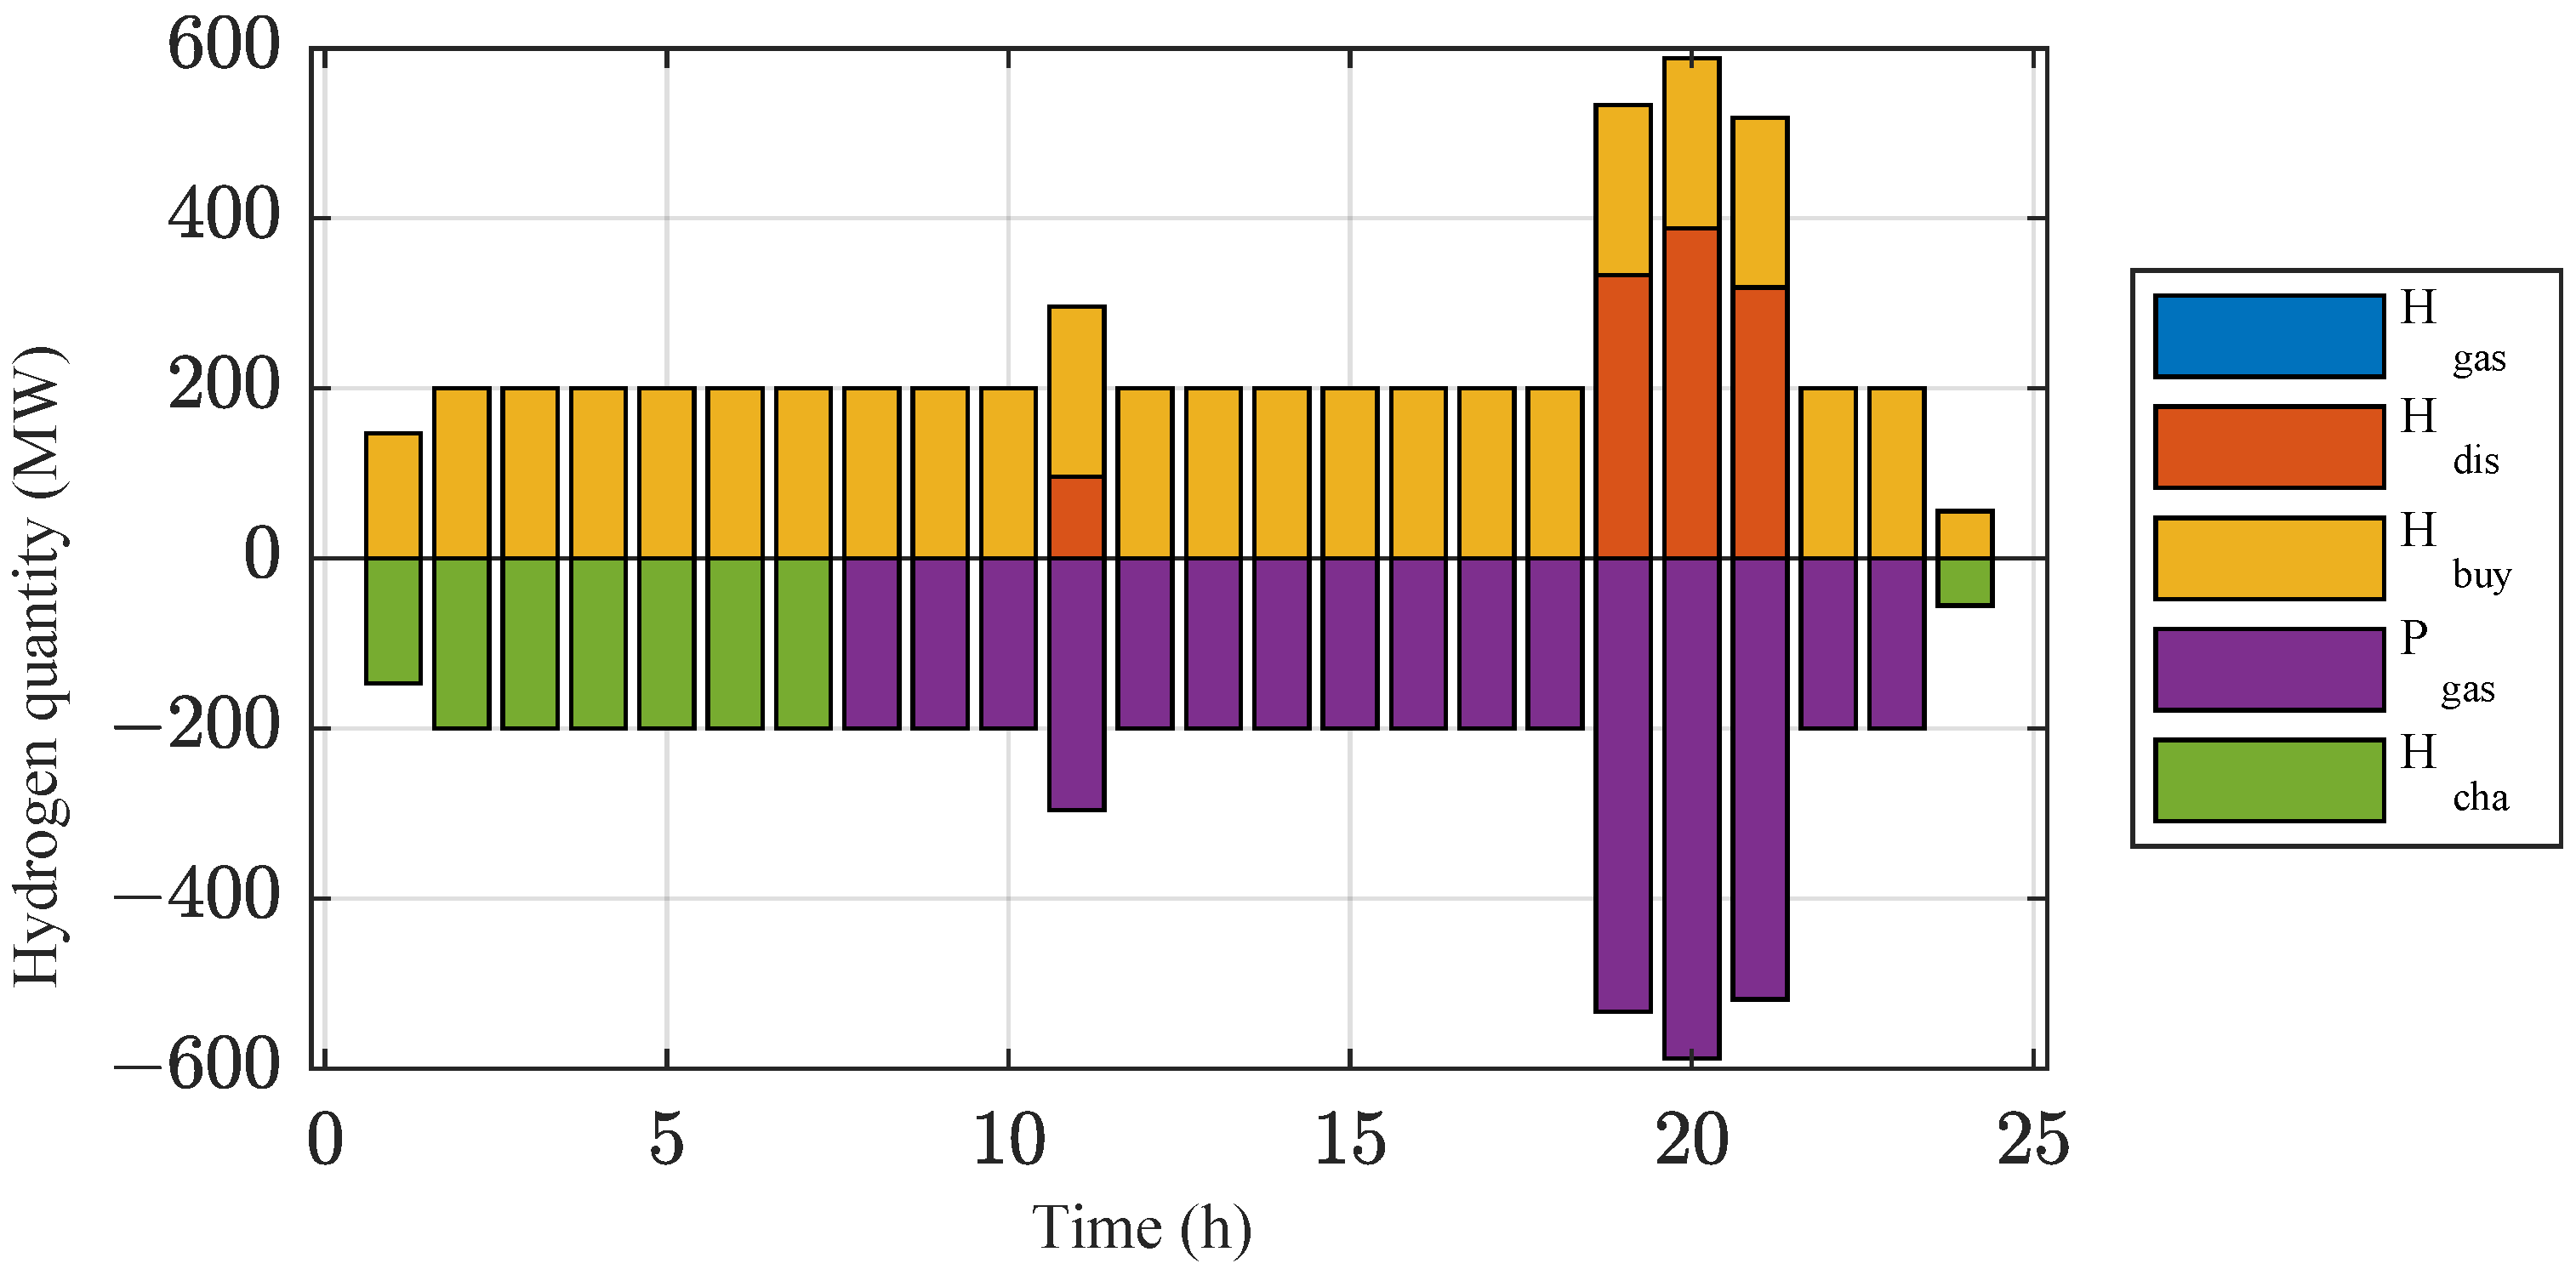
The hydrogen energy scheduling results of each device in the system are shown in Figure 6. The electrolyzer and HFC cannot operate simultaneously, but the system can purchase hydrogen from the outside while the HST releases hydrogen. Between 24:00 and 5:00, the system has a surplus of electricity, which converts into hydrogen and stores in the HST. During the time periods of 10:00–13:00 and 22:00, the system chooses to purchase hydrogen directly from the outside for use in HFC to generate electricity, and it does not choose to release the hydrogen into the hydrogen storage tank. Between 19:00 and 21:00, the system not only purchases hydrogen from the outside but also releases hydrogen from the HST for use in HFC. It is calculated that the system has purchased a total of 995.41 MW of hydrogen from outside.
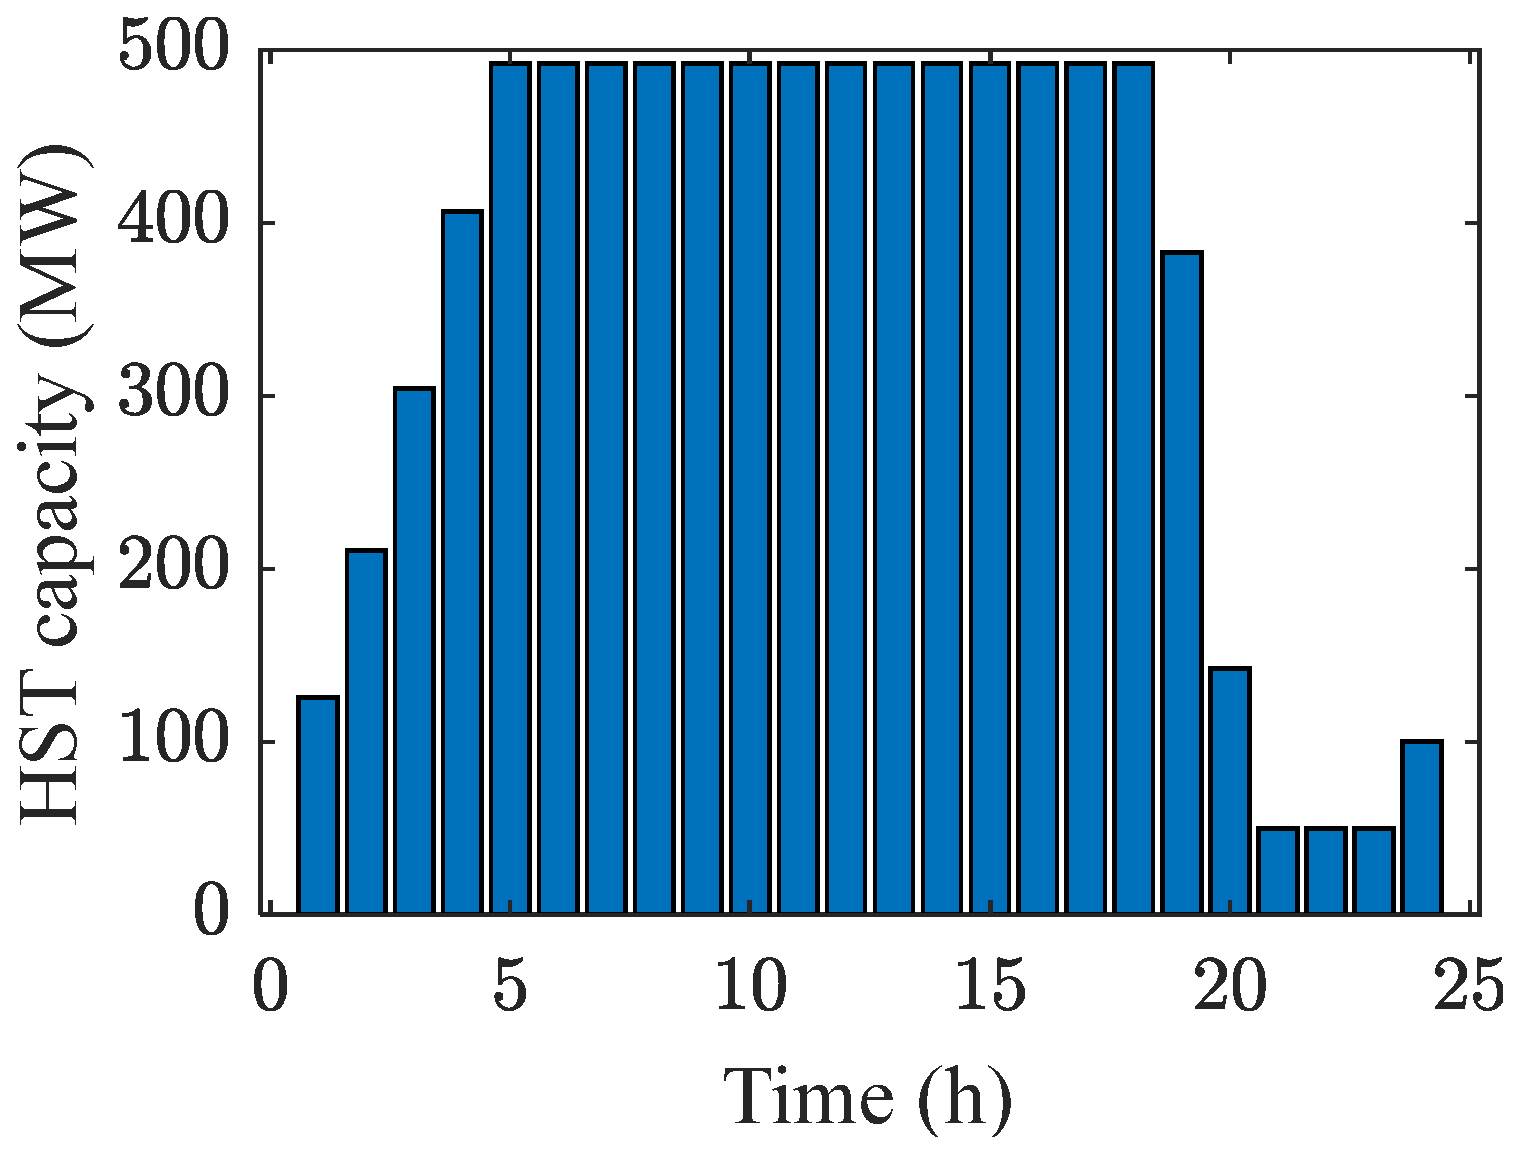
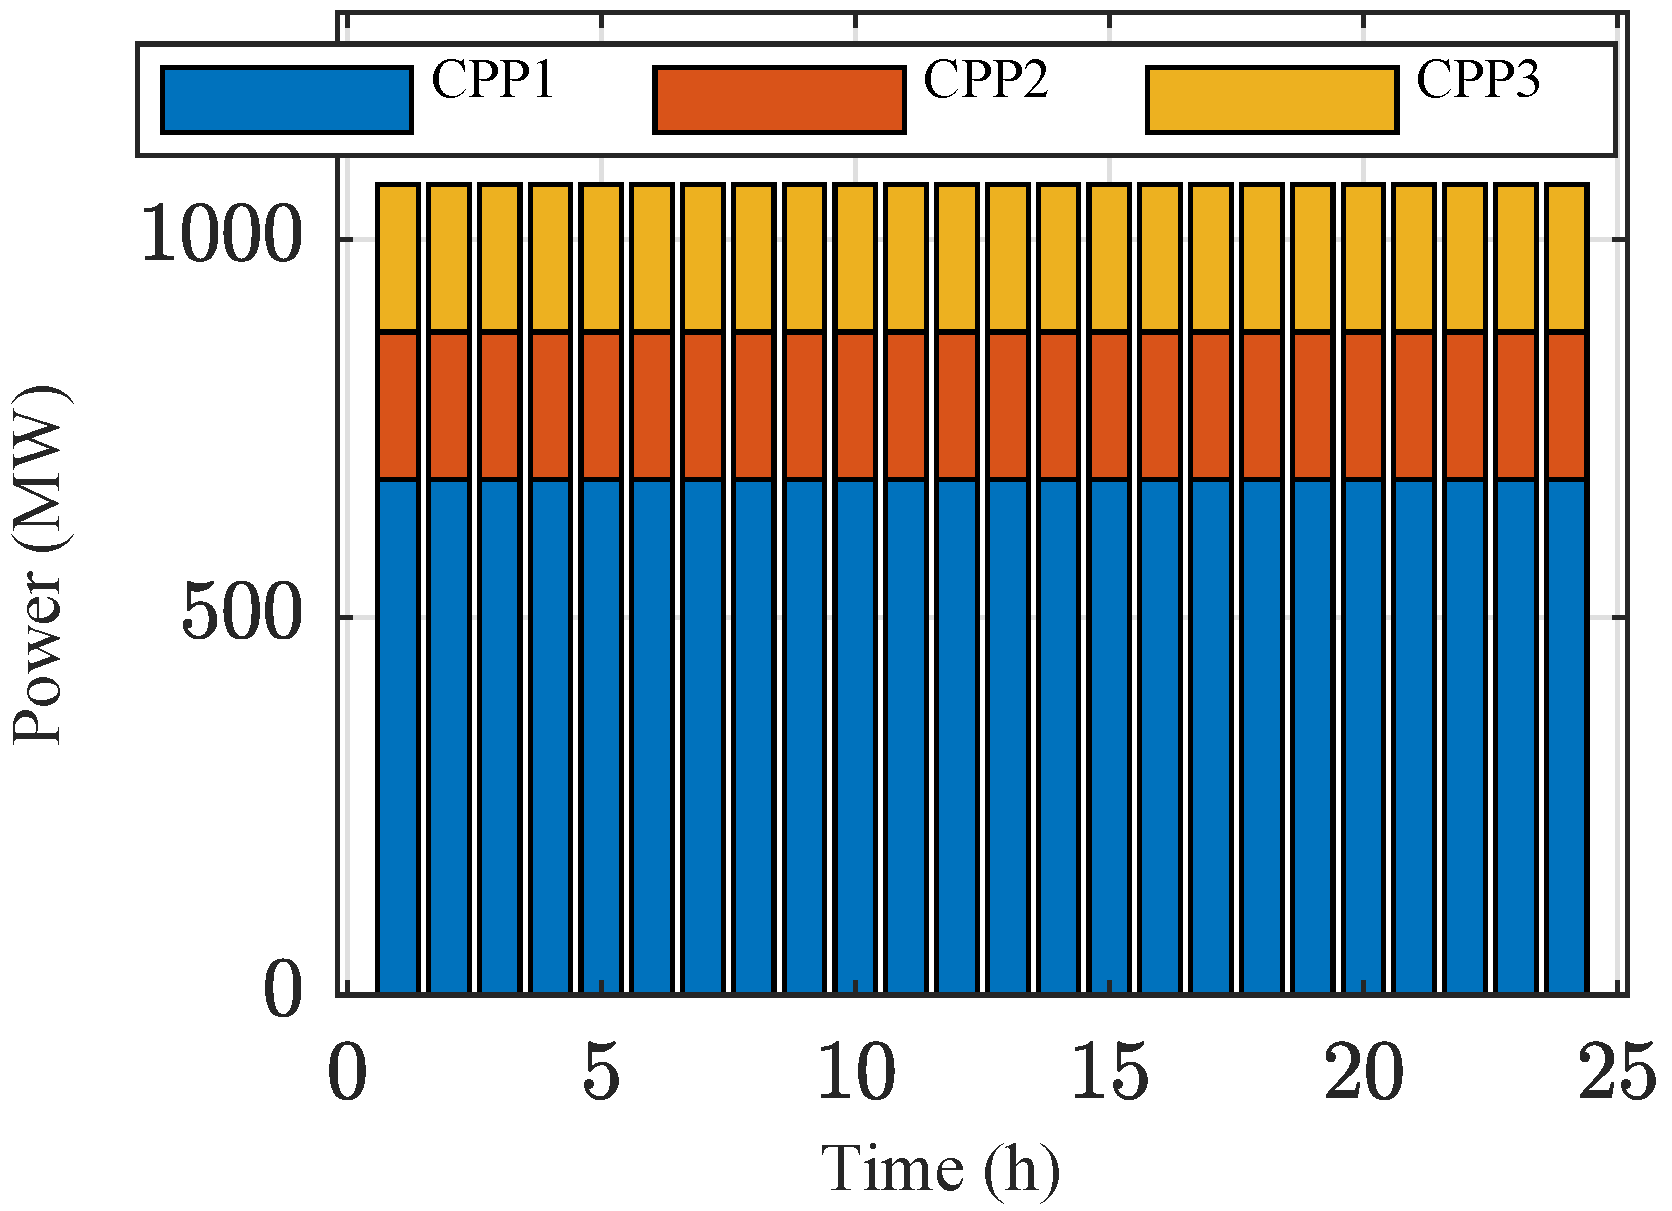
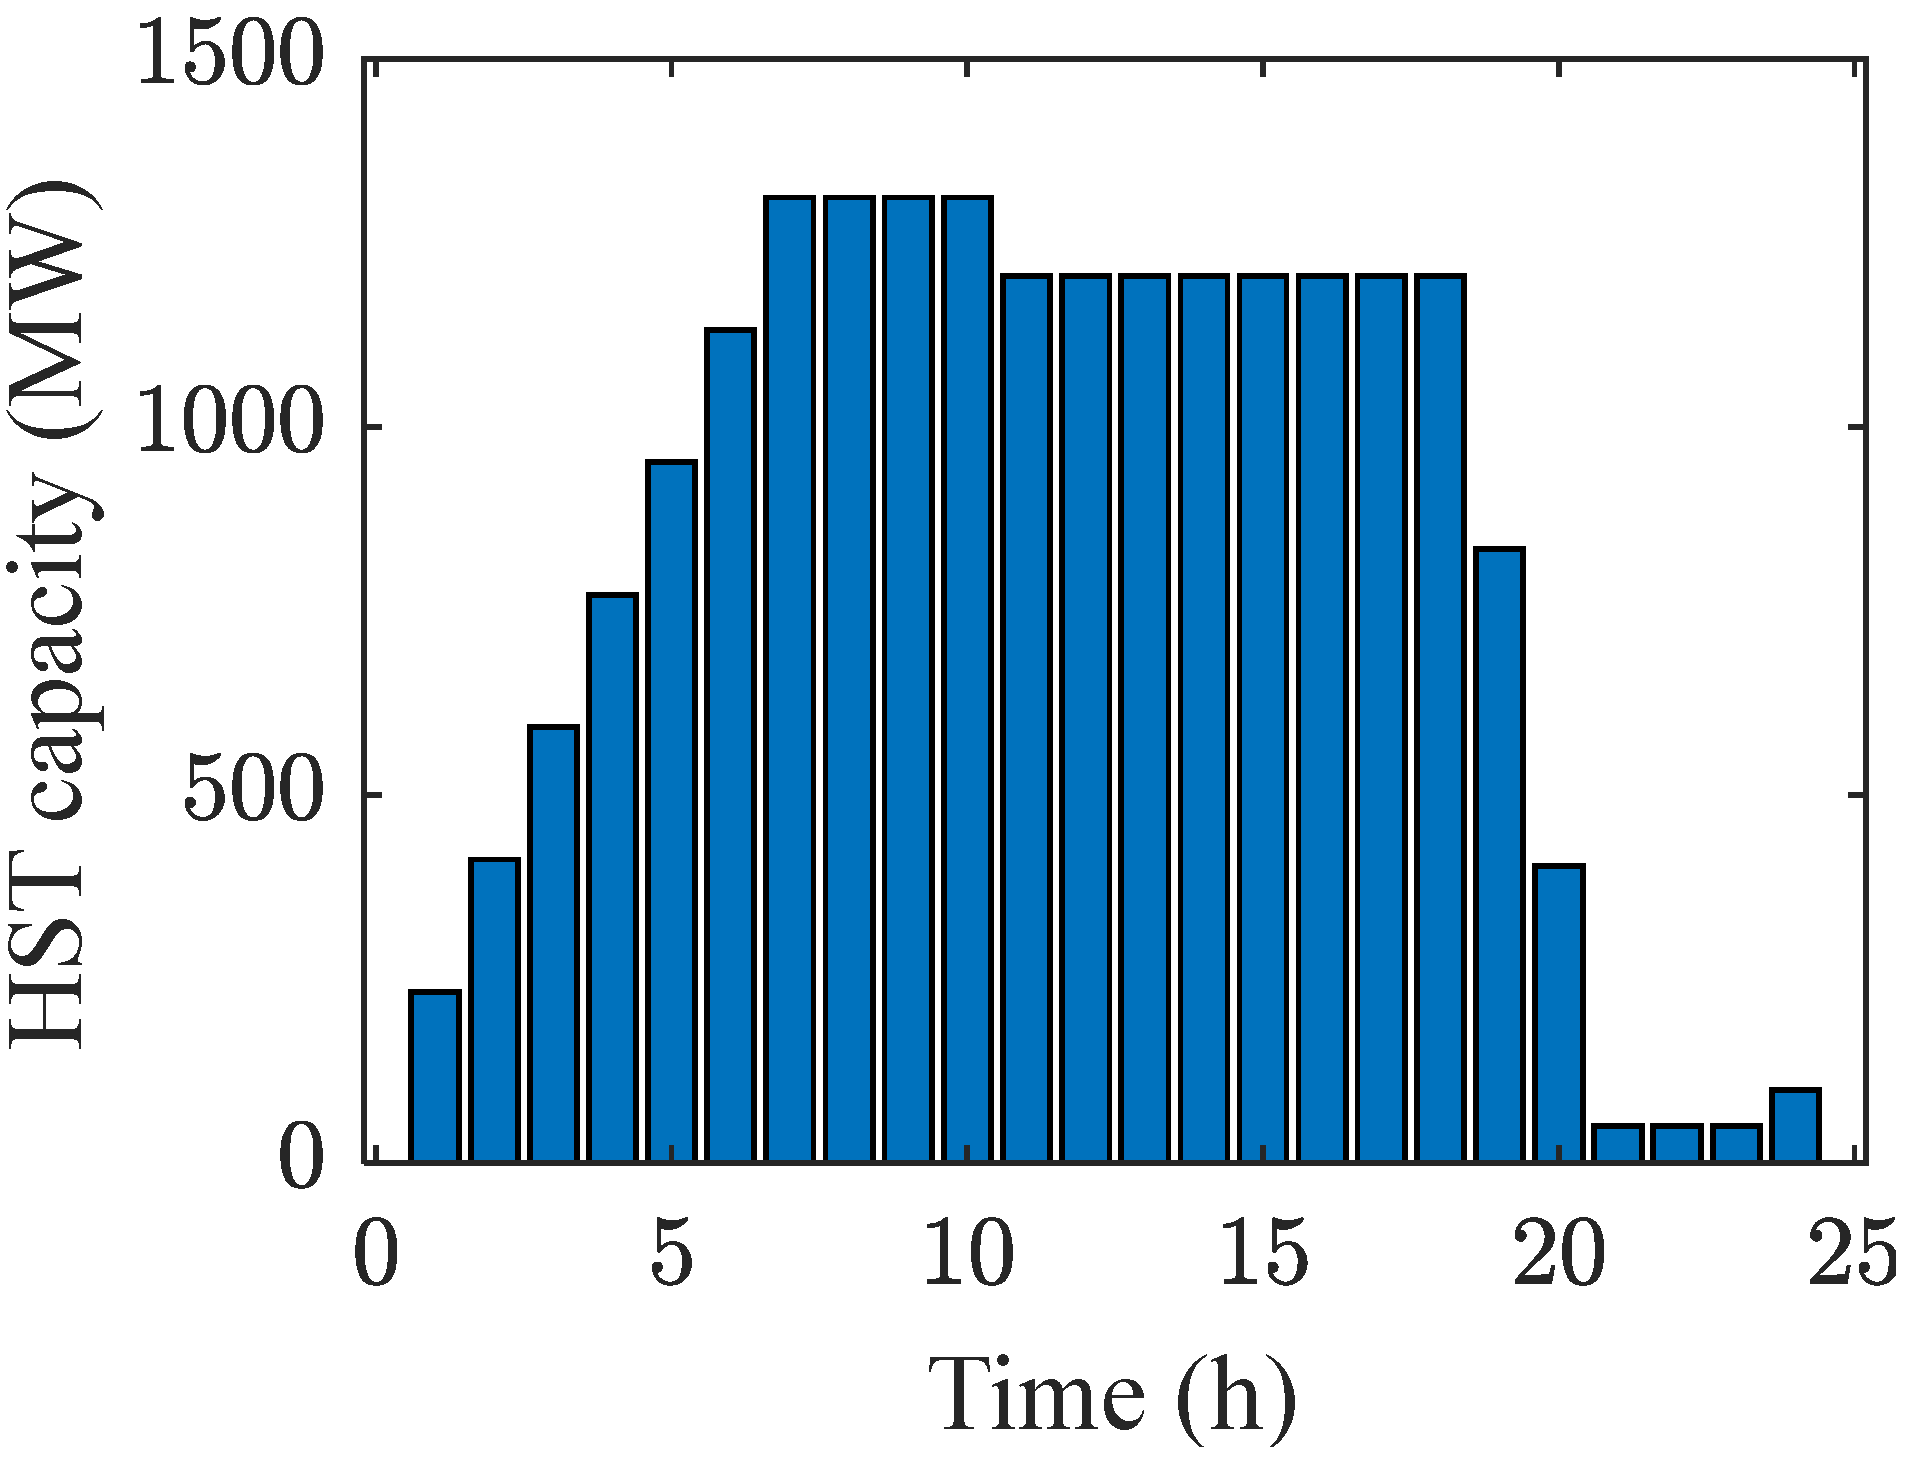
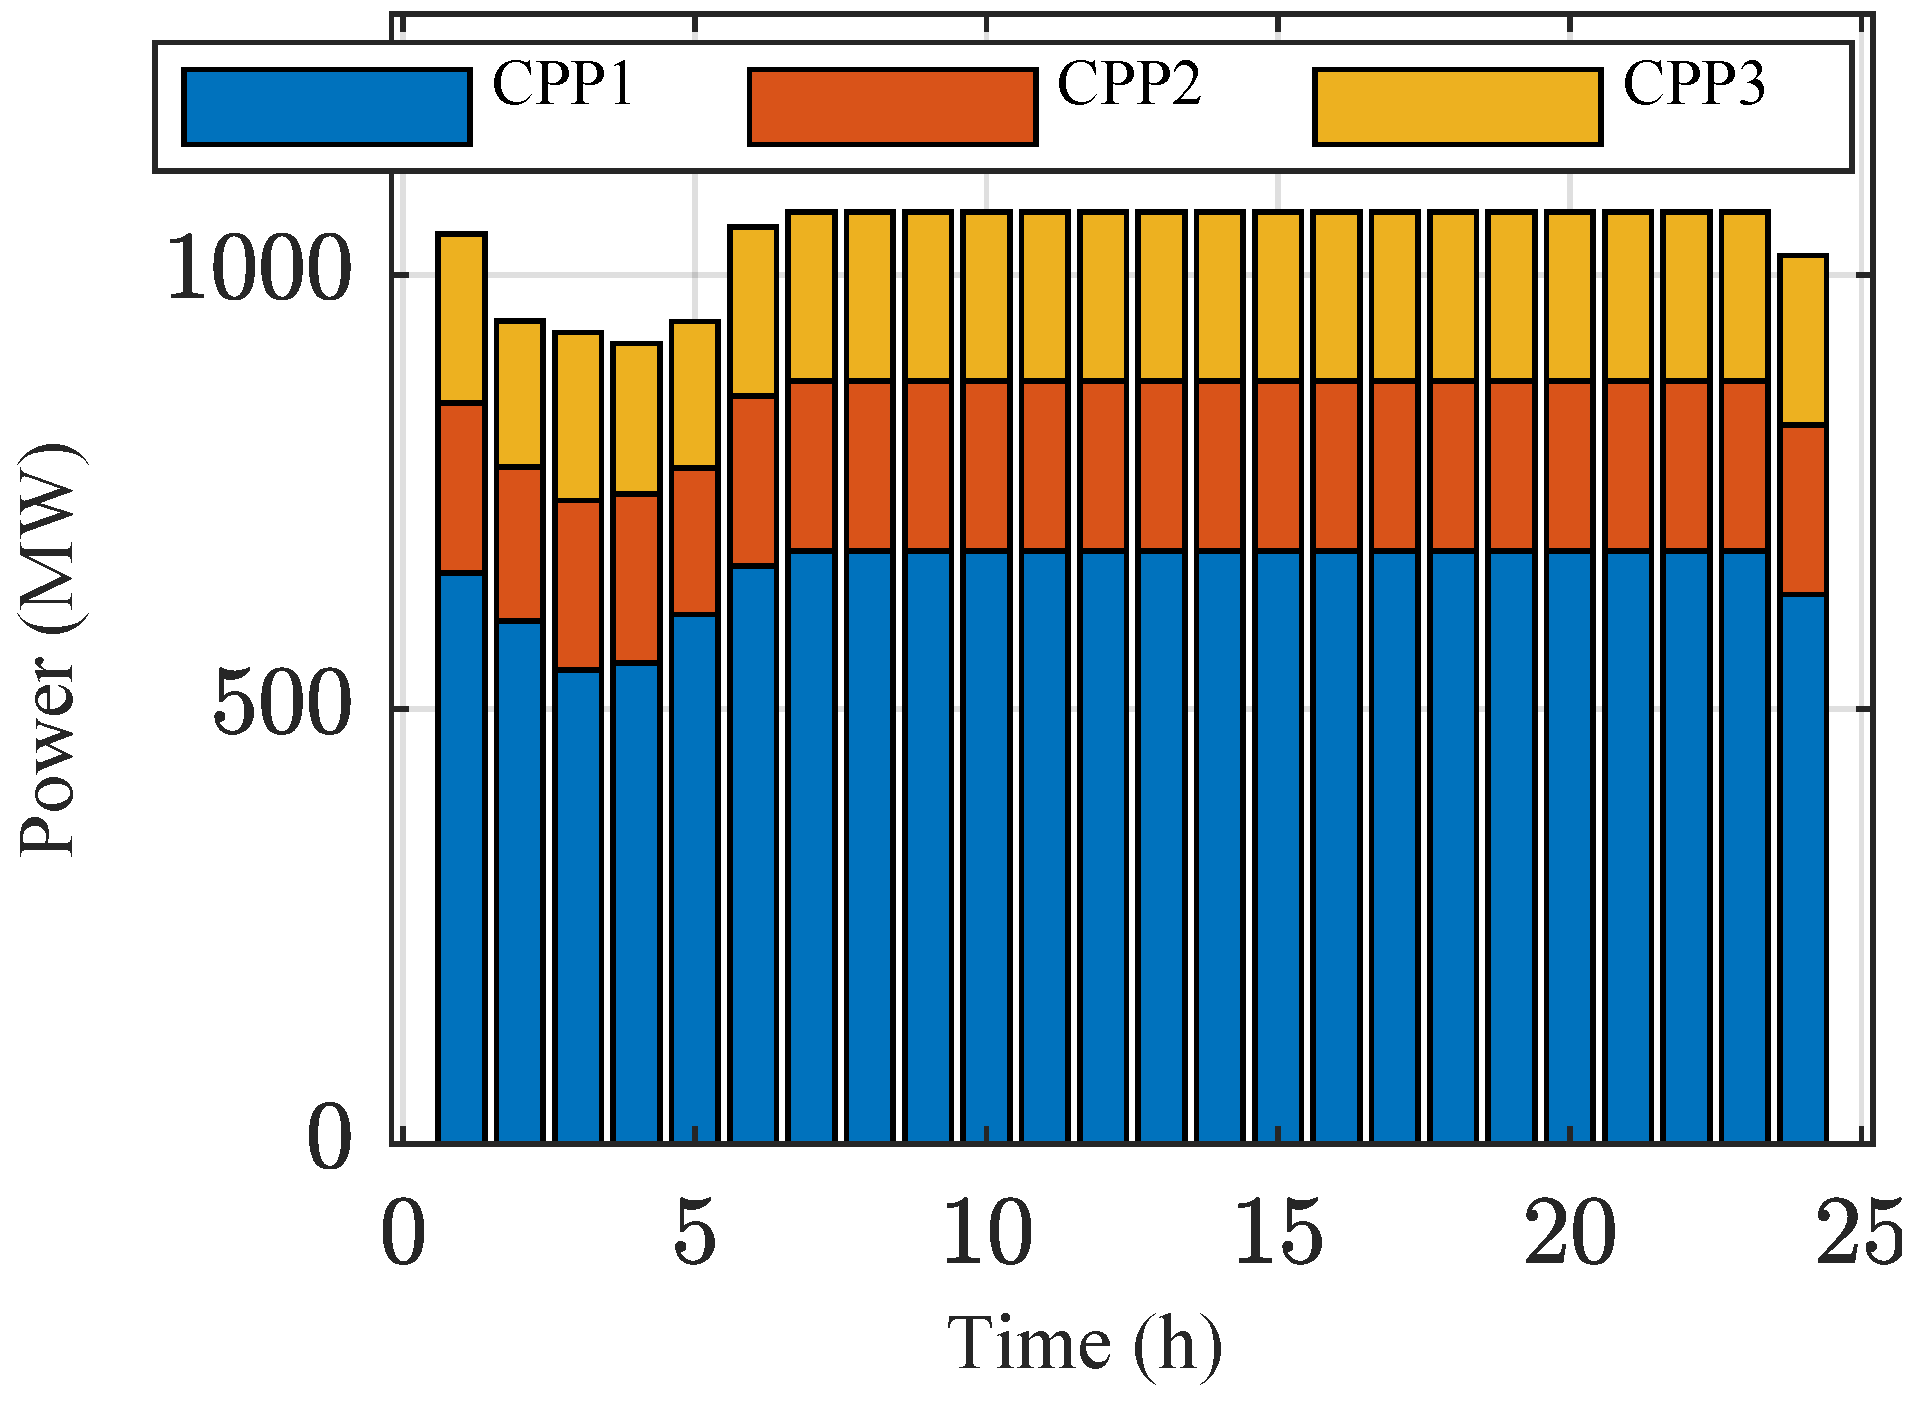
The trend of hydrogen energy in the HST is shown in Figure 7. The hydrogen in the HST increases continuously during the period of 24:00–5:00, indicating that the system is producing hydrogen through the electrolyzer. The hydrogen decreases during the period of 19:00–21:00, indicating that the HFC is converting hydrogen into electrical energy to maintain the electrical energy balance of the system. At other times, the hydrogen storage level remains constant because electrical energy is plentiful during these times. At this time, as shown in Figure 8, all three CPP units are running at full load. This is because the system pays more attention to economic efficiency, and the cost of power generation by CPP units is much lower than the cost of purchasing hydrogen. It is estimated that the CPP units have generated a total of 25,740 MW of electricity. However, the long-term operation of CPP units will also lead to an increase in carbon emissions.
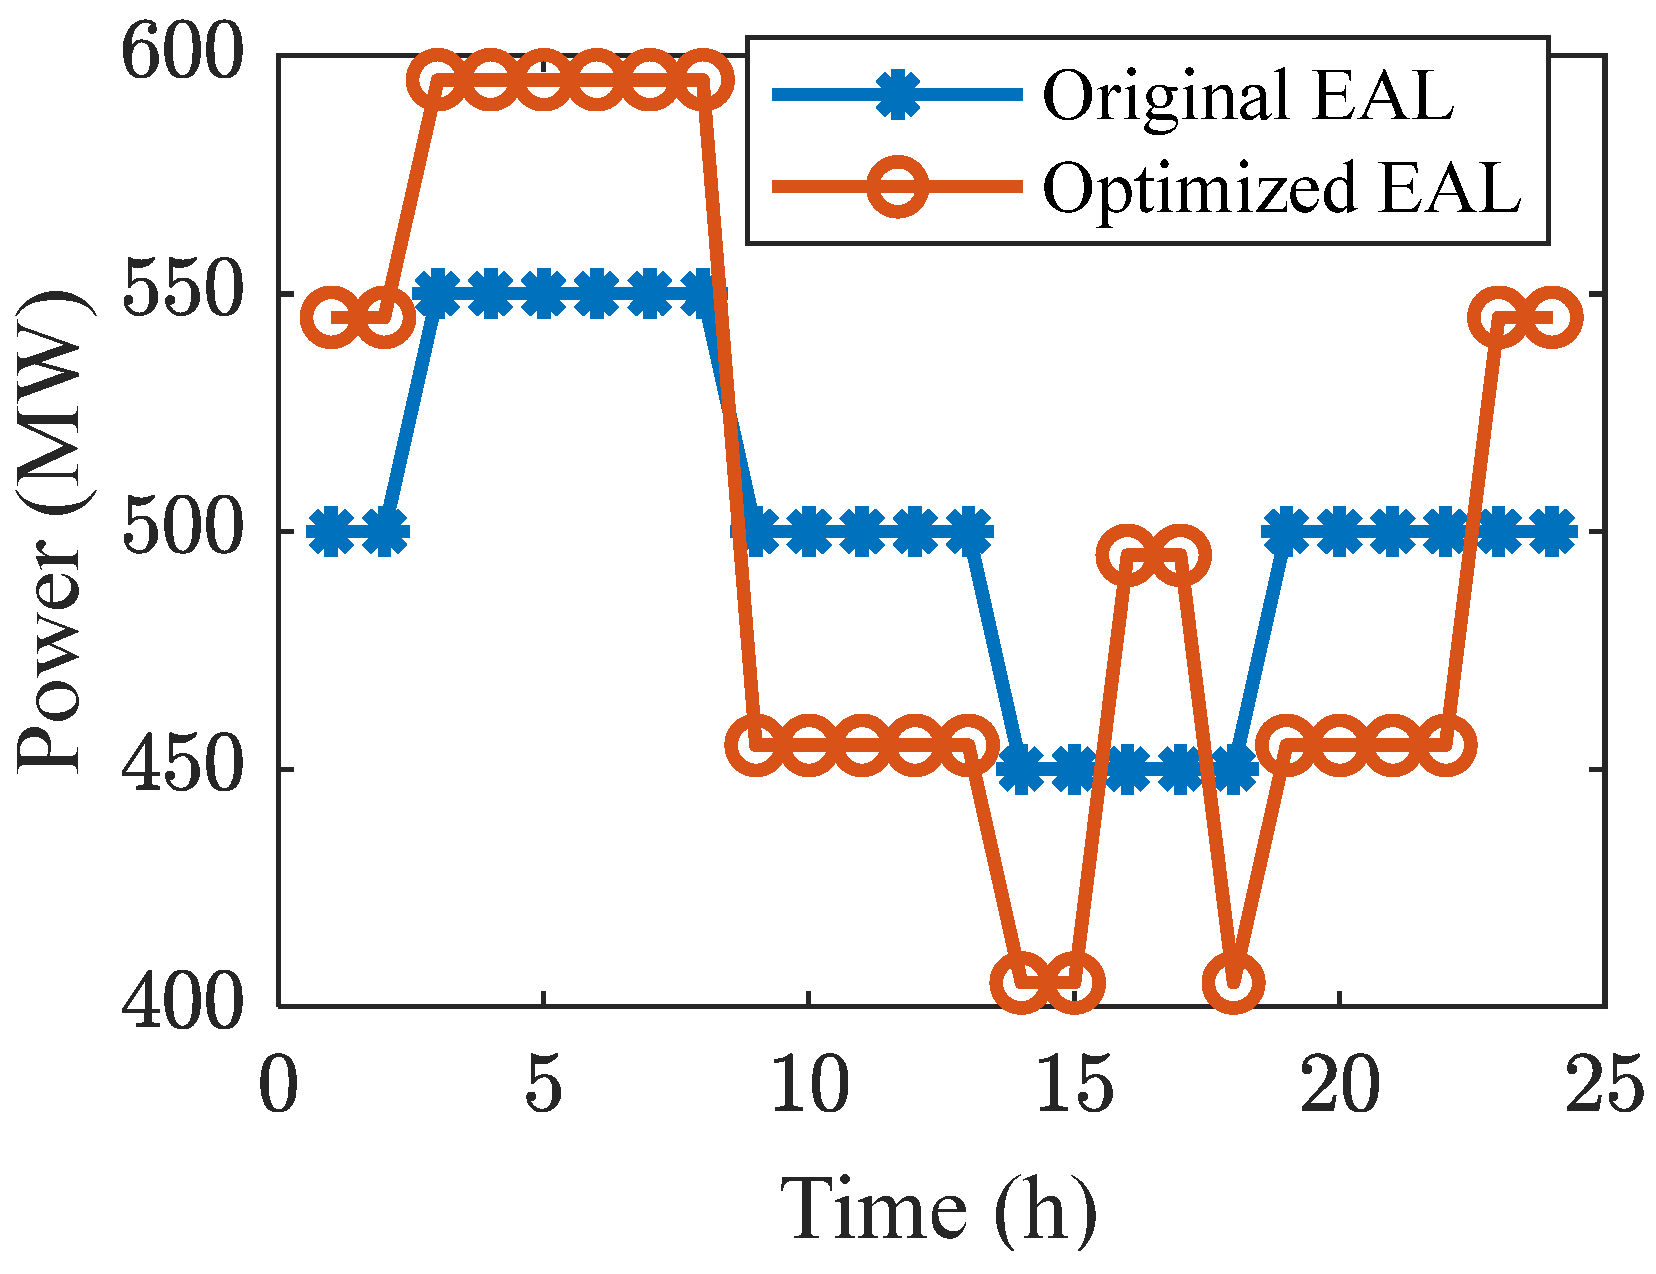
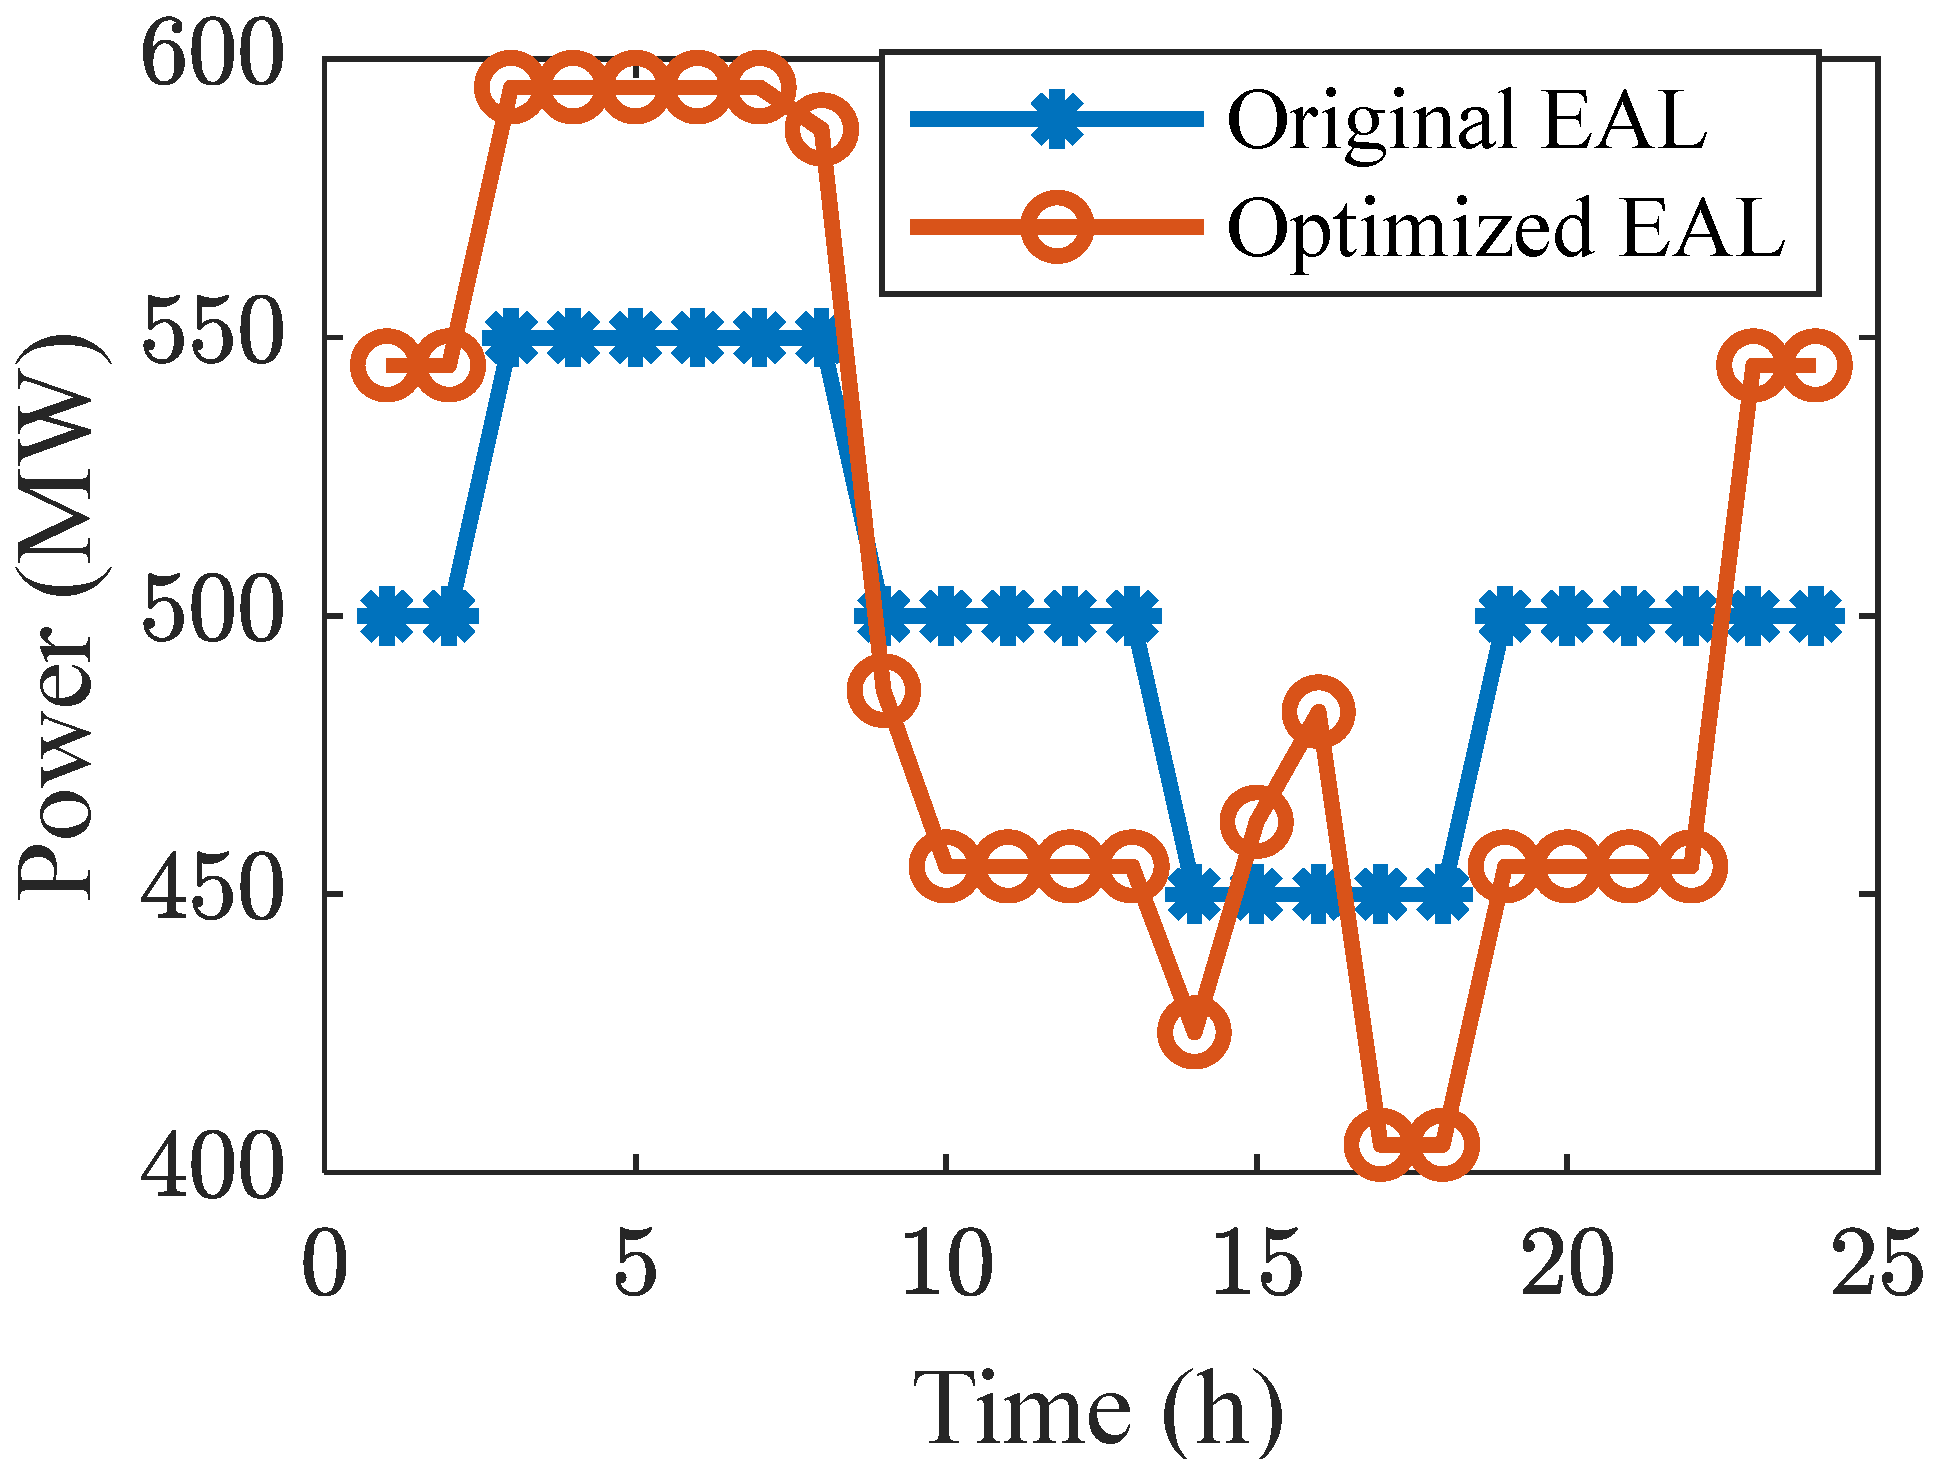
The electrolytic aluminum benchmark load and the actual ELA after scheduling are shown in Figure 9. As shown in Figure 9, the ELA distribution is relatively uniform before scheduling, and the fluctuation of the electrolytic aluminum load distribution in each period is relatively small. After scheduling, the fluctuation of the ELA distribution in each period becomes larger. In the three time periods of 1:00–9:00, 16:00–18:00, and 22:00–24:00, the electrolytic aluminum load after scheduling is greater than that before scheduling. In the other periods, the electrolytic aluminum load after scheduling is less than that before scheduling. By flexibly adjusting the distribution of electrolytic aluminum load during the entire scheduling period, the power distribution of the entire system can be effectively adapted, thereby reducing the operating cost of the entire system.

4.2.2. Analysis of Case 2 Results

The weights of operating cost and total carbon emissions in the objective function are modified to 0.2 so that the system focuses more on reducing the total carbon emissions. At this time, the power scheduling results of each piece of equipment in the integrated energy system are shown in Figure 10.
As shown in Figure 10, when the objective function focuses more on reducing the total carbon emissions of the system, the time that the IES uses HFC increases significantly. The time period for HFC power generation has increased by 7 h, from 14:00–15:00 and 24:00–5:00 to 8:00–23:00. The power generation of HFC has increased from 1184.2 MW to 3685.8 MW. At the same time, the output power of CPP units and the amount of electricity purchased by the system from the large power grid have both decreased. This is because the carbon emissions generated by thermal power generation are significantly greater than those of HFC. Therefore, by changing the weight of the objective function, it is possible to flexibly adapt to the optimization needs in different scenarios.
The hydrogen energy scheduling results of each device in the system are shown in Figure 11 and Figure 12. During the entire scheduling cycle, the system maintains the state of purchasing hydrogen from the outside. The hydrogen electrolyzer is always closed ( H g a s = 0 ) to reduce thermal power generation and carbon emissions. Between 24:00 and 7:00, the system stores the hydrogen purchased from the outside in the HST. In the period of 8:00–23:00, the HFC remains operational. In the two time periods of 11:00 and 19:00–21:00, the HST also releases the previously stored hydrogen. According to calculations, the system purchased a total of 4062 MW of hydrogen from the outside, an increase of 3066.59 MW compared to Case 1. This is because purchasing hydrogen is more helpful in reducing carbon emissions than using CPP units. The output changes of the three CPP units are shown in Figure 13. Due to the increase in HP, the output of the CPP units is significantly lower than before. It is calculated that the CPP units generated a total of 25,104 MW of electricity, a decrease of 636 MW. Due to the reduction in the output of the CPP units, the total carbon emissions of the system will also be reduced accordingly. However, since the cost of purchasing hydrogen is greater than that of coal, the system will increase operating costs while reducing carbon emissions.
The benchmark load of electrolytic aluminum and the actual EAL after scheduling are shown in Figure 14. By flexibly adjusting the distribution of electrolytic aluminum load during the entire scheduling period, it is possible to better adapt to the changes in electricity and hydrogen energy in the system.
Case 1 and Case 2 reflect the impact of the changes in the importance of different demands on the optimization results. The various costs of the IES under different objective functions are shown in Table 2.
As can be seen from Table 2, when the optimization goal of the integrated energy system focuses on operating costs, the system’s operating costs are reduced by 18.89%. Under Case 1, the cost of thermal power generation and the cost of purchasing electricity from the large power grid of the IES are significantly greater than the relevant costs under Case 2. However, in this case, the cost of PH from the outside, the maintenance cost of hydrogen-containing equipment, and the income from selling electricity are significantly reduced. When the system dispatch goal focuses on reducing the total amount of carbon emissions, the carbon emissions are reduced by 11.90%. Currently, the system’s dispatch plan involves a significant increase in hydrogen power generation, a reduction in CPP unit output, and the purchase of electricity from the large power grid. The output of electricity through these two methods is the main reason for the increase in carbon emissions in the system. However, the cost of hydrogen power generation is generally higher than the above two methods, which will inevitably increase the operating costs of the system. It is worth noting that in both cases, the WPP and PV have fully released their output, so there is no wind and light abandonment in the system. In summary, the designed dispatch model can adjust the strategy according to the needs of different scenarios to achieve more flexible operation optimization.

4.2.3. Optimization Effect of EAL

To verify the necessity of optimizing the EAL, two sets of experiments were set up, namely Case 3 and Case 4. Case 3 and Case 1 use the same objective function ( c = 0.8 ), but Case 3 does not optimize the EAL. The optimization results of Case 3 and Case 1 are shown in Table 3.
It can be seen from Table 3 that when the system does not optimize the EAL curve, the system’s operating cost will increase by 7.62%. The carbon emissions emitted by the system will decrease by about 0.33%, which is negligible compared to the increase in operating costs. The above situation is calculated when the system focuses on reducing operating costs. Then, Case 4 and Case 2 use the same objective function ( c = 0.2 ), but Case 4 does not optimize the EAL. The comparison results are shown in Table 4.
It can be seen from Table 4 that when the system does not optimize the EAL curve and focuses on reducing the total carbon emissions of the system, the system operating cost will increase by 6.42%. At the same time, the total carbon emissions emitted by the system do not change significantly. From Table 3 and Table 4, it can be concluded that optimizing the EAL curve plays a very important role in reducing the system operating cost, but the impact on the total carbon emissions of the system is relatively limited.

4.2.4. Sensitivity Analysis

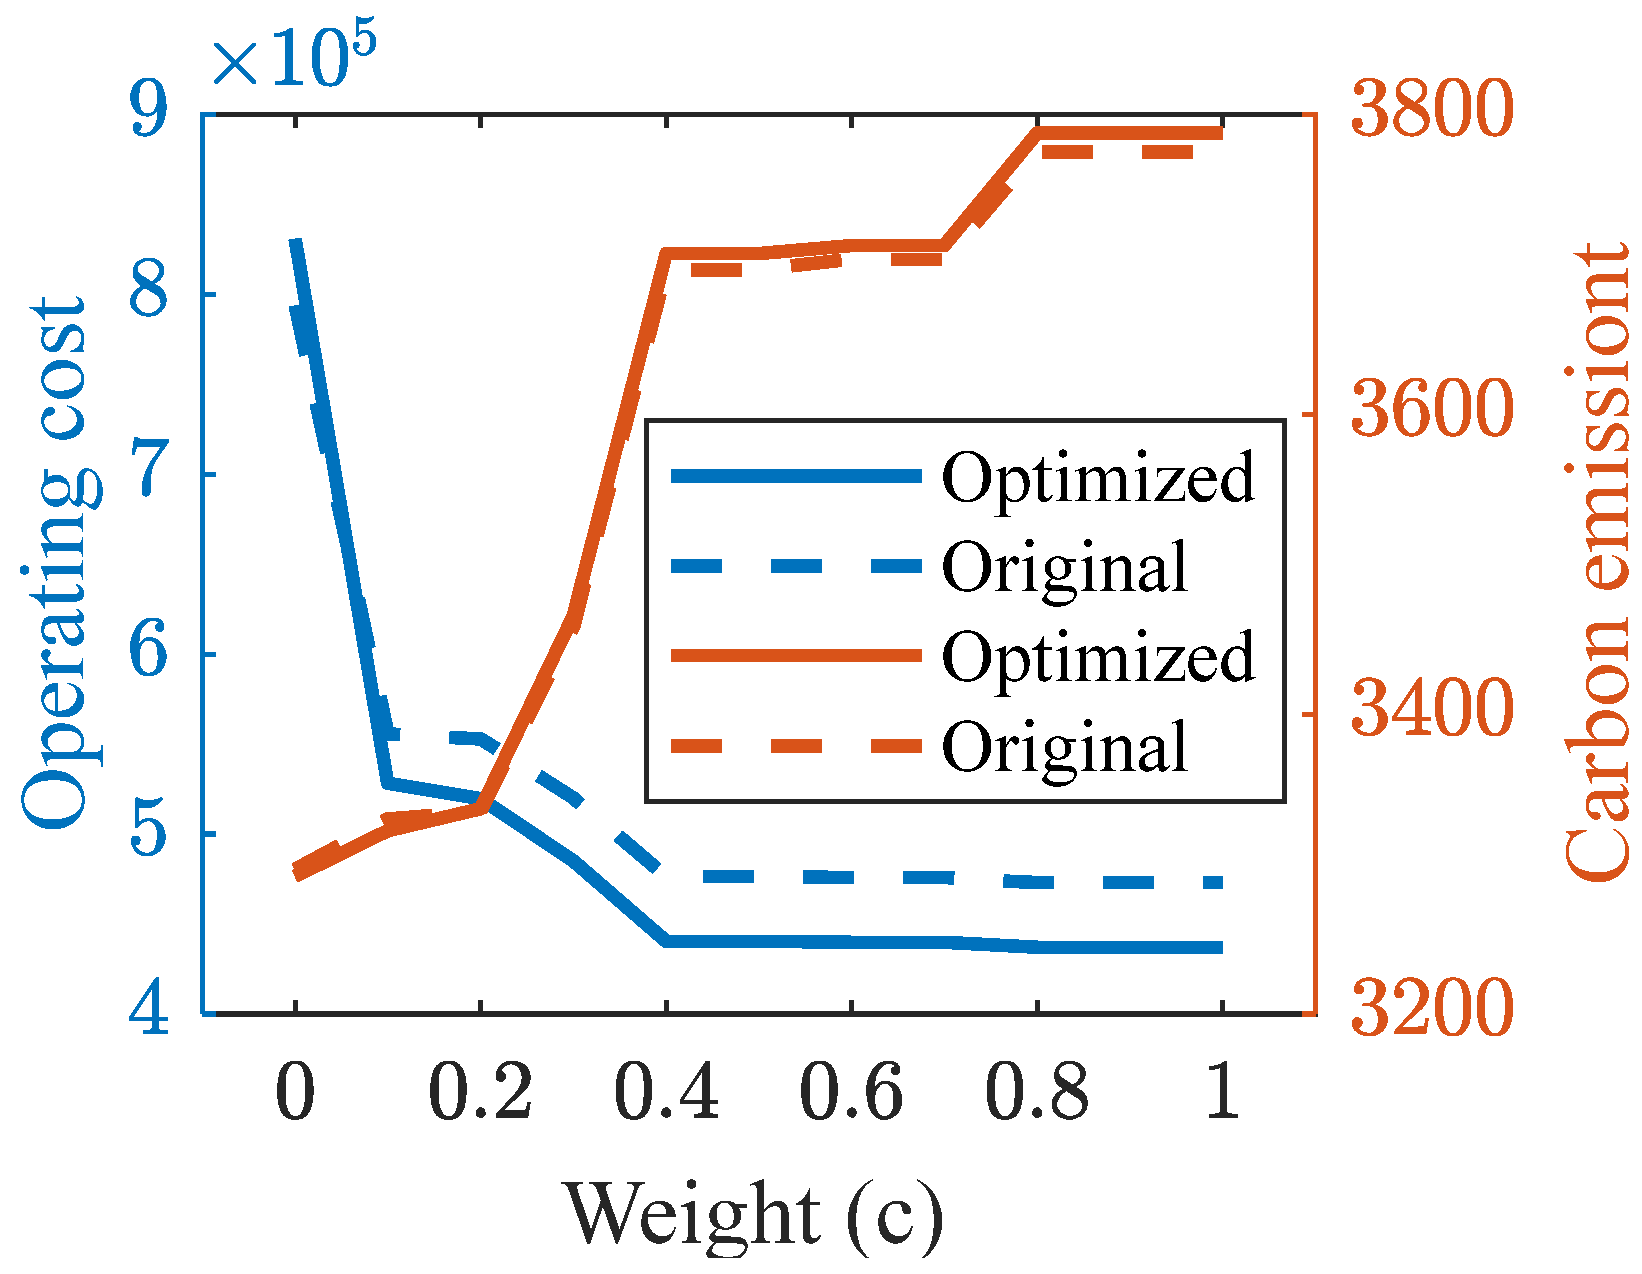
To more clearly demonstrate the role of the proposed penalty cost function, this section analyzes the sensitivity of the weights ( c ). The weights gradually increased from 0 to 1 with an interval of 0.1, and the costs and carbon emissions before and after optimization are compared under different weights. The results are shown in Figure 15.
First, by adjusting the weights, carbon emissions and costs can be significantly changed, with the impact on costs exceeding 90% and the impact on carbon emissions exceeding 15%. When c = 0.2 , carbon emissions decrease by 11.61% and operating costs drop by 34.53% versus their peak values. Under different c , EAL optimization can effectively reduce the cost of the IES, with a maximum reduction of 7.62%. However, the impact on carbon emissions is not obvious, which is consistent with the conclusions in Section 4.2.3. By introducing the cost function with a penalty, more flexible optimization can be achieved to meet the different requirements of the IES.

5. Conclusions

Reducing carbon emissions in industrial parks is the key to achieving a green economy. As a typical high-energy consumption industry, electrolytic aluminum plays an important role in the world economy. The International Aluminium Institute called on the global aluminum industry to sign a carbon reduction agreement and increase research on related technologies. However, the current development of optimization methods for electrolytic aluminum load in the integrated energy system is insufficient. The hydrogen production industry can effectively improve the absorption and overall economic performance of the entire industrial park for new energy. Therefore, it is very meaningful to integrate the hydrogen production industry and the electrolytic aluminum load into an energy system, further improving the economy of the entire system and reducing carbon emissions through optimized scheduling. This paper proposes a multi-objective flexible optimization method for the above problems. The main conclusions are as follows:
(1)
This paper establishes an optimization scheduling model for an IES containing an electrolytic aluminum load, which comprehensively considers reducing the total carbon emissions of the system and the operating cost of the system. By introducing the whole industrial chain, including hydrogen electrolysis, storage, and utilization, the scheduling model can effectively reduce the carbon emissions generated by thermal power generation and electricity purchase from the large power grid.
(2)
The optimization method of the electrolytic aluminum load curve proposed can effectively reduce the operating costs of the system. The optimized electrolytic aluminum load can reduce the total operating cost by 7.62% at most, while the optimization result has little effect on carbon emissions.
(3)
The proposed objective function with penalty terms can flexibly adjust the total carbon emissions and operating costs according to actual conditions. Under an appropriate weight, carbon emissions decrease by 11.61% and operating costs drop by 34.53% versus their peak values. The changes in the weights of cost and carbon emissions show opposite trends, mainly because the cost of purchasing hydrogen is much greater than the cost of generating electricity from thermal power units.
The limitations of this study lie in the insufficient consideration of the electrolytic aluminum system, overlooking the impacts of waste heat recovery, cooling, and variable operating conditions. Additionally, the stringent operational and storage requirements of the hydrogen production system were also not accounted for in the optimization process. Nevertheless, the optimization results still provide valuable guidance for the construction and planning of such industrial parks. In our future work, we will consider more practical scenarios, including market dynamics, regulatory frameworks, and uncertainties in hydrogen supply.

Author Contributions

Methodology, J.W.; Software, W.L.; Validation, B.H.; Formal analysis, J.W.; Investigation, G.L.; Data curation, B.C.; Writing—original draft, J.W., W.L. and Z.C.; Writing—review & editing, Q.Z. and Y.C. All authors have read and agreed to the published version of the manuscript.

Funding

This research received no external funding.

Data Availability Statement

The original contributions presented in this study are included in the article. Further inquiries can be directed to the corresponding author.

Conflicts of Interest

Author Jinkun Wang, Wei Liu, Baohua He, Zhendong Cao, Gang Liu, Bin Chuan were employed by the company Inner Mongolia Huomei Hongjun Aluminum and Electricity Co., Ltd. Author Qiang Zhang was employed by the company Shanghai Power Equipment Research Institute Co., Ltd. The remaining authors declare that the research was conducted in the absence of any commercial or financial relationships that could be construed as a potential conflict of interest.

References

  1. Rowaihy, F.; Hamieh, A.; Odeh, N.; Hejazi, M.; Al-Juaied, M.; Afifi, A.M.; Hoteit, H. Decarbonizing Saudi Arabia energy and industrial sectors: Assessment of carbon capture cost. Carbon Capture Sci. Technol. 2025, 14, 100375. [Google Scholar] [CrossRef]
  2. Lima, R.G.A.; Calili, R.F.; Almeida, M.F.L.; Silva, F.L.; Santos, S.; Velásquez, R. Estimating the potential for thermal energy efficiency in the industrial sector: A hybrid model integrating exergy analysis and long-term technology diffusion scenarios. Energy 2024, 313, 133824. [Google Scholar] [CrossRef]
  3. Li, Q.; Wei, F.C.; Zhou, Y.C.; Li, J.J.; Zhou, G.W.; Wang, Z.H.; Liu, J.F.; Yan, P.G.; Yu, D.R. A scheduling framework for VPP considering multiple uncertainties and flexible resources. Energy 2023, 282, 20. [Google Scholar] [CrossRef]
  4. Zhou, G.; Bai, M.; Li, H.; Li, J.; Li, Q.; Liu, J.; Yu, D. Multi-objective station-network synergy planning for regional integrated energy system considering energy cascade utilization and uncertainty. Energy Convers. Manag. 2024, 301, 118073. [Google Scholar] [CrossRef]
  5. Alizad, E.; Hasanzad, F.; Rastegar, H. A tri-level hybrid stochastic-IGDT dynamic planning model for resilience enhancement of community-integrated energy systems. Sustain. Cities Soc. 2024, 117, 105948. [Google Scholar] [CrossRef]
  6. Li, S.; Li, Z. Coordinating and valuing the flexibility resources in a rural integrated energy system by considering correlated source-load uncertainty. Renew. Energy 2024, 237, 121576. [Google Scholar] [CrossRef]
  7. Duan, J.; Tian, Q.; Liu, F.; Xia, Y.; Gao, Q. Optimal scheduling strategy with integrated demand response based on stepped incentive mechanism for integrated electricity-gas energy system. Energy 2024, 313, 133689. [Google Scholar] [CrossRef]
  8. Li, Q.; Zhou, Y.; Wei, F.; Long, Z.; Li, J.; Ma, Y.; Zhou, G.; Liu, J.; Yan, P.; Yu, D. Harmonizing comfort and energy: A multi-objective framework for central air conditioning systems. Energy Convers. Manag. 2024, 314, 118651. [Google Scholar] [CrossRef]
  9. Lin, H.; Yan, Q.; Li, X.; Dang, J.; Yang, S.; Gejirifu, D.; Yao, L.; Wang, Y. Multi-energy coordinated and flexible operation optimization and revenue reallocation models for integrated micro energy system considering seasonal and daily load characteristics of different buildings. Energy Rep. 2022, 8, 12583–12597. [Google Scholar] [CrossRef]
  10. Kahraman, U.; Dincer, I. Development of a waste tires-based integrated energy system for multiple useful outputs in sustainable communities. Energy Convers. Manag. 2022, 271, 116305. [Google Scholar] [CrossRef]
  11. Zhu, X.; Yang, J.; Pan, X.; Li, G.; Rao, Y. Regional integrated energy system energy management in an industrial park considering energy stepped utilization. Energy 2020, 201, 117589. [Google Scholar] [CrossRef]
  12. Liu, S.; Ding, G.; Gu, R.; Hao, J.; Liu, P.; Qin, W.; Yu, Y.; Han, Y.; Huang, J.; He, W. Co-capture and recovery of ammonia and CO2 driven by microbial electrolysis system coupling with mineral carbon sequestration by industrial wastes. Resour. Conserv. Recycl. 2025, 212, 107931. [Google Scholar] [CrossRef]
  13. Yao, L.; He, T.; Luo, H. Piggybacking on past problem for faster optimization in aluminum electrolysis process design. Eng. Appl. Artif. Intell. 2023, 126, 106937. [Google Scholar] [CrossRef]
  14. Sun, M.; Li, B.; Liu, Z. Experimental and numerical analysis on electrolytic bubble group dynamics in the aluminum electrolysis process using the slotted anode. Powder Technol. 2023, 428, 118854. [Google Scholar] [CrossRef]
  15. Han, Z.; Li, Z.; Wang, W.; Liu, W.; Ma, Q.; Sun, S.; Liu, H.; Zhang, Q.; Cao, Y. Multi-Time Optimization Scheduling Strategy for Integrated Energy Systems Considering Multiple Controllable Loads and Carbon Capture Plants. Energies 2024, 17, 5995. [Google Scholar] [CrossRef]
  16. Wang, Y.; Qin, Y.; Ma, Z.; Wang, Y.; Li, Y. Operation optimisation of integrated energy systems based on cooperative game with hydrogen energy storage systems. Int. J. Hydrogen Energy 2023, 48, 37335–37354. [Google Scholar] [CrossRef]
  17. Li, Q.; Xiao, X.; Pu, Y.; Luo, S.; Liu, H.; Chen, W. Hierarchical optimal scheduling method for regional integrated energy systems considering electricity-hydrogen shared energy. Appl. Energy 2023, 349, 121670. [Google Scholar] [CrossRef]
  18. Temiz, M.; Dincer, I. Solar and sodium fast reactor-based integrated energy system developed with thermal energy storage and hydrogen. Energy 2023, 284, 129275. [Google Scholar] [CrossRef]
  19. Dong, X.; Zhao, Y. An economic way to reduce emissions of industrial parks with hydrogen-based integrated energy systems. Int. J. Hydrogen Energy 2025, 106, 1122–1133. [Google Scholar] [CrossRef]
  20. Li, W.; Liu, W.; Lin, Y.; Liu, C.; Wang, X.; Xu, J. Optimal dispatching of integrated energy system with hydrogen-to-ammonia and ammonia-mixed/oxygen-enriched thermal power. Energy 2025, 316, 134514. [Google Scholar] [CrossRef]
  21. Zhang, Q.; Qi, J.; Zhen, L. Optimization of integrated energy system considering multi-energy collaboration in carbon-free hydrogen port. Transp. Res. Part E Logist. Transp. Rev. 2023, 180, 103351. [Google Scholar] [CrossRef]
  22. Shi, M.; Vasquez, J.C.; Guerrero, J.M.; Huang, Y. Smart communities—Design of integrated energy packages considering incentive integrated demand response and optimization of coupled electricity-gas-cooling-heat and hydrogen systems. Int. J. Hydrogen Energy 2023, 48, 31063–31077. [Google Scholar] [CrossRef]
  23. Wang, R.; Yang, L.; Wang, X.; Zhou, Y. Low carbon optimal operation of integrated energy system based on concentrating solar power plant and power to hydrogen. Alex. Eng. J. 2023, 71, 39–50. [Google Scholar] [CrossRef]
  24. Yue, X.; Liao, S.; Xu, J.; Ke, D.; Wang, H.; Yang, J.; He, X. Collaborative optimization of renewable energy power systems integrating electrolytic aluminum load regulation and thermal power deep peak shaving. Appl. Energy 2024, 373, 123869. [Google Scholar] [CrossRef]
  25. Abdelsamie, M.M.; Hassan Ali, M.I. Technoeconomic feasibility of integrating carbon capture technology with primary aluminum production using an advanced cogeneration waste heat recovery system. Chem. Eng. J. 2025, 519, 165078. [Google Scholar] [CrossRef]
  26. Brough, D.; Jouhara, H. The aluminium industry: A review on state-of-the-art technologies, environmental impacts and possibilities for waste heat recovery. Int. J. Thermofluids 2020, 1–2, 100007. [Google Scholar] [CrossRef]
  27. Wu, K.; Jiang, M.; Huang, Y.; Dai, Z.; Wang, X.; Duan, Z.; Wang, Y.; Li, G. Optimization of multi-objective capacity allocation and performance analysis for integrated energy systems considering hydrogen storage. Energy 2025, 325, 136160. [Google Scholar] [CrossRef]
  28. Li, S.; Zhang, T.; Niu, L.; Yue, Q. Analysis of the development scenarios and greenhouse gas (GHG) emissions in China’s aluminum industry till 2030. J. Clean. Prod. 2021, 290, 125859. [Google Scholar] [CrossRef]
  29. Fan, S.L.; Ai, Q.; He, X. Risk analysis on dispatch of virtual power plant based on chance constrained programming. Zhongguo Dianji Gongcheng Xuebao/Proc. Chin. Soc. Electr. Eng. 2015, 35, 4025–4034. [Google Scholar]
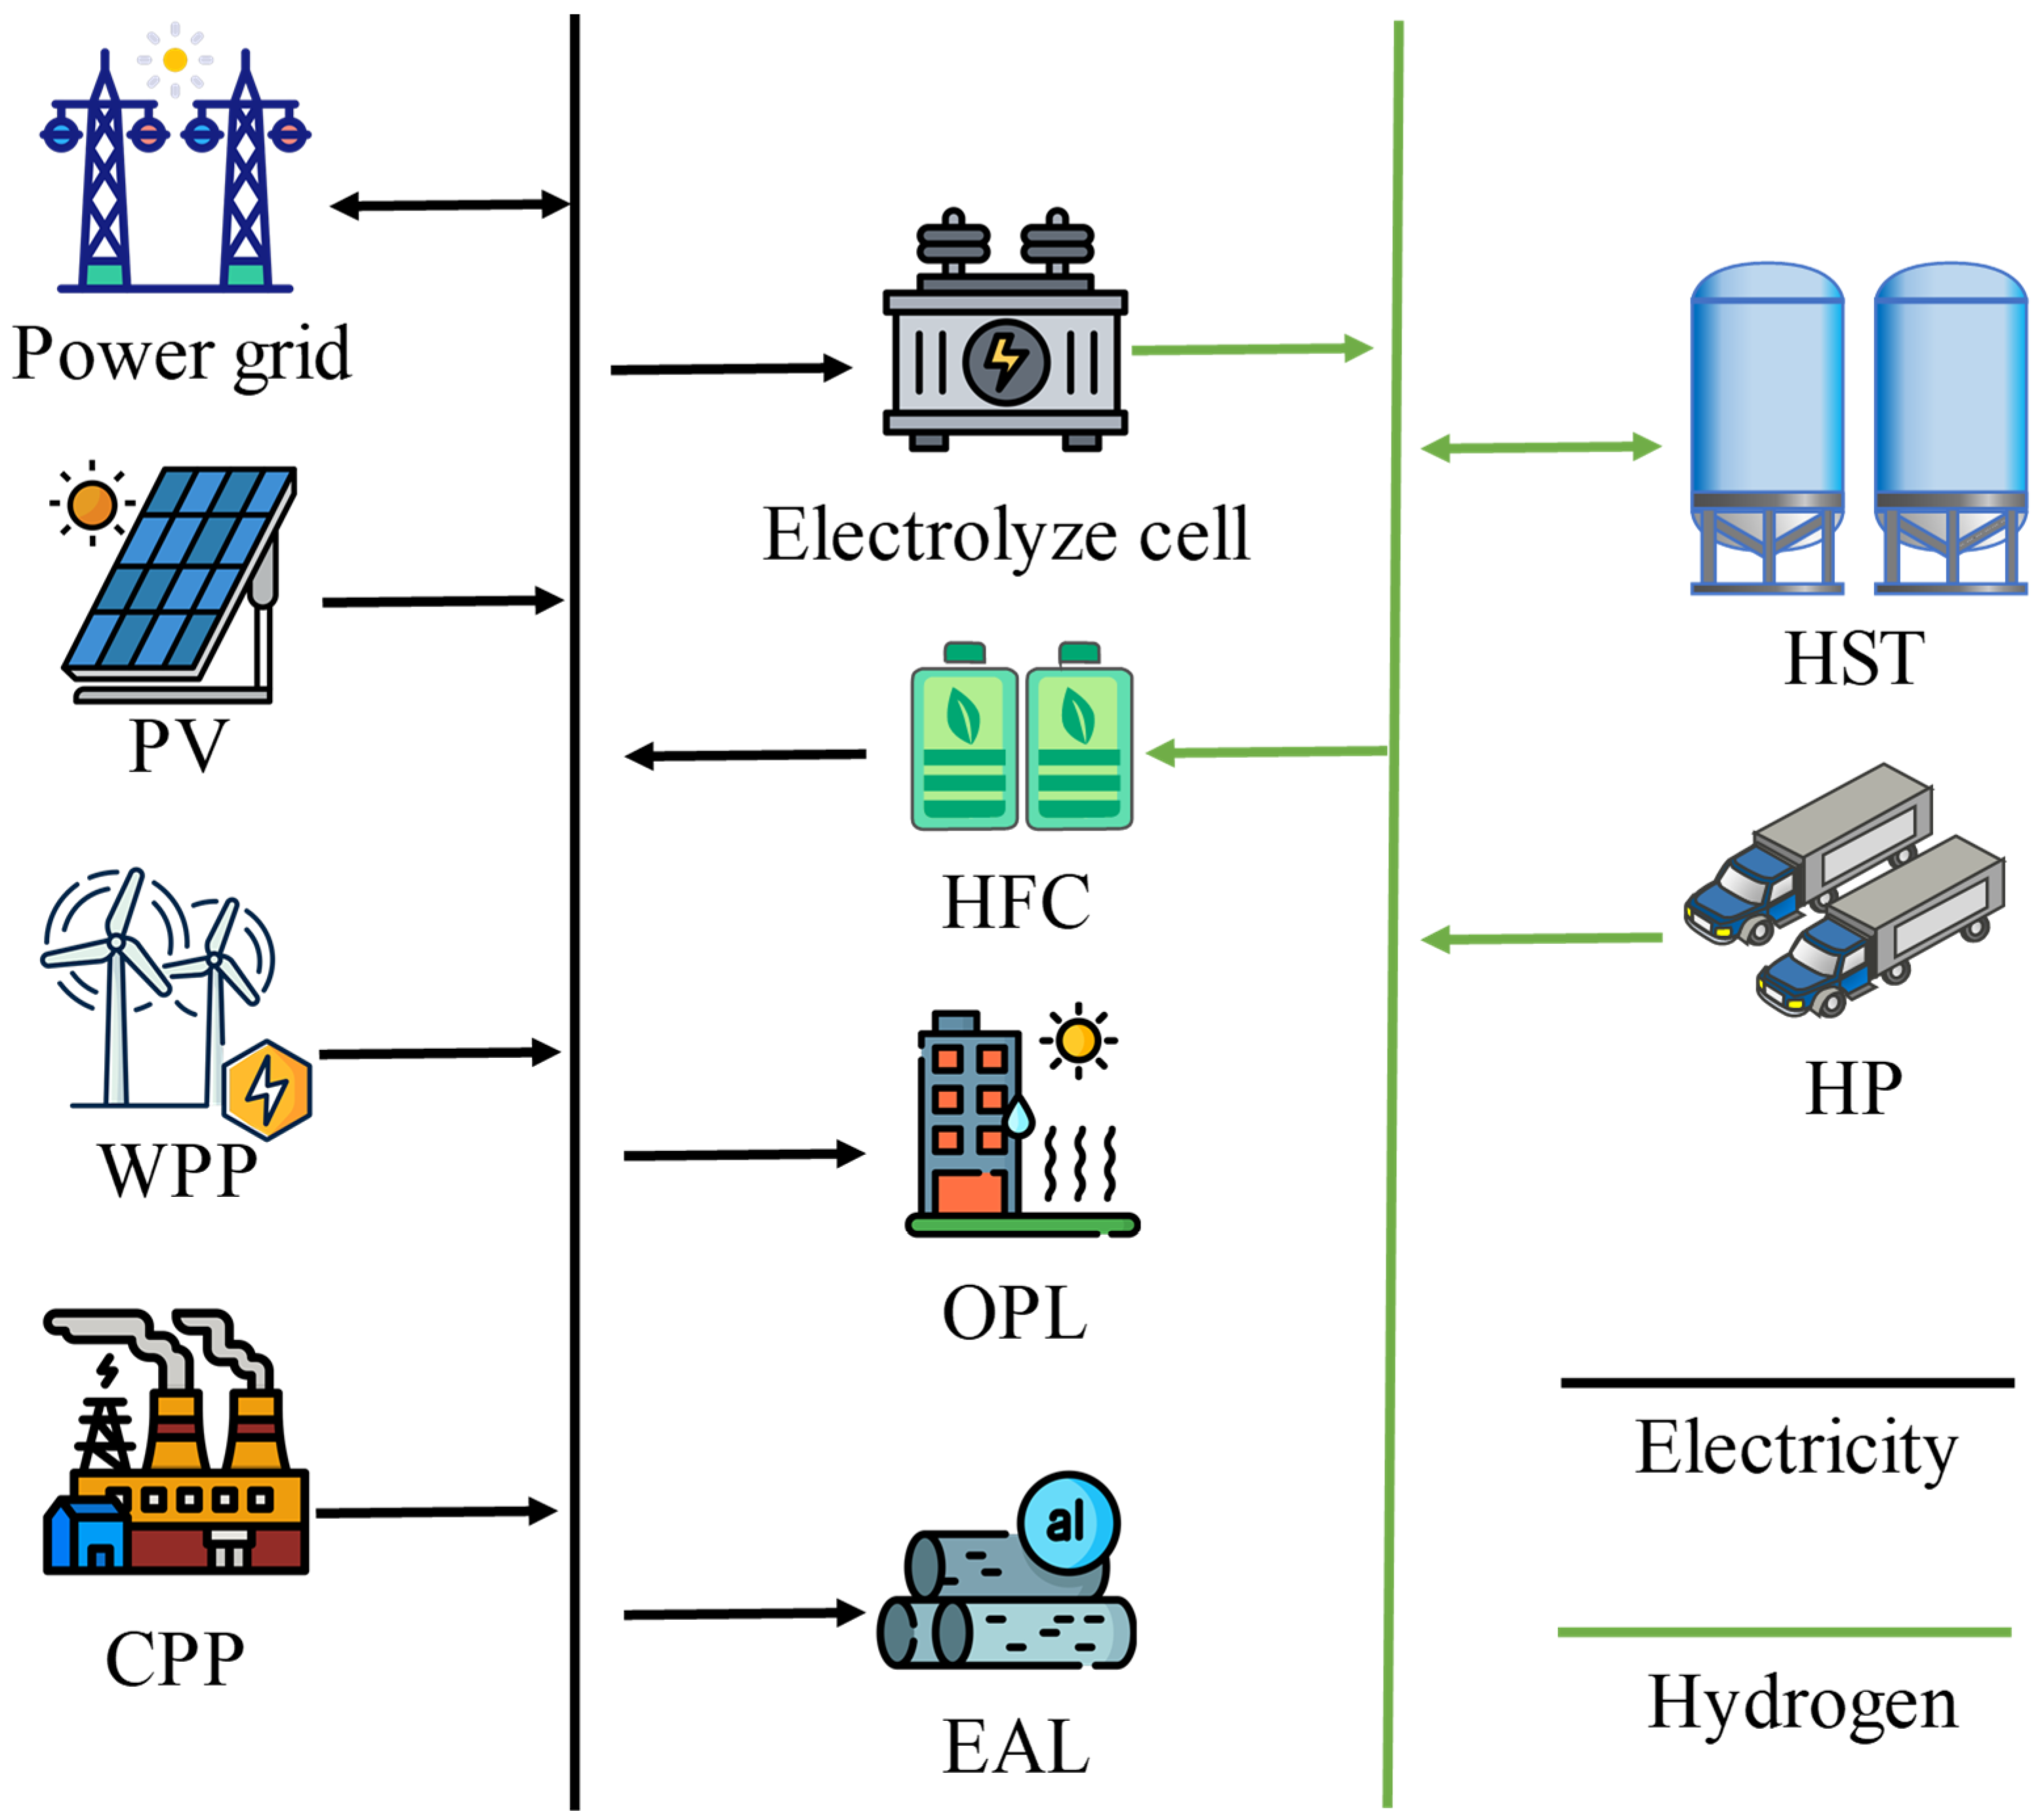
Figure 1. Structure of the integrated energy system.
Energies 18 06109 g001
Figure 2. Optimization framework.
Energies 18 06109 g002
Figure 3. Day-ahead forecast data.
Energies 18 06109 g003
Figure 4. Electricity price between the IES and the power grid.
Energies 18 06109 g004
Figure 5. Power dispatch results of Case 1.
Energies 18 06109 g005
Figure 6. Hydrogen dispatch results for Case 1.
Energies 18 06109 g006
Figure 7. Changes in HST capacity in Case 1.
Energies 18 06109 g007
Figure 8. Output changes of CPP in Case 1.
Energies 18 06109 g008
Figure 9. Optimized EAL in Case 1.
Energies 18 06109 g009
Figure 10. Power dispatch results of Case 2.
Energies 18 06109 g010
Figure 11. Hydrogen dispatch results for Case 2. H g a s = 0 means that the system hydrogen electrolyzer is always closed.
Energies 18 06109 g011
Figure 12. Changes in HST capacity in Case 2.
Energies 18 06109 g012
Figure 13. Output changes of CPP in Case 2.
Energies 18 06109 g013
Figure 14. Optimized EAL in Case 2.
Energies 18 06109 g014
Figure 15. Sensitivity analysis results of penalty weights.
Energies 18 06109 g015
Table 1. Parameters of CPPs [29].
CPP P i min , p i max ( MW ) P i down , P i up ( MW ) a i ( $ / MWh 2 ) b i ( $ / MWh ) c i ( $ )
1[150, 682.5][56, 56]0.000477.05420
2[30, 195][26, 26]0.00024.23970
3[30, 195][27, 27]0.00024.23700
Table 2. Comparison of optimization results of Case 1 and Case 2.
Case 1 ( c = 0.8 )Case 2 ( c = 0.2 )Changes (Case 2 − Case 1)Improvement (Changes/Case 2)
C buy ( $ ) 169,24621,725.2−147,520.8−87.16%
C cell ( $ ) 33,756.895,854.9262,098.1183.96%
C pen ( $ ) 0000.00%
C cpp ( $ ) 189,071.8184,340−4731.86−2.50%
C m ( $ ) 42,772.2487,147.0644,374.8103.75%
C h ( $ ) 69,678.7322,193.1252,514362.40%
obj 1 ( $ ) 437,010519,550.682,540.618.89%
obj 2 ( t ) 3787.563336.9−450.66−11.90%
Table 3. Comparison of optimization results of Case 1 and Case 3.
Case 1 ( c = 0.8 )Case 3 ( c = 0.8 )Changes (Case 3 − Case 1)Improvement (Changes/Case 3)
C buy ( $ ) 169,246164,852.7−4393.34−2.67%
C cell ( $ ) 33,756.8138,721.8104,96575.67%
C pen ( $ ) 0000
C cpp ( $ ) 189,071.8188,897.5−174.3−0.09%
C m ( $ ) 42,772.2458,119.8815,347.626.41%
C h ( $ ) 69,678.787,318.717,64020.20%
obj 1 ( $ ) 437,010473,057.836,047.87.62%
obj 2 ( t ) 3787.563775.1−12.46−0.33%
Table 4. Comparison of optimization results of Case 2 and Case 4.
Case 2 ( c = 0.2 )Case 4 ( c = 0.2 )Changes (Case 4 − Case 2)Improvement (Changes/Case 4)
C buy ( $ ) 21,725.236,063.4414,338.2466.00%
C cell ( $ ) 95,854.9283,354.6−12,500.3−13.04%
C pen ( $ ) 0000
C cpp ( $ ) 184,340181,993.4−2346.54−1.27%
C m ( $ ) 87,147.0692,300.65153.545.91%
C h ( $ ) 322,193.1325,888.83695.721.15%
obj 1 ( $ ) 519,550.6552,891.233,340.586.42%
obj 2 ( t ) 3336.93334.94−1.96−0.06%
Disclaimer/Publisher’s Note: The statements, opinions and data contained in all publications are solely those of the individual author(s) and contributor(s) and not of MDPI and/or the editor(s). MDPI and/or the editor(s) disclaim responsibility for any injury to people or property resulting from any ideas, methods, instructions or products referred to in the content.