Article

Synergistic Effects of Dimethyl Ether and LSW in a CO2 WAG Process for Enhanced Oil Recovery and CO2 Sequestration

by
Yongho Seong
1,
Bomi Kim
1,
Qingquan Liu
2,
Liang Wang
2 and
Kun Sang Lee
1,2,*
1
Department of Earth Resources and Environmental Engineering, Hanyang University, Seoul 04763, Republic of Korea
2
School of Safety Engineering, China University of Mining and Technology, Xuzhou 221116, China
*
Author to whom correspondence should be addressed.
Energies 2025, 18(23), 6104; https://doi.org/10.3390/en18236104
Submission received: 24 September 2025 / Revised: 5 November 2025 / Accepted: 17 November 2025 / Published: 21 November 2025
(This article belongs to the Section H1: Petroleum Engineering)

Abstract

The integrated injection of low-salinity water (LSW) and carbon dioxide (CO2) into the water-alternating-gas (WAG) process offers advantages, primarily increasing oil recovery and reducing operating costs. However, CO2 has challenges in sweep efficiency due to significant differences in density and viscosity compared with oil. While LSW and dimethyl ether (DME) have shown promise in improving recovery through wettability alteration and reducing minimum miscible pressure, interfacial tension (IFT), and CO2 mobility, their synergistic integration with CO2-WAG remains poorly understood. Existing DME-based enhanced oil recovery (EOR) studies have not explored low-salinity water injection as a cost-effective alternative to mitigate high DME operating costs. This study introduces the CO2/DME-LSWAG method, systematically evaluating the effect of DME concentrations (0%, 10%, 25%) and LSWs (seawater, twice-diluted seawater, ten-times-diluted seawater) on sweep and displacement efficiencies, oil recovery, and CO2 storage in a 2D cross-sectional carbonate reservoir model. Results showed that DME dramatically reduces IFT (67% and 95% at 10% and 25% DME solvent, respectively) while salinity effects are relatively small. Compared with CO2-LSWAG, the oil recovery factor improved by 5.2–13.1% depending on DME concentration and water salinity, with DME performance maximized at higher salinity water. CO2 storage efficiency showed opposing trends. Structural trapping decreased, while solubility trapping increased with lower salinity. The sensitivity analysis identified DME concentration as the dominant factor for CO2 storage. The composition modeling and simulation of the CO2/DME-LSWAG process provide critical engineering guidance for the design of future EOR and CO2 storage projects that utilize DME in carbonate reservoirs.

1. Introduction

CO2 is the solvent most widely used in enhanced oil recovery (EOR) processes. However, CO2 causes problems such as early breakthrough and viscous fingering due to large differences in density and viscosity compared with oil [1,2,3]. To compensate for that, the water-alternating-gas (WAG) injection method was developed to enable geological CO2 storage and enhanced oil recovery [4].
Low-salinity water injection (LSWI) has been recognized as a cost-effective, eco-friendly, and effective method for EOR [5]. Although numerous studies have been conducted to elucidate the fundamental mechanism of LSWI, it has not yet been fully identified. However, it is generally believed that several mechanisms work in combination [6,7]. Research on CO2-low-salinity WAG (LSWAG), which enables advanced, cost-effective oil recovery and CO2 storage, has been actively conducted using CO2-WAG and LSW processes [6]. Research has also been conducted on injection of materials such as foam, polymer, gel, and nanoparticles together with CO2 [8]. Recently, dimethyl ether (DME) has been reviewed as a promising solvent.
DME has physical properties similar to those of liquefied petroleum gas. However, it is low-toxicity, non-corrosive, and non-carcinogenic and is not classified as a greenhouse gas. Its solubility in water is about 1000 times greater than that of propane, allowing solubility and stable in water [9]. In addition, DME increases the viscosity of CO2 and inhibits diffusion [10]. When it contacts oil, a first-contact miscibility process occurs, reducing the viscosity of the oil and causing it to expand, improving its mobility [11]. However, due to the high cost of DME, there are few EOR studies utilizing it. Most DME studies have been conducted with DME-enhanced waterflood [11] or DME or CO2/DME injection [12,13,14,15,16], and molecular dynamics simulations [10,17]. Recently, a study was conducted to investigate the effect of DME in dynamic conditions using WAG numerical simulations of mixed CO2 and DME solvents in a 2D cross-sectional reservoir model [16,18].
Both DME and LSW have been demonstrated to enhance oil recovery significantly. There has been no research on the synergistic effects of combining these two methods. Therefore, to leverage the benefits of both methods, numerical simulations have been performed on a CO2/DME-LSWAG process, which combines DME and LSW with the existing CO2-WAG process. The 2D cross-sectional carbonate reservoir model incorporates geochemical reaction and wettability alteration effects. Based on the simulation results, comparison and analysis have been conducted for the synergistic effects of the CO2/DME-LSWAG process on sweep and displacement efficiency, oil recovery, and CO2 storage.

2. Numerical Modeling and Simulation

2.1. Geochemical Reaction

To incorporate the interactions among oil, rock, and brine, geochemical reactions must be considered. Therefore, 15 chemical reactions representing hydrocarbon solubility, aqueous phase reactions, mineral dissolution/precipitation, and ion exchange were applied to the simulation, as listed in Table 1 [19].
Soluble hydrocarbons dissolve rapidly at given pressures, compositions, and temperatures until they reach thermodynamic equilibrium. Therefore, their solubility can be modeled using phase equilibrium. Hydrocarbon components have identical fugacity in all phases (oleic, gaseous, and aqueous phases). As an illustration, consider CO2 at equilibrium in a reaction (R1), where it exhibits equal fugacity in all three phases (Equation (1)).
f i g p , y i g ,   T f i o p , y i o ,   T f i w p ,   y i w ,   T , i = 1 ,   2 ,   ,   N c
where f i g , f i o , and f i w are the fugacity of the gas, oil, and aqueous phases, respectively; y i g , y i o , and y i w are mole fractions of component i in the three phases; and N c is the number of soluble hydrocarbon components. The fugacity of soluble hydrocarbon components in the gas and oil phases is determined by the Peng–Robinson (PR) equation of state (EOS). In parallel, the model calculates aqueous reactions, which are governed by the principle of thermodynamic equilibrium. This equilibrium state is achieved when the net reaction rate becomes zero, when the reaction activity product equals the equilibrium constant (Equation (2)). To implement this condition, the activity coefficients are calculated using the Debye–Hückel equation (Equation (5)) [20]. The ionic strength required for this calculation is determined by the expression given in Equation (6).
Q α K e q ,   α = 0 ,               α = 1 ,   2 ,   ,   R a q
Q α = i = 1 N a q ( a i ) v i α ,               α = 1 ,   2 ,   ,   R a q
a i = γ i m i ,               i = 1 ,   2 ,   ,   N a q
Here, Q α represents the activity product of reaction α ; K e q , α is the equilibrium constant for reaction α ; N a q is the total component number in the aqueous phase; and v i α is the stoichiometric coefficient of ion i . Furthermore, a i is the activity; γ i is the activity coefficient for an ideal solution; and m i is molality.
log γ i = A T z i 2 I 1 + a i ˙ B T I + b i ˙ I ,               i = 1 ,   2 ,   ,   N a q
I = 1 2 i = 1 N a q z i 2 m i
where A , B , and b i ˙ are temperature-related parameters, and a i ˙ is a dimensionless parameter for ion i .

2.2. Fluid Modeling

Fluid modeling was performed using WinProp software (2025.20) developed by the Computer Modeling Group (CMG) and oil data from the Weyburn reservoir in southeast Saskatchewan, Canada [21]. The PR EOS embedded in WinProp software was used to calculate the fugacity of components in the oil and gas phases and to determine DME solubility and the phase behavior of the fluid model with reservoir oil and injected fluid. The PR EOS is calculated as
p = R T v b a v v + b + b ( v b )
where p is the pressure; T is the temperature; R is the universal gas constant; v is the molar volume; and a and b are the EOS model parameters. Table 2 shows the oil composition and properties, and Table 3 displays the binary interaction coefficient between DME and each oil component [11,22].
Table 4 compares the experimental data with those of fluid model. Although the fluid model results exhibit slight deviations from the experimental data, they were sufficiently reliable. Henry’s law for the fugacity of two solvents in the aqueous phase was used to calculate the solubility of CO2 and DME in water [23]:
f i w = y i w H i ,           i = 1 ,   2 ,   3 ,   ,   n c
where H i denotes Henry’s constant for component i ; and y i w is the mole fraction of component i in the aqueous phase.
ln H i = ln H i * + v ¯ i ( p p * ) R T
Here, H i * represents Henry’s constant for component i at reference pressure p * ; T is the temperature; and v ¯ i is the partial molar volume of component i .
Table 4. Comparison of properties between the fluid model and experimental data.
ParametersFluid ModelExperimental Data
Saturation pressure (psi)694713
Oil density (lb/ft3)50.350.3
Oil viscosity (cP)1.761.76
Formation volume factor (ft3/ft3)1.111.12
Oil gravity (°API)3531

2.3. Low-Salinity Water Injection

The wettability alteration from oil-wet to water-wet using LSWI was first reported by Morrow and Buckley (2006) [24]. Since then, various mechanisms have been proposed, such as fines migration, multi-ion exchange, electrical double layer expansion, osmosis, in situ soap generation, and IFT reduction. However, no single mechanism has yet provided a complete explanation [7]. These various mechanisms all contribute to enhanced oil recovery as the salinity of the injected brine decreases. Therefore, this study simulates the behavior of the CO2/DME-LSWAG phenomenon. The properties of each brine used in the simulation are presented in Table 5.
To implement wettability alteration, the relative permeability curves of Yousef et al. (2011) were used (Figure 1), and the Ca2+ concentration was used as an indicator of the relative permeability shift phenomenon [19,25]. Depending on the salinity of the brine, the relative permeability function in different wettability conditions was approximated using linear interpolation. These datasets were used as input parameters for the GEM compositional simulator developed by CMG.

2.4. Reservoir Modeling

The homogeneous 2D cross-sectional reservoir model was designed using 52 × 1 × 20 grids, and the size of each grid was 10 × 10 × 5 ft. This reservoir model uses a carbonate rock composed of calcite, barite, and dolomite to account for the geochemical effects induced by LSWI. Detailed reservoir properties and initial conditions are shown in Table 6.

2.5. Injection Design

This study simulates WAG techniques. As illustrated in Figure 2, the total 12-year injection process consists of three stages: an initial three years of LSW flooding, followed by six years of LSWAG injection at a 1:1 LSWAG ratio, and a final three years of LSW flooding to recover residual oil and injected gas. Nine cases were performed to test varying DME concentrations and water salinities (Table 7).

3. Results and Discussion

3.1. Effect of Low-Salinity Water

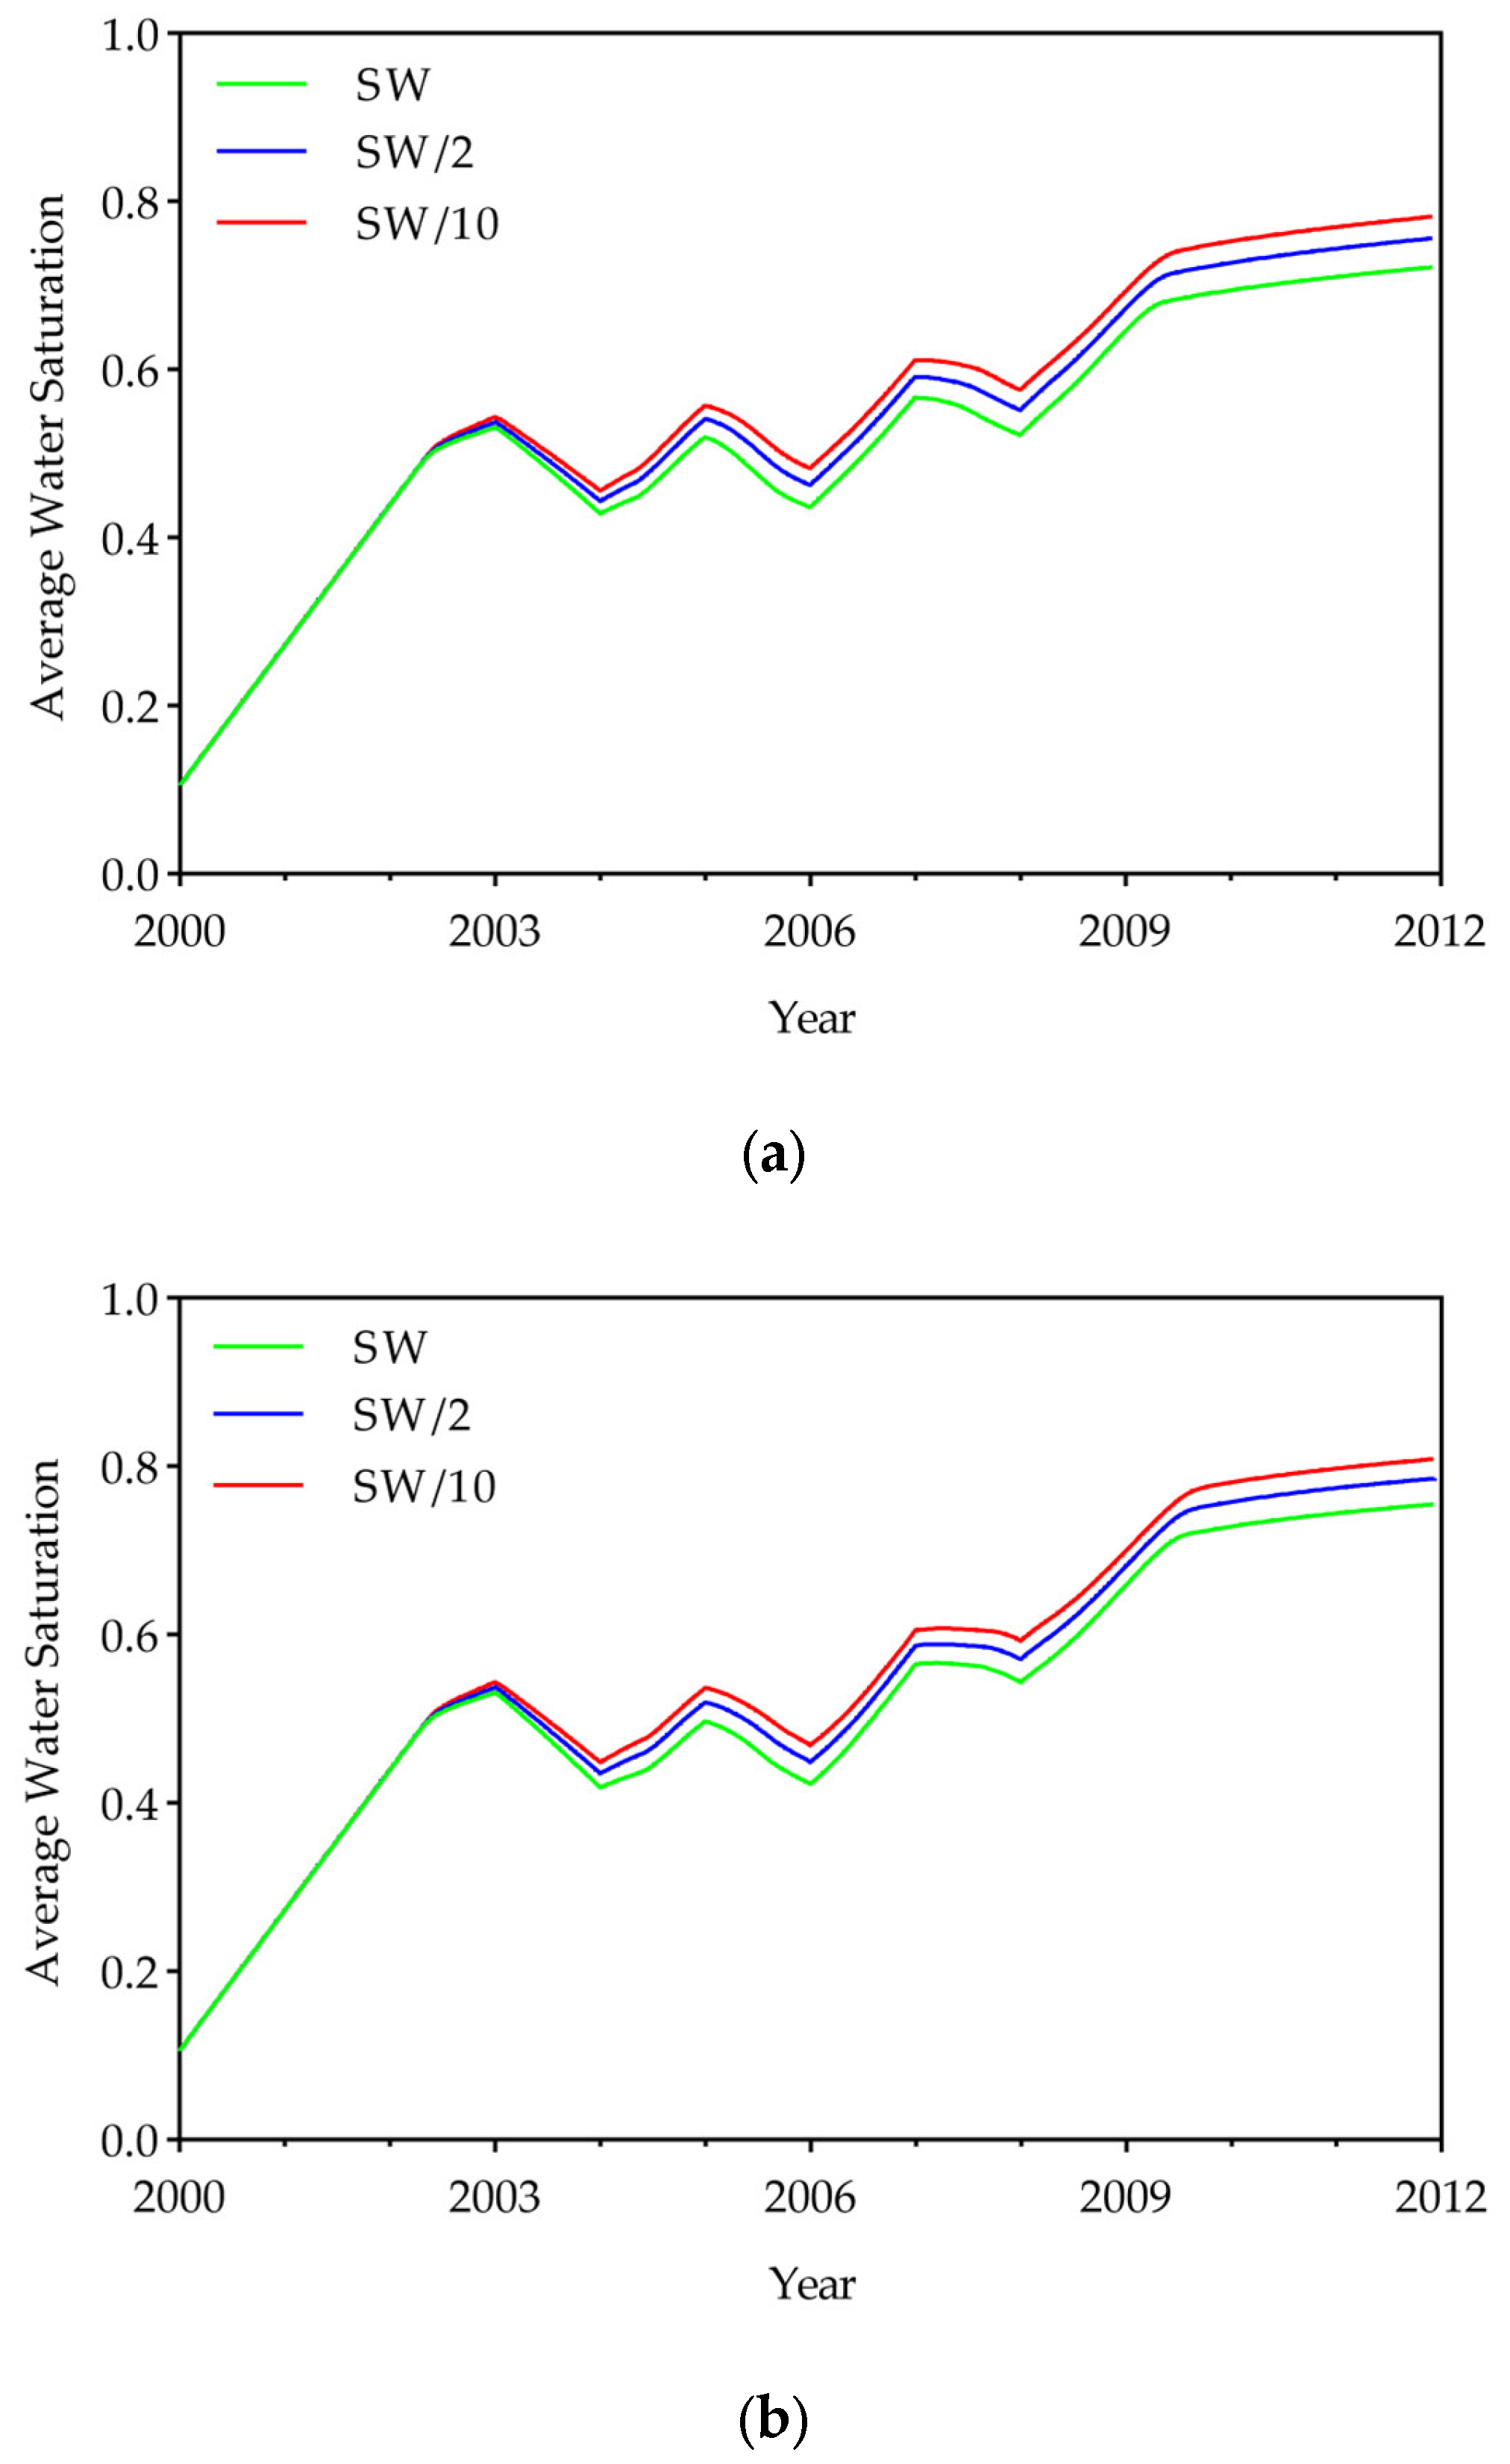
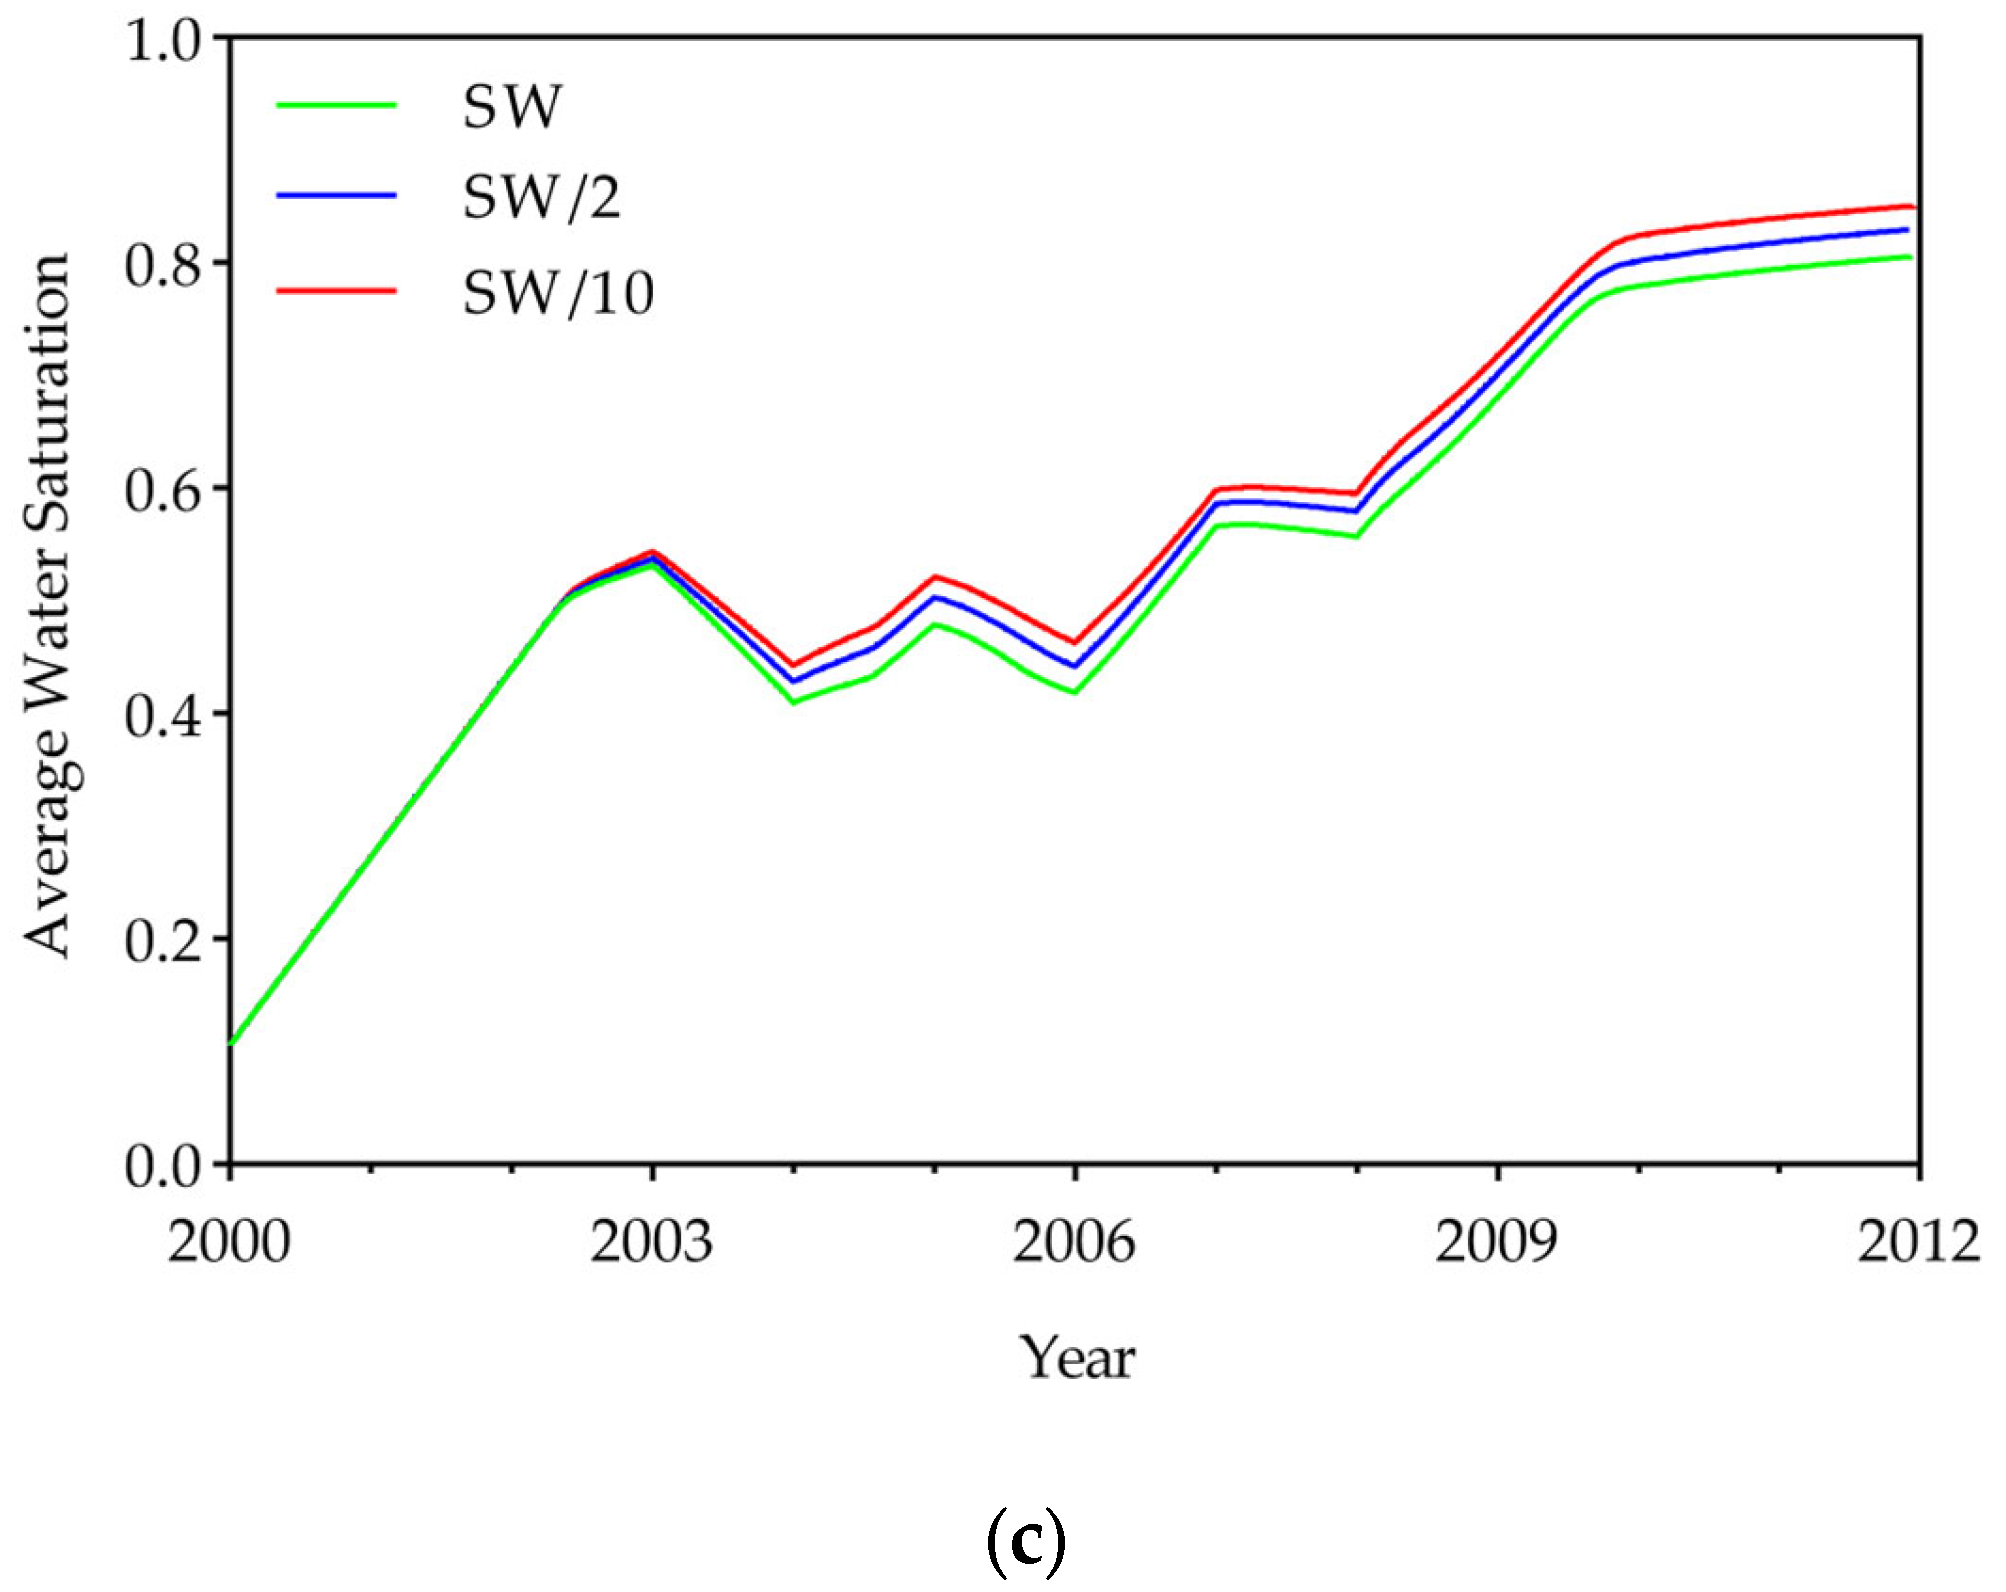
LSWI enhances oil recovery by inducing a wettability alteration, which shifts the rock from an oil-wet to a water-wet state. As shown in Figure 3, in all cases, water saturation increased as salinity decreased. Compared with seawater (SW), the average water saturation of twice-diluted seawater (SW/2) increased by an average of 3.9%, and that of ten-times-diluted seawater (SW/10) increased by an average of 7.0%. This change not only improves oil recovery but also increases the average water saturation within the reservoir.
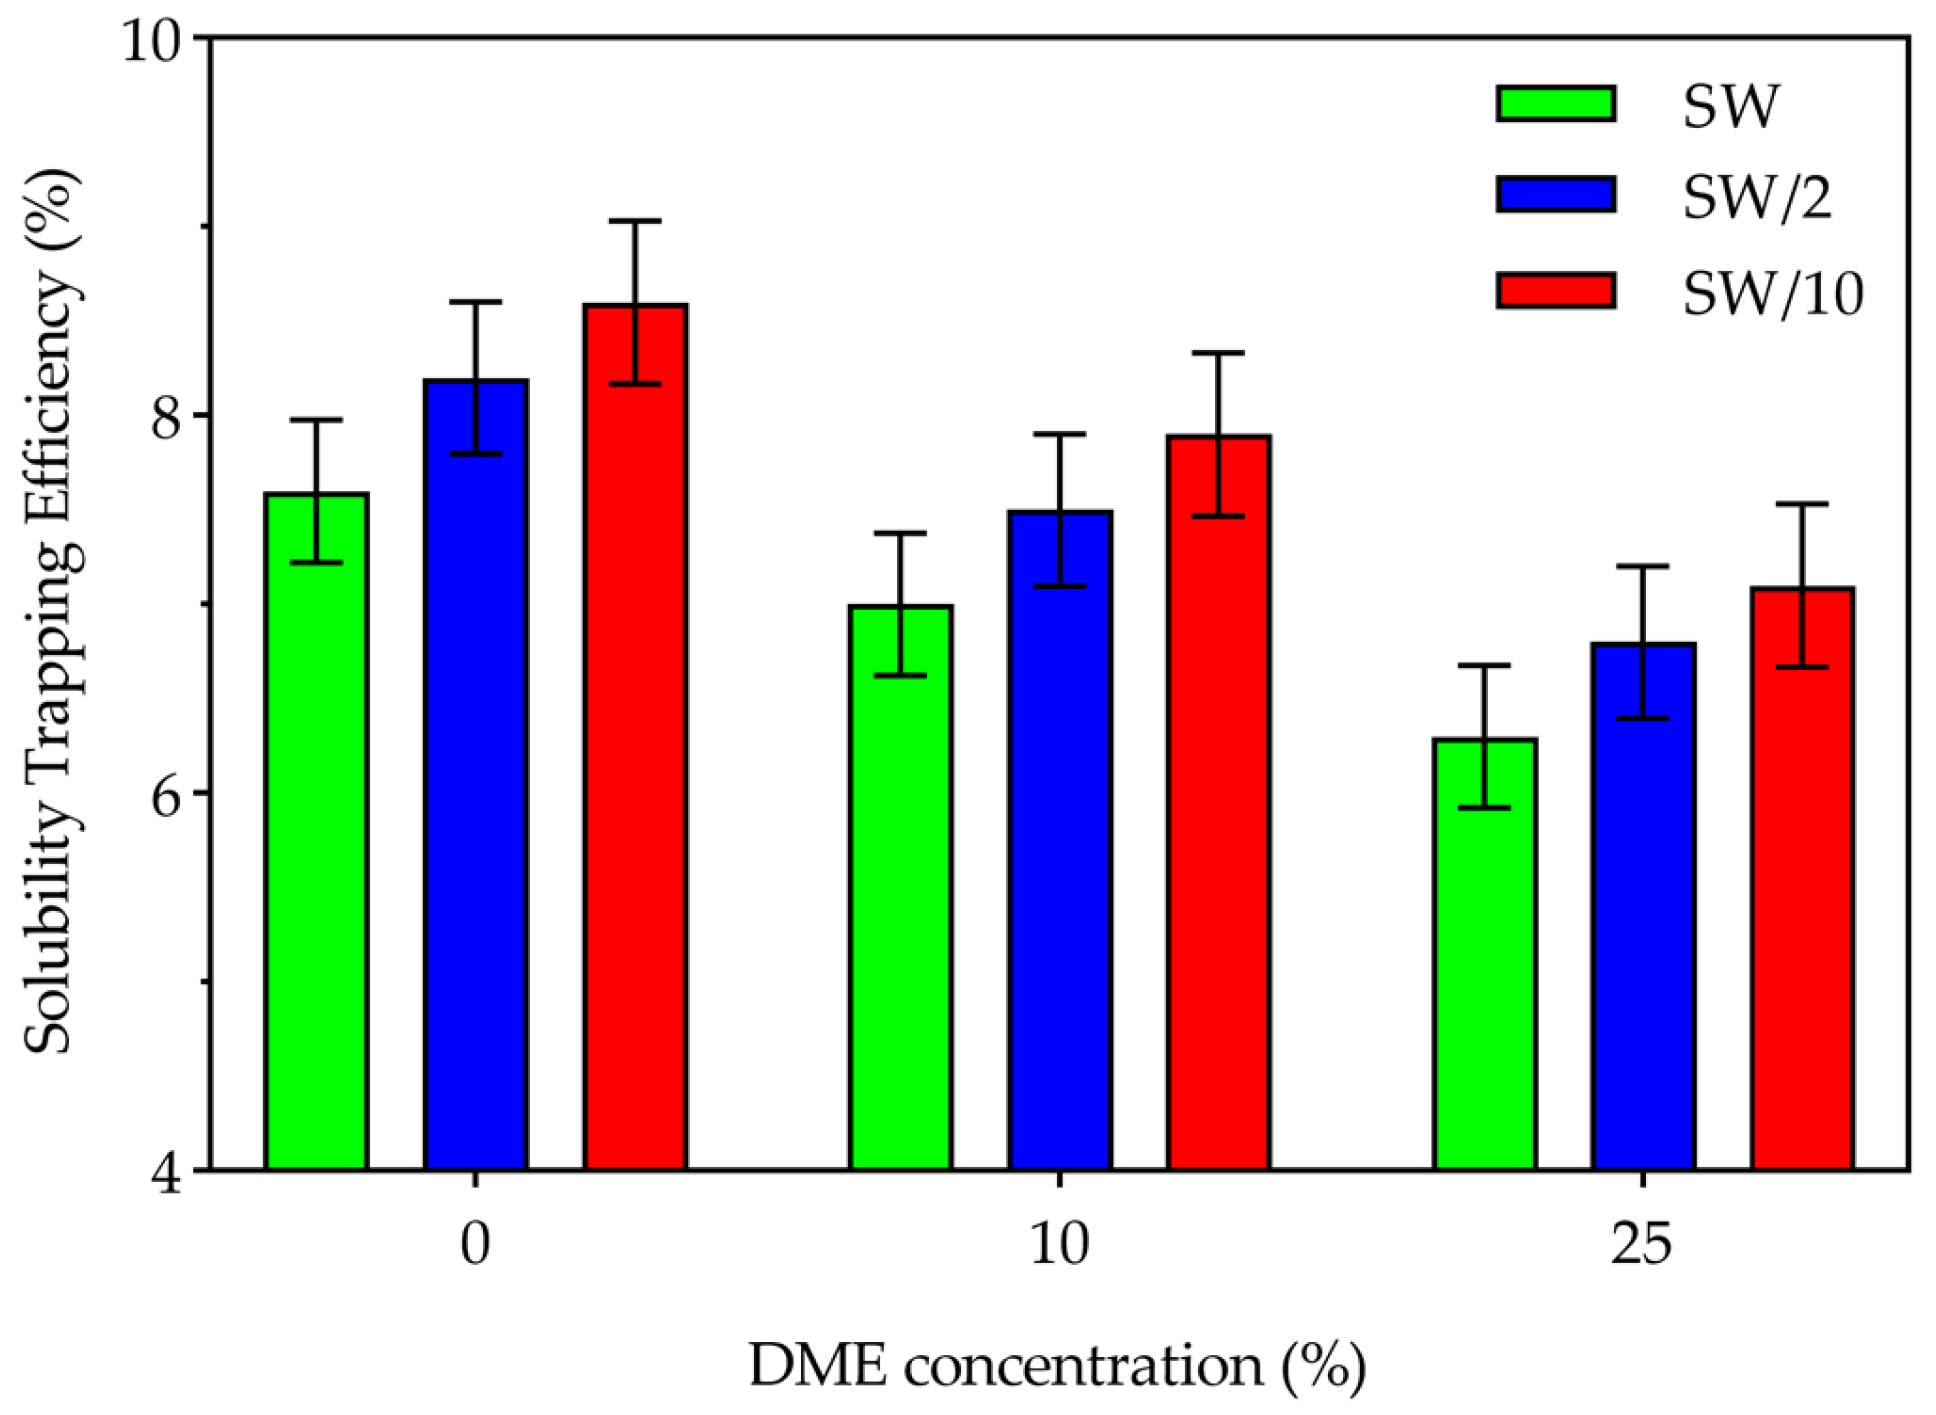
Furthermore, lower salinity in the water mitigates the salting-out effect, increasing the solubility of CO2 in the aqueous phase. Consequently, as salinity decreases, a greater amount of CO2 can be stably trapped. Figure 4 specifically illustrates the solubility trapping efficiency, which is defined as the ratio between the amount of soluble CO2 trapped and the amount of CO2 injected. The average values were 6.9% for SW, 7.5% for SW/2, and 7.9% for SW/10, demonstrating an increasing trend with decreasing salinity.
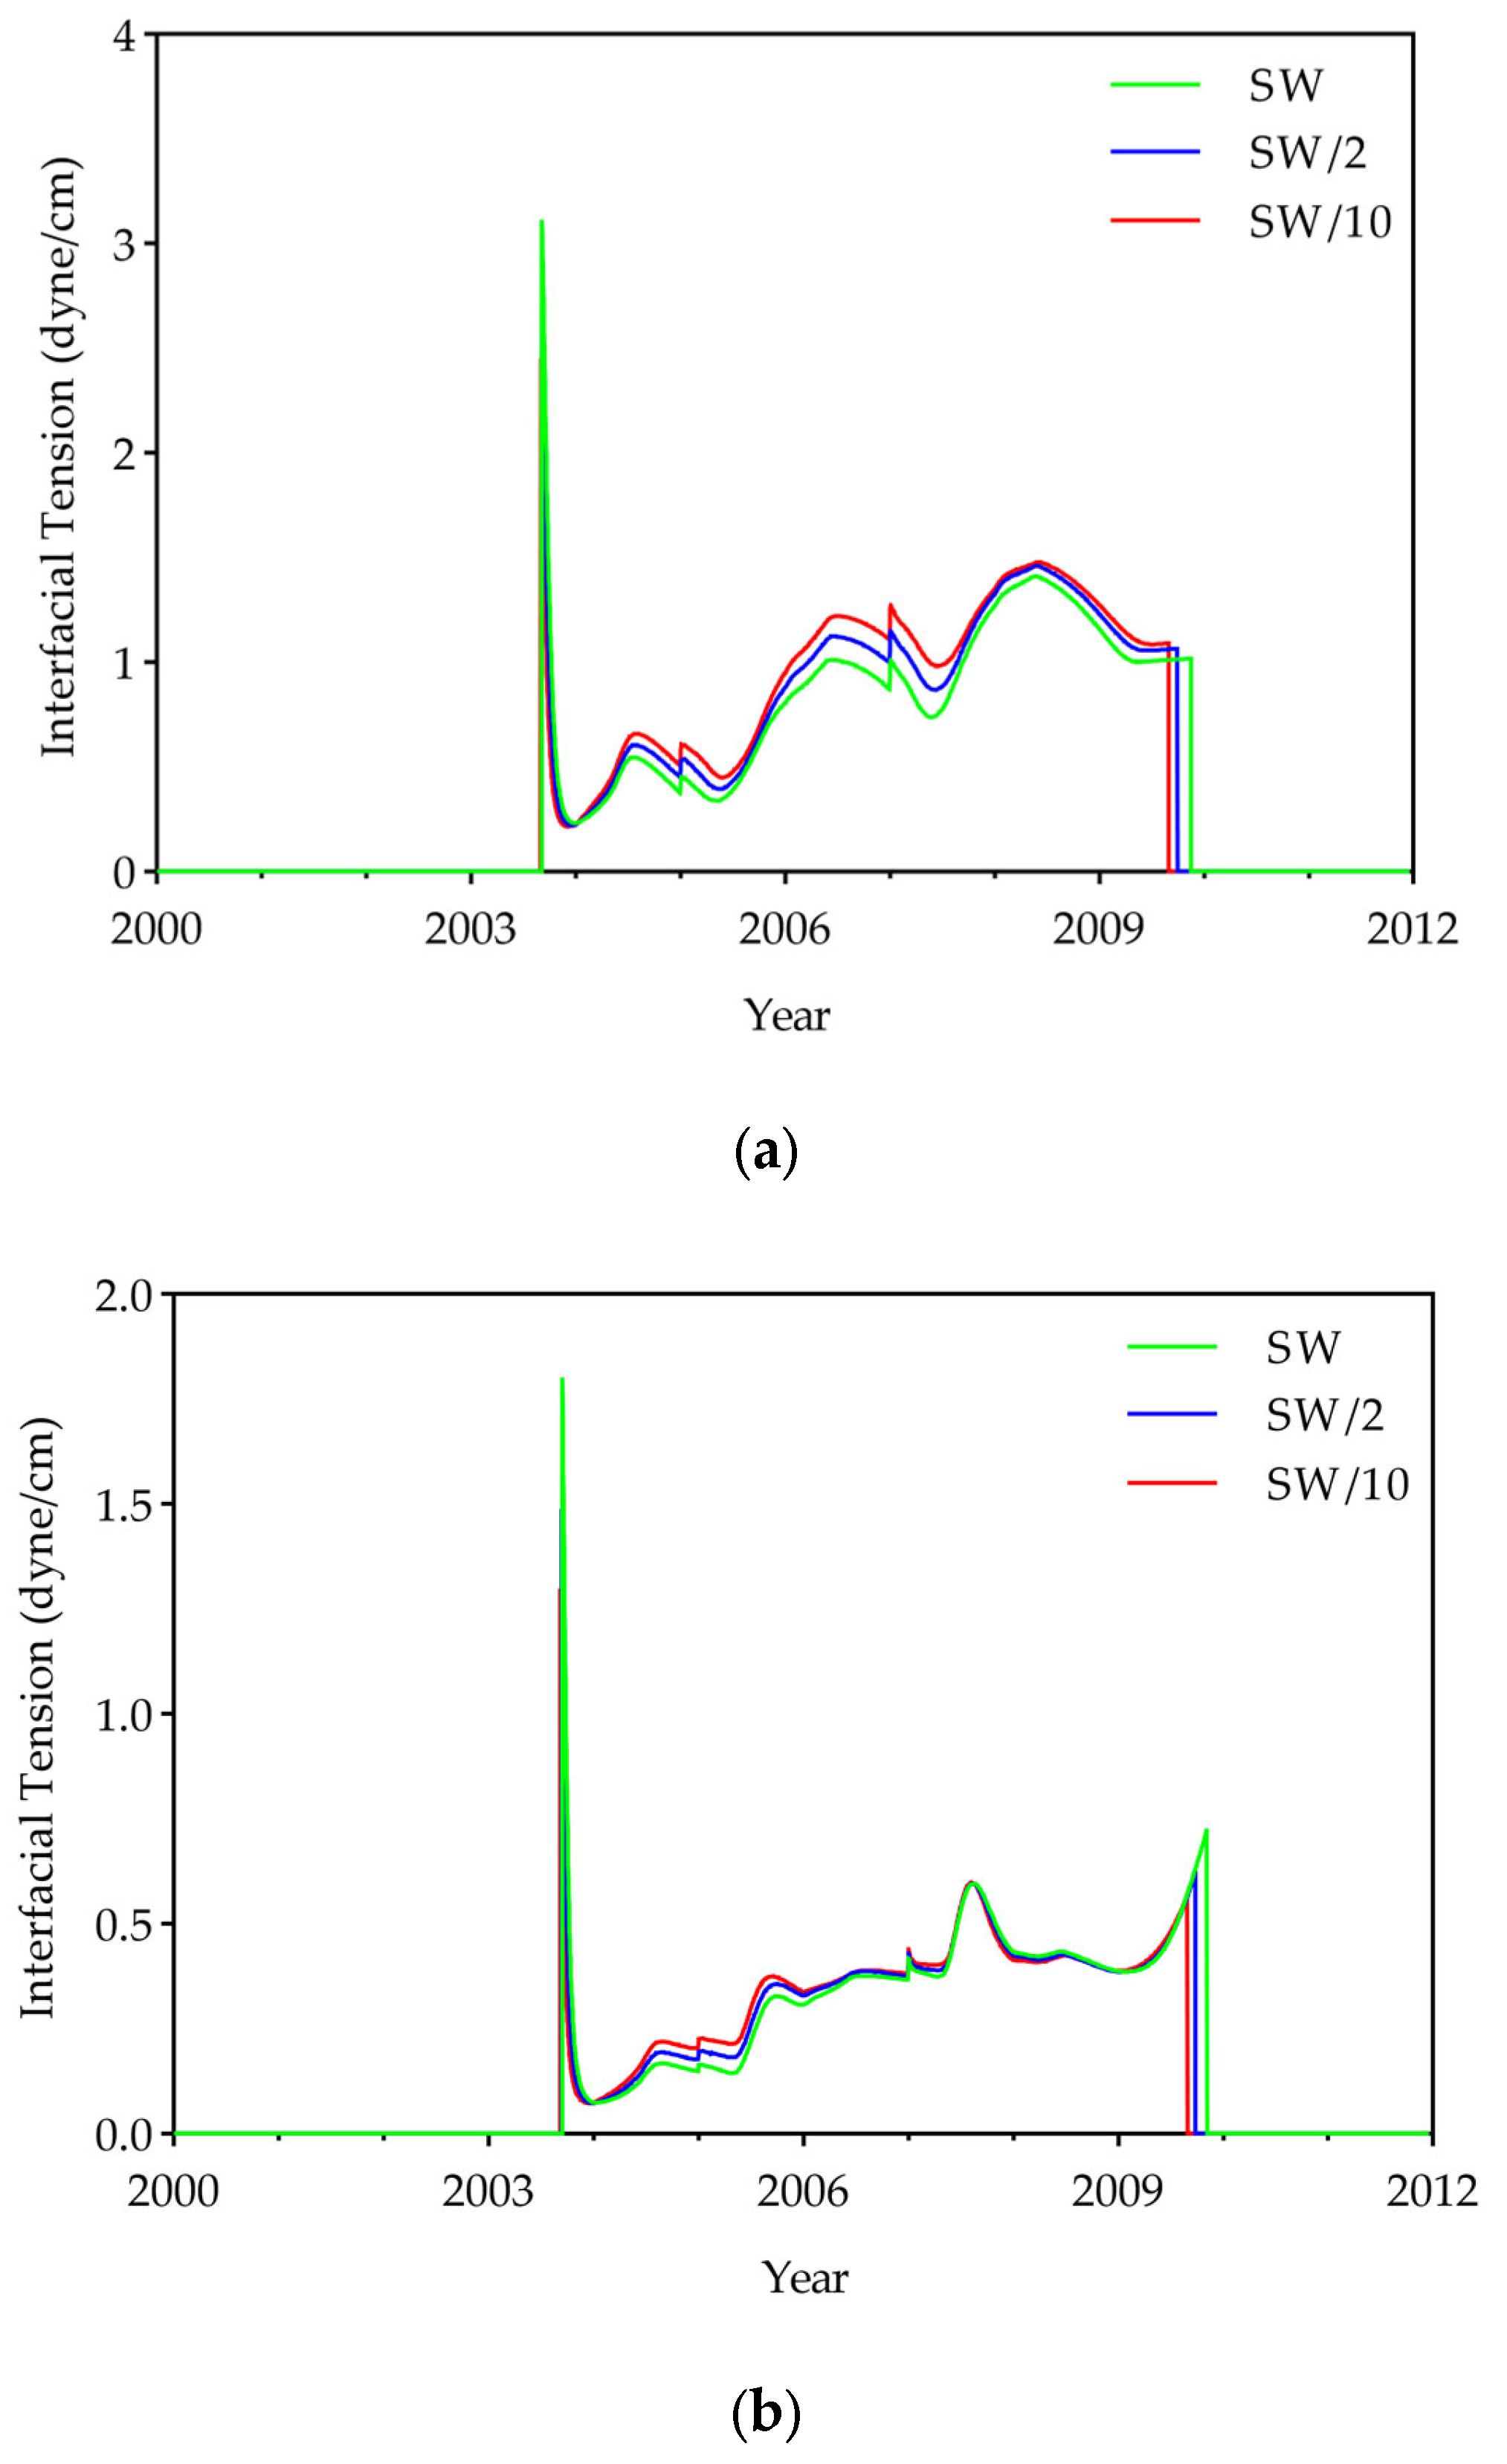
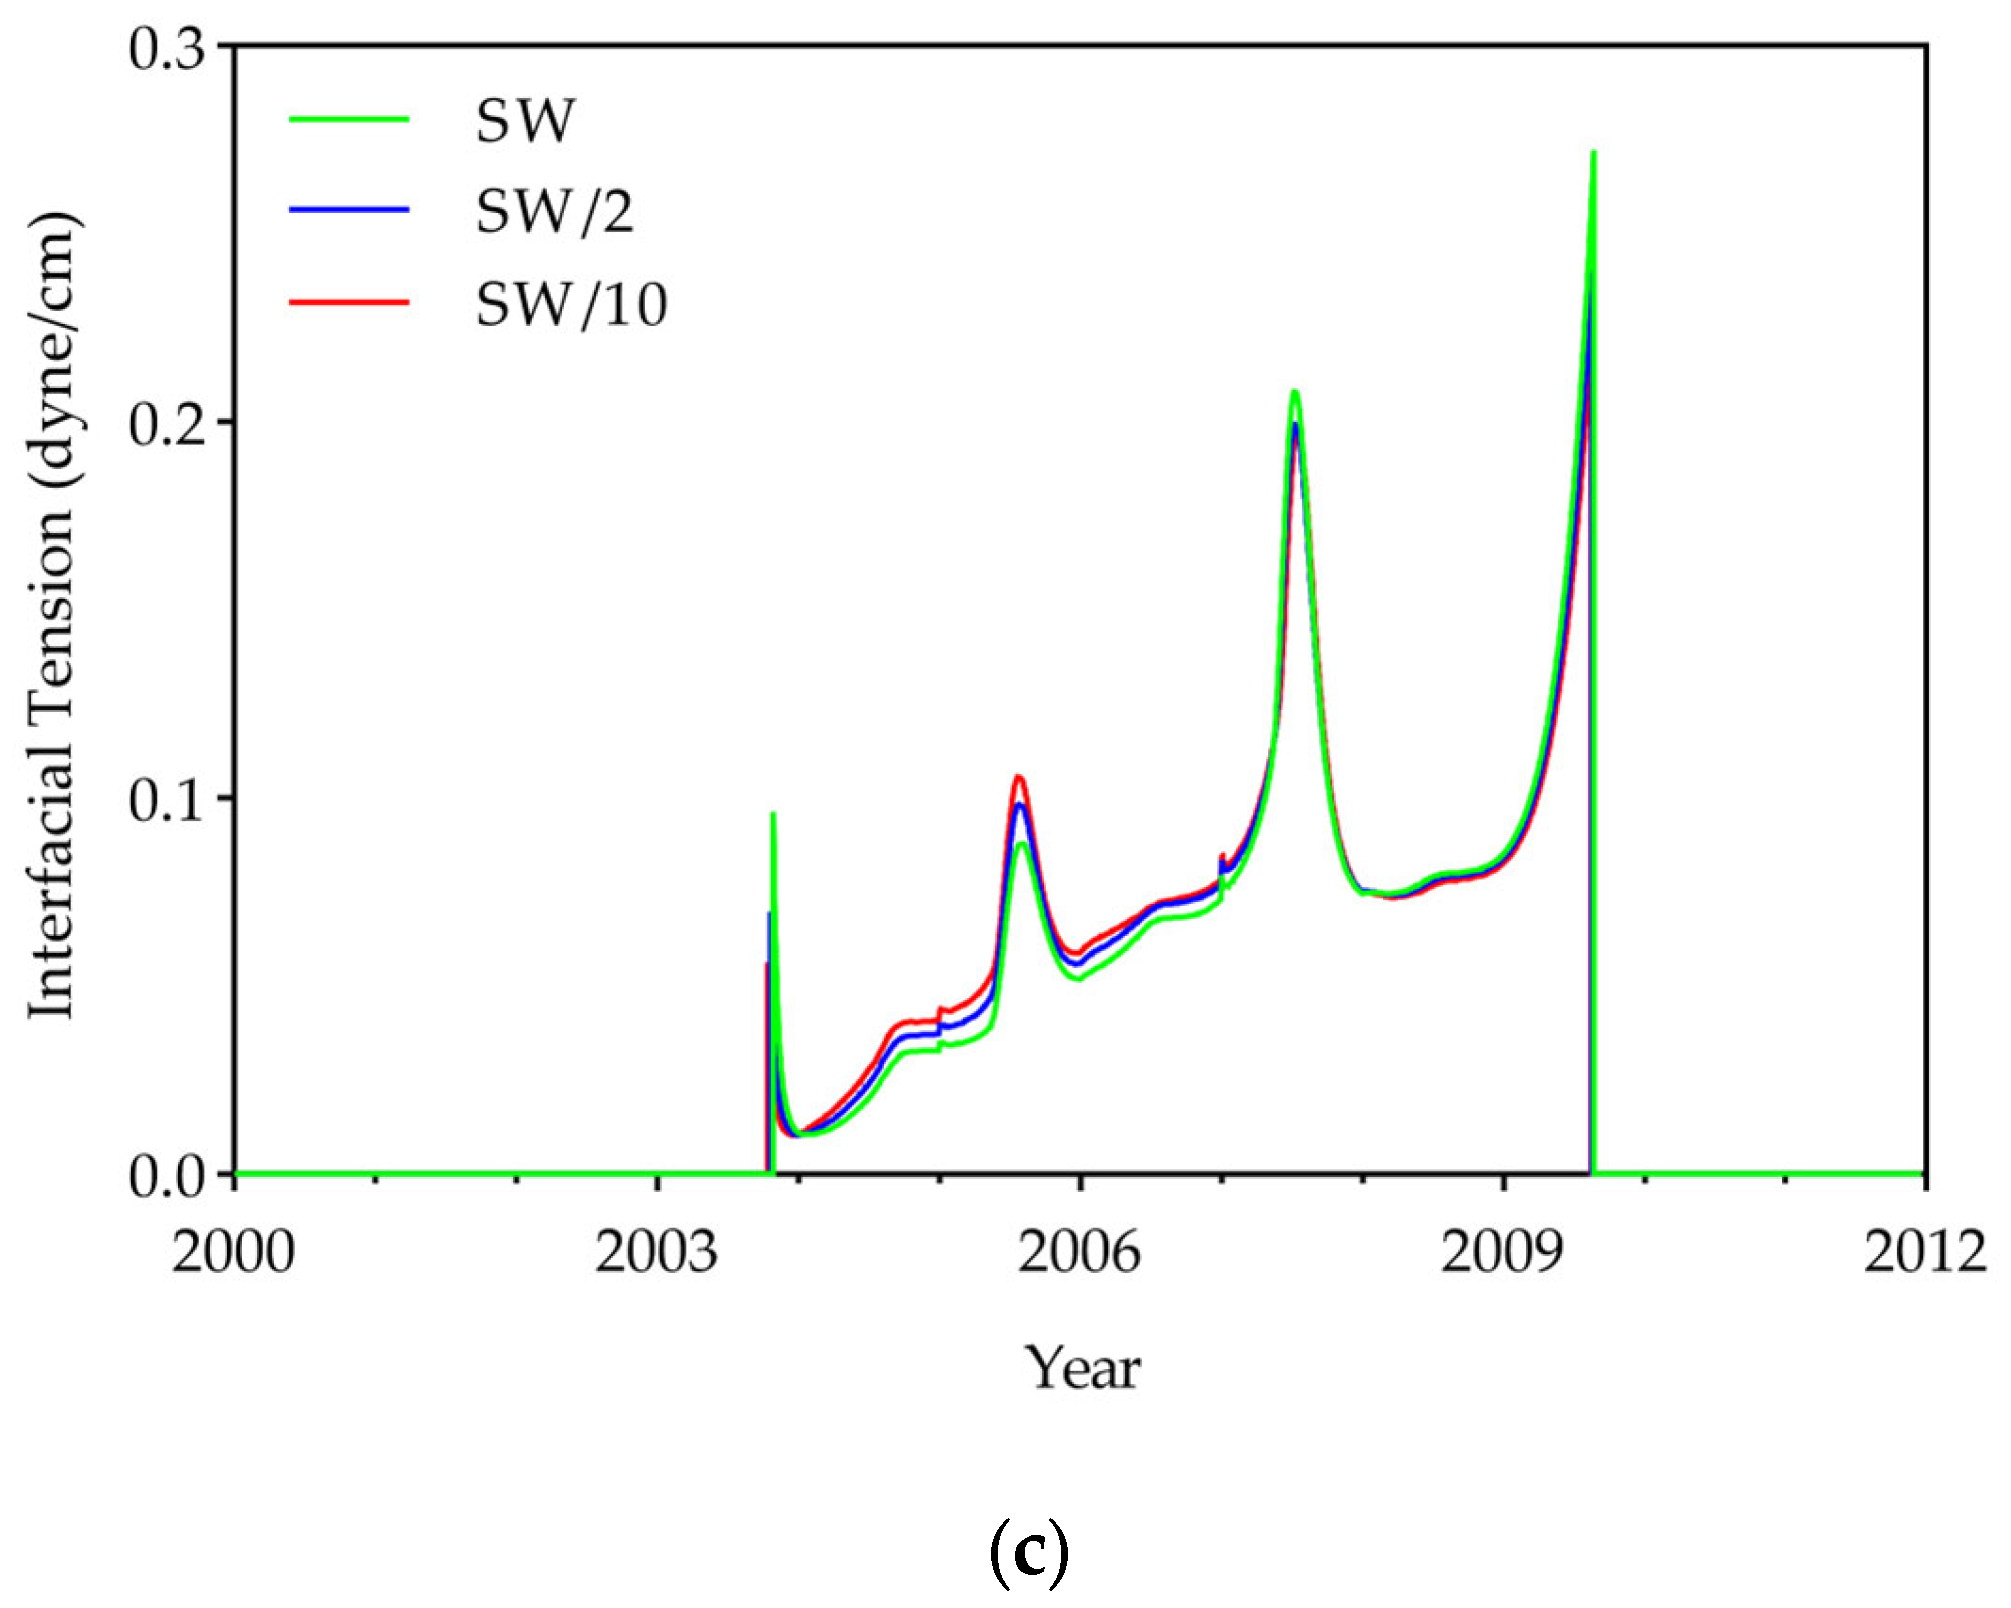
LSWI influences displacement efficiency by reducing the IFT. Tang and Morrow (2002) first reported reduced IFT due to LSW [26]. Subsequent studies have shown that LSW reduces IFT through several mechanisms. Polar organic components (resins and asphaltenes) act as natural surfactants at the oil–water interface, increasing miscibility. The salting-in effect at low salinity enhances the solubility of these organic materials in the aqueous phase. Divalent cations (Mg2+ and Ca2+) form water—soluble complexes with oxygen—containing structures in resins through coordination bonding, transferring polar components into the aqueous phase. Sulfate ions (SO42−) interact with polar oil fractions, reorienting and stabilizing them at the interface to lower interfacial energy. These mechanisms work collectively to alter IFT, with the effect depending on oil composition and aqueous phase [27,28]. The oil used in this study contains 13.2 wt% resins and 4.9 wt% asphaltenes [21], and the brine composition includes divalent cations and sulfate ions, as shown in Table 5. As a result of the interactions between these components, Figure 5 shows that the minimum IFT value after the first contact decreases slightly as the brine becomes more diluted at each DME concentration.
Consequently, LSWI confirmed wettability alteration and slight IFT reduction. As water salinity decreases, water saturation is expected to increase, leading to enhanced oil recovery. However, significant improvement in oil recovery due to IFT reduction is not expected. Furthermore, lower water salinity mitigates the salting-out effect, increasing CO2 solubility in the aqueous phase. This creates a more favorable environment for stable CO2 trapping in the aqueous phase.

3.2. Evaluation of the Incremental Recovery Factor

3.2.1. Sweep Efficiency

The effects of DME content and LSW on sweep efficiency were investigated through simulations using a 2D cross-sectional reservoir model. Figure 6 illustrates the oil viscosity observed with three brines when 0.25 PV of gas was injected. The slope at the front of the swept zone varied depending on the presence of DME and water salinity, with the slope changing significantly with the DME concentration. In the 0% DME case, the slope was 2.4 for all water salinities. In the 10% DME case, the slope was 4, 4.3, and 6 for SW, SW/2, and SW/10, respectively. In the 25% DME case, the slope was 6, 10, and 14 for SW, SW/2, and SW/10, respectively, becoming steeper as water salinity decreased. Table 8 shows the breakthrough date and swept area for all cases. As DME concentration increased, the breakthrough date was delayed, and a larger area was swept. Compared with the 0% DME case, the swept area increased by an average of 4.9% and 8.1% for 10% and 25% DME, respectively. However, variations with water salinity were relatively small. The breakthrough date was delayed as salinity decreased, but the difference was not significant. The change in swept area with varying water salinity was also negligible. For all DME concentrations, the swept area expanded by approximately 0.2% and 0.8% compared with SW for SW/2 and SW/10, respectively.
Overall, the effect of DME on sweep efficiency was dominant, while the LSW effect was minimal. DME delayed gas advancement by reducing CO2 mobility, while simultaneously mitigating the CO2 gravity override problem. Thereby improving volumetric sweep efficiency. These results indicate that adding DME to the CO2 injection process can be effective for improving sweep efficiency.

3.2.2. Displacement Efficiency

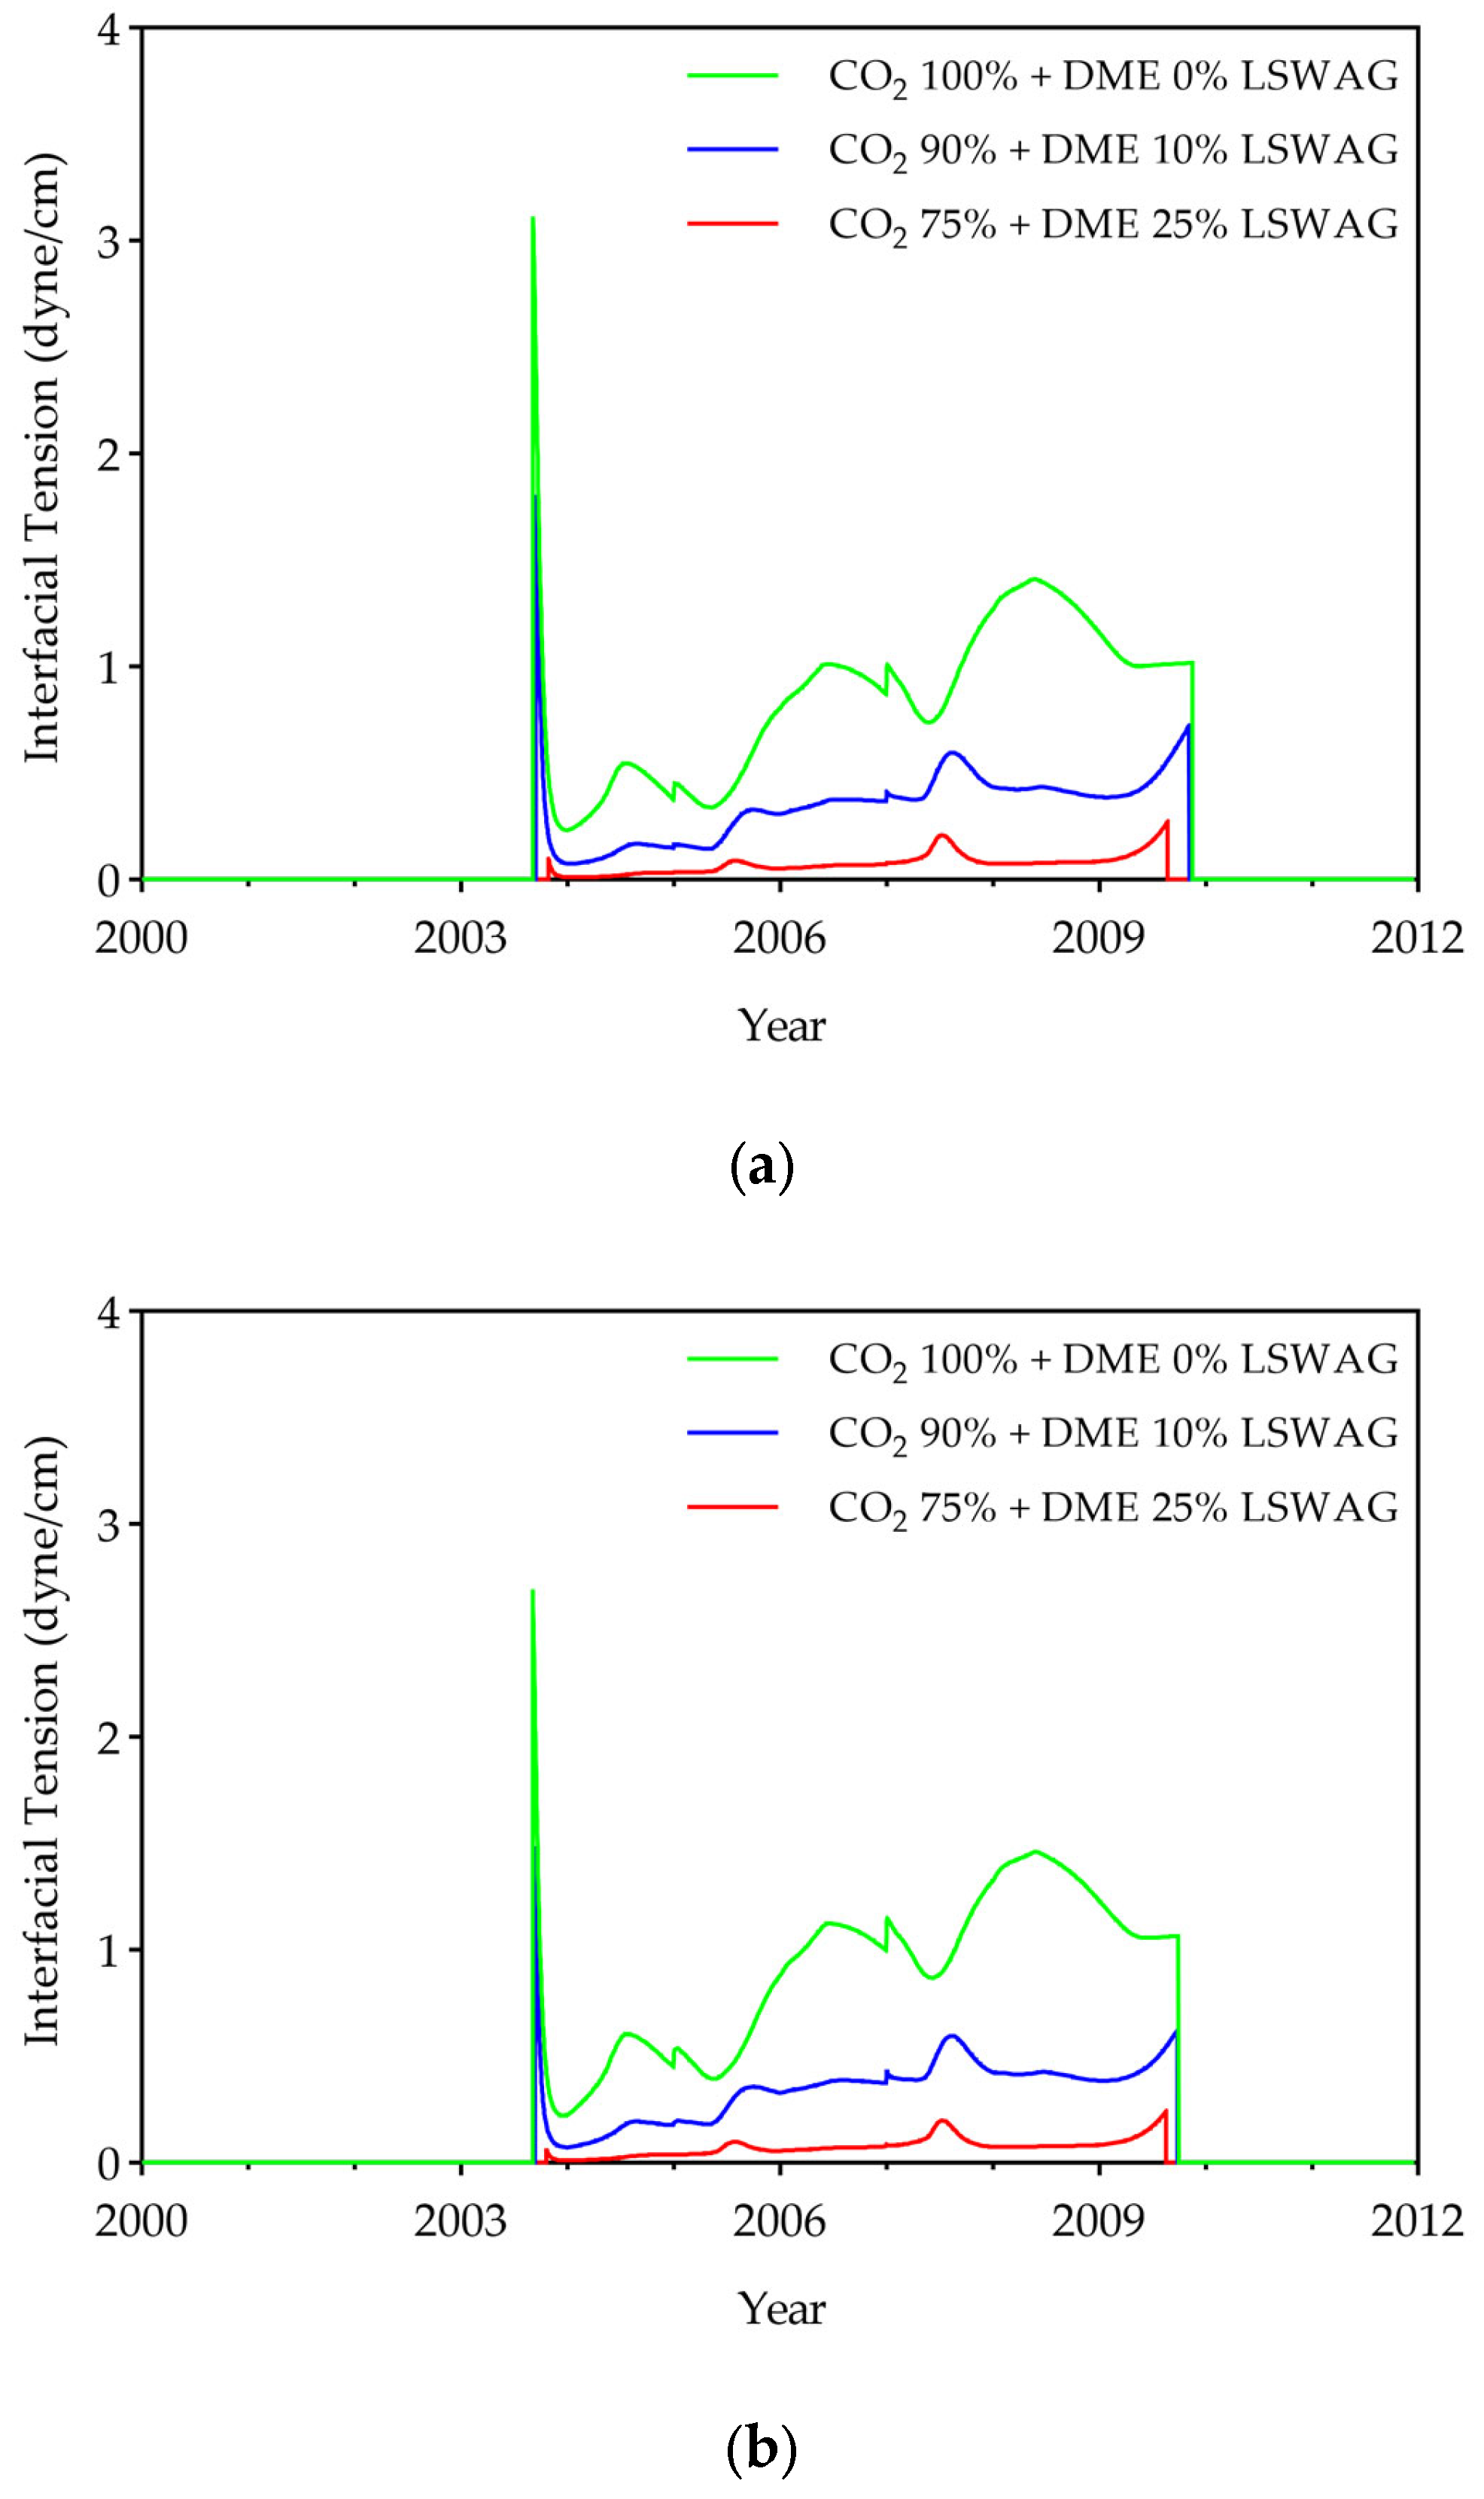
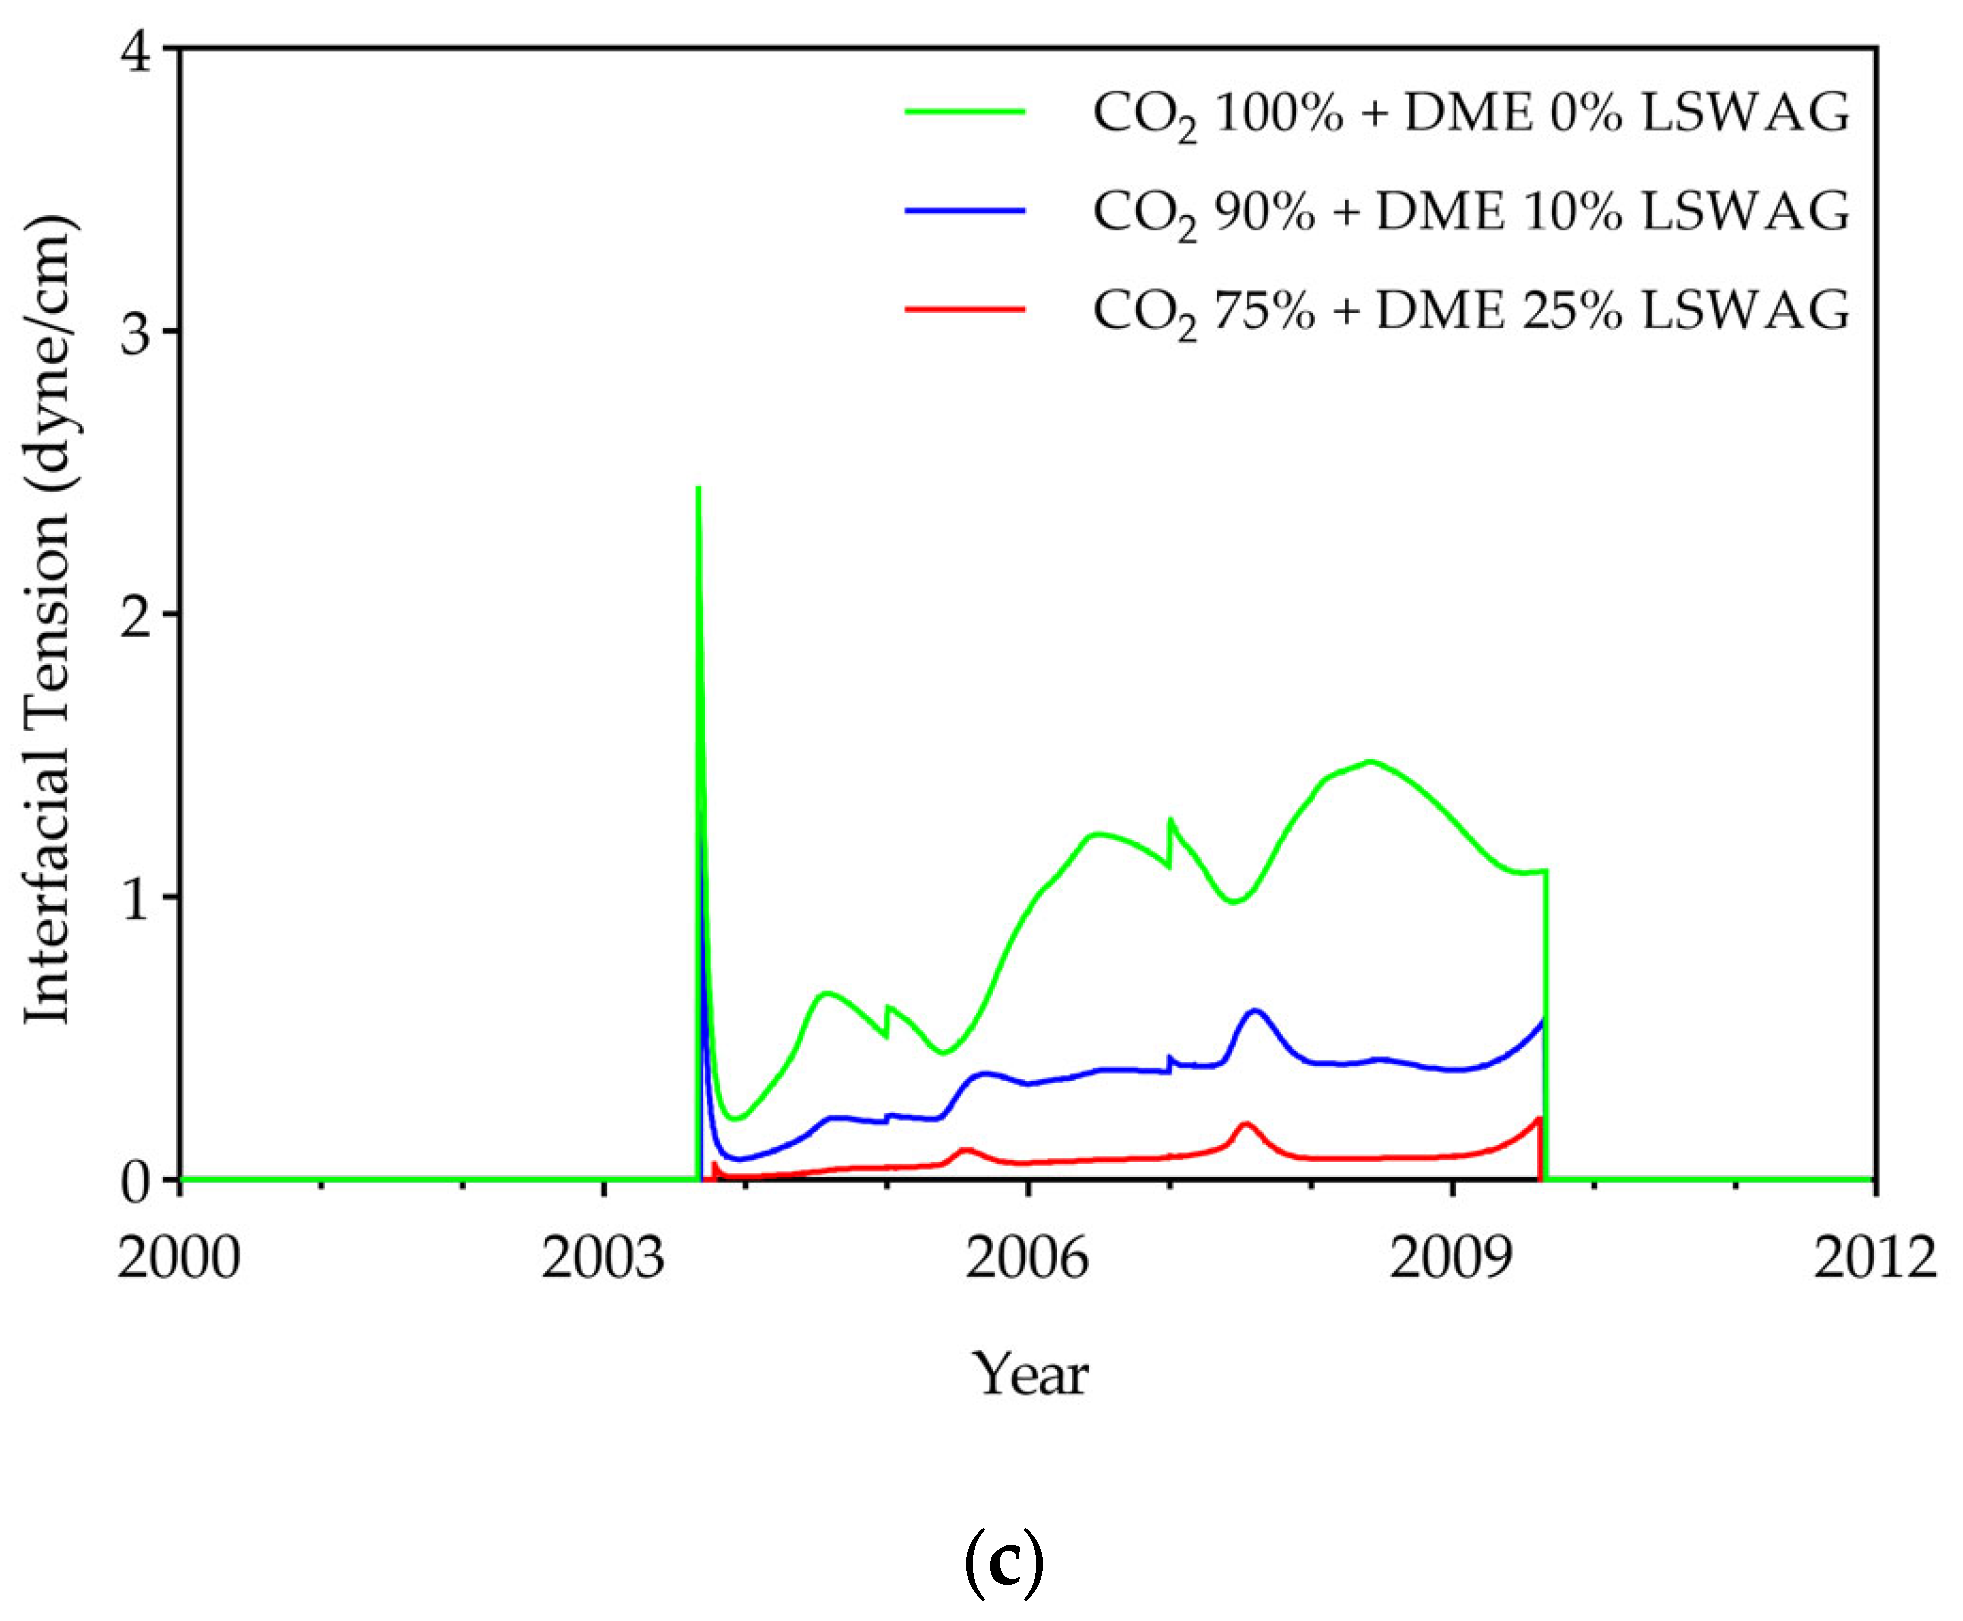
Displacement efficiency was evaluated based on its relationship with IFT, oil viscosity, and displaced oil components. First, both LSW and DME are known to reduce IFT [10,15,26,29]. The effects of utilizing these together were verified through IFT analysis. The IFT calculation results (Figure 7) showed that DME concentration had a dominant effect on IFT reduction compared with LSW. Under SW conditions, the IFT for the 10% and 25% cases decreased by 68% and 95.4%, respectively, compared with the 0% DME case. Under SW/2 conditions, IFT decreased by 67% and 95.3%, respectively, and under SW/10 conditions, it decreased by 66% and 95.2%, respectively. In contrast, when DME concentration was constant, the IFT reduction with varying salinity (SW, SW/2, and SW/10) was insignificant, at approximately 1–7%. This is attributed to the effect of DME being much greater than the effect of salinity reduction. DME is both water- and oil-soluble and effectively reduces IFT. Notably, at 25% DME concentration, the IFT reduction exceeded 95% in all LSW conditions, confirming that the effect of LSW becomes negligible as DME concentration increases. Conversely, in the 0% DME condition, the IFT reduction was relatively significant at 4.5% and 7.0% in the SW/2 and SW/10 conditions, respectively, compared with the SW condition, although the absolute values were very small.
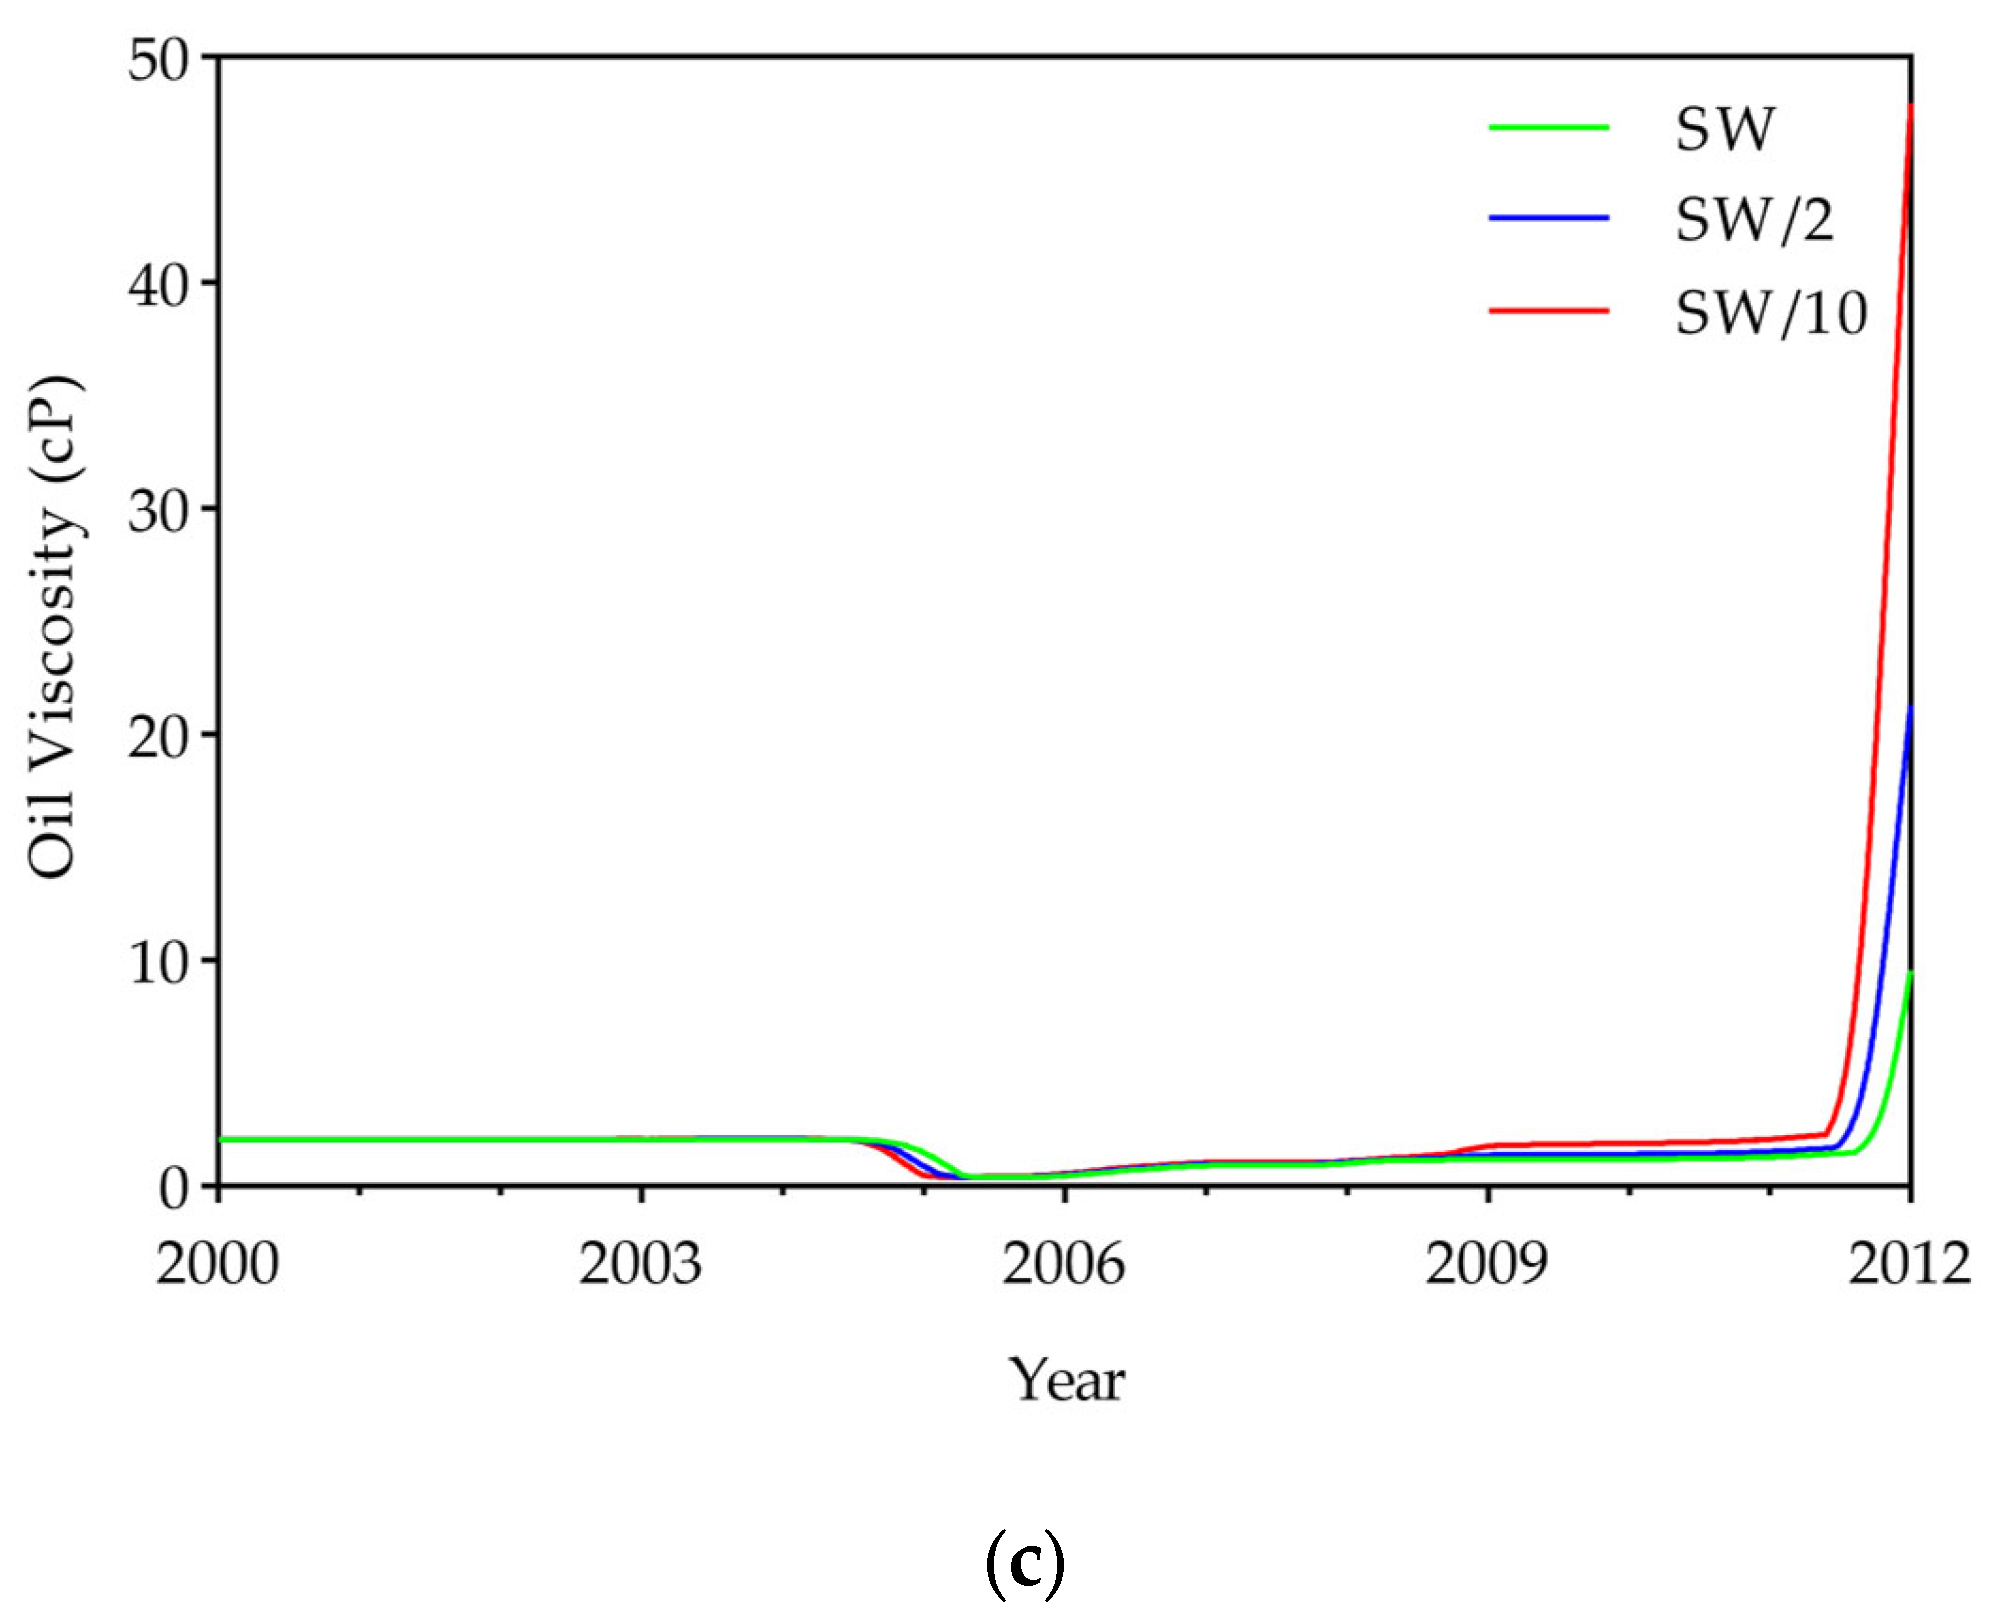
The oil viscosity was analyzed at the reservoir midpoint. As shown in Figure 8, oil viscosity decreased substantially from its initial value of 2.1 cP as DME dissolved in the oil phase. The lowest viscosity values during displacement were 0.54 cP, 0.47 cP, and 0.38 cP for the 0%, 10%, and 25% DME cases, respectively. This indicates that higher DME concentrations led to greater viscosity reduction. Interestingly, while the lowest viscosity value was largely independent of water salinity for a given DME concentration, salinity influenced the time required to reach the lowest viscosity level. Lower salinity water (SW/10) exhibited faster viscosity decline compared with higher salinity water (SW), likely due to enhanced oil mobilization. Figure 8 also reveals that viscosity increased toward the end of displacement in all cases. This phenomenon is attributed to the preferential displacement of lighter hydrocarbon components, which left behind residual oil enriched in heavier hydrocarbon components. To investigate this further, the molar quantities of the oil components were analyzed for each case. The detailed displacement efficiency for each hydrocarbon component is presented in Table 9.
The data clearly demonstrate that both DME and LSW significantly enhance the displacement of intermediate hydrocarbon components. While the 0% DME case showed limited displacement of C6–C28+ components, DME injection extended the effective displacement range to C1–C9 components. Importantly, LSW also substantially increased the displacement of these intermediate components; SW/10 conditions achieved notably higher displacement efficiencies compared with SW across all DME concentrations. The combined effect of DME and LSW resulted in the most extensive displacement of intermediate hydrocarbons. These compositional changes directly explain the post-displacement increase in oil viscosity observed in Figure 8. The preferential extraction of lighter C1–C9 components resulted in residual oil enriched in heavier C10+ components, causing a sharp increase in viscosity. This phenomenon was most pronounced in cases combining 25% DME concentration with SW/10, where nearly complete displacement of light to intermediate components occurred.
Overall, the results demonstrate that displacement efficiency is enhanced through the synergistic effects of DME and LSW. DME provides substantial IFT reduction and oil viscosity decrease, while LSW enhances wettability alteration, facilitating oil mobilization. Together, these mechanisms enable more effective oil displacement.

3.2.3. Oil Recovery

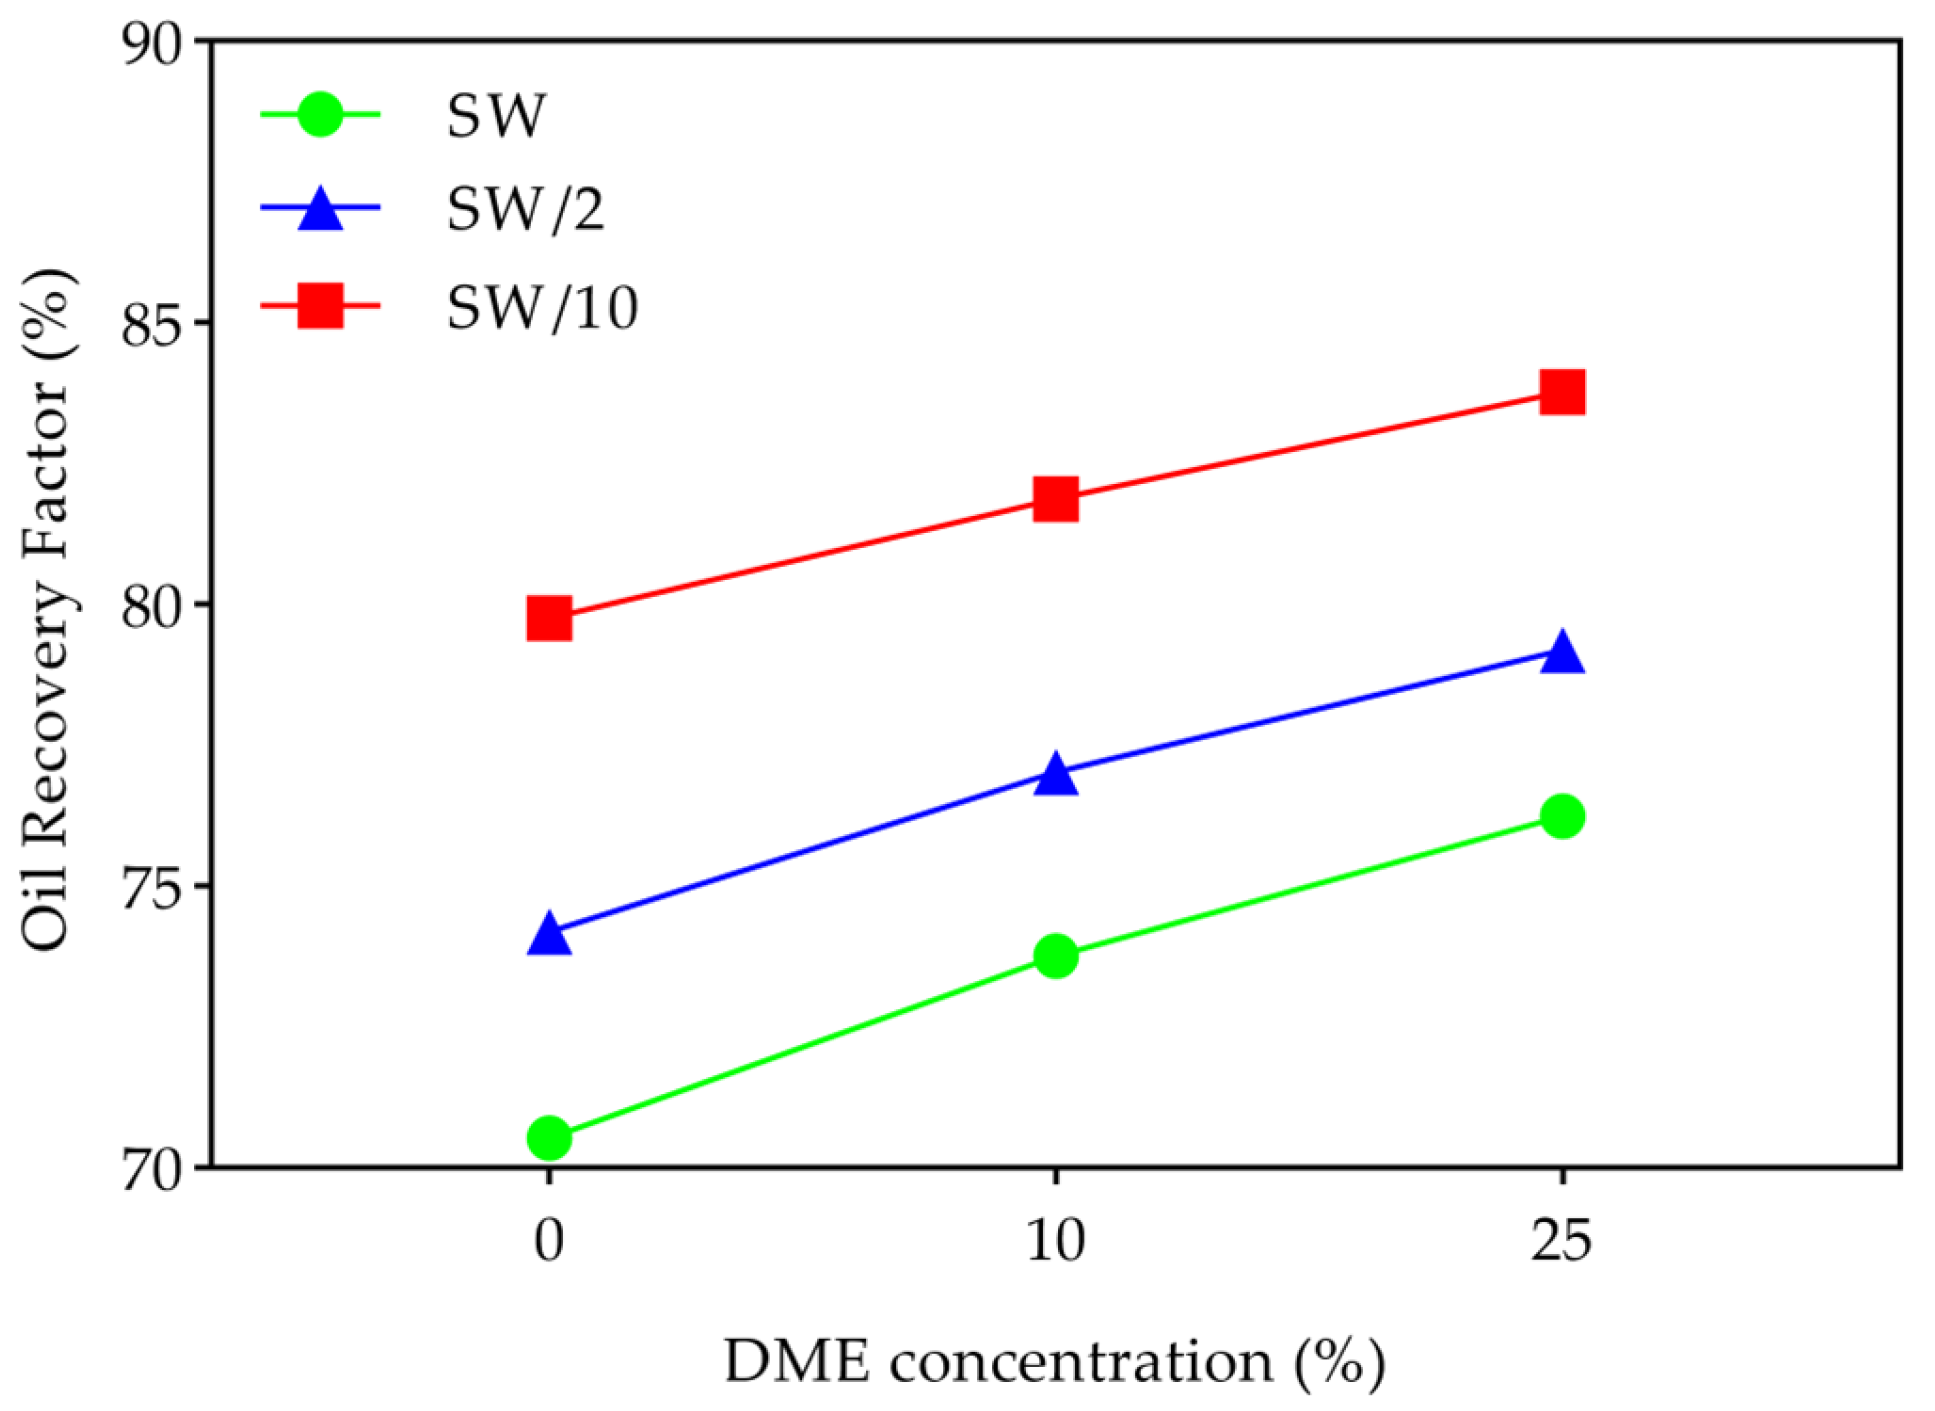
Figure 9 displays the ultimate oil recovery factors for all cases. Within each brine group, the most significant improvement according to DME was observed in high-salinity waters. Compared with the 0% DME case, recoveries in the 10% DME cases increased by 4.6%, 3.8%, and 2.7% for SW, SW/2, and SW/10, respectively, and by 8.1%, 6.7%, and 5.0% for the 25% DME case, respectively. Within each DME concentration group, improved recovery with lower salinity water was observed. Compared with SW, recoveries in SW/2 increased by 5.2%, 4.4%, and 3.9% for the 0%, 10%, and 25% DME cases, respectively, and by 13.1%, 11.0%, and 9.9% for SW/10, respectively. The oil recovery improvement due to DME was highest in the SW injection case. This is because, as water salinity increases, DME becomes less soluble in water and more soluble in oil due to the salting-out effect. These results confirm that DME reduces the effectiveness of LSW. DME, a low-polarity, aprotic organic solvent, selectively associates with water upon contact with brine, separating salt and water [30]. Therefore, the higher the salinity, the more salt remains in the aqueous phase after contact with DME, resulting in lower performance than conventional LSW. For this reason, the oil recovery improvement due to LSW was highest when only CO2 was injected. Overall, these results confirm that the effect of DME was greater in waters with higher salinity, while the effect of LSW was greater at lower DME concentrations.
The overall oil recovery was highest at 83.8% in the 25% DME + SW/10 case, compared with 70.5% in the 0% DME + SW case, representing a 13.3 percentage point improvement. This demonstrates that the combination of DME and LSW produces synergistic effects for oil recovery. Higher DME concentrations and lower water salinity both contribute to enhanced performance. DME-driven improvements in sweep and displacement efficiency and LSW enhanced wettability alteration work together to maximize oil recovery. Specifically, higher DME concentrations increase sweep and displacement efficiency, while lower water salinity enhances wettability alteration—both direct factors affecting oil recovery. Consequently, the optimal combination of high DME concentration with LSW achieves substantially higher recovery than either method alone. Notably, specific DME and brine combinations showed similar oil recovery rates. The combinations of 10% DME + SW and 0% DME + SW/2 yielded similar recoveries at 73.8% and 74.2%, respectively. The combinations of 25% DME + SW and 10% DME + SW/2 yielded similar recoveries at 76.2% and 77.0%, respectively. The combinations of 25% DME + SW/2 and 0% DME + SW/10 were similar at 79.2% and 79.8%, respectively. These results suggest that an economic analysis of the combination of DME concentration and low-salinity water suitable for field conditions is essential.

3.3. CO2 Storage

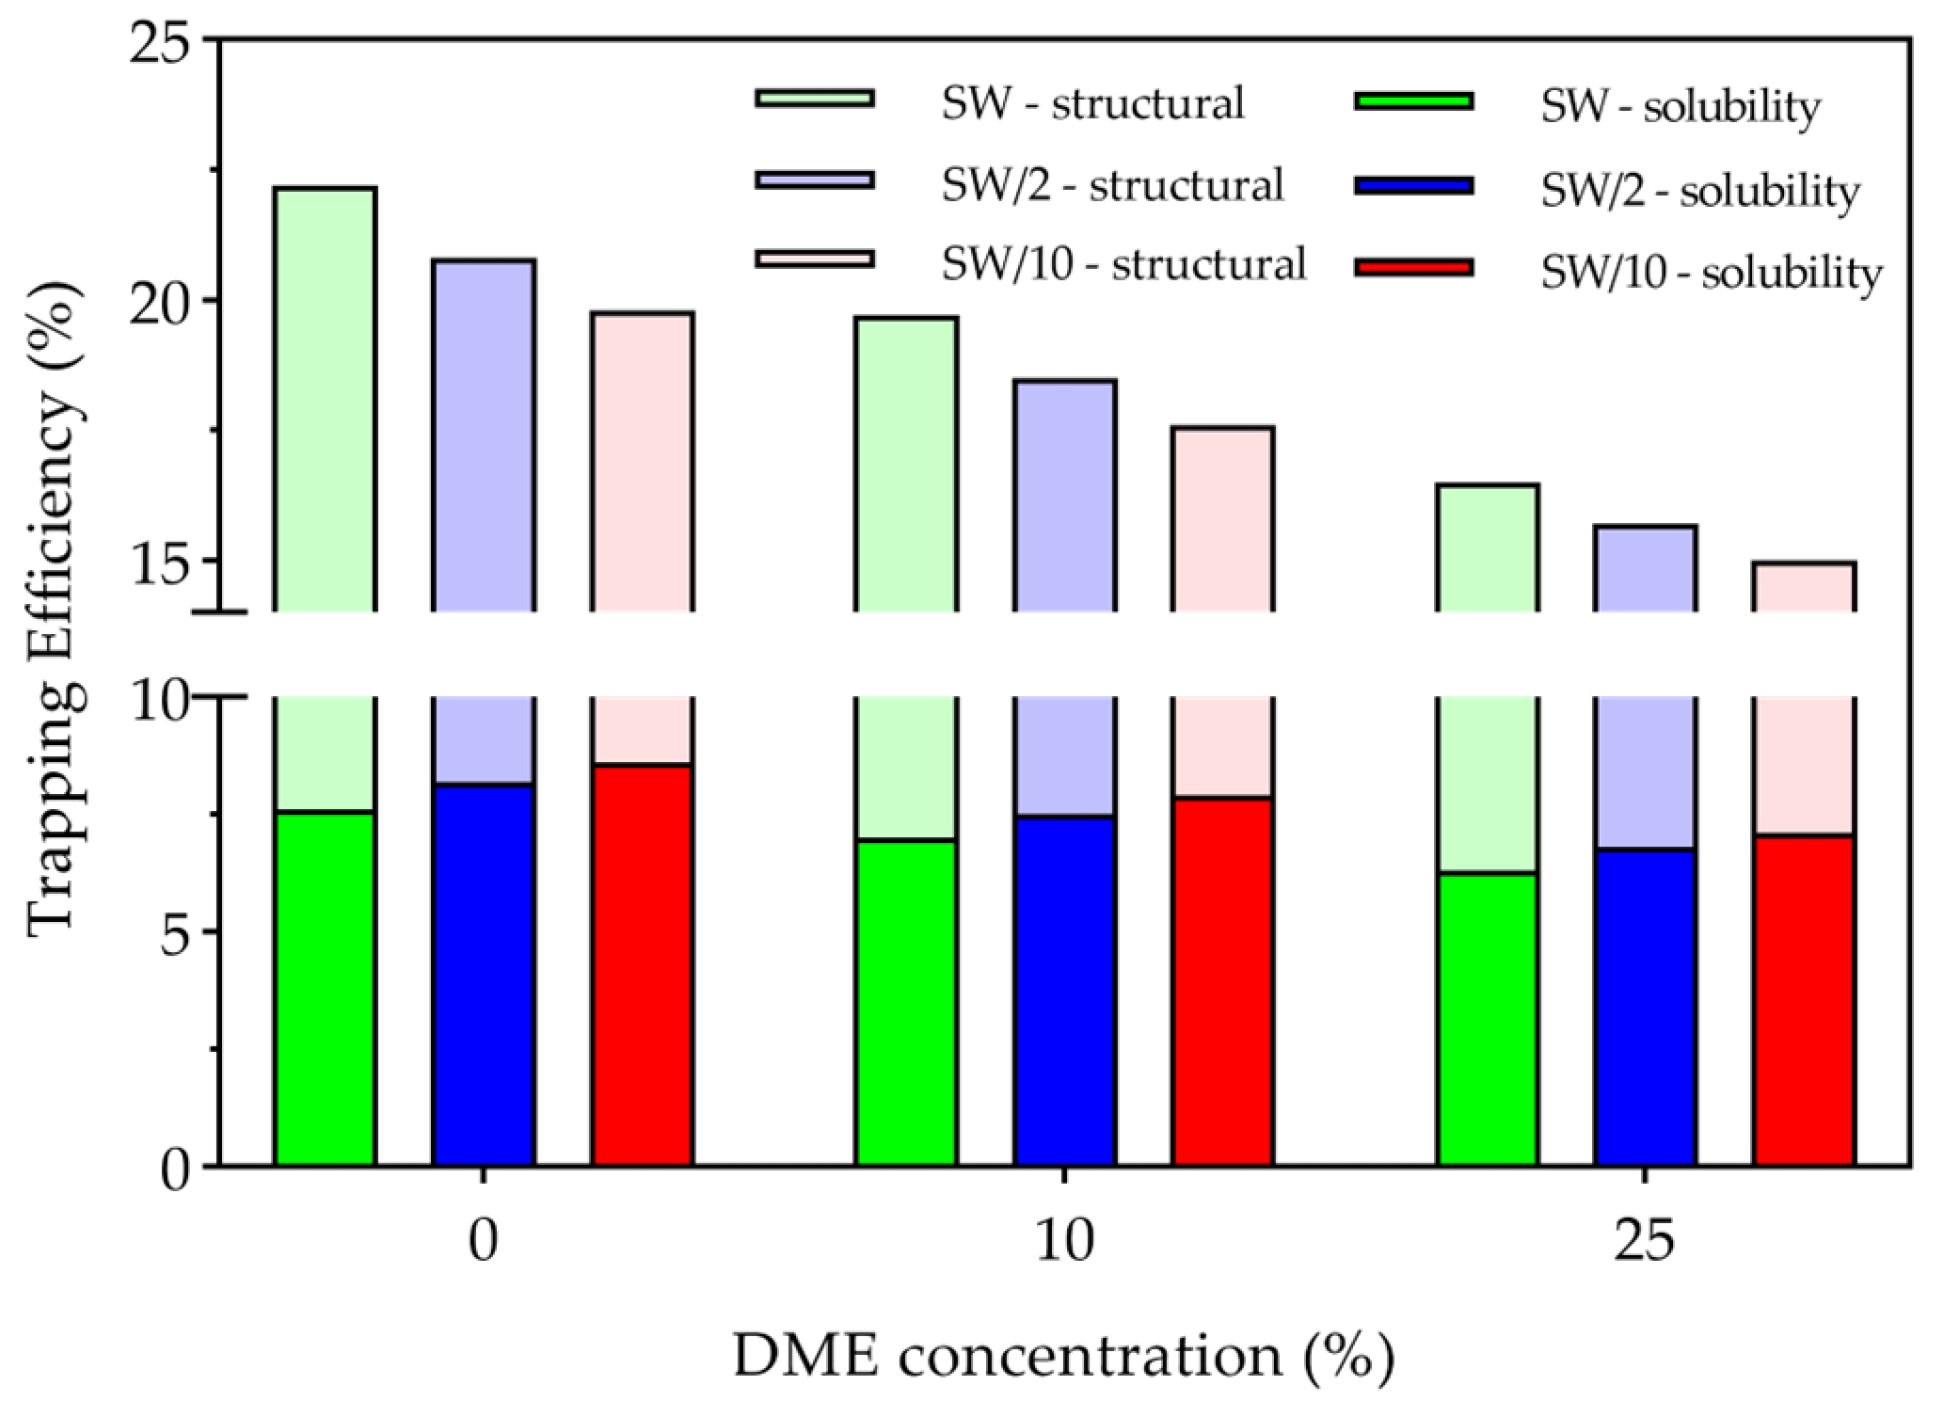
Figure 10 presents the CO2 storage efficiency, defined as the ratio of CO2 stored in the reservoir to the total amount injected. Overall, CO2 storage efficiency decreased as DME concentration increased and increased with water salinity. The low-salinity effect was consistently negative across all cases. The reasons for this result are analyzed in the next section.

3.3.1. Structural Trapping

Structural trapping occurs when CO2 within a reservoir is immobilized in a gaseous or supercritical phase. This typically occurs when caprock, faults, or impermeable formation layers surround the reservoir. When CO2 is injected into a reservoir with an impermeable boundary, it displaces existing fluids within the pores and migrates. Depending on the shape and size of the pores, some CO2 is trapped as droplets [31]. As shown in Figure 10, most of the trapped CO2 exists as a structurally trapped supercritical phase. A trend was observed in which the efficiency of this structural trapping increased with higher water salinity and lower DME concentration. The reasons are as follows. First, lower DME concentrations increase the absolute amount of CO2, which increases structural trapping efficiency. Second, as water salinity decreases, the diminished salting-out effect increases CO2 solubility in the aqueous phase. This enhances solubility trapping, reducing the volume of supercritical phase CO2 available for structural trapping. Third, the three years of waterflooding following the WAG cycle displaces structurally trapped CO2. The efficiency of this displacement is enhanced by lower salinity and higher DME concentration, which contributes to a lower final structural trapping efficiency.

3.3.2. Solubility Trapping

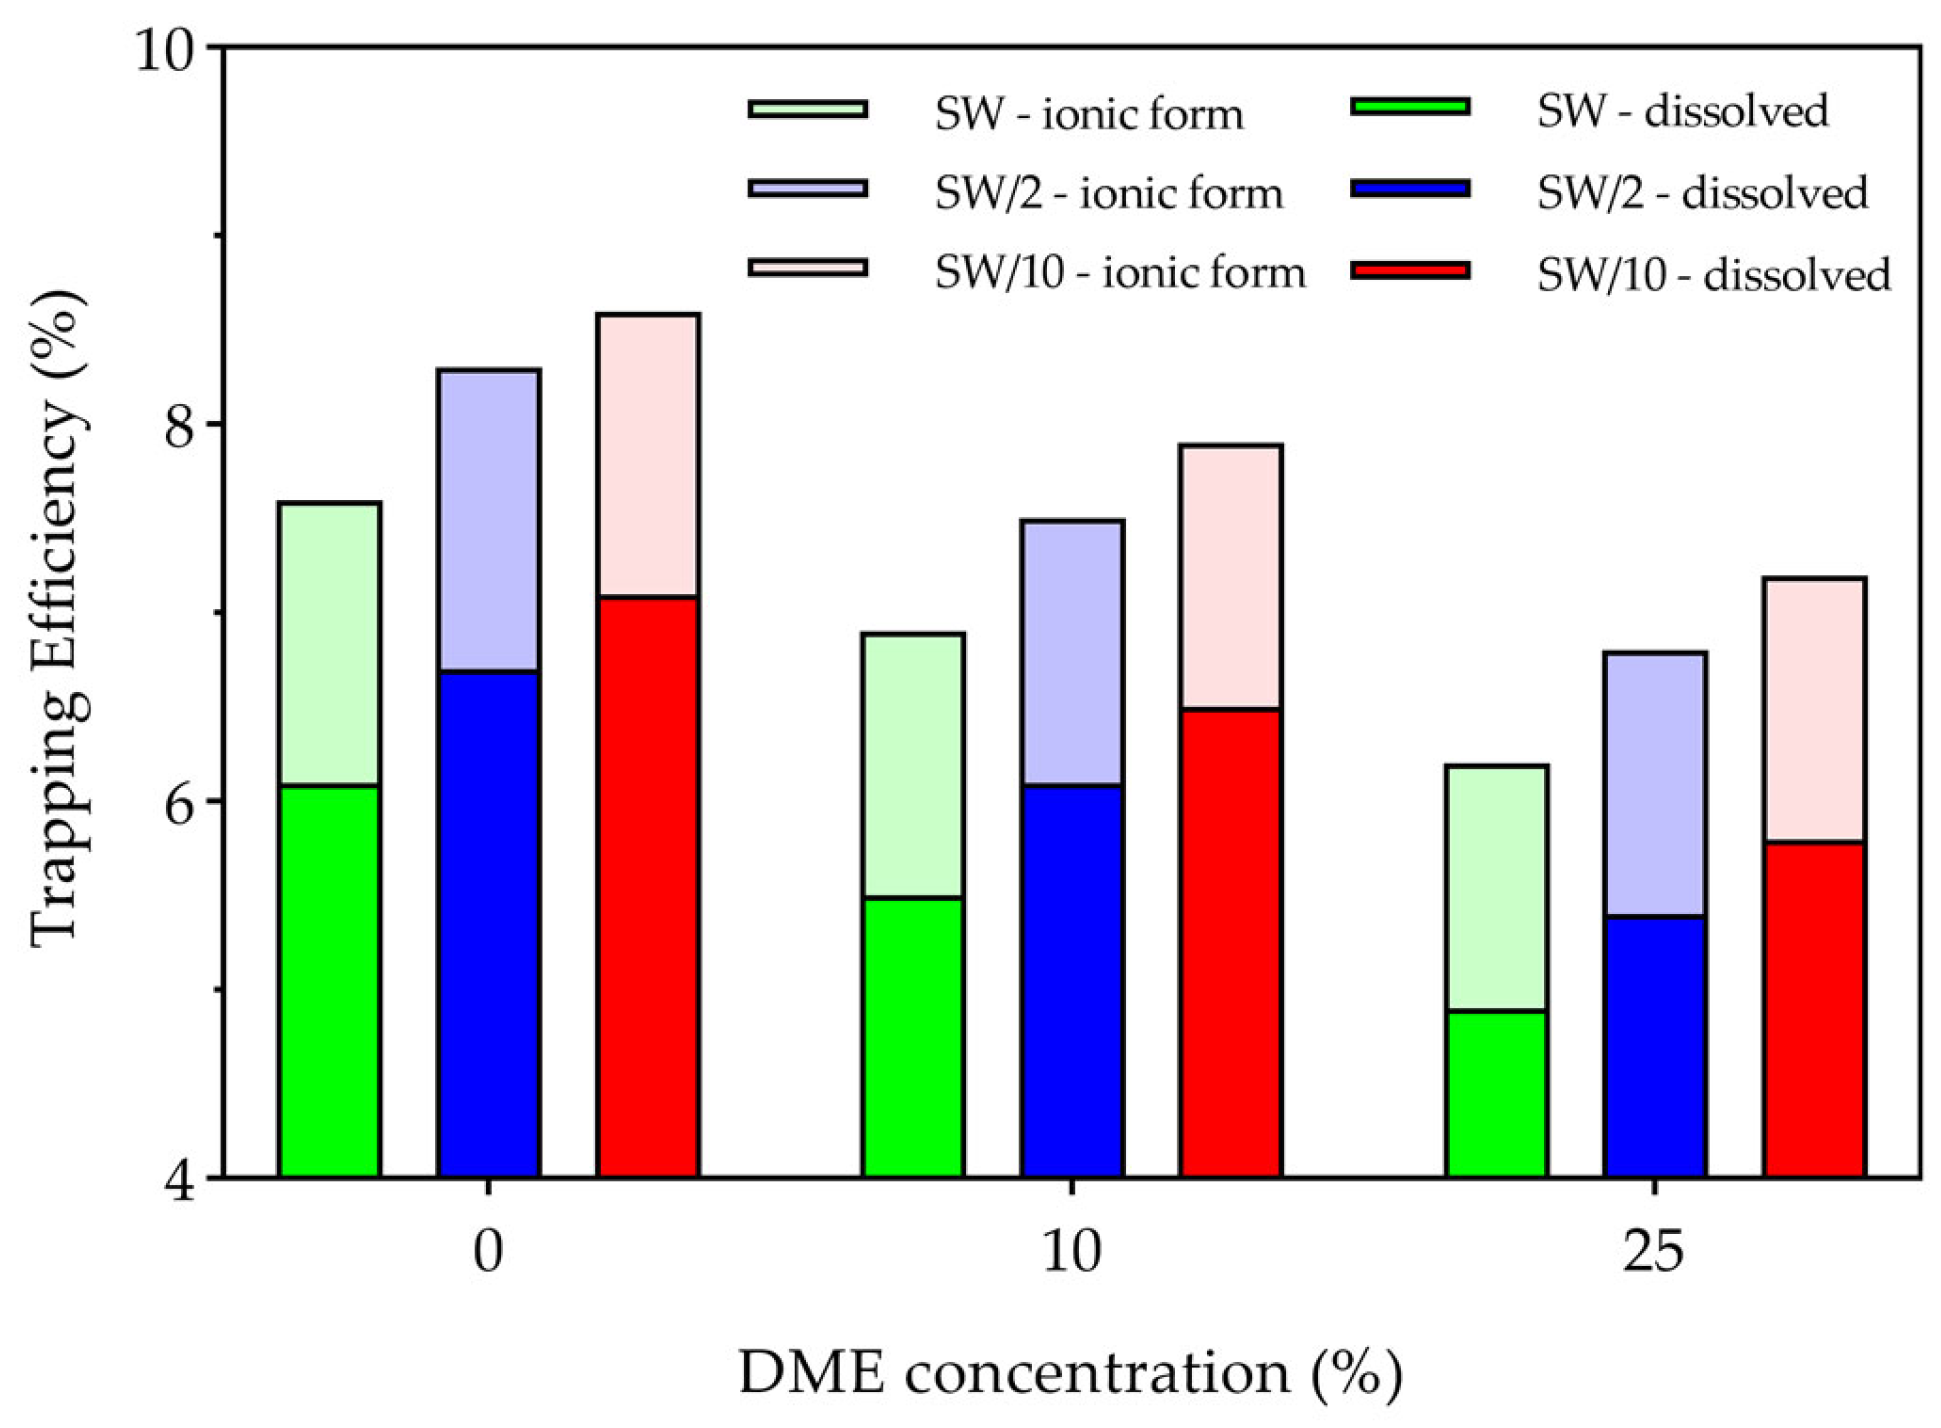
Solubility traps are formed when CO2 dissolves in brine. In this study’s model, solubility was calculated using Henry’s law. When CO2 dissolves in water, it forms weak carbonic acid, which over time decomposes through chemical reactions into H+ and HCO3 ions (Table 1) [31]. Figure 11 displays solubility trapping efficiency for each phase. Because trapping in the ionic form is a very slow process [31], the trapping efficiency in this study was insignificant, at 1.3–1.4%. However, the amount of CO2 dissolved in the aqueous phase decreases as DME concentration increases. Trapping of CO2 in the aqueous phase is governed by thermodynamic effects. Thermodynamically, higher DME concentrations lower the partial pressure of CO2, reducing its solubility. This negative effect is counteracted at lower salinities because the reduced salting-out effect increases CO2 solubility in the aqueous phase, and water saturation increases as salinity decreases.

3.3.3. Sensitivity Analysis

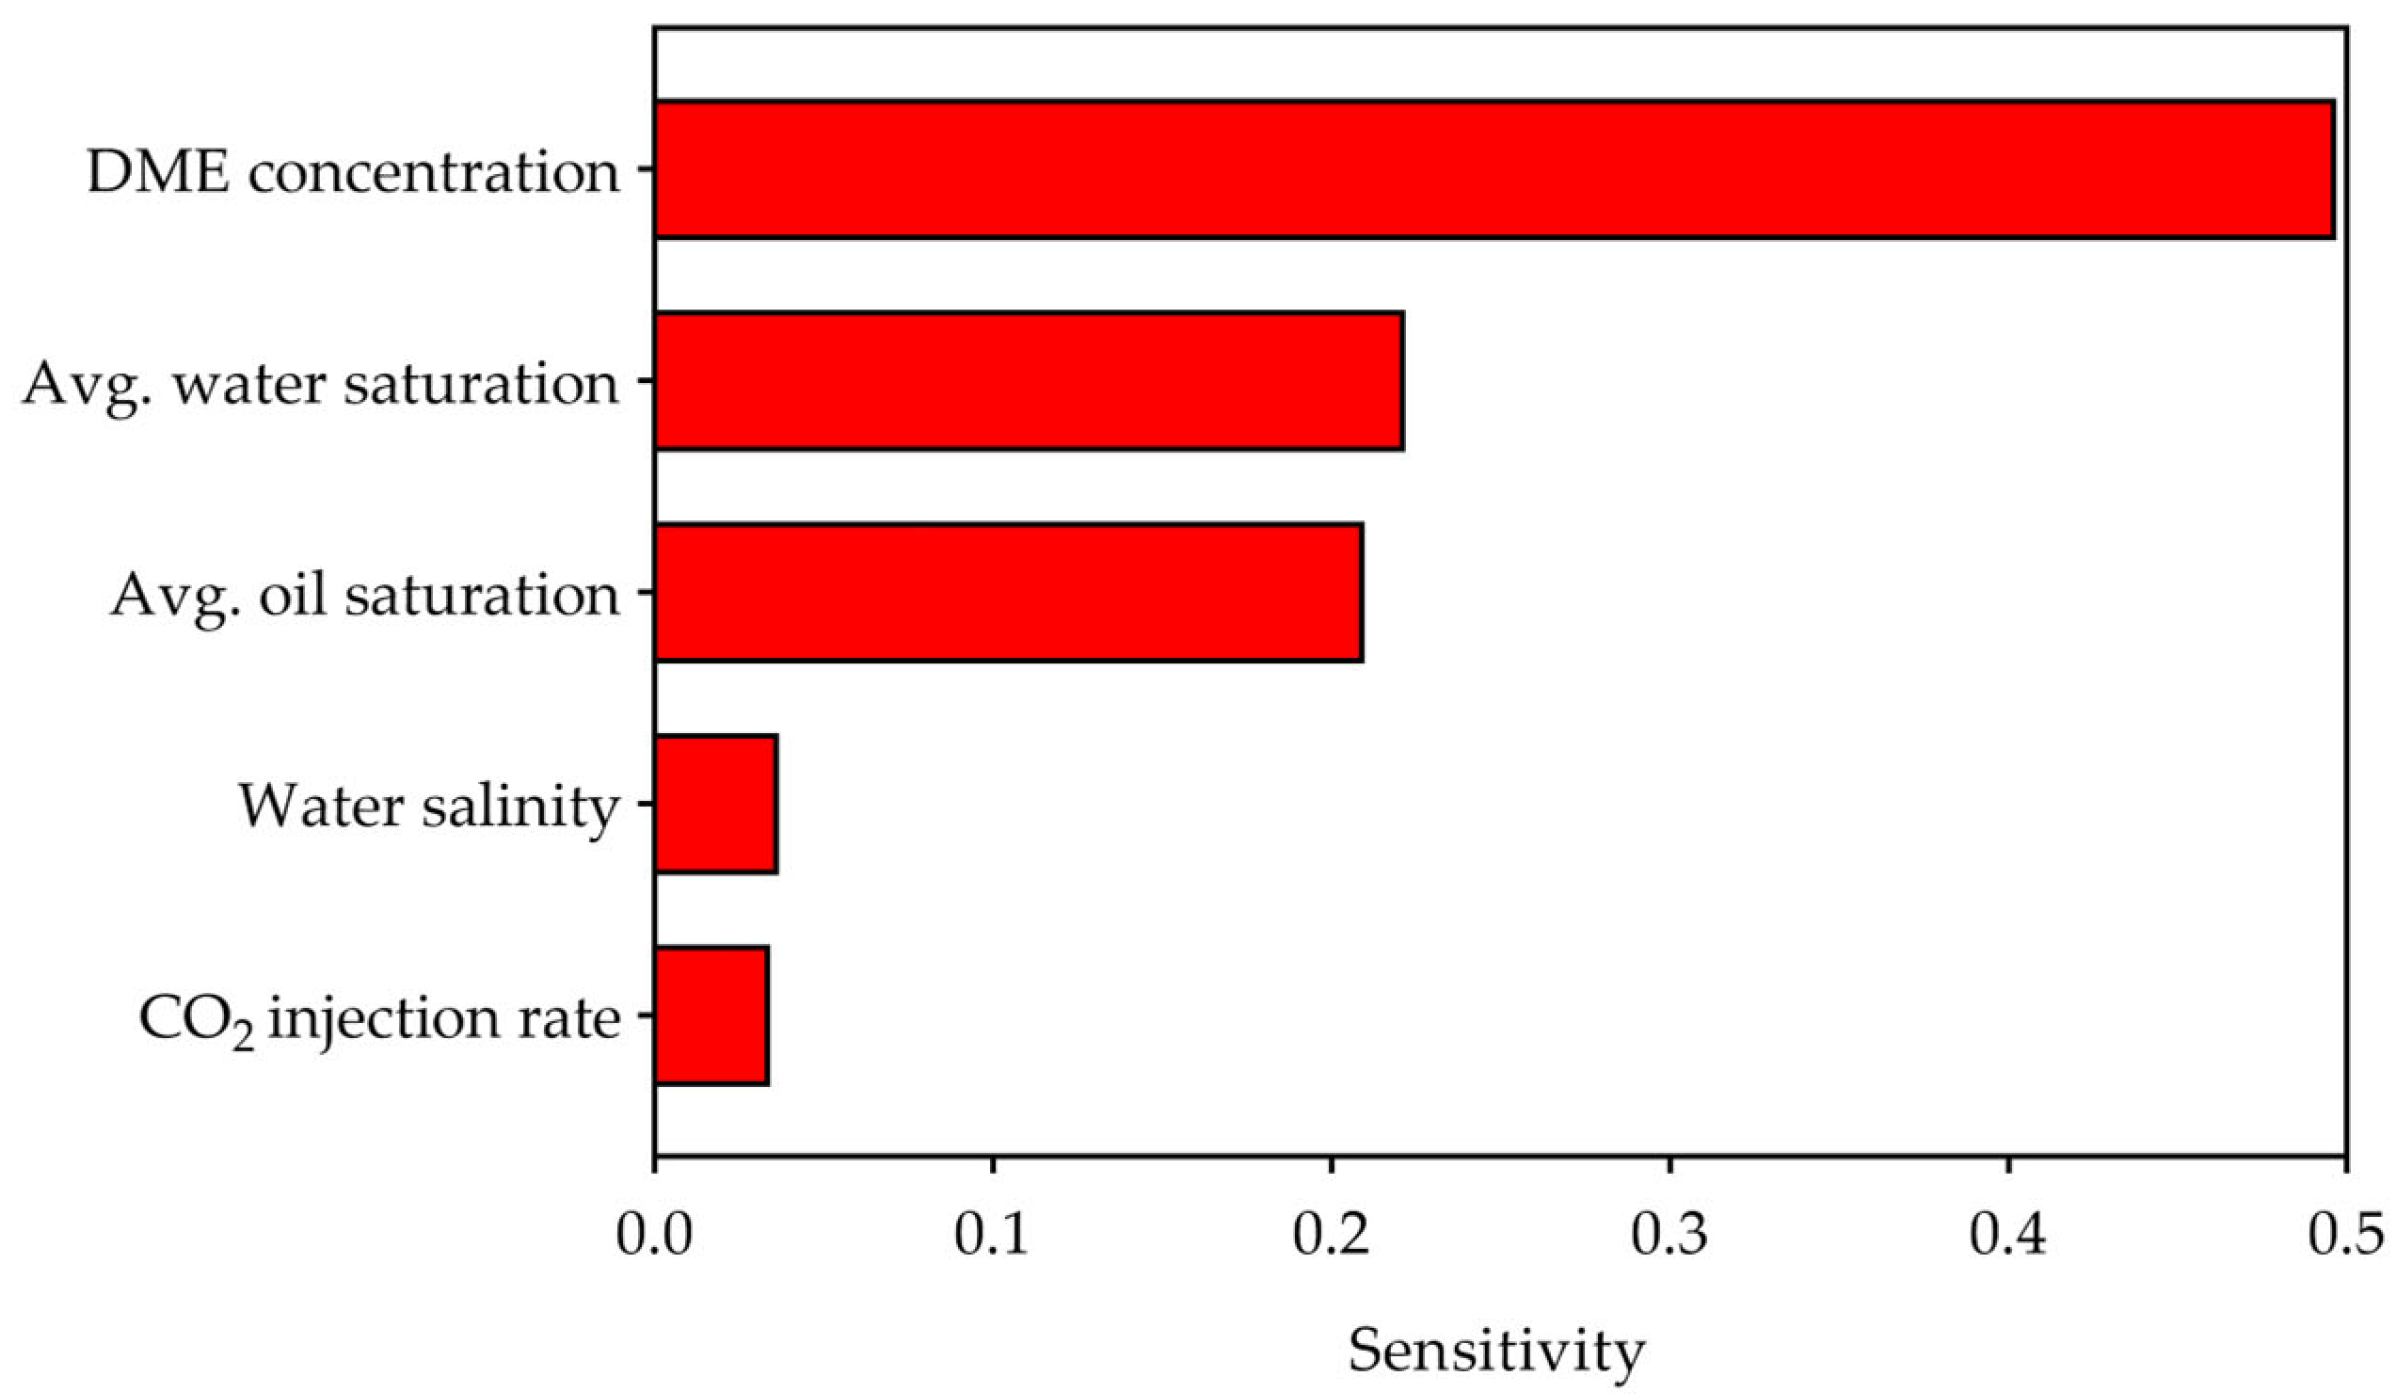
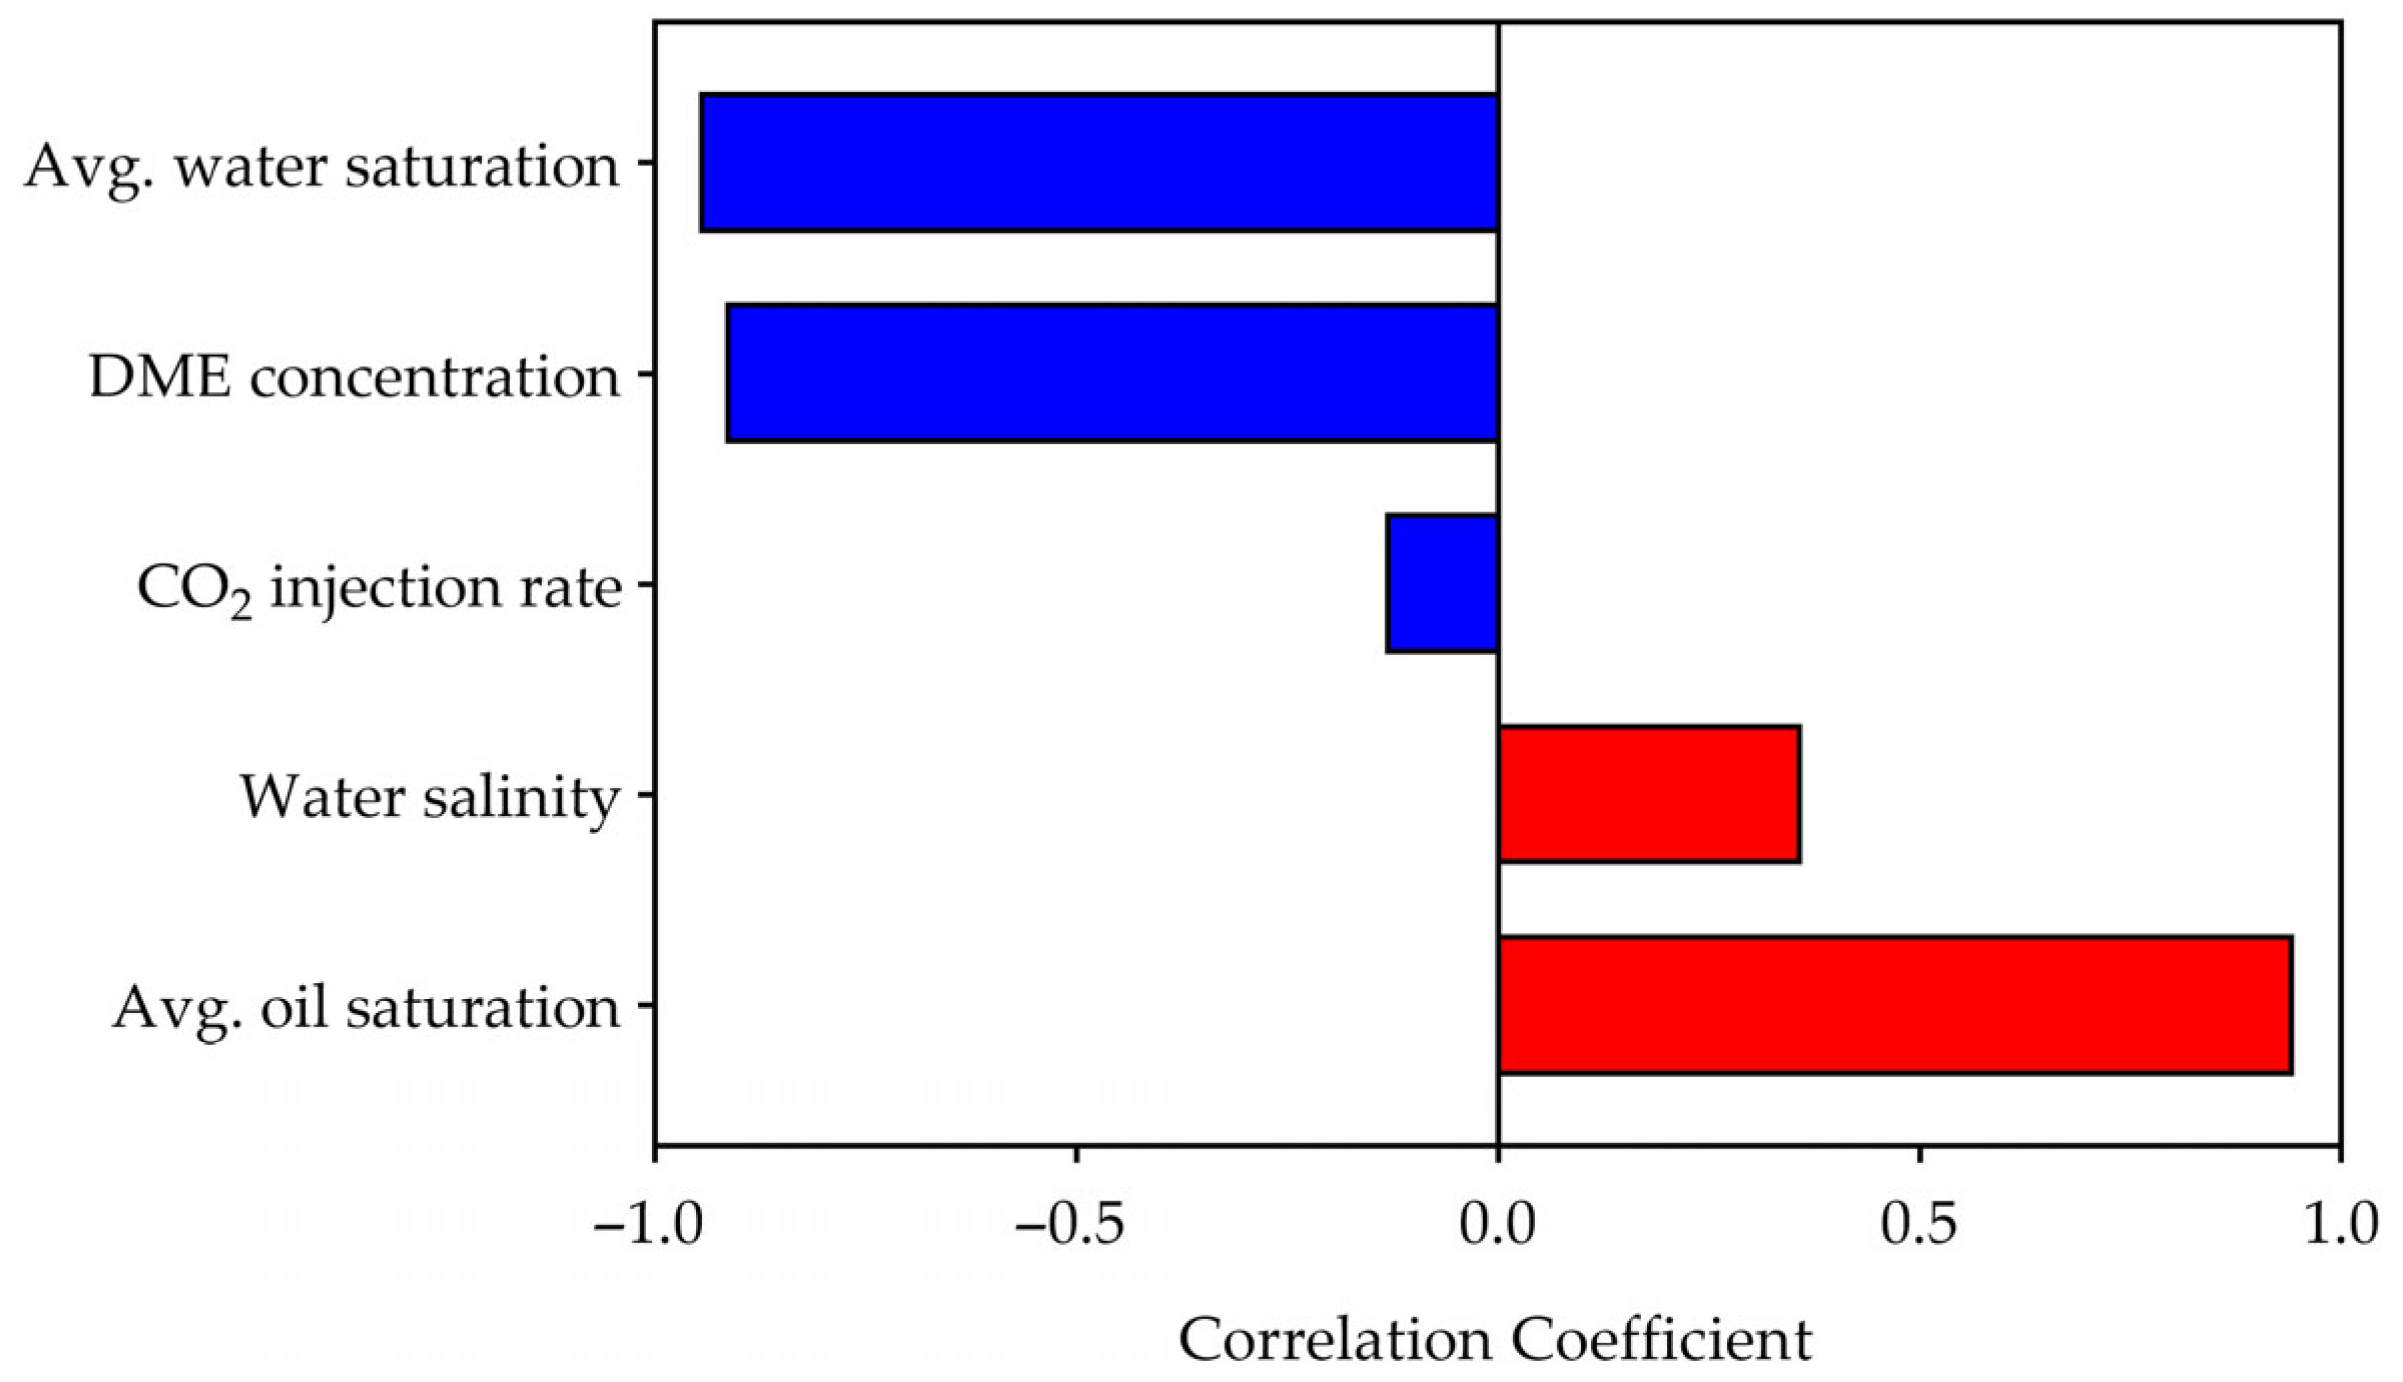
To quantitatively assess the factors controlling CO2 storage efficiency, a machine learning–based sensitivity analysis and correlation analysis of the simulation results were conducted. The random forest regression revealed that DME concentrations were the most influential parameter (sensitivity = 0.50), followed by average water saturation (0.22), average oil saturation (0.21), water salinity (0.04), and CO2 injection rate (0.03), as shown in Figure 12. Notably, water salinity and CO2 injection rate showed relatively low importance.
The correlation analysis of CO2 storage efficiency provides validation of the sensitivity rankings (Figure 13). The DME concentration exhibits the strongest negative correlation with CO2 storage efficiency (r = −0.92), directly confirming its role as the primary factor opposing sequestration objectives. This dominant influence aligns perfectly with its highest sensitivity score in Figure 12, confirming that DME concentration is a critical control parameter. Interestingly, average water saturation and average oil saturation show strong correlations of similar magnitude but in opposite directions. Average oil saturation has a strong positive correlation (r = 0.90), and average water saturation has a strong negative correlation (r = −0.90). This indicates that both variables significantly affect CO2 storage, but in opposing manners. On the other hand, the results from the sensitivity analysis for water salinity and CO2 injection rate are consistent with the results of the correlation analysis, which show a weak positive correlation and a negligible negative correlation, respectively. This analysis suggests that these variables play a secondary role behind the more dominant factors of DME concentration and water saturation.
This integrated analysis offers a thorough understanding of both the magnitude and direction of each input variable’s effect on the outcome. The findings of this study quantitatively demonstrate that DME concentration is the most critical control factor, followed by oil and water saturation.

4. Conclusions

To reduce operating costs and enhance oil recovery in existing CO2/DME-WAG studies, the synergistic effects of injecting seawater and low-salinity water were compared and analyzed against the conventional CO2-LSWAG process. The results revealed that sweep and displacement efficiency, oil recovery factor, and CO2 storage capacity vary with DME concentration and water salinity. The main conclusions of this study are as follows:
(1)
Simulations showed that DME addition substantially improved volumetric sweep, increasing the swept area by 5–8% depending on concentration, while LSW effects were negligible (<1%). The improvement in sweep efficiency was accompanied by changes in the displacement front. The slope of the swept front gradually steepened with increasing DME concentration. The slope increased from 2.4 for the 0% DME case to 4–6 for the 10% DME case and 6–14 for the 25% DME case, with the slope being steeper in lower-salinity water. This steeper front and delayed breakthrough date suggest that DME improved sweep efficiency by reducing CO2 mobility and mitigating gravity override. These results demonstrate that DME injection effectively addresses the primary limitation of CO2-EOR—poor sweep efficiency—making it a promising strategy for enhanced oil recovery.
(2)
To evaluate displacement efficiency, IFT, oil viscosity, and the displacement efficiency of hydrocarbon components were investigated. Results showed that DME concentration dominates IFT reduction (up to 95% at 25% DME), while LSW effects were relatively small (<7%). DME also substantially reduced oil viscosity from 2.1 cP to a minimum of 0.38 cP, with LSW accelerating this reduction through enhanced mobilization. Compositional analysis revealed that both DME and LSW significantly enhanced the displacement of hydrocarbon components (C6+), with their combined application yielding the most extensive extraction. These findings demonstrate that DME in low salinity conditions improves displacement efficiency.
(3)
Oil recovery increased from 70.5% (in the 0% DME + SW case) to 83.8% (in the 25% DME + SW/10 case), demonstrating the significant advantages of using DME and LSW together. Both factors contributed through distinct mechanisms—DME enhanced sweep and displacement efficiency, while LSW promoted wettability alteration. However, their interaction showed asymmetric patterns due to salting-out effects. The benefits of DME dominated in high-salinity conditions, while LSW’s benefits were strongest at low DME concentrations. Equivalent recoveries achieved through different combinations highlight optimization opportunities.
(4)
Structural trapping, which constituted the majority of stored CO2, was enhanced in higher salinity water and lower DME concentrations through three mechanisms: first, higher absolute amounts of CO2 at lower DME concentrations; second, reduced CO2 dissolution in the aqueous phase due to stronger salting-out effects at higher salinity water; and third, less efficient displacement of structurally trapped CO2 during the three years of waterflooding after the WAG cycle. Conversely, solubility trapping decreased with increasing DME concentrations due to reduced CO2 partial pressures, though this effect was partially offset by enhanced CO2 solubility at lower salinity.
(5)
Correlation analysis for CO2 storage efficiency revealed that DME concentration is the dominant controlling factor, showing a strong negative correlation (r = −0.92) with storage efficiency. Machine learning-based sensitivity analysis confirmed DME as the most influential parameter (sensitivity = 0.50), followed by water saturation (0.22) and oil saturation (0.21), while water salinity (0.04) and CO2 injection rate (0.03) had minimal influence. Storage efficiency decreased with increasing DME concentration but increased with higher water salinity, driven by competing trapping mechanisms.
This process exhibited a phenomenon by which the CO2 storage performance deteriorated in conditions that increased the oil recovery factor. Therefore, careful balancing of conflicting objectives is necessary when applying this process, considering field conditions. Future studies could optimize the concentrations of DME and LSW to achieve these objectives and conduct an economic analysis that considers the potential for reuse through DME recovery.

Author Contributions

Conceptualization, K.S.L. and Q.L.; methodology, Y.S. and K.S.L.; software, Y.S.; validation, B.K. and L.W.; formal analysis, K.S.L. and Q.L.; investigation, Y.S.; resources, B.K.; writing—original draft preparation, Y.S.; visualization, Y.S.; supervision, K.S.L. and Q.L.; project administration, K.S.L. All authors have read and agreed to the published version of the manuscript.

Funding

This research received no external funding.

Data Availability Statement

The original contributions of this study are included in the article. Further inquiries can be directed to the corresponding author.

Conflicts of Interest

The authors declare no conflicts of interest.

Abbreviations

The following abbreviations are used in this manuscript:
CO2Carbon dioxide
CMGComputer Modeling Group
DMEDimethyl Ether
EOREnhanced Oil Recovery
EOSEquation Of State
IFTInterfacial Tension
LSWLow-Salinity Water
LSWILow-Salinity Water Injection
LSWAGLow-Salinity Water-Alternating Gas
PRPeng–Robinson
PVPore Volume
SWSeawater
SW/2Twice-diluted Seawater
SW/10Ten-times-diluted Seawater
WAGWater-Alternating Gas
Symbol
a ,   b EOS model parameters
a i ˙ Dimensionless parameter
α Reaction
A ,   B ,   b i ˙ Temperature-related parameters
f Fugacity
H Henry’s constant
H * Henry’s constant at reference pressure
i Component
i Ion
K Equilibrium constant value
k r Relative permeability
γ Activity coefficient
m Molality
N a q Total component number in the aqueous phase
N c The number of soluble hydrocarbon components
p Pressure
p * Reference pressure
Q Activity product
R Universal gas constant
T Temperature
v Molar volume
v i α Stoichiometric coefficient
v ¯ i Partial molar volume
y Mole fraction

References

  1. Campbell, B.T.; Orr, F.M. Flow visualization for CO2/crude-oil displacements. SPE J. 1985, 25, 665–678. [Google Scholar] [CrossRef]
  2. Hustad, O.S.; Holt, T. Gravity Stable Displacement of Oil by Hydrocarbon Gas After Waterflooding. In Proceedings of the SPE/DOE Enhanced Oil Recovery Symposium, Tulsa, OK, USA, 22–24 April 1992. [Google Scholar]
  3. Afzali, S.; Rezaei, N.; Zendehboudi, S. A comprehensive review on enhanced oil recovery by water alternating gas (WAG) injection. Fuel 2018, 227, 218–246. [Google Scholar] [CrossRef]
  4. Nygård, J.I.; Andersen, P.Ø. Simulation of immiscible water-alternating-gas injection in a stratified reservoir: Performance characterization using a new dimensionless number. SPE J. 2020, 25, 1711–1728. [Google Scholar] [CrossRef]
  5. Sheng, J.J. Critical review of low-salinity waterflooding. J. Pet. Sci. Eng. 2014, 120, 216–224. [Google Scholar] [CrossRef]
  6. Ma, S.; James, L.A. Literature review of hybrid CO2 low salinity water-alternating-gas injection and investigation on hysteresis effect. Energies 2022, 15, 7891. [Google Scholar] [CrossRef]
  7. Behera, U.S.; Sangwai, J.S.; Baskaran, D.; Byun, H.-S. A comprehensive review on low salinity water injection for enhanced oil recovery: Fundamental insights, laboratory and field studies, and economic aspects. Energy Fuels 2024, 39, 72–103. [Google Scholar] [CrossRef]
  8. Fang, P.; Zhang, Q.; Zhou, C.; Yang, Z.; Yu, H.; Du, M.; Chen, X.; Song, Y.; Wang, S.; Gao, Y. Chemical-assisted CO2 water-alternating-gas injection for enhanced sweep efficiency in CO2-EOR. Molecules 2024, 29, 3978. [Google Scholar] [CrossRef]
  9. Parsons, C.; Chernetsky, A.; Eikmans, D.; Te Riele, P.; Boersma, D.; Sersic, I.; Broos, R. Introducing a Novel Enhanced Oil Recovery Technology. In Proceedings of the SPE Improved Oil Recovery Conference, Tulsa, OK, USA, 11–13 April 2016. [Google Scholar]
  10. Gao, Y.; Jia, J.; Tian, F.; Liang, Y.; Wang, D.; Wang, X.; Tsuji, T. Interfacial activity and phase behavior of dimethyl ether in decane/CO2–water systems: A molecular dynamics study. Chem. Eng. Sci. 2025, 314, 121826. [Google Scholar] [CrossRef]
  11. Cho, J.; Kim, T.H.; Lee, K.S. Compositional modeling and simulation of dimethyl ether (DME)-enhanced waterflood to investigate oil mobility improvement. Pet. Sci. 2018, 15, 297–304. [Google Scholar] [CrossRef]
  12. Kong, S.; Feng, G.; Liu, Y.; Li, K. Potential of dimethyl ether as an additive in CO2 for shale oil recovery. Fuel 2021, 296, 120643. [Google Scholar] [CrossRef]
  13. Huang, X.; Tian, Z.; Zuo, X.; Li, X.; Yang, W.; Lu, J. The microscopic pore crude oil production characteristics and influencing factors by DME-assisted CO2 injection in shale oil reservoirs. Fuel 2023, 331, 125843. [Google Scholar] [CrossRef]
  14. Wang, C.; Su, Y.; Wang, W.; Li, L.; Hao, Y. Experimental study on ethane-dimethyl ether assisted CO2 displacement to improve crude oil recovery in tight reservoirs. Energy Fuels 2024, 38, 12546–12554. [Google Scholar] [CrossRef]
  15. Choi, Y.J.; Seo, K.; Lee, K.S. Techno-economical optimization of water-alternating-CO2/dimethyl ether process for enhanced oil recovery. Pet. Sci. Technol. 2024, 42, 4913–4931. [Google Scholar] [CrossRef]
  16. Lee, Y.W.; Lee, H.S.; Jeong, M.S.; Cho, J.; Lee, K.S. Compositional modeling of dimethyl ether-CO2 mixed solvent for enhanced oil recovery. Appl. Sci. 2021, 11, 406. [Google Scholar] [CrossRef]
  17. Wang, L.; Zhang, Y.; Zou, R.; Zou, R.; Huang, L.; Liu, Y.; Lei, H. Molecular dynamics investigation of DME assisted CO2 injection to enhance shale oil recovery in inorganic nanopores. J. Mol. Liq. 2023, 385, 122389. [Google Scholar] [CrossRef]
  18. Choi, Y.; Seo, K.; Lee, K.S. Compositional Modelling of Enhanced Oil Recovery Using Dimethyl Ether-Enhanced Carbon Dioxide Water-Alternating-Gas Process. In Proceedings of the SPE/IATMI Asia Pacific Oil & Gas Conference and Exhibition, Jakarta, Indonesia, 10–12 October 2023. [Google Scholar]
  19. Awolayo, A.N.; Sarma, H.K.; Nghiem, L.X. A Comprehensive Geochemical-Based Approach at Modeling and Interpreting Brine Dilution in Carbonate Reservoirs. In Proceedings of the SPE Reservoir Simulation Conference, Montgomery, TX, USA, 20–22 February 2017. [Google Scholar]
  20. Helgeson, H.C.; Brown, T.H.; Leeper, R.H. Handbook of Theoretical Activity Diagrams Depicting Chemical Equilibria in Geologic Systems: Involving an Aqueous Phase at one Atm and 0 °C to 300 °C; Freeman, Cooper: San Francisco, CA, USA, 1969. [Google Scholar]
  21. Srivastava, R.K.; Huang, S.S.; Dong, M. Laboratory investigation of Weyburn CO2 miscible flooding. J. Can. Pet. Technol. 2000, 39, PETSOC-00-02-04. [Google Scholar] [CrossRef]
  22. Ganjdanesh, R.; Rezaveisi, M.; Pope, G.A.; Sepehrnoori, K. Treatment of condensate and water blocks in hydraulic-fractured shale-gas/condensate reservoirs. SPE J. 2016, 21, 665–674. [Google Scholar] [CrossRef]
  23. Li, Y.K.; Nghiem, L.X. Phase equilibria of oil, gas and water/brine mixtures from a cubic equation of state and Henry’s law. Can. J. Chem. Eng. 1986, 64, 486–496. [Google Scholar] [CrossRef]
  24. Morrow, N.R.; Buckley, J. Wettability and Oil Recovery by Imbibition and Viscous Displacement from Fractured and Heterogeneous Carbonates; Univ. of Wyoming: Laramie, WY, USA, 2006. [Google Scholar]
  25. Yousef, A.A.; Al-Saleh, S.; Al-Kaabi, A.; Al-Jawfi, M. Laboratory investigation of the impact of injection-water salinity and ionic content on oil recovery from carbonate reservoirs. SPE Reserv. Eval. Eng. 2011, 14, 578–593. [Google Scholar] [CrossRef]
  26. Tang, G.; Morrow, N.R. Injection of dilute brine and crude oil/brine/rock interactions. In Geophysical Monograph Series; Raats, P.A.C., Smiles, D., Warrick, A.W., Eds.; American Geophysical Union: Washington, DC, USA, 2002; Volume 129, pp. 171–179. [Google Scholar]
  27. Kakati, A.; Sangwai, J.S. Effect of monovalent and divalent salts on the interfacial tension of pure hydrocarbon-brine systems relevant for low salinity water flooding. J. Pet. Sci. Eng. 2017, 157, 1106–1114. [Google Scholar] [CrossRef]
  28. Madadizadeh, A.; Aghdam, M.A.; Sadeghein, A.; Hosseini, S.; Riahi, S.; Saviz, S. Ionic optimization of engineered water for enhanced oil recovery in carbonate reservoirs: A case study. Sci. Rep. 2025, 15, 15665. [Google Scholar] [CrossRef]
  29. Mohammadi, A.; Chahardowli, M.; Simjoo, M. The effect of diethyl ether on interfacial tension and oil swelling in crude oil-brine system. J. Pet. Explor. Prod. Technol. 2025, 15, 83. [Google Scholar] [CrossRef]
  30. Deshmukh, A.; Wilson, A.D.; Lienhard, J.H. Electrically powered high-salinity brine separation using dimethyl ether. Ind. Eng. Chem. Res. 2024, 63, 8341–8356. [Google Scholar] [CrossRef]
  31. Salam, A.H.; Nazar, M.; Kamal, M.S.; Mahboob, A.; Hussain, S.M.S.; Aljawad, M.S.; Raza, A.; Patil, S. A perspective on ionic liquids as multifunctional agents in enhanced oil recovery and CO2 sequestration in carbonate formations. Carbon Capture Sci. Technol. 2025, 15, 100443. [Google Scholar] [CrossRef]
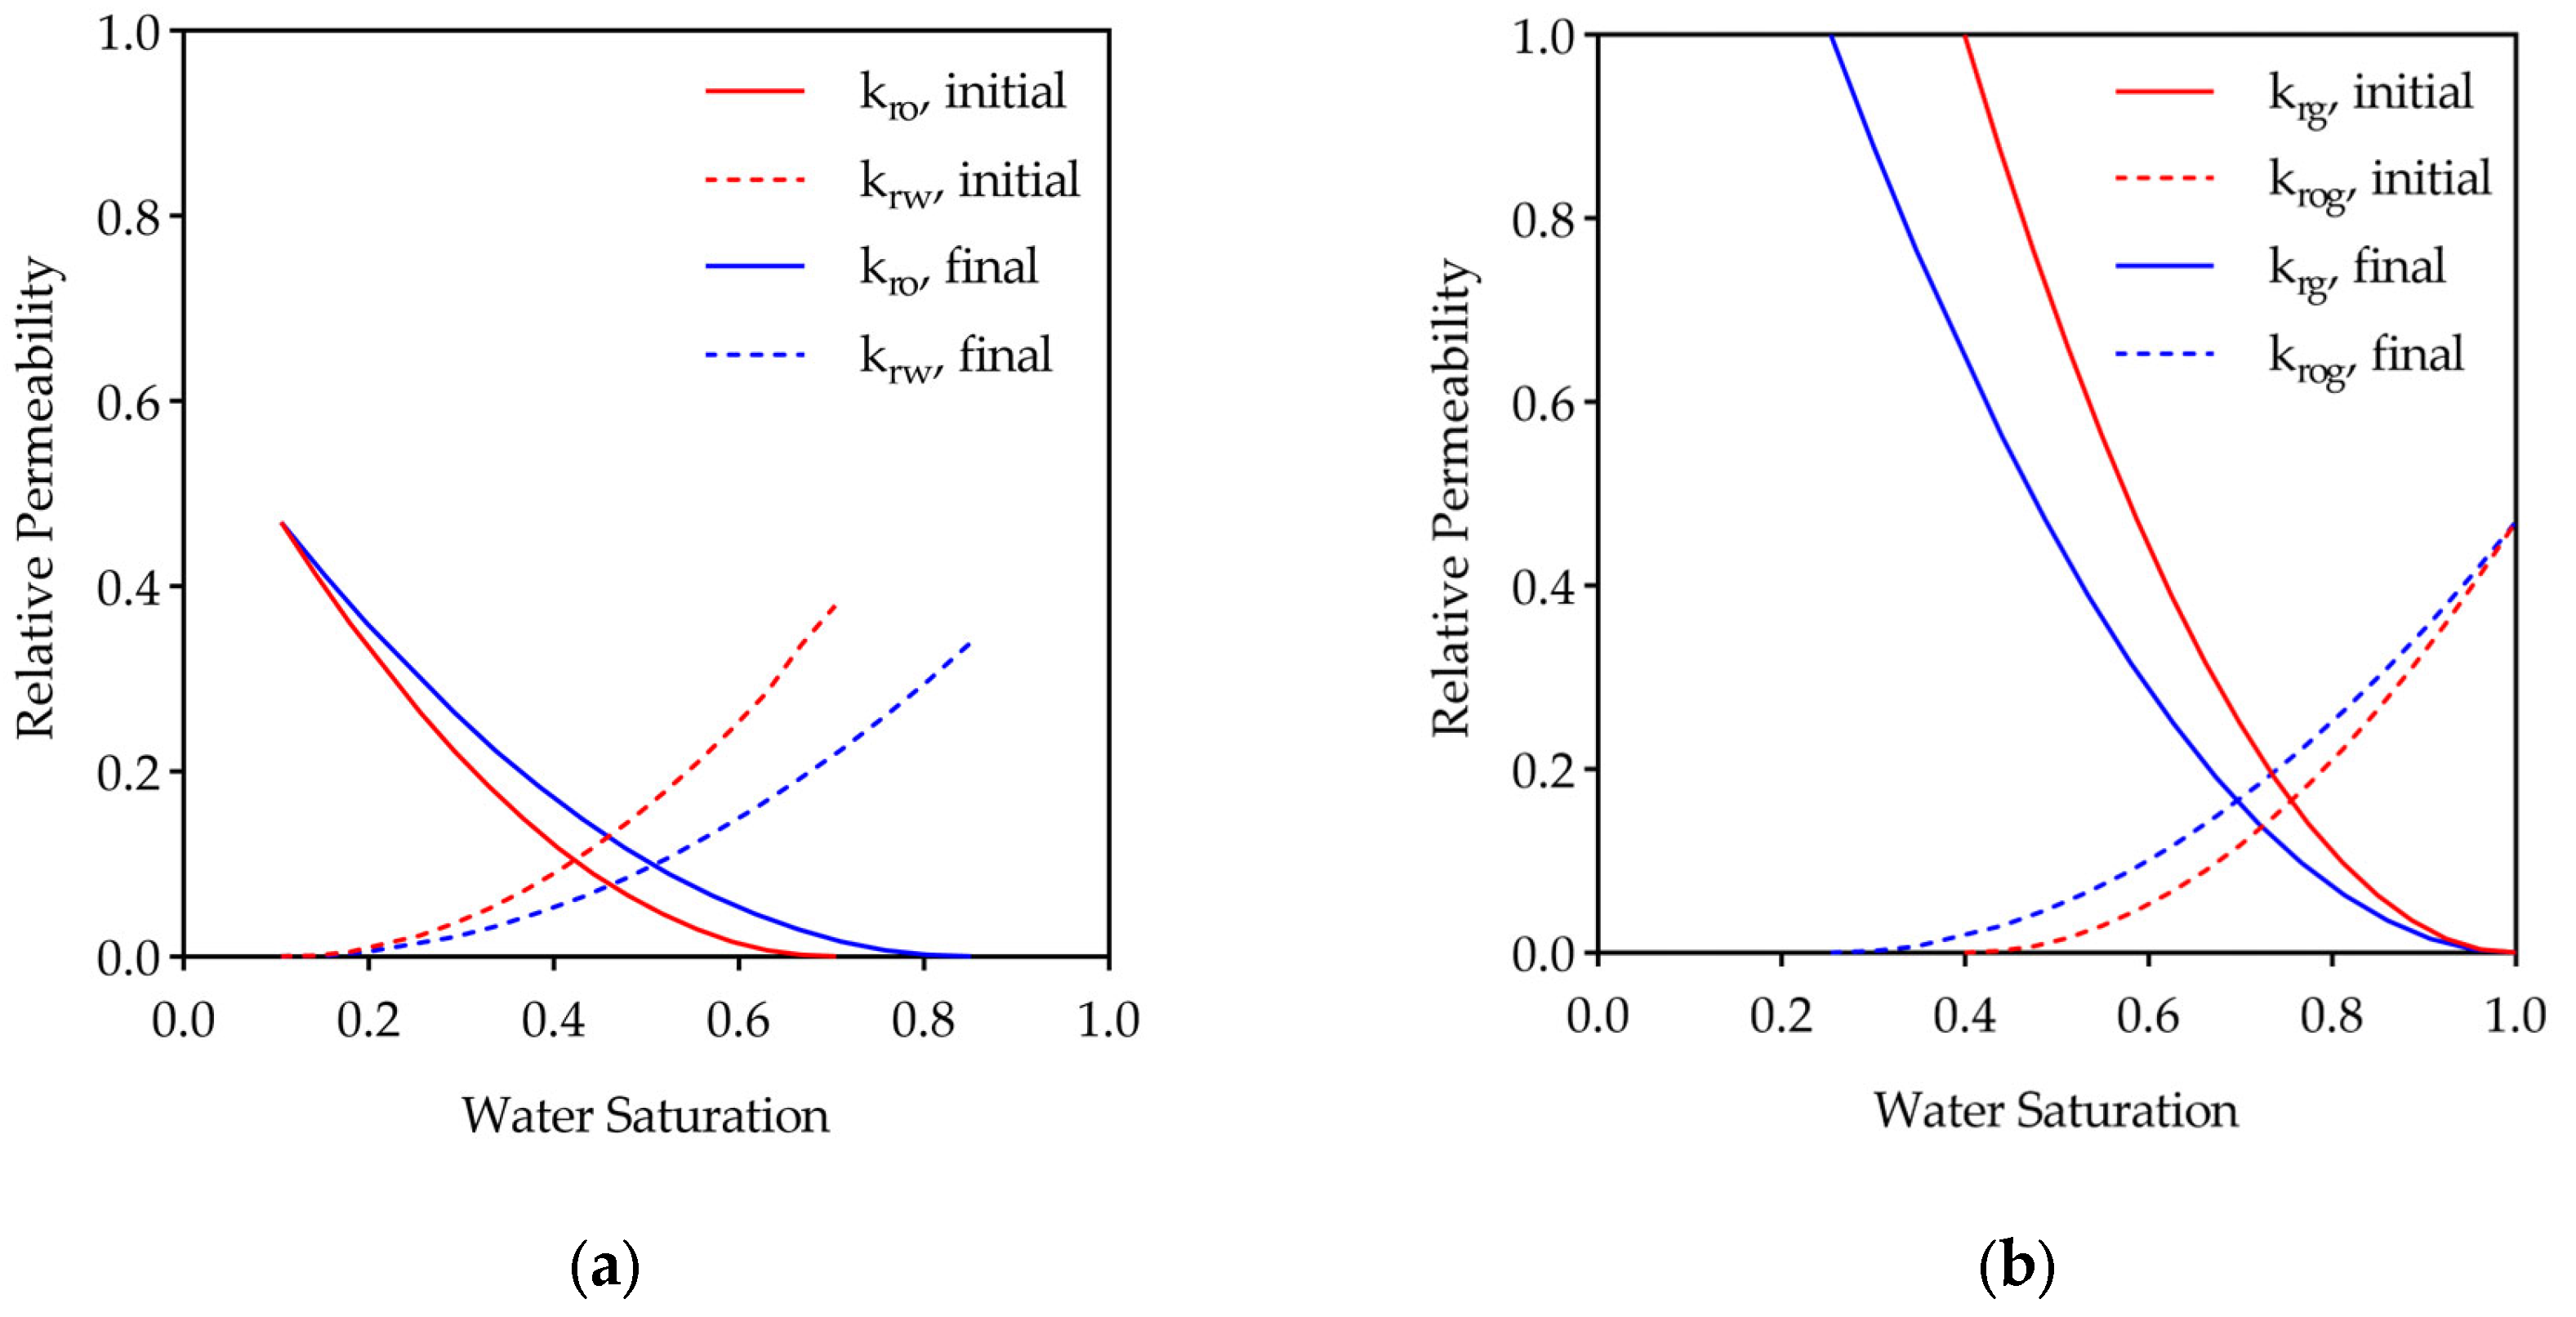
Figure 1. Relative permeability curves of (a) water–oil and (b) liquid–gas.
Energies 18 06104 g001
Figure 2. Schematic of the water-alternating gas injection design.
Energies 18 06104 g002
Figure 3. Comparison of average water saturation according to water salinity at three DME concentrations: (a) CO2 100% LSWAG; (b) CO2 90% + DME 10% LSWAG; (c) CO2 75% + DME 25% LSWAG.
Energies 18 06104 g003aEnergies 18 06104 g003b
Figure 4. Comparison of solubility trapping efficiency with various DME and SW concentrations.
Energies 18 06104 g004
Figure 5. Comparison of interfacial tension according to water salinity at three DME concentrations: (a) CO2 100% LSWAG; (b) CO2 90% + DME 10% LSWAG; (c) CO2 75% + DME 25% LSWAG.
Energies 18 06104 g005aEnergies 18 06104 g005b
Figure 6. Oil viscosity when 0.25 PV gas was injected: (a) CO2 100% LSWAG; (b) CO2 90% + DME 10% LSWAG; (c) CO2 75% + DME 25% LSWAG. The red lines indicate the slope at the front of the swept zone.
Energies 18 06104 g006
Figure 7. Comparison of interfacial tension according to DME concentration in three brines: (a) seawater; (b) twice-diluted seawater; (c) ten-times-diluted seawater.
Energies 18 06104 g007aEnergies 18 06104 g007b
Figure 8. Comparison of oil viscosity at the midpoint of the reservoir according to water salinity with three DME concentrations: (a) CO2 100% LSWAG; (b) CO2 90% + DME 10% LSWAG; (c) CO2 75% + DME 25% LSWAG.
Energies 18 06104 g008aEnergies 18 06104 g008b
Figure 9. Comparison of oil recovery factors with various DME and SW concentrations.
Energies 18 06104 g009
Figure 10. Comparison of CO2 trapping efficiency for each mechanism at various DME concentrations and water salinities.
Energies 18 06104 g010
Figure 11. Comparison of the solubility trapping efficiency at various DME concentrations and water salinities.
Energies 18 06104 g011
Figure 12. Sensitivity analysis of CO2 storage efficiency using random forest regression.
Energies 18 06104 g012
Figure 13. Correlation coefficient for CO2 storage efficiency.
Energies 18 06104 g013
Table 1. Chemical reaction pathways.
Hydrocarbon Solubility
C O 2 ( o ) C O 2 ( g ) C O 2 ( a q ) (R1)
C O 2 ( a q ) + H 2 O H + + H C O 3 (R2)
Aqueous reactions
C a S O 4 C a 2 + + S O 4 2 (R3)
M g S O 4 M g 2 + + S O 4 2 (R4)
N a S O 4 N a + + S O 4 2 (R5)
C a C O 3 + H + C a 2 + + H C O 3 (R6)
M g C O 3 + H + M g 2 + + H C O 3 (R7)
C a H C O 3 + C a 2 + + H C O 3 (R8)
M g H C O 3 + M g 2 + + H C O 3 (R9)
N a H C O 3 + N a + + H C O 3 (R10)
Mineral reactions
C a l c i t e + H + C a 2 + + H C O 3 (R11)
D o l o m i t e + 2 H + C a 2 + + 2 H C O 3 + M g 2 + (R12)
A n h y d r i t e + H + C a 2 + + S O 4 2 (R13)
Ion exchange reactions
N a + + 1 2 C a X 2 1 2 C a 2 + + ( N a X ) (R14)
N a + + 1 2 M g X 2 1 2 M g 2 + + ( N a X ) (R15)
Table 2. Oil composition and properties.
ComponentCompositionCritical Pressure (psi)Critical Temperature (°F)Acentric FactorMolecular Weight
N20.0207492.31−232.510.04028.013
CO20.00741,069.8787.890.22544.010
H2S0.00121,296.18212.090.10034.080
C10.0749667.20−116.590.00816.043
C20.0422708.3490.050.09830.070
C30.0785615.76205.970.15244.097
DME0.0000789.39260.840.20046.070
IC40.0158529.05274.910.17658.124
NC40.0497551.10305.690.19358.124
IC50.0201490.84369.050.22772.151
NC50.0258489.38385.610.25172.151
C6– 90.2156437.95541.790.331102.500
C10–17 0.2202292.61786.460.584184.000
C18–270.1027192.46995.500.893306.200
C28+0.1252167.531188.301.100565.613
Table 3. Binary interaction coefficients.
N2CO2H2SC1C2C3DMEIC4NC4IC5NC5C6–9C10–17C18–27C28+
N20.00------- - ----
CO20.000.00-------------
H2S0.130.140.00------------
C10.250.110.070.00-----------
C20.010.130.090.000.00----------
C30.090.130.080.010.000.00---------
DME0.100.000.000.290.250.250.00--------
IC40.100.120.080.020.010.000.250.00-------
NC40.100.120.080.020.010.000.250.000.00------
IC50.100.120.070.020.010.000.250.000.000.00-----
NC50.100.120.070.020.010.000.250.000.000.000.00----
C6–90.110.120.050.030.020.010.200.000.000.000.000.00---
C10–170.110.120.050.060.040.020.080.020.020.010.010.010.00--
C18–270.110.120.050.090.060.050.080.030.030.030.030.020.000.00-
C28+0.110.120.050.120.090.070.080.050.050.050.050.030.010.000.00
Table 5. Properties of the water compositions injected by Yousef et al. (2011) [25] (unit: mg/L).
Ion ComponentNa+Ca2+Mg2+SO42−HCO3Cl
Brine Type
Seawater (SW)18,3006502110429012032,200
Twice-Diluted Seawater (SW/2)9150325105521456016,100
Ten-times-Diluted Seawater (SW/10)183065211429123220
Table 6. Properties and initial conditions of the reservoir model.
PropertyValues
Grids52 × 1 × 20
Size of each grid (ft)10 × 10 × 5
Depth (ft)4000
Initial pressure (psi)2000
Temperature (°F)145
Porosity0.251
Mineral volume fractionCalcite 64%, Dolomite 10%, Anhydrite 2%
Permeability (I/J/K directions, mD)39.6/39.6/3.96
Initial   oil   saturation ,   S o 0.8948
Connate   water   saturation ,   S w 0.1052
Pore volume (ft3)130,520
Table 7. Composition of the injected solvents and brines used in the simulation.
Injected SolventBrine
CO2 100%Seawater (SW)
CO2 90% + DME 10%Twice-diluted seawater (SW/2)
CO2 75% + DME 25%Ten-times-diluted seawater (SW/10)
Table 8. Breakthrough dates and swept areas in different injection scenarios.
SolventBrineBreakthrough DateSwept Area (ft3)
CO2 100%SW12 May 2004271,500
SW/213 May 2004272,000
SW/1014 May 2004273,500
CO2 90% + DME 10%SW8 June 2004284,000
SW/214 June 2004285,500
SW/1017 June 2004287,500
CO2 75% + DME 25%SW23 July 2004294,500
SW/230 July 2004292,000
SW/104 August 2004296,500
Table 9. Displacement efficiency (%) for each hydrocarbon component. Background color intensity corresponds to displacement efficiency, with darker blue indicating higher efficiency.
SolventBrineC1C2C3IC4NC4IC5NC5C6–9C10–17C18–27C28+
CO2 100%SW89.4488.0586.7385.7285.1283.6483.1578.4771.8470.6370.51
SW/291.4590.4189.3888.5588.0486.7386.2881.7375.1673.9273.79
SW/1093.0592.2591.4490.7690.3489.1788.7584.2577.6976.4276.30
CO2 90% + DME 10%SW92.3891.6691.0090.4990.1989.3489.0485.2277.1573.6072.99
SW/293.9893.4392.9392.5392.3191.6491.4087.9880.0276.4575.84
SW/1095.3494.9294.5494.2394.0693.5493.3590.2582.2178.6177.99
CO2 75% + DME 25%SW94.0393.7093.3893.1393.0192.6292.5090.9585.8978.8476.44
SW/295.2094.9794.7694.6094.5294.2694.1993.0388.1981.1178.71
SW/1096.8296.5896.3796.2296.1595.9395.8694.9290.2083.0780.68
Disclaimer/Publisher’s Note: The statements, opinions and data contained in all publications are solely those of the individual author(s) and contributor(s) and not of MDPI and/or the editor(s). MDPI and/or the editor(s) disclaim responsibility for any injury to people or property resulting from any ideas, methods, instructions or products referred to in the content.