Article

Critical Raw Materials in Life Cycle Assessment: Innovative Approach for Abiotic Resource Depletion and Supply Risk in the Energy Transition

1
Department of Chemical Engineering Materials Environment (DICMA), Faculty of Civil and Industrial Engineering, Sapienza University of Rome, Via Eudossiana 18, 00184 Rome, Italy
2
Department of Civil, Constructional and Environmental Engineering (DICEA), Faculty of Civil and Industrial Engineering, Sapienza University of Rome, Via Eudossiana 18, 00184 Rome, Italy
3
Institute of Energy Systems and Environment, Riga Technical University, Azenes iela 12/1, LV-1048 Riga, Latvia
*
Authors to whom correspondence should be addressed.
Energies 2025, 18(23), 6103; https://doi.org/10.3390/en18236103
Submission received: 30 September 2025 / Revised: 14 November 2025 / Accepted: 18 November 2025 / Published: 21 November 2025

Abstract

Achieving a low-carbon energy future requires scaling up the supply of minerals and metals essential for renewable-energy technologies, many of which are classified as Critical Raw Materials (CRMs). Current Life Cycle Assessment (LCA) methods insufficiently address their depletion and criticality. This study introduces two novel indicators, the Raw Material Extraction/Reserve Index (RERI) and a Gini-based metric, to quantify depletion pressure and supply concentration, integrated into SimaPro v10.2 for practical use in LCA. The proposed framework is tested on a comparative case study of electric and diesel vehicles, showing that electric models, while reducing greenhouse-gas emissions, entail higher CRM-related impacts. A complementary multi-criteria analysis (TOPSIS) confirms that electric vehicles remain the more sustainable long-term option, highlighting the need to integrate CRM indicators into LCA for robust sustainability assessments.

1. Introduction

The transition to a low-carbon energy system will require substantial amounts of minerals and metals that are essential to the technologies used to produce, store, and distribute renewable energy. Lithium, cobalt, and nickel, for example, are critical inputs for the batteries deployed in stationary energy-storage systems and electric vehicles (EVs) [1]. Due to their strategic role in renewable-energy technologies, demand for many of these minerals and metals has sharply increased, and several are now officially classified as critical raw materials (CRMs) [2]. CRMs are scarce, possess limited global reserves, and are highly exposed to supply-chain disruptions and price volatility. Any constraint in their supply can quickly become a bottleneck that slows, or even stalls, the rollout of new clean-energy technologies [3]. This is particularly evident in the development and manufacture of electronic devices and energy-transition technologies. Accordingly, one of the goals of this paper is to quantify how the use of CRMs affects the environmental performance of electric vehicles within the broader energy system. In recent years, the rising demand for next-generation batteries has become a clear indicator of the global drive to reach Net Zero emissions by 2050, a target championed by the International Energy Agency, among others [4]. However, an important and still under-researched question concerns how these CRMs influence the entire battery life cycle, from raw-material extraction to end-of-life management, when analysed through the Life Cycle Assessment (LCA) methodology [5]. Although resource depletion in Life Cycle Assessment has long been represented mainly by the Abiotic Depletion Potential (ADP) [6], several alternative indicators, such as ReCiPe 2016’s Mineral Resource Scarcity, Surplus Ore/Cost Potential, and more recently CRM-focused methods like CriticS have been proposed. However, none of these approaches has yet been standardised or widely implemented in commercial LCA software, leaving a clear gap for robust, CRM-specific depletion factors, especially for battery metals and rare-earth elements critical to the energy transition.
Several circularity-oriented metrics already combine circular-economy thinking with Life-Cycle Assessment. The Material Circularity Indicator (MCI) developed by the Ellen MacArthur Foundation [7] and the Circularity Indicator (CI) operationalised by Cilleruelo-Palomero et al. [8] provide cradle-to-grave snapshots by tracing material flows and the energy required for both primary and secondary production. However, these metrics treat all materials uniformly and therefore neither single out Critical Raw Materials (CRMs) nor quantify their specific contribution compared with more common inputs. Recognising this methodological gap, the present work pursues the following objectives:
-
Multi-criteria analysis. A TOPSIS multi-criteria evaluation was carried out to derive a Performance score (Pi) for the electric- and diesel-vehicle scenarios. The ranking draws on five overarching categories: Supply Chain, Technological, Environmental, Economic, and Legislative, each populated with quantitative indicators.
-
Methodological innovation. We designed two new characterisation factors: a Resource-Depletion Index and a Gini Index, quantifying respectively the depletion risk and supply-concentration risk of CRMs in energy-intensive manufacturing processes. Both metrics have been implemented as a custom method in SimaPro, enabling direct application in Life Cycle Assessment studies of energy and transport systems.
-
Case study. We applied the new CRM method to the cradle-to-grave comparative LCA of the Peugeot 308 previously developed by the authors, contrasting the battery-electric and diesel versions over two mileage scenarios (200,000 km and 540,000 km) [9]. Using the same inventory, we reran the assessment with an adapted Environmental Footprint 3.1 impact set plus the CRM characterisation factors to quantify how critical raw materials alter the sustainability balance between the two powertrain and energy-supply options.

2. Literature Review: State of the Art

2.1. Importance of Critical Raw Materials

The global energy transition is one of the most intricate challenges of our era, seeking to reshape the global economy into a sustainable, carbon-neutral system capable of reaching Net Zero CO2 emissions [10]. The transformation calls for sweeping changes in energy generation, industrial operations and transport systems, enabled by the widespread deployment of low-carbon and energy-efficient technologies [11]. Yet a major obstacle is the limited availability of the critical minerals that underpin the technologies driving the clean-energy transition. Recent analyses [3,11,12] show that a low-emission and energy-resilient system cannot be achieved without a marked expansion in the mining and refining of critical minerals. Materials such as lithium, cobalt, nickel, rare-earth elements and copper are indispensable for manufacturing the batteries, permanent-magnet motors, wind-turbine generators and high-capacity power lines that underpin renewable-energy generation, storage and distribution. Lithium and graphite are ubiquitous in contemporary lithium-ion batteries, while cobalt and nickel are key constituents in the high-energy cathodes (e.g., NCM and NCA) used in most electric vehicles and many stationary energy-storage systems [11,13]. Recent advances in redox-flow battery research demonstrate the growing dependence of energy-storage technologies on metallic elements such as vanadium and titanium [14]. Moreover, rare-earth elements (REEs) are crucial for the permanent-magnet generators used in many modern wind turbines and for the high-efficiency traction motors found in electric vehicles and other advanced energy-conversion machinery [12]. Copper and aluminium are widely used in manufacturing solar panels, wind turbines, lightweight vehicles, and the infrastructure that supports renewable-energy systems [12,13].
According to the International Energy Agency projections consistent with the Paris Agreement targets, the share of total mineral demand attributable to clean-energy technologies is set to climb sharply over the next two decades, rising to more than 40% for copper and rare-earth elements, 60–70% for nickel and cobalt, and almost 90% for lithium. European Commission President Ursula von der Leyen highlighted the issue in her 2022 State of the Union address. She welcomed the surge in demand for critical raw materials as “a good sign, because it shows that our European Green Deal is moving fast,” but warned that “one country dominates the market. We must avoid falling into the same dependency as with oil and gas; we have to secure our supply and safeguard our global competitiveness”.
The shift from fossil-fuels energy sources to renewable-energy systems is indispensable, yet it introduces a new set of challenges that make certain raw materials “critical”, among them fragile supply chains, finite reserves, and high market volatility.

Main Critical Issues: Supply Chain, Limited Reserves, Market Volatility

Supply chains for many of the critical raw materials that low-carbon and clean-energy technologies rely on are still immature and lack resilience [15]. Production volumes remain modest and are heavily concentrated in a handful of countries, leaving global supply vulnerable to geopolitical or market shocks [3,4,11]. Notably, China has positioned itself across the entire critical-raw-material and energy-technology value chain, controlling significant shares of extraction, refining, and downstream component manufacturing. This geographic concentration, made worse by the shrinking number of alternative suppliers, heightens the likelihood of price volatility and supply disruptions. The European Union relies heavily on imported critical raw materials, with dependency often exceeding 75% and, for several of them, reaching full import reliance [16]. When assessing mineral availability for the energy transition, the central issue is not the physical existence of the resources, but whether mining, refining, and processing capacity can expand quickly enough to keep pace with the rapidly rising demand [3]. As mineral demand grows, improved exploration and extraction technologies, together with higher price incentives, are expected to turn deposits that were once uneconomic into commercially viable reserves. However, looking only at future demand versus known reserves ignores a key variable: recycling within energy and industrial systems. As end-of-life products enter the waste stream, efficient collection and processing can supply an increasing share of the required metals, moderating, or even offsetting, the need for additional mining, especially in the latter part of the projection period and beyond [17]. Apart from a few bulk metals such as copper and aluminium, end-of-life recycling rates for most critical raw materials remain well below 50%, with lithium, rare-earth elements, cobalt and nickel still in the low-to-mid-double-digit range. Dedicated recycling infrastructure for these materials is therefore only in its early stages of development [3]. Improving collection schemes, upgrading recycling technologies and lifting end-of-life recovery rates will be essential in the coming years to secure a responsible and energy-sustainable mineral supply.
Even with greater circularity, the global CRM value chain remains intricate and exposed to shocks, from natural disasters and logistical bottlenecks to geopolitical tensions and trade measures such as export quotas or predatory pricing [4]. Many critical raw materials are produced only as co-products or by-products of larger commodity streams. Because their output cannot be scaled independently of the host metals, supply remains inflexible and prices volatile. As demand for low-carbon energy technologies accelerates, this constraint heightens pressure on ecosystems and communities, fuels further mining expansion, and drives resource prices upward [18].
CRM markets are notoriously opaque, with price swings driven by a mix of geopolitical, economic and environmental factors [11]. Because extraction and refining are concentrated in only a few countries, global supply chains are highly exposed to localised shocks [19]. The vulnerability is compounded by long lead times: bringing a greenfield mine from discovery to first production now takes, on average, more than 16 years [11]. To curb this volatility, governments and industry are working to diversify supply sources, expand recycling and accelerate the development of substitute materials for clean-energy applications [4,16,17].

2.2. Classification and Quantification of Raw Materials

Clean-energy technologies are crucial for cutting GHG emissions and steering the global energy sector toward sustainability. In its Energy Technology Outlook, the International Energy Agency highlights eleven key technologies that underpin this shift [20].
The main groups relevant here are:
  • Renewable power: solar PV, onshore/offshore wind, concentrating solar power, hydropower, geothermal and biomass.
  • Nuclear power: provides dispatchable, low-carbon, and reliable electricity generation.
  • Electricity networks (transmission and distribution): must be expanded and modernised as electrification accelerates and energy demand rises.
  • Battery energy storage: stabilises electric grids with high shares of variable renewables and enhances energy-system flexibility.
  • Electric vehicles: replace conventional cars and cut CO2 emissions from road transport while promoting energy diversification in mobility.
  • Hydrogen technologies (electrolysers and fuel cells): supply a low-carbon and energy-dense carrier for hard-to-abate sectors.
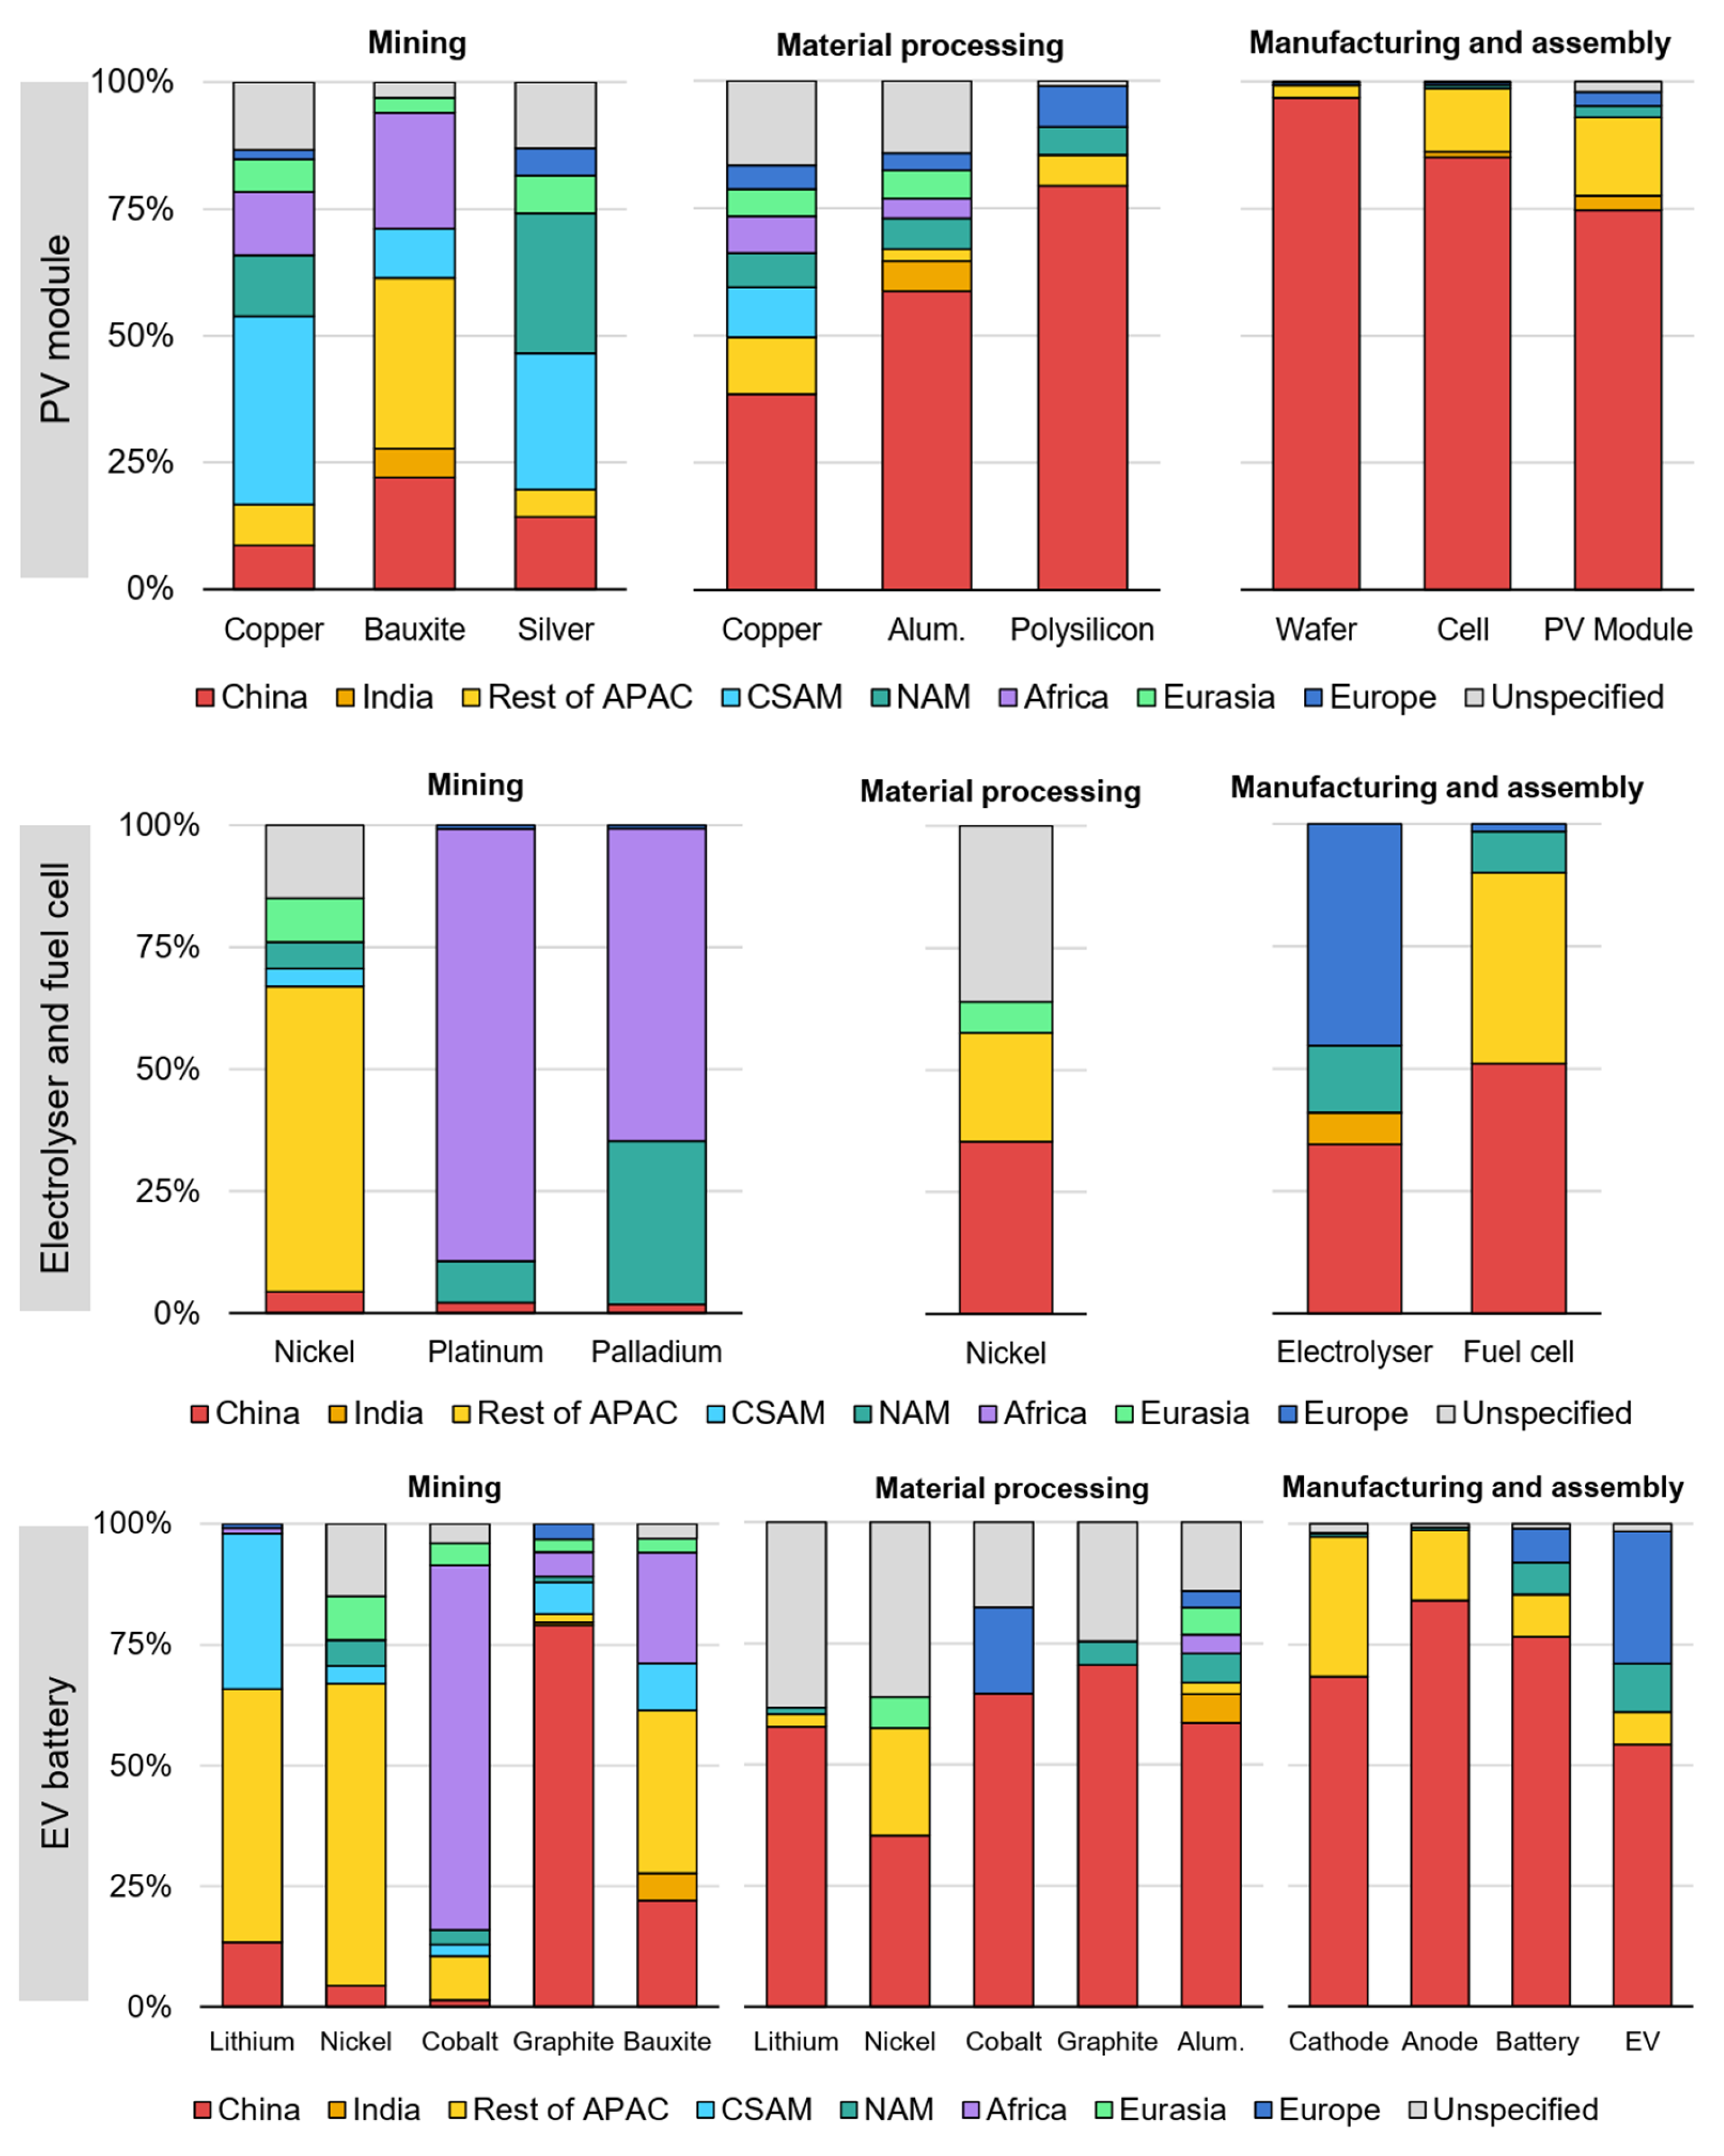
Figure 1 below illustrates the correlation between clean-energy technologies and the metals required for their production. Each green dot indicates the use of a given element in a specific energy technology. A small group of materials, such as aluminium, copper and nickel, supports most technologies, while lithium, cobalt and manganese are mainly associated with battery systems and electric vehicles, and rare-earth elements with wind-energy turbines. Platinum-group metals are widely used across multiple technologies, including hydrogen production, fuel cells, and catalytic energy-conversion systems.
The next section examines the CRM attributes that are most critical to the development and deployment of clean-energy technologies and energy systems.
Cobalt—Cobalt is mined in about 14 countries, yet roughly 73% of global output still comes from sediment-hosted Cu–Co deposits in the Democratic Republic of the Congo (DRC) [21]. The DRC also holds around 46% of known reserves, with notable amounts in Australia, Indonesia and Cuba. Because cobalt is typically a by-/co-product of copper or nickel, up to 40–60% of its content can be lost in tailings and slags during processing and refining [22]. In the energy and automotive sector it remains crucial for lithium-ion batteries used in electric vehicles (EVs) and stationary energy-storage systems, especially in NMC and NCA cathode chemistries [23]. This strong dependence on DRC mining, coupled with the fact that most refining occurs in China, raises geopolitical and energy-supply security concerns. China is also a leading hub for EV and lithium-ion battery manufacturing, accounting for about 45% of global EV sales in 2020 [23]. Globally, cobalt demand could rise by up to nine times between 2020 and 2050, with transport and energy-storage applications potentially absorbing about 64.5% of that total [24].
Lithium—The largest identified resources are in the “Lithium Triangle” (Bolivia, Argentina and Chile, mainly brines), followed by hard-rock deposits in Australia and China [13]. In recent years, hard-rock deposits have become the dominant source of lithium production, where lithium concentrate is refined into either lithium carbonate or lithium hydroxide [25]. Lithium hydroxide is favoured by lithium-ion battery (LIB) manufacturers due to its higher lithium content compared to lithium carbonate, but converting lithium carbonate from brine into lithium hydroxide requires additional refining costs [26]. Currently, China processes about 75% of hard-rock lithium from Australia and 25% of lithium from brine sources in the lithium triangle countries [26]. However, the shift from brine to hard-rock production, along with the concentration of refining in China, increases the risk of supply-chain disruptions for the global energy-storage and electric-mobility sectors [26]. Significant lithium resources have also been identified in various parts of Europe and Central Asia [27]. Diversifying lithium production and relocating refining capacity closer to battery- and energy-manufacturing hubs could streamline the supply chain and lessen dependence on a few producer countries. Demand for lithium for rechargeable batteries, driven primarily by electric vehicles, is projected to rise sharply over the next decade, whereas stationary-storage applications are expected to remain a comparatively small share of total consumption and, under most outlooks, should not strain supply [28]. Several demand-projection studies suggest that, in high-EV scenarios and without major advances in recycling or new discoveries, lithium demand could exceed current reserve estimates before 2050 and approach today’s total resource base by 2100 [29]. Several levers can help align long-term lithium supply with demand: (1) scaling up efficient end-of-life recycling, (2) improving material utilisation along the battery value chain and (3) diversifying drivetrain technologies to curb primary-lithium requirements [30,31]. Reference [30] notes that today’s end-of-life lithium recycling rate is only about 3%, and argues that it should reach ≥30% by mid-century to avert potential shortages and narrow the energy-supply and demand gap.
Nickel—Global nickel reserves have risen by around 40 million tonnes, about a 50% increase, since 2012 [32]. Indonesia led world nickel production in 2022, accounting for about 48% of global output, with the Philippines a distant second at roughly 10% [21]. Nickel is a critical cathode material in lithium-ion batteries (LIBs) for battery-electric vehicles (BEVs) [33], and recent chemistries are trending toward ever-higher nickel content to boost energy density and reduce cobalt use. Although modern wind-energy turbines rely on nickel-rich stainless steels and alloys, battery-electric vehicles are projected to dominate future nickel demand. Most outlooks [34,35] conclude that known reserves, together with announced mining and refining expansions, should be adequate for a low-carbon energy transition. Even so, any long-term supply assessment must account for the additional demand likely to emerge as developing economies scale up their own electric-mobility and energy-storage fleets. Reference [36] projects that, depending on the scenario, China’s cumulative nickel demand could consume between 21% and 55% of today’s global nickel reserves by 2050, even after accounting for secondary (recycled) supply from the energy and transport sectors [13].
Manganese—Around 90% of manganese is used in the iron and steel-making sector, mainly as ferroalloys that purify and strengthen the metal [37]. Current market outlooks suggest that manganese demand will continue to rise by roughly 4% per year through the second half of this decade (2024–2030), driven by large-scale infrastructure projects and the expanding use of manganese-rich batteries in electric vehicles [37,38]. Although demand is climbing, manganese output is expanding more slowly because high-grade reserves are limited and production, especially in China, faces technical and cost hurdles [3]. Supply is also geographically concentrated, with South Africa, Australia and Gabon providing most of the world’s ore. Even so, recent assessments indicate that manganese is less likely to become a supply bottleneck than other critical minerals essential to the clean-energy transition, such as lithium or cobalt [37,38].
Rare earth elements—Currently, heavy rare earths (HREEs) like dysprosium and terbium are mainly sourced from China and Myanmar [39], while light rare earths (LREEs) such as neodymium and praseodymium come from a wider range of countries. Overall, China remains the leading global producer, accounting for about 60% of total REE production in 2021 [21]. Chinese rare-earth operations can remain profitable at lower market prices than most competitors, largely because of lower labour costs, state support, and less stringent environmental requirements [40]. North America and India host sizable rare-earth resources, and Greenland is widely viewed as an attractive frontier for future REE production thanks to its large, undeveloped deposits and comparatively low geopolitical risk [41,42]. In contrast, OECD Europe holds only modest rare-earth reserves and has virtually no mining capacity, leaving the region heavily reliant on imports [41]. Several studies warn that this dependence, combined with China’s dominant market share, could create strategic and economic vulnerabilities as REE demand for clean-energy and advanced energy-conversion technologies accelerates, underscoring the need to diversify supply sources. Neglecting this vulnerability risks compounding both geopolitical tensions and environmental pressures [41]. Meeting the projected build-out of wind-energy turbines and electric vehicles could push rare-earth output sharply higher: up to 35-fold for heavy REEs and nine-fold for light REEs, relative to today’s production [43]. Moreover, forecasting studies suggest that dysprosium demand could outstrip today’s identified reserves, creating a potential bottleneck for the global energy transition unless robust recycling infrastructure is put in place [43,44]. Reference [43] argues that rare-earth bottlenecks can be avoided only if end-of-life recycling reaches roughly 80%, a target that will require higher-efficiency separation processes, stricter material-purity standards, systematic recovery from production and consumer waste, and a far more extensive recycling infrastructure. Today’s end-of-life recycling rate for rare-earth elements is estimated to be well below 1%, underscoring the magnitude of the challenge.
Gallium—Gallium is used mainly in semiconductor and optoelectronic applications; in 2019, less than 3% of output went to CIGS (copper indium gallium selenide) solar cells [21], and electric vehicles required only trace amounts [33]. Gallium is recovered chiefly as a by-product of bauxite refining, with smaller quantities extracted from zinc-processing residues [13]. Although gallium is plentiful in the Earth’s crust, it occurs only in trace amounts. Bauxite typically contains about 0.003–0.008% gallium, and current processes recover only around 10% of that content [21,45]. In 2022 global refined gallium output was about 650 t, and China supplied approximately 94% of that total [13]. Gallium is rarely recycled, as it is dispersed in trace amounts across energy- and electronics-related products and is uneconomical to recover at end of life. The main exception is the closed-loop reclamation of gallium from manufacturing scrap generated during GaAs (gallium arsenide) device production [21].
Platinum group metals—PGMs are essential for catalytic converters in internal-combustion vehicles, where they catalyse reactions that curb harmful exhaust emissions [46]. Roughly 32% of platinum, 80% of palladium, and 84% of rhodium are used by the automotive sector. Demand for PGMs in catalytic converters is expected to fall as transport shifts toward low-carbon options and EVs, while their use in water electrolysers for green-hydrogen production, key to fuel-cell vehicles and stationary storage, is projected to rise sharply in the coming decades [47,48]. South Africa controls close to 90% of the world’s PGM reserves, while Russia is the other main source of supply [21]. Zimbabwe has boosted iridium output by roughly 40% over the past five years, although political instability still clouds the investment outlook [49]. In autocatalysts, producers routinely switch between platinum and palladium to hedge against price swings, and similar substitution strategies are under investigation for fuel-cell catalysts and hydrogen technologies.
Inefficiencies in mining lead to approximately 32% platinum losses [47], highlighting the importance of enhancing supply diversification, co-production efficiency, and waste recovery. As the demand for internal-combustion-engine vehicles (ICEVs) decreases, the resulting reduction in platinum consumption could be redirected to satisfy the material requirements of fuel-cell electric vehicles (FCEVs). Achieving a 90% closed-loop recycling rate for platinum has the potential to supply up to 75% of the gross demand for FCEVs through 2100, thereby mitigating associated energy-supply risks [46,48]. With respect to other PGMs, the phase-out of ICEVs is expected to reduce the demand for palladium and rhodium, thereby creating opportunities to reuse these metals as substitutes for platinum and iridium in various clean-energy and industrial applications [47,48]. Regarding iridium, ref. [50] projected its demand in electrolyzers through 2070 and recommended achieving at least a 90% closed-loop recycling rate, together with a reduction in iridium loading to 0.05 g per kilowatt, in order to mitigate potential supply constraints in the hydrogen-energy sector [48,51]. Currently, recycling accounts for approximately 11% of the global platinum supply, with most secondary material originating from the industrial and jewellery sectors [48,51].
Although recycling rates of PGMs from the automotive sector range between 50% and 60%, collection inefficiencies result in losses of approximately 30%, underscoring the need to enhance recovery systems [47,48].
Copper—Copper plays a critical role in the global energy transition, with demand projected to increase substantially. Electric vehicles require approximately three times more copper than ICEVs, solar power plants up to four times more than thermal power plants, and wind-energy turbines around six times more than nuclear power plants [52,53]. Furthermore, ref. [54] observed that although copper demand in developed countries is stabilising, global primary production continues to expand, with an average annual growth rate of about 2.8%. Copper also acts as a host metal for several critical by-products, including cobalt, tellurium, silver, molybdenum, and germanium. Between 2010 and 2021, economically recoverable copper reserves expanded by approximately 250 million tonnes, largely as a result of advances in mining practices, exploration, and extraction technologies [21,55]. Chile accounts for about 23% of global copper reserves [13], whereas China dominates the downstream segment, producing nearly half of the world’s refined copper and leading the manufacturing of copper-based components for the energy and construction sectors [21]. Currently, copper recycling rates range between 42% and 65%, suggesting considerable potential for further improvement [54,56].
While renewable-energy technologies are increasingly driving copper demand, the largest consumers remain electric-grid infrastructure, buildings, and the construction sector [56,57]. Additionally, copper demonstrates remarkable longevity in use, with estimates indicating that nearly two-thirds of all copper produced since 1900 was still in circulation by 2010 [57,58]. This extended lifecycle, coupled with growing demand, implies that recycling alone will be insufficient to fully address concerns regarding future energy-system copper availability [58]. To address these challenges, strategies extending beyond recycling are essential [52,54,56,59]. Substitution efforts are already in progress, with fibre optics increasingly replacing copper in data-transmission networks and aluminium serving as an alternative in power-transmission lines.
Figure 2 illustrates the geographical concentration of critical raw materials across the supply chains of selected clean-energy technologies and energy systems, summarising the key points discussed above.

Classification Parameters (Criticality, Availability, Recyclability)

Raw materials are designated as “critical” following assessments of technological, economic, geopolitical, and social factors, together with their strategic importance for industrial and energy systems. The European Commission has undertaken several initiatives to address raw material availability and accessibility, beginning with the establishment of the Raw Materials Supply Group in the 1970s–1980s and culminating in the launch of the European Union Raw Materials Initiative in 2008 [60]. In September 2020, the European Raw Materials Action Plan was announced, introducing the establishment of the European Raw Materials Alliance (ERMA) to strengthen supply resilience for the clean-energy transition.
The European Union Raw Materials Initiative entails updating the list of CRMs every three years, incorporating the perspectives of EU member states. In assessing raw materials, each is assigned a score for Supply Risk (SR) and Economic Importance (EI). Supply Risk accounts for factors such as the geographical concentration of global production, the EU’s dependence on imports, trade restrictions imposed by supplier countries, policies of producer nations (including environmental and social aspects), as well as recycling rates and substitutability within energy and industrial sectors. Economic Importance, by contrast, reflects the material’s relevance to strategic industrial and energy activities. Specifically, the European Commission designates a material as “critical” when it attains a Supply Risk (SR) score greater than 1 and an Economic Importance (EI) score exceeding 2.8. In its most recent 2023 assessment [2], 70 materials were evaluated, of which 34 were included in the proposed CRM list, as shown in Table 1. This evaluation treated PGMs, LREEs, and HREEs as grouped categories rather than individual elements.

2.3. Current Methods for the Analysis of Critical Raw Materials

2.3.1. Review of Existing Methodologies

Once the key issues defining critical raw materials are identified, the existing methodologies for their assessment are reviewed. Subsequently, the ESSENZ method is applied to calculate relative scores, allowing for a comparison of criticality indicators across ten raw materials relevant to the battery and clean-energy supply chain. This approach yields an overall ranking of each producing region according to its relative criticality scores. In this way, the underlying supply risks and resilience factors of each region can be analysed in detail [61]. Using the methodology developed by the International Round Table on Materials Criticality (IRTC), the main raw materials employed in lithium-ion batteries (e.g., Li, Co, Ni, Mn, and graphite) are assessed to determine their supply risks and strategic relevance within the broader context of sustainability and energy systems [62].
The Abiotic Depletion Potential (ADP) method, which quantifies primary resource depletion, has been one of the most widely applied approaches in Life Cycle Assessment (LCA) for over two decades. In recent years, however, new methods have been developed to better capture aspects such as reduced resource accessibility and material dissipation, both at the Life Cycle Inventory (LCI) and Life Cycle Impact Assessment (LCIA) levels [63].
Specifically, these approaches include the Environmental Dissipation Potential (EDP) [64], the Abiotic Resource Project (ARP) method [65], the Average Dissipation Rate and Lost Potential Service Time (ADR/LPST) framework [66], and the Joint Research Centre–LCI (JRC-LCI) method [67], complemented by the JRC price-based approach [68] to reflect the loss of economic value. The ADP Ultimate Reserves, EDP, and ARP methods are grounded in assumptions that are fundamental for modelling but remain scientifically debated. ADP Ultimate Reserves and EDP, in particular, do not account for the economic value of mineral resources, whereas the JRC-LCI method (and, to some extent, ARP), when combined with the JRC price-based approach and the ADR/LPST endpoint, explicitly incorporate this dimension. Overall, two main schools of thought can be distinguished among recent methodologies addressing mineral resource use in LCA: one builds on existing LCI databases and employs assumptions and proxies (e.g., ADR/LPST, EDP, ARP), while the other aims to construct new LCIs (e.g., the JRC-LCI) method [63].
The study in [19] applies a novel R2 decomposed connectedness approach to investigate contemporaneous and lagged spillover effects between critical commodity markets and high-tech and energy-intensive sectors in China. The GJR-GARCH-MIDAS model [69] is also employed to assess the impact of trade policy uncertainty on these spillovers. The analysis reveals significant return and volatility transmissions between critical commodity and high-tech markets in China, with critical commodities acting primarily as spillover transmitters and high-tech sectors as the main receivers.
Circularity indicators proposed in [8], including the Material Circularity Indicator (MCI) and the Circularity Indicator (CI), integrate circular economy principles with Life Cycle Assessment (LCA). These indicators broaden the cradle-to-grave perspective of a product or system by considering material flows and the energy requirements of both primary and secondary production. However, they do not specifically capture the role of critical raw materials or distinguish their impacts from those of other raw materials in practical applications.
An additional analysis reported in [70], reviews and systematises the indicators used in supply risk assessment by compiling them into composite supply risk scores. In total, 618 individual indicators were identified and grouped into ten categories: concentration, scarcity, political instability, regulations, by-product dependence, reliance on primary production, demand growth, lack of substitution options, price volatility, and import dependence. For each category, the original formulas were rescaled to a common normalised supply risk score ranging from 0 to 100 [70].

2.3.2. Research Gaps and Study Objectives

The literature review reveals several knowledge gaps and research directions that this article aims to address. As innovation and technological progress accelerate, the use of critical raw materials (CRMs) continues to rise, and their growing demand is widely acknowledged. What remains insufficiently explored, however, is how to quantify the specific impacts of CRMs across the entire life cycle of energy-related products and systems. Existing approaches typically assess raw materials as a whole, without differentiating CRMs. The uniqueness of CRMs stems from their elevated supply risk and criticality, combined with substantial environmental, technological, economic, geopolitical, and social implications.
One of the main objectives of this article is to establish a comprehensive sustainability and energy-assessment framework for critical raw materials (CRMs) by applying a set of indicators within a Multi-Criteria Analysis (MCA) approach. Specifically, the study employs the TOPSIS method to reassess existing indicators according to multiple criteria and introduces new metrics, such as the Gini Index, to enable a more robust and nuanced evaluation. The detailed discussion of these indicators is provided in the following sections.
In this study, the TOPSIS analysis is applied for the first time to compare two scenarios: electric vehicles and diesel vehicles. The method generates comparative insights by ranking the performance of indicators, grouped into macro-categories, for each scenario and thereby identifies the more sustainable option. Furthermore, this article seeks to close the identified gap by introducing a method that explicitly integrates CRMs into life-cycle impact assessment (LCIA) for energy systems. To ensure practical applicability, the method is implemented in the SimaPro v10.2 software, leveraging the existing ReCiPe 2016 Midpoint (M) and Endpoint (E) methods. A key contribution of this paper is the demonstration of the method’s practical utility through a real clean-energy case study. By comparing two scenarios (electric and diesel vehicles) the impact of the electric vehicle battery with respect to CRMs is assessed, providing valuable insights into the sustainability trade-offs of CRM use in energy technologies.

3. Materials and Methods

3.1. Multicriteria Analysis (TOPSIS)

The TOPSIS method identifies the alternative that is closest to the ideal solution, defined as the vector of the best performance values, while simultaneously being farthest from the negative-ideal solution, defined as the vector of the worst performance values [71]. The TOPSIS method assumes that all criteria are formulated as maximisation objectives. For minimization criteria, values can be transformed by expressing them relative to the worst (i.e., maximum) criterion value, thereby converting them into maximisation form.
After this transformation, the criterion can be considered a maximisation objective. The TOPSIS procedure, applied in this study to the comparison of energy-related scenarios, can then be summarised in the following steps:
  • The initial decision matrix values Xij are normalised to obtain X ¯ ij values using the following relationship:
    X ¯ i j = X i j i = 1 n X i j 2 1 / 2
Depending on the type of criterion considered in the evaluation, an ideal value is then assigned to be maximised (benefit criterion) or minimised (cost criterion).
2.
The elements of the weighted decision matrix V are calculated as Vij = Wj × X ¯ ij, where Wj denotes the weight assigned to the j-th criterion. If equal weights are assumed for all criteria, then Vij = X ¯ ij.
3.
The ideal variant composed of criteria values ( V 1 + , V 2 + , …, V j + ) and the basal variant composed of criteria values ( V 1 , V 2 , …, V j ) where V j + = maxi (Vij) and V j = mini (Vij), j = 1, 2, …, k are determined based on elements of matrix V.
4.
The distances of variants from the ideal and basal variants are calculated pursuant to formulas:
S i + = j = 1 k V i j V j + 2 1 / 2
S i = j = 1 k V i j V j 2 1 / 2
5.
The Performance score Pi is finally determined as relative distance of variants from the basal variant using the relationship below.
P i = S i S i + S i + ,         i = 1 , 2 , , n .
The performance score Pi ranges from 0 to 1, where 0 corresponds to the negative-ideal solution and 1 corresponds to the positive-ideal solution. Alternatives are ranked in descending order of their Pi values, with higher scores indicating closer proximity to the ideal solution [71].
The implementation of the TOPSIS analysis began with the definition of five macro-categories of indicators: Supply Chain, Technological, Environmental, Economic, Legislative, all related to the assessment of sustainability and energy-system performance. These categories were derived from an initial review of 18 documents and research papers, mainly addressing critical raw materials and the emerging clean-energy technologies associated with them. Based on these documents, the main issues identified in Section 2 were listed and classified into the predefined categories. The issues with the highest frequency of citation, and thus considered the most relevant, were retained. Each selected issue was then associated with the most appropriate indicator, yielding six supply-chain indicators, six technological indicators, six environmental indicators, four economic indicators, and five legislative indicators. To perform the TOPSIS analysis, each indicator was assigned a specific weight. A Likert-type rating scale is employed [72]. The Likert scale, or rating system, is a measurement tool commonly used in research to assess attitudes, opinions, and perceptions [72]. Owing to its flexibility, it is applied across a wide range of fields, from customer satisfaction surveys to market research, and, as in this case, to sustainability and energy-impact assessment. Each item on the scale provides a set of possible responses, typically rated from 1 (Strongly Disagree) to 5 (Strongly Agree). The evaluation of each indicator according to the Likert scale is presented in Supplementary Materials (Table S1).

3.2. Gini Index and Raw Material Extraction/Reserve Index (RERI)

The Gini Index (GI) and the Raw Material Extraction/Reserve Index (RERI), presented in Table S1, are newly developed and specifically adapted for critical raw materials. They are of particular relevance to energy-system sustainability assessment, as they play a central role in addressing the research objectives and in reinforcing the robustness of the LCA analysis. These two indices have been specifically designed for critical raw materials to capture extraction intensity and supply concentration within energy and industrial systems [73]. The Raw Material Extraction/Reserve Index (RERI) for critical materials is conceptually inspired by the Abiotic Depletion Potential (ADP) factor, which in LCA quantifies the potential depletion of mineral and fossil resources, with indirect implications for human health and ecosystem quality as system inputs are extracted [6]. The ADP method, originally developed by [74], is based on a resource scarcity indicator derived from the ratio between the world’s annual production (P, in kg/year) and the estimated ultimate global reserve (R, in kg) of the element [75]. In this study, the index has been calculated specifically for the 34 critical raw materials (CRMs) identified in [16]. The Raw Material Extraction/Reserve Index (RERI) ranges from 0 to 1: a value of 0 indicates no production of the material, while a value of 1 indicates that annual production is equal to the available reserves. The lower the index value, the greater the relative availability of the material, whereas higher values indicate stronger extraction pressure on reserves and thus a higher long-term depletion risk. The Gini Index, as previously outlined, is a statistical measure of dispersion that captures inequality in the distribution of suppliers. Applied to critical raw materials, it serves to quantify the geographical concentration of production within global energy and material supply chains, with higher values indicating stronger dependence on a limited number of producing countries [2]. It is therefore intended to capture the extent of reserve diversification and dependence on the world’s largest producers. The Gini Index ranges from 0 to 1: a value of 0 denotes a perfectly even distribution, with all producing countries contributing equally, whereas a value of 1 denotes complete concentration in a single country, with all other contributions equal to zero.
To calculate the Gini Index for each CRM:
  • Define the dataset: Consider a set of values x1, x2, …, xn, where each xi represents the annual production of the CRM in country I (n being the total number of producing countries). The values are arranged in ascending order, such that x1 ≤ x2 ≤ ⋯ ≤ xn.
  • Create the absolute difference matrix: Construct a matrix D where each element represents the absolute difference between every pair of production values:
    D i j = | x i x j |
    where Dij denotes the absolute difference between the production values xi and xj.
  • Calculate the sum of absolute differences: Add up all the elements of the absolute difference matrix:
    S = i = 1 n j = 1 n D i j
    where S represents the total sum of all absolute differences.
  • Calculate the average of the values: Compute the arithmetic mean of the production values x1, x2, …, xn:
    T = i = 1 n x i n
    where T represents the average of the production values.
  • Normalise the sum of absolute differences. The total sum is then normalised by the average value T and by the square of the number of countries. The Gini Index is thus calculated as:
    G = i = 1 n j = 1 n | x i x j | 2 n 2   i = 1 n x i n
    or
    G = S 2 n 2 T
    where G denotes the Gini Index, S is the sum of all absolute differences, n is the number of countries, and T is the average production value.
This formula is then applied to each CRM considering the specific number of producing countries for that material (n). The Gini Index is employed both as a standalone indicator and as a normalisation factor for the Raw Material Extraction/Reserve Index (RERI) within the LCA framework for energy and industrial systems presented in Section 4. It is noteworthy that, for a given material, the Raw Material Extraction/Reserve Index (RERI) may be low while the Gini Index is high, or vice versa, thereby affecting the outcome of the final normalisation. Both indices are presented in Table 2.
These two indices are integrated into the LCA analysis presented in Section 4.3.4, which is carried out using the SimaPro software. X(i) denotes the value of the selected indicator (e.g., RERI or Gini Index) calculated for the i-th CRM. For each material, the result is calculated as the product of the Raw Material Extraction/Reserve Index (RERI), the Gini Index (GI), and the mass of the specific material used in the energy-related process under study. The operation is presented below:
X i = R a w   m a t e r i a l   e x t r a c t i o n R a w   m a t e r i a l   r e s e r v e i n d e x × G i n i   i n d e x × M a s s   ( i )
The combination of the Raw Material Extraction/Reserve Index (RERI) and the Gini Index was expressed through a multiplicative relationship (RERI × Gini) to capture the environmental criticality and supply-chain concentration in energy and industrial systems. This formulation reflects how the overall supply risk increases non-linearly when a material is both environmentally burdensome and geographically concentrated. The multiplicative aggregation was therefore preferred to an additive one, as it better represents the joint amplification of environmental and geopolitical pressures on resource availability and energy-system resilience.
Alternative formulations could also be considered to integrate depletion and concentration risk, such as additive or weighted-sum combinations, or multi-criteria composite indices based on normalised scores. These approaches are suitable when the two dimensions are treated as linearly independent. In the present framework, however, depletion and concentration are regarded as interdependent and mutually reinforcing, which makes the multiplicative relationship (RERI × Gini) the most appropriate for representing their synergistic interaction and amplifying the combined effect of resource scarcity and supply-risk concentration.

3.3. Life Cycle Assessment (LCA)

3.3.1. LCA Methodology Introduction and Description

According to ISO 14040:2006, Life Cycle Assessment (LCA) is defined as “the compilation and evaluation of the inputs, outputs and potential environmental impacts of a product system throughout its life cycle” [85]. LCA therefore serves as an analytical tool to evaluate the environmental impacts of products across all phases of their life cycle, including resource extraction, material production, component fabrication, and final product manufacturing. Additionally, LCA covers the use phase of the product and its post-consumption management, which may include reuse, recycling, or final disposal. This comprehensive perspective is commonly referred to as a “cradle-to-grave” assessment [73].
The complete set of unit processes that make up the life cycle of a product is referred to as the product system. The environmental burden comprises all forms of environmental impact, including resource extraction, emissions of hazardous substances, and various categories of land use [73]. The term “product” is employed in its broadest sense, covering both tangible goods and services, and applies at both operational and strategic levels. In comparative LCA studies, however, the foundation of the comparison is not the products themselves.
While LCA primarily relies on a quantitative approach whenever possible, it is important to acknowledge that, in cases where quantitative data are lacking, qualitative factors may and should be incorporated to provide a more comprehensive understanding of the environmental impacts involved [73]. Most notably, a cradle-to-grave analysis adopts a holistic approach by integrating environmental impacts into a coherent framework that covers all stages of a product’s life cycle, regardless of when or where these impacts occur. A primary rationale for adopting this method is that the final consumption of products constitutes a pivotal driver of the economy. Consequently, it offers significant opportunities for indirect environmental management across the entire chain of processes associated with a product.
Goal and scope definition—LCA begins with a clear and deliberate definition of the research question. Why has the study been undertaken? What questions is it intended to answer, and for whom? The definition of the objective establishes the context of the LCA study and provides the basis for defining the scope, within which the evaluation is framed and described, primarily in relation to the stated goals. This includes: (i) the precise definition of the target functional unit; (ii) the scope of the product system, specifying which activities and processes within the product life cycle are to be considered; (iii) the selection of assessment parameters; (iv) the specification of geographical and temporal boundaries together with the technological level relevant to the product system processes; (v) the choice of the appropriate perspective for the study (e.g., attributional or consequential); (vi) the identification of the need for a critical review.
Defining the goal and scope is crucial for the interpretation of research results, as these choices determine both the collection of data and the way in which the system is modelled and evaluated.
Inventory Analysis—Once the objective and scope have been defined, the Life Cycle Inventory (LCI) phase consists of collecting data on the physical flows within the product system, including resources, materials, semi-finished and finished products, emissions, waste, and co-products. The analysis covers all processes identified within the product system, with flows scaled to the product reference flow defined by the functional unit. Because most product systems are highly complex, the inventory analysis frequently relies on generic data for many processes, obtained from unit process databases or cradle-to-gate datasets. These represent the input and output flows of individual processes, such as material production, energy generation, transportation or waste management. The outcome is the Life Cycle Inventory (LCI), a list of quantified elementary flows for the product system associated with providing the service or function defined by the functional unit.
Impact assessment—Based on the LCI, the Life Cycle Impact Assessment (LCIA) phase translates the physical flows and interventions of the product system into potential environmental impacts using knowledge and models from environmental science. In line with ISO 14040, the LCIA framework comprises five elements, of which the first three are mandatory:
  • Selection of impact categories. Impact categories are selected to reflect the assessment parameters defined in the scope. For each category, a representative indicator is identified, along with an environmental model used to quantify the contribution of elementary flows to that indicator.
  • Classification. Elementary flows from the inventory are allocated to impact categories based on their potential contribution to the corresponding category indicators.
  • Characterisation. For each impact category, environmental models are used to quantify the contribution of the assigned elementary flows to the category indicator, typically through characterisation factors (e.g., conversion of greenhouse gases into CO2-equivalents).
  • Normalisation. It provides information on the relative magnitude of the characterised values across different impact categories by expressing them in relation to a common set of reference impacts, one for each category. The outcome is a normalised impact profile of the product system, in which all category indicator values are presented on a comparable scale.
  • Grouping and weighting. These procedures facilitate the comparison of impact categories either by grouping and ranking them according to their perceived significance, or by applying weighting factors that express the relative importance of each category in quantitative terms.
Interpretation—The interpretation phase was conducted in accordance with ISO 14044 guidelines [86], taking into account the study objectives, boundaries, and assumptions.

3.3.2. Development of an Innovative Methodology for Assessing CRMs in LCA

The most innovative contribution of this study lies in the introduction of a newly developed methodology aimed at characterising the role of Critical Raw Materials (CRMs) across the life cycle of a product, component, or energy system. The method generates specific indicators designed to quantify the relative weight of CRMs within production processes, thereby providing a more nuanced perspective than conventional resource depletion metrics. In addition, the framework allows for the development of tailored indicators that target CRMs of strategic importance for battery and clean-energy technology manufacturing, namely lithium, cobalt, manganese, nickel, and graphite, ensuring that the assessment reflects sector- and energy-specific material dependencies. What sets this method apart from existing approaches is its specific focus on the nature and criticality of the materials under consideration. Existing approaches (as mentioned in Section 2.2) quantify the impact of all raw materials used in the production process, placing materials such as iron, silver, gold, and tin on the same level as the critical materials listed above. Instead, the varying criticality of materials should be considered in terms of both their depletion and geographical distribution. In the implementation of the new method, the previously defined Resource-Depletion Index (Raw Material Extraction/Reserve Index) and the Gini Index were applied as characterisation factors within the LCA framework for energy and industrial applications. The method is structured into two approaches, referred to as Method 1 and Method 2. In Method 1, the results describe the impact of each individual CRM, based on the Resource-Depletion Index and on the Resource-Depletion Index scaled by the Gini Index. In Method 2, the results describe the impact of specific categories, namely all CRMs, CRMs used in battery production, and rare earth elements (REEs). The implementation of the method is presented in Section 4.
While both approaches are based on the same underlying indicators (RERI and Gini Index), they differ in purpose and level of detail. Method 1 provides a material-specific analysis that quantifies the contribution of each individual critical raw material to depletion and supply risk, supporting hotspot identification and methodological research. Method 2, in contrast, aggregates materials into functional categories (all CRMs, CRMs for batteries, and REEs), enabling a more streamlined and user-friendly implementation in LCA software. The two methods are therefore complementary: Method 1 ensures analytical transparency, whereas Method 2 enhances applicability and scalability for practitioners.

4. Results and Discussion

4.1. TOPSIS Analysis

Interpretation of the Rankings and Weightings of the Indicators

In this application of the TOPSIS analysis, two scenarios are compared: Scenario 1, the electric passenger car, and Scenario 2, the diesel passenger car. The objective is to assess the sustainability implications of each indicator listed in Table S1 for the two scenarios. To assign a Likert-scale value (ranging from 1 to 5) to each indicator, reference was made to the 18 papers considered in the review. Based on the number of citations, the expected impact of the indicator on future technological developments, and the relevance attributed in each paper, values from 1 to 5 were assigned, as reported in Table 3. Furthermore, depending on the nature of the indicator, the ideal target was defined either as maximisation or minimisation, as specified in the last column of Table 3.
The impact level scores reported in Table 3 were assigned directly by the authors, based on the comparative analysis of the 18 papers included in the literature review. This expert-based classification aimed to ensure internal consistency and to highlight the most recurrent and influential indicators identified across studies. However, the authors acknowledge that this approach involves a degree of subjectivity. Future developments of the framework should include the design of a structured questionnaire involving key stakeholders, i.e., LCA practitioners, policy experts, and industry representatives, particularly from the clean-energy and resource-management sectors, to validate and refine the indicator weighting. Such participatory assessment would increase transparency and reduce uncertainty in the impact-level classification.
Once the Likert-scale values were assigned to the indicators, a sensitivity analysis was carried out by varying the weight of each macro-category according to predefined unitary variation ratios (bₖ). Specifically, the original weight of a given category was multiplied by different bₖ values (0.01, 0.5, 1, 1.5, 2, and 3), thus simulating scenarios in which that category became almost negligible (bₖ = 0.01), moderately reduced (bₖ = 0.5), unchanged (bₖ = 1), moderately emphasised (bₖ = 1.5), or strongly emphasised (bₖ = 2 and 3). In each scenario, the weights of the remaining categories were proportionally rescaled to ensure that the total always equalled 100%. This procedure tested the robustness of the TOPSIS results against variations in the relative importance assigned to each category.
After the weighting, the TOPSIS method described in Section 3.1 was applied. The Performance score (Pi) was calculated for the two scenarios (electric and diesel passenger cars), across the different weights of the macro-categories. It should be noted that, for Pi, a value of 0 represented the baseline variant, while a value of 1 corresponded to the ideal variant. The results obtained are described below, providing insight into the sustainability and energy-performance trade-offs between the two vehicle types.
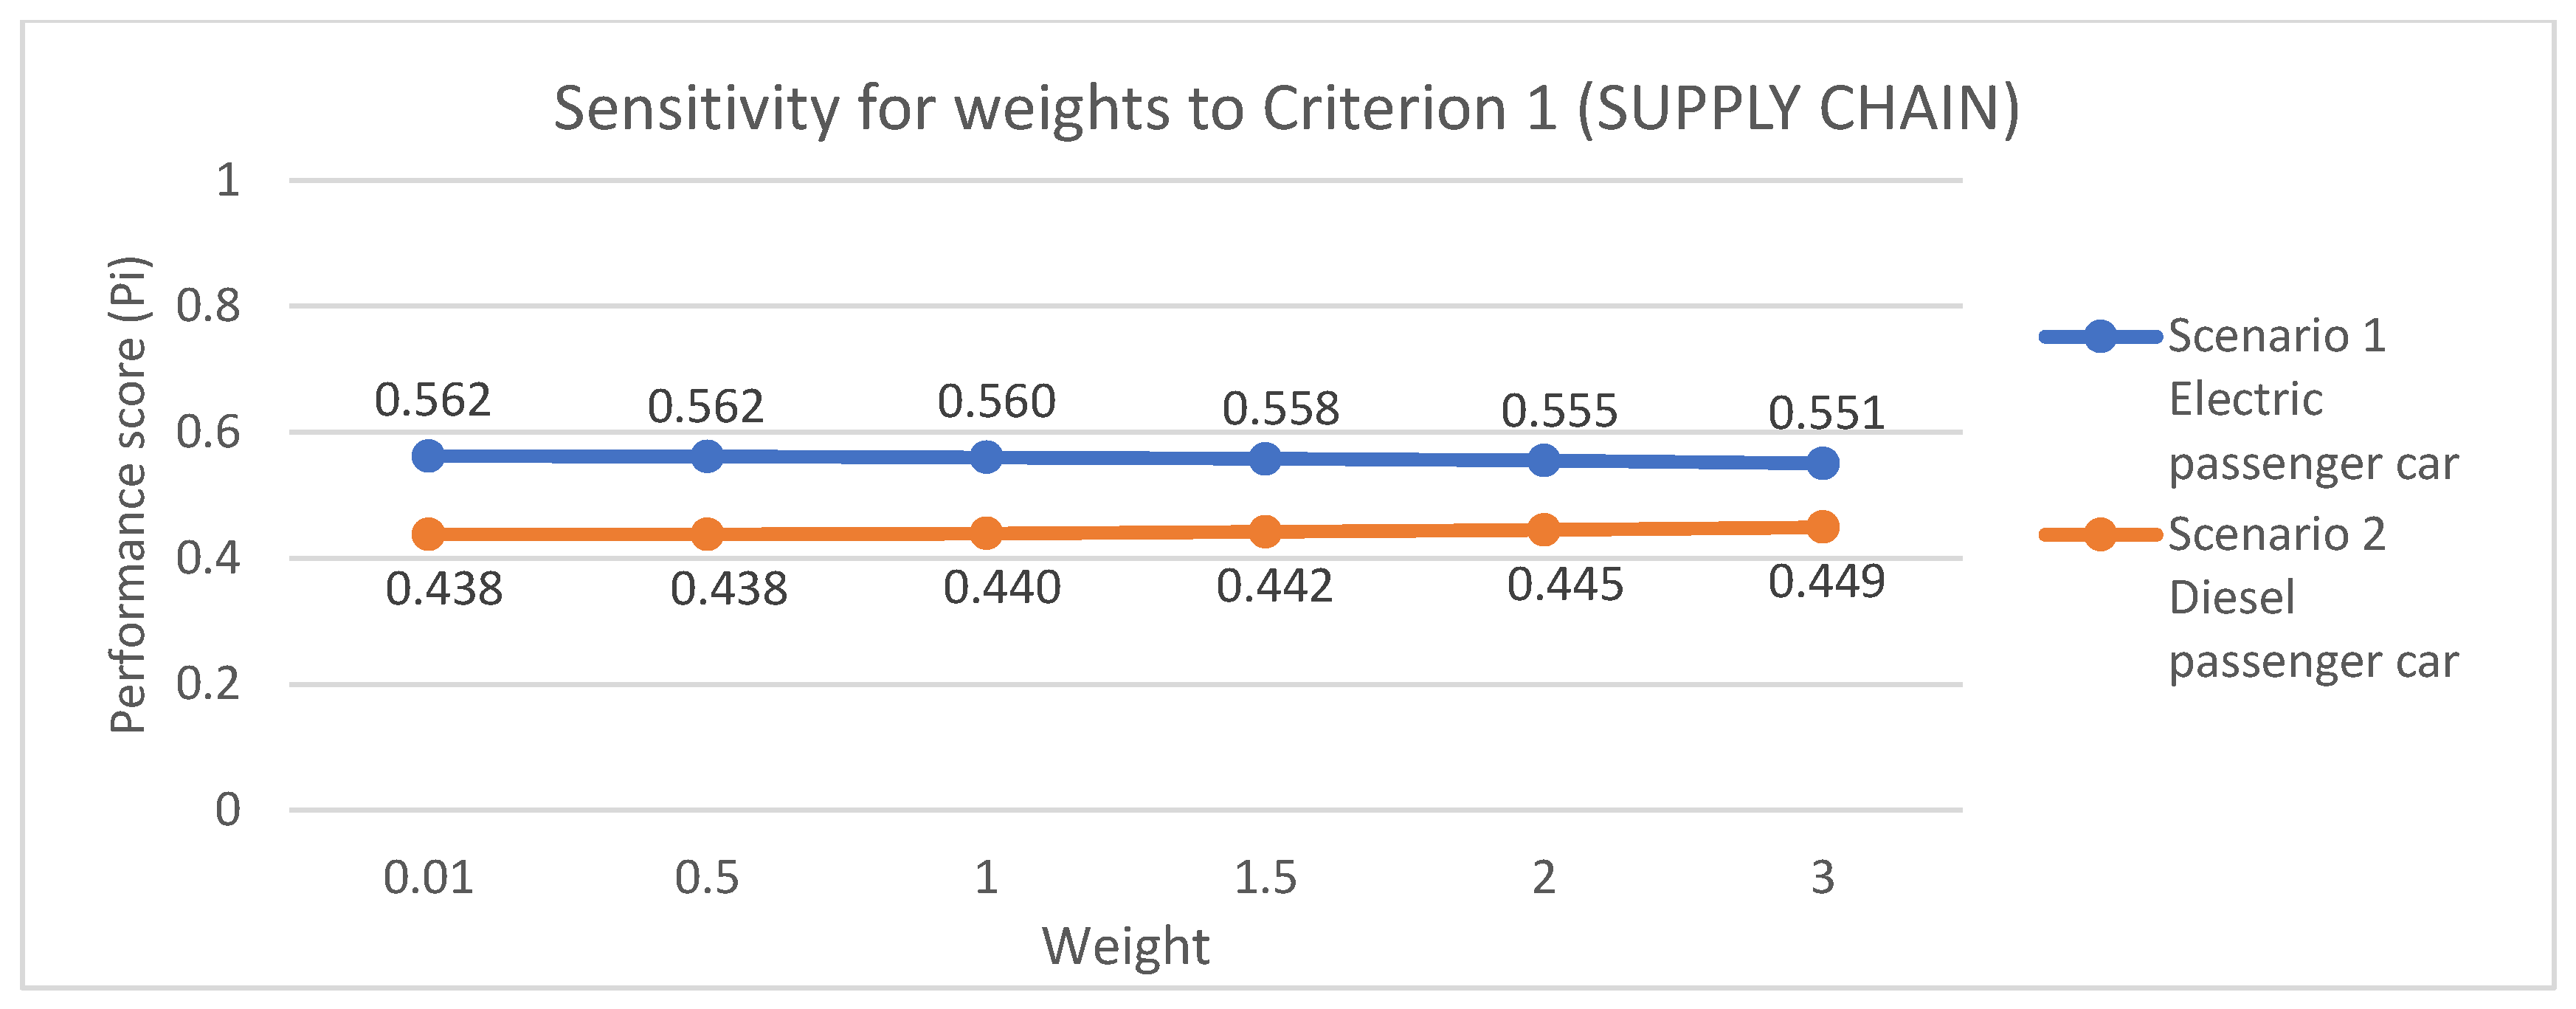
Criterion 1: The results, obtained by weighting the Supply Chain category, did not show a change in the ranking. The high-performance score values for Scenario 1 indicated that the results were closer to the ideal variant than those of Scenario 2. Furthermore, the absence of a reversal in the ranking when varying the weights demonstrates that the outcome was more consistent, as it was entirely independent of the weighting. This trend is also evident in Figure 3, where the performance score curves for the two scenarios appear almost parallel.
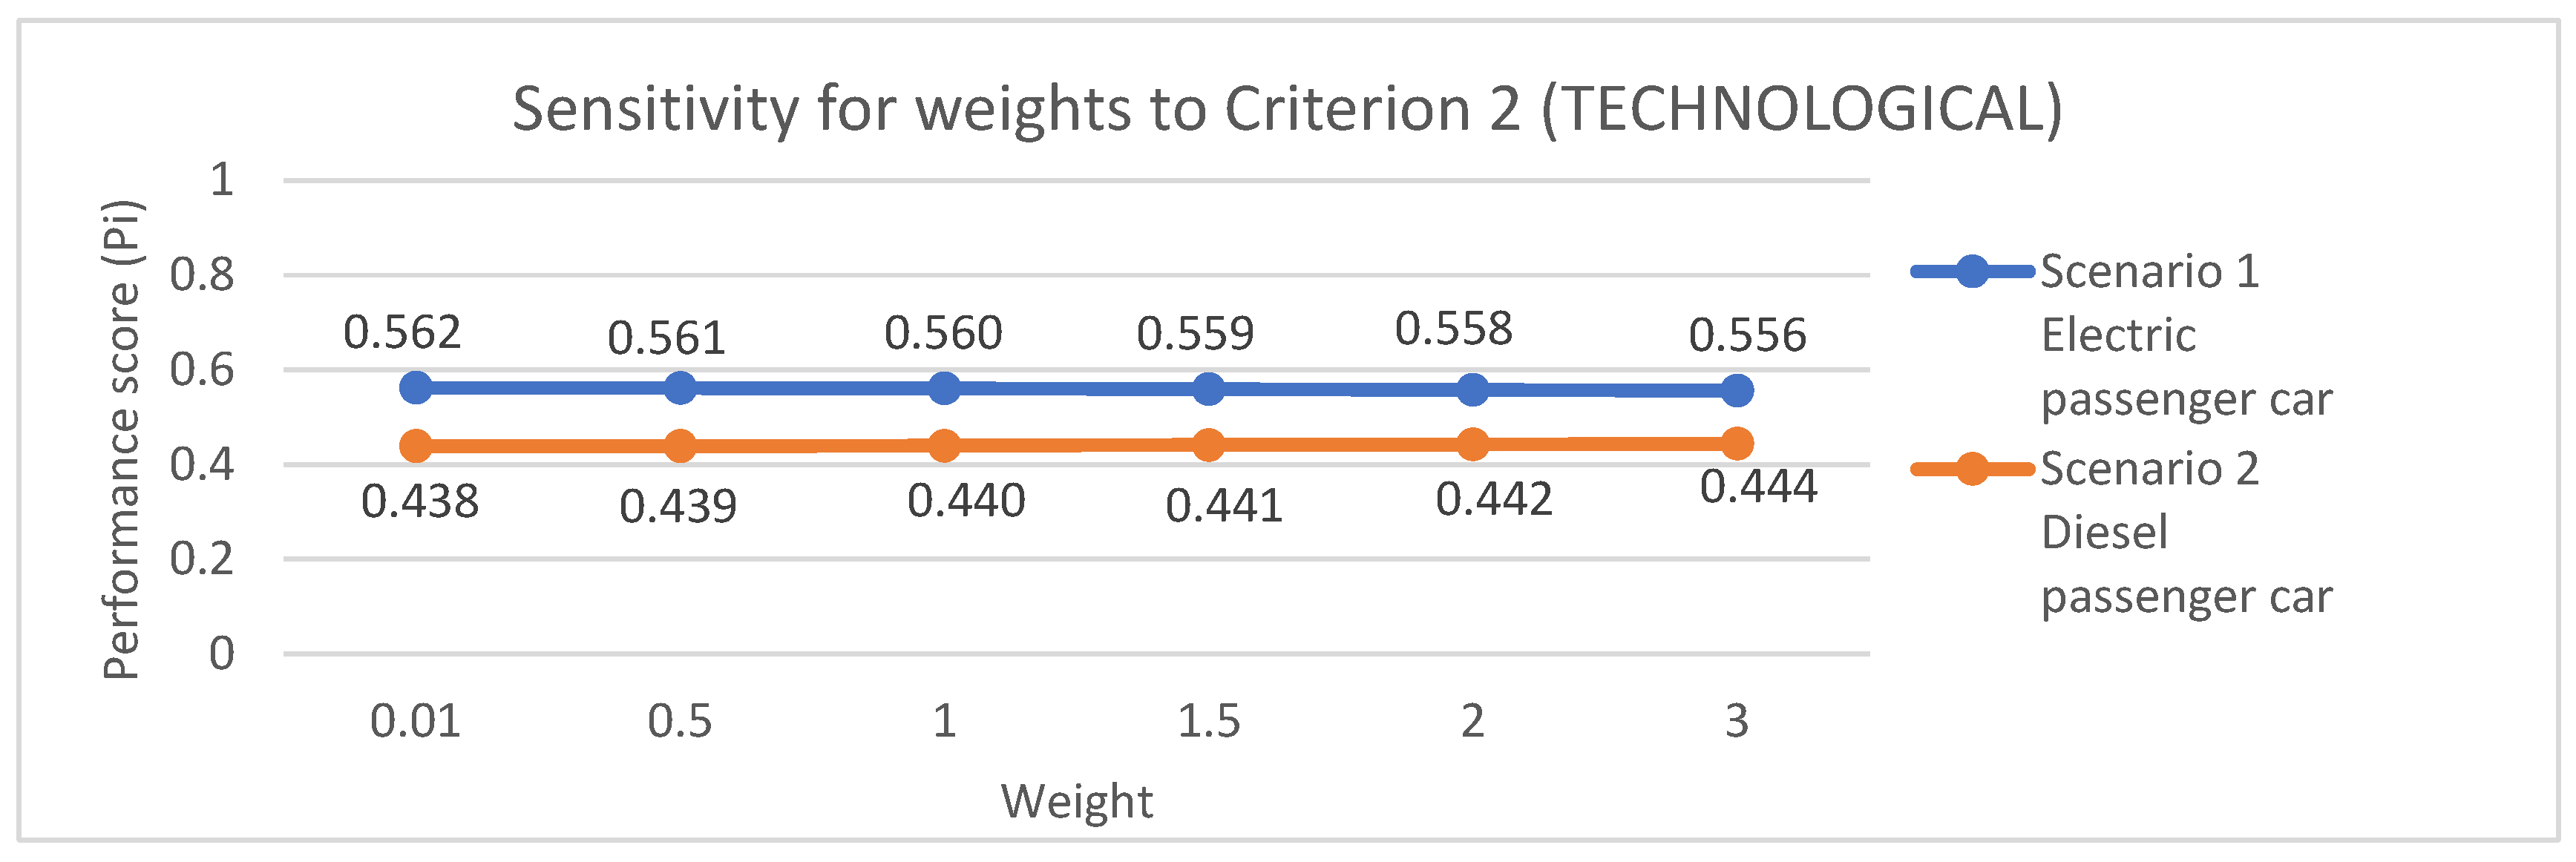
Criterion 2: The results, obtained by weighing the Technological category, did not show a change in the ranking. The higher performance score values for Scenario 1 indicated that its outcomes were closer to the ideal variant than those of Scenario 2. Furthermore, the absence of a reversal in the ranking when varying the weights demonstrates that the result was more consistent, as it was entirely independent of the weighting. This trend is also evident in Figure 4, where the performance score curves for the two scenarios appear almost parallel. The outcome obtained is similar to that of Criterion 1.
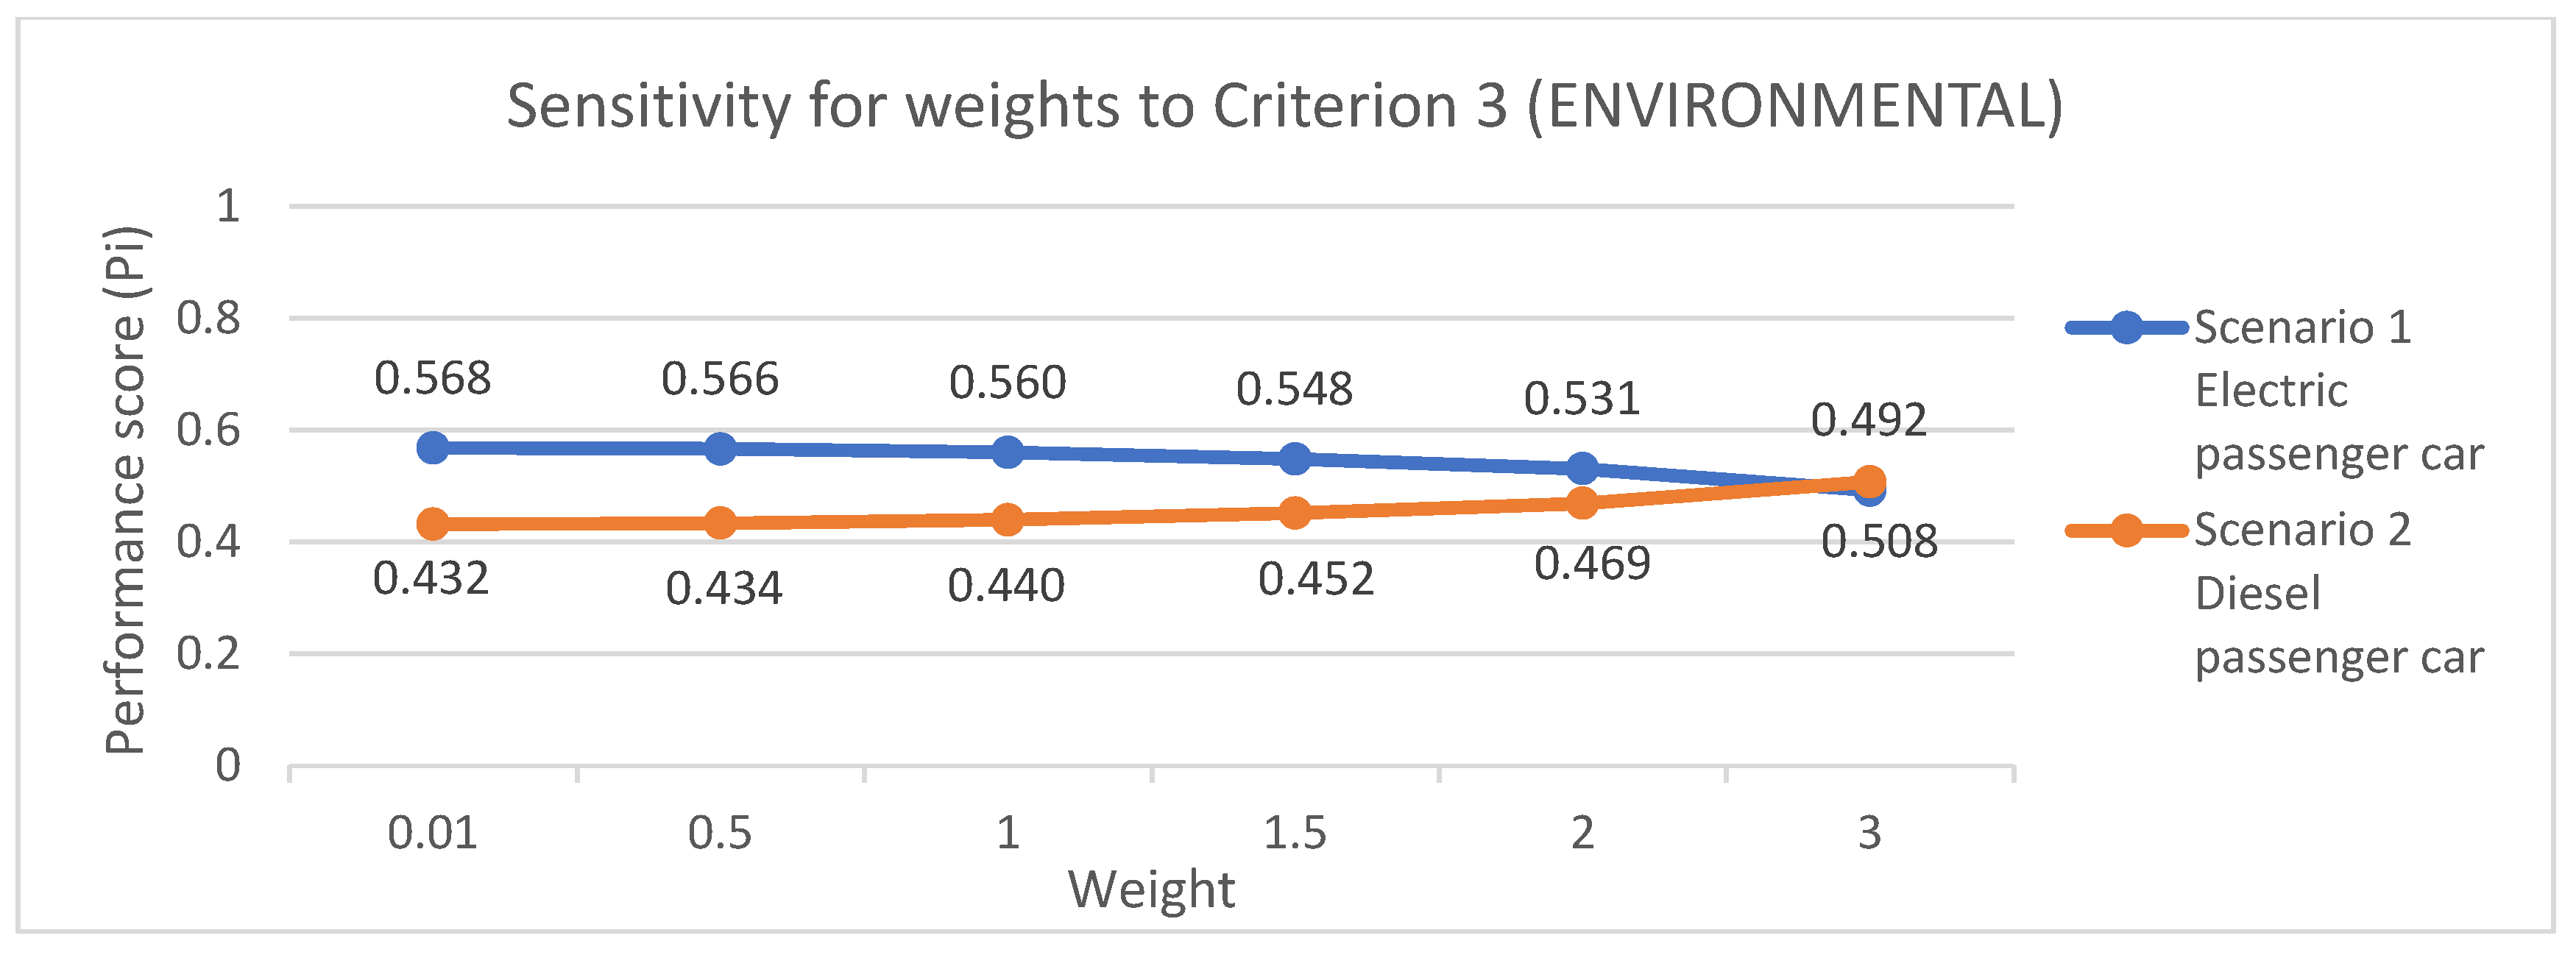
Criterion 3: As shown in Figure 5 the performance scores of Scenario 1 and Scenario 2 remain unchanged up to a weighting factor of 2, indicating that Scenario 1 maintains its overall advantage when environmental considerations are moderately weighted. However, when the weight is increased to 3, a reversal in the ranking occurs, with Scenario 2 surpassing Scenario 1 and becoming closer to the ideal solution. This trend reflects the fact that Scenario 2 performs better in the environmental dimension, and its advantage becomes dominant only when the environmental category is given substantial importance. The nearly parallel progression of the performance curves up to a weighting factor of 2 highlights the stability of the initial ranking, while the crossover at weight of 3 marks a critical threshold beyond which the weighting of environmental performance substantially influences the overall outcome.
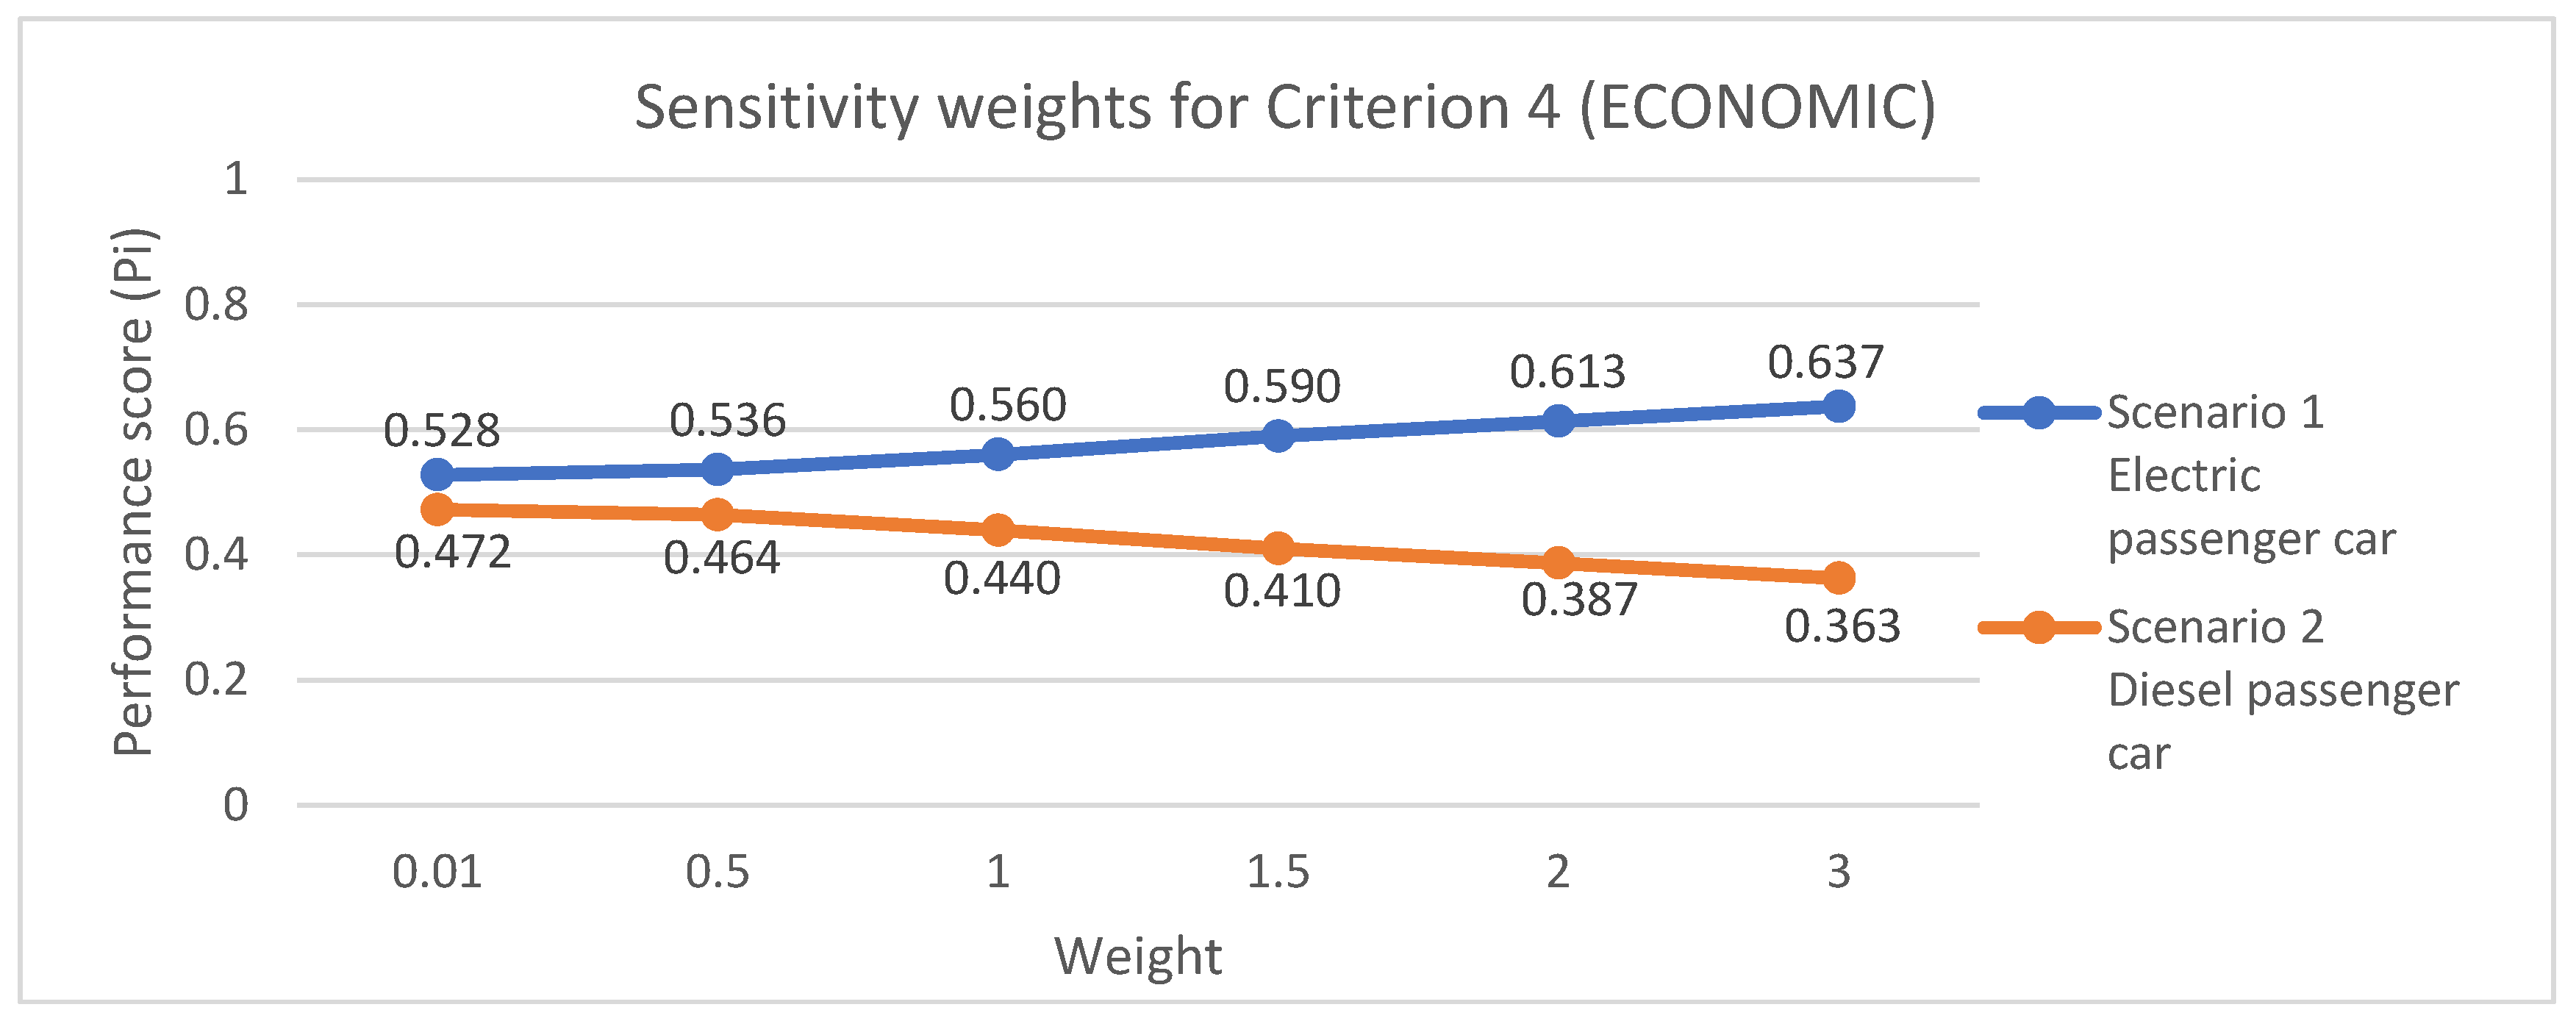
Criterion 4: The results, obtained by weighing of the Economic category, do not show a change in the ranking. The higher performance score values for Scenario 1, indicate that its outcomes are closer to the ideal variant, while the lower performance score values for Scenario 2 show that its outcomes move further away from the ideal variant. This trend is evident in Figure 6, where the performance score curves for the two scenarios diverge as the weighting factor increases.
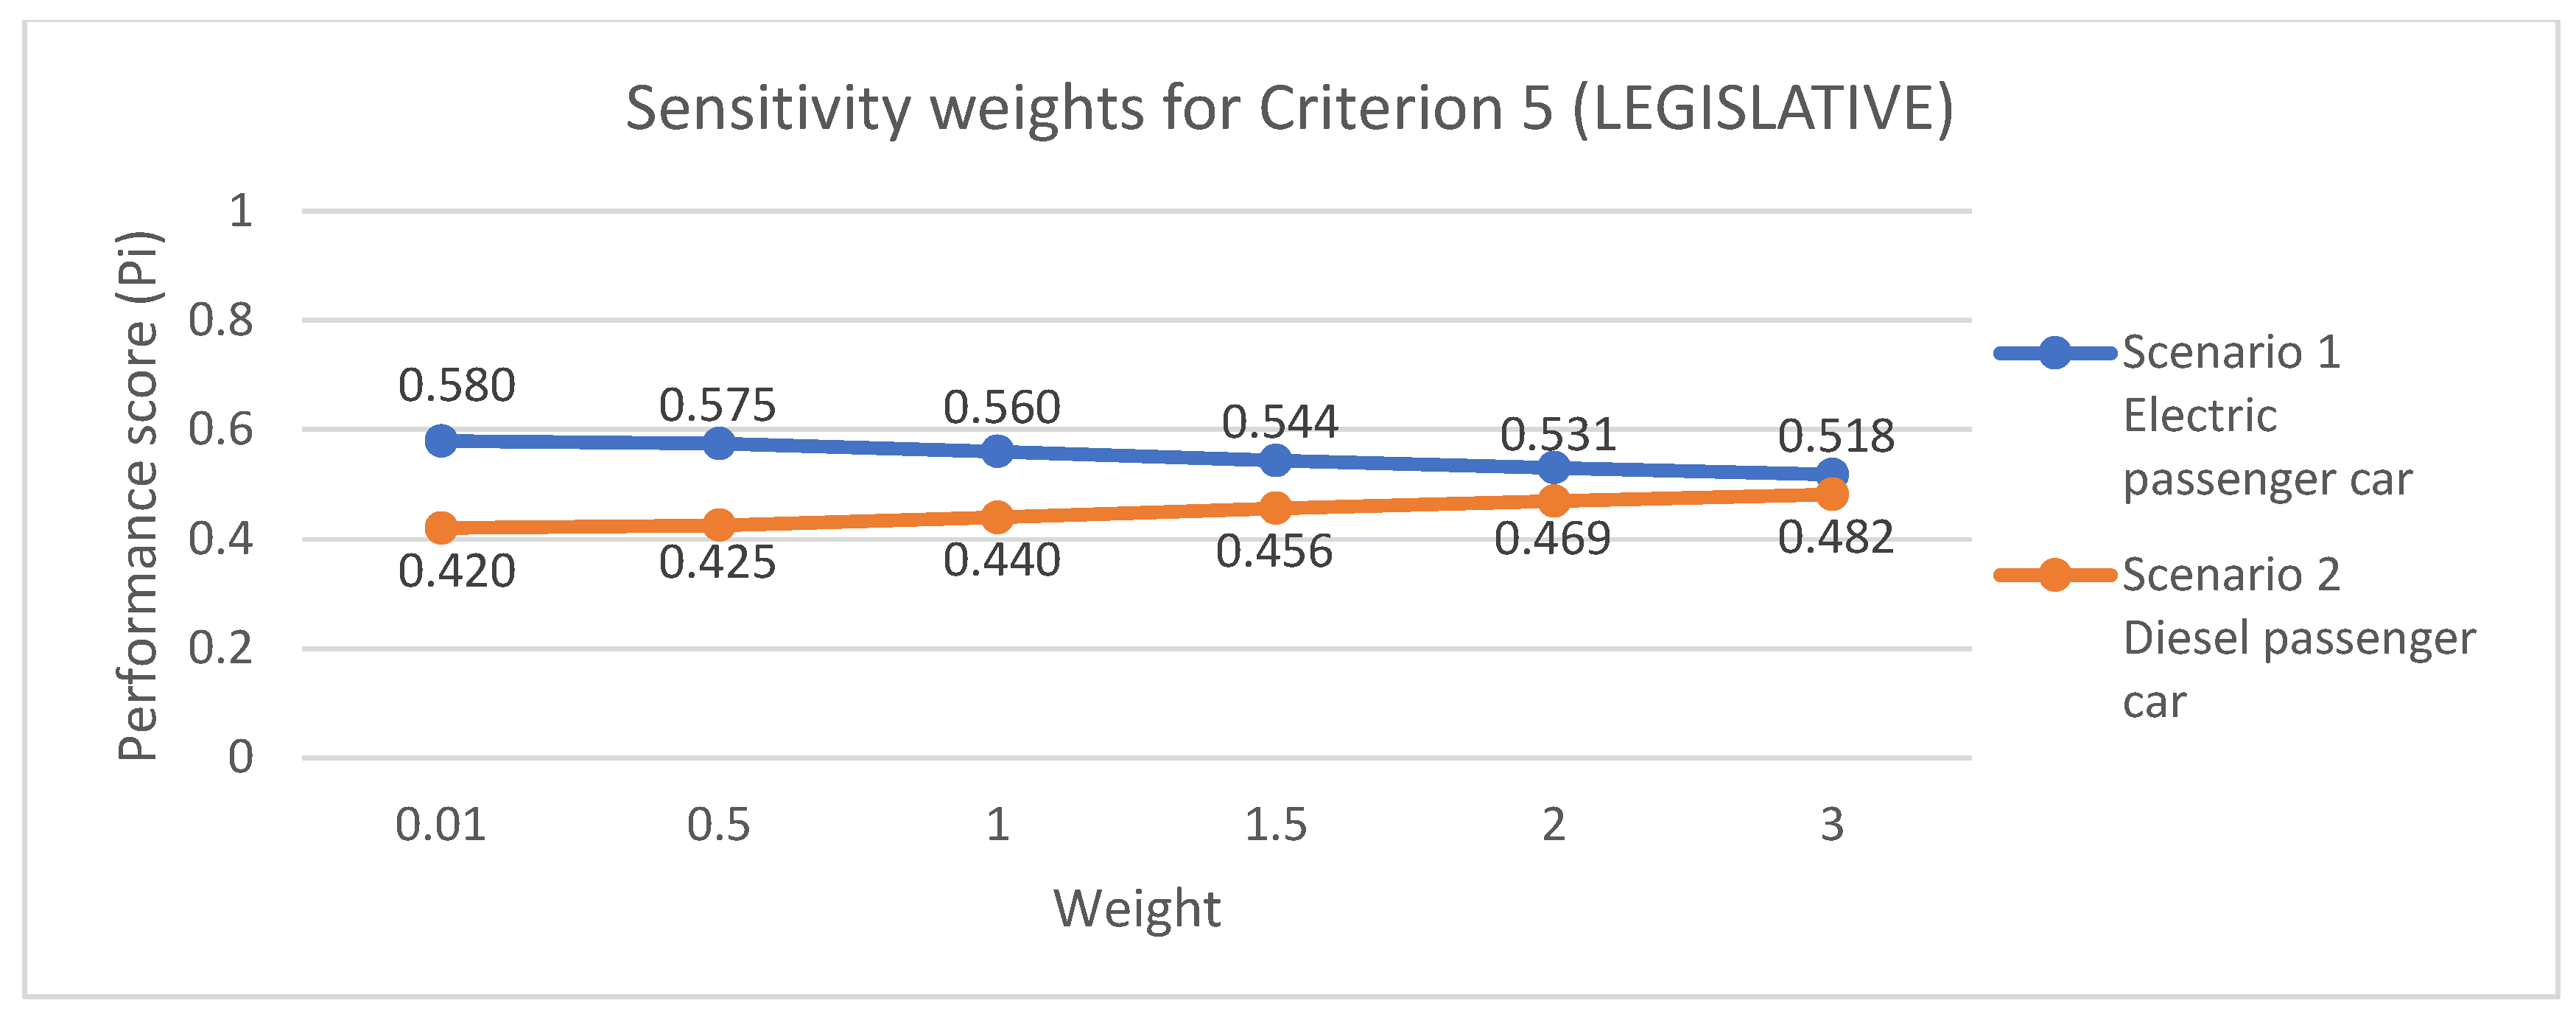
Criterion 5: The results indicate that, despite variations in the weight assigned to the Legislative category, the ranking of scenarios remains unchanged. Scenario 1 consistently shows lower performance scores, suggesting that its outcomes move further away from the ideal solution, whereas Scenario 2 maintains higher performance scores, indicating closer proximity to the ideal variant. This trend is further illustrated in Figure 7, where the performance score curves for the two scenarios gradually converge as the weight of the legislative category increases. The convergence of the curves implies that increasing the legislative weight reduces the performance gap between the scenarios without altering their relative ranking, highlighting the moderate influence of legislative considerations on the overall multi-criteria assessment.
The TOPSIS results confirm the robustness of the integrated approach and its ability to capture multiple criticality dimensions.
A deeper interpretation of the TOPSIS results was developed, focusing particularly on Criterion 3 (Environmental) and Criterion 5 (Legislative).
For Criterion 3, the analysis shows that cobalt, nickel, and lithium display the highest proximity to the ideal solution, reflecting their elevated extraction burdens, energy-intensive refining processes, and critical importance in battery manufacturing. These findings are consistent with their high RERI values and limited global recycling rates. Conversely, aluminium and copper exhibit lower proximity values under this criterion, owing to their broader resource base and more mature recycling infrastructure. This demonstrates that the environmental dimension in the TOPSIS model effectively integrates both extraction intensity and resource management potential.
For Criterion 5 (Legislative), the ranking mirrors the degree of strategic and regulatory attention attributed to each material at the EU level. Materials officially classified as Critical Raw Materials (e.g., cobalt, rare-earth elements, platinum-group metals) attain higher scores, confirming their alignment with policy priorities and supply-risk mitigation strategies. In contrast, industrially relevant but less formally regulated materials (e.g., manganese, titanium) rank lower, indicating emerging yet underdeveloped policy focus.
This additional interpretation clarifies how the environmental and legislative criteria interact within the overall multi-criteria framework, showing that materials with high environmental impact often coincide with those prioritised in policy initiatives. This reinforces the internal consistency and decision-support relevance of the TOPSIS-based sustainability assessment.

4.2. Implementation of the Proposed Method in SimaPro

The new method is implemented in the SimaPro v10.2 software, and the implementation steps are described in this section. Taking the ReCiPe 2016 Midpoint and ReCiPe 2016 Endpoint methods in SimaPro as references, a similar approach was developed and divided into Method 1 and Method 2. In both methods, three categories were created: all CRMs, CRMs for batteries, and REEs. The REEs are treated as a single group rather than being subdivided into LREEs and HREEs, given the divergent views on the exact criteria for their classification. Each category is defined by the following CRMs:
-
All CRMs: this category includes the 34 CRMs defined in Table 1 [2].
-
CRMs for Batteries: this category includes Cobalt, Lithium, Manganese, Graphite and Nickel [11,23].
-
REEs: this category includes Europium, Gadolinium, Terbium, Yttrium, Erbium, Holmium, Thulium, Ytterbium, Lutetium, Dysprosium, Cerium, Lanthanum, Praseodymium, Neodymium, Samarium and Scandium [2].
Both Method 1 and Method 2 were developed to be fully compatible with the internal calculation framework of SimaPro. They use the same Life Cycle Inventory (LCI) data from the Ecoinvent v3.10 database and share the same characterisation phase, in which all CRMs are associated with the Raw Material Extraction/Reserve Index (RERI). The two methods differ in how the Gini Index is applied and how the categories are structured in the damage assessment and weighting phases. In Method 1, the Gini Index is directly linked to each material within the damage assessment step, allowing automatic propagation in the impact calculation. In Method 2, the Gini Index is instead used to define aggregated groups (all CRMs, battery CRMs, and REEs), enabling a more flexible comparative analysis among material categories. In both cases, the procedures are fully integrated into SimaPro’s workflow, allowing results to be generated, normalised, and compared within the software environment.
The detailed implementation steps for each method are described below.
Method 1—In this first approach, the following data are entered into the corresponding sections:
-
Characterisation: All CRMs are included under the Impact category. For each material, the respective Substance is selected from the Ecoinvent v3.10 database, and the characterisation factor is defined as the Raw Material Extraction/Reserve Index (RERI) described and calculated above. The unit is expressed in kilograms (kg).
-
Damage assessment: All CRMs are included under the Damage category. For each material, the corresponding Impact category defined in the characterisation step is selected, and the Gini Index, described and calculated above, is applied as the characterisation factor.
-
Weighting: Three categories are created within the Normalisation/Weighting set: all CRMs, CRMs for batteries, and REEs. Each element defined in the damage-assessment step is assigned a value of 1 if it belongs to the group, and 0 if it does not.
To establish this division into groups, some elements are assigned two identifiers. For example, cobalt appears as Cobalt_GINI (for the group comprising all CRMs) and Cobalt_GINI_batteries (for the group of battery materials). Similarly, REEs are given two identifiers (e.g., Europium_GINI and Europium_GINI_HREE), as they belong to two distinct groups.
Method 2—In this second approach, the following data are entered in the corresponding sections:
-
Characterisation: Identical to Method 1, with all CRMs included and the characterisation factor defined as the Raw Material Extraction/Reserve Index (RERI).
-
Damage assessment: The three categories defined in Method 1 (CRMs for batteries, REEs, and all CRMs) are created under the Damage category. Each CRM is assigned to the corresponding group, where the respective Impact category defined in the characterisation step is selected, and the Gini Index is applied as the characterisation factor.
-
Weighting: Three categories are created within the Normalisation/weighting set: all CRMs, CRMs for batteries, REEs. For each group, a value of 1 is assigned to the Damage category to which the element belongs, and 0 to the others.
The two methodological approaches were developed to enable a consistent evaluation of critical raw materials within the LCA framework.
In practical terms, the two approaches were implemented in SimaPro following distinct integration pathways. Method 1 was applied externally to the software as a bottom-up, material-specific procedure, relying on customised inventory data and direct computation of impact scores based on the RERI × Gini formulation. This configuration allows high-resolution analysis of individual material flows and supports methodological development. Conversely, Method 2 was implemented directly within SimaPro as a set of new characterisation factors derived from the same RERI × Gini relationship but aggregated by material category. This enables straightforward integration within conventional LCIA modules, where the RERI × Gini product functions as a normalisation coefficient scaling each material’s contribution according to combined depletion and concentration risk. In this way, Method 2 ensures broad applicability for LCA practitioners, while Method 1 provides detailed analytical insight for research-oriented studies.

4.3. Case Study

The aim of this section is to apply the developed method to a real case in order to demonstrate its applicability and the type of results that can be obtained. The LCI database from a previous study on the Peugeot 308 diesel and the Peugeot 308 electric is used [9]. The objective is to conduct an LCA of the two vehicles using the SimaPro software. To carry out the analysis, the steps described in Section 3.2 are followed. It should be noted that the choice of the Peugeot 308 as the reference vehicle was primarily motivated by the availability of a complete life-cycle inventory dataset, ensuring methodological consistency between the two propulsion systems. However, future work should extend the analysis to multiple vehicle classes with different weights and specific fuel consumption values to test the sensitivity and robustness of the proposed approach.

4.3.1. Goal and Scope Definition

This study aims to highlight the differences in environmental impacts across the life cycle of an electric and a diesel car. Since CRMs and their impact related to raw materials have been discussed in the LCA analysis, this study also seeks to raise awareness and provide analytical and critical insights into the use of these materials. To this end, different scenarios are analysed at the end of the study, namely the results obtained with the Environmental Footprint 3.1 (adapted) method [87] and with the newly developed Method 1 and Method 2. The Environmental Footprint 3.1 (adapted) method expresses the results in terms of eco-points (Pt). A value of 1 Pt corresponds to one thousandth of the annual environmental load of an average European inhabitant [88]. It is calculated by dividing the total environmental load in Europe by the number of inhabitants and multiplying the result by 1000 [88].
Data quality and parameters—The entire LCA modelling and calculation were carried out using the SimaPro software. The latest version of the Ecoinvent v3.10 database was employed as the primary source. From this database, processes and flow proportions were retrieved to build a complete and consistent Life Cycle Inventory (LCI). Each process retrieved from Ecoinvent is presented in detail in the Section “Life Cycle Inventory”.
Some external parameters are introduced to adapt this LCA to the specific case of an existing vehicle. The criteria for selecting a commercial passenger car for the study require that the vehicle be currently in production, available in both diesel and electric versions, and classified in the C-segment, in accordance with the description of all “passenger car” in Ecoinvent.
The Peugeot 308 was chosen as the reference vehicle, and the corresponding data from [9] were subsequently integrated into SimaPro. In particular:
-
Diesel vehicle total weight: 1361 kg
-
Electric vehicle total weight: 1684 kg
-
Diesel vehicle estimated fuel consumption: 5 L/100 km
-
Electric vehicle estimated electricity consumption: 0.15 kWh/km
-
Electric vehicle Li-ion battery pack details: Cathode material—NMC811, number of cells—102, nominal capacity: 54.0 kWh.
-
Electric vehicle Li-ion battery pack weight: NMC811 batteries have a cell energy density in the range of 244–300 Wh/kg. For the case study, this ratio is assumed to be valid for the battery pack, and a standard value of 300 Wh/kg is adopted. Based on this assumption, the battery weight is calculated as proportional to the nominal capacity, resulting in 180 kg.
-
Glider weight for diesel vehicles and powertrain weight for electric vehicles: The glider and powertrain weights are calculated using the Ecoinvent “Passenger car production, diesel” process, which specifies the distribution of the total car weight as 69.5% for the glider and 30.5% for the internal-combustion engine. Since the selection criteria for the case study require the vehicle to be available in both electric and diesel versions, it is assumed that the glider composition and weight are the same for both models. Consequently, the EV drivetrain weight is determined by subtracting the glider weight and the Li-ion battery weight from the total weight of the electric car.
System boundaries—This LCA adopts a cradle-to-grave approach, meaning that the processes considered extend from the extraction of primary raw materials, both for refined materials and for energy production, through product manufacturing, distribution, and use of the product, up to the downstream end-of-life processes.
In terms of geographical boundaries, vehicle manufacturing is assumed to occur within Europe, while the use phase is modelled under Italian operating conditions, incorporating the national electricity mix. The end-of-life stage is likewise considered within the European context.
Several recent life cycle assessment (LCA) studies on electric vehicles (EVs) support the use of a 200,000 km driving distance as a representative vehicle lifetime. For example, ref. [89] compares various LCA models for lithium-ion batteries during the operational phase and conclude that 200,000 km is a reasonable estimate, grounded in empirical data on battery degradation and manufacturer warranty policies. Similarly, ref. [90] adopts a lifespan range of 150,000–200,000 km for plug-in hybrid electric vehicles, which remains relevant for current EV assessments. More recently, ref. [91] also employs the 200,000 km benchmark in its evaluation of lithium-ion battery production and use, further reinforcing the validity of this distance as representative of typical EV durability.
Nonetheless, while the 200,000 km figure is frequently employed as a standard reference in LCA studies, recent findings suggest that it may underestimate the actual operational potential of electric vehicles. For instance, an EV equipped with a 54-kWh nominal battery and consuming 15 kWh per 100 km achieves an approximate driving range of 360 km per full charge, which corresponds to about 555 complete charging cycles over a 200,000 km lifetime. However, according to several scientific investigations [92], lithium-ion batteries typically retain most of their capacity, with only 10–15% degradation, even after undergoing between 1500 and 2000 full charge–discharge cycles. Using the conservative lower estimate of 1500 cycles, this corresponds to a potential driving range of approximately 540,000 km (1500 cycles × 360 km). On this basis, a longer lifespan scenario of 540,000 km is proposed alongside the 200,000 km baseline, to more accurately capture real-world battery durability. Incorporating this extended service life into the LCA framework enables a more comprehensive and realistic assessment of the environmental performance of EVs, while supporting a more robust comparison with internal-combustion-engine vehicles.
It is acknowledged that the 540,000 km lifespan represents an optimistic yet scientifically supported scenario. This assumption aims to explore the upper boundary of realistic battery durability, drawing on evidence from recent studies on high-performance lithium-ion systems. Its inclusion in the analysis serves to test the sensitivity of the LCA results to extended service life, thereby enhancing the robustness and transparency of the comparison between electric and diesel vehicles.
Functional units—A standard, medium-sized passenger car is considered as the functional unit for both the production and end-of-life phases. The choice of the functional unit is guided by the processes available in the Ecoinvent database concerning the glider, internal-combustion engine, and powertrain, which are based on a generic C-segment car (length between 4.30 and 4.40 m). The vehicle selected as the functional unit is the Peugeot 308, specifically the Peugeot e-308 electric version. This choice allows the assumption that the glider of both the electric and diesel versions has the same weight and material composition, thereby increasing the consistency of the study. For the use phase, the functional unit considered is 1 km of distance travelled, ensuring a consistent comparison of all impacts associated with the same driving distance for an electric vehicle and a conventional internal-combustion vehicle.

4.3.2. Life Cycle Inventory (LCI)

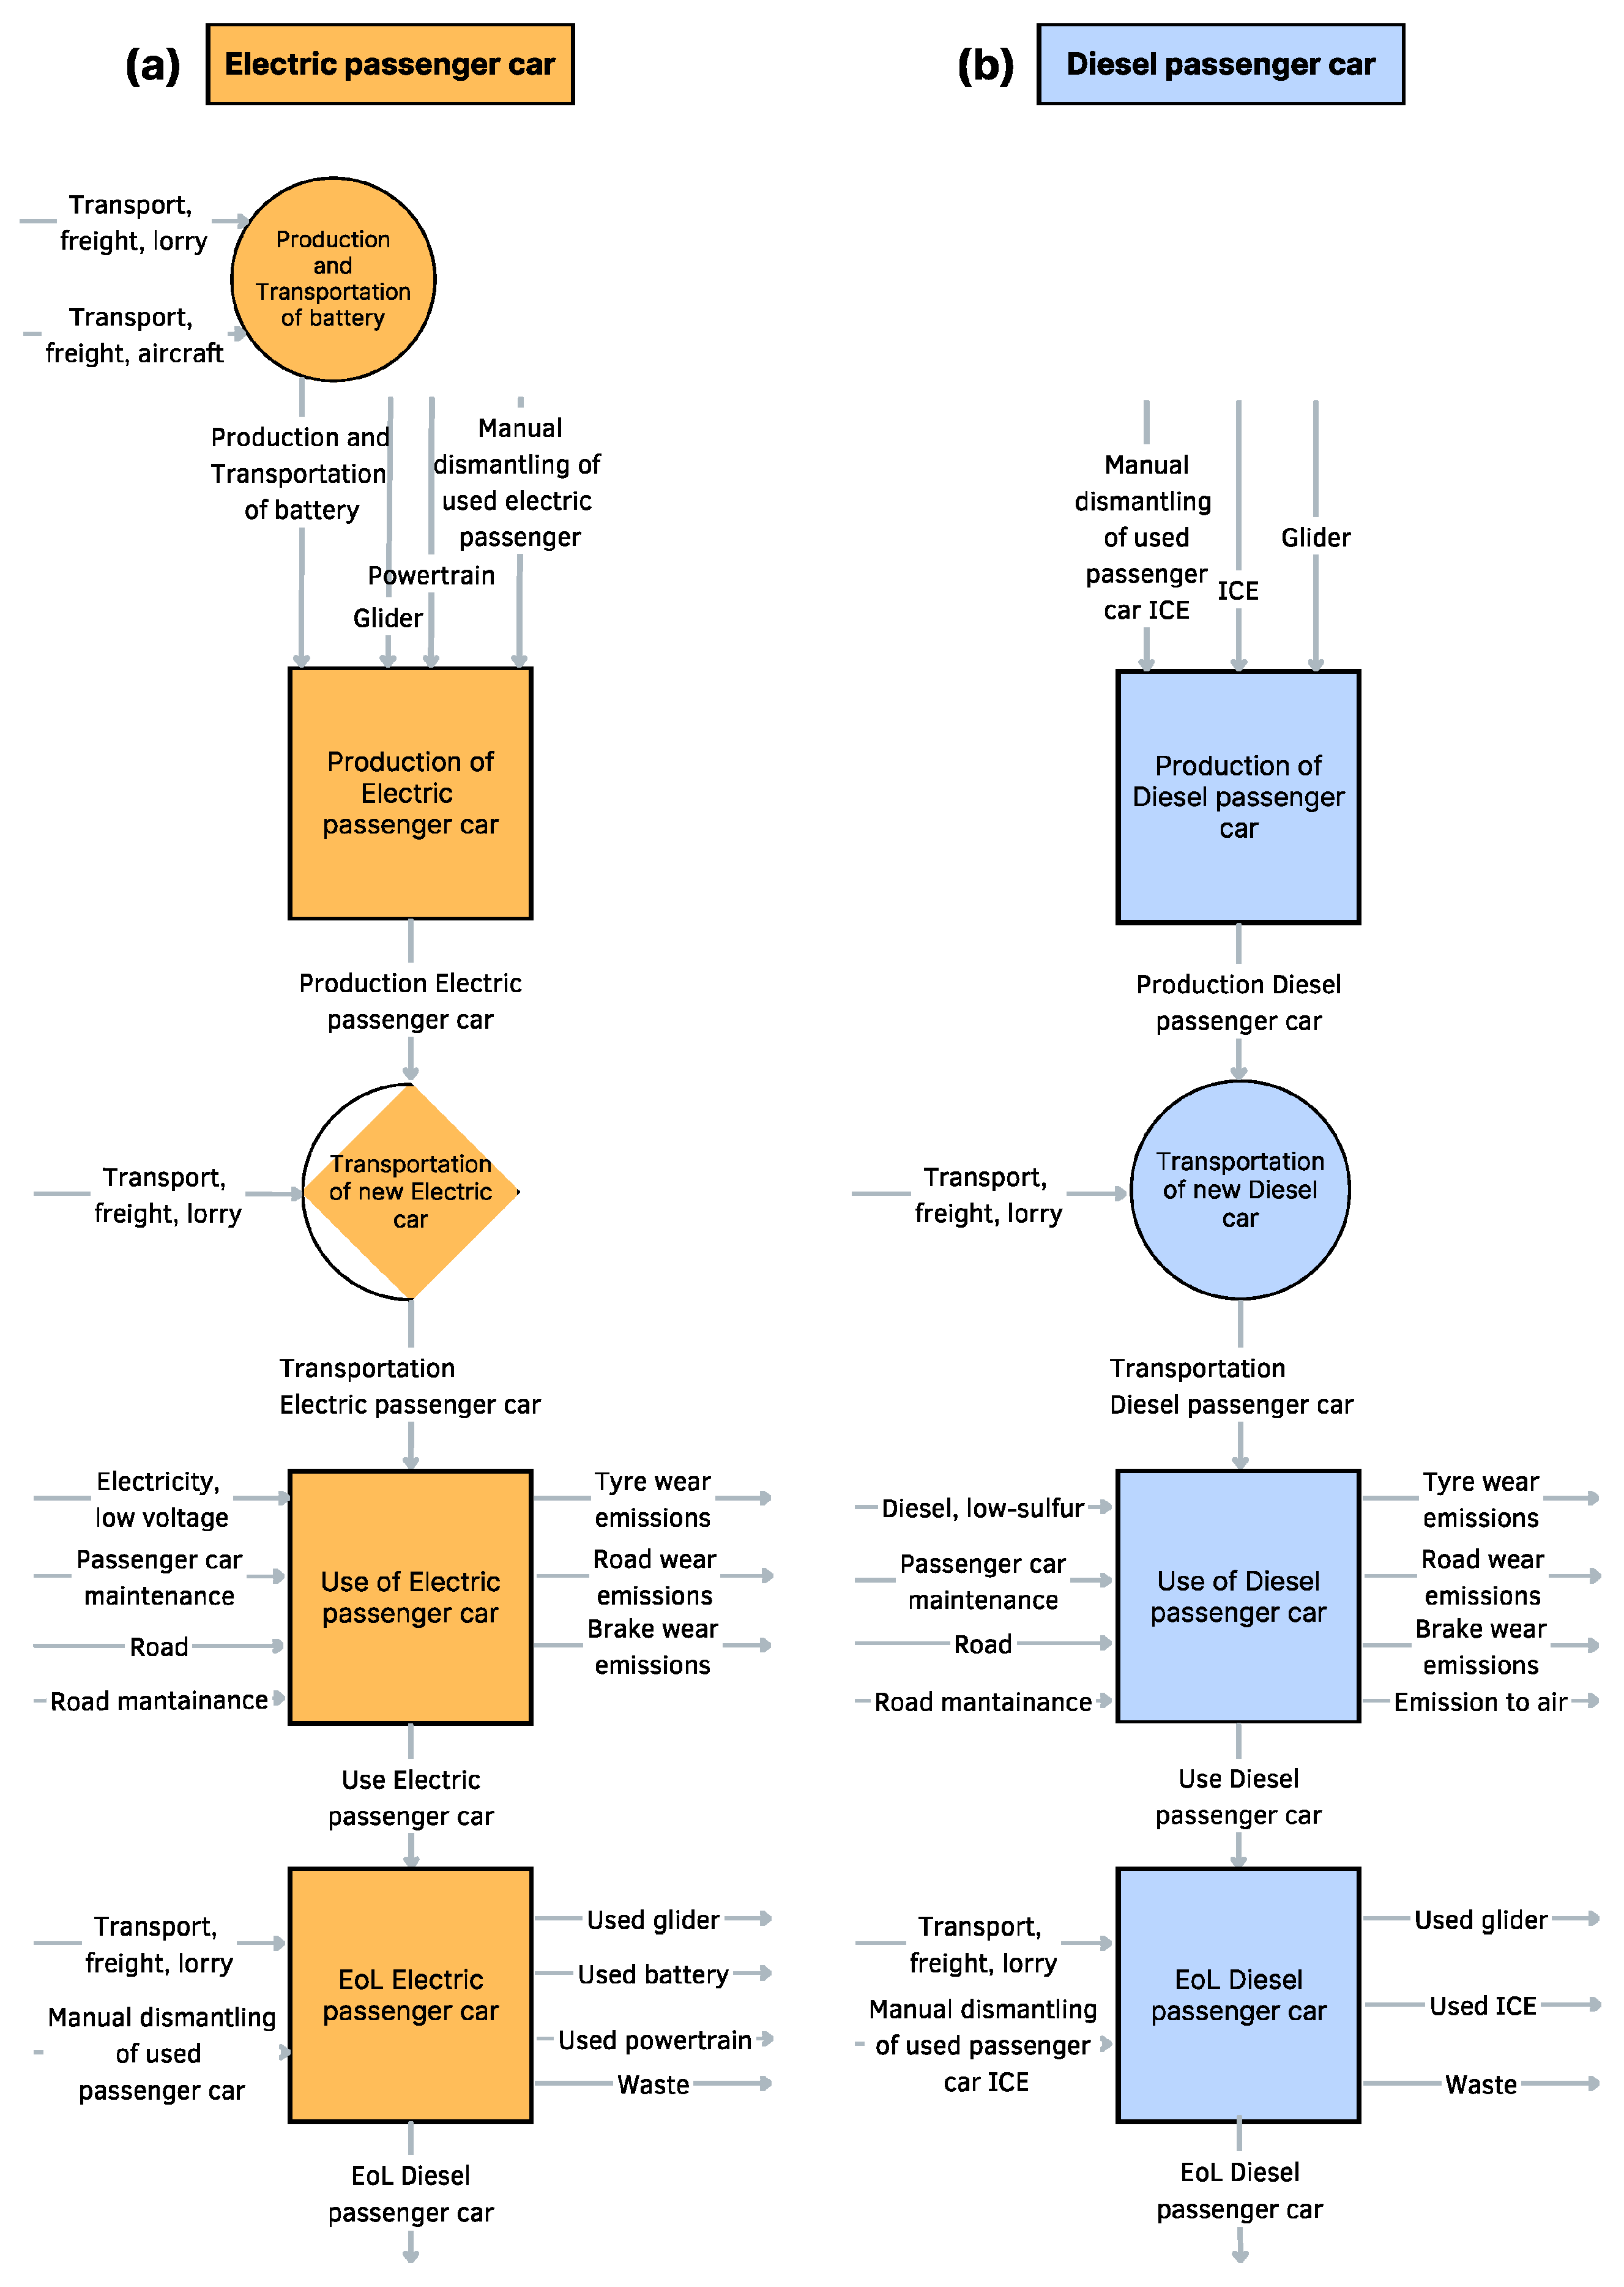
Model overview—The LCI model is divided into four main phases: passenger-car production, transportation of the new car, use and end-of-life. In each phase, the two vehicle types (electric and diesel) are modelled separately, resulting in two LCIs of comparable complexity, but incorporating slightly different processes to account for structural differences between the vehicles. In particular, the production and transportation phases of the Li-ion battery are explicitly represented in the LCI of the electric car. The overall structure of the LCI is illustrated in Figure 8.
As shown in Figure 8, the emission profiles of the two vehicles differ markedly. For modern diesel engines, the high air–fuel excess ratio ensures nearly complete combustion, resulting in minimal carbon monoxide (CO) emissions, whereas nitrogen oxides (NOx) and particulate matter (PM) remain significant contributors to air toxicity. For electric vehicles, air emissions primarily originate from electricity generation, and their magnitude depends strongly on the regional energy mix. Regions relying on renewable or low-carbon sources display markedly lower indirect emissions compared with systems dominated by fossil-based electricity.
The approach adopted for this inventory is consequential. Since the study follows a cradle-to-grave perspective, no cut-offs are applied. Determining the quantities of recycled materials to be used as secondary raw materials is highly complex, and modelling a closed loop would be inaccurate, given that the EV value chain is not currently circular. Instead, the consequential approach accounts for the benefits of producing secondary raw materials from waste, namely their contribution to the circular economy and the avoided use of primary raw materials in any other process, with these output products considered as ‘avoided burdens’. In addition, secondary raw materials may appear in process inputs that generate lower environmental impacts compared with those of primary materials.
Phase 1: Production—The production phase of the electric and diesel cars includes all upstream processes related to the manufacturing of components and the final assembly of the vehicles. The two vehicle types are composed as follows:
  • Electric passenger car: (glider + powertrain) + Li-ion battery;
  • Diesel passenger car: glider + internal-combustion engine.
All upstream processes are retained as default input data from the Ecoinvent dataset. The following paragraph describes each production process in more detail, drawing on the corresponding Ecoinvent process documentation.
-
Production and transportation of Li-ion battery (NMC811), rechargeable, prismatic—This dataset represents the production of 1 kg of a Li-ion battery pack, typically used for the mechanical drive of an electric vehicle. The cells consist of a nickel-manganese-cobalt (NMC811) cathode, a silicon-coated graphite anode, a liquid electrolyte, and a porous plastic separator. The dataset also includes the required infrastructure, modelled as an “electronic component factory”. In addition, the dataset accounts for the transport of one tonne of freight over a distance greater than 4000 km using a dedicated freight aircraft (i.e., an aircraft carrying only cargo). The transport process covers the entire life cycle, including the production of the aircraft, the operation of the transport service, and the construction and operation of the airport. The system boundary of this dataset is the operation of the aircraft, with inputs for both aircraft and airport. Fuel consumption and major emissions (SOx, NOx, NMHC, PM and CO) are calculated for 99.5% of all scheduled flights in 2016, based on OAG (2016) data.
-
Production of electric passenger car—In this dataset, entries are reported on a per-kilogram basis. The model is optimised for a vehicle of approximately 1200 kg, including the battery, and is divided into three modules: glider, drivetrain and battery. Each module incorporates specific material inputs, production processes, and emissions, with the battery represented by the dataset “Production and transportation of battery”. The activity concludes with the assembly of the three modules to form the complete car, with the unit of measurement expressed as “item” to match the functional unit.
-
Passenger car production, diesel—This dataset describes the production of a compact diesel passenger car. Entries are reported on a per-kilogram basis, and the model is optimised for a vehicle of approximately 1314 kg. It is divided into two modules: glider and drivetrain. Each module includes specific material inputs, production processes, and emissions. The dataset takes as inputs the two modules (glider and drivetrain) that constitute the vehicle. The activity concludes with the assembly of the car, with the unit of measurement expressed as “item” to match the functional unit.
All previous processes are regionalised. The assembly of both electric and diesel vehicles takes place in Sochaux (France), where the Peugeot-Stellantis plants producing the 308 and e-308 models are situated. Regarding battery production, no specific data are available on the production site. However, since Stellantis signed a multi-billion-euro agreement with LG Energy Solution in 2022, it is assumed that the lithium-ion batteries are produced at the company’s main plant in Nanjing (China).
Subsequent processes include the air transport of the Li-ion battery from the LG plant in China and the road transport of both finished vehicles from the Peugeot plant in Sochaux to a Peugeot dealer in Italy, where the vehicles are assumed to be used. Rome is selected as the destination city, as it is geographically located in the centre of the country. The flight distance from Shanghai Pudong Airport to Paris Charles De Gaulle Airport is 9287 km, while the road distance from Sochaux to Rome is 1017 km; both values were calculated using Google Maps.
-
Transport of new passenger car, freight, lorry >32 metric tons—This dataset represents the service of 1 tkm freight transport by a lorry with a gross vehicle weight (GVW) of more than 32 metric tons and Euro VI emissions class. The dataset covers the entire transport life cycle, including the construction, operation, maintenance, and end-of-life of both the vehicle and the road infrastructure. Fuel consumption and emissions are modelled for average European journeys and load factors, and are therefore not representative of a specific transport scenario.
Phase 2: Utilisation—The second phase includes the energy use of vehicles, whether from fuel or electricity, over their full operational lifetimes, together with maintenance requirements and the gradual degradation of components such as brakes, tyres, and road infrastructure. In this LCA, two lifetime scenarios are assessed: a baseline of 200,000 km, consistent with the functional unit definition, and an extended scenario of 540,000 km, which reflects both current industry standards and the potential durability of battery systems. In both cases, vehicle operation is assumed to occur entirely within Italy, covering a representative mix of urban and highway driving conditions.
A key assumption is that the Italian energy mix, which powers electric vehicles, remains unchanged over the entire vehicle lifetime. This is indeed a strong assumption, since the share of renewable energy in Italy is projected to increase from the current 37% to 55% over the next few years [93]. Although restrictive, this represents a conservative approach, as it is more likely to underestimate rather than overestimate the environmental benefits of electric vehicles.
The Ecoinvent processes used for this phase are limited to two, corresponding to electric and diesel car travel. Both processes also include car maintenance as well as brake, tyre, and road wear. The datasets for electric and diesel passenger car transport are linked, respectively, to the Ecoinvent 3.10 processes representing the Italian energy mix (market for electricity, low voltage—IT) and the European diesel market (market group for diesel, low-sulphur—RER), which are required to calculate the impacts of fuel and energy consumption. The low-voltage option for the Italian electricity mix is selected to account not only for the electricity generation, but also for its transformation and distribution down to domestic plugs.
In the following paragraphs, each utilisation-phase is described in greater detail, drawing on the corresponding Ecoinvent process documentation.
-
Lifetime usage, passenger car, electric—This dataset describes a journey of 1 km with an electric passenger car. It is parameterised with respect to the mass of the vehicle, the mass of the battery, the electricity consumption, and the lifetimes of both the vehicle and the battery. The construction of the dataset allows these key parameters to vary to cover a wide range of situations. The inputs considered are the vehicle with battery, maintenance activity, and the electricity consumed for the journey. Both the vehicle and the battery are treated as infrastructure elements, even though they are expressed in kilograms. For this study, an addition to the output of the predefined process was introduced: to link the impacts of car use to the subsequent life-cycle stage, the electric car was added as an output product at the end of its lifetime, serving as the initial input for the end-of-life treatment processes.
-
Lifetime usage, passenger car, diesel: This dataset represents the transport service of a passenger car over a journey length of 1 km and is valid for Europe. It is parameterised with respect to vehicle size, fuel consumption, and vehicle lifetime. Exhaust emissions for fuel combustion are divided into two categories: fuel-dependent emissions (determined by fuel type and quantity) and Euro-class-dependent emissions, which reflect the standards the vehicle complies with. This dataset refers to a small diesel passenger car of Euro 5 class. Non-exhaust emissions, resulting from tyre, brake, and road wear, are included as by-products. Inputs to the system are the vehicle and road-network infrastructure, the materials and efforts needed for their maintenance, and the fuel consumed during the journey. The activity ends with the provision of 1 km of transport service and the release of both exhaust and non-exhaust emissions to air. For this study, an addition to the default process output was introduced: to link the transport impacts to the subsequent life-cycle stage, the diesel passenger car was added as an output product at the end of its lifetime, serving as the initial input for the end-of-life treatment processes.
Phase 3: End of life—The last phase of the inventory concerns the recovery of secondary raw materials and the treatment of residual waste from vehicle components. This phase is divided into two stages: first the disassembly of the car, during which usable components are extracted and sent to specific treatment; second, the processing of waste components (glider, battery, powertrain, and ICE) directed towards recycling.
As previously mentioned, a large share of the vehicle’s weight is typically recycled as scrap aluminium, iron, and other metals. According to the consequential approach adopted in this LCA, this results in a negative contribution to the overall impact. This is because the secondary raw materials recovered from end-of-life vehicle components are considered equivalent to new materials that can substitute primary material production, thereby reducing the environmental burdens associated with virgin resource extraction.
Once the vehicle reaches its end of life, it undergoes a process of manual dismantling. During this stage, the main components are separated and considered as output waste flows: for the electric vehicle, these include the Li-ion battery, powertrain, and glider; for the diesel vehicle, the internal-combustion engine (ICE) and glider. These outputs, together with additional waste flows such as glass, mineral oil, and rubber, are then directed to specific Ecoinvent processes for appropriate treatment.
The Ecoinvent database provides different options for the treatment of lithium-ion batteries; in this study, the hydrometallurgical process was selected. This process operates at low temperatures and allows the recovery of all battery components, but it requires extensive pre-treatment as well as complex purification and separation systems, which makes it economically unviable at current end-of-life battery volumes. Despite its complexity, hydrometallurgy may represent a more sustainable option in the long term, particularly when compared with pyrometallurgical processes, for achieving complete recovery of battery materials [94].

4.3.3. Life Cycle Impact Assessment (LCIA)

The impact categories considered in this article focus on critical raw materials, with the objective of developing differentiated damage assessments for Methods 1 and 2. As previously described, in Method 1 the damage assessment includes all CRMs, normalised using the Raw Material Extraction/Reserve Index and Gini Index, after which the contribution of each individual material can be analysed. In Method 2, by contrast, the damage assessment is structured into three categories: CRMs for batteries, all CRMs and rare-earth elements (REEs). This structure enables the results to be interpreted at different levels of detail, depending on the category of interest.

4.3.4. Results of the Case Study from LCA Analysis

Result 1: Method 1 was applied to compare the production stages of electric and diesel passenger cars, considering a lifetime scenario of 200,000 km. The results obtained (Table S2) report, for each CRM, the Raw Material Extraction/Reserve Index scaled by the Gini Index. The comparison shows that, between the two scenarios, the electric car exhibits higher consumption of CRMs and, consequently, a greater overall impact. In particular, the values presented in Table S2 quantify the environmental impact according to the two normalised indicators: the higher the value, the greater the impact in terms of both material availability and dependence on a single country. These results cover the full life cycle of the vehicles, from the extraction of CRMs and other resources to the end-of-life stage. The materials found to be most impactful and most visible in the graphs for both scenarios are aluminium, fluorspar, nickel, and manganese (Figure 9).
Result 2: Method 1 was applied again to compare the production stages of electric and diesel passenger cars, considering the lifetime scenario of 540,000 km. The results obtained (Table S3) report, for each CRM, the Raw Material Extraction/Reserve Index scaled by the Gini Index. As in the previous case, the electric car shows higher consumption of CRMs and, consequently, a greater overall impact; however, the values are higher than those reported in Table S2. In particular, the values presented in Table S3 quantify the environmental impact according to the two normalised indicators: the higher the value, the greater the impact in terms of both material availability and dependence on a single country. These results account for the full life cycle of the vehicles, from the extraction of CRMs and other resources to the end-of-life stage. The materials found to be most impactful and most visible in the graphs for both scenarios are aluminium, fluorspar, nickel, and manganese (Figure 10).
Result 3: Method 2 was used to compare the production stages of electric and diesel passenger cars, considering a lifetime scenario of 200,000 km. The results obtained are the values of CRMs in the three groups described by Method 2: CRMs for batteries, rare-earth elements (REEs), and all CRMs. As in the previous case, the electric car shows a higher consumption of CRMs and, consequently, a greater overall impact. As shown in Figure 11, the category “CRMs for batteries” refers to materials required for battery construction, including substances that, in other scenarios, such as the diesel car, are used for different components. The impact of CRMs is therefore greater for the electric car, since the battery is a critical component that requires a high concentration of these materials. In contrast, while the diesel car also requires CRMs for certain parts, the absence of a traction battery results in a significantly lower overall demand for these materials.
Result 4: Method 2 was used to compare the production stages of electric and diesel passenger cars, considering a lifetime scenario of 540,000 km. The results obtained present the values of CRMs grouped according to Method 2: CRMs for batteries, rare-earth elements (REEs), and all CRMs. Method 2 also indicates higher CRM-related impacts for the electric car. As shown in Figure 12, the category “CRMs for batteries” refers to materials required for battery construction, including substances that, in other scenarios, such as the diesel car, are used for different components. The impact of CRMs is therefore greater for the electric car, since the battery is a critical component that requires a high concentration of these materials.
In contrast, while the diesel car also requires CRMs for certain parts, the absence of a traction battery means that the overall demand for these materials is significantly lower.
Result 5: The Environmental Footprint 3.1 (adapted) was applied to compare the production stages of electric and diesel passenger cars, considering a lifetime scenario of 200,000 km. The results obtained for each damage category are expressed in Points (Pt). The EF3.1 (adapted) method also shows a higher impact for the electric car in the category Resource use, minerals and metals (Figure 13). Based on the values reported in Table S4, two damage categories exceed 1 Pt: Climate change for the diesel passenger car and Resource use, minerals and metals for the electric passenger car.
Result 6: Environmental Footprint 3.1 (adapted) was applied to compare the production stages of electric and diesel passenger cars, considering a lifetime scenario of 540,000 km. The results obtained for each damage category are expressed in Points (Pt). They show that, between the two scenarios, the electric car has a greater impact in the category Resource use, minerals and metals (Figure 14). Looking at the values reported in Table S5, three damage categories exceed 1 Pt for both vehicles: Climate change, Resource use, fossil, and Resource use, minerals and metals. Moreover, when considering the Total value, which is the sum of all damage categories, the results for the diesel and electric cars are quite similar, with a slightly higher value for the diesel passenger car. This outcome differs from the results shown in Figure 13, where the electric car exhibited a higher environmental impact. The observed shift may be attributed to the extended vehicle lifespan, which alters the relative contribution of various impact categories.
Result 7: Once the results were obtained with both Method 2 and Environmental Footprint 3.1 (adapted), the raw-material use in the production stages of electric and diesel passenger cars was compared considering a lifetime of 200,000 km. Because the two methods use different units of measurement, the results are expressed in percentages. The raw material use of the electric passenger car was taken as the reference value (100%) (Figure 15), and the percentages for the diesel passenger car were calculated accordingly. The two methods yield consistent patterns, confirming that the CRM-specific indicators align with the Environmental Footprint 3.1 (adapted). In both cases, the use of raw materials for the electric passenger car is higher than for the diesel passenger car.
Result 8: Once the results were obtained with both Method 2 and Environmental Footprint 3.1 (adapted), the raw-material use in the production stages of electric and diesel passenger cars was compared considering a lifetime of 540,000 km. Because the two methods use different units of measurement, the results are expressed in percentages. The raw-material use of the electric passenger car was taken as the reference value (100%) (Figure 16), and the percentages for the diesel passenger car were calculated accordingly. The comparison of the two methods shows that the new CRM-specific method is consistent with the existing Environmental Footprint 3.1 (adapted) method. In both cases, raw-material use is higher for the electric passenger car than for the diesel one. Moreover, as shown by the comparison between Figure 14 and Figure 15, when using a vehicle lifetime of 540,000 km and the Environmental Footprint 3.1 (adapted) method, an increase in the environmental impact of the diesel passenger car can be observed (Figure 16).
To complement the graphical comparison, the following paragraphs provide a consolidated interpretation of numerical results from Methods 1 and 2 and from the Environmental Footprint 3.1 (adapted), highlighting consistent patterns across the two mileage scenarios.
The two proposed approaches serve distinct purposes and are complementary within the overall framework. Method 1 delivers a high-resolution, material-specific assessment, enabling researchers to identify which critical raw materials exert the strongest depletion and supply risk pressures. Method 2, on the other hand, aggregates results into broader material categories, such as all CRMs, CRMs for batteries, and rare earth elements, thereby simplifying result interpretation and facilitating direct implementation in standard LCA tools. While Method 1 enhances analytical transparency and supports methodological development, Method 2 provides a more universal and practitioner-oriented framework for applied sustainability studies. Presenting both methods in parallel ensures that the proposed model remains scientifically rigorous and accessible for policy and industrial applications.
Using Method 1 for the 200,000 km scenario, the total impact values were 1.126 for the diesel passenger car and 2.865 for the electric passenger car. This indicates that the electric vehicle has a higher overall impact due to greater CRM consumption. The most influential materials remain aluminium/bauxite (0.682 for diesel vs. 1.421 for electric), Nickel (0.204 vs. 0.540), Manganese (0.138 vs. 0.213), Fluorspar (0.062 vs. 0.553), and Lithium (2.33 × 10⁻⁷ vs. 5.19 × 10⁻³). These values represent the Raw Material Extraction/Reserve Index multiplied by the Gini Index, quantifying both the depletion risk and the concentration of production in specific countries.
For the 540,000 km scenario the same pattern is observed (1.296 vs. 3.102), with individual materials showing proportional increases but unchanged relative relevance: Aluminium/Bauxite (0.709 vs. 1.535), Nickel (0.241 vs. 0.588), Manganese (0.175 vs. 0.241), Fluorspar (0.116 vs. 0.589), and Lithium (2.38 × 10⁻⁷ vs. 5.19 × 10⁻³).
The higher impact observed in the extended-lifetime scenario is mainly attributable to the additional electricity demand and maintenance activities occurring over a longer operational period. These contributions are more pronounced for the electric vehicle, as the electricity mix used during the use phase involves technologies that rely on critical raw materials, particularly within renewable-energy generation and storage systems. Consequently, the increase reflects upstream energy and maintenance processes represented in the life-cycle inventory rather than any additional use of critical materials in vehicle manufacturing.
Method 2 aggregates CRMs into three categories: CRMs for batteries, rare-earth elements (REEs), and all CRMs. For the 200,000 km scenario, the impact values were CRMs for batteries: 0.343 for diesel vs. 0.780 for electric vehicles, REEs: 0.005 vs. 0.058, and all CRMs: 1.138 vs. 2.890. For 540,000 km, the values increased to CRMs for batteries: 0.418 vs. 0.857, REEs: 0.007 vs. 0.060, and all CRMs: 1.308 vs. 3.129. Across both mileage scenarios, electric vehicles systematically show higher CRM-related impacts, with both scenarios exhibiting similar relative patterns and only minor variations between the 200,000 km and 540,000 km lifespans.
The adapted Environmental Footprint 3.1 method provides complementary results. At 200,000 km, the total impact amounted to 5.048 for diesel and 6.784 for electric vehicles, with the Resource use, minerals and metals category being particularly significant (0.498 vs. 2.978). For the 540,000 km scenario, total impacts were 11.730 for diesel and 11.685 for electric vehicles, with electric vehicles still showing higher consumption of minerals and metals (5.549 vs. 1.754). When expressed in relative percentages with the electric vehicle set as 100%, diesel cars accounted for 39.4% (Method 2) and 16.7% (Environmental Footprint 3.1) at 200,000 km; 41.8% and 31.6% at 540,000 km, respectively.
These quantitative insights reinforce the robustness and internal consistency of the proposed methods. By integrating numerical evidence directly into the discussion, the results show that the methodological advances developed in this study can effectively translate complex CRM dynamics into measurable indicators of environmental and resource pressure.
The comparative outcomes of our case study are consistent with the main trends in the LCA literature on electric vs. internal-combustion passenger cars. Previous studies indicate that battery-electric vehicles (BEVs) achieve lower life-cycle greenhouse-gas (GHG) emissions when powered by low-carbon electricity, while exhibiting higher production-phase burdens in metal and resource-related categories driven by traction-battery materials [95]. This finding aligns with earlier comparative LCAs, e.g., [96], which also highlighted the decisive influence of vehicle mass, grid carbon intensity, and lifetime assumptions on overall environmental performance. Subsequent inventories and assessments widely used in EV LCAs corroborate the sensitivity to grid carbon intensity and lifetime assumptions [91,96,97] which consolidate over one hundred recent studies confirming this trend. Recent global comparisons indicate that, with current European electricity mixes, BEVs’ life-cycle GHG emissions are typically around 65% lower than those of comparable ICE vehicles, although the advantage narrows in more carbon-intensive grids [98]. Country-level reviews similarly find a stronger environmental benefit where renewable shares are higher and for longer operational lifespans [99].
Consistent with this evidence, our dual-mileage design couples a baseline 200,000 km scenario, commonly adopted in EV LCAs, with a high-use (optimistic) 540,000 km scenario to test the sensitivity of comparative results to lifetime extension. The rationale is supported by studies highlighting the decisive role of use-phase modelling (battery efficiency, degradation, and vehicle mass) on life-cycle outcomes [89,91], which identify efficiency losses, degradation rates, and total mileage as the most sensitive parameters in BEV life-cycle impacts. Recent LCAs also show that variations in battery manufacturing routes and cathode composition can significantly influence metal-related impact categories [91].
Overall, our results align with the broader literature consensus. Several comparative LCAs have shown that BEVs involve higher CRM and resource-use impacts during the production phase due to battery and electronics manufacturing [95,96]. However, multiple studies confirm that BEVs deliver substantially lower life-cycle GHG emissions when operated under realistic lifespans and low-carbon electricity mixes [98,99]. Recent reviews and process-focused LCAs further highlight how technological improvements in battery efficiency and manufacturing routes can progressively enhance these environmental benefits [89,91,97]. These trends observed across the literature are in line with and lend support to the assumptions adopted in this study.

5. Conclusions

This work makes a significant contribution to advancing the understanding of the role of CRMs in product life cycles and introduces a new method for their evaluation.
The inclusion of numerical evidence from the case study strengthens the robustness of the findings and provides concrete reference points for interpreting CRM-related sustainability trade-offs. The results provide a detailed quantification of the environmental impact associated with the use of CRMs in the vehicle life cycle. One of the key findings is that, although EVs contribute to reducing GHG emissions, they require substantially higher amounts of CRMs, particularly for batteries, leading to greater impacts linked to material availability and supply-chain dependence. The analysis, carried out using both the newly developed Method 1 and Method 2, and the existing Environmental Footprint 3.1 (adapted), consistently demonstrated that the impact of CRMs is significantly higher for electric vehicles compared to diesel vehicles.
The results underscore the importance of including CRMs in the sustainability assessments of emerging technologies, particularly in the context of the energy transition to a green economy. With the growing demand for EVs and renewable energy technologies, it will be essential to implement strategies to mitigate the risks associated with CRM depletion and supply chain vulnerabilities, thereby ensuring the long-term sustainability of these technologies. Furthermore, the possibility of continuously updating and refining the models with new data and approaches will enable the assessments to adapt to future challenges and opportunities in the sector. This research demonstrates the feasibility of embedding CRM-focused indicators (RERI and Gini Index) into widely used LCA software, thus providing practitioners and policymakers with a transparent and replicable tool. This strengthens the scientific basis for policy initiatives such as the EU Critical Raw Materials Act and supports industry stakeholders in anticipating and mitigating supply risks.
Future work could extend the application of the proposed framework beyond the automotive sector, testing its robustness across renewable technologies, digital infrastructure, and other CRM-intensive industries. By isolating material-specific scarcity and supply-risk patterns, the proposed indicators offer a more granular understanding of CRM dependencies than conventional LCIA categories, enabling more informed decisions in product design, procurement, and long-term strategic planning.
However, it is important to acknowledge some limitations of this study. One of the main challenges concerns the lack of up-to-date data on the reserves and production of critical raw materials, with some datasets dating back several years. Nevertheless, the proposed models are designed to be flexible and can be progressively improved and refined over time through the integration of updated data and the adoption of more advanced methodologies, thereby providing a more accurate representation of future developments in CRM-intensive energy and industrial systems.

Supplementary Materials

The following supporting information can be downloaded at: https://www.mdpi.com/article/10.3390/en18236103/s1, Table S1: Overview of the five macro-indicators and their specific indicators considered in the study. Detailed descriptions of the Gini Index and the Raw Material Extraction/Reserve Index (RERI) are provided in Section 3.2; Table S2: Method 1, 200,000 km. Values of the Raw Material Extraction/Reserve Index multiplied by the Gini Index for each CRM in the electric and diesel passenger car scenarios; Table S3: Method 1, 540,000 km. Values of the Raw Material Extraction/Reserve Index multiplied by the Gini Index for each CRM in the electric and diesel passenger car scenarios; Table S4: Environmental Footprint 3.1 (adapted), Weighting, 200,000 km. Values, for each damage category, of the electric and diesel passenger car scenarios; Table S5: Environmental Footprint 3.1 (adapted), Weighting, 540,000 km. Values, for each damage category, of the electric and diesel passenger car scenarios.

Author Contributions

Conceptualization, A.C. and F.R.; Methodology, A.C., F.B., R.P. and F.R.; Software, F.B., R.P. and F.R.; Validation, A.C., F.B., R.P. and F.R.; Formal analysis, A.C., F.B., R.P., S.M. and F.R.; Investigation, F.B.; Resources, R.P. and F.R.; Data curation, F.B. and S.M.; Writing—original draft, A.C. and F.B.; Writing—review & editing, A.C.; Visualization, F.B.; Supervision, A.C., R.P. and F.R.; Project administration, A.C. All authors have read and agreed to the published version of the manuscript.

Funding

This research received no external funding.

Data Availability Statement

The original contributions presented in this study are included in the article/Supplementary Materials. Further inquiries can be directed to the corresponding authors.

Conflicts of Interest

The authors declare no conflict of interest.

References

  1. Zanoletti, A.; Massa, M.; Depero, L.E.; Bontempi, E. The Power Law of Resource Abundance and Their Corresponding Extraction: Evidence to Be Accounted in the Frame of the Critical Raw Materials Initiatives for the Energy Transition. Sustain. Energy Technol. Assess. 2024, 72, 104022. [Google Scholar] [CrossRef]
  2. European Commission. Directorate General for Internal Market, Industry, Entrepreneurship and SMEs. In Study on the Critical Raw Materials for the EU 2023: Final Report; Publications Office: Luxembourg, 2023. [Google Scholar]
  3. Simas, M.; Aponte, F.; Wiebe, K. The Future Is Circular: Circular Economy and Critical Minerals for the Green Transition. 2022. Available online: https://www.sintef.no/en/publications/publication/2073636/ (accessed on 20 June 2025).
  4. International Energy Agency. Securing Clean Energy Technology Supply Chains; OECD: Paris, France, 2022; ISBN 978-92-64-95325-3. [Google Scholar]
  5. Husmann, J.; Beylot, A.; Perdu, F.; Pinochet, M.; Cerdas, F.; Herrmann, C. Towards Consistent Life Cycle Assessment Modelling of Circular Economy Strategies for Electric Vehicle Batteries. Sustain. Prod. Consum. 2024, 50, 556–570. [Google Scholar] [CrossRef]
  6. Yusuf Bicer, I.D. 1.27 Life Cycle Assessment of Energy. In Comprehensive Energy Systems; Elsevier: Amsterdam, The Netherlands, 2018; Volume 1. [Google Scholar]
  7. Ellen MacArthur Foundation; Granta Design. Circularity Indicators: An Approach to Measuring Circularity—Methodology; Ellen MacArthur Foundation: Cowes, UK, 2015; Available online: https://content.ellenmacarthurfoundation.org/m/77e62bc9924c20d0/original/circularity-indicators-methodology.pdf (accessed on 16 July 2025).
  8. Cilleruelo Palomero, J.; Freboeuf, L.; Ciroth, A.; Sonnemann, G. Integrating Circularity into Life Cycle Assessment: Circularity with a Life Cycle Perspective. Clean. Environ. Syst. 2024, 12, 100175. [Google Scholar] [CrossRef]
  9. Cappelli, A.; Trimarchi, N.S.; Marzeddu, S.; Paoli, R.; Romagnoli, F. A Comparative Life Cycle Assessment of an Electric and a Conventional Mid-Segment Car: Evaluating the Role of Critical Raw Materials in Potential Abiotic Resource Depletion. Energies 2025, 18, 3698. [Google Scholar] [CrossRef]
  10. International Energy Agency. Net Zero by 2050—A Roadmap for the Global Energy Sector; IEA: Paris, France, 2021. [Google Scholar]
  11. International Energy Agency. The Role of Critical Minerals in Clean Energy Transitions; IEA: Paris, France, 2022. [Google Scholar]
  12. KU Leuven. Metals for Clean Energy: Pathways to Solving Europe’s Raw Materials Challenge 2022; KU Leuven: Leuven, Belgium, 2022. [Google Scholar]
  13. Kamran, M.; Raugei, M.; Hutchinson, A. Critical Elements for a Successful Energy Transition: A Systematic Review. Renew. Sustain. Energy Transit. 2023, 4, 100068. [Google Scholar] [CrossRef]
  14. Chen, X.; Li, L.; Jiang, Y.; Feng, Z.; Li, Q.; Jiang, L.; Dai, L.; Wang, L.; He, Z. Manipulating the Local Electronic Structure Microenvironment at the MXene Interface to Achieve Efficient Anode for Vanadium Redox Flow Battery. J. Energy Chem. 2025, 104, 118–126. [Google Scholar] [CrossRef]
  15. Manjong, N.B.; Usai, L.; Orangi, S.; Clos, D.P.; Strømman, A.H. Exploring Raw Material Contributions to the Greenhouse Gas Emissions of Lithium-Ion Battery Production. J. Energy Storage 2024, 100, 113566. [Google Scholar] [CrossRef]
  16. Ragonnaud, G. Securing Europe’s Supply of Critical Raw Materials; European Parliamentary Research Service: Brussels, Belgium, 2023. [Google Scholar]
  17. Tedesco, R.; Kostrowski, A.; Bodo, E. How to Reduce Our Dependency on Critical Raw Materials by Stimulating Circularity. 2023. Available online: https://www.rreuse.org/publications/how-to-reduce-our-dependency-on-critical-raw-materials-by-stimulating-circularity (accessed on 20 June 2025).
  18. Purdy, C.; Castillo, R. The Future of Mining in Latin America 2022; Brookings Institution: Washington, DC, USA, 2022. [Google Scholar]
  19. Gao, W.; Zhang, L.; Zhang, H.; Zhang, H. The Role of Trade Policy Uncertainty on Contemporaneous and Lagged Connectedness Between Critical Raw Materials and High-Tech Markets: Evidence from China. Resour. Policy 2024, 98, 105356. [Google Scholar] [CrossRef]
  20. International Energy Agency. World Energy Outlook 2024; IEA: Paris, France, 2024. [Google Scholar]
  21. U.S. Department of the Interior. U.S. Geological Survey Mineral Commodity Summaries 2024; USGS: Reston, VA, USA, 2024.
  22. Petavratzi, E.; Gunn, G.; Kresse, C. BGS Commodity Review—Cobalt. 2019. Available online: https://nora.nerc.ac.uk/id/eprint/534461 (accessed on 20 June 2025).
  23. International Energy Agency. Global Electric Vehicle Outlook 2022; IEA: Paris, France, 2022. [Google Scholar]
  24. Seck, G.S.; Hache, E.; Barnet, C. Potential Bottleneck in the Energy Transition: The Case of Cobalt in an Accelerating Electro-Mobility World. Resour. Policy 2022, 75, 102516. [Google Scholar] [CrossRef]
  25. Petavratzi, E.; Josso, P. Global Material Flows of Lithium for the Lithium-Ion and Lithium Iron Phosphate Battery Markets; British Geological Survey: Nottingham, UK, 2021. [Google Scholar]
  26. Graham, J.D.; Rupp, J.A.; Brungard, E. Lithium in the Green Energy Transition: The Quest for Both Sustainability and Security. Sustainability 2021, 13, 11274. [Google Scholar] [CrossRef]
  27. Vakulchuk, R.; Overland, I. Central Asia Is a Missing Link in Analyses of Critical Materials for the Global Clean Energy Transition. One Earth 2021, 4, 1678–1692. [Google Scholar] [CrossRef]
  28. Viebahn, P.; Soukup, O.; Samadi, S.; Teubler, J.; Wiesen, K.; Ritthoff, M. Assessing the Need for Critical Minerals to Shift the German Energy System towards a High Proportion of Renewables. Renew. Sustain. Energy Rev. 2015, 49, 655–671. [Google Scholar] [CrossRef]
  29. Hache, E.; Seck, G.S.; Simoen, M.; Bonnet, C.; Carcanague, S. Critical Raw Materials and Transportation Sector Electrification: A Detailed Bottom-up Analysis in World Transport. Appl. Energy 2019, 240, 6–25. [Google Scholar] [CrossRef]
  30. Klimenko, V.V.; Ratner, S.V.; Tereshin, A.G. Constraints Imposed by Key-Material Resources on Renewable Energy Development. Renew. Sustain. Energy Rev. 2021, 144, 111011. [Google Scholar] [CrossRef]
  31. Greim, P.; Solomon, A.A.; Breyer, C. Assessment of Lithium Criticality in the Global Energy Transition and Addressing Policy Gaps in Transportation. Nat. Commun. 2020, 11, 4570. [Google Scholar] [CrossRef]
  32. U.S. Department of the Interior. U.S. Geological Survey Mineral Commodity Summaries 2022; USGS: Reston, VA, USA, 2022.
  33. Calvo, G.; Valero, A. Strategic Mineral Resources: Availability and Future Estimations for the Renewable Energy Sector. Environ. Dev. 2022, 41, 100640. [Google Scholar] [CrossRef]
  34. De Koning, A.; Kleijn, R.; Huppes, G.; Sprecher, B.; Van Engelen, G.; Tukker, A. Metal Supply Constraints for a Low-Carbon Economy? Resour. Conserv. Recycl. 2018, 129, 202–208. [Google Scholar] [CrossRef]
  35. Bobba, S.; Bianco, I.; Eynard, U.; Carrara, S.; Mathieux, F.; Blengini, G.A. Bridging Tools to Better Understand Environmental Performances and Raw Materials Supply of Traction Batteries in the Future EU Fleet. Energies 2020, 13, 2513. [Google Scholar] [CrossRef]
  36. Guohua, Y.; Elshkaki, A.; Xiao, X. Dynamic Analysis of Future Nickel Demand, Supply, and Associated Materials, Energy, Water, and Carbon Emissions in China. Resour. Policy 2021, 74, 102432. [Google Scholar] [CrossRef]
  37. The Assay. Manganese Steeling for Significant Demand Growth 2021; The Assay: Hong Kong, China, 2021. [Google Scholar]
  38. Li, S.; Yan, J.; Pei, Q.; Sha, J.; Mou, S.; Xiao, Y. Risk Identification and Evaluation of the Long-Term Supply of Manganese Mines in China Based on the VW-BGR Method. Sustainability 2019, 11, 2683. [Google Scholar] [CrossRef]
  39. European Commission. Joint Research Centre. In The Role of Rare Earth Elements in Wind Energy and Electric Mobility: An Analysis of Future Supply/Demand Balances; Publications Office: Luxembourg, 2020. [Google Scholar]
  40. Smith Stegen, K. Heavy Rare Earths, Permanent Magnets, and Renewable Energies: An Imminent Crisis. Energy Policy 2015, 79, 1–8. [Google Scholar] [CrossRef]
  41. Li, J.; Peng, K.; Wang, P.; Zhang, N.; Feng, K.; Guan, D.; Meng, J.; Wei, W.; Yang, Q. Critical Rare-Earth Elements Mismatch Global Wind-Power Ambitions. One Earth 2020, 3, 116–125. [Google Scholar] [CrossRef]
  42. Xie, L.; Wu, W.; Huang, X.; Ou, P.; Lin, Z.; Zhiling, W.; Song, Y.; Lang, T.; Huangfu, W.; Zhang, Y.; et al. Mining and Restoration Monitoring of Rare Earth Element (REE) Exploitation by New Remote Sensing Indicators in Southern Jiangxi, China. Remote Sens. 2020, 12, 3558. [Google Scholar] [CrossRef]
  43. Junne, T.; Wulff, N.; Breyer, C.; Naegler, T. Critical Materials in Global Low-Carbon Energy Scenarios: The Case for Neodymium, Dysprosium, Lithium, and Cobalt. Energy 2020, 211, 118532. [Google Scholar] [CrossRef]
  44. Ballinger, B.; Schmeda-Lopez, D.; Kefford, B.; Parkinson, B.; Stringer, M.; Greig, C.; Smart, S. The Vulnerability of Electric-Vehicle and Wind-Turbine Supply Chains to the Supply of Rare-Earth Elements in a 2-Degree Scenario. Sustain. Prod. Consum. 2020, 22, 68–76. [Google Scholar] [CrossRef]
  45. Grandell, L.; Höök, M. Assessing Rare Metal Availability Challenges for Solar Energy Technologies. Sustainability 2015, 7, 11818–11837. [Google Scholar] [CrossRef]
  46. Hao, H.; Geng, Y.; Tate, J.E.; Liu, F.; Sun, X.; Mu, Z.; Xun, D.; Liu, Z.; Zhao, F. Securing Platinum-Group Metals for Transport Low-Carbon Transition. One Earth 2019, 1, 117–125. [Google Scholar] [CrossRef]
  47. Rasmussen, K.D.; Wenzel, H.; Bangs, C.; Petavratzi, E.; Liu, G. Platinum Demand and Potential Bottlenecks in the Global Green Transition: A Dynamic Material Flow Analysis. Environ. Sci. Technol. 2019, 53, 11541–11551. [Google Scholar] [CrossRef]
  48. Tong, X.; Dai, H.; Lu, P.; Zhang, A.; Ma, T. Saving Global Platinum Demand While Achieving Carbon Neutrality in the Passenger Transport Sector: Linking Material Flow Analysis with Integrated Assessment Model. Resour. Conserv. Recycl. 2022, 179, 106110. [Google Scholar] [CrossRef]
  49. Oberly, A.; Singerling, S.; Schulte, R.F. Platinum-Group Metals. In Mineral Commodity Summaries 2018; U.S. Geological Survey: Reston, VA, USA, 2018. [Google Scholar]
  50. Minke, C.; Suermann, M.; Bensmann, B.; Hanke-Rauschenbach, R. Is Iridium Demand a Potential Bottleneck in the Realization of Large-Scale PEM Water Electrolysis? Int. J. Hydrogen Energy 2021, 46, 23581–23590. [Google Scholar] [CrossRef]
  51. Mulvaney, D.; Richards, R.M.; Bazilian, M.D.; Hensley, E.; Clough, G.; Sridhar, S. Progress towards a Circular Economy in Materials to Decarbonize Electricity and Mobility. Renew. Sustain. Energy Rev. 2021, 137, 110604. [Google Scholar] [CrossRef]
  52. Huang, C.-L.; Xu, M.; Cui, S.; Li, Z.; Fang, H.; Wang, P. Copper-Induced Ripple Effects by the Expanding Electric Vehicle Fleet: A Crisis or an Opportunity. Resour. Conserv. Recycl. 2020, 161, 104861. [Google Scholar] [CrossRef]
  53. Watari, T.; McLellan, B.; Ogata, S.; Tezuka, T. Analysis of Potential for Critical Metal Resource Constraints in the International Energy Agency’s Long-Term Low-Carbon Energy Scenarios. Minerals 2018, 8, 156. [Google Scholar] [CrossRef]
  54. Henckens, M.L.C.M.; Worrell, E. Reviewing the Availability of Copper and Nickel for Future Generations. The Balance between Production Growth, Sustainability and Recycling Rates. J. Clean. Prod. 2020, 264, 121460. [Google Scholar] [CrossRef]
  55. U.S. Department of the Interior. U.S. Geological Survey Mineral Commodity Summaries 2011; USGS: Reston, VA, USA, 2011.
  56. Watari, T.; Northey, S.; Giurco, D.; Hata, S.; Yokoi, R.; Nansai, K.; Nakajima, K. Global Copper Cycles and Greenhouse Gas Emissions in a 1.5 °C World. Resour. Conserv. Recycl. 2022, 179, 106118. [Google Scholar] [CrossRef]
  57. Seck, G.S.; Hache, E.; Bonnet, C.; Simoën, M.; Carcanague, S. Copper at the Crossroads: Assessment of the Interactions between Low-Carbon Energy Transition and Supply Limitations. Resour. Conserv. Recycl. 2020, 163, 105072. [Google Scholar] [CrossRef]
  58. Vidal, O.; Rostom, F.; François, C.; Giraud, G. Global Trends in Metal Consumption and Supply: The Raw Material–Energy Nexus. Elements 2017, 13, 319–324. [Google Scholar] [CrossRef]
  59. Månberger, A.; Johansson, B. The Geopolitics of Metals and Metalloids Used for the Renewable Energy Transition. Energy Strategy Rev. 2019, 26, 100394. [Google Scholar] [CrossRef]
  60. European Commission. The Raw Materials Initiative—Meeting Our Critical Needs for Growth and Jobs in Europe; European Commission: Luxembourg, 2008. [Google Scholar]
  61. Manjong, N.B.; Marinova, S.; Bach, V.; Burheim, O.S.; Finkbeiner, M.; Strømman, A.H. Approaching Battery Raw Material Sourcing through a Material Criticality Lens. Sustain. Prod. Consum. 2024, 49, 289–303. [Google Scholar] [CrossRef]
  62. Almansour, S. Criticality and Life Cycle Assessment of Lithium-Ion-Battery Raw Materials. Master’s Thesis, University of Liège, Liège, Belgium, 2022. [Google Scholar]
  63. Beylot, A.; Dewulf, J.; Greffe, T.; Muller, S.; Blengini, G.-A. Mineral Resources Depletion, Dissipation and Accessibility in LCA: A Critical Analysis. Int. J. Life Cycle Assess. 2024, 29, 890–908. [Google Scholar] [CrossRef]
  64. Van Oers, L.; Guinée, J.B.; Heijungs, R.; Schulze, R.; Alvarenga, R.A.F.; Dewulf, J.; Drielsma, J.; Sanjuan-Delmás, D.; Kampmann, T.C.; Bark, G.; et al. Top-down Characterization of Resource Use in LCA: From Problem Definition of Resource Use to Operational Characterization Factors for Dissipation of Elements to the Environment. Int. J. Life Cycle Assess. 2020, 25, 2255–2273. [Google Scholar] [CrossRef]
  65. Owsianiak, M.; Van Oers, L.; Drielsma, J.; Laurent, A.; Hauschild, M.Z. Identification of Dissipative Emissions for Improved Assessment of Metal Resources in Life Cycle Assessment. J. Ind. Ecol. 2022, 26, 406–420. [Google Scholar] [CrossRef]
  66. Charpentier Poncelet, A.; Loubet, P.; Helbig, C.; Beylot, A.; Muller, S.; Villeneuve, J.; Laratte, B.; Thorenz, A.; Tuma, A.; Sonnemann, G. Midpoint and Endpoint Characterization Factors for Mineral Resource Dissipation: Methods and Application to 6000 Data Sets. Int. J. Life Cycle Assess. 2022, 27, 1180–1198. [Google Scholar] [CrossRef]
  67. Beylot, A.; Ardente, F.; Sala, S.; Zampori, L. Mineral Resource Dissipation in Life Cycle Inventories. Int. J. Life Cycle Assess. 2021, 26, 497–510. [Google Scholar] [CrossRef]
  68. Ardente, F.; Beylot, A.; Zampori, L. A Price-Based Life Cycle Impact Assessment Method to Quantify the Reduced Accessibility to Mineral Resources Value. Int. J. Life Cycle Assess. 2023, 28, 95–109. [Google Scholar] [CrossRef]
  69. Conrad, C.; Kleen, O. Two Are Better than One: Volatility Forecasting Using Multiplicative Component GARCH-MIDAS Models. J. Appl. Econom. 2020, 35, 19–45. [Google Scholar] [CrossRef]
  70. Helbig, C.; Bruckler, M.; Thorenz, A.; Tuma, A. An Overview of Indicator Choice and Normalization in Raw Material Supply Risk Assessments. Resources 2021, 10, 79. [Google Scholar] [CrossRef]
  71. Černý, I.; Krčmarská, L.; Špakovská, K.; Rolčíková, M. Multi-Criteria Decision-Making Analysis of Critical Raw Materials in the European Union. Int. Multidiscip. Sci. GeoConf. SGEM 2016, 2, 619–626. [Google Scholar]
  72. Qualtrics Likert Scale. Qualtrics. 2024. Available online: https://www.qualtrics.com/articles/strategy-research/likert-scale/ (accessed on 20 June 2025).
  73. Bruijn, H.; Duin, R.; Huijbregts, M.A.J.; Guinee, J.B.; Gorree, M.; Heijungs, R.; Huppes, G.; Kleijn, R.; Koning, A.; Oers, L.; et al. Handbook on Life Cycle Assessment: Operational Guide to the ISO Standards; Eco-Efficiency in Industry and Science; Kluwer Academic Publishers: Dordrecht, The Netherlands, 2004; ISBN 978-0-306-48055-3. [Google Scholar]
  74. Guinée, J.B.; Heijungs, R. A Proposal for the Definition of Resource Equivalency Factors for Use in Product Life-cycle Assessment. Environ. Toxic Chem. 1995, 14, 917–925. [Google Scholar] [CrossRef]
  75. Van Oers, L.; Guinée, J.B.; Heijungs, R. Abiotic Resource Depletion Potentials (ADPs) for Elements Revisited—Updating Ultimate Reserve Estimates and Introducing Time Series for Production Data. Int. J. Life Cycle Assess. 2020, 25, 294–308. [Google Scholar] [CrossRef]
  76. U.S. Geological Survey. Mineral Commodity Summaries 2024—Magnesium Compounds: Data Release; U.S. Department of the Interior: Reston, VA, USA, 2024. Available online: https://catalog.data.gov/dataset/mineral-commodity-summaries-2024-magnesium-compounds-data-release (accessed on 7 November 2025).
  77. U.S. Geological Survey. Mineral Commodity Summaries 2024—Phosphate Rock: Data Release; U.S. Department of the Interior: Reston, VA, USA, 2024. Available online: https://data.usgs.gov/datacatalog/data/USGS%3A65b7d847d34e36a39045b503 (accessed on 7 November 2025).
  78. Frenzel, M.; Ketris, M.P.; Gutzmer, J. On the Geological Availability of Germanium. Min. Depos. 2014, 49, 471–486. [Google Scholar] [CrossRef]
  79. Han, Z.; Liu, Q.; Ouyang, X.; Song, H.; Gao, T.; Liu, Y.; Wen, B.; Dai, T. Tracking Two Decades of Global Gallium Stocks and Flows: A Dynamic Material Flow Analysis. Resour. Conserv. Recycl. 2024, 202, 107391. [Google Scholar] [CrossRef]
  80. Foosoon Trading Co., Ltd. Global Silicon Metal Reserves Revealed; Foosoon Trading: Hong Kong, China, 2021; Available online: https://foosoonhk.com/news/industry-news/global-silicon-metal-reserves-revealed/ (accessed on 7 November 2025).
  81. Center on Global Energy Policy at Columbia University, School of International and Public Affairs. Materials Powering the Future of Energy Dataset; Center on Global Energy Policy: New York, NY, USA, 2023. [Google Scholar]
  82. Idoine, N.E.; Raycraft, E.R.; Hobbs, S.F.; Everett, P.; Evans, E.J.; Mills, A.J.; Currie, D.; Horn, S.; Shaw, R.A. World Mineral Production 2018–2022; British Geological Survey: Keyworth, Nottingham, UK, 2024; Available online: https://www.bgs.ac.uk/mineralsuk/statistics/world-mineral-statistics/ (accessed on 7 November 2025).
  83. Phoung, S.; Williams, E.; Gaustad, G.; Gupta, A. Exploring Global Supply and Demand of Scandium Oxide in 2030. J. Clean. Prod. 2023, 401, 136673. [Google Scholar] [CrossRef]
  84. U.S. Geological Survey. Mineral Commodity Summaries 2024; U.S. Department of the Interior: Reston, VA, USA, 2024. Available online: https://pubs.usgs.gov/publication/mcs2024 (accessed on 7 November 2025). [CrossRef]
  85. ISO 14040:2006; Environmental Management—Life Cycle Assessment—Principles and Framework. ISO: Geneva, Switzerland, 2006. Available online: https://www.iso.org/standard/37456.html (accessed on 7 November 2025).
  86. ISO 14044:2006; Environmental Management—Life Cycle Assessment—Requirements and Guidelines. International Organization for Standardization: Geneva, Switzerland, 2006.
  87. Database & Support team at PRé Sustainability. SimaPro Database Manual—Methods Library 2024; PRé Sustainability: Amersfoort, The Netherlands, 2024. [Google Scholar]
  88. Xiarchos, I.; Morozinis, A.K.; Charitidis, C. Life-Cycle Assessment and Possible Impacts of CFRPs for Space Applications; EDP Sciences: Les Ulis, France, 2019. [Google Scholar]
  89. Chen, Q.; Lai, X.; Chen, J.; Huang, Y.; Guo, Y.; Wang, Y.; Han, X.; Lu, L.; Sun, Y.; Ouyang, M.; et al. A Critical Comparison of LCA Calculation Models for the Power Lithium-Ion Battery in Electric Vehicles during Use-Phase. Energy 2024, 296, 131175. [Google Scholar] [CrossRef]
  90. Zackrisson, M.; Avellán, L.; Orlenius, J. Life Cycle Assessment of Lithium-Ion Batteries for Plug-in Hybrid Electric Vehicles—Critical Issues. J. Clean. Prod. 2010, 18, 1519–1529. [Google Scholar] [CrossRef]
  91. Shen, K.; Zhai, Q.; Gu, Y.; Wang, W.; Cao, H.; Hauschild, M.; Yuan, C. Life Cycle Assessment of Lithium Ion Battery from Water-Based Manufacturing for Electric Vehicles. Resour. Conserv. Recycl. 2023, 198, 107152. [Google Scholar] [CrossRef]
  92. Kim, J.-H.; Woo, S.C.; Park, M.-S.; Kim, K.J.; Yim, T.; Kim, J.-S.; Kim, Y.-J. Capacity Fading Mechanism of LiFePO4-Based Lithium Secondary Batteries for Stationary Energy Storage. J. Power Sources 2013, 229, 190–197. [Google Scholar] [CrossRef]
  93. Verme, M.D.; Lipari, D.; Lucido, G.; Maio, V.; Surace, V.; Liberatore, P. Rapporto Statistico 2021 Energia Da Fonti Rinnovabili in Italia; Gestore dei Servizi Energetici SpA: Rome, Italy, 2023. [Google Scholar]
  94. Pagnanelli, F.; Altimari, P.; Schiavi, P.G. Process Development for End-of-Life Li-Ion Batteries. Chim. Ind. 2021, 103, 24. Available online: https://www.soc.chim.it/sites/default/files/chimind/pdf/2021_5_24_ca.pdf (accessed on 20 June 2025).
  95. Hawkins, T.R.; Singh, B.; Majeau-Bettez, G.; Strømman, A.H. Comparative Environmental Life Cycle Assessment of Conventional and Electric Vehicles. J. Ind. Ecol. 2013, 17, 53–64. [Google Scholar] [CrossRef]
  96. Ellingsen, L.A.-W.; Singh, B.; Strømman, A.H. The Size and Range Effect: Lifecycle Greenhouse Gas Emissions of Electric Vehicles. Environ. Res. Lett. 2016, 11, 054010. [Google Scholar] [CrossRef]
  97. Das, P.K.; Bhat, M.Y.; Sajith, S. Life Cycle Assessment of Electric Vehicles: A Systematic Review of Literature. Environ. Sci. Pollut. Res. 2024, 31, 73–89. [Google Scholar] [CrossRef] [PubMed]
  98. Bieker, G. A Global Comparison of the Life-Cycle Greenhouse Gas Emissions of Combustion Engine and Electric Passenger Cars; International Council on Clean Transportation (ICCT): Washington, DC, USA; Berlin, Germany, 2021; Available online: https://theicct.org/sites/default/files/publications/Global-LCA-passenger-cars-jul2021_0.pdf (accessed on 7 November 2025).
  99. Idris, M.; Koestoer, R.H. Environmental Life Cycle Assessment of Conventional and Electric Vehicles: Lessons Learned from Selected Countries. J. Innov. Mater. Energy Sustain. Eng. 2023, 1, 1–19. [Google Scholar] [CrossRef]
Figure 1. Overview of metals used in clean energy technologies and energy systems, comprising both EU-listed critical raw materials and other strategic metals. Authors’ elaboration based on KU Leuven and Eurometaux (2022) [12].
Energies 18 06103 g001
Figure 2. Geographic concentration of selected clean energy technologies by supply chain stage and country/region, 2021. Original notes: NAM: North America; Rest of APAC: Asia-Pacific excluding China and India; CSAM: Central and South America. Alum.: Aluminium. Although Indonesia produces around 40% of total nickel, little of this is currently used in the EV battery supply chain. The largest Class 1 battery-grade nickel producers are Russia, Canada and Australia. Source: IEA (2022), Securing Clean Energy Technology Supply Chains, OECD Publishing, Paris. Licenced under CC BY 4.0 [4].
Energies 18 06103 g002
Figure 3. Criterion 1: Performance score values for the Supply Chain category for the electric and diesel passenger cars, as a function of the assigned weight.
Energies 18 06103 g003
Figure 4. Criterion 2: Performance score values for the Technological category for the electric and diesel passenger cars, as a function of the assigned weight.
Energies 18 06103 g004
Figure 5. Criterion 3: Performance score values for the Environmental category for the electric and diesel passenger cars, as a function of the assigned weight.
Energies 18 06103 g005
Figure 6. Criterion 4: Performance score values for the Economic category for the electric and diesel passenger cars, as a function of the assigned weight.
Energies 18 06103 g006
Figure 7. Criterion 5: Performance score values for the Legislative category for the electric and diesel passenger cars, as a function of the assigned weight.
Energies 18 06103 g007
Figure 8. (a) Electric vehicle and (b) diesel vehicle. Air emissions by impact category. For the diesel vehicle, emissions primarily arise from combustion processes, with limited CO but notable NOx and PM due to the high air–fuel ratio typical of modern engines. For the electric vehicle, emissions reflect the upstream electricity generation mix, varying according to the share of renewable and fossil-based sources.
Energies 18 06103 g008
Figure 9. Method 1, single score at 200,000 km. Values of the Raw Material Extraction/Reserve Index multiplied by the Gini Index for each CRM in the electric and diesel passenger car scenarios.
Energies 18 06103 g009
Figure 10. Method 1, single score at 540,000 km. Values of the Raw Material Extraction/Reserve Index multiplied by the Gini Index for each CRM in the electric and diesel passenger car scenarios.
Energies 18 06103 g010
Figure 11. Method 2, damage assessment, 200,000 km. Values, for each damage category, of the electric and diesel passenger car scenarios.
Energies 18 06103 g011
Figure 12. Method 2, damage assessment, 540,000 km. Values, for each damage category, of the electric and diesel passenger car scenarios.
Energies 18 06103 g012
Figure 13. Environmental Footprint 3.1 (adapted), single score, 200,000 km. Values, for each damage category, of the electric and diesel passenger car scenarios.
Energies 18 06103 g013
Figure 14. Environmental Footprint 3.1 (adapted), single score, 540,000 km. Values, for each damage category, of the electric and diesel passenger car scenarios.
Energies 18 06103 g014
Figure 15. Comparison of the use of raw materials using Environmental Footprint 3.1 (adapted) and Method 2 for the electric and diesel passenger car scenarios, 200,000 km. Values are expressed in percentage.
Energies 18 06103 g015
Figure 16. Comparison of the use of raw materials using Environmental Footprint 3.1 (adapted) and Method 2 for the electric and diesel passenger car scenarios, 540,000 km. Values are expressed in percentage.
Energies 18 06103 g016
Table 1. 2023 Critical raw materials for the EU. Source: [2]. Note: * Copper and Nickel do not meet the CRM thresholds but are included as CRMs.
2023 Critical Raw Materials
Aluminium/BauxiteCoking CoalLithiumPhosphorous
AntimonyFeldsparLREEScandium
ArsenicFluorsparMagnesiumSilicon metal
BaryteGalliumManganeseStrontium
BerylliumGermaniumNatural graphiteTantalum
BismuthHafniumNiobiumTitanium metal
Boron/BorateHeliumPGMTungsten
CobaltHREEPhosphate rockVanadium
Copper *Nickel *
Table 2. Raw Material Extraction/Reserve Index and Gini Index for all 34 raw materials, for the year 2022. Calculation based on data from [2,21,76,77,78,79,80,81,82,83,84].
2023 CRM Resource—Depletion Index
2022
GINI Index
2022
Aluminium/bauxite 0.01330.58
Antimony 0.04160.56
Arsenic 0.05000.50
Baryte 0.02970.47
Beryllium 0.00280.50
Bismuth 0.06910.68
Boron/borate 0.00310.63
Cobalt 0.01790.70
Coking coal 0.00150.41
Copper 0.02190.41
Feldspar 0.01160.46
Fluorspar 0.02970.66
Gallium 0.00040.73
Germanium 0.00030.73
Hafnium 9.59 × 10−70.45
Helium 0.01320.59
HREEEuropium0.00241
Gadolinium0.00241
Terbium0.00131
Yttrium0.02081
Erbium0.00081
Holmium0.00051
Thulium0.00181
Ytterbium0.00021
Lutetium0.00091
Dysprosium0.00111
TOTAL HREE0.00281
LREECerium0.10450.54
Lanthanum0.00210.54
Praseodymium0.00130.54
Neodymium0.00090.54
Samarium0.00040.54
TOTAL LREE0.00380.39
REE 0.00680.42
Lithium 0.00520.55
Magnesium metal 0.00040.74
Manganese 0.01040.62
Natural graphite 0.00600.63
Nickel 0.02520.51
Niobium 0.00490.59
PGMIridium0.00160.45
Ruthenium0.00160.45
Osmium0.00160.45
Palladium0.00710.28
Platinum0.00610.48
Rhodium0.00320.50
TOTAL0.00610.67
Phosphate rock 0.00310.61
Phosphorus 0.00330.56
Scandium 0.000010.59
Silicon metal 0.0000010.62
Strontium 0.02710.30
Tantalum 0.00510.57
Titanium metal 0.01250.41
Tungsten 0.01810.65
Vanadium 0.00540.49
Table 3. The five macro indicators and their specific indicators. Each indicator has its own impact level from 1 to 5.
IndicatorsScenario 1 Electric Passenger CarScenario 2 Diesel Passenger CarIdeal Target
Min or Max
Supply chain
Extraction of Critical Raw Materials53Min
EOL Recycling Rate54Max
Gini Index42Max
Resources diversification43Min
Dependency on Import44Min
Future demand for CRMs using recycled material42Max
Technological
Lifespans of CRMs53Max
Dependence of the technological system on specific characteristics of CRMs52Min
Substitutability54Max
Research and innovation53Max
Advanced recycling processes54Max
Ease of manufacturing raw materials42Max
Environmental
Sustainable mining activities43Max
Raw Material Extraction/Reserve Index53Min
GHG emissions from CRMs extraction/production33Min
Energy intensity to produce secondary material43Min
Application of circularity practices43Max
Environmental Footprint34Min
Economic
Market volatility53Min
Market incentives for improvement43Max
Market for secondary raw materials43Max
High-tech market52Max
Legislative
Trade policy uncertainty43Min
Political instability53Min
Military vulnerability42Min
Export restrictions42Max
Innovation to diversify products on the market42Max
Disclaimer/Publisher’s Note: The statements, opinions and data contained in all publications are solely those of the individual author(s) and contributor(s) and not of MDPI and/or the editor(s). MDPI and/or the editor(s) disclaim responsibility for any injury to people or property resulting from any ideas, methods, instructions or products referred to in the content.