Article

Resilient Preventive Scheduling for Hydrogen-Based Integrated Energy Systems Considering Impacts of Natural Disasters

1
School of Internet of Things Engineering, Wuxi University, Wuxi 214105, China
2
Key Laboratory of Measurement and Control of CSE, Ministry of Education, Southeast University, Nanjing 210096, China
*
Author to whom correspondence should be addressed.
Energies 2025, 18(23), 6091; https://doi.org/10.3390/en18236091
Submission received: 23 October 2025 / Revised: 12 November 2025 / Accepted: 18 November 2025 / Published: 21 November 2025
(This article belongs to the Section A1: Smart Grids and Microgrids)

Abstract

Hydrogen energy is developing rapidly, and the hydrogen-based integrated energy system (HIES) offers improved economic performance, flexibility, and environmental benefits compared with conventional power systems. However, the increasing frequency of natural disasters caused by climate change introduces significant vulnerabilities that threaten system security. Preventive scheduling provides a proactive and economical means to enhance system resilience against such uncertainties. This paper proposes a preventive scheduling model for HIES based on adaptive robust optimization (ARO) to address the uncertain impacts of natural disasters on transmission lines, pipelines, and roads. The model incorporates the operational constraints and interdependencies among multiple energy subsystems and integrates flexible scheduling strategies such as power-to-hydrogen-and-heat (P2HH) and hydrogen transportation (HT). A hybrid algorithm is developed to efficiently solve the large-scale ARO problem with numerous integer variables. Case studies performed on two test systems demonstrate that the proposed preventive scheduling model effectively reduces operational costs and load curtailments. Simulation results show that coordinating P2HH and HT reduces power, heat, hydrogen, and gas load curtailments by 14.35%, 43.39%, 49.97%, and 40.32%, respectively, as well as operational costs by 14.60%. Moreover, the proposed hybrid algorithm enhances computational efficiency, reducing solution time by 21% with only a 2% deviation from the solution obtained by the conventional C&CG–AOP algorithm.

1. Introduction

In the past decade, climate change has led to frequent natural disasters, which seriously threaten the operation safety of power systems [1]. To make the power grid stronger and smarter against natural disasters, reference [2] introduced the concept of power system resilience, which has received much attention from researchers. The research on resilient power system can be divided into five categories: resilience assessment [3], long-term resilience-oriented planning [4], short-term preventive scheduling [5], real-time emergency response [6], and recovery planning post-disaster including service restoration [7] and black-start management [8]. Compared with long-term planning, such as line hardening in [9], short-term preventive scheduling provides a more flexible and economical way for resilience enhancement using the existing resources and facilities against natural disasters [10]. This paper focuses on the day-ahead preventive scheduling.
With the rapid development of hydrogen production, transportation, and storage technologies, the hydrogen-based integrated energy system (HIES) has been introduced for greenhouse gas eliminating and climate change mitigation in recent years due to its high energy density, cleanness, and sustainability. Many works have been devoted to HIES operation and planning for flexibility enhancement for economic and environmental benefits. Meanwhile, compared with modern battery-based and DC smart-grid technologies widely adopted to enhance short-term resilience [11], HIES provides a complementary long-duration and multi-energy solution [12], as summarized in Table 1. Renewable energy such as solar and wind can be on-site converted into hydrogen by electrolyzers (ELZs) and stored for supply–demand balance [13]. In addition to methanation reactor (MR) with carbon capture facilities [14], the hydrogen-enriched compressed natural gas (HCNG) is developed by directly mixed hydrogen with natural gas [15]. References [16,17,18] studied the hydrogen supply chain coordinating the on-site hydrogen production/storage, hydrogen transportation (HT), and distribution. When the electricity or hydrogen supply is interrupted, these facilities will not work correctly, which further affects the energy supplies to customers in the HIES. Therefore, the ever-increasing inter-dependency of hydrogen systems, power systems, heat systems, and natural gas systems may result in extraordinary vulnerabilities to natural disasters in HIES operation.
Great efforts have been made to develop preventive scheduling methods for the resilient HIES against natural disasters. Among them, preventive unit commitment (UC) of key equipment such as generators and ELZs is the most widely used approach. In [19], a bi-level UC model that performs rolling scheduling before disasters was proposed, and demonstrated its economic efficiency and high energy supply capability through simulations. To balance economic efficiency and resilience, authors in [20] developed a multi-objective optimization model ensuring that increased operating costs do not lead to load shedding. The above-mentioned works primarily focus on electric–hydrogen coupled systems, while some recent studies have begun to consider couplings with other energy systems. For example, ref. [14] proposed a resilient operation strategy for coordinating hydrogen conversion and production, in which HCNG were utilized as emergency energy resources transmitted through gas network system (GNS). Regarding electric–thermal coupling, several studies have explored hydrogen-assisted heat supply, including heat generation through fuel cells [21] and heat recovery during electrolysis [22]. However, few studies have simultaneously considered the interactions among electricity, gas, heat, and hydrogen subsystems within HIESs. Therefore, to establish practical preventive scheduling methods that reflect real HIES operations, it is essential to account for the integrated coupling of electricity, gas, heat, and hydrogen in the modeling framework.
Another effective and widely studied approach for enhancing system resilience is based on mobile energy resources (MERs). In HIESs, MERs include electric vehicles (EVs), mobile generators, and mobile energy storage systems for electricity supply, as well as fuel-cell EVs or hydrogen trucks for hydrogen delivery. To maximize their effectiveness in resilience enhancement, MERs are preventively allocated before disasters and dispatched according to preplanned strategies during disasters. In [23], a hierarchical HIES resilience scheduling strategy was proposed, in which the upper layer coordinates energy production facilities, while the lower layer manages fuel-cell EV dispatch to maintain energy balance among microgrids. The authors in [24] proposed a two-stage stochastic scheduling method for mobile wind turbines, which improves system resilience while reducing carbon emissions. Furthermore, to address uncertainties in disaster impacts on system operation, adaptive robust optimization (ARO)-based preventive scheduling models [25] and corresponding high-efficiency solution algorithms [26] have been developed. However, in most existing studies, MER routing networks are required to be predefined [23,24], which limits the applicability of these methods in scenarios with potential traffic disruptions. In [27], the influence of faulted traffic roads was considered. Nevertheless, road traffic conditions, such as travel time, were assumed to be deterministic in most studies, making them unsuitable for representing the complex uncertainties introduced by disasters. Therefore, further efforts are needed to develop robust preventive scheduling methods that incorporate multiple uncertainties including faulted transportation networks.
Therefore, research gaps exist in (1) establishing a practical preventive scheduling method that accounts for the integrated coupling of electricity, gas, heat, and hydrogen in HIESs, and (2) developing robust preventive scheduling methods that incorporate multiple uncertainties, including failures in transportation networks. This paper proposes a day-ahead preventive scheduling method for HIESs that considers the uncertain impacts of natural disasters to enhance system resilience. The proposed approach realizes the integration of electricity, gas, heat, and hydrogen subsystems through energy hubs (EHs) located at the coupling points between the transmission network system (TNS) and the GNS. Furthermore, a HT model is developed to capture the uncertain impacts of road traffic disruptions, based on which an ARO-based preventive scheduling model is formulated to ensure robust and reliable operation under various disaster-induced uncertainties. The major contributions are listed as follows:
1.
A resilient preventive scheduling model for HIESs is proposed to mitigate the impacts of natural disasters. The model considers the coordinated operation of the TNS, GNS, and EHs to practically account for the integrated coupling of electricity, gas, heat, and hydrogen in HIESs. In particular, flexible scheduling measures such as power-to-hydrogen-and-heat (P2HH) conversion and HT scheduling are incorporated and investigated to enhance system resilience.
2.
An ARO-based preventive scheduling model is developed to handle uncertainties including damaged transmission lines (TLs), gas pipelines, and roads. In particular, a novel HT scheduling model is proposed to characterize the uncertainty associated with road disruptions in the second stage.
3.
A hybrid algorithm is proposed to solve the proposed preventive scheduling model. The algorithm is developed based upon the column-and-constraint-generation (C&CG) framework and efficiently identifies near-optimal solutions for problems with a large number of integer variables by integrating analytical target cascading (ATC) and alternating optimization procedures (AOP).
The remainder of this paper is organized as follows. Section 2 describes the formulation of the proposed preventive scheduling model. Section 3 presents the solution methodology based on the proposed algorithm. Case studies are conducted in Section 4, followed by conclusions in Section 5.

2. Proposed Preventive Scheduling Model

2.1. System Settings and Assumptions

The ARO framework is adopted to formulate the preventive scheduling model for resilience enhancement against natural disasters. The operator aims to minimize the operation costs leveraging the potential damage in the TNS, GNS, and road network (RN). The proposed preventive scheduling approach consists of two stages. In the first stage, preventive unit commitment decisions, including those for coal-fired generators (CGs) in the TNS and ELZs EHs, are determined to safeguard HIES operation prior to any disaster. In the second stage, emergency scheduling is conducted to minimize operational costs and load curtailments under the worst-case damage scenarios in the TNS, GNS, and RN. Some key hypotheses are outlined as follows.
1.
Although renewable outputs and demands in the IEGS are generally volatile, their impacts on the performance of the proposed day-ahead preventive scheduling for transmission-level HIESs are not the main focus of this study. This is because the bidirectional interactions enabled by the power-to-gas facilities and gas turbines (GTs), together with the line-pack reserves in the GNS [28], can help buffer these fluctuations. This assumption has also been used in recent studies [14], but it can be incorporated through uncertainty sets in future work if needed.
2.
Both the CGs and the ELZs are committed in the first stage because the catalyst layer of the electrolysis cell is highly sensitive to degradation caused by frequent startups and shutdowns [22].
3.
Linear gas flow models are widely used for modeling the operation of transmission-level HIESs [28]. In this paper, a linear gas flow model is adopted under the assumption that the GNS has sufficient capacity to regulate pressure during disasters [13]. Nonetheless, from a mathematical standpoint, the proposed method can readily incorporate linear security-constrained gas flow models if required.
4.
The disaster-impacted areas can be estimated by the system operator based on analyses of weather records and historical data statistics [29]. The affected HIES facilities are assumed to be limited to transmission lines, pipelines, and roads, as these components are most vulnerable to disasters such as hurricanes and snowstorms.
5.
Impacted facilities are assumed to remain unavailable throughout the scheduling horizon. This is a common resilience-oriented assumption because repairing transmission-level infrastructure typically requires more than one day during natural disasters [30].

2.2. First-Stage Model

The objective of the first-stage model is to minimize the total unit commitment cost of both CGs and ELZs. Meanwhile, decisions in the first stage are determined based on the feasibility constraints from both the first and second stages. The first-stage model is expressed as
min x t n C n , t e l z , s 1 + i C i , t c g , s 1
S u b j e c t   t o C n , t e l z , s 1 = c n e l z , o n x n , t o n + c n e l z , o f f x n , t o f f + c n e l z , n l δ n , t , n C i , t c g , s 1 = c i c g , o n x i , t o n + c i o f f x i , t o f f + c i c g , n l δ i , t , i
δ { · } , t δ { · } , t 1 = x { · } , t o n x { · } , t o f f δ { · } , μ x { · } , t o n , t μ t + T { · } o n 1 1 δ { · } , μ x { · } , t o f f , t μ t + T { · } o f f 1 ; i , n , { · } = i , n
where x = { δ { · } , t , x { · } , t o n , x { · } , t o f f , { · } = i , n } denotes the first stage binary variables determining UC decisions. Equation (1) denotes the first stage objective, which aims to minimize the UC costs of CGs and ELZs including the startup/shutdown cost and no-load cost (2). Constraint (3) restricts the startup/shutdown states and the minimum on/off time of these units [13].

2.3. Second-Stage Model

In the second stage, the maximum emergency scheduling cost among any possible facility damage within the impacted areas in the case of preventive scheduling (i.e., the unit commitment scheduling) is obtained by solving the following max–min model:
max u L , u P u R = u i e s u h t = u U min y = y i e s y h t , z Ψ x , u × t n C n , t e h , s 2 + C t g n s , s 2 + C t t n s , s 2 + C t h t
s . t . Ψ x , u = ( y , z ) | ( 7 ) ( 28 )
where u denotes random facility damage status by disasters. y , z represent the continuous and binary variables in the second stage, respectively. The second stage objective shown in (4) contains the worst-case scenario identification and emergency scheduling, which is subject to the following uncertainty set of facility damage scenario and system operation models in constraint (5) including EHs, TNS, GNS, and HT scheduling.

2.3.1. Uncertainty Set

The potentially damaged facilities include the TLs, pipes, and roads within the impacted areas. The uncertainty set U is described as
U = l 1 u l , t L Γ L , u l , t L u l , t + 1 L , l L i m p , t p 1 u p , t P Γ P , u p , t P u p , t + 1 P , p P i m p , t r 1 u r , t R Γ R , u r , t R u r , t + 1 R , r R i m p , t
where Γ L , Γ P , Γ R are budgets of uncertainty for TLs, pipes, and roads within the impacted areas, respectively. Once the facility is damaged, it remains unavailable for the rest of the scheduling time spans.

2.3.2. EH Model

The structure of the EH within the HIES is illustrated in Figure 1. Each EH is simultaneously coupled with a TNS bus, a GNS node, and a road node in the transportation network. Within the EH, the input electric power is converted into hydrogen and heat by the ELZs through P2HH scheduling, and the detailed P2HH process can be found in [31]. The produced hydrogen can be further converted into natural gas by the MR for GT operation or used for electricity generation through the fuel cell (FC). The surplus electric power can be exported back to the TNS. Hydrogen can also be transported among EHs via HT. Natural gas flows bidirectionally within the EH, supplying the GTs and gas loads while also accepting the gas produced by the MR. In addition, the EH is equipped with energy storage units for electricity, heat, and hydrogen, including energy storage (ES), thermal storage (TS), and hydrogen storage (HS), respectively. The mathematical model of the EH is formulated as follows.
C n , t e h , s 2 = c n e l z , o p · P n , t e l z + c n g t , o p · M n , t g t + c n m r · H n , t m r + c n h s · p n , t h s + p s , t h s + + c n e s · p n , t e s + p s , t e s + + c n t s · p n , t t s + p s , t t s + + c n f c · P n , t f c + c s e · r n . t e · P n , t d e + c s h · r n . t h · H n , t d e + c s q · r n . t q · Q n , t d e + c s m · r n . t m · M n , t d e
P n , t e h = P n , t e l z + P n , t f c + p n , t e s + + ( 1 r n , t e ) P n , t d e P n , t g t p n , t e s H n , t e c + p n , t h s = p n , t h s + + H n , t m r + P n , t f c / η n f c + ( 1 r n , t h ) H n , t d e + H n , t h t M n , t e h + H n , t m r / L H V g = M n , t g t + 1 r n , t m M n , t d e M n , t g t = ( P n , t g t + Q n , t g t ) / ( η n g t · L H V g ) Q n , t g t + p n , t t s p n , t t s + + Q n , t r e c = ( 1 r n , t q ) Q n , t d e 0 r n , t · 1 ; · = e , h , q , m , n , t
R D n g t P n , t g t P n , t 1 g t R U n g t , P n , t g t , Q n , t g t Θ n g t , n , t
H n , t e c = A n · P n , t e l z + B n · τ n , t e c · δ n , t e l z Q n , t e c = C n · P n , t e l z + D n · τ n , t e c δ n , t e l z · P n e l z ̲ P n , t e l z δ n , t e l z · P n e l z ¯ P n , t e l z P n , t 1 e l z R U n e l z · δ n , t 1 e l z + S U n e l z · x n , t e l z , o n P n , t 1 e l z P n , t e l z R D n e l z · δ n , t e l z + S D n e l z · x n , t e l z , o f f τ n , t e c = τ n , t 1 e c + Δ t T C n e c · Q n , t e c ( τ n , t e c τ t A ) / T R n e c Q n , t r e c / η n r e c τ n , t e c ̲ ( 1 δ n , t e l z ) M τ n , t e c τ n , t e c ¯ + ( 1 δ n , t e l z ) M τ n , t A δ n , t e l z · M τ n , t e c τ n , t e c ¯ + δ n , t e l z · M ; n , t
R D n f c P n , t f c P n , t 1 f c R U n f c , P n f c ̲ P n , t f c P n f c ¯ , n , t
E n , t · E n , t 1 · = Δ t · p n , t · + · η n · + p n , t · / η n · E n · ̲ E n , t · E n · ¯ p n · + ̲ p n , t · + p n · + ¯ p n · ̲ p n , t · p n · ¯ ; · = h s , e s , t s , n , t
Equation (7) denotes the emergency scheduling cost of EH including operation and load shedding costs. Constraint (8) presents the balance equations with load shedding of power, hydrogen, natural gas, and heat in the EH. Constraint (9) denotes the feasible operational area and ramping limits for GT with the polygon set of feasible operational area [32]. The operation characteristics and limits for P2HH is denoted in (10), where A n , B n , C n , D n are coefficients of the linear operation region of P2HH [13]. The bilinear term τ n , t e c · δ n , t e l z can be linearized using BigM method [33]. The operating constraints for FC is shown in (11). Constraint (12) denotes the charging/discharging limits, and SOC operation range limits for ES, HS, and TS.

2.3.3. TNS Model

The TNS is described by the DC power flow model, which is widely used in researches of resilient power systems [8]. The emergency scheduling of TNS is composed of dispatching of CGs and power flow. The TNS model is given as
C t t n s , s 2 = c i c g , o p · P i , t c g + b c s e · r b e · P b , t d e
P i c g ̲ · δ i , t P i , t c g P i c g ¯ · δ i , t P i , t c g P i , t 1 c g R U i · δ i , t 1 + S U i · x i , t o n P i , t 1 c g P i , t c g R D i   ·   δ i , t + S D i  ·  x i , t o f f
i CG ( b ) P i , t c g b b L θ b , t θ b , t / X b b = P D b , t P D b , t = n EH ( b ) P n , t e h + 1 r b , t e P b , t d e 0 r b , t e 1 , θ ̲ θ b , t θ ¯ ; b , t
u b b , t L   ·   P b b ¯ θ b , t θ b , t / X b b u b b , t L · P b b ¯ , t , b b L
Equation (13) shows the total cost contains CG operation and load shedding cost for emergency scheduling in the second stage. The upper/lower outputs and ramping rates of CGs are limited in constraint (14). Constraint (15) denotes the power equilibrium at buses in TNS with load shedding and the limitation for phase angle of buses. The power flow range of the TL b b is given in (16), which is forced to be 0 when it outages due to disasters.

2.3.4. GNS Model

A linear transmission model adapted from [16] is used for GNS modeling. The GNS model is given as
C t g n s , s 2 = c g · M w , t + c s g s M s , t g s + + M s , t g s + g c s m · r g m · M g , t d e
p p e ( g ) M t e ( p ) p p s ( g ) M t s ( p ) = 1 r g , t m M g , t d e w M w , t + n EH ( g ) M n , t e h s M s , t g s M s , t g s +
0 r g , t m 1 , g , t
M ̲ · ( u p , t P 1 ) M t · M ¯ · ( 1 u p , t P ) , · = s ( p ) , e ( p ) , p , t
E s , t g s E s , t 1 g s = Δ t · M s , t g s + · η s g s + M s , t g s / η s g s M s g s · ̲ M s , t g s · M s g s · ¯ , · = + , E s , t g s ̲ E s , t g s E s , t g s ¯ ; s , t
M w ̲ M w , t M w ¯ , w , t
Equation (17) denotes the total cost including gas purchase from gas wells (GWs), gas storage (GS) scheduling, and gas load shedding. The balance constraints for nodes with load shedding in GNS are considered in (18) and (19). Constraint (20) denotes the limits of capacities for gas mass flow transmission leveraging the pipe damage. The operation constraints of GS and GW are shown in (21) and (22), respectively.

2.3.5. HT Model

The consumers in the HIES will suffer a long energy shortage from outage of TLs and pipes by natural disasters. The HT fleets with large storage capacity are requisitioned and scheduled to transport the hydrogen from the energy-surplus EHs to the energy-deficient ones for emergency scheduling, where hydrogen can be converted to other forms of energy. The popular time–space network model for MER routing in [34] is difficult for modeling the HT scheduling with uncertainties of road impacts in the second stage because the number of constraints is related to the travel time. Therefore, a novel HT scheduling model leveraging the impacts of natural disasters on roads is proposed, inspired from [35]. The cost of HT scheduling is given in (23), in which the first and the second term are transport cost and charging/releasing cost, respectively. In this paper, the travel time between any two spots in RN for an HT fleet T f , r is a symmetric matrix. The diagonal elements of the matrix are 0, and the travel time for any two spots without road connection is set to a large number (e.g., slightly larger than T). When the road is damaged, the travel time will be changed. The fleet location state a f , m , t and traveling state b f , m , t are constrained in (24)–(27), in which the travel time for the damaged roads is assumed to be multiplied by a coefficient κ in (26). Due to space constraints, details of these constraints can be found in [36]. Constraint (28) denotes the charging/releasing limits and stage of charge (SOC) operation range for the fleets, which can be charged or released only when parking at the EHs.
C t h t = f m c f t r a · b f , m . t + c f h t , o p H f , m , t h t + + H f , m , t h t
m a f , m , t + m b f , m , t = 1 , f , t [ 0 , T ]
a f , m , t + 1 a f , m , t + 1.2 b f , m , t b f , m , t + 1 + 0.4 m b f , m , t m b f , m , t + 1 0.8 a f , m , t + 1 a f , m , t + b f , m , t b f , m , t + 1 0.5 m b f , m , t m b f , m , t + 1 + 0.7 ; h , t [ 0 , T 1 ]
F f , t a f , m , t 1 m m R T f , m m m m R T f , m m + m m R b f , m , t T f , m m , f , m , t T f , r = u r , t R T f , r 0 + κ · 1 u r , t R · T f , r 0 , f , r , t R f , t = R f , t 1 + F f , t m b f , m , t 1 R f , t / M m b f , m , t R f , t , f , t [ 0 , T ] F f , t 0 , f , m m R , t [ 1 , T ] F f , 0 = 0 , R f , 0 = 0
ω f , t n b f , m , t 1 + m b f , m , t 2 + ε 1 ω f , t b f , m , t b f , m , t 1 1 ω f , t ω f , 0 = 0 ; f , t [ 1 , T ]
E f , t h t E f , t 1 h t = Δ t · m H f , m , t h t + · η f h t + H f , m , t h t / η f h t a f , m , t · H f h t · ̲ H f , n , t h t · a f , m , t · H f h t · ¯ E f h t ̲ E f , t h t E f h t ¯ H n , t h t = f H f , n , t h t + H f , n , t h t ; · = + , , f , n EH ( m ) , t

2.4. Compact Formulation

The compact form of the proposed ARO-based preventive scheduling model consisting of (2)–(28) is presented by
min x a x + max u U min ( y , z ) Ψ x , u b y + c z s . t . A x d , x { 0 , 1 } Ψ x , u = C x + D y + E z + F u h , z { 0 , 1 }
where x , z are binary variable vectors in the first stage and second stage model, respectively. y is the continuous variable vector in second stage model. Ψ x , u is the constraint in the second stage defined in (5). a , A , d are constant coefficient matrices in the first stage. b , c , h , C , D , E , F are constant coefficient matrices derived from the second stage model.

3. Solution Methodology

In general, several decomposition methods are available to solve the ARO model with integer variables in the inner layer, such as the nested C&CG algorithm [37]. However, the nested C&CG algorithm would not solve the proposed model directly. The reasons are listed as follows: Firstly, the lower-level problem contains a large number of integer variables, which reduces the efficiency of inner iteration based on enumeration. Secondly, by creating new variables in each iteration, the upper-level problem is solved to obtain the solutions feasible for any scenario appended from the lower-level problem. When the scale of the system becomes larger, the computing performance will decrease. Therefore, an ATC-C&CG-AOP algorithm is proposed for solving the preventive scheduling model to find a near-optimal solution. In this section, the C&CG-AOP algorithm [38] is first introduced to enhance computational efficiency for the lower-level problem. The ATC algorithm [39] combined with the AOP procedure is adopted for the computational performance improving for the upper-level problem in a distributed manner.

3.1. C&CG-AOP Algorithm

The C&CG–AOP algorithm presented in Algorithm 1 is an iterative approach built upon the C&CG framework [40]. Its main distinction lies in the solution of the lower-level problem, where heuristic alternating optimization is applied to handle the binary and continuous variables without generating primal cuts. The two-stage preventive scheduling model in (29) is decomposed into an upper-level master problem (MP) and a lower-level sub-problem (SP). The SP further consists of a sub-slave problem (SSP) and a sub-master problem (SMP), as specified in (30)–(32). The superscript ‘ · ’ denotes optimal values. The vector λ represents the dual variables associated with the second-stage constraints, ϵ denotes the relative error threshold, and i is the counter for the outer loop. The indices k and l correspond to the outer and inner iterations, respectively. The bilinear term λ l u is linearized using the Big-M method [33]. The convergence of the C&CG–AOP algorithm has been proven in [38].
Algorithm 1 C&CG-AOP algorithm.
Initialization: 
L B = ; U B = ; k = 0 ; a feasible solution x k for MP.
  1:
 while  | ( U B L B ) / U B | ϵ   do
  2:
  Set l = 0
  3:
  Relax z as continuous, solve the lower-level maximum problem, obtain a initial disaster scenario u 0 .
  4:
  while  u l u l 1  do
  5:
     Solve SSP ( x k , u l ) (31). Obtain y l + 1 , z l + 1 .
  6:
     Set l = l + 1 .
  7:
     Solve SMP ( x k , z l ) (32). Obtain u l , θ l .
  8:
  end while
  9:
  Set U B = a x k + θ l .
10:
  Submit u l as u k + 1 . Solve MP ( u k + 1 ) (30). Obtain x k + 1 , η k + 1 .
11:
  Set L B = a x k + 1 + η k + 1 .
12:
  Set k = k + 1 .
13:
 end whilereturn  x k , u k , y l , z l
MP : min x , η a x + η     s . t .   A x d     η 0 , η b y k + c z k , 1 k i     C x + D y k + E z k + F u k h , 1 k i
SSP : min y , z b y + c z     s . t .   C x + D y + E z + F u l + 1 h   z { 0 , 1 }
SMP : max u , θ θ     s . t .   u U     θ λ l h C x E z l F u + c z l     D λ l = b , λ l 0
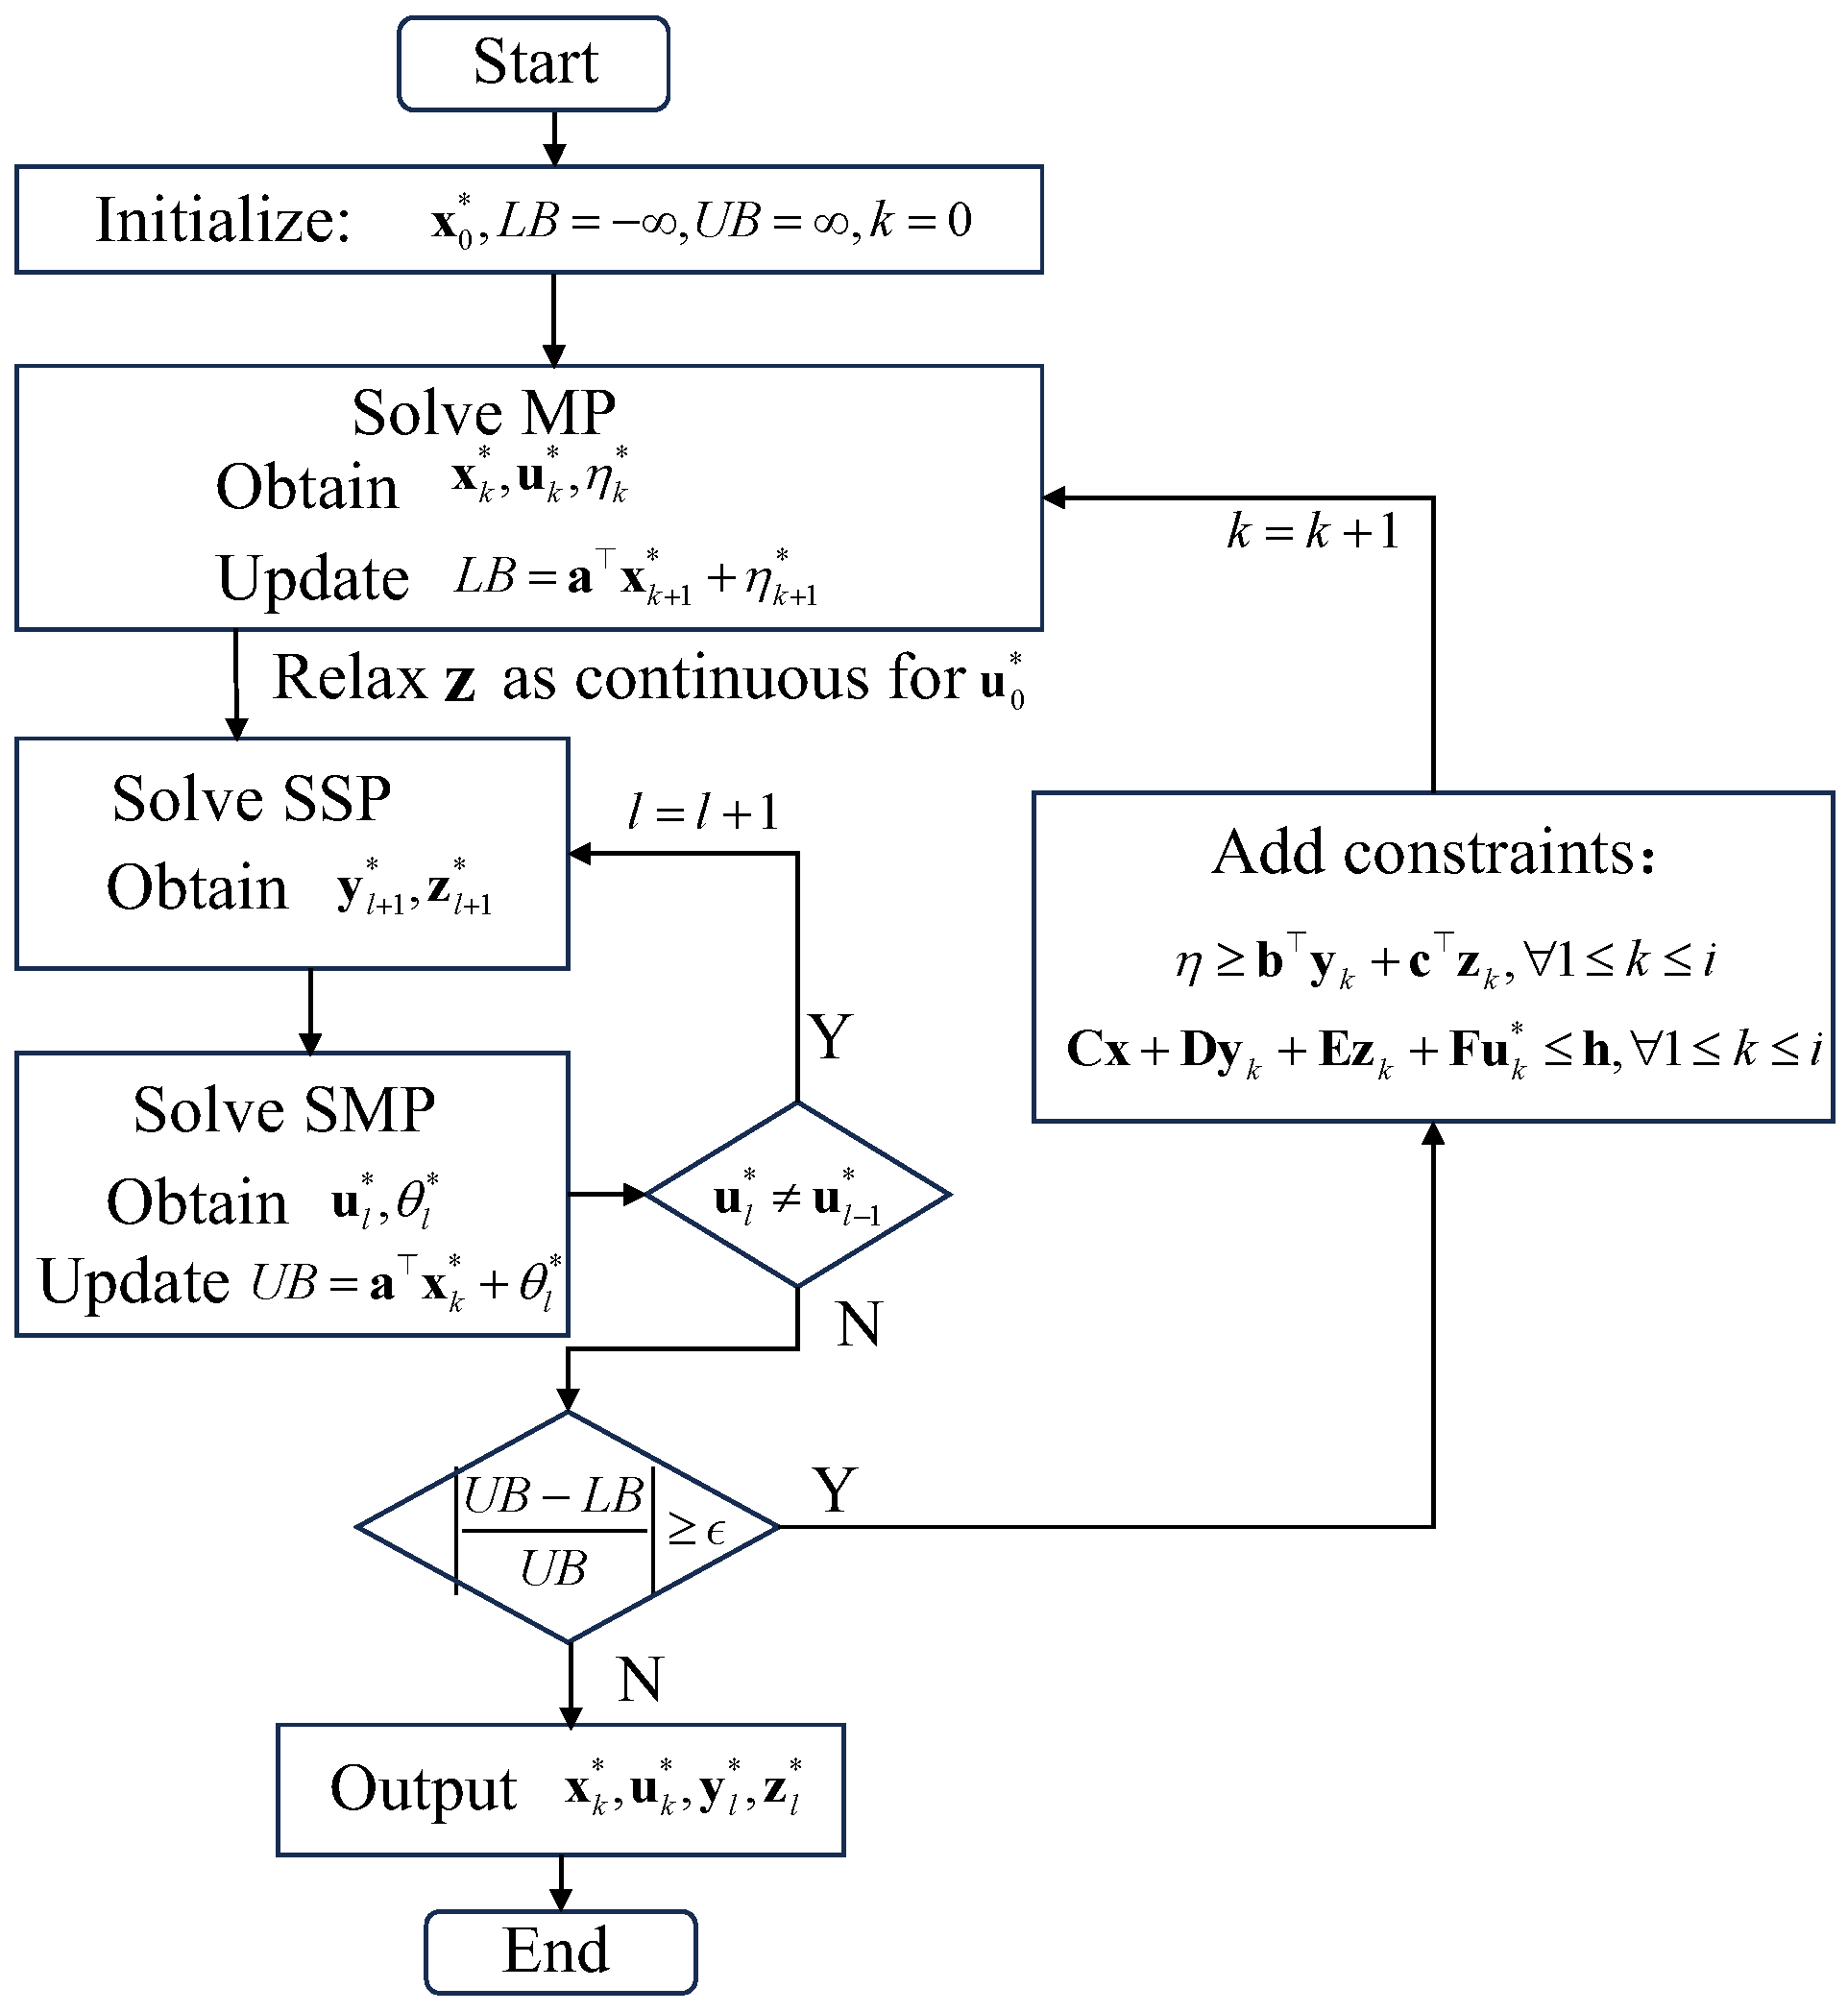
Algorithm 1 can be further summarized in the flowchart shown in Figure 2. After initialization, the MP and the sub-problem, which consists of the SSP and the SMP, are solved alternately to compute the upper and lower bounds. The convergence criterion of Algorithm 1 is based on the relative error between the upper and lower bounds, as defined in the first step of the algorithm, where ϵ denotes the relative error threshold. If the convergence condition is not satisfied, the cuts generated from the last two constraints in (30) are added to the MP, and the procedure repeats until convergence. It is worth noting that in the SP, the SSP and SMP are solved iteratively through the AOP scheme, and their convergence is determined by the condition that the uncertain variables no longer change.

3.2. Solving MP by ATC-AOP Algorithm

An ATC algorithm based on augmented Lagrangian relaxation is adopted to improve the computational performance for MP solving in step 8 of Algorithm 1. The MP (30) is decomposed into the HIES scheduling sub-problem (IES-MP) and HT scheduling sub-problems (HT-MPs) for each HT fleet in each iteration. The charging/releasing hydrogen of the fleets (i.e., y h t in (4)) are set as the coupling variables. The decomposed IES-MP and HT-MPs are formulated as
HT MP : min η f h t   η f h t s . t .   η f h t 0 η f h t c f , 2 z f , k + f c f h t ( y ¯ f , k h t y f , k h t ) + β f h t ( y ¯ f , k h t y f , k h t ) 2 2 D f , 2 y f , k h t + E f , 2 z f , k + F 2 u k h t h f , 2 z f , k { 0 , 1 } ; 1 k i
IES MP : min x , η i e s   a x + η i e s s . t .   A x d , η i e s 0 η i e s b 1 y k i e s + f α f i e s ( y ¯ f , k h t y ^ f , k h t ) + β f i e s ( y ¯ f , k h t y ^ f , k h t ) 2 2 C 1 x + D 1 y k i e s + F 1 u k i e s h 1 ; 1 k i
where the symbol ⊙ denotes the Hadamard product. The constant coefficient matrices in (29) are adjusted to the appropriate dimension with the subscript 1 , 2 for IES-MP and HT-MPs, respectively. α f i e s , α f h t denote the linear penalty multipliers in IES-MP and HT-MPs, respectively. β f i e s , β f h t denote the second-order penalty multipliers in IES-MP and HT-MPs, respectively. y ^ f , k h t and y f , k h t denote the coupling variable in IES-MP and HT-MP, respectively. u k i e s and u k h t defined in (4) represent the worst scenario of facility damage in k t h iteration. y ¯ f , k h t is the consensus vector for defining the feasible search direction defined in step 2 of Algorithm 2.
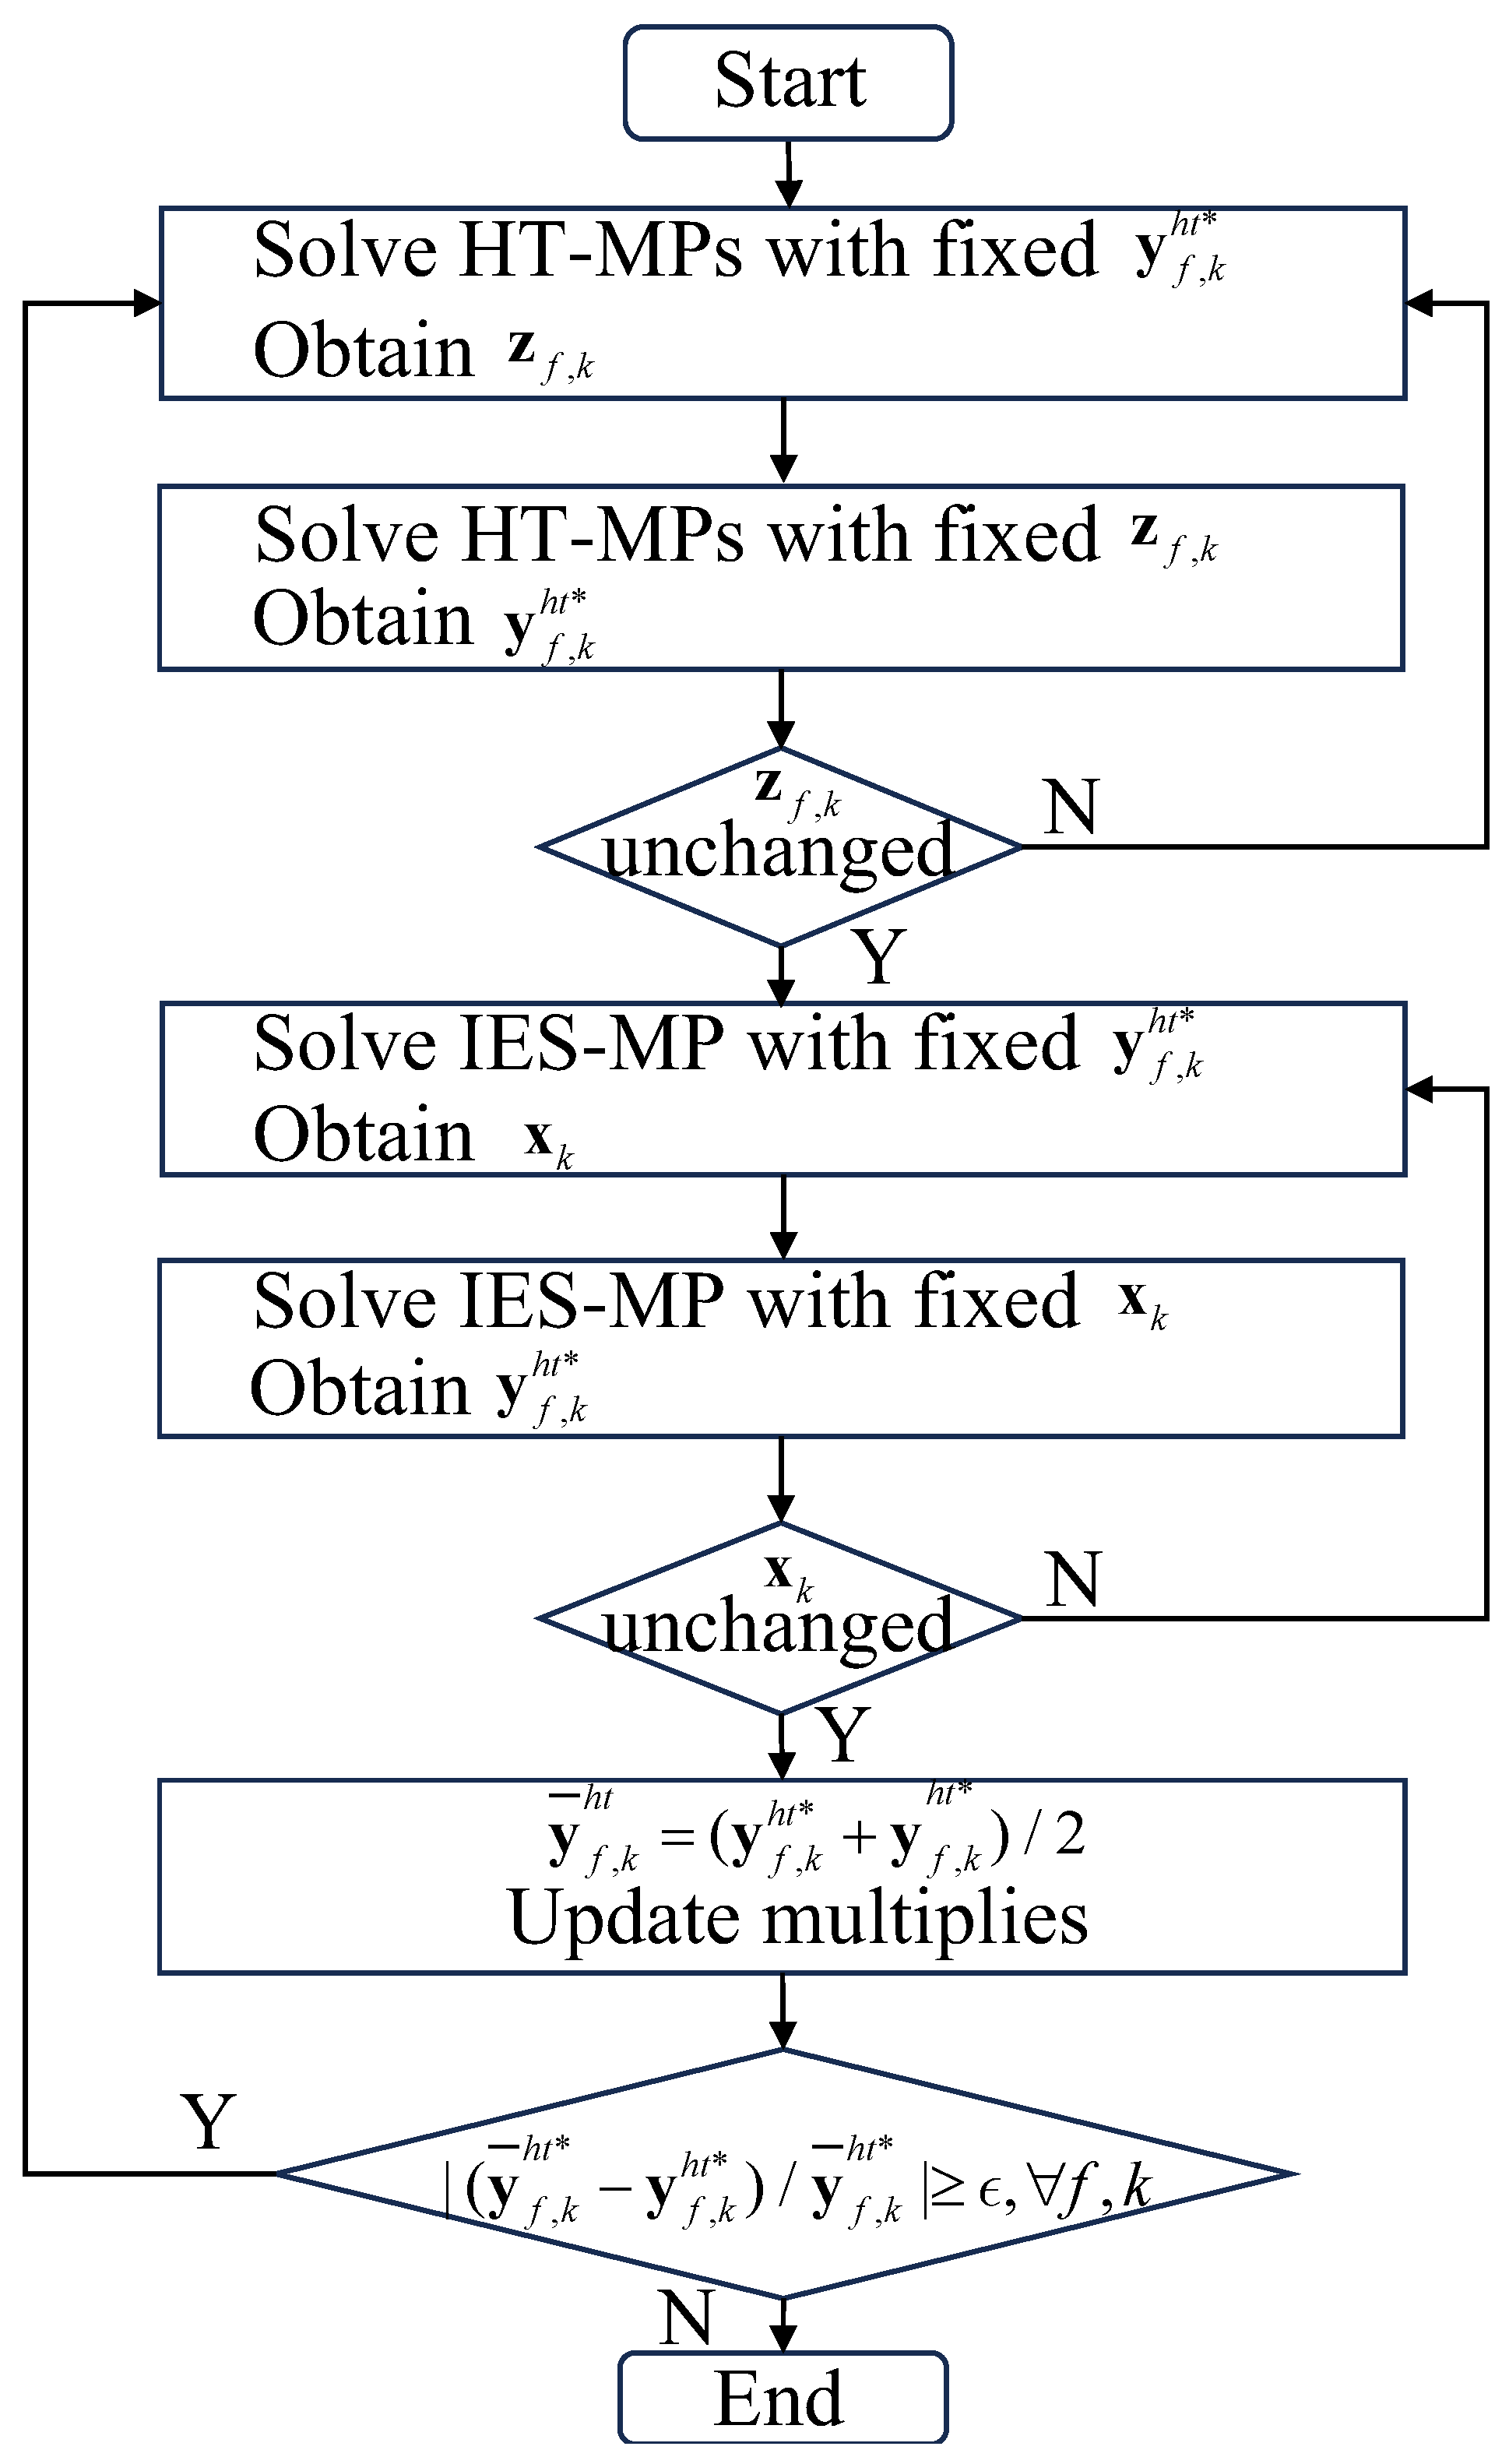
The convergence of a standard ATC algorithm is only guaranteed to create convex problems [39]. Therefore, the AOP procedure is introduced by alternately optimizing the coupling variables and integer variables in each sub-problems to obtain a high-quality solution. The details of the ATC-AOP algorithm including the iterative process and multiplier update process are presented in Algorithm 2, where j , ϵ , γ are respectively the index for iteration, relative error threshold, and updating step. For clarity, the corresponding flowchart is provided in Figure 3. The convergence criterion of Algorithm 2 is satisfied when the integer variables remain unchanged over two consecutive iterations. Once the convergence condition is met, the MP is solved, and the remaining steps of Algorithm 1 are subsequently executed.
Remark 1.
Although the MER routing model adopted in this paper showed advantages in model size and computational efficiency in [36], as the scale of the fleets increases, the SSP may become intractable by commercial solvers. Some relaxation methods, including the proposed ATC-AOP algorithm, can be used to obtain an approximate optimal solution.
Algorithm 2 ATC-AOP algorithm for MP.
Initialization: 
Relax x as continuous, and solve MP and obtain initial solution of coupling variables y f , k h t , y ^ f , k h t . Initialize a proper y ¯ f , k h t for the first iteration.
  1:
while  | ( y ¯ f , k h t y f , k h t ) / y ¯ f , k h t | ϵ , f , k   do
  2:
   Solve HT-MPs (33) in parallel with fixed y f , k h t and z f , k alternately until z f , k is the same as the last value, obtain y f , k h t , η i e s .
  3:
   Solve IES-MP (34) with fixed y f , k h t and x k alternately until x k is the same as the last value, obtain x k , y ^ f , k h t , η f h t .
  4:
   Update y ¯ f , k h t ( y f , k h t + y ^ f , k h t ) / 2 .
  5:
   Update the multiples as
  6:
  α f i e s α f i e s + 2 ( β f i e s ) 2 · ( y ¯ f , k h t y ^ f , k h t )
  7:
  α f h t α f h t + 2 ( β f h t ) 2 · ( y ¯ f , k h t y f , k h t )
  8:
  β f i e s γ · α f i e s , β f h t γ · α f h t
  9:
 end while
10:
 Set η k = η i e s + f η f h t  return  x k , u k , η k

4. Case Studies

The effectiveness of the proposed preventive schemes is validated on a modified 6-bus, 6-node, 6-spot system and a modified New-England 39-bus system with a Belgian 20-node gas system [41] and a 12-spot transportation system. The models are programmed in Matlab 2020a and solved by GUROBI [42] version 9.5 on a workstation with Intel I7 3.7 GHz CPU and 16 GB RAM. For the solver settings, the MIP gap is set at 0.1%. The relative error threshold ϵ is set to 1% for both MP and SPs. The proposed algorithm is a deterministic mathematical optimization process that employs the Branch-and-Bound method to solve mixed-integer linear programming problems. Therefore, it does not involve any stochastic factors and does not require setting a random seed. The number of runs is determined by the number of iterations required for convergence. The time horizon T is 24 h. For the sake of the safety of hydrogen transportation, the impacted roads are assumed to be completely interrupted. Therefore the time coefficient κ is set to T. The HT fleets are assumed to share the same travel time for a road in the RN for simplifying matters. The travel time of each road is 1h. The load shedding cost for electric power, heat, and hydrogen is 1000 $/MWh( MW t h ) and is set to 10 $/ Sm 3 for gas load curtailment. The transportation cost is 100 $/h according to [17]. The capacity of each fleet is 100 MW t h . The detailed case study data and corresponding scripts can be download in the Supplementary Materials with this paper, and will be made available online [43].

4.1. Test 1: 6-Bus, 6-Node, 6-Spot System

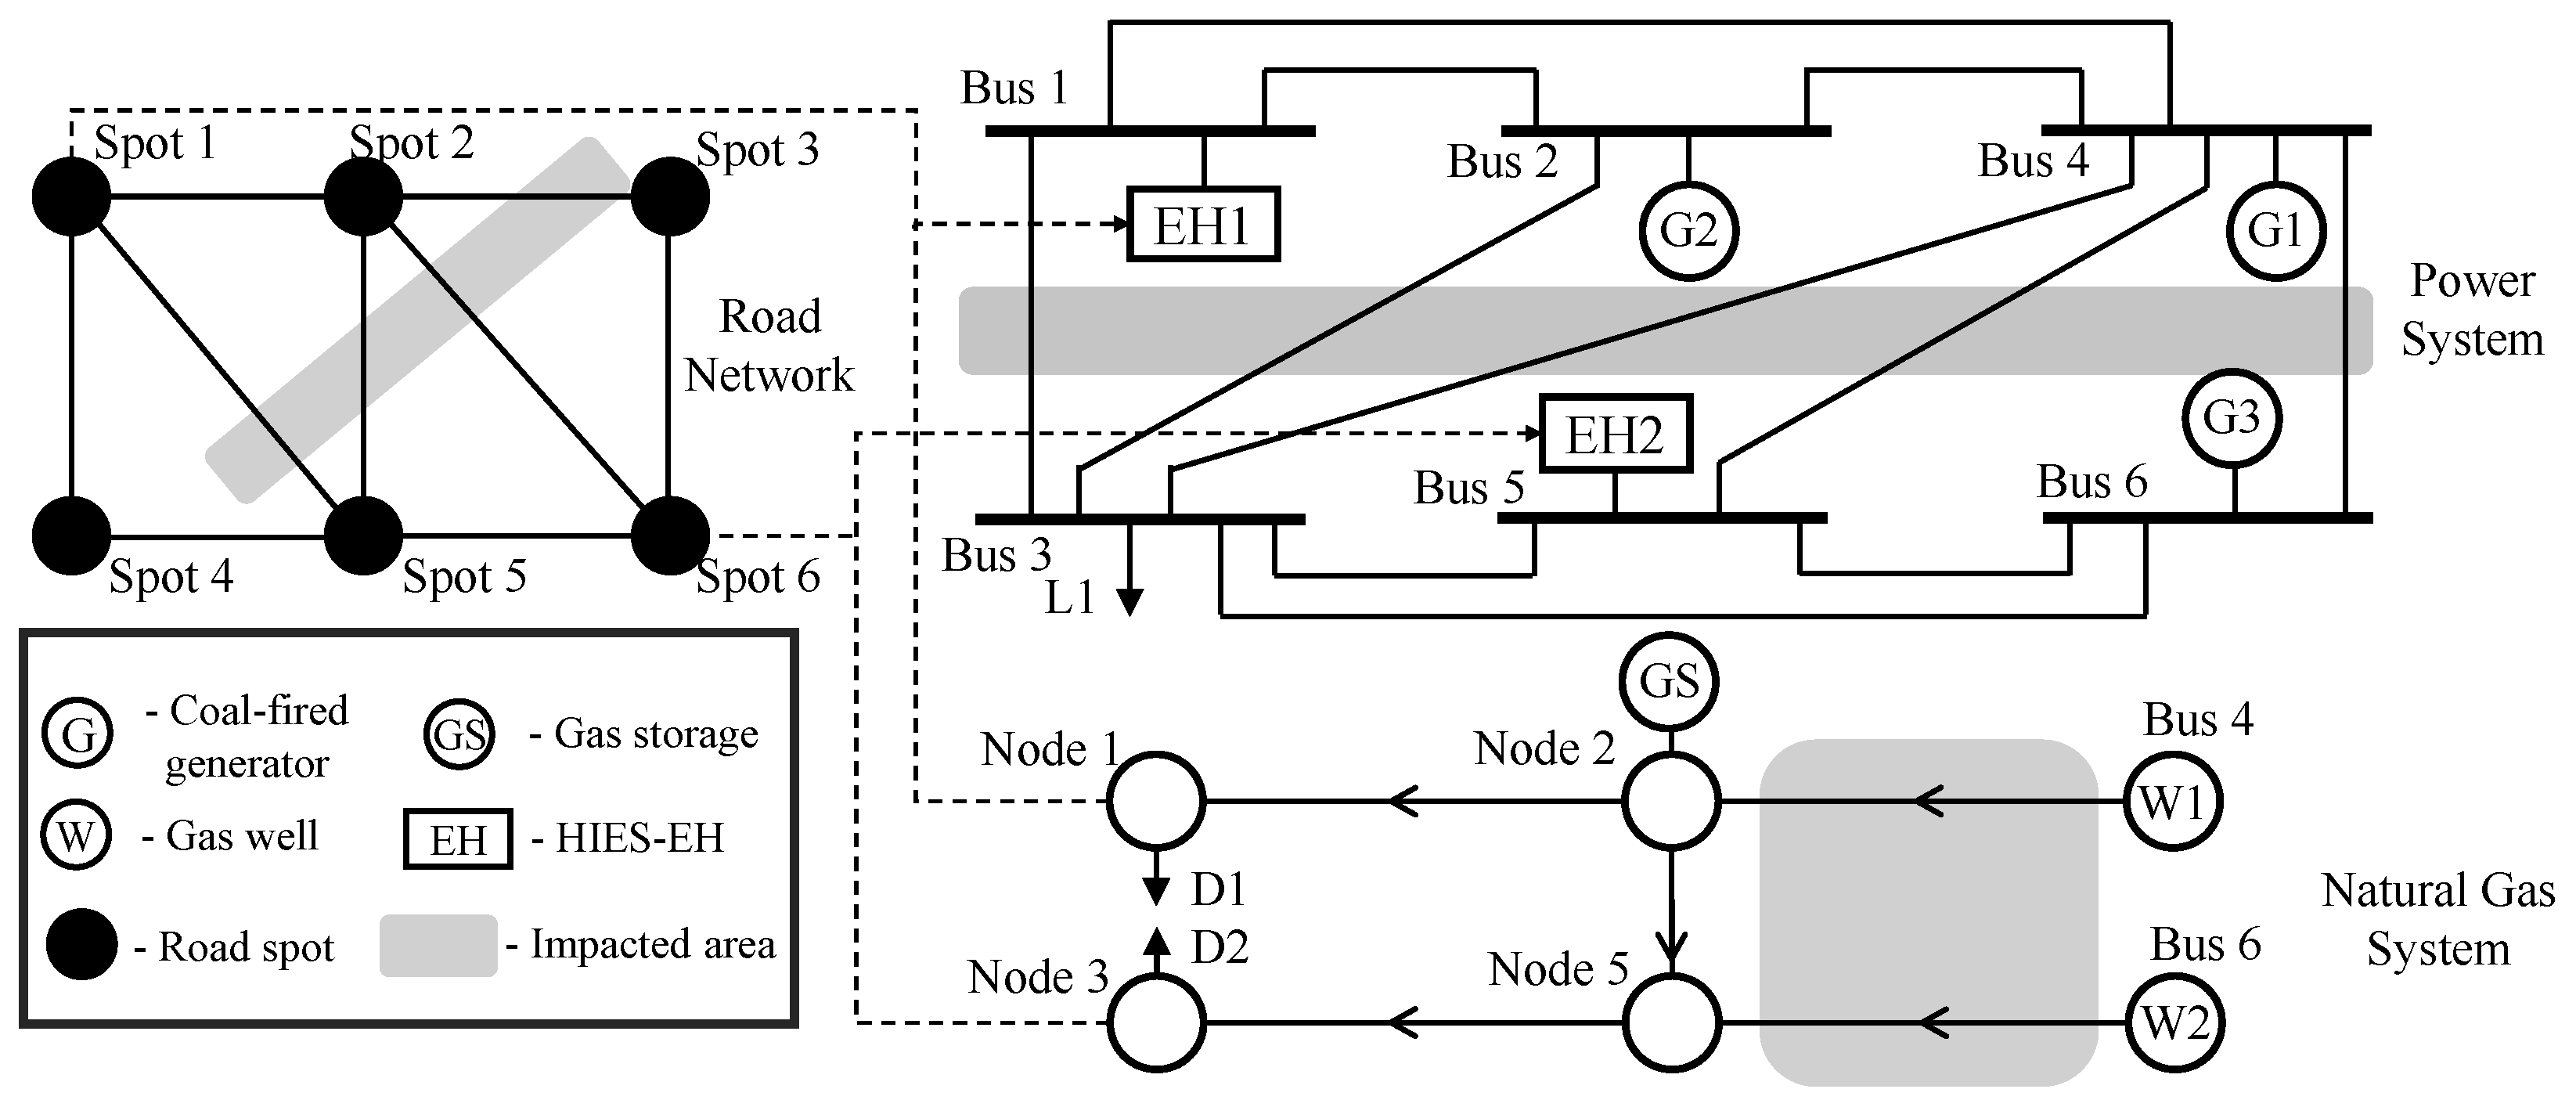
The 6-bus, 6-node, 6-spot system modified from [44] is shown in Figure 4, where the shaded areas represent the impacted regions. The test system includes three GTs, two EHs, two GWs, and one GS. The two EHs, which serve as the coupling points between the TNS and GNS, are located at spots 1 and 6 in the RN. Note that the detailed structure of each EH is provided in Figure 1. Within an EH, hydrogen is produced by the ELZs or discharged from the HS, and can be transported among EHs via HT through the road network. Two HT fleets are pre-deployed at spots 1 and 6, respectively, and initially carry no stored hydrogen.
To illustrate the rationality and effectiveness of the proposed preventive schemes, we investigate a deterministic facility damage scenario under an extreme condition as following settings: TL 1-3, 2-3, 4-3, 4-5, and 4-6 are outage one by one every 1 h from 2:00; pipe 4-2 is interrupted at 2:00; roads 2-3, 2-6, 2-5, and 1-3 are interrupted one by one every 1 h from 2:00.
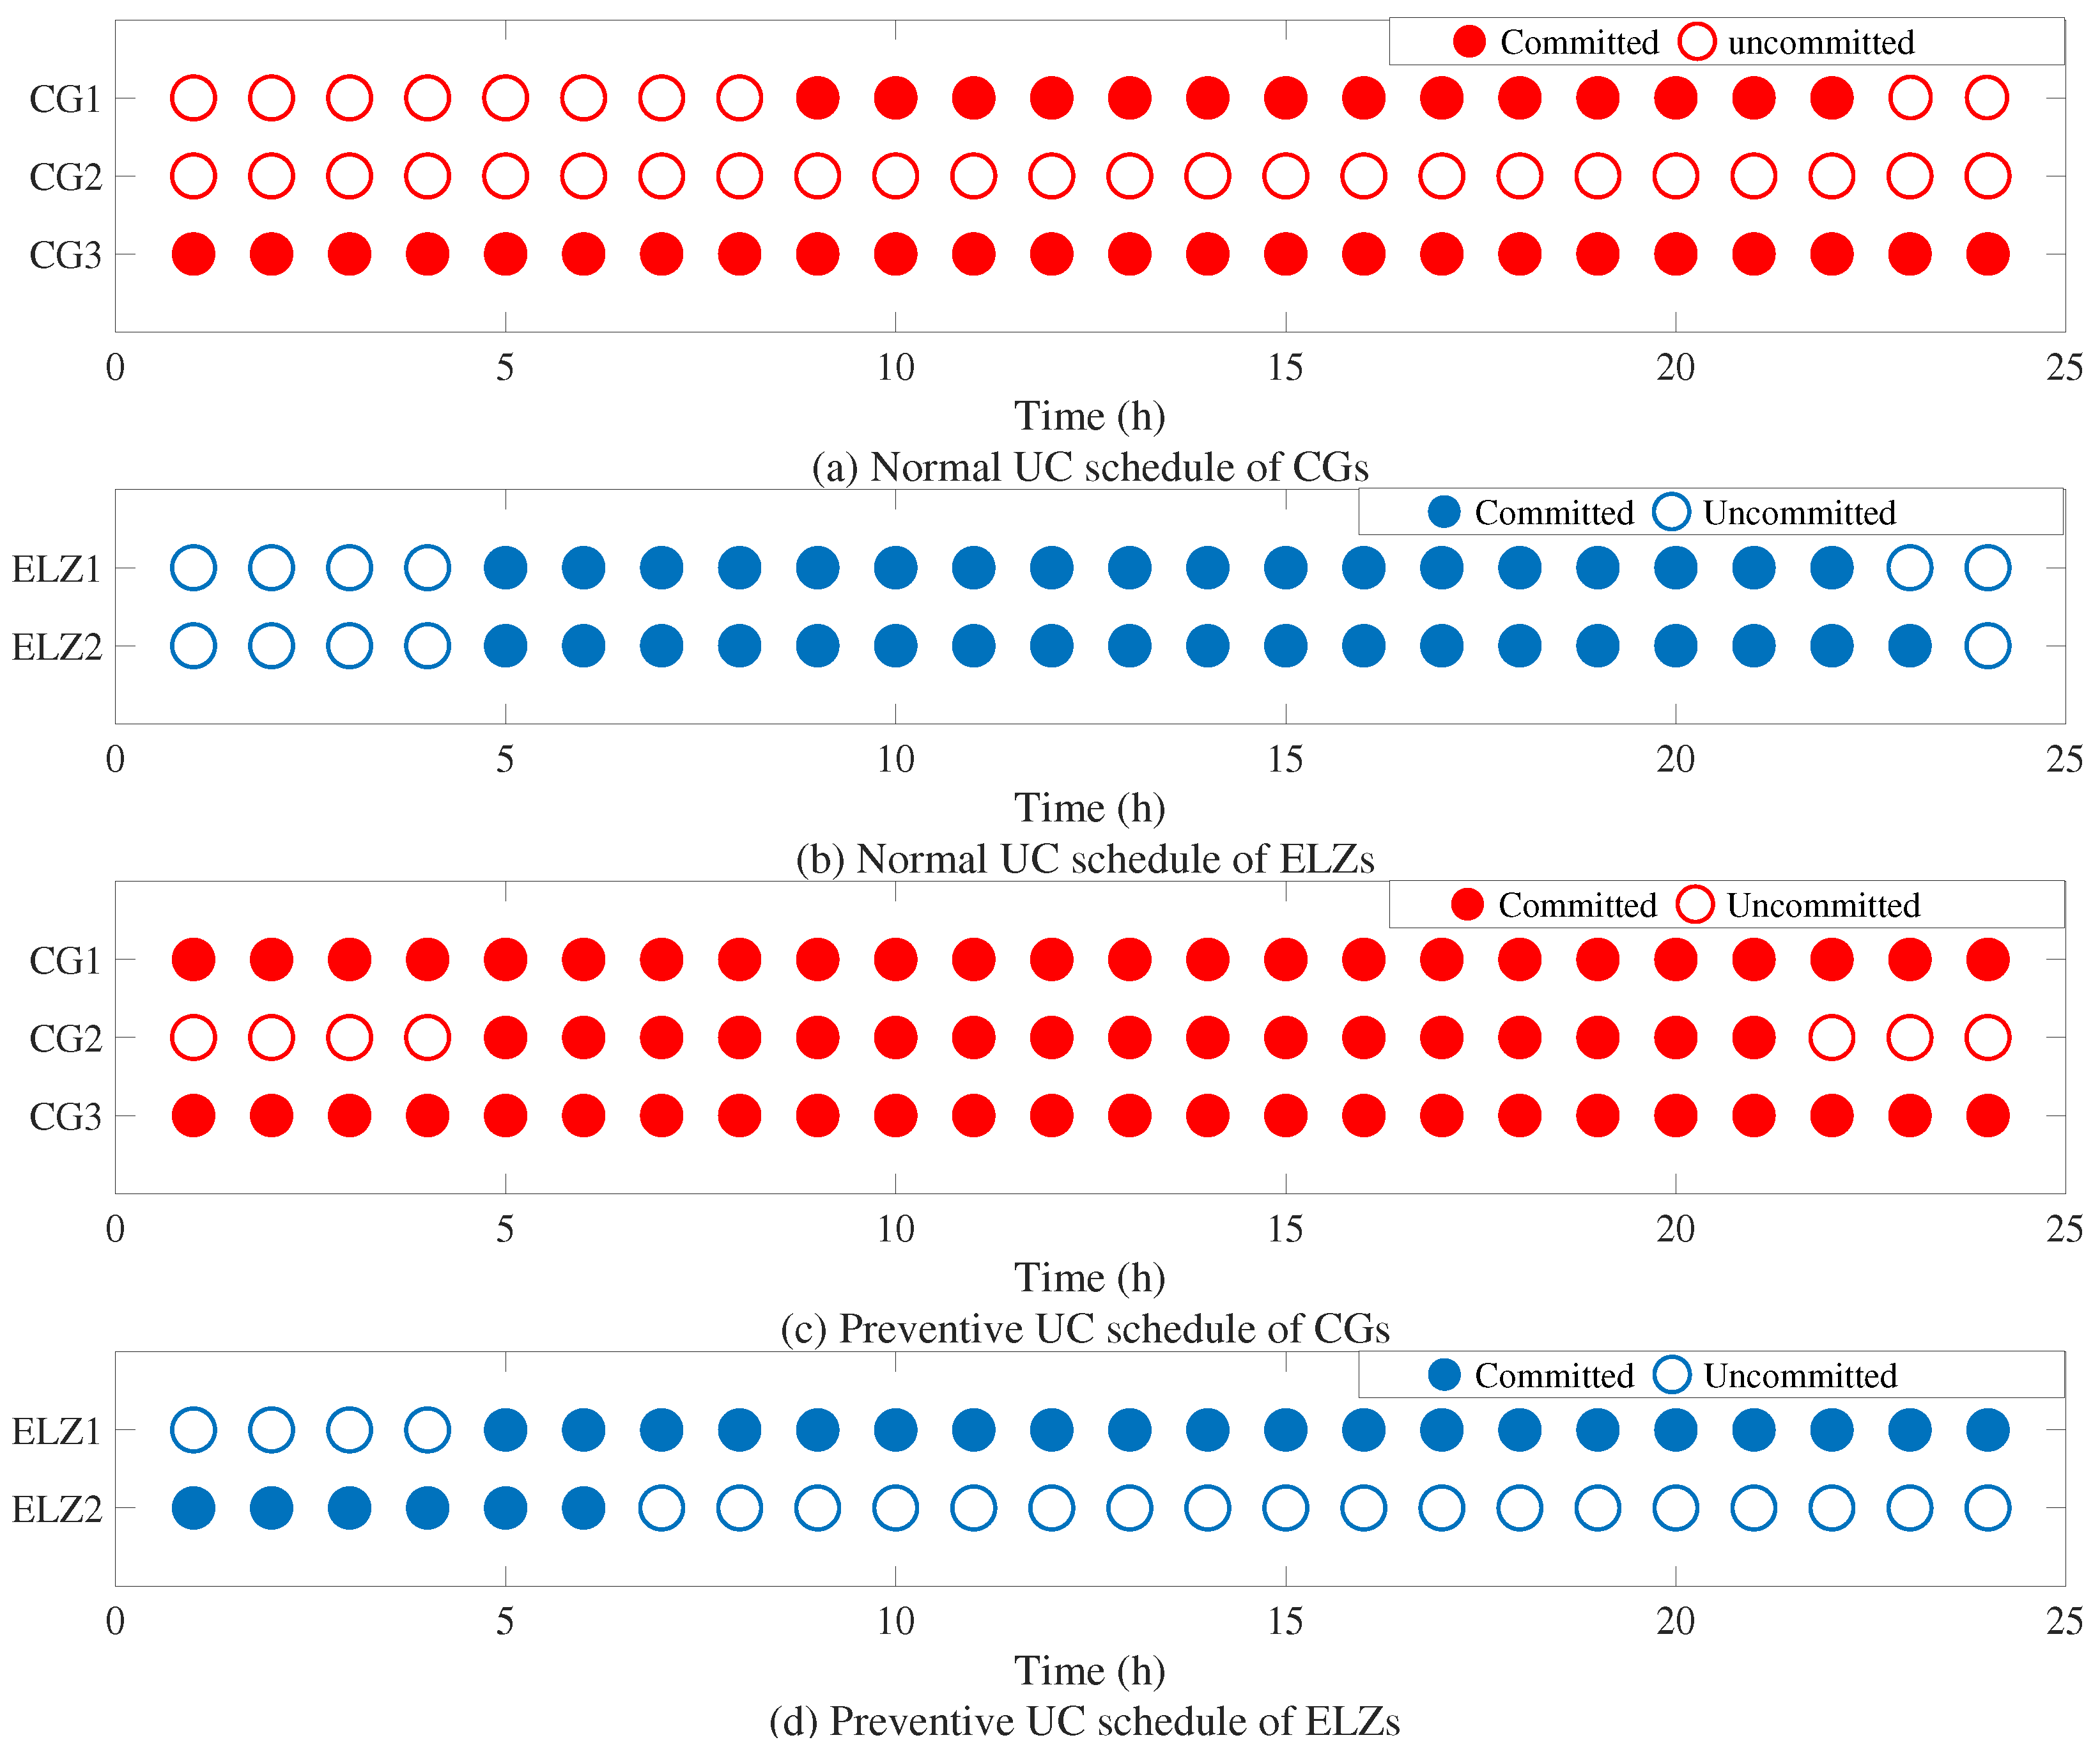
Figure 5 presents the UC schedules of the CGs and ELZs. Specifically, Figure 5a,b show the normal UC schedules without considering facility damages, while Figure 5c,d display the UC schedules obtained under the proposed preventive scheduling approach, which accounts for potential facility damages. In the figures, a filled circle indicates that the corresponding unit is committed, whereas a hollow circle denotes that the unit is offline. It can be observed that CG1 and CG3 are committed in all cases, whereas CG2 remains offline. This is because CG2 has a higher generation cost and is dispatched only when additional hydrogen production is required for HT in the emergency stage. In addition, ELZ2 operates from 1:00 to 6:00 because the outage of line 4-6 splits the TNS into two islanded areas, and the area containing ELZ2 experiences a power shortage as the generation capacity of CG3 is insufficient to meet the local demand. These results demonstrate that the preventive scheduling approach yields a reasonable UC pattern by proactively allocating flexible resources to mitigate islanding-induced shortages.
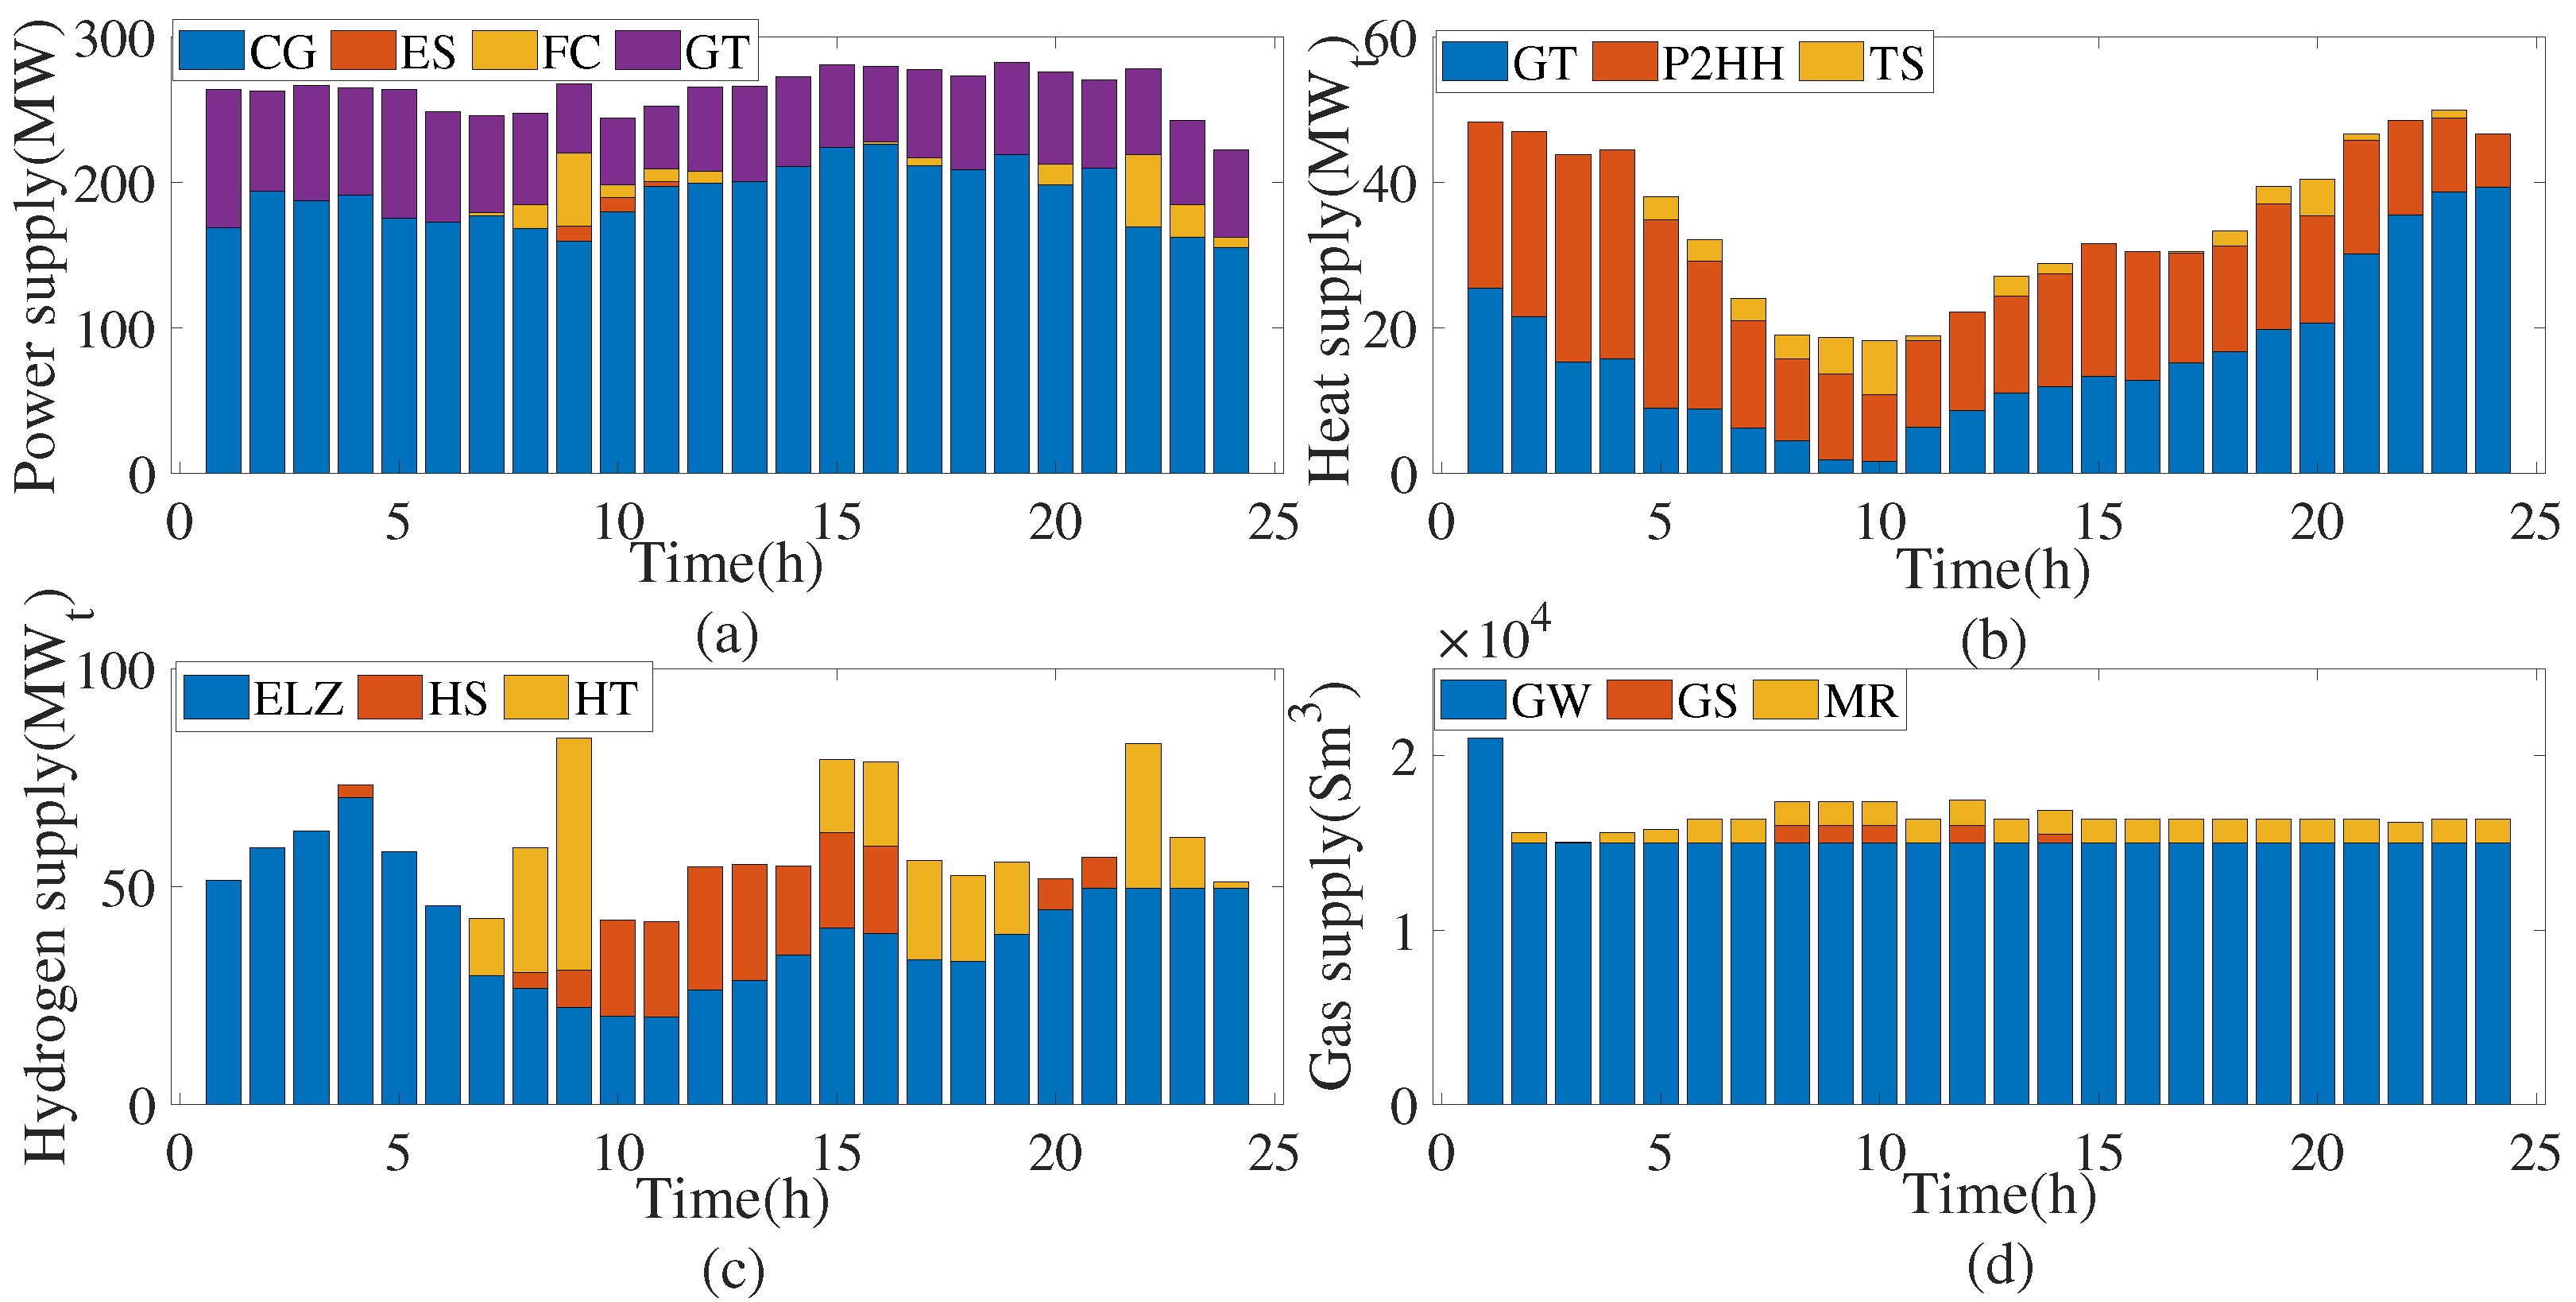
Figure 6 presents the schedules of electric power, heat, hydrogen, and natural gas supplies. As shown in Figure 6a,c, hydrogen is transported to EH2 via HT and then converted into electricity through the FC. From Figure 6b, approximately half of the heat demand is supplied by the ELZs through P2HH scheduling, which preserves additional natural gas for GT power generation and residential gas demand under conditions of limited gas availability. In Figure 6d, natural gas is primarily supplied by the GW due to the capacity limits of the pipelines and the GS. Only a portion of the hydrogen is converted to natural gas for overall cost considerations. These results indicate that the system relies heavily on P2HH to alleviate natural gas shortages and on HT-to-FC conversion to support the islanded area, demonstrating the cross-energy sensitivities that highlight the need for coordinated preventive scheduling.
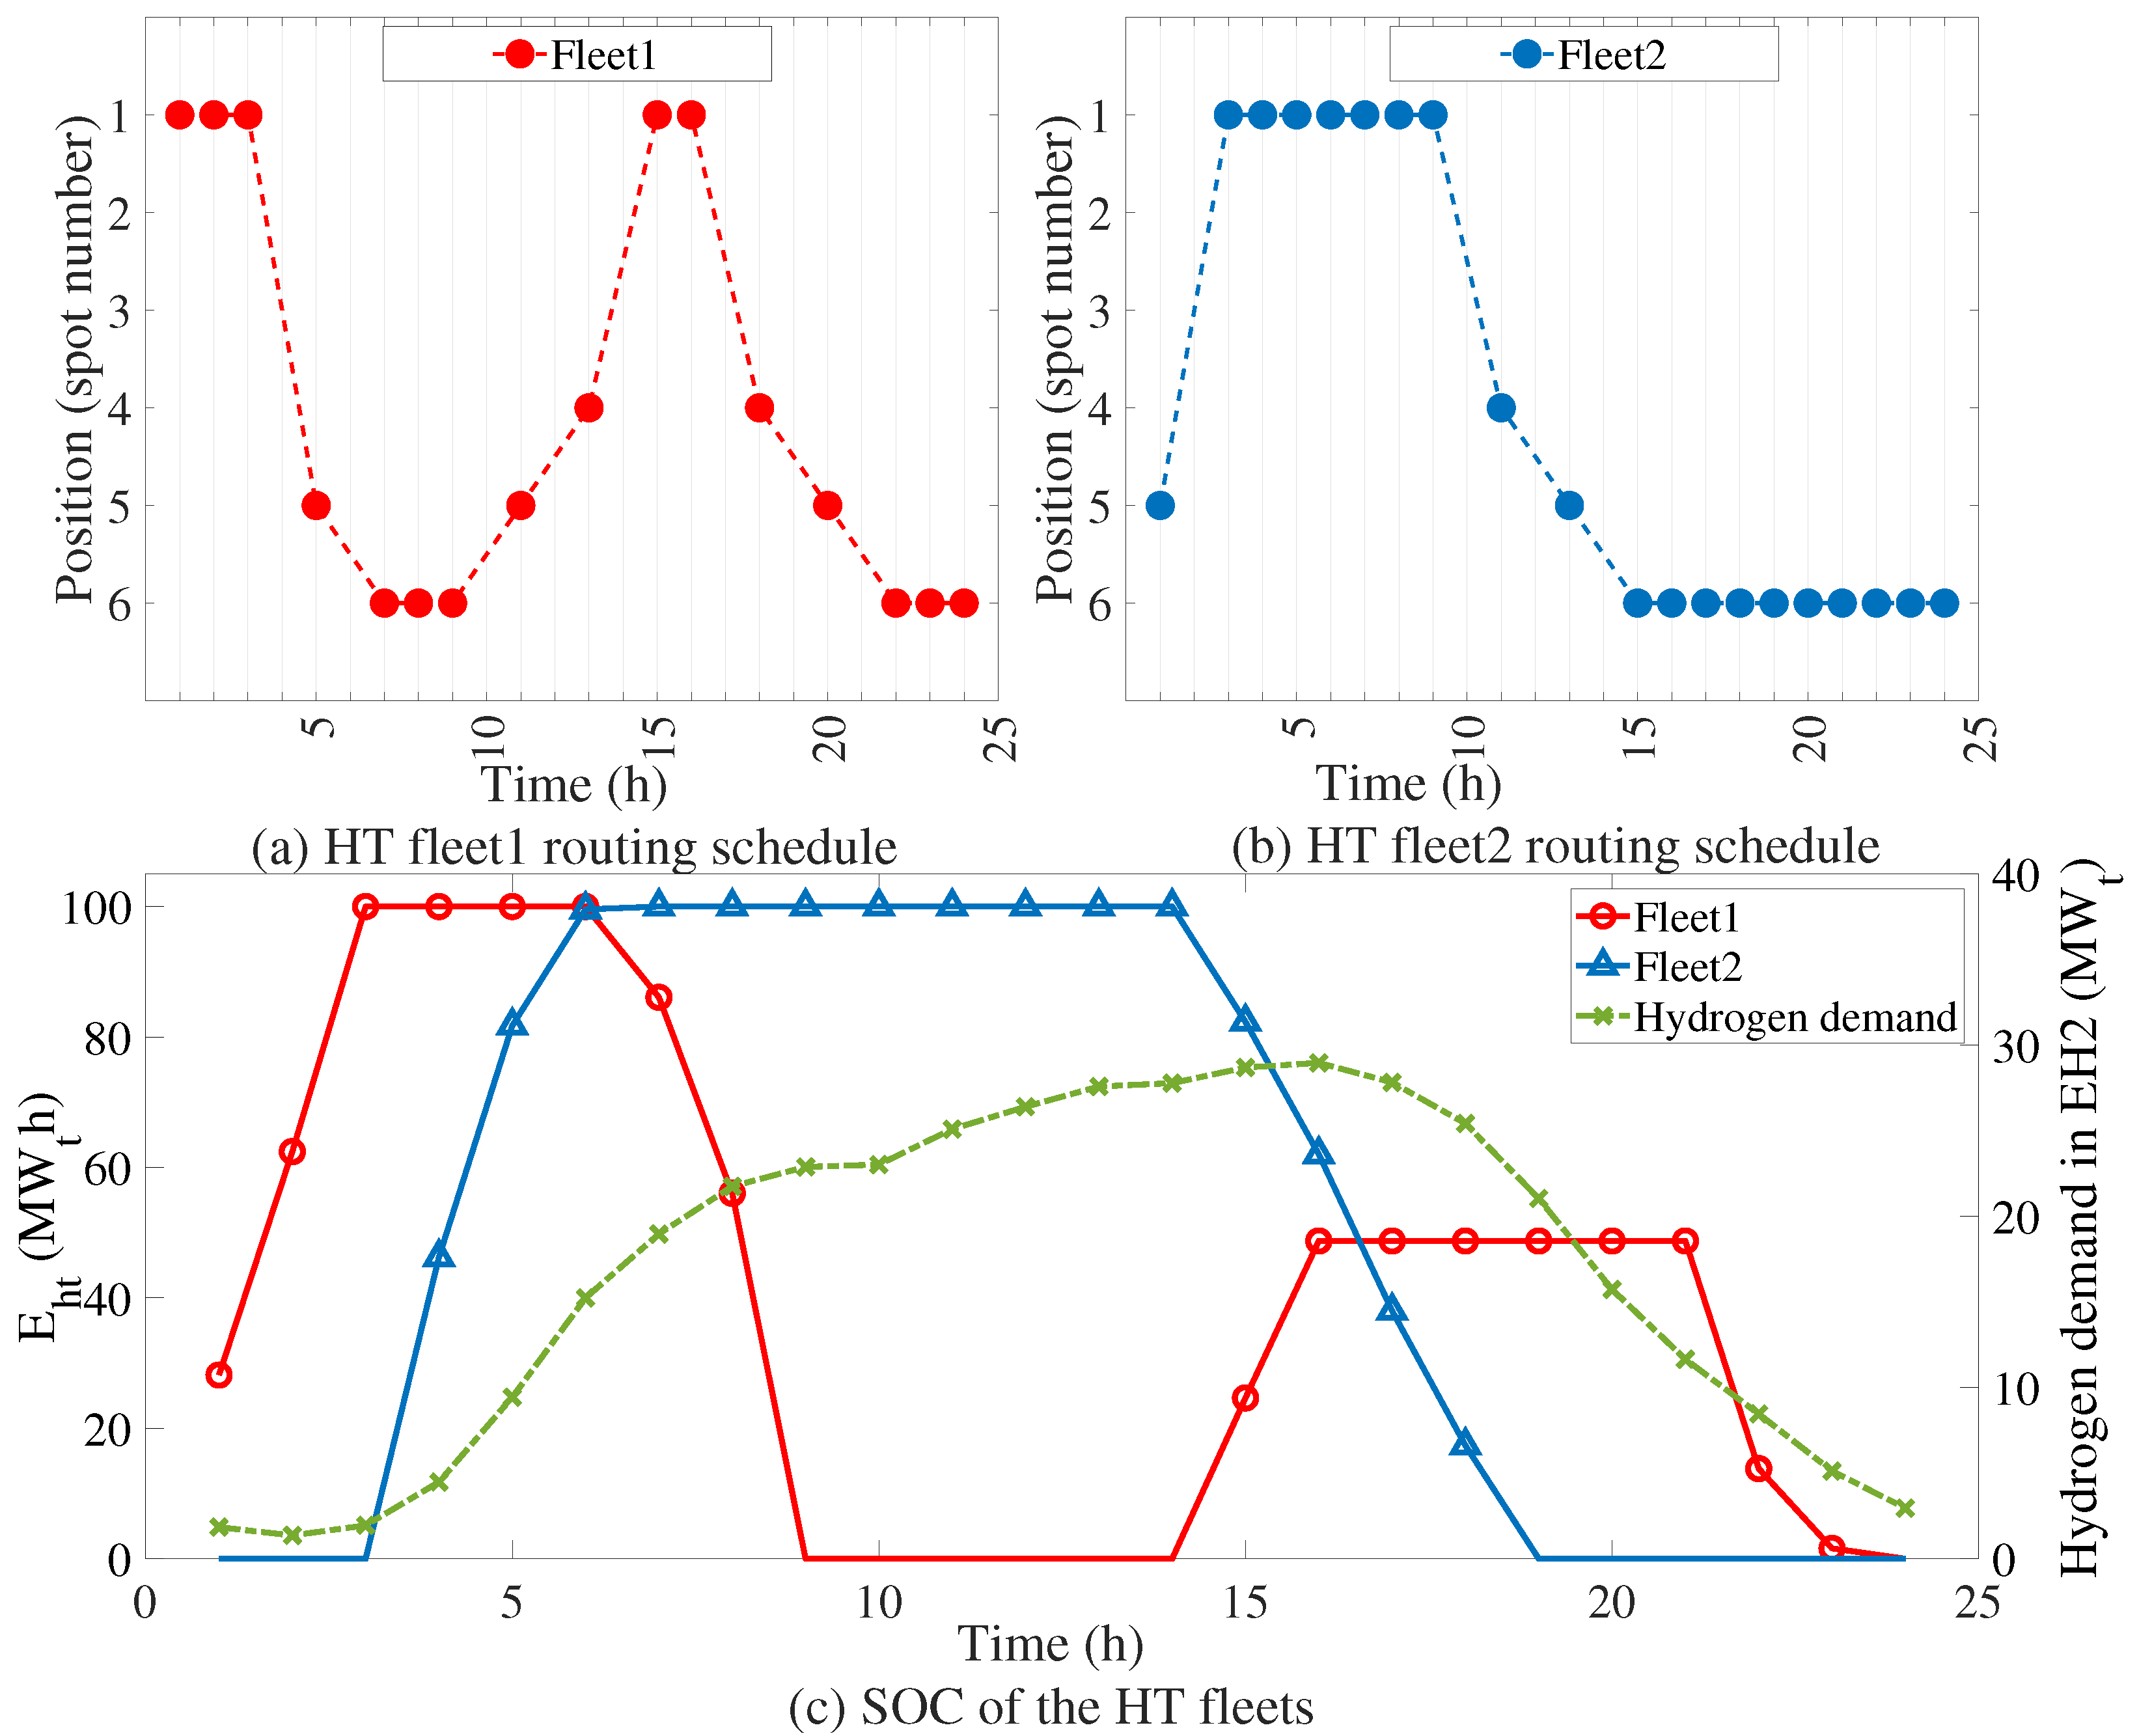
Figure 7 illustrates the routing schedules of the HT fleets as well as their charging and releasing statuses. Taking Fleet 1 as an example, it charges hydrogen at EH1 from 1:00 to 3:00, then travels along the shortest path 1-5-6 and arrives at node 6 at 6:00 to meet the upcoming hydrogen demand peak during 10:00–16:00. After fully releasing its stored hydrogen, Fleet 1 immediately returns to EH1 for the next delivery cycle. Because the shortest return path 6-5-1 becomes unavailable at 3:00 due to a road interruption, Fleet 1 must instead return via the alternative route 6-3-2-1. This routing adjustment highlights the system’s high sensitivity to road interruptions, as even a single blocked path necessitates detours and increases travel time, underscoring the importance of considering road-network uncertainty in HT scheduling.
To illustrate the effectiveness of the proposed method, five cases are considered as follows:
  • Case 1 (Baseline): Only UC is considered; the ELZs operate without P2HH scheduling as [19].
  • Case 2: Only UC is considered; the ELZs operate with P2HH scheduling as [13].
  • Case 3: One HT fleet is requisitioned, but the roads are immunity to disasters. Other settings are the same as Case 2.
  • Case 4: The roads can be interrupted by disasters. Other settings are the same as Case 3.
  • Case 5: Two HT fleets are requisitioned. Other settings are the same as Case 4.
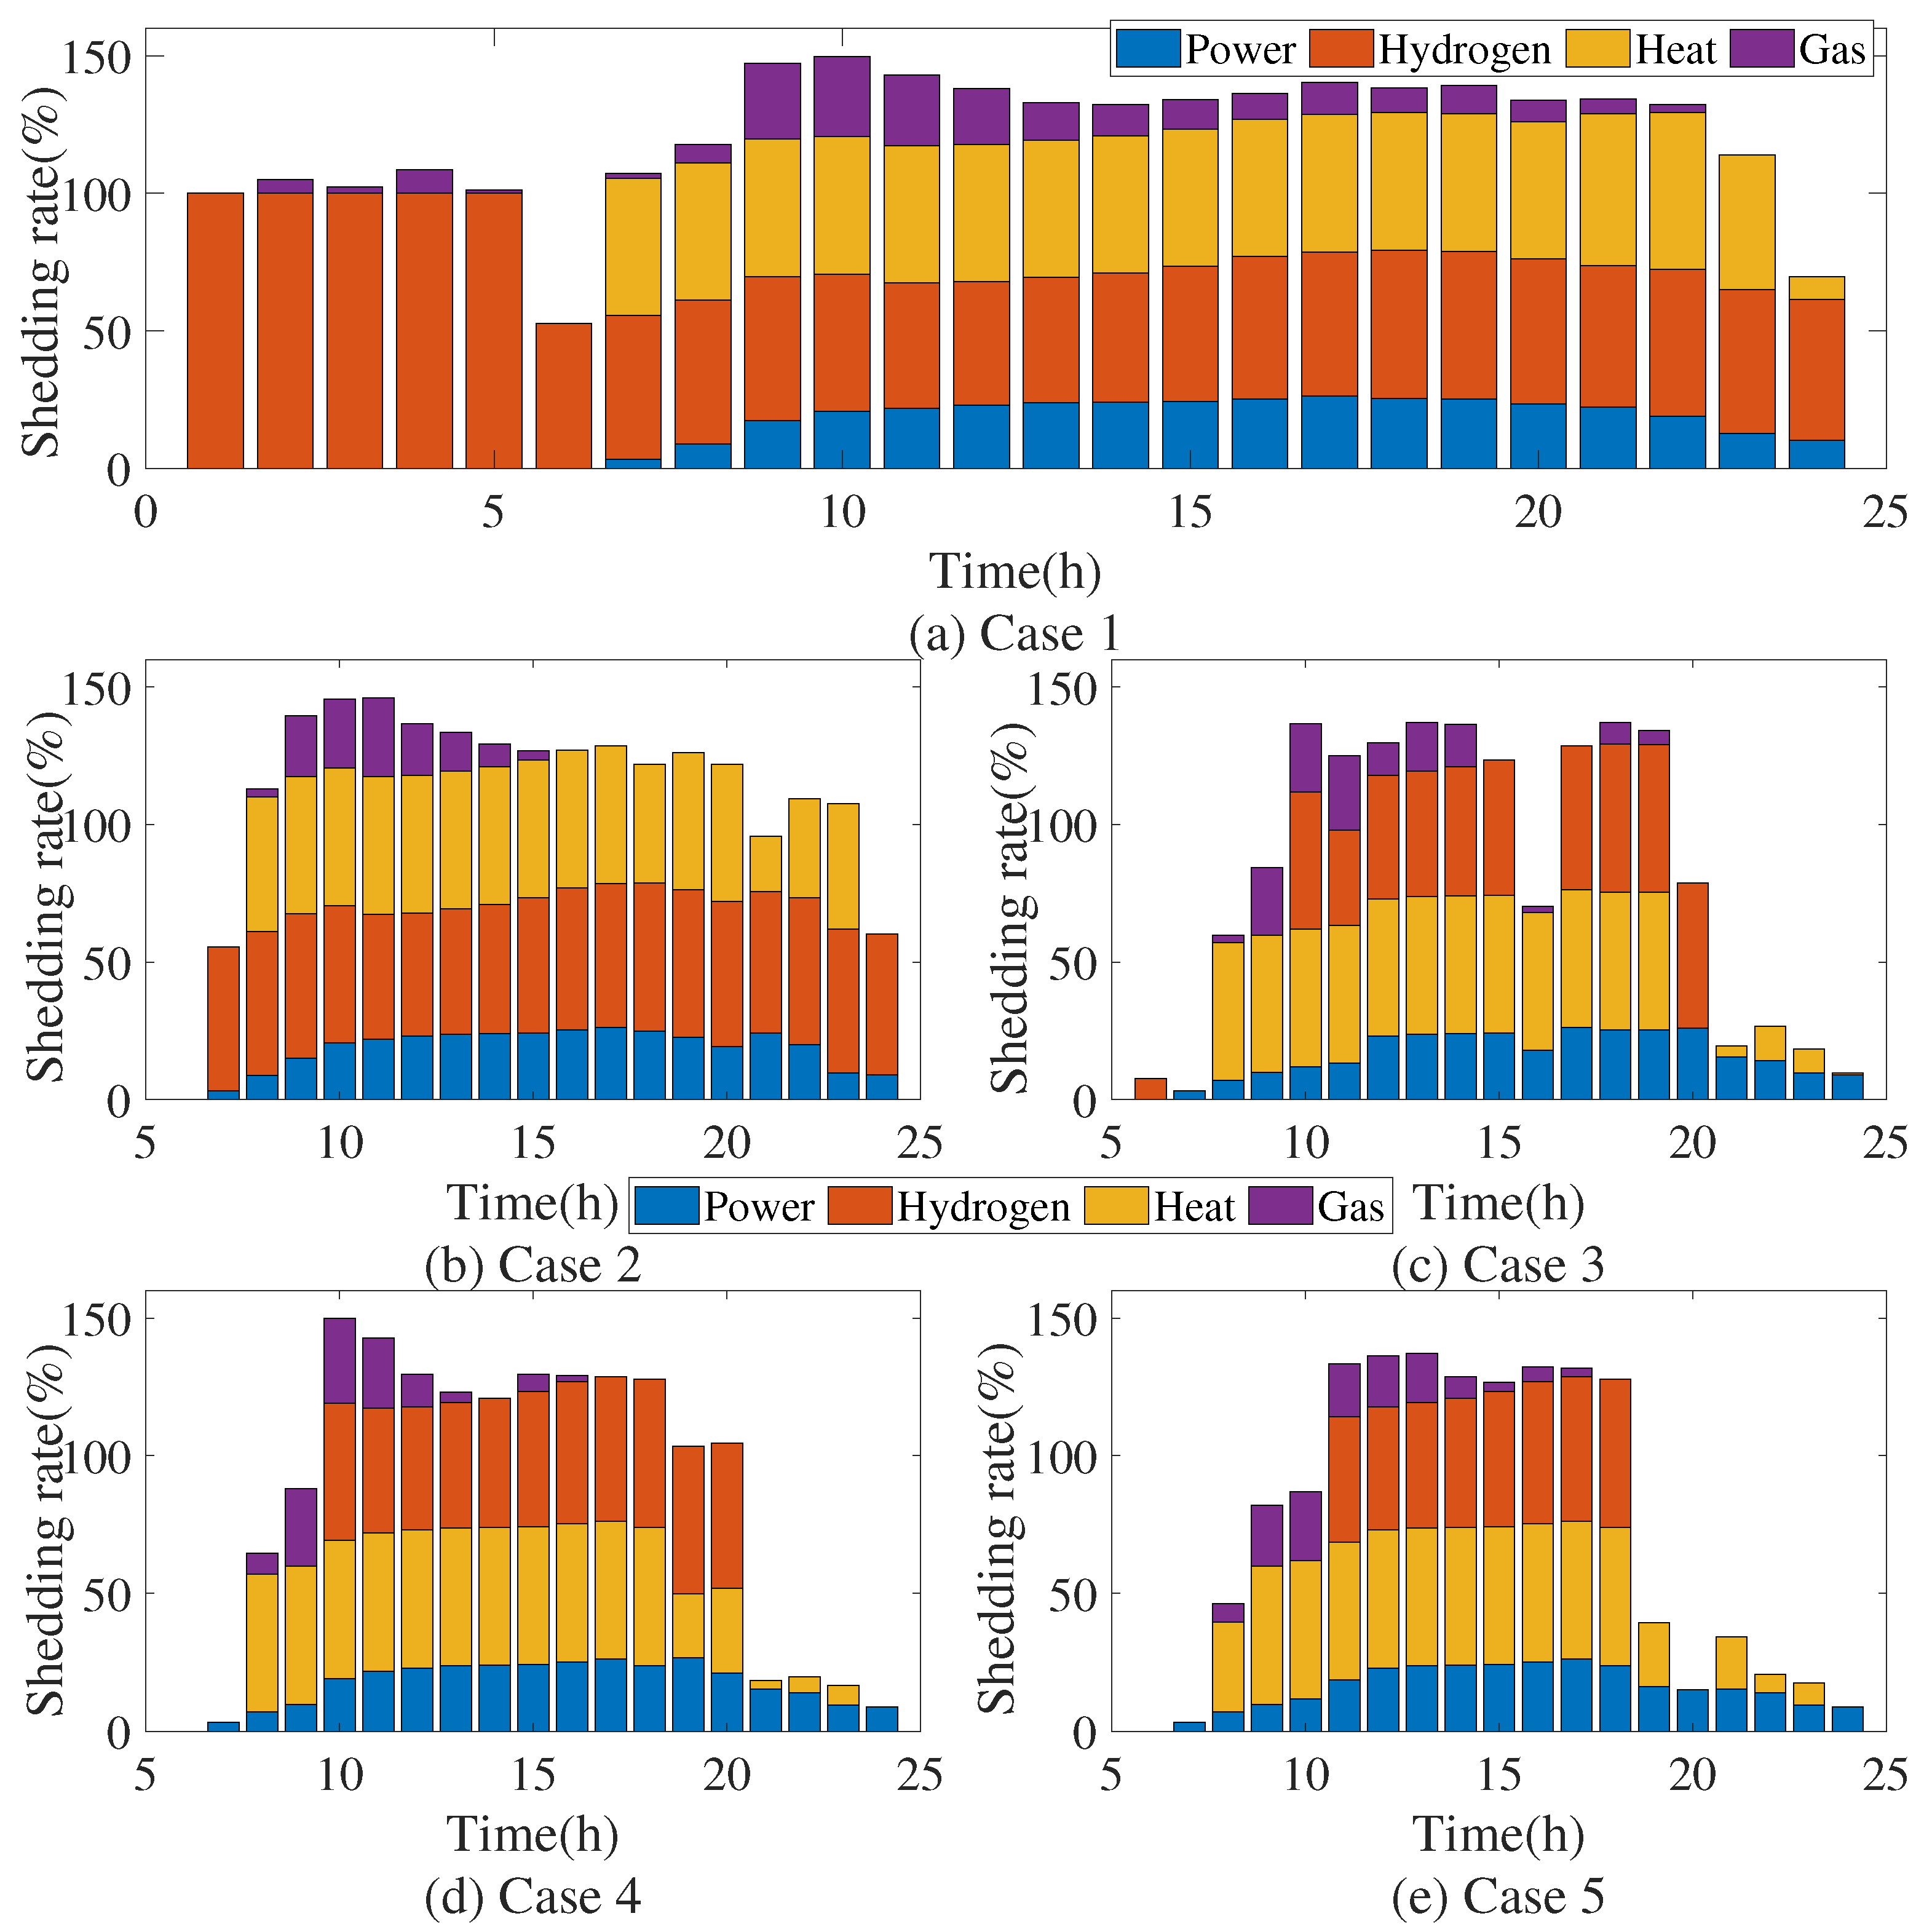
The results are given in Table 2 and Figure 8, where the changes compared to the baseline are indicated in bold.
Figure 8 shows that the load-shedding period becomes increasingly concentrated around the peak hours as more effective preventive schemes are adopted. Table 2 further indicates that Case 5 achieves the lowest total cost and load shedding. By comparing Case 1 and Case 2, it can be observed that heat recovery reduces all forms of energy curtailment in the HIES. In Case 2, heat and gas curtailments directly benefit from the P2HH scheduling, decreasing by 17.33% and 31.62% to Case 1, while the reductions in power and hydrogen curtailments are comparatively smaller. When the TNS is divided into two islands, different types of energy can no longer be flexibly allocated due to interrupted power exchanges and pipeline capacity limits, which restricts the system’s ability to further reduce operational costs. The results of Case 3 to Case 5 highlight the importance of HT scheduling within the proposed preventive framework. In these cases, the total cost and load curtailments are reduced by approximately a factor of two compared with Case 2. When one HT fleet is requisitioned (Case 3–4) or two fleets are requisitioned (Case 5), the electric-power curtailment is reduced by roughly threefold and fivefold compared with Case 2, respectively. Relative to Case 4, substantially more hydrogen is transported to the energy-deficient area in Case 3 and Case 5, leading to further reductions in power and hydrogen curtailments. Overall, these results demonstrate that heat recovery, P2HH scheduling, and HT flexibility play complementary and significant roles in strengthening system resilience. By enabling cross-energy coordination and ensuring resource deliverability under disruptions, the proposed preventive schemes substantially enhance the system’s capability to withstand and recover from extreme events.

4.2. Test 2: 39-Bus, 20-Node, 12-Spot System

To verify the effectiveness and computational performances of the proposed ARO-based preventive scheduling with the uncertainties of facility damage, a larger 39-bus, 20-node, 12-spot system is used in this test. The system contains five CGs, five EHs, two GSs, and three GWs. Four HT fleets are requisitioned and pre-deployed at spots 3, 11, 6, and 2, respectively. The updating step γ in Algorithm 2 is set to 2.
To evaluate the sensitivity of the scheduling results to the robustness budgets Γ , the outcomes of the proposed preventive schemes under different budget levels are summarized in Table 3. The initial values of Γ L , Γ P , and Γ R are set to 5, 4, and 2, respectively. When Γ L increases to 6, the failure of transmission lines 39-1, 4-3, 17-16, 16-15, 28-26, and 29-6 divides the TNS into four islanded subsystems under the worst-case scenario. In this case, generation resources become highly unevenly distributed, with no CG in the island containing EH1 and four CGs concentrated in the area of EH4. This imbalance leads to power load curtailment and results in a 44% increase in the total system cost, which subsequently drives higher levels of heat, hydrogen, and gas load shedding. Similarly, when Γ P rises to 5, pipelines 3-4, 4-8, 7-10, 8-11, and 11-12 fail in the worst-case scenario. Although the gas load curtailment increases by 61%, the load shedding of power, heat, and hydrogen rises by less than 10%, indicating that the integrated energy system maintains a relatively high level of resilience against limited natural gas supply disruptions. For the transportation network, increasing Γ R by one unit (while keeping other budgets constant) leads to a 4% increase in total cost and a 10% increase in average load shedding. These results highlight that road accessibility plays a critical role in maintaining the efficiency of HT scheduling and, consequently, the overall resilience of the HIES. This finding is consistent with the trends observed in Table 2 from Test 1.
Table 4 illustrates the computational performances of the proposed preventive schemes solved by different methodologies. The budgets Γ L , Γ P , Γ R are respectively set at 6, 4, 3. When the nested C&CG is adopted directly, the solver is stuck when solving SMP, making the day-ahead scheduling fail. When the AOP is used in the inner C&CG loop, a near-optimal solution, with a deviation of 2% from the solution by the C&CG-AOP algorithm, is obtained in 25214s. The iterations of MP and SP, respectively, are 8 and 26 for the two algorithms. The solution time is further reduced by 21% using the proposed ATC-C&CG-AOP algorithm compared to the C&CG-AOP algorithm. Overall, simulation results on the 39-bus, 20-node, 12-spot test system demonstrate that the proposed strategy effectively reduces shedding costs. In addition, the ATC–C&CG–AOP algorithm exhibits clear advantages in convergence and computational efficiency, particularly in solving the MP.

5. Conclusions

This paper proposes an ARO-based resilient preventive scheduling approach that incorporates the interactions among multiple energy systems, P2HH, and HT scheduling in HIESs to mitigate the impacts of natural disasters. The model accounts for road interruptions as well as failures of TLs and pipelines caused by disasters. To improve computational efficiency, an ATC–C&CG–AOP hybrid algorithm is developed to solve the proposed ARO model. Case studies conducted on two test systems demonstrate that the proposed preventive scheduling model effectively reduces operational costs and load curtailments. Simulation results show that coordinating P2HH and HT reduces power, heat, hydrogen, and gas load curtailments by 14.35%, 43.39%, 49.97%, and 40.32%, respectively, and lowers operational costs by 14.60%. Moreover, the proposed hybrid algorithm enhances computational efficiency, reducing solution time by 21% with only a 2% deviation from the solution obtained using the conventional C&CG–AOP algorithm.
The proposed preventive scheduling approach has several limitations. First, the uncertainties of loads and renewable generation are not considered, which limits applicability in future energy systems with high renewable penetration. Future work will incorporate both disaster-induced uncertainties and source–load uncertainties and develop enhanced optimization models capable of handling all these factors simultaneously. Moreover, hydrogen transportation may pose potential safety risks, unlike natural gas, because hydrogen has several hazardous characteristics, including high leakage propensity, low minimum ignition energy, and a wide flammable range [45]. Therefore, safety-oriented scheduling strategies for hydrogen transportation can be further investigated in future research.

Supplementary Materials

The following supporting information can be downloaded at: https://www.mdpi.com/article/10.3390/en18236091/s1.

Author Contributions

Conceptualization, L.S.; methodology, L.S. and Y.Z.; software, L.S.; validation, L.S.; investigation, Y.Z.; resources, Z.W.; supervision, L.Z. and Z.W.; writing—original draft preparation, L.S.; writing—review and editing, Y.Z., L.Z. and Z.W. All authors have read and agreed to the published version of the manuscript.

Funding

This research was supported in part by the National Natural Science Foundation of China under Grant 42305158, and by the Startup Foundation for Introducing Talent of Wuxi University (Grant 2024r001).

Data Availability Statement

The data that support the findings of this study are available from the corresponding author upon reasonable request.

Conflicts of Interest

The authors declare no conflicts of interest.

Abbreviations and Nomenclature

The following abbreviations are used in this manuscript:
HIESHydrogen-based Integrated Energy System
ELZElectrolyzer
MRMethanation Reactor
HTHydrogen Transportation
HCNGHydrogen-enriched Compressed Natural Gas
UCUnit Commitment
GNSGas Network System
MERMobile Energy Resource
EVElectric Vehicles
AROAdaptive Robust Optimization
EHEnergy Hub
TNSTransmission Network System
P2HHPower-to-Hydrogen-and-Heat
TLTransmission Line
C&CGColumn-and-Constraint-Generation
ATCAnalytical Target Cascading
AOPAlternating Optimization Procedures
RNRoad Network
CGCoal-fired Generators
GTGas Turbine
FCFuel Cell
ESEnergy System
TSThermal Storage
GWGas Well
GSGas Storage
IES-MPIntegrated Energy System Master Problem
HT-MPHydrogen Transportation Master Problem
The nomenclature used in this manuscript is as follows:
tIndices of time spans
n , i , s Indices of EHs, CGs, and GSs
fIndices of HT fleets
b , g , p , w Indices of buses, nodes, pipes, gas wells
p s ( g ) / p e ( g ) Index set of pipes start/end at node g
EH ( b / g / m ) Index set of EHs coupling at b / g / m
U Uncertainty set
L Set of TLs
P Set of pipes
R Set of roads
L i m p Set of impacted TLs
P i m p Set of impacted pipes
R i m p Set of impacted roads
c s e / h / q / m Load shedding cost
c n ( i ) e l z / g t / c g , o p Operating cost of ELZ/GT/CG
c n m r / f c Operating cost of MR/FC
c n ( i ) e l z ( c g ) , o n / o f f Startup/shutdown cost of ELZ(CG)
c n ( i ) e l z ( c g ) , n l No-load cost of ELZ(CG)
c n ( s ) e s / h s / t s / g s Charging/discharging cost of ES/HS/TS/GS
c g Trading cost of natural gas
c f t r a Transportation cost of HT fleet f
c f h t , o p Charging/releasing cost of HT fleet f
{ · } ¯ / { · } ̲ Maximum/minimum value
TTime horizon
τ t A Ambient temperature. (℃)
T R n e c / T C n e c Thermal resistance/capacity of EC. (℃/ M W and M W / Δ t )
L H V g Lower heating value of natural gas. (MW/Sm3)
T n ( i ) o n / o f f Minimum ON/OFF time
Γ L / P / R Budget of uncertainty set
η r e c / f c / m r / g t Efficiency coefficient of conversion
η e s / h s / t s / h t / g s Efficiency coefficient of storage units
R D i ( n ) / R U i ( n ) Ramp-down/up limit
S D i ( n ) / S U i ( n ) Shutdown/startup ramp limit
P b ( n ) , t d e Power demand
Q b ( n ) , t d e Heat demand
H n , t d e Hydrogen demand
M g ( n ) , t d e Natural gas demand
X b b Reactance of TL b b
T m m 0 Standard travel time from m to m
r n ( b , g ) t e / h / q / m Load shedding rate
E n ( s , f ) , t e s / h s / t s / g s / h t State of charge (SOC) of storage units
τ n , t e c Temperature of electrolysis cell
P n , t e h Input power of EH
P n , t e l z Input power of ELZ
P n , t g t / f c Output power of GT/FC
Q n , t g t / e c Output heat power of GT/EC
Q n , t r e c Recovered heat power of P2HH
H n , t m r Input hydrogen power of MR
H n , t e c / h t Output hydrogen power of EC/HT
M n , t e h / g t Gas consumption of EH/GT
p n , t e s / h s / t s , + Charging power of ES/HS/TS
p n , t e s / h s / t s , Discharging power of ES/HS/TS
P i , t c g Output power of CG
θ b , t Phase angle at bus b
M s , t g s + / Charging/discharging gas mass flow of GS
M t e ( p ) / s ( p ) Injection gas mass flow at the start/end node of pipe p
M w , t Output gas mass flow of GW w
H f , m , t h t + / Charging/releasing hydrogen of HT fleet f at spot m and time t
T f , r Travel time of road r
F f , t Total travel time of the current trip for HT fleet f at time t
R f , t Remaining travel time of the current trip for HT fleet f at time t
u t l / p / r Binary variable: 0 if the facility is damaged; 1 otherwise
δ i ( n ) , t c g ( e l z ) Binary: 1 if unit is committed; 0 otherwise
x i ( n ) , t o n / o f f , c g ( e l z ) Binary: 1 if unit is startup/shutdown; 0 otherwise
a f , m , t Binary: 1 if HT fleet f is at road spot m at time t; 0 otherwise
b f , m , t Binary: 1 if HT fleet f is heading to road spot m at time t; 0 otherwise
ω f , t Binary: 1 if HT fleet f is traveling at both t 1 and t; 0 otherwise

References

  1. Zhao, J.; Li, F.; Zhang, Q. Impacts of renewable energy resources on the weather vulnerability of power systems. Nat. Energy 2024, 9, 1407–1414. [Google Scholar] [CrossRef]
  2. Panteli, M.; Mancarella, P. The grid: Stronger, bigger, smarter?: Presenting a conceptual framework of power system resilience. IEEE Power Energy Mag. 2015, 13, 58–66. [Google Scholar] [CrossRef]
  3. Shi, Q.; Yan, Y.; Liu, W.; Zeng, B.; Wang, Z.; Li, F. Resilience Assessment of Urban Power Network Considering Multi-Stage Electrical-Water Fault Propagation. IEEE Trans. Power Syst. 2024, 40, 2819–2831. [Google Scholar] [CrossRef]
  4. Wen, J.; Gan, W.; Chu, C.C.; Jiang, L.; Luo, J. Robust resilience enhancement by EV charging infrastructure planning in coupled power distribution and transportation systems. IEEE Trans. Smart Grid 2024, 16, 491–504. [Google Scholar] [CrossRef]
  5. Wu, W.; Hou, H.; Zhu, S.; Liu, Q.; Wei, R.; He, H.; Wang, L.; Luo, Y. An intelligent power grid emergency allocation technology considering secondary disaster and public opinion under typhoon disaster. Appl. Energy 2024, 353, 122038. [Google Scholar] [CrossRef]
  6. Huang, W.; Hu, B.; Shahidehpour, M.; Sun, Y.; Sun, Q.; Yan, M.; Shao, C.; Xie, K. Preventive scheduling for reducing the impact of glaze icing on transmission lines. IEEE Trans. Power Syst. 2021, 37, 1297–1310. [Google Scholar] [CrossRef]
  7. Liu, Z.; Wu, Q.; Shen, X.; Tan, J.; Zhang, X. Post-disaster robust restoration scheme for distribution network considering rerouting process of cyber system with 5G. IEEE Trans. Smart Grid 2024, 15, 4478–4491. [Google Scholar] [CrossRef]
  8. Xie, D.; Xu, Y.; Nadarajan, S.; Viswanathan, V.; Gupta, A.K. A transparent data-driven method for stability-constrained load restoration considering multi-phase load dynamics. IEEE Trans. Power Syst. 2023, 39, 366–379. [Google Scholar] [CrossRef]
  9. Zare-Bahramabadi, M.; Ehsan, M.; Farzin, H. A risk-based resilient distribution system planning model against extreme weather events. IET Renew. Power Gener. 2022, 16, 2125–2135. [Google Scholar] [CrossRef]
  10. Gao, H.; Chen, Y.; Mei, S.; Huang, S.; Xu, Y. Resilience-oriented pre-hurricane resource allocation in distribution systems considering electric buses. Proc. IEEE 2017, 105, 1214–1233. [Google Scholar] [CrossRef]
  11. Sankhwar, P. Electric Vehicle DC Charging Stations Design, Floating Solar Photovoltaics, and HVDC Power Transmission and Distribution. Int. J. Inven. Eng. Sci. 2025, 12, 13–19. [Google Scholar] [CrossRef]
  12. Yu, L.; Fang, H.; Strbac, G.; Qiu, D.; Yue, D.; Guan, X.; Hancke, G.P. A Review of Resilience Enhancement Measures for Hydrogen-penetrated Multi-energy Systems. arXiv 2024, arXiv:2412.19374. [Google Scholar]
  13. Pan, G.; Gu, W.; Lu, Y.; Qiu, H.; Lu, S.; Yao, S. Optimal planning for electricity-hydrogen integrated energy system considering power to hydrogen and heat and seasonal storage. IEEE Trans. Sustain. Energy 2020, 11, 2662–2676. [Google Scholar] [CrossRef]
  14. Zhu, R.; Liu, H.; Yu, W.; Gu, W.; Sun, L. Resilience-oriented operation of integrated electricity-natural gas systems using hydrogen enriched compressed natural gas. IEEE Syst. J. 2024, 18, 953–964. [Google Scholar] [CrossRef]
  15. Fu, C.; Lin, J.; Song, Y.; Li, J.; Song, J. Optimal Operation of an Integrated Energy System Incorporated with HCNG Distribution Networks. IEEE Trans. Sustain. Energy 2019, 11, 2141–2151. [Google Scholar] [CrossRef]
  16. He, G.; Mallapragada, D.S.; Bose, A.; Heuberger, C.F.; Gençer, E. Hydrogen supply chain planning with flexible transmission and storage scheduling. IEEE Trans. Sustain. Energy 2021, 12, 1730–1740. [Google Scholar] [CrossRef]
  17. Shao, C.; Feng, C.; Shahidehpour, M.; Zhou, Q.; Wang, X.; Wang, X. Optimal stochastic operation of integrated electric power and renewable energy with vehicle-based hydrogen energy system. IEEE Trans. Power Syst. 2021, 36, 4310–4321. [Google Scholar] [CrossRef]
  18. Maulén, L.; Castro, M.; Lorca, Á.; Negrete-Pincetic, M. Optimization-based expansion planning for power and hydrogen systems with feedback from a unit commitment model. Appl. Energy 2023, 343, 121207. [Google Scholar] [CrossRef]
  19. Haggi, H.; Sun, W.; Fenton, J.M.; Brooker, P. Proactive rolling-horizon-based scheduling of hydrogen systems for resilient power grids. IEEE Trans. Ind. Appl. 2022, 58, 1737–1746. [Google Scholar] [CrossRef]
  20. Shahbazbegian, V.; Shafie-Khah, M.; Laaksonen, H.; Strbac, G.; Ameli, H. Resilience-oriented operation of microgrids in the presence of power-to-hydrogen systems. Appl. Energy 2023, 348, 121429. [Google Scholar] [CrossRef]
  21. Liu, J.; Cao, X.; Xu, Z.; Guan, X.; Dong, X.; Wang, C. Resilient operation of multi-energy industrial park based on integrated hydrogen-electricity-heat microgrids. Int. J. Hydrogen Energy 2021, 46, 28855–28869. [Google Scholar] [CrossRef]
  22. Huang, C.; Zong, Y.; You, S.; Træholt, C.; Zheng, Y.; Wang, J.; Zheng, Z.; Xiao, X. Economic and resilient operation of hydrogen-based microgrids: An improved MPC-based optimal scheduling scheme considering security constraints of hydrogen facilities. Appl. Energy 2023, 335, 120762. [Google Scholar] [CrossRef]
  23. Zhao, Y.; Lin, J.; Song, Y.; Xu, Y. A hierarchical strategy for restorative self-healing of hydrogen-penetrated distribution systems considering energy sharing via mobile resources. IEEE Trans. Power Syst. 2022, 38, 1388–1404. [Google Scholar] [CrossRef]
  24. Su, J.; Zhang, R.; Dehghanian, P.; Kapourchali, M.H.; Choi, S.; Ding, Z. Renewable-dominated mobility-as-a-service framework for resilience delivery in hydrogen-accommodated microgrids. Int. J. Electr. Power Energy Syst. 2024, 159, 110047. [Google Scholar] [CrossRef]
  25. Dong, Y.; Zheng, W.; Cao, X.; Sun, X.; He, Z. Co-planning of hydrogen-based microgrids and fuel-cell bus operation centers under low-carbon and resilience considerations. Appl. Energy 2023, 336, 120849. [Google Scholar] [CrossRef]
  26. Cao, X.; Cao, T.; Xu, Z.; Zeng, B.; Gao, F.; Guan, X. Resilience constrained scheduling of mobile emergency resources in electricity-hydrogen distribution network. IEEE Trans. Sustain. Energy 2022, 14, 1269–1284. [Google Scholar] [CrossRef]
  27. Wang, Z.; Ding, T.; Jia, W.; Mu, C.; Huang, C.; Catalão, J.P. Multi-period restoration model for integrated power-hydrogen systems considering transportation states. IEEE Trans. Ind. Appl. 2021, 58, 2694–2706. [Google Scholar] [CrossRef]
  28. Li, Y.; Li, Z.; Wen, F.; Shahidehpour, M. Minimax-regret robust co-optimization for enhancing the resilience of integrated power distribution and natural gas systems. IEEE Trans. Sustain. Energy 2018, 11, 61–71. [Google Scholar] [CrossRef]
  29. Liu, Z.; Zhao, H.; Liu, G.; Liang, G.; Zhao, J.; Qiu, J. Risk-sensitive mobile battery energy storage system control with deep reinforcement learning and hybrid risk estimation method. IEEE Trans. Smart Grid 2024, 15, 4143–4158. [Google Scholar] [CrossRef]
  30. Wang, Z.; Wang, Z. A novel preventive islanding scheme of power system under extreme typhoon events. Int. J. Electr. Power Energy Syst. 2023, 147, 108857. [Google Scholar] [CrossRef]
  31. Li, J.; Lin, J.; Song, Y.; Xing, X.; Fu, C. Operation optimization of power to hydrogen and heat (P2HH) in ADN coordinated with the district heating network. IEEE Trans. Sustain. Energy 2018, 10, 1672–1683. [Google Scholar] [CrossRef]
  32. Chen, X.; Kang, C.; O’Malley, M.; Xia, Q.; Bai, J.; Liu, C.; Sun, R.; Wang, W.; Li, H. Increasing the flexibility of combined heat and power for wind power integration in China: Modeling and implications. IEEE Trans. Power Syst. 2014, 30, 1848–1857. [Google Scholar] [CrossRef]
  33. Jenabi, M.; Ghomi, S.M.T.F.; Smeers, Y. Bi-level game approaches for coordination of generation and transmission expansion planning within a market environment. IEEE Trans. Power Syst. 2013, 28, 2639–2650. [Google Scholar] [CrossRef]
  34. Lei, S.; Chen, C.; Zhou, H.; Hou, Y. Routing and scheduling of mobile power sources for distribution system resilience enhancement. IEEE Trans. Smart Grid 2018, 10, 5650–5662. [Google Scholar] [CrossRef]
  35. Wang, W.; Xiong, X.; He, Y.; Hu, J.; Chen, H. Scheduling of separable mobile energy storage systems with mobile generators and fuel tankers to boost distribution system resilience. IEEE Trans. Smart Grid 2021, 13, 443–457. [Google Scholar] [CrossRef]
  36. Wang, W.; Xiong, X.; Xiao, C.; Wei, B. A novel mobility model to support the routing of mobile energy resources. IEEE Trans. Smart Grid 2022, 13, 2675–2678. [Google Scholar] [CrossRef]
  37. Zhao, L.; Zeng, B. An Exact Algorithm for Two-Stage Robust Optimization with Mixed Integer Recourse Problems. 2012. Available online: https://optimization-online.org/wp-content/uploads/2012/01/3310.pdf (accessed on 1 October 2025).
  38. Qiu, H.; Long, H.; Gu, W.; Pan, G. Recourse-cost constrained robust optimization for microgrid dispatch with correlated uncertainties. IEEE Trans. Ind. Electron. 2020, 68, 2266–2278. [Google Scholar] [CrossRef]
  39. Kargarian, A.; Fu, Y. System of systems based security-constrained unit commitment incorporating active distribution grids. IEEE Trans. Power Syst. 2014, 29, 2489–2498. [Google Scholar] [CrossRef]
  40. Zeng, B.; Zhao, L. Solving two-stage robust optimization problems using a column-and-constraint generation method. Oper. Res. Lett. 2013, 41, 457–461. [Google Scholar] [CrossRef]
  41. Pan, G.; Gu, W.; Lu, Y.; Qiu, H.; Lu, S.; Yao, S. Accurate modeling of a profit-driven power to hydrogen and methane plant toward strategic bidding within multi-type markets. IEEE Trans. Smart Grid 2020, 12, 338–349. [Google Scholar] [CrossRef]
  42. Gurobi Optimization, LLC. Gurobi Optimizer Reference Manual. 2025. Available online: https://www.gurobi.com (accessed on 1 October 2025).
  43. Lina, S. Supplement Data for Resilient HIES. 2025. Available online: https://figshare.com/articles/dataset/Supplement_data_and_codes_for_paper_Resilient_Preventive_Scheduling_for_Hydrogen-based_Integrated_Energy_Systems_Considering_Impacts_of_Natural_Disasters_/30598349 (accessed on 12 November 2025).
  44. Yan, M.; He, Y.; Shahidehpour, M.; Ai, X.; Li, Z.; Wen, J. Coordinated regional-district operation of integrated energy systems for resilience enhancement in natural disasters. IEEE Trans. Smart Grid 2018, 10, 4881–4892. [Google Scholar] [CrossRef]
  45. Li, H.; Cao, X.; Liu, Y.; Shao, Y.; Nan, Z.; Teng, L.; Peng, W.; Bian, J. Safety of hydrogen storage and transportation: An overview on mechanisms, techniques, and challenges. Energy Rep. 2022, 8, 6258–6269. [Google Scholar] [CrossRef]
Figure 1. The EH structure.
Energies 18 06091 g001
Figure 2. Flowchart of Algorithm 1.
Energies 18 06091 g002
Figure 3. Flowchart of Algorithm 2.
Energies 18 06091 g003
Figure 4. Topology and affected areas of the 6-bus, 6-node, 6-spot test system.
Energies 18 06091 g004
Figure 5. UC scheduling results.
Energies 18 06091 g005
Figure 6. Profiles of energy supplies. (a) electric power supply. (b) heat supply. (c) hydrogen supply. (d) gas supply.
Energies 18 06091 g006
Figure 7. HT scheduling results.
Energies 18 06091 g007
Figure 8. Load shedding rate in different cases.
Energies 18 06091 g008
Table 1. Comparison between hydrogen-based storage system and modern battery energy storage system.
CriteriaHydrogen Based Storage SystemModern Battery Energy Storage System
Resilience capabilityLong-duration, multi-energy supportShort-duration, fast-response
Storage durationSuitable for medium–long-term storageBest for short-term (seconds–hours) applications
Energy carrier flexibilitySupports electricity, heat, gas, and mobilityMainly supports electricity
Emission reductionHigh potential with renewable hydrogenSignificant but limited by lifecycle constraints
Table 2. Comparison of load shedding across different cases.
CaseTotal Cost (106 $)Total Load Shedding
Power (MWh) Heat (MWth) Hydrogen (MWth) Gas (104Sm3)
Case 1  [19]27.19879.33247.05212.533.10
Case 2  [13]25.32 (−6.81%)853.34 (−2.96%)204.23 (−17.33%)185.43 (−12.75%)2.12 (−31.61%)
Case 323.84 (−12.26%)767.22 (−12.75%)146.25 (−40.80%)120.88 (−43.12%)1.94 (−37.42%)
Case 424.21 (−10.92%)811.55 (−7.71%)149.50 (−39.48%)137.40 (−35.35%)1.98 (−36.12%)
Case 523.21 (−14.60%)744.32 (−15.35%)139.60 (−43.49%)106.32 (−49.97%)1.85 (−40.32%)
Table 3. Sensitivity of the scheduling results to the robustness budgets Γ .
ΓLΓPΓRTotal Cost (106 $)Total Load Shedding
Power (MWh) Heat (MWth) Hydrogen (MWth) Gas (103Sm3)
54211.26644.96390.90712.0838.43
64216.284965.32567.69946.3171.20
65216.944980.56576.731004.84115.30
65317.925228.45627.821296.53120.49
65418.215500.41695.771537.37134.52
Table 4. Comparison of different solution methodologies.
MethodologyTotal Cost (106 $)Time (s)Iteration (Times)
Total MP SP MP SP
Nested C&CGIntractable within 24 h (solver stuck in SMP)
C&CG-AOP16.6525,21416,5288596826
ATC-C&CG-AOP16.2719,85711,2308627826
Disclaimer/Publisher’s Note: The statements, opinions and data contained in all publications are solely those of the individual author(s) and contributor(s) and not of MDPI and/or the editor(s). MDPI and/or the editor(s) disclaim responsibility for any injury to people or property resulting from any ideas, methods, instructions or products referred to in the content.