Article

Effects of Wellbore Parameters on the Performance of an Open-Loop Geothermal System with Horizontal Well

1
CNOOC Key Laboratory of Liquefied Natural Gas and Low-Carbon Technology, Beijing 100028, China
2
CNOOC Gas & Power Group, Research & Development Center, Beijing 100028, China
3
State Key Laboratory of Petroleum Resources and Engineering, China University of Petroleum, Beijing 102249, China
4
State Key Laboratory of Deep Geothermal Resources, China University of Petroleum, Beijing 102249, China
*
Author to whom correspondence should be addressed.
Energies 2025, 18(23), 6090; https://doi.org/10.3390/en18236090
Submission received: 18 October 2025 / Revised: 12 November 2025 / Accepted: 14 November 2025 / Published: 21 November 2025
(This article belongs to the Section H: Geo-Energy)

Abstract

The open-loop geothermal system with a horizontal well is expected to be a favorable approach to develop geothermal energy from reservoirs through an extended horizontal section. The wellbore design is essential for enhancing the performance of a geothermal system. Nevertheless, research on wellbore parameters for open-loop geothermal systems remains scarce. Hence, a coupled wellbore–fractured reservoir mathematical model is developed and numerically solved using COMSOL Multiphysics 5.6. The target geothermal reservoir is located in Xiongan New Area, China. The temperature distribution in the wellbore is analyzed based on the numerical model. Furthermore, the impacts of wellbore parameters—including the thermal conductivity, thickness, and diameter of the insulated pipe, as well as the injection–production spacing—on production performance are systematically evaluated. Grey relational analysis is further employed to quantify the sensitivity of the wellbore parameters. The results show that the wellbore, particularly the insulated pipe, determines the heat loss of the production fluid, while the fractured reservoir dominates the heat extraction capacity of the injection fluid. Reducing the thermal conductivity of the insulation layer has the most significant effect on decreasing the production temperature and thermal power. The injection–production pressure demonstrates a notable decline as the insulation thickness decreases. Increasing the pipe diameter leads to a non-monotonic trend in the injection–production pressure, which first decreases and then increases. There are critical design thresholds for the thermal conductivity, thickness, and diameter of the insulated pipe. Additionally, expanding the injection–production spacing can effectively delay thermal breakthrough and enhance overall system performance. These findings provide valuable guidance for wellbore design in field applications.

1. Introduction

With the continuous expansion of the global economy, energy demand has been steadily increasing. The combustion of fossil fuels releases large amounts of CO2 and other gases, which intensify the greenhouse effect, contribute to severe environmental pollution, and pose challenges to the sustainable development of modern society [1]. As a clean and renewable resource, geothermal energy has attracted growing attention due to its wide distribution, substantial reserves, and independence from seasonal or meteorological fluctuations, ensuring a reliable and stable energy supply [2,3]. Therefore, accelerating the utilization of geothermal energy is of great importance for advancing global sustainability.
Fractured geothermal reservoirs have become the primary target for medium-to-deep geothermal development due to their favorable permeability, as widely observed in the U.S., Europe, and China [3,4]. The doublet-well system remains the most widely adopted geothermal development approach globally, with extensive applications in Beijing, Hebei Province, and Henan Province, China [4,5]. However, this configuration requires at least two wells, one for injection and one for production, which significantly increases drilling costs. To address this limitation, Danish researchers proposed a single-well open-loop system [6,7], in which injection and production are realized within the same well. Nevertheless, their design is based on a vertical well, and when the reservoir thickness is limited, the heat extraction capacity is greatly constrained. To overcome this issue, we previously introduced an open-loop geothermal system with horizontal wells [8], where the extended horizontal section enhances performance within the reservoir, as shown in Figure 1. It can be seen that the low-temperature fluid is injected through the annulus and flows into the reservoir, while the high-temperature fluid is produced through the insulated tubing. A packer is installed at the bottom of the wellbore to isolate the annulus from the inner pipe, ensuring separate flow paths for injection and production fluids. Heat exchange occurs along the entire wellbore and within the subsurface reservoir. In such a system, wellbore design plays a critical role, e.g., the insulated pipe and the injection–production spacing, which affect the heat losses of the produced fluid and thermal breakthrough in the reservoir, respectively. However, comprehensive studies of wellbore parameters remain scarce. Therefore, further investigation of the effects of wellbore parameters is essential to enhance performance.
In the production of an open-loop geothermal system, the fluid flow and heat exchange within the wellbore and reservoir are involved. However, in-depth studies on these coupled processes remain limited. To address this, it is essential to develop a coupled wellbore–reservoir flow and heat transfer model. For the wellbore domain, Horne [9] established a geothermal well model for fluid flow and heat transfer based on principles from oil drilling. Beier et al. [10] developed a transient heat transfer model using the Laplace transformation. Numerical simulation has received increasing attention due to its ability to improve model accuracy. Holmberg et al. [11] adopted an implicit finite-difference scheme to obtain accurate solutions. For fractured reservoir characterization, it can be described using the single-porosity, dual-porosity, and discrete fracture network theories [12,13,14,15]. The single-porosity model treats the fractured reservoir as one equivalent homogeneous medium, thereby neglecting the influence of rapid fluid flow through fractures. The dual-porosity approach enhances computational accuracy by representing the matrix and fractures as two interacting equivalent continua. In contrast, the discrete fracture network method explicitly represents individual fractures within the reservoir, ensuring fidelity but significantly increasing computational demand. For the flow and heat transfer modeling in a reservoir, Huang et al. [15] investigated the impacts of injection velocity and formation thermal conductivity using a finite-volume framework. Cai et al. [16] established a numerical model of an enhanced geothermal system with five-spot wells, focusing on the influence of reservoir characteristics. Furthermore, previous researchers have proposed coupled wellbore–reservoir models [17,18], but these models mainly assume that the reservoir is characterized by a single-porosity theory. Studies on coupled wellbore–fractured reservoir models incorporating flow and heat transfer are relatively scarce.
The production in an open-loop geothermal system involves coupled flow and heat transfer processes within both the wellbore and the fractured reservoir. Wellbore parameters are critical for the rational design of a geothermal system. However, related research remains limited. In this study, a 3D coupled wellbore–fractured reservoir model is developed to investigate the performance of an open-loop geothermal system with a horizontal well. The bottom of the wellbore serves as the coupling interface between the wellbore model and the fractured reservoir model. The temperature, pressure, and flow rate at this interface are consistent in both models to ensure the continuity of physical variables. The temperature distribution in the wellbore is analyzed. The influences of key parameters—including the thermal conductivity, thickness, and diameter of the insulated inner pipe, as well as the injection–production spacing—on production performance are systematically examined. Parameter sensitivity is further evaluated using the grey relational method. The results provide valuable guidance for wellbore design in open-loop geothermal systems.

2. Materials and Methods

2.1. Model Assumptions

Given the complexity of solving a coupled model, appropriate simplifications were introduced to enhance numerical stability and computational efficiency. The simulation domain was divided into two subdomains: the upper wellbore region and the lower reservoir region. Coupling at the bottom-well nodes ensures continuity of state variables between the two subdomains, allowing for integrated modeling of the entire geothermal system. The following assumptions were further adopted in model construction [12,13,16,17,18]:
(1)
The rock is homogeneous and isotropic [11,12]. The thermophysical properties of the rock are assumed to be constant [13], including the density, thermal capacity, and thermal conductivity.
(2)
In non-aquifer zones adjacent to the wellbore, heat transfer occurs exclusively by conduction in the rock matrix.
(3)
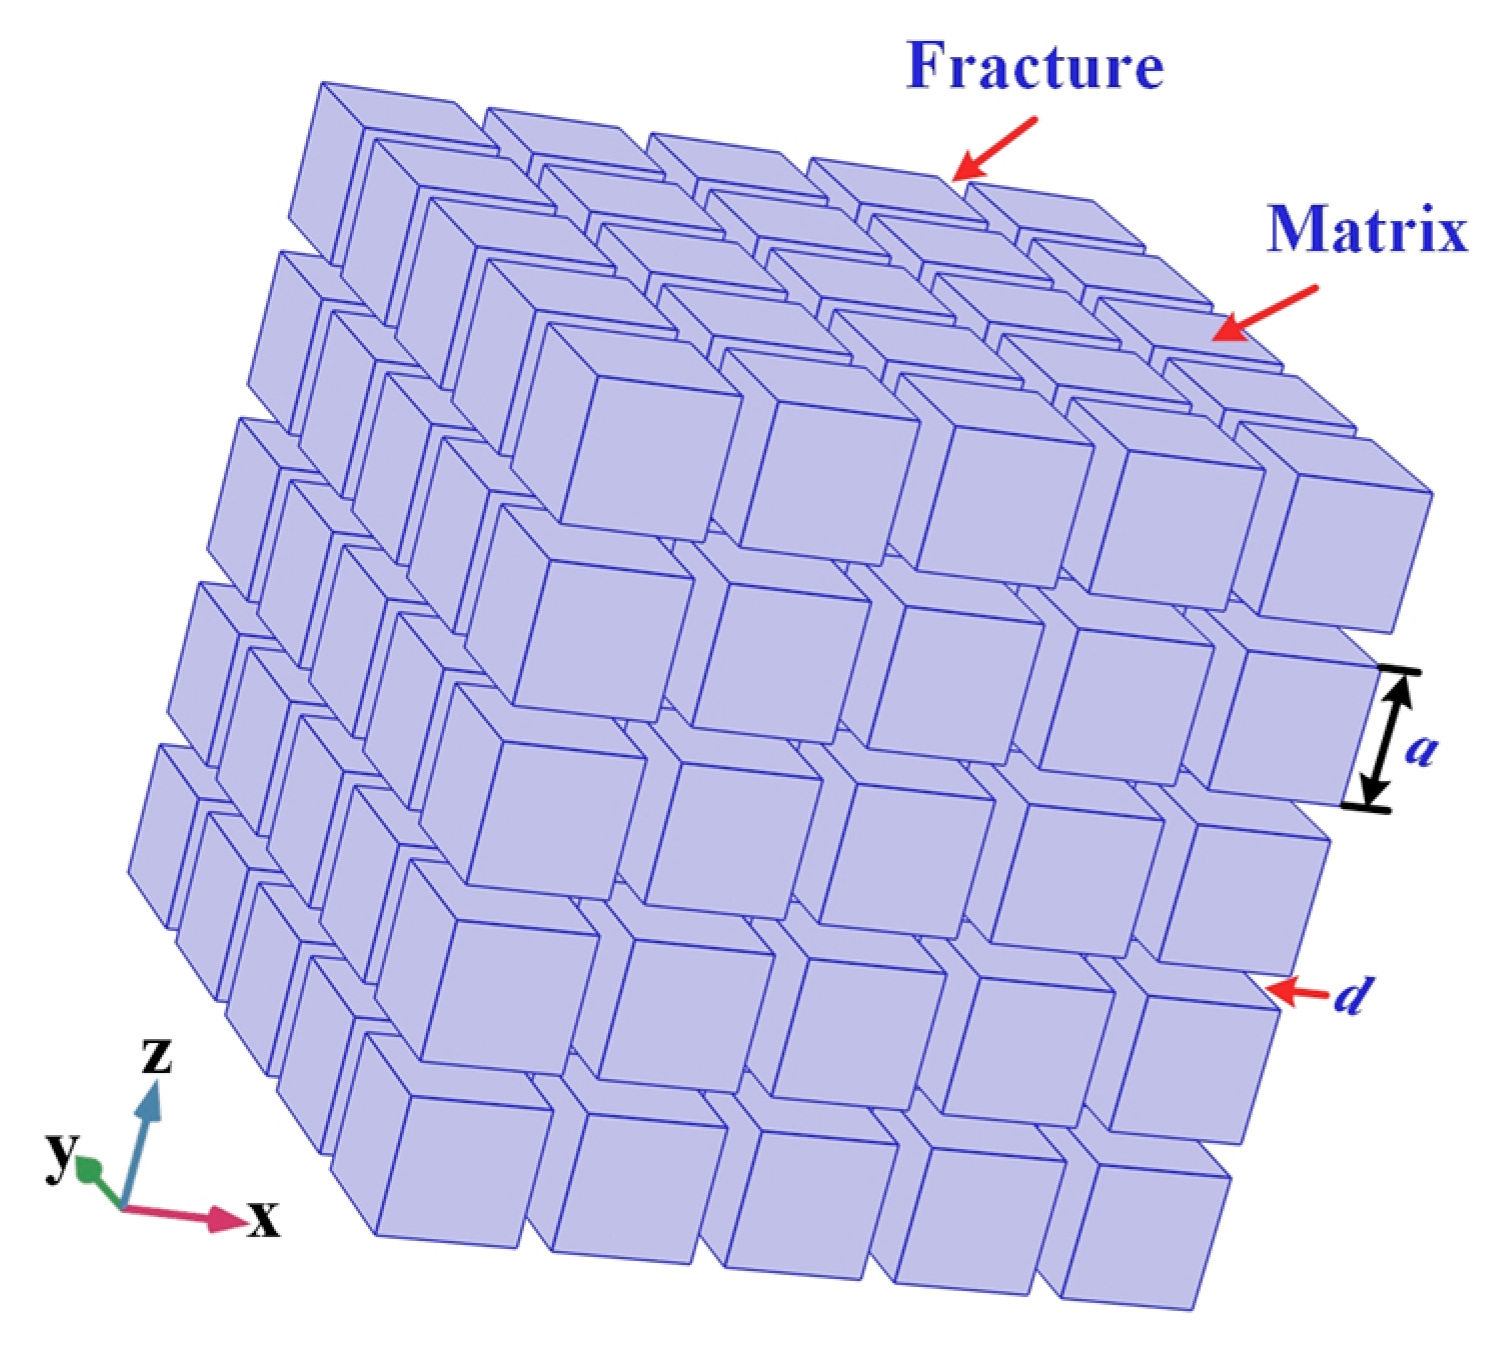
The fractured geothermal reservoir (aquifer zone) is described based on the dual-porosity theory to ensure calculational efficiency. It conceptualizes the system as two superimposed continua (see Figure 2) [12]: a matrix region providing storage capacity, and a fracture region offering dominant flow channels.
(4)
The influence of formation deformation on porosity and permeability in the reservoir is neglected.

2.2. Governing Equations

A 3D transient model that incorporates the effects of fluid gravity and viscous friction was established. A non-isothermal pipe flow framework was employed to describe the coupled flow and heat transfer processes in the wellbore. The governing flow and heat transfer behavior were formulated through the following equations:
A c ρ f t + A c ρ f u f = 0
ρ f u f t = p 1 2 f D ρ f d p u f u f ρ f g
ρ f A c c f T f 1 t + ρ f A c c f u f T f 1 A c λ f T f 1 = 1 2 f D ρ f A c d p u f u f 2 Q 1
ρ f A c c f T f 2 t + ρ f A c c f u f T f 2 A c λ f T f 2 = 1 2 f D ρ f A c d p u f u f 2 + Q 1 + Q 2
where Ac is the cross-sectional area of the flow channel in the wellbore, ρf is the fluid density, uf is the flow velocity, t is the time, fD is the Darcy friction factor, p is the pressure, g is the gravitational acceleration, dp is the hydraulic diameter of the flow channel, cf is the thermal capacity of the fluid, Tf1 is the fluid temperature in the insulated pipe, λf is the thermal conductivity of the fluid, and Tf2 is the fluid temperature in the annulus.
In Equation (3), the second and third terms on the left-hand side represent thermal convection and conduction within the circulating fluid, respectively. The first term on the right-hand side accounts for the viscous friction of the fluid. The heat source term Q1 describes the heat exchange between the produced and injected fluids, while Q2 characterizes the heat exchange between the surrounding formation and the injected fluid. Furthermore, the flow behavior within the fractured reservoir is governed by Darcy’s law. The fractured reservoir is represented by two overlapping equivalent porous domains: a high-porosity matrix and a high-permeability fracture network. For the matrix and fracture domains, the flow equations can be expressed as follows:
ρ w φ m β w + β s p m t + ρ w u m = M m f
ρ w φ f β w + β s p f t + ρ w u f = M m f
M m f = 60 ρ f k m , e f f a 2 μ f p m p f
where φm represents the matrix porosity, βw and βs are the compressibility coefficients of water and the solid matrix, respectively, pm is the matrix pressure, Mmf denotes the mass exchange from the matrix to the fractures, um is the flow velocity in the matrix, φf represents the porosity of the fracture, pf denotes the pressure in the fracture, uf is the Darcy velocity of the fracture fluid, α is the thermal diffusivity, and Km,eff is the equivalent permeability of the matrix. Mass exchange between the matrix and fracture regions is calculated according to the Warren–Root solution [12]. For the thermal process in the fractured reservoir, the energy equations for the matrix solid phase, matrix fluid, and fracture fluid are expressed as follows:
1 φ m φ f ρ s C s T s t 1 φ m φ f λ s T s = Q m s + Q f s
φ m ρ f C f T w m t + ρ f C f u m T w m φ m λ f T w m = Q m s Q m f
φ f ρ f C f T w f t + ρ f C f u f T w f φ f λ f T w f = Q f s + Q m f
where φf is the fracture porosity; Ts is the solid temperature; Qms denotes the heat exchange between the matrix fluid and the solid component; Qfs represents the heat exchange between the fracture fluid and the solid component; ρs is the solid density; Cs is the solid heat capacity; λs denotes the solid thermal conductivity; Twm denotes the temperature of the matrix fluid; Qmf denotes the heat exchange between the matrix fluid and the fracture fluid, which is influenced by mass exchange; and Twf denotes the temperature of the fracture fluid. Furthermore, it is worth noting that Equations (8)–(10) include three source terms characterizing inter-medium heat exchange, which can be determined by
Q m s = h m s A m T w m T s
Q f s = h m f A f T w f T s
Q m f = M m f C w T w m T w f
where hrm denotes the heat transfer coefficient between the solid component and matrix fluid, Am is the specific transfer area of the matrix, hmf denotes the heat transfer coefficient between the solid component and the fracture fluid, Af is the specific transfer area of the fractures, and Qmf is determined by the mass transfer between fractures and matrix. In the porous matrix, hms and hmf can be analytically evaluated assuming a packed bed of spherical particles. Thermal power is introduced to quantify the heat extraction rate in the geothermal system:
P = 10 6 ρ w q o u t C w , o u t T o u t ρ w q i n C w , i n T i n
where P is the thermal power of a geothermal system, and q is the volumetric flow rate of the circulating fluid. The subscripts “out” and “in” denote the physical variables of the produced fluid and the injected fluid, respectively.

2.3. Geometric Model

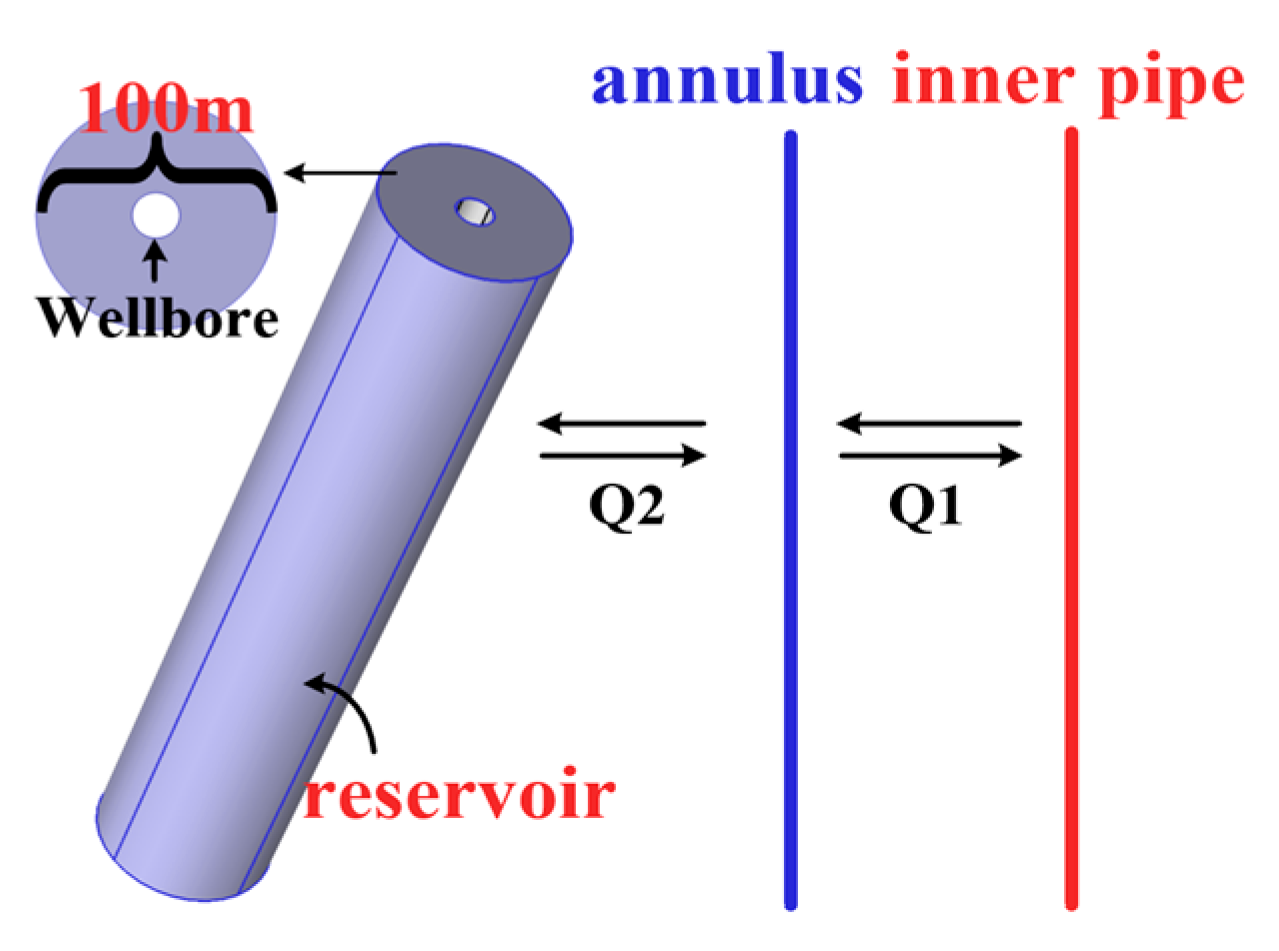
The research was conducted on a geothermal field in Xiongan New Area, Hebei Province, which serves as a representative case of medium-to-deep geothermal resources in China [19,20]. The geometric models were constructed separately for the wellbore and the reservoir, based on the underground conditions in Xiongan New Area. To balance computational efficiency with sufficient accuracy, the wellbore geometry was simplified. Figure 3 illustrates the geometric model of the upper wellbore. The surrounding formation is modeled as a 3D cylinder with a radius of 100 m and a height of 1700 m. Within the model, the inner pipe and annulus are represented as 1D line elements. By computing the coupling variables Q1 and Q2, the inner pipe, annulus, and formation are integrated to establish the wellbore model. Since the wellbore–formation interface is a 3D surface, whereas the annulus and inner pipe are one-dimensional, the calculation of Q1 and Q2 requires transferring temperature data across entities of different dimensions, and a line-integral approach is adopted to obtain average values for coupling. The average wellbore wall temperature at each depth is computed via line integration and combined with the corresponding annulus temperature to determine Q2. Heat transfer between the annulus and the surrounding formation is implemented through a heat flux boundary condition.
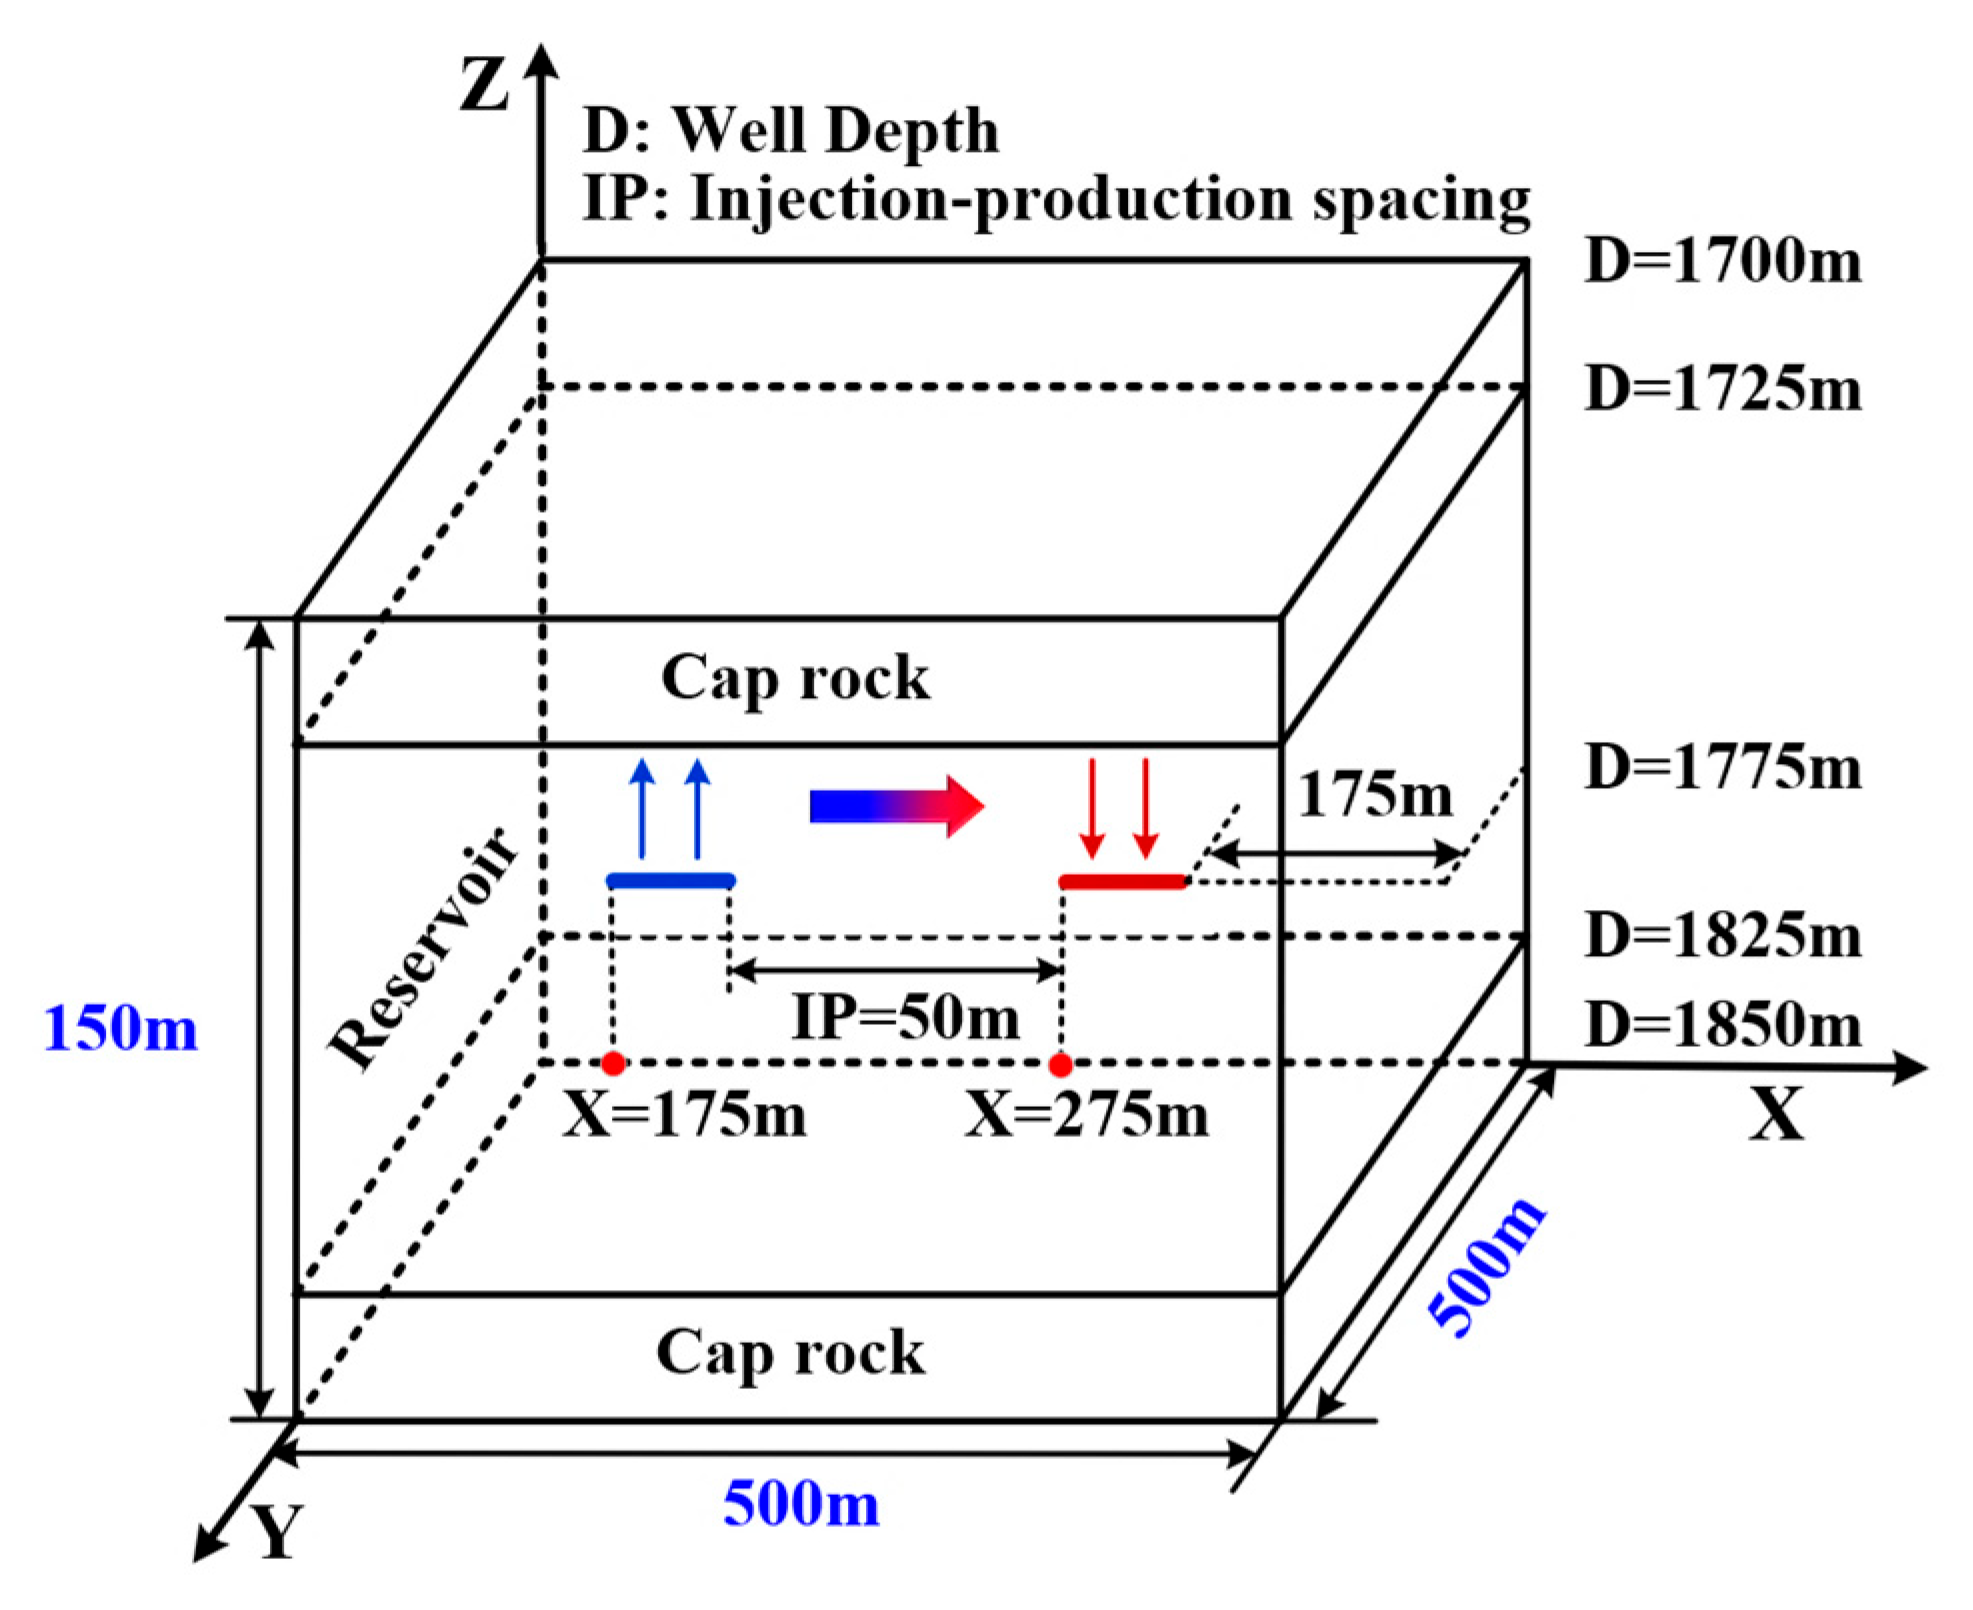
Table 1 presents the input parameters for the upper wellbore model [8,21]. Figure 4 illustrates the typical structure of a geothermal reservoir, which includes the horizontal well’s injection and production sections, the fractured reservoir, and the overlying cap rock. The cap rock is a low-permeability, dense, porous medium, whereas the fractured reservoir exhibits high permeability, where the majority of fluid flow and heat transfer occurs. Furthermore, the reservoir considered in this study is located at a depth of 1700–1850 m, with dimensions of 500 m × 500 m × 150 m. The cap rock and fractured reservoir have heights of 100 m and 25 m, respectively. The horizontal well is positioned at the center of the fractured reservoir, with both the injection and production sections measuring 50 m in length and the injection–production spacing set to 50 m. Silica aerogel is adopted as the insulation material for the central pipe, owing to its outstanding thermal insulation performance [22].

2.4. Initial and Boundary Conditions for the Numerical Model

The fractured reservoir located at a depth of 1000–1700 m was assigned the properties listed in Table 2. In contrast, for the depth range of 0–1000 m, the formation properties were assumed to match those of the cap rock, as specified in Table 2.

2.5. Numerical Calculation

The governing equations were numerically solved in the finite element software COMSOL Multiphysics. First, the equations were spatially discretized using numerical meshing. Next, the wellbore bottom served as the coupling interface between the wellbore model and the fractured reservoir model, ensuring the continuity of physical variables, including temperature, pressure, and flow rate. Finally, the numerical results were obtained using an iterative approach.
The spatial discretization is illustrated in Figure 5. For the wellbore model, triangular elements were initially generated on the top surface of the surrounding formation and subsequently swept along the z-axis to form triangular prism elements, reducing the total number of grids. The 1D line segments representing the inner pipe and annulus were evenly discretized along the vertical direction using edge elements. For the reservoir model, quadrilateral elements were first generated on the side surfaces and then swept along the z-axis to form hexahedral elements. To improve accuracy in regions of high velocity and pressure gradients near the wellbore, local mesh refinement was applied. The simulation considered a 120-day production period, corresponding to winter operation, with a time step of 0.1 day. Numerical solutions were obtained using the Newton–Raphson iteration method, with a relative tolerance of 10−6 set as the convergence criterion.

2.6. The Validation for the Numerical Model

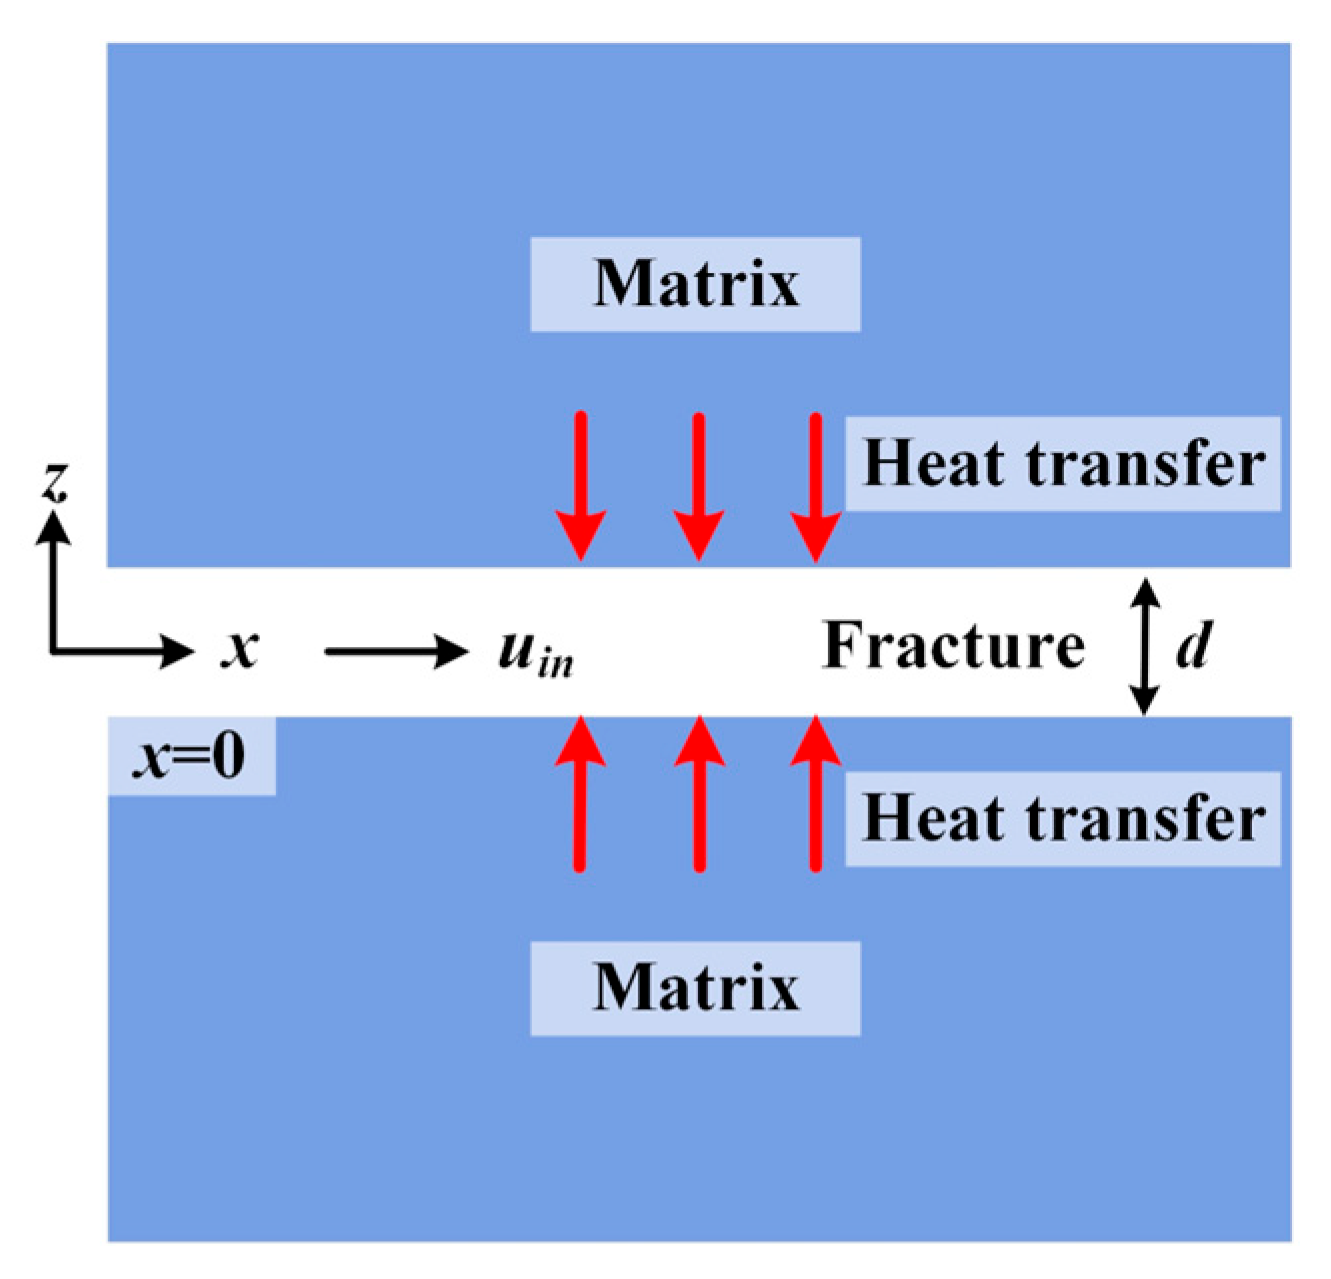
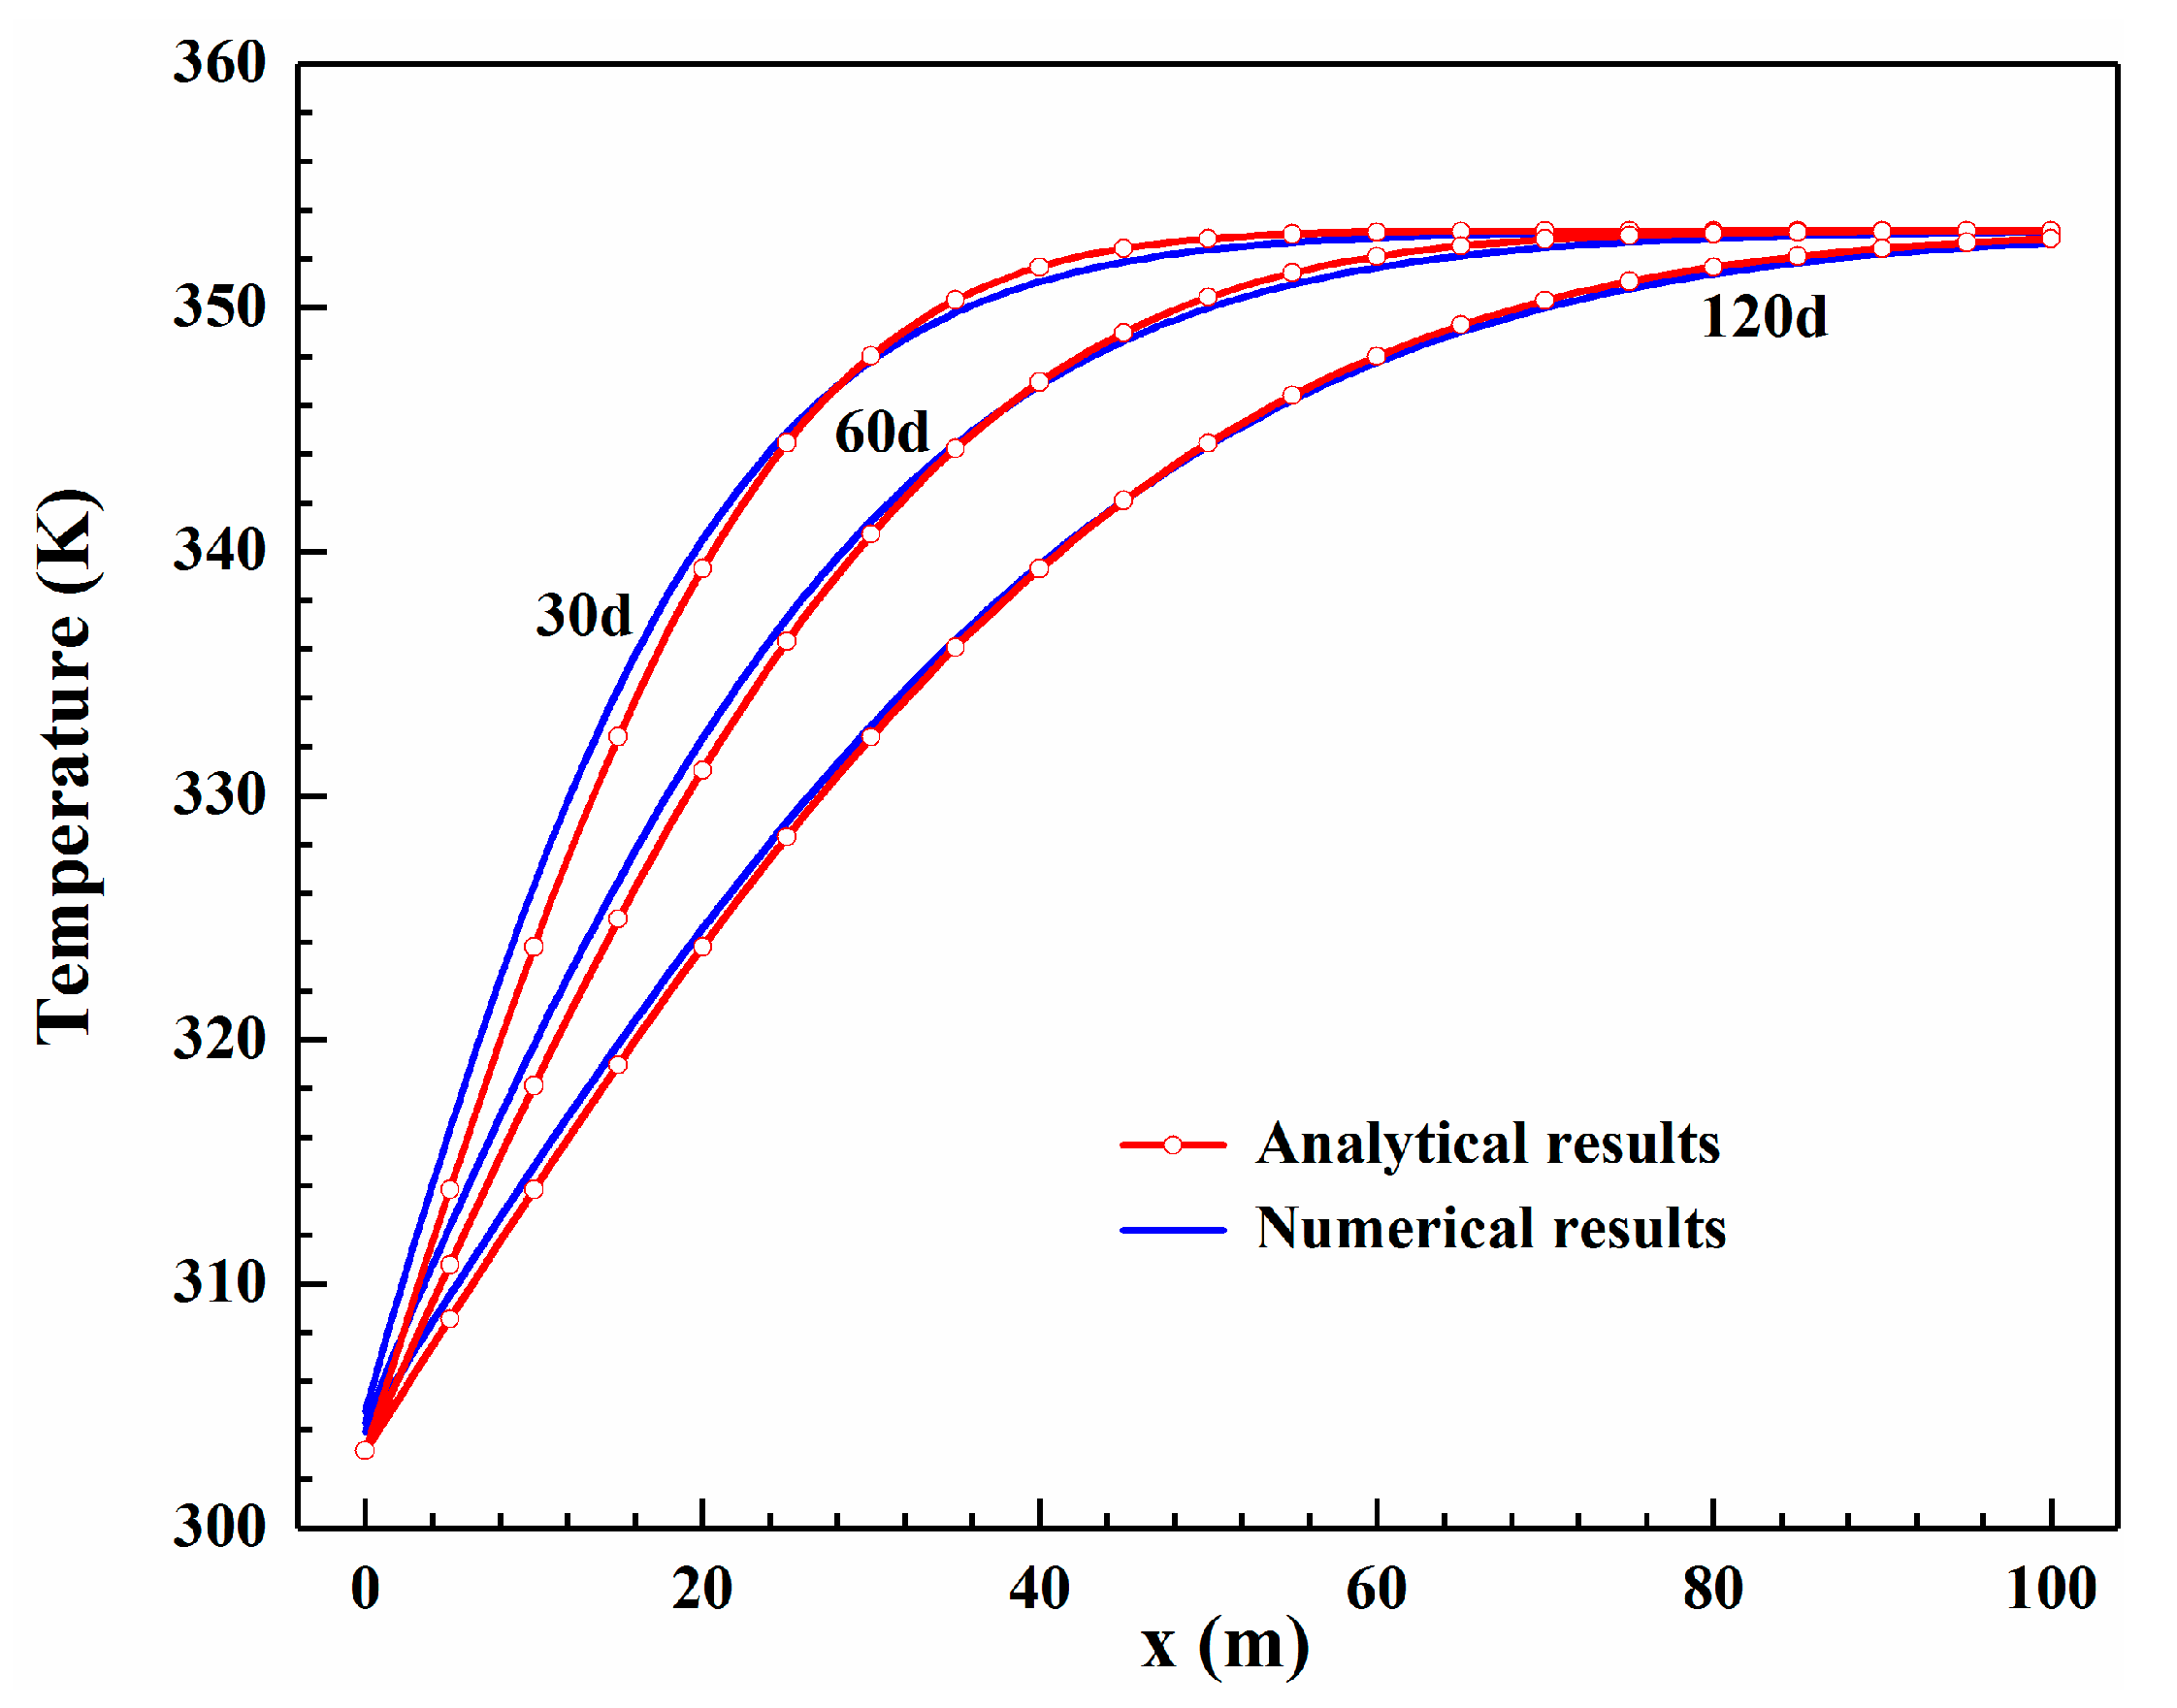
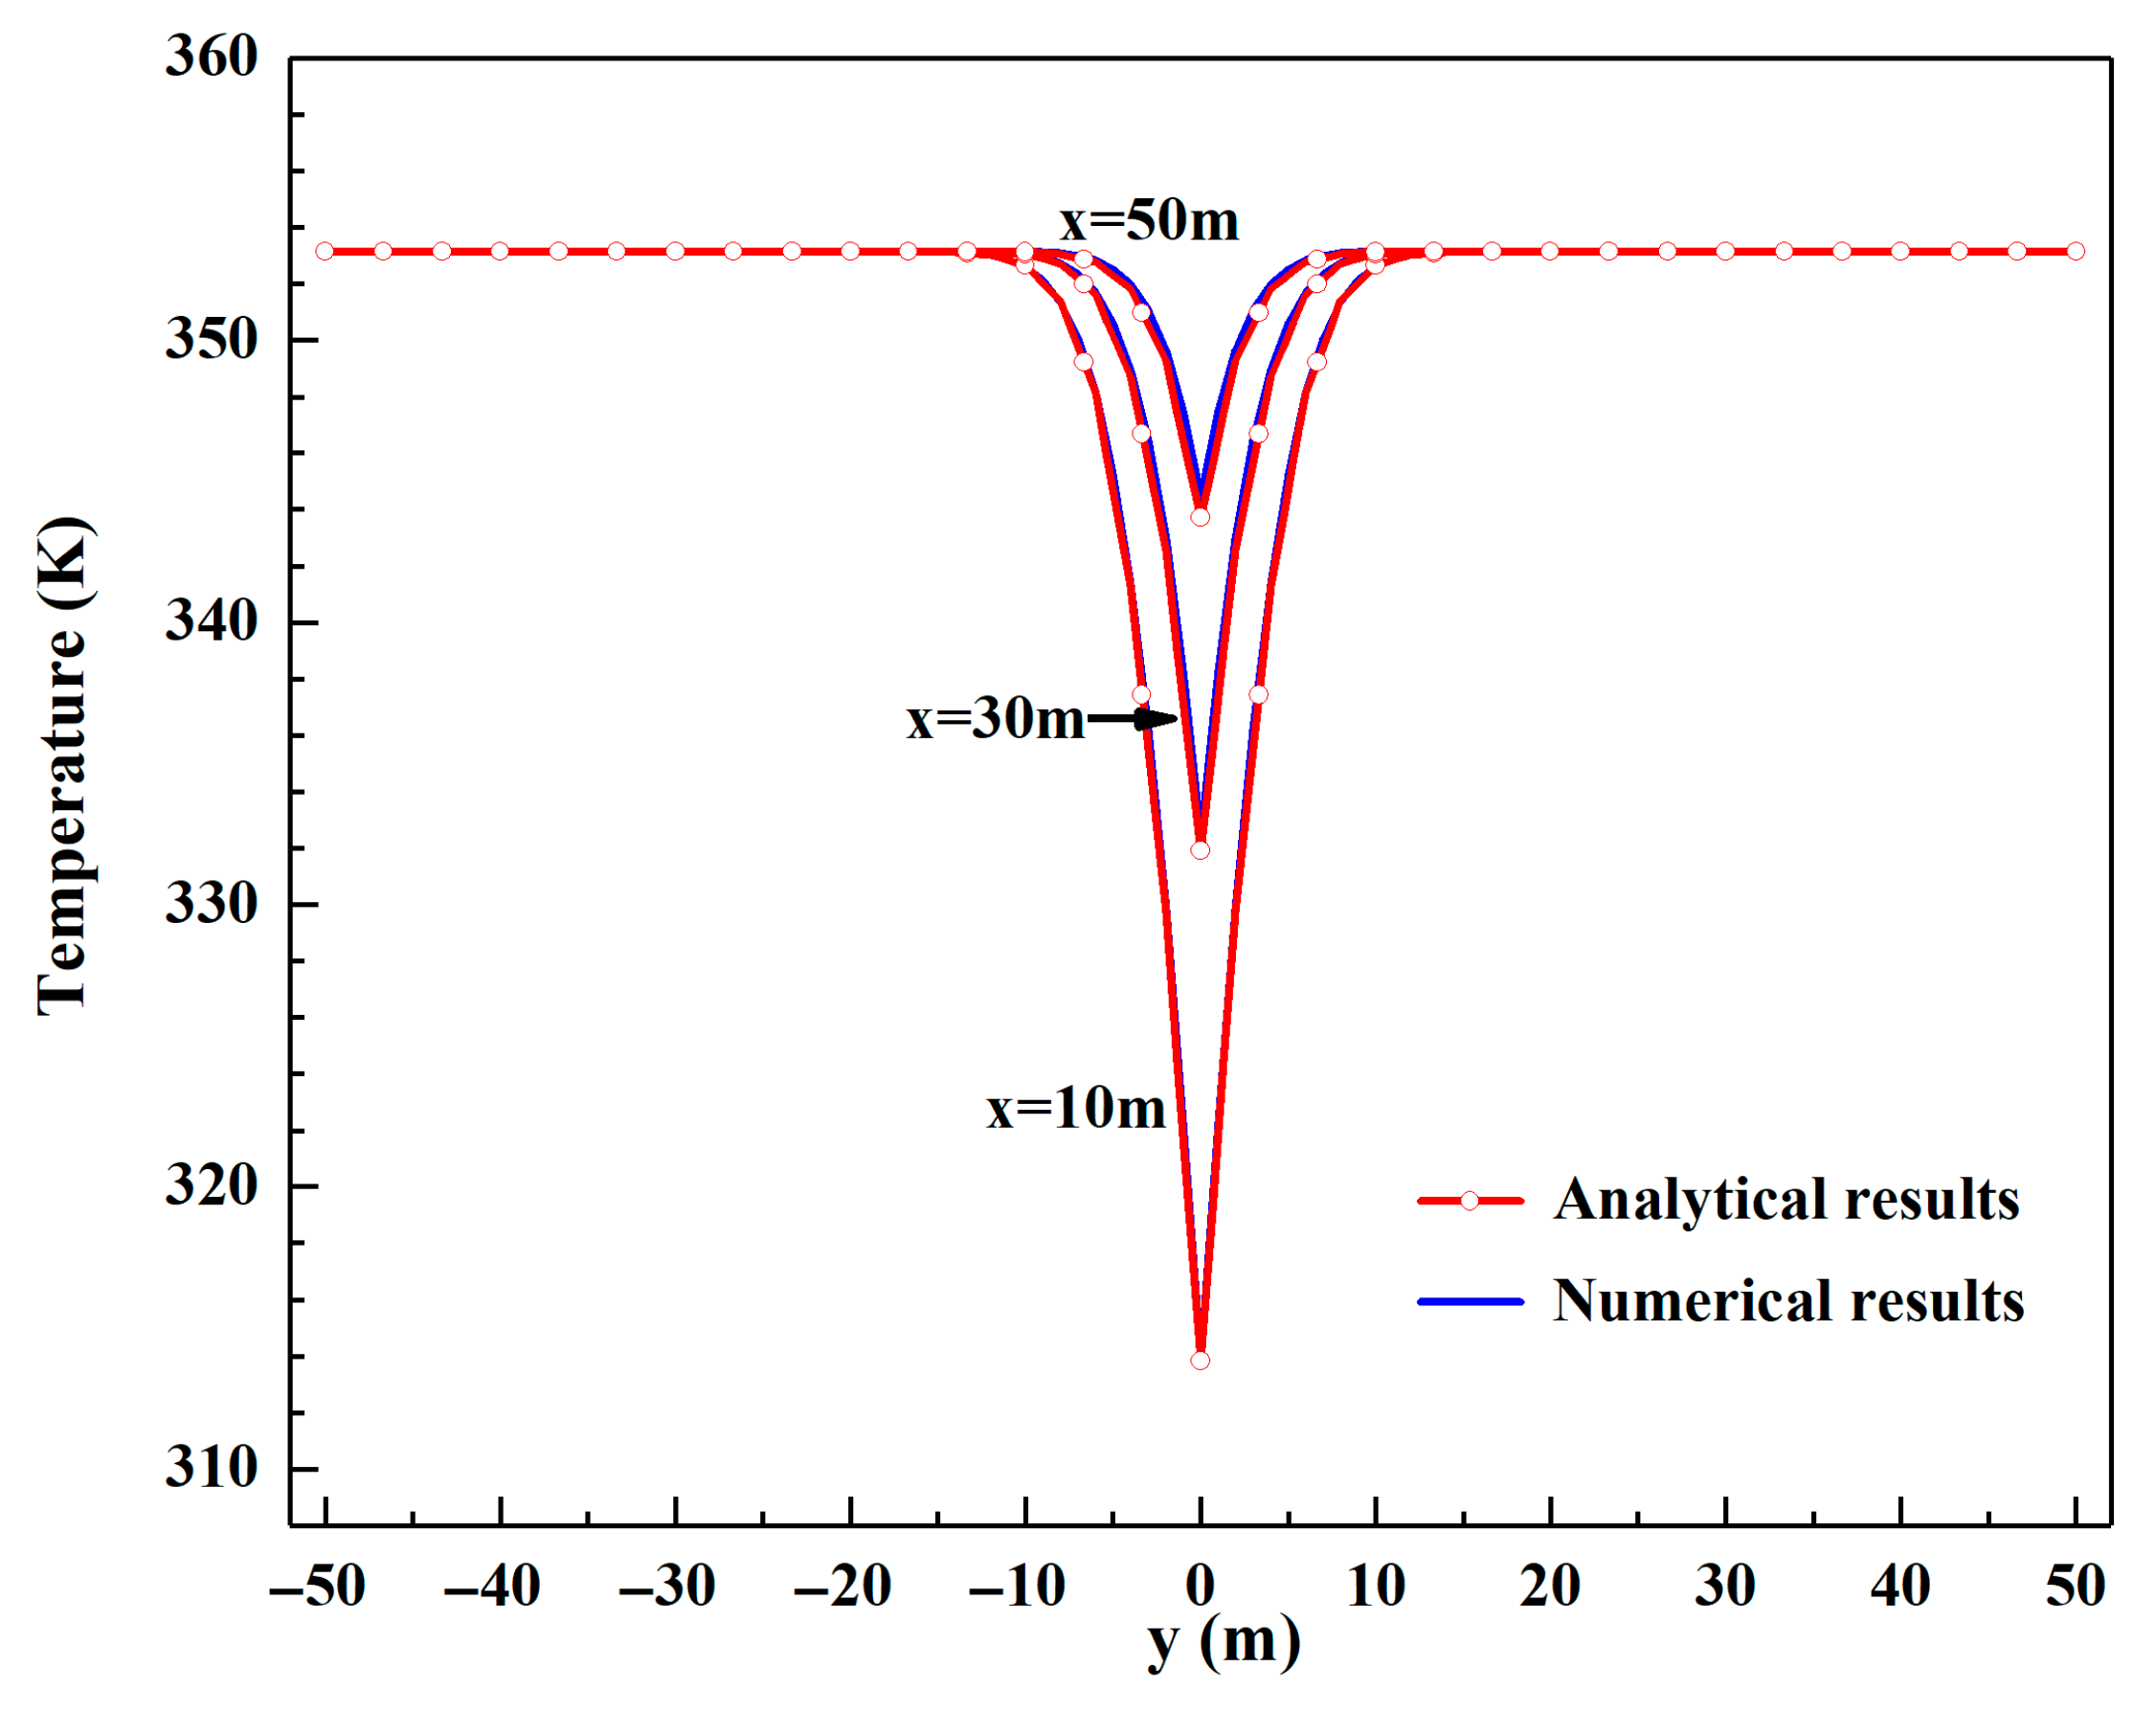
Currently, there is a lack of experimental data concerning open-loop geothermal systems with horizontal wells in geothermal fields. Consequently, a rigorous analytical solution was adopted to verify the proposed model, which is a conventional procedure of the researchers [17,18]. It characterizes the temperature variation in a 2D fracture, as depicted in Figure 6. Specifically, low-temperature fluid is injected into the fracture, while heat is transferred from the adjacent matrix. To derive an exact solution, the matrix is assumed to be impermeable and semi-infinite. The temperature of the fracture fluid and the surrounding matrix is formulated as follows [23]:
T f = T i + T i n T i e r f c λ s x / ρ f c f d u i n u i n t x λ s / ρ s c s U t x u i n
T r o c k = T i + T i n T i e r f c 2 λ s x + d u i n ρ f c f y 2 d u i n ρ f c f u i n ρ s c s λ s u i n t x
where erfc denotes the complementary error function and U is the unit step function. The specific parameters are listed in Table 3.
A numerical solution for the 2D fracture system was computed using the governing equations presented in this study. The computational domain comprised a rectangular region discretized into 100 m × 100 m segments. Figure 7 and Figure 8 exhibit highly consistent agreement between the analytical and numerical solutions, thereby validating the reliability of the proposed model. The proposed model is thus suitable for production analysis.
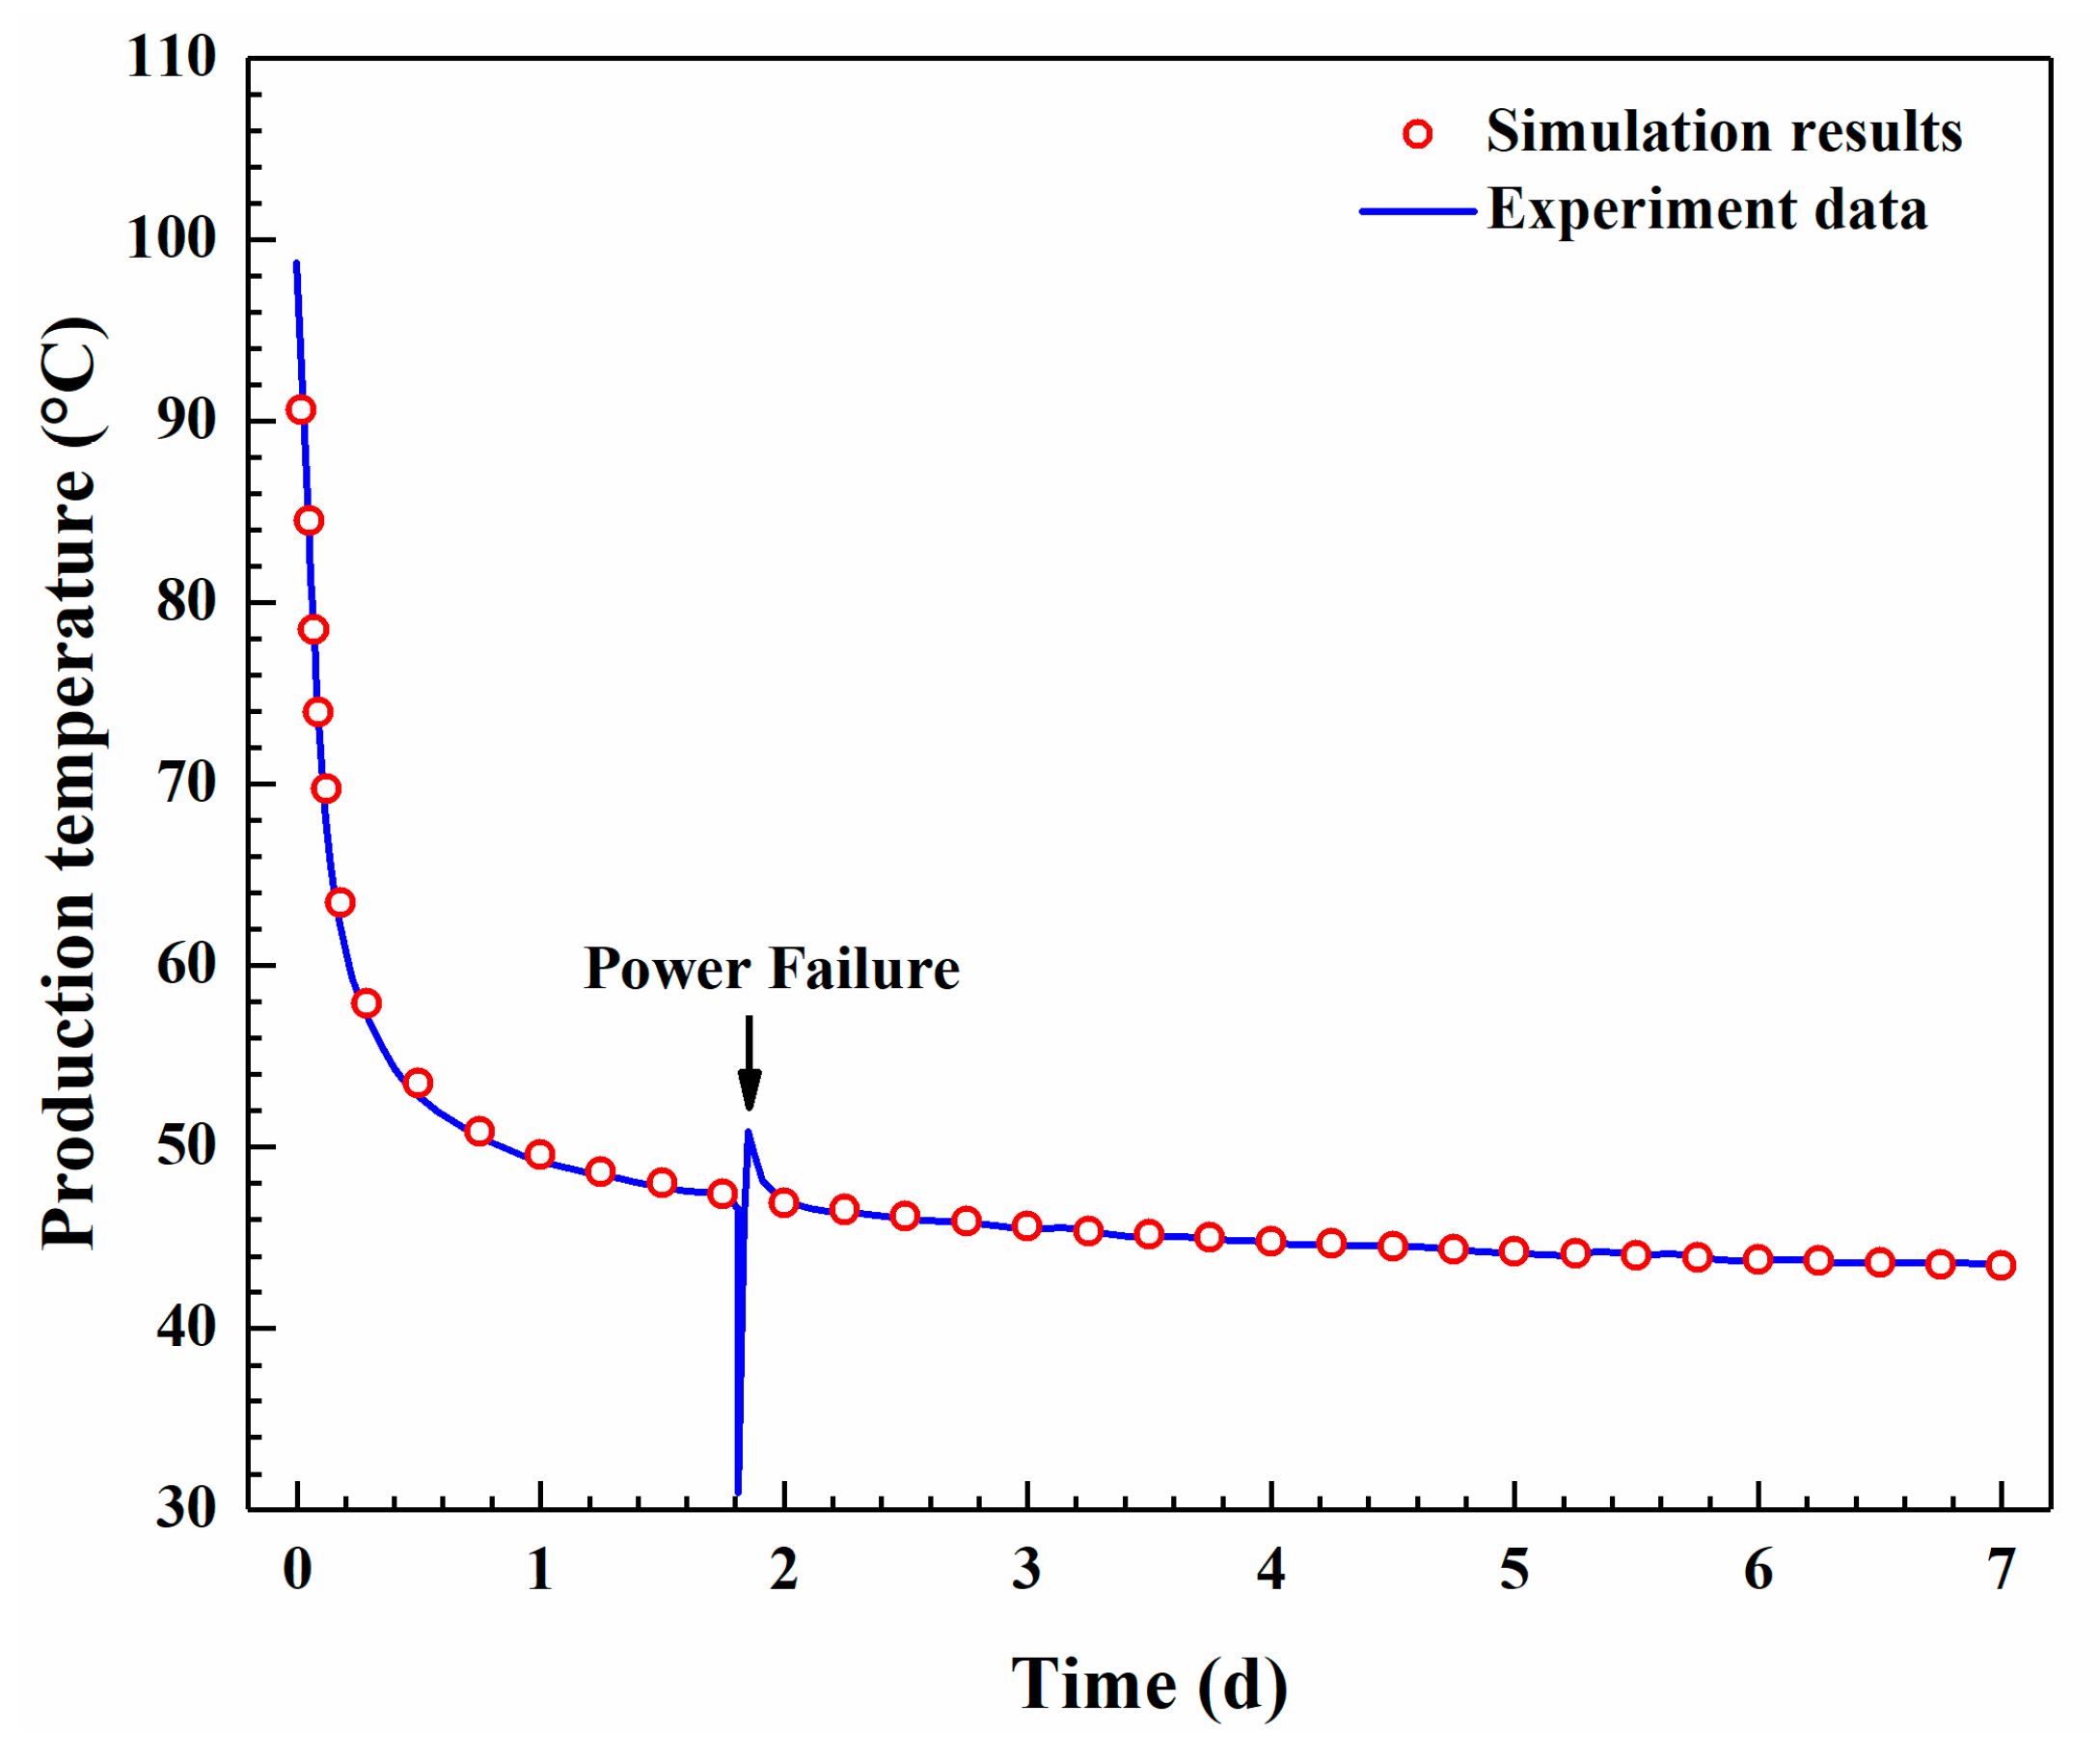
Field measurements from the HGP-A geothermal well in Hawaii were employed to verify the model’s reliability in simulating wellbore heat transfer [24]. In this test, cold fluid is injected through the annulus and produced via the inner tubing, forming a closed circulation confined within the wellbore. The well has a total depth of 876.5 m. During the operation, the injection rate is maintained at 80 L/min, and the inlet fluid temperature is fixed at 30 °C. The detailed operational and wellbore parameters are summarized in Table 4. A comparison between the simulated and measured outlet temperatures is presented in Figure 9. The results demonstrate a high level of consistency, with a maximum deviation of only 0.25 °C after 7 days of operation. This close agreement confirms that the developed model provides reliable predictive capability and is suitable for analyzing heat extraction performance.

3. Results

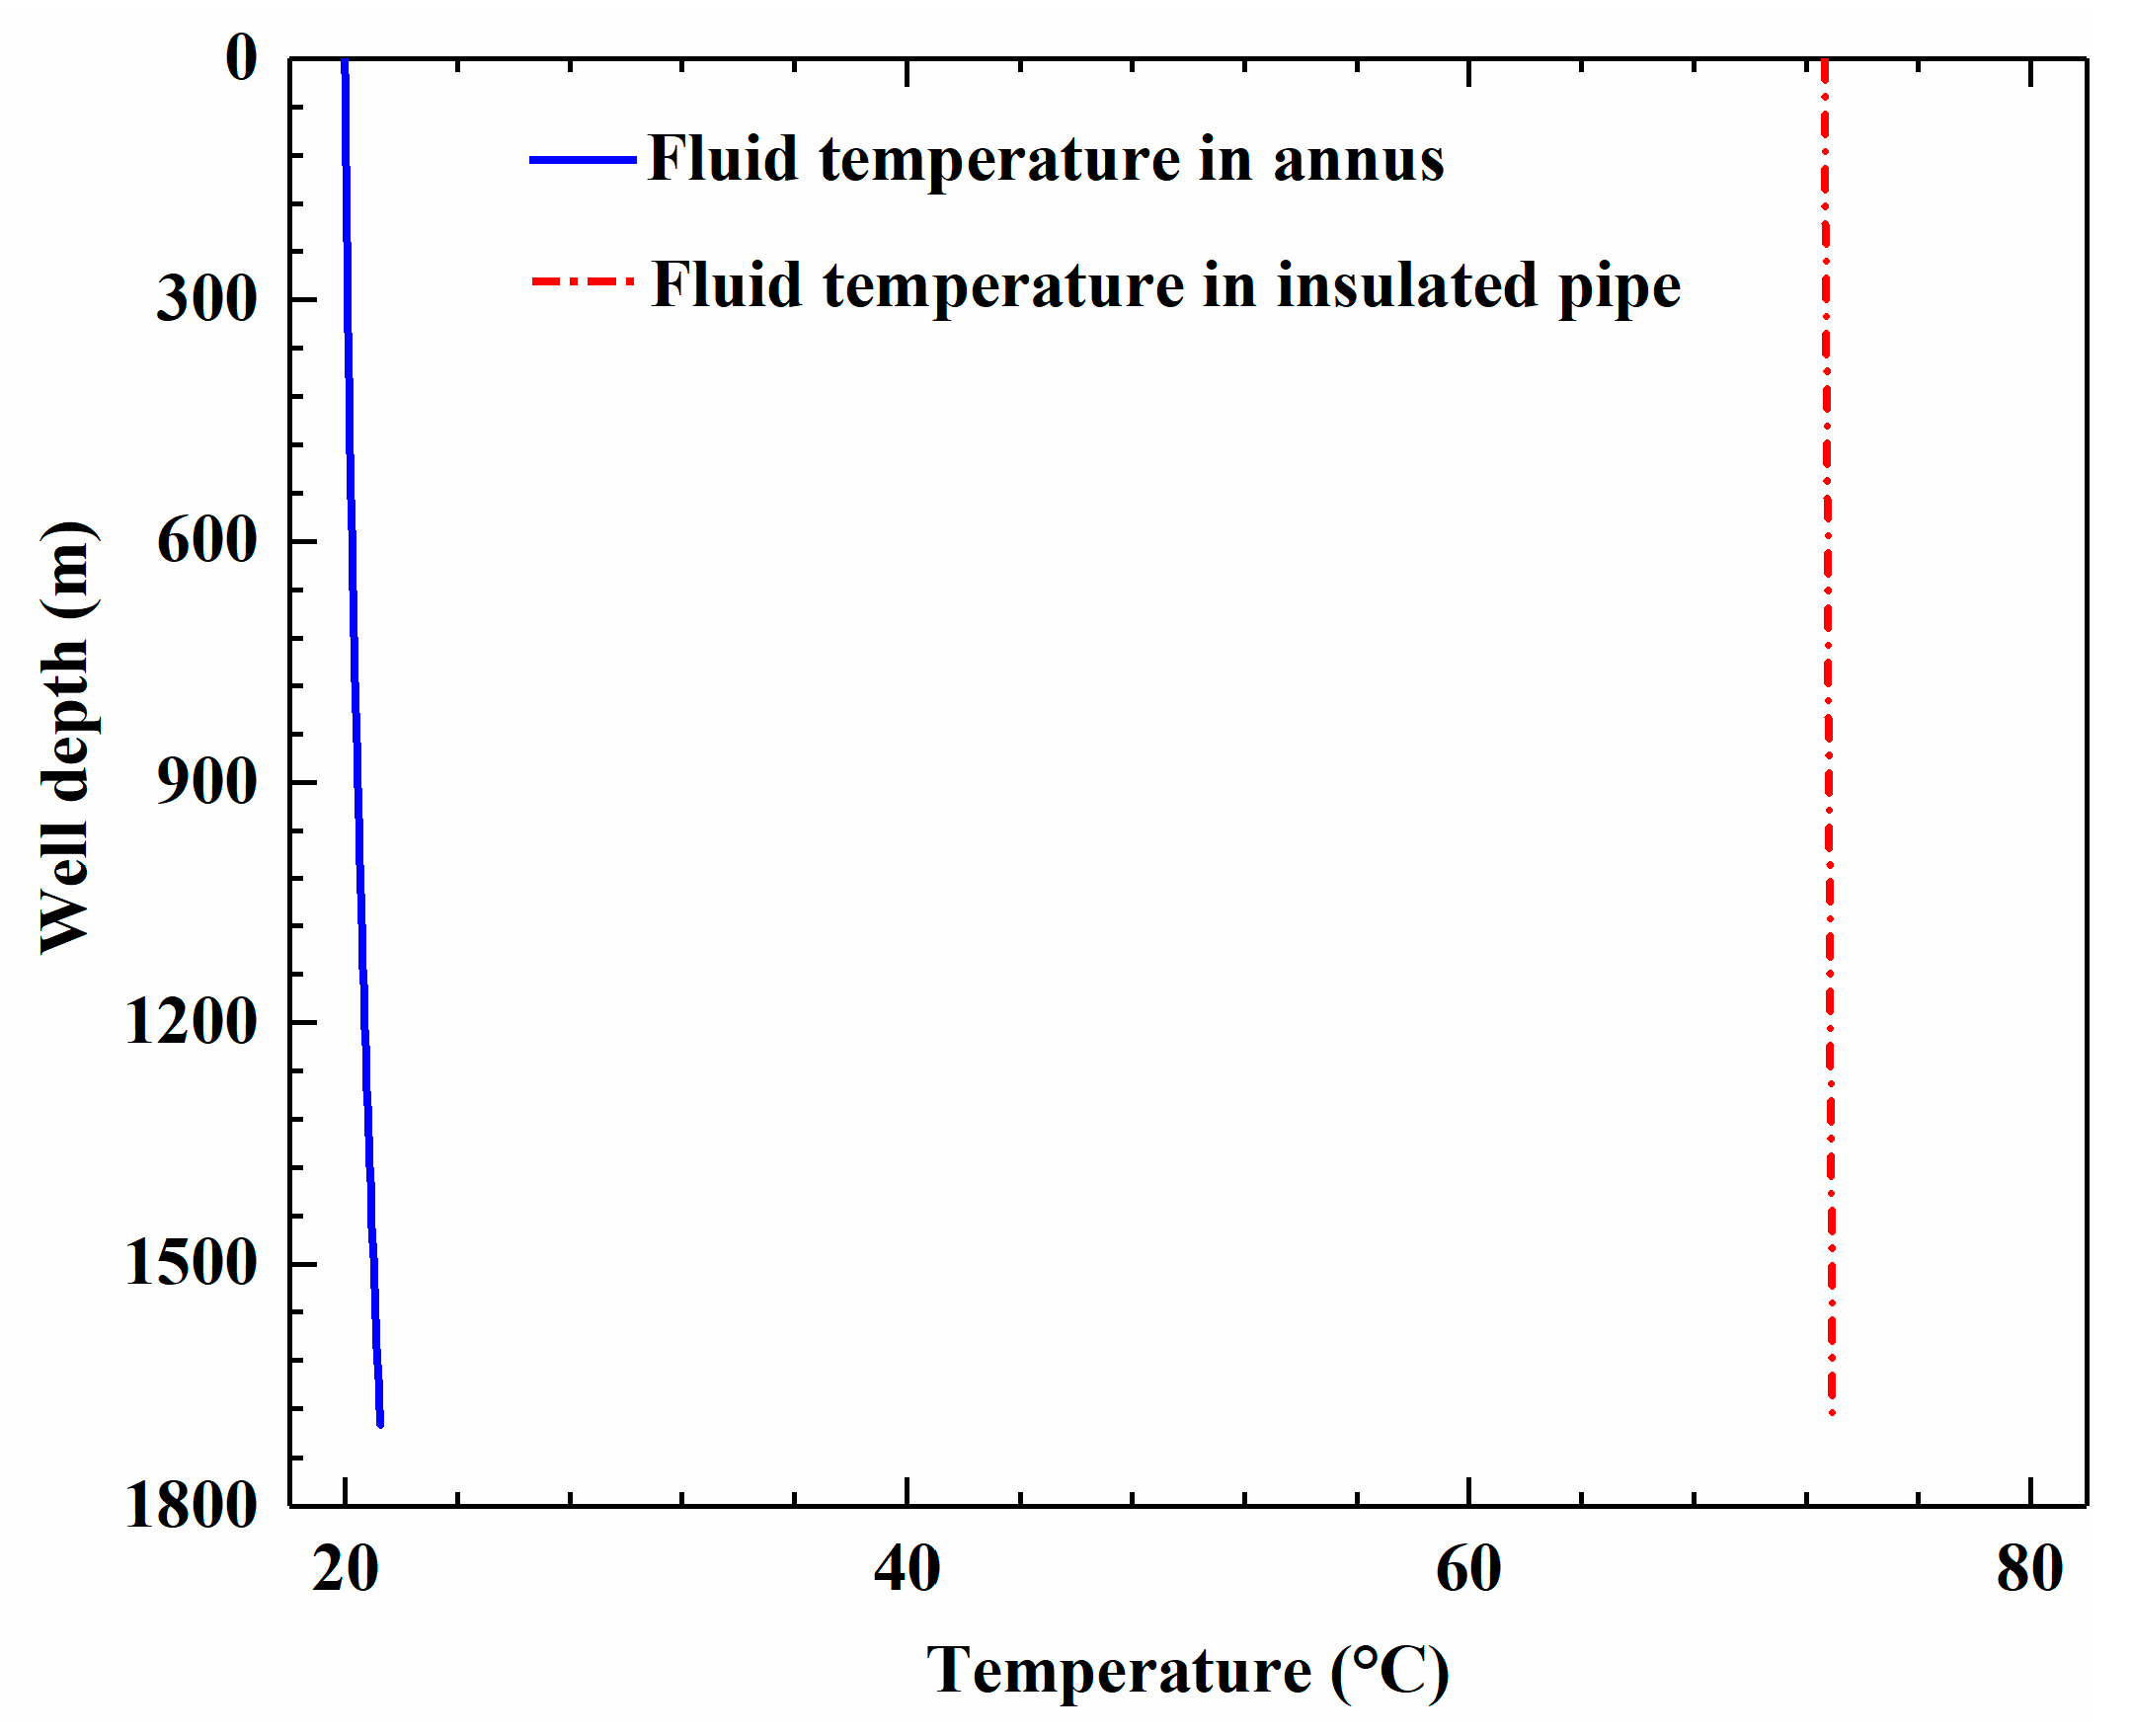
Figure 10 illustrates the temperature distribution within the wellbore. Along the well depth, the temperature of the annular fluid gradually increases, although the increment remains small, reaching only 1.24 °C after 120 days. This is primarily because the high-temperature formation is located at greater depths, resulting in a limited heat transfer zone between the wellbore and the surrounding formation. It is also noteworthy that the temperature of the inner pipe fluid remains nearly constant during its upward flow to the surface, with a decrease of only 0.29 °C after 120 days, demonstrating the excellent thermal insulation performance of the inner pipe. Furthermore, Figure 9 shows that the fluid increase in the reservoir can exceed 50 °C, which indicates that the reservoir is the main heat extraction region.

3.1. Influences of Various Wellbore Parameters

The influences of four wellbore parameters—the thermal conductivity, thickness, and diameter of the insulated pipe, and the injection–production spacing—on the production performance of the open-loop geothermal system were investigated. The insulation pipe affects the heat losses of the produced fluid, while the injection–production spacing plays an important role in the heat extraction in the reservoir.

3.1.1. Influence of the Thermal Conductivity of the Insulated Pipe

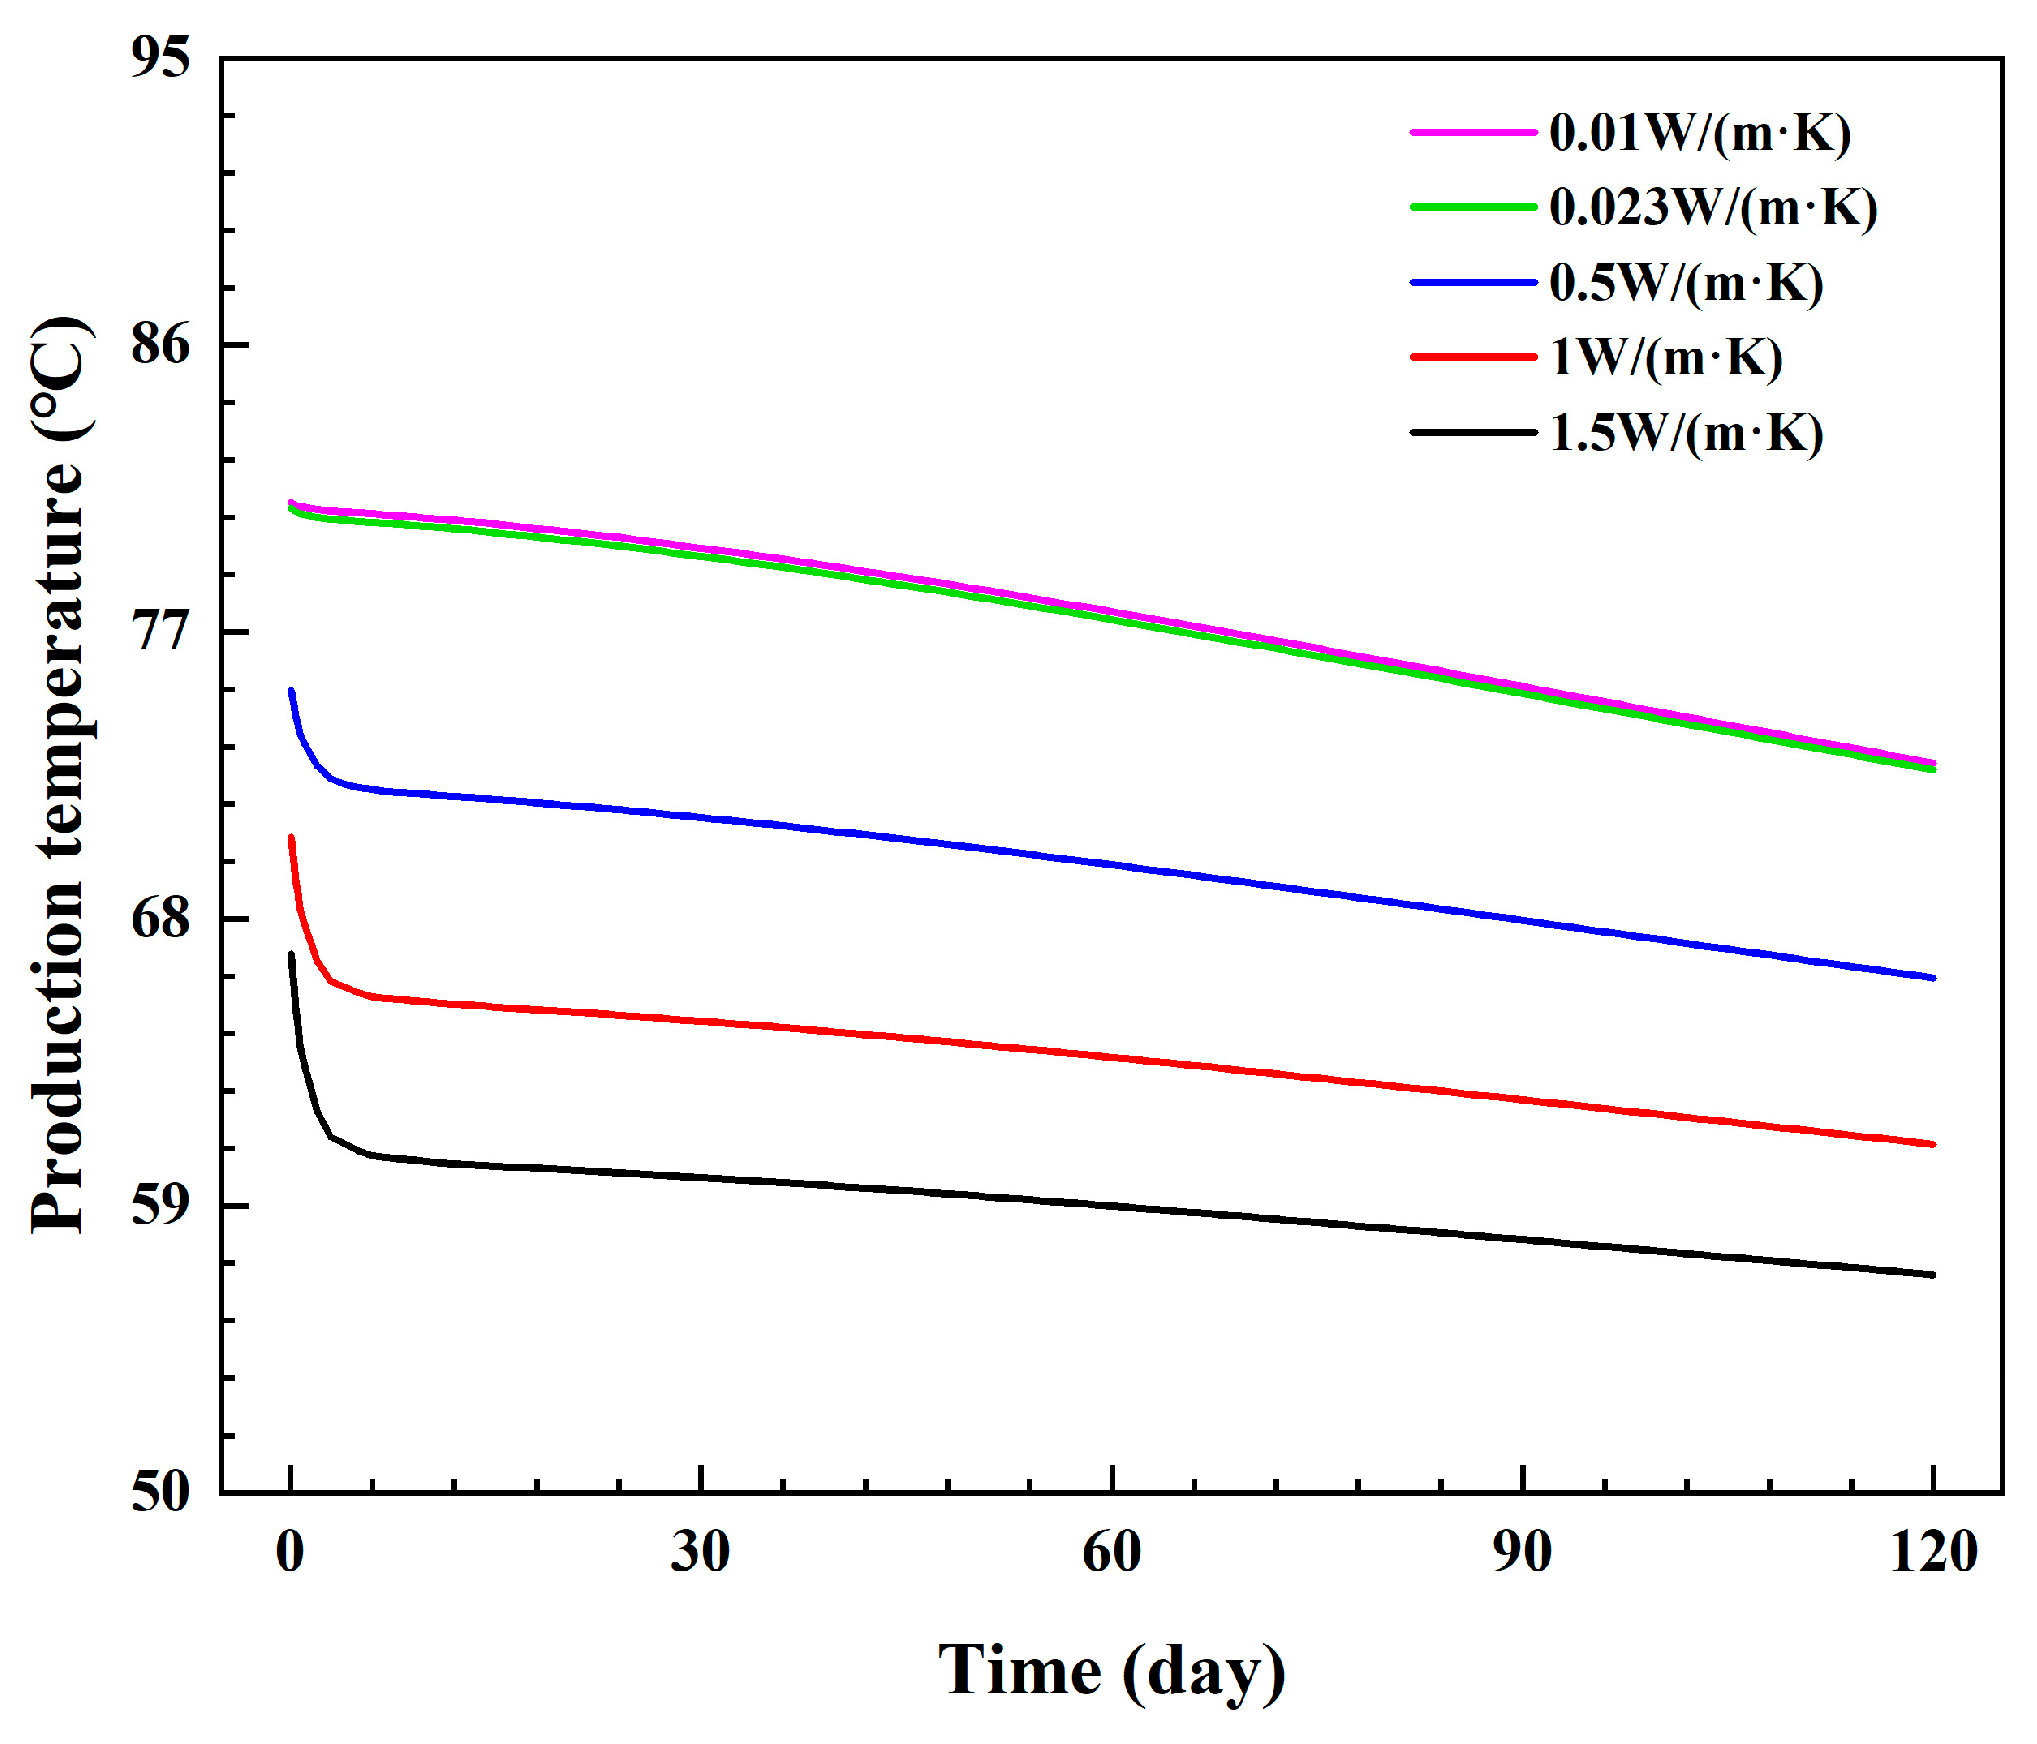
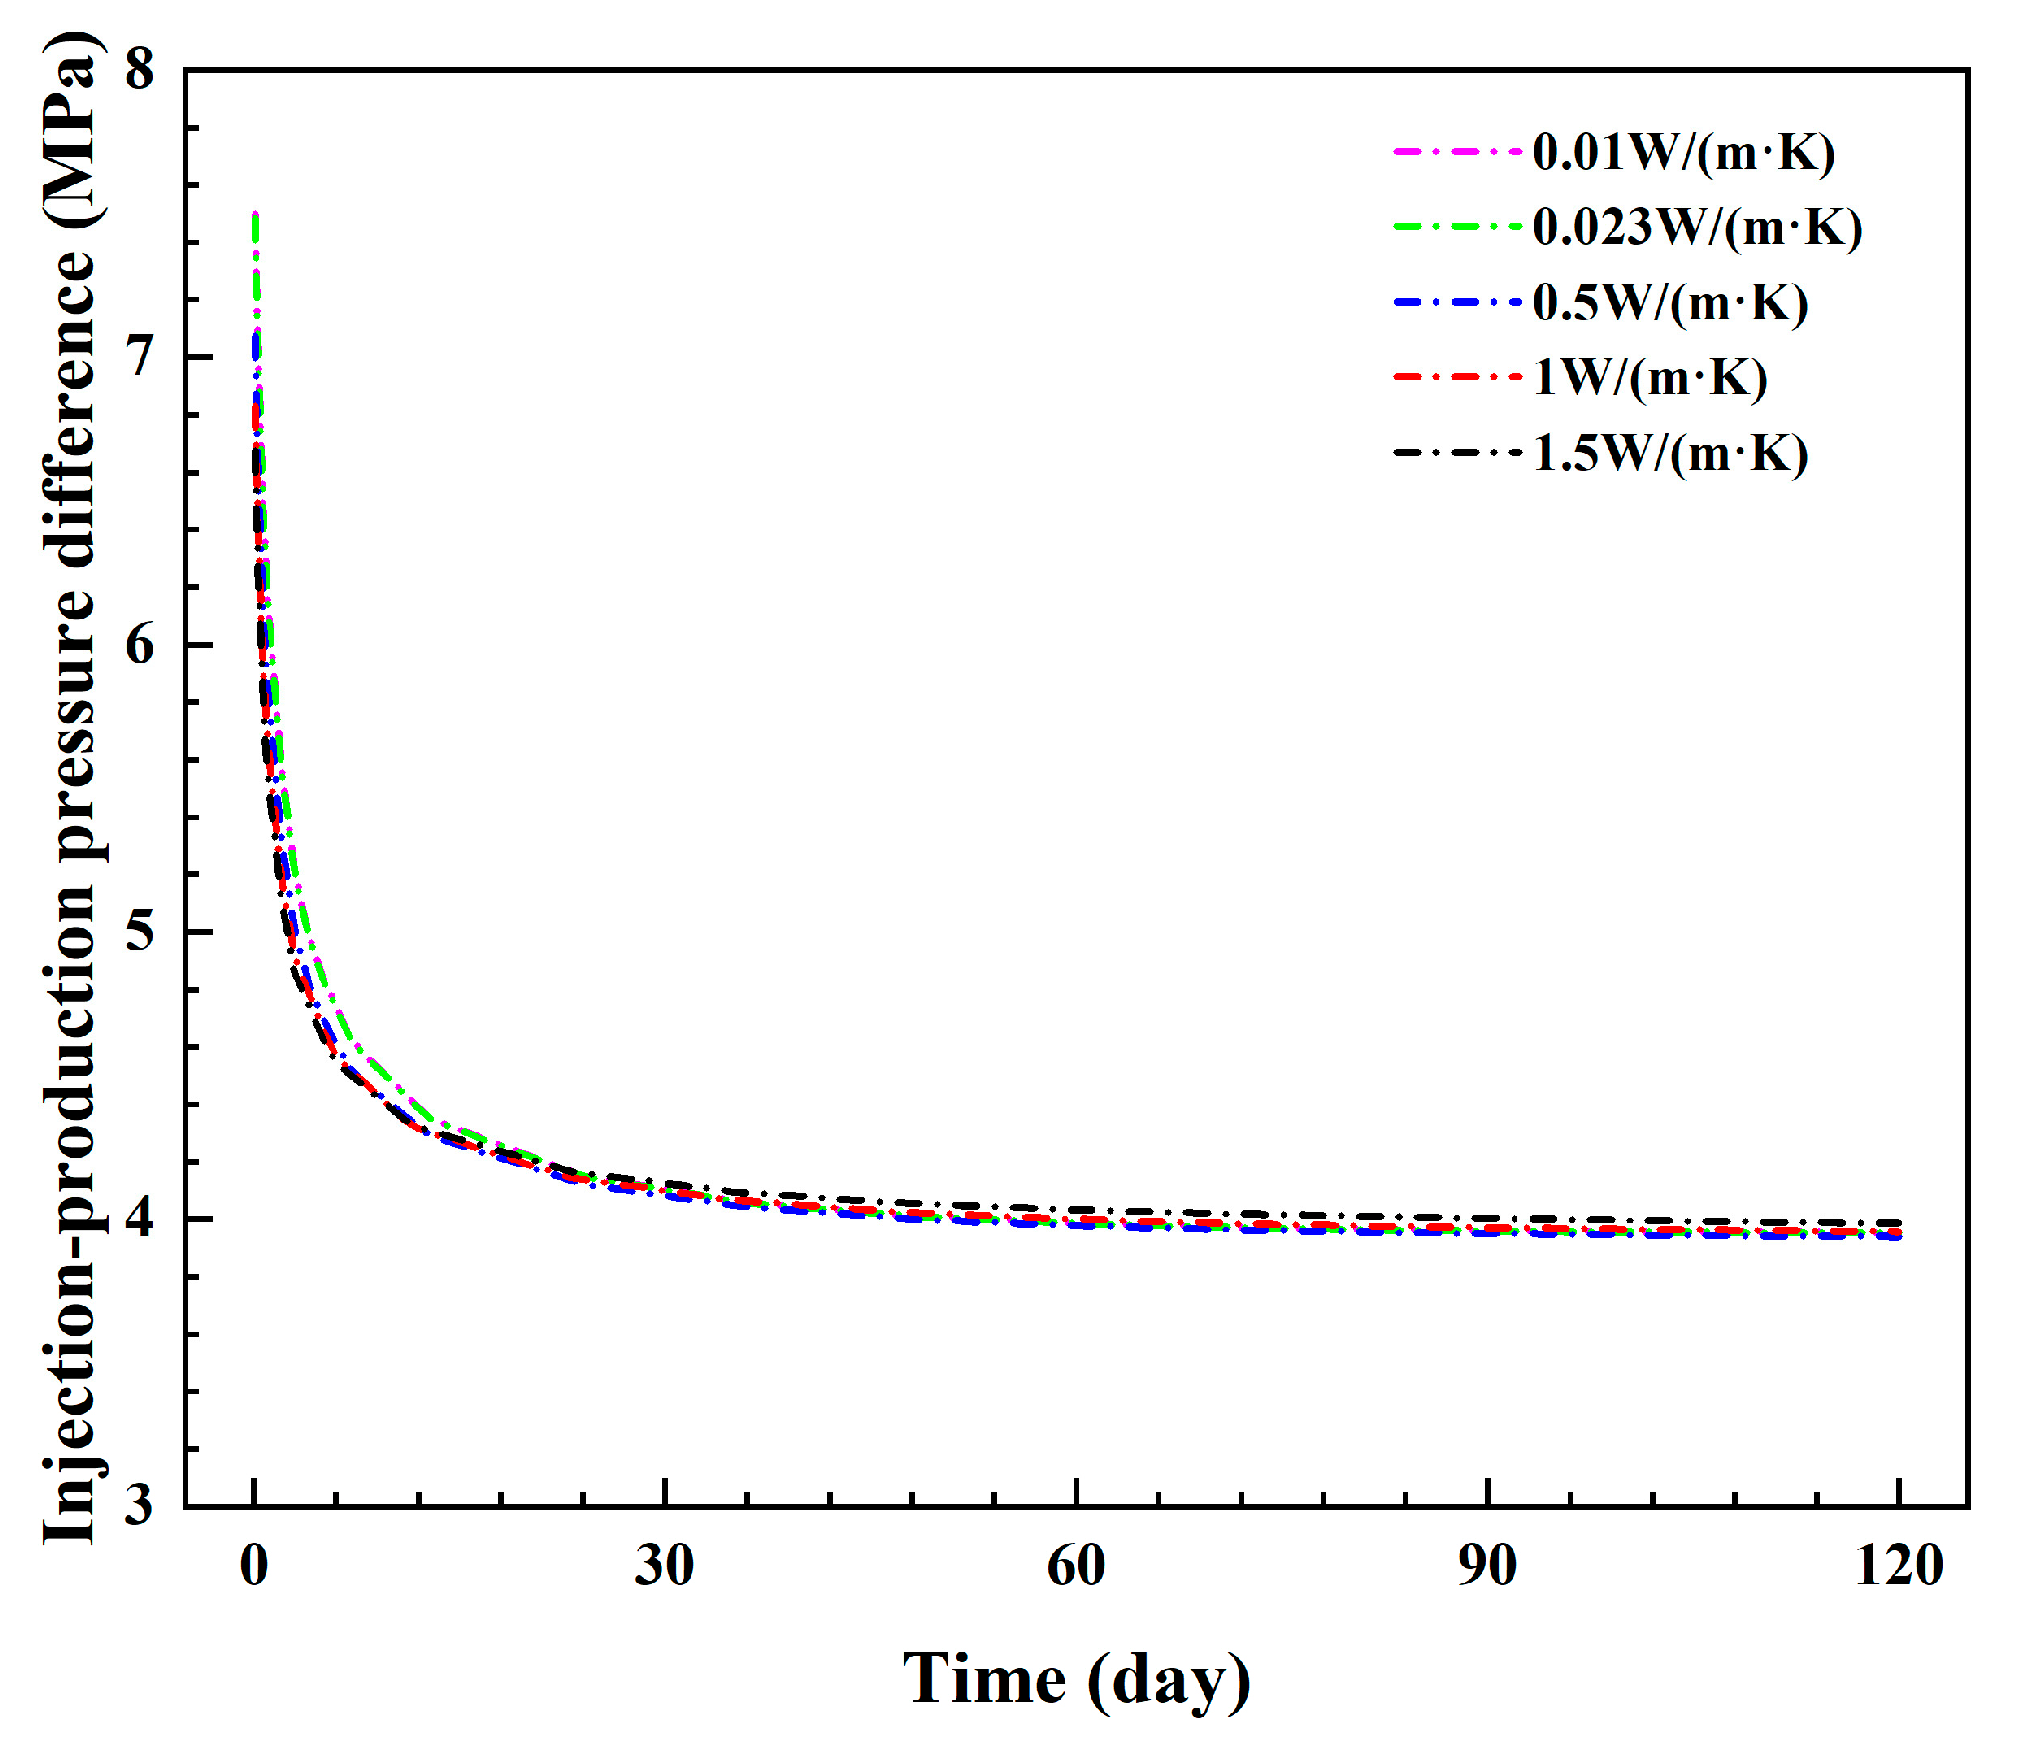
Figure 11 and Figure 12 show the changes in production temperature and the injection–production pressure difference under different thermal conductivities of the inner pipe. It can be seen that as the inner pipe’s thermal conductivity increases, the heat loss of the production fluid in the wellbore rises sharply, leading to a significant drop in the system’s outlet temperature. When the inner pipe’s thermal conductivity is 1.5 W/(m·K), the production temperature after 120 days is approximately 56.84 °C. Compared with the outlet temperature when the thermal conductivity is 0.01 W/(m·K), the decrease amounts to 16.04 °C. Notably, when the inner pipe’s thermal conductivity is less than 0.023 W/(m·K) (the parameter of the basic case), the difference in the production temperature is negligible, indicating an excellent insulation effect. Thus, this value can serve as a reference for determining the reasonable range of the inner pipe’s thermal conductivity. Additionally, the variation range of the injection–production pressure difference with different thermal conductivities of the insulated pipe is quite small, reflecting that its influence is limited.
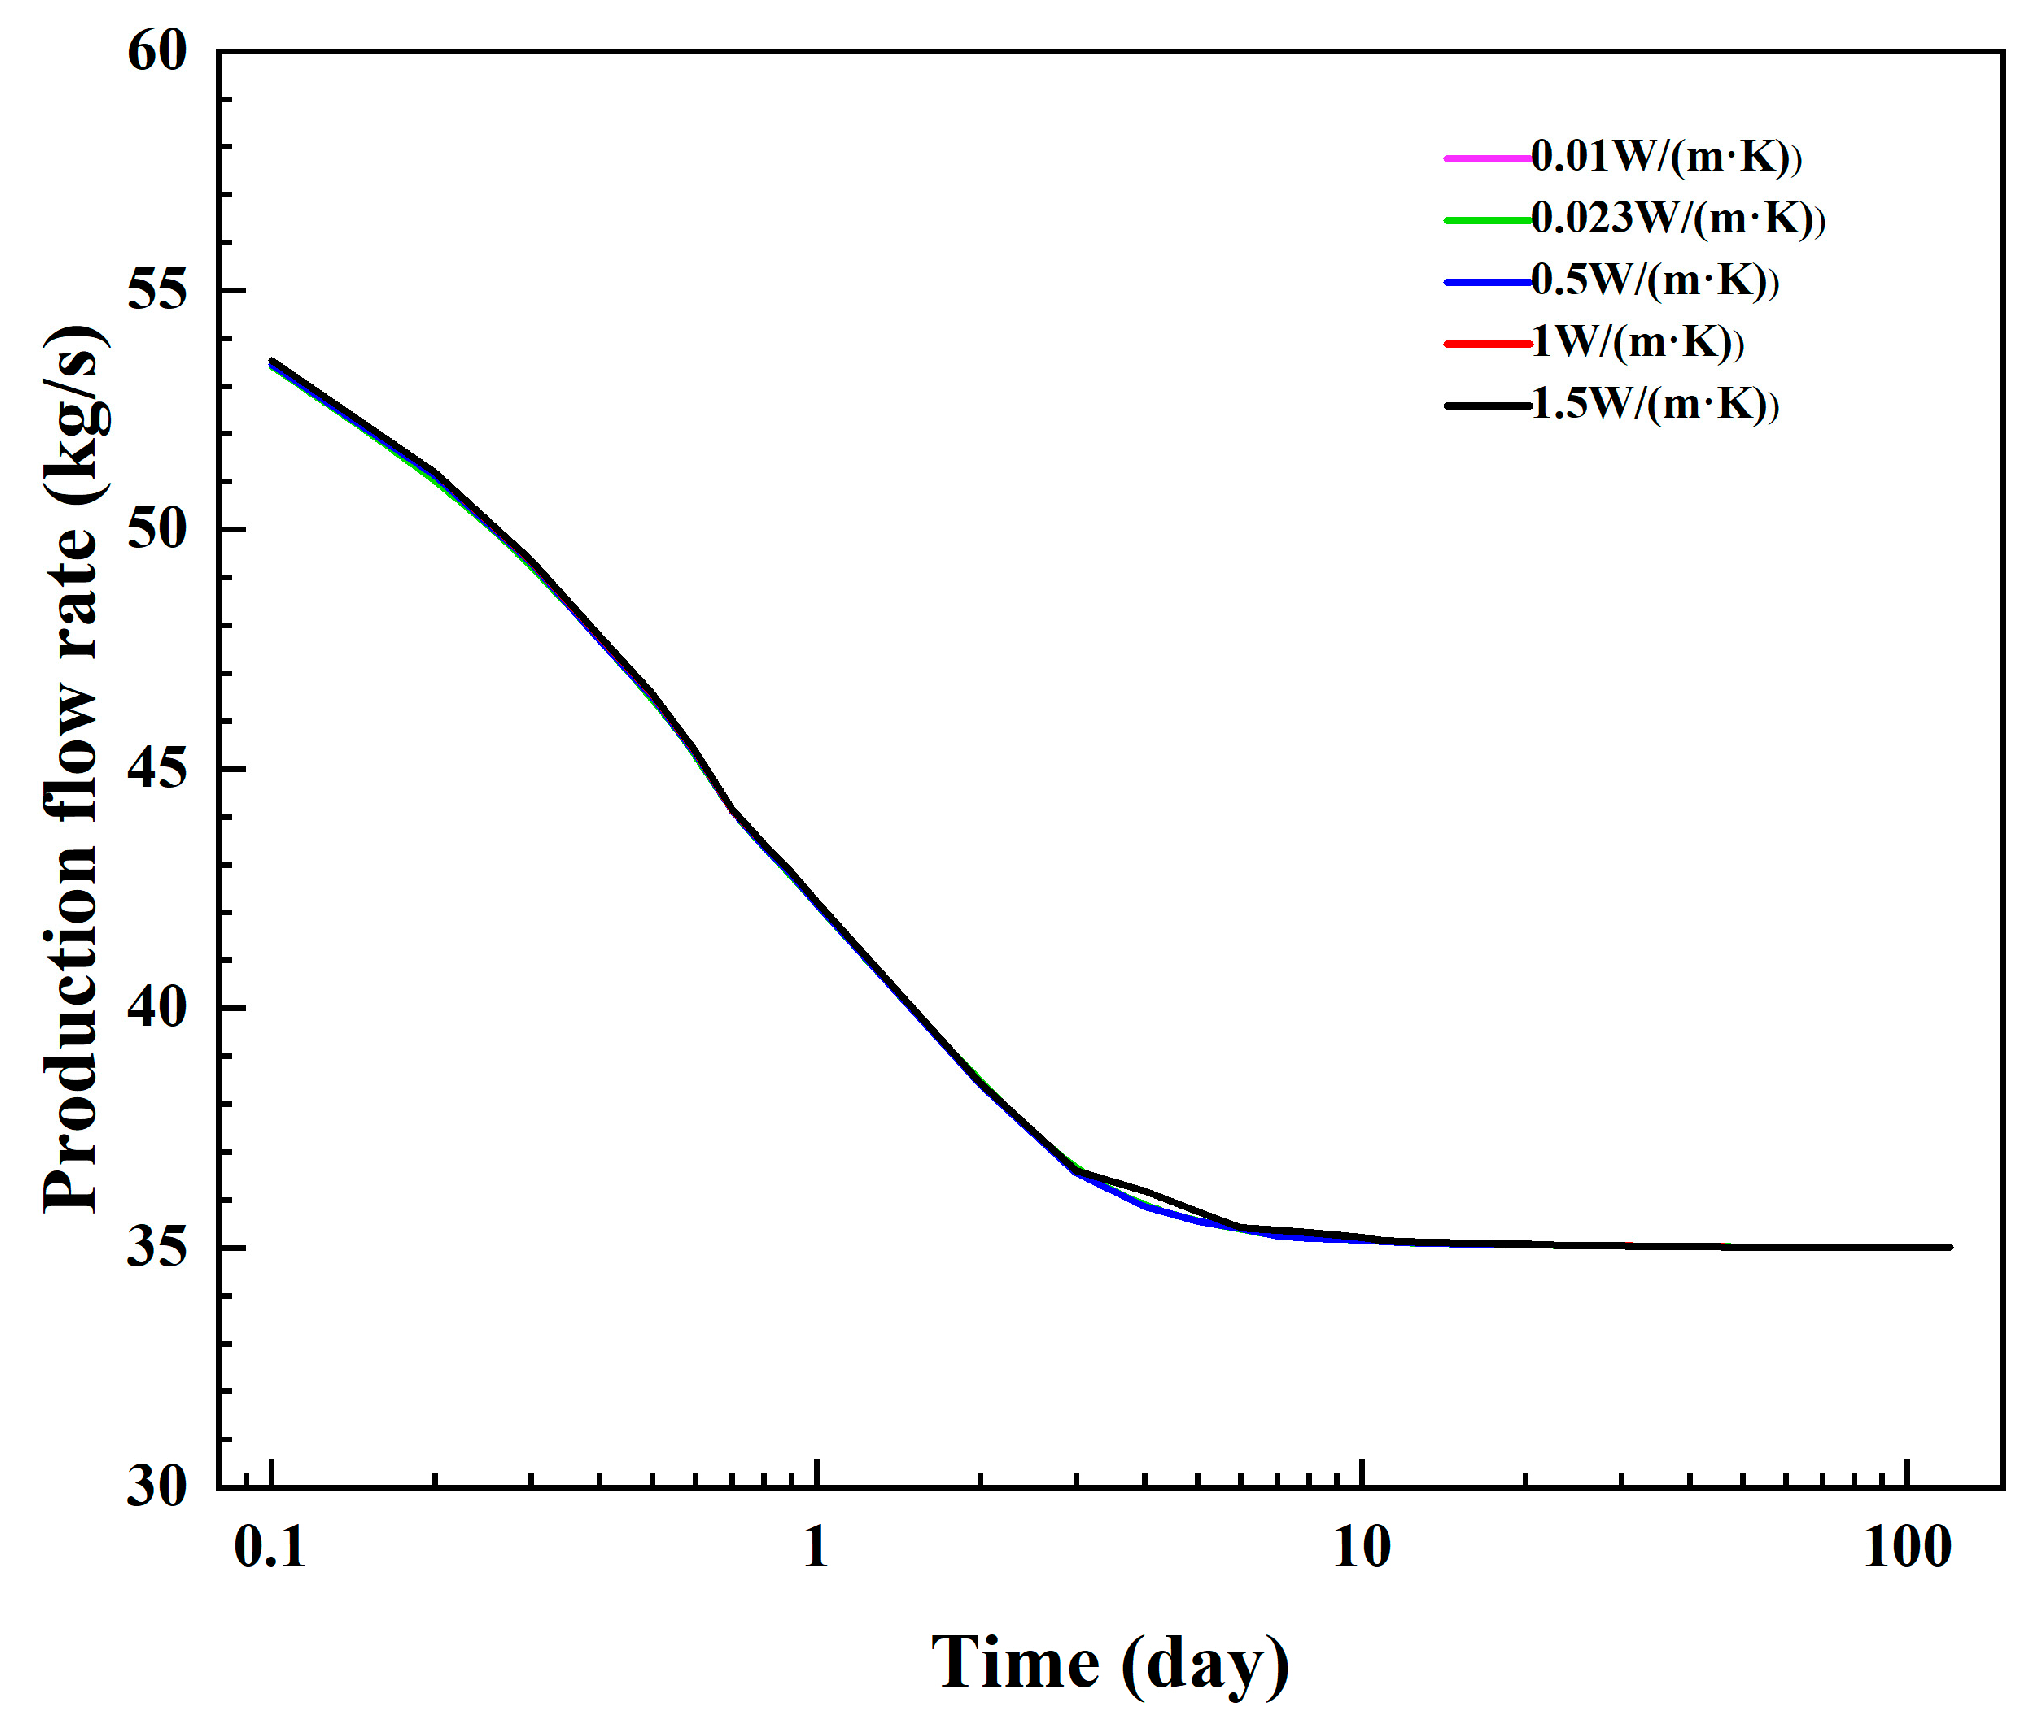
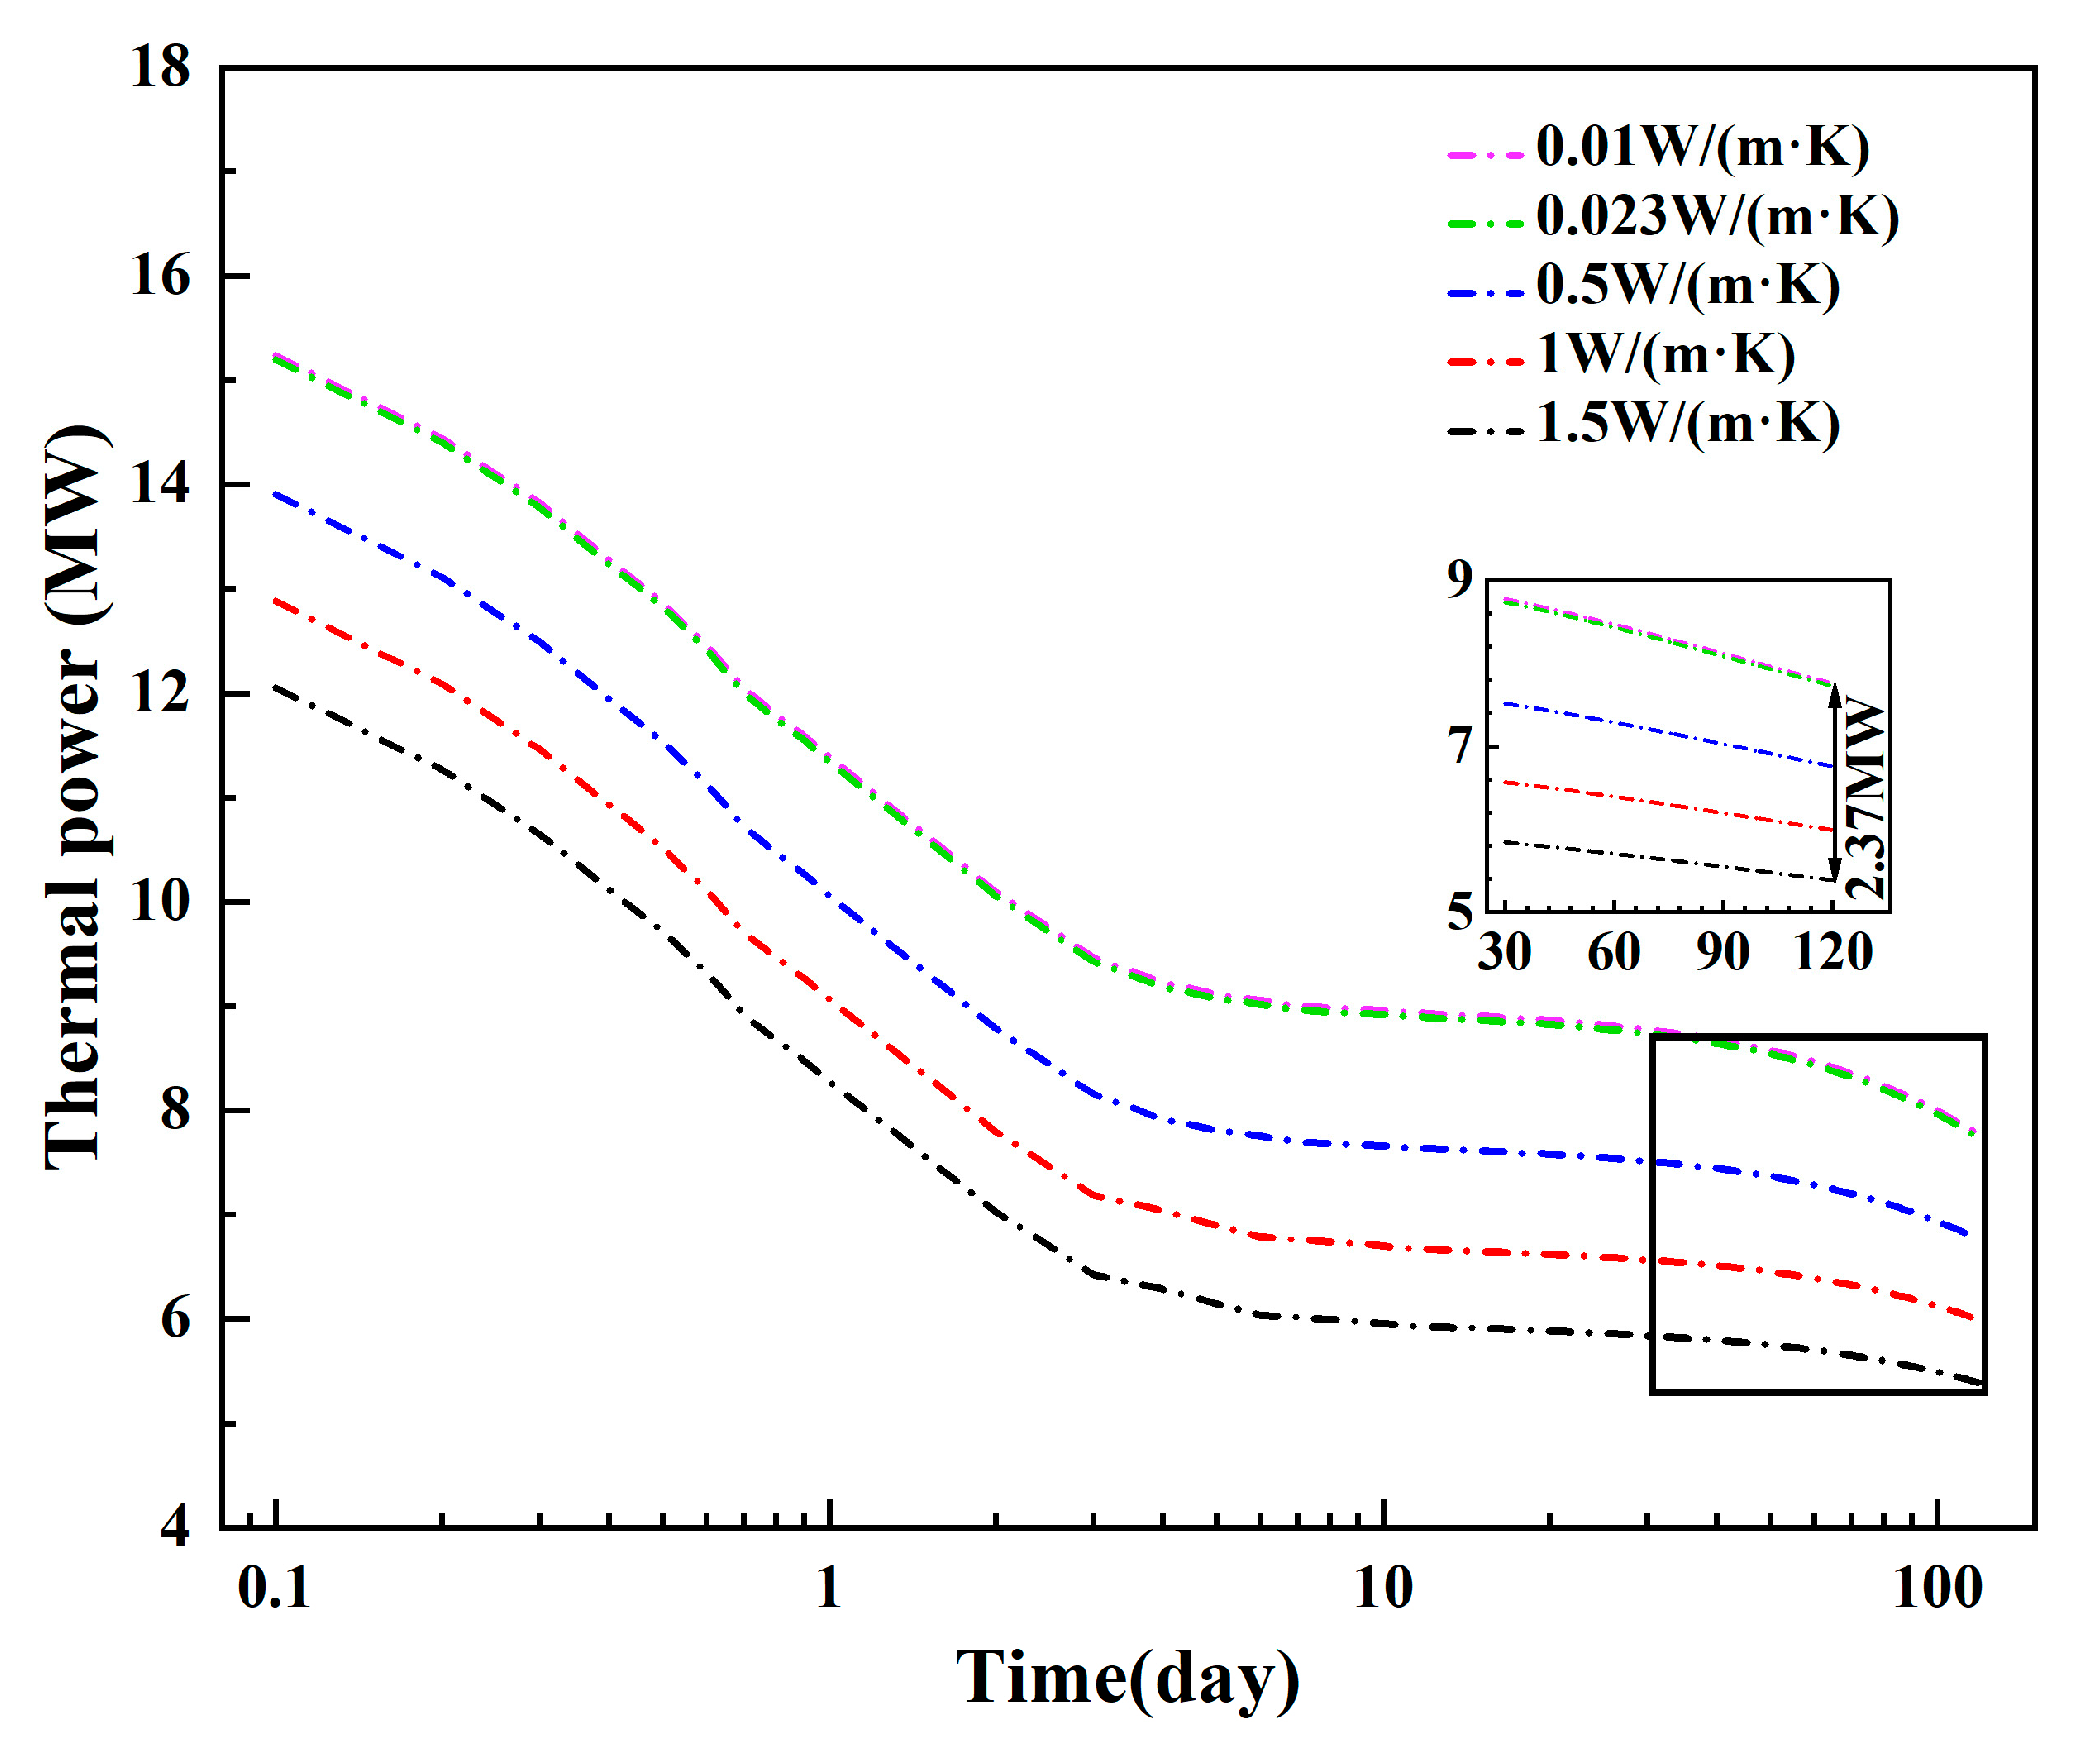
Figure 13 and Figure 14 show the changes in the production flow rate and the thermal power under different thermal conductivities of the inner pipe. It can be observed from the figures that the inner pipe’s thermal conductivity has a minimal impact on the system’s production flow rate. Moreover, a lower thermal conductivity of the inner pipe can effectively reduce the heat loss of the production fluid and remarkably increase the thermal power. After 120 days, the thermal power with a thermal conductivity of 0.01 W/(m·K) is around 7.76 MW. Compared with the thermal power with a thermal conductivity of 1.5 W/(m·K), it increases by 2.37 MW. In conclusion, the thermal conductivity of the insulated pipe has a minor influence on fluid injection and production, but it can significantly affect the heat production by determining the heat loss of the fluid in the inner pipe. Thus, it is advisable to use an inner pipe with a lower thermal conductivity during production.

3.1.2. Influence of the Thickness of the Insulated Pipe

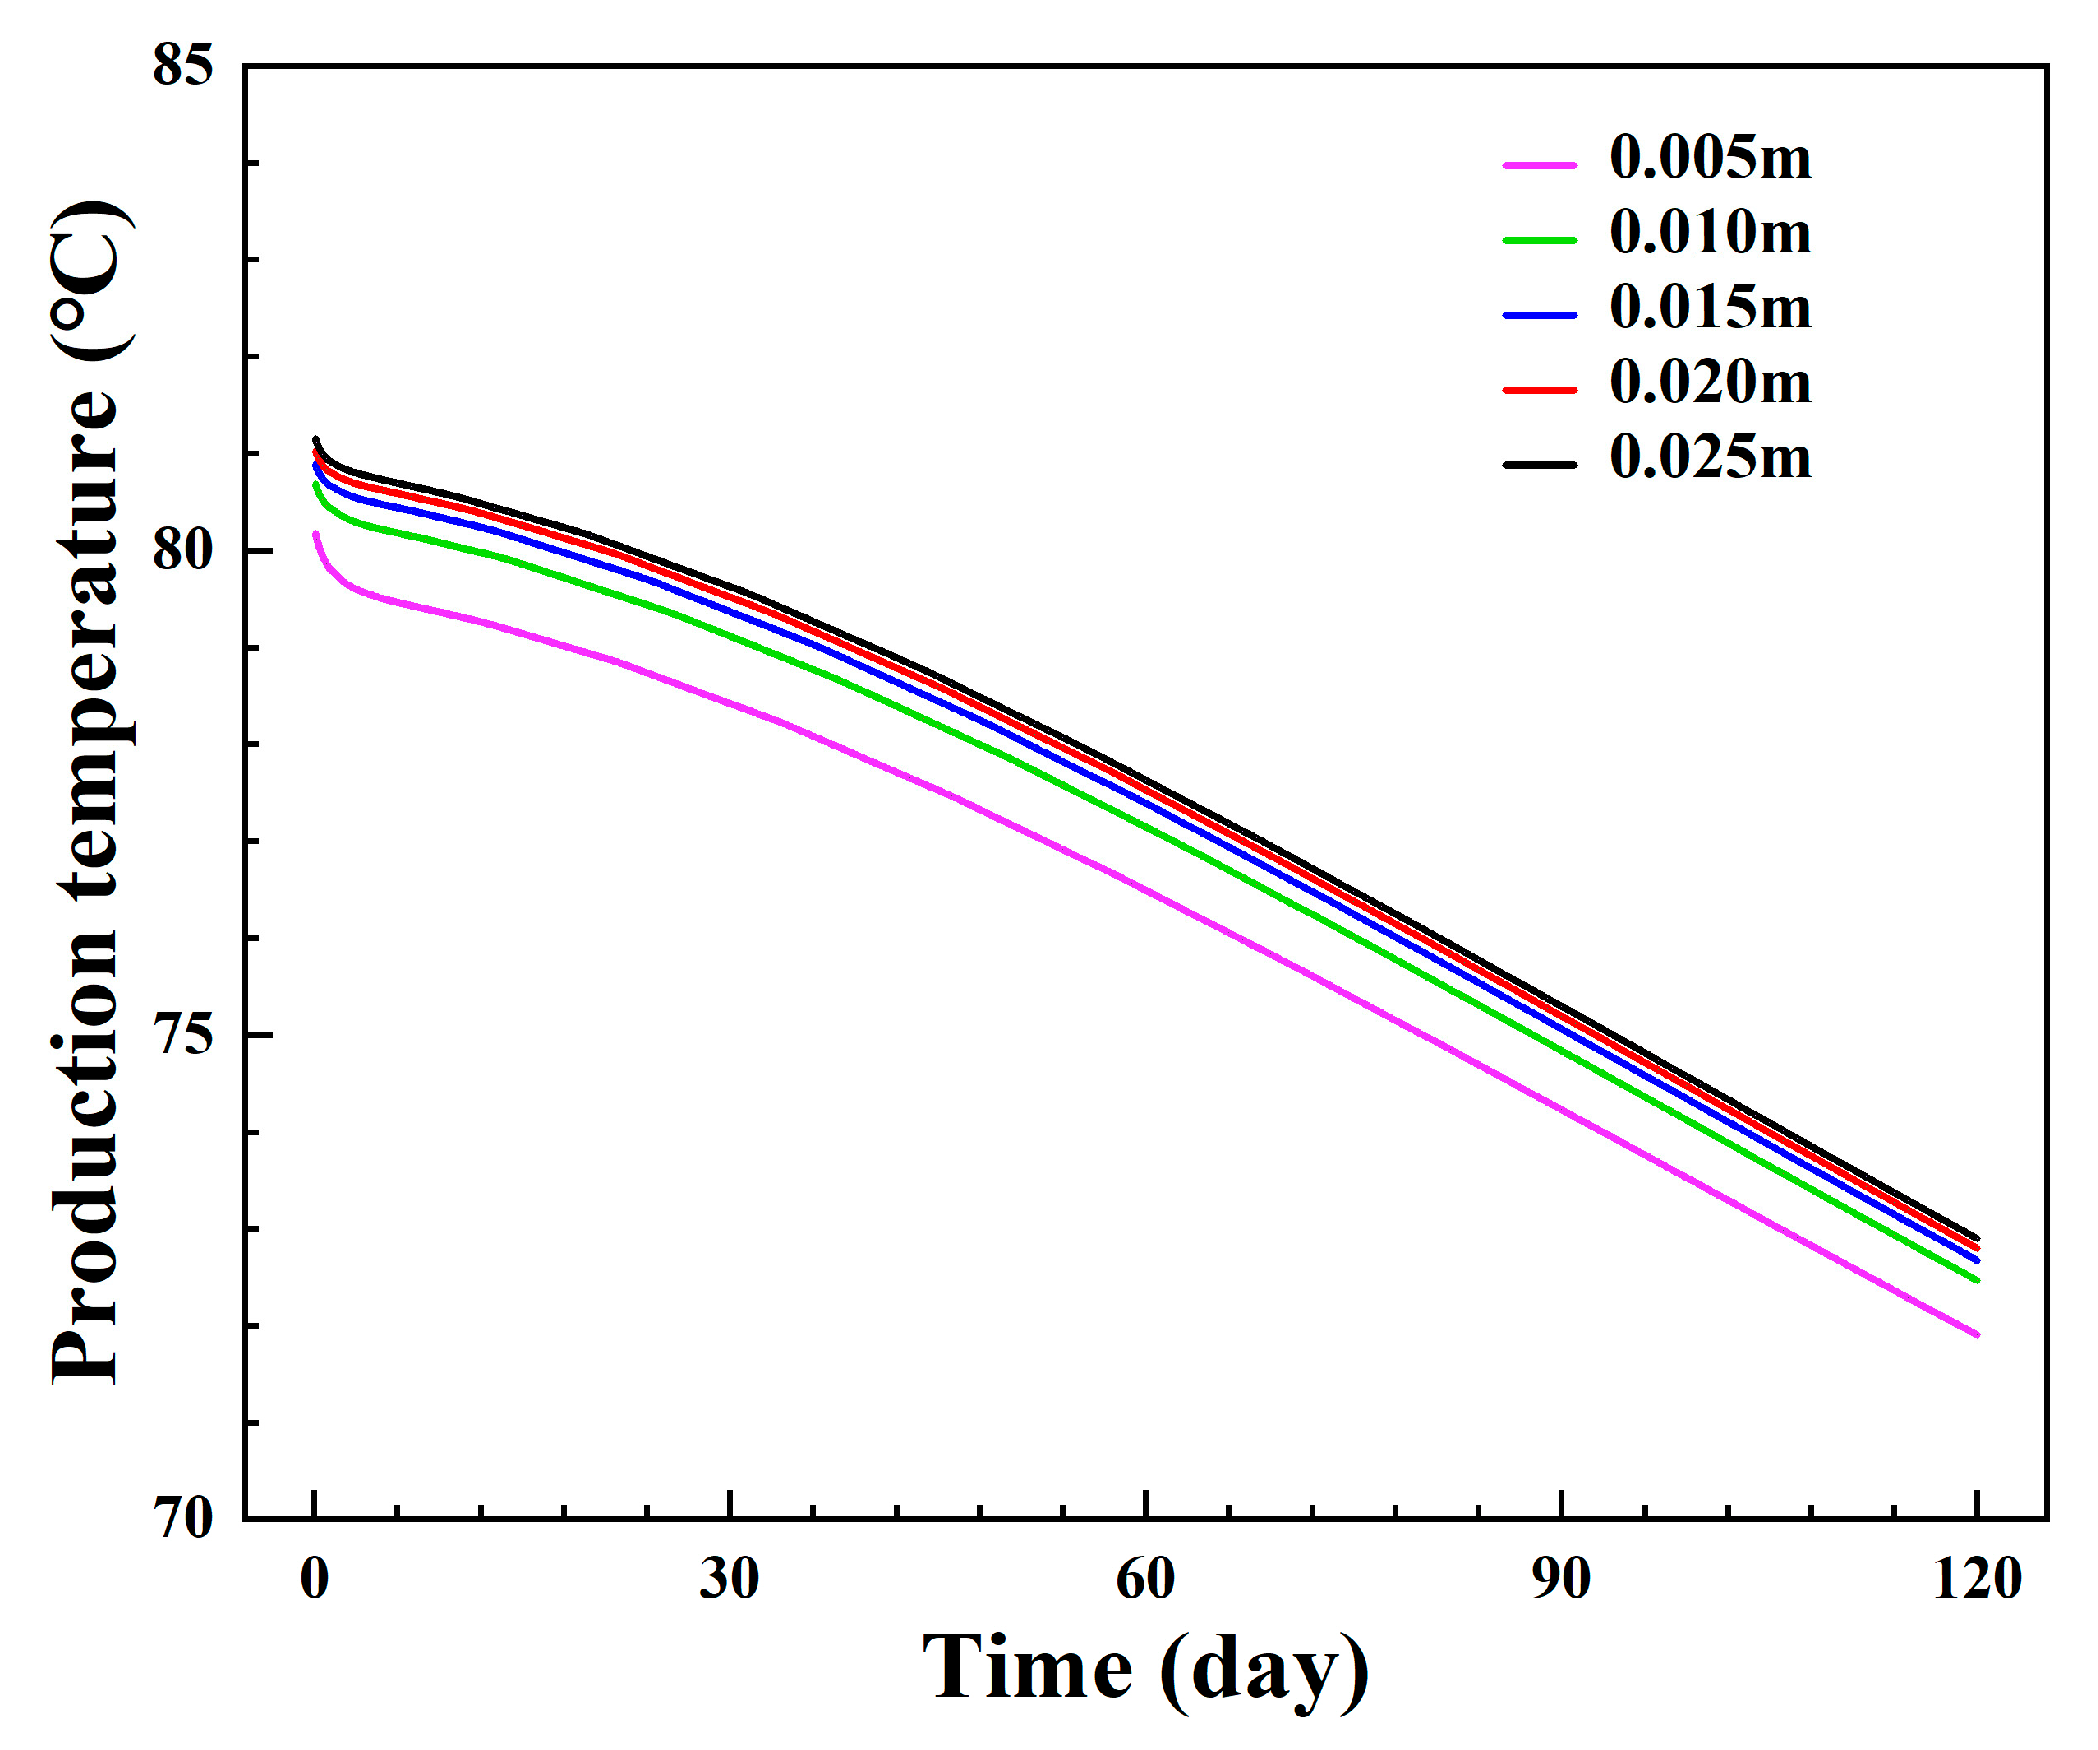
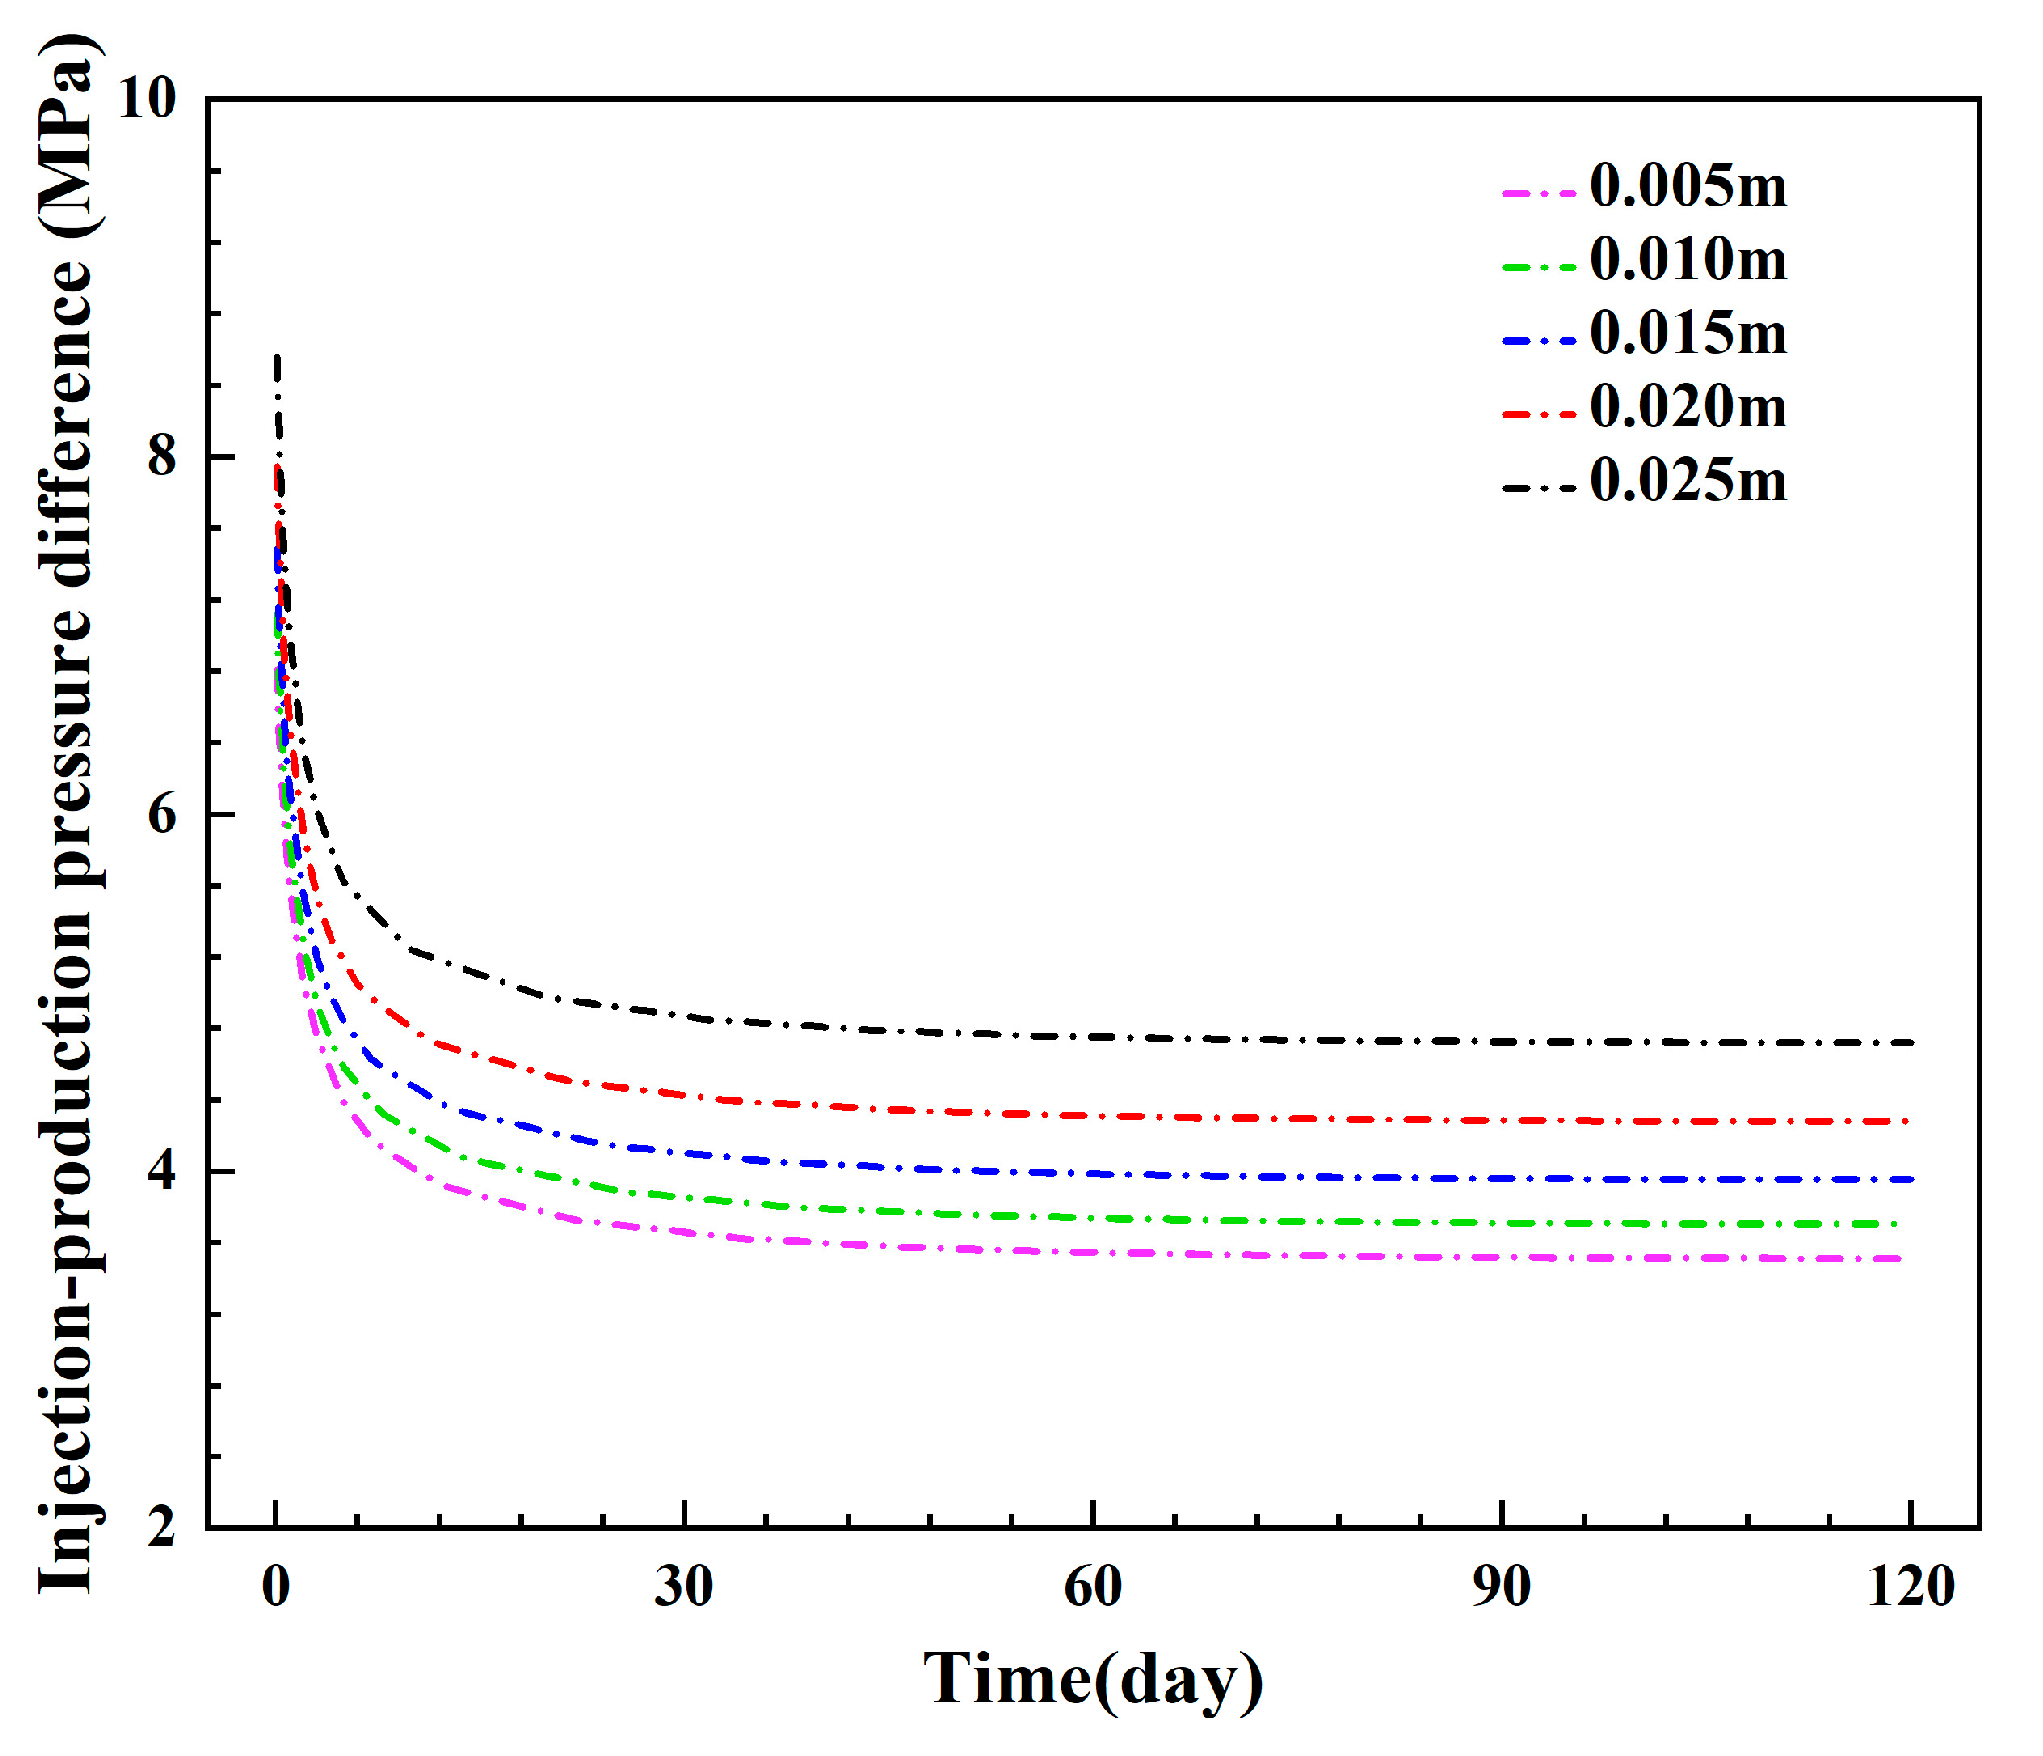
Figure 15 and Figure 16 show the changes in the production temperature and the injection–production pressure difference under different inner pipe thicknesses. It can be seen that reducing the thickness of the inner pipe causes the production temperature to decrease, indicating that the insulation performance of the inner pipe is gradually deteriorating. When the inner pipe’s thickness is 0.005 m, the production temperature after 120 days is around 71.90 °C. Compared with the production temperature when the inner pipe’s thickness is 0.025 m, the decrease is about 1.00 °C. When the inner pipe’s thickness exceeds 0.015 m, the change in the system’s outlet temperature is slight. This value can provide a reference for designing the inner pipe’s thickness. Furthermore, an overly large inner pipe thickness will reduce the flow spaces of the annulus and the inner pipe, resulting in an increase in flow velocity and an elevation in frictional resistance. Compared with the injection–production pressure difference when the inner pipe’s thickness is 0.005 m, the injection–production pressure difference after 120 days under the condition of a thickness of 0.025 m increases by 34.41%.
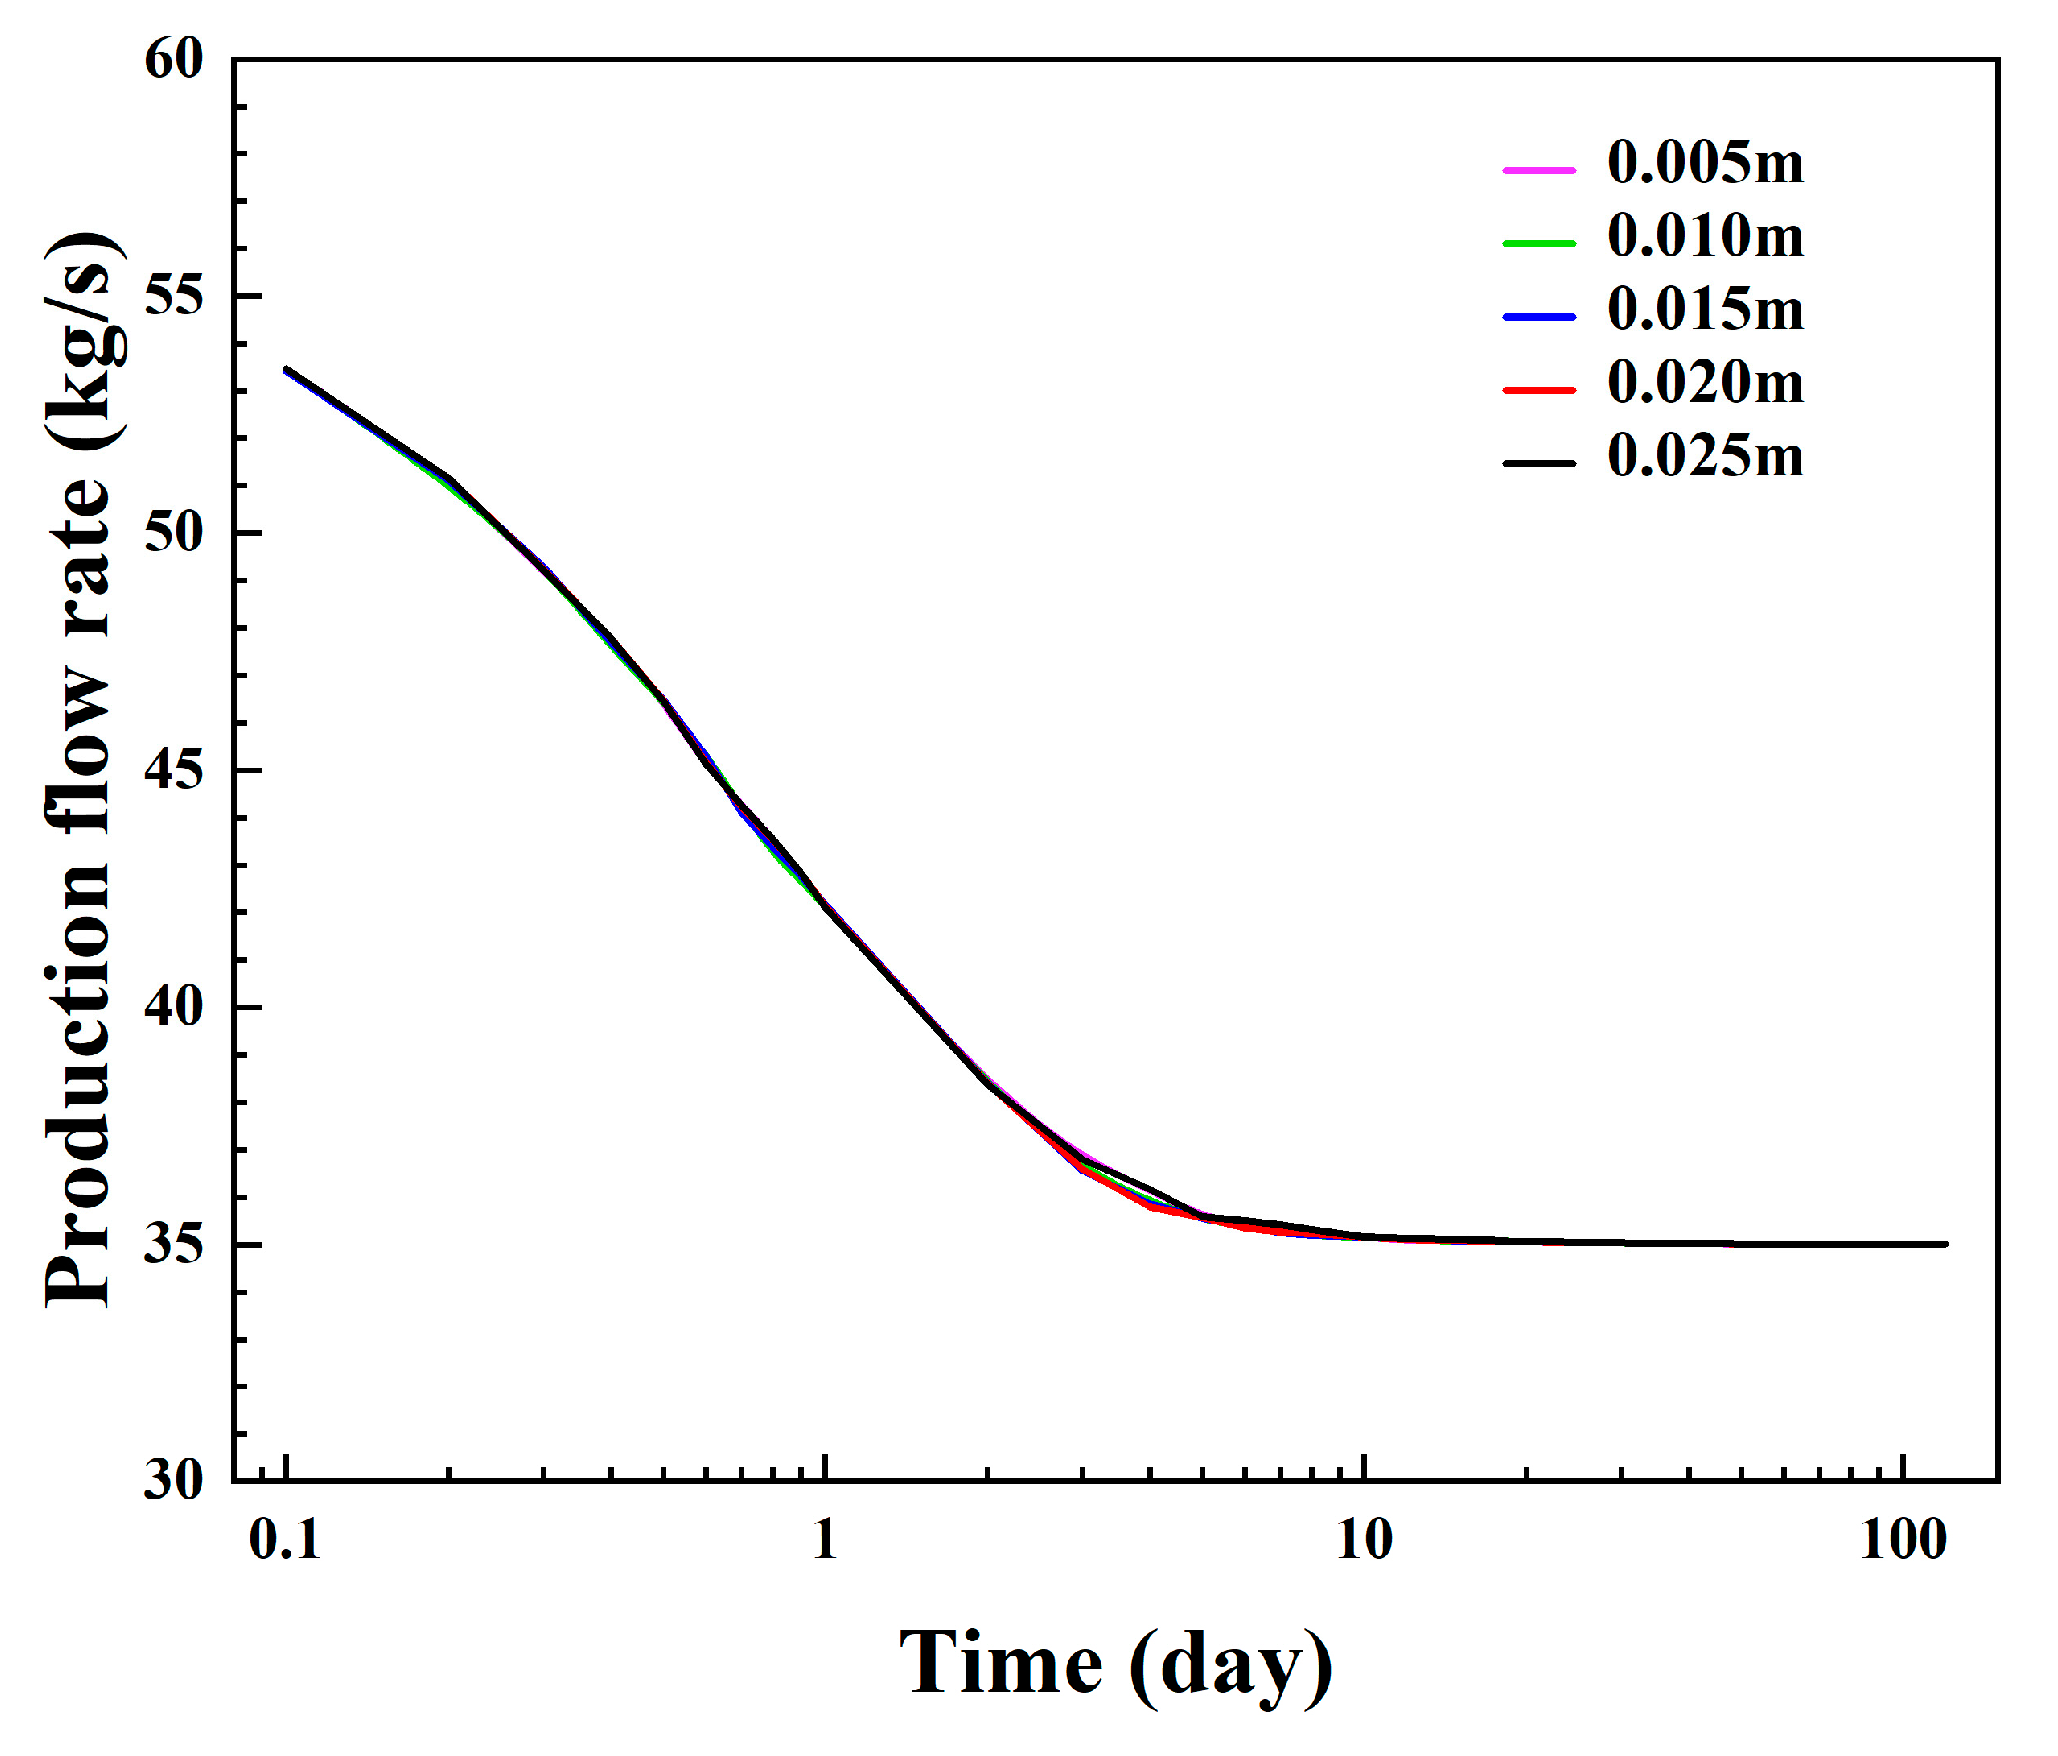
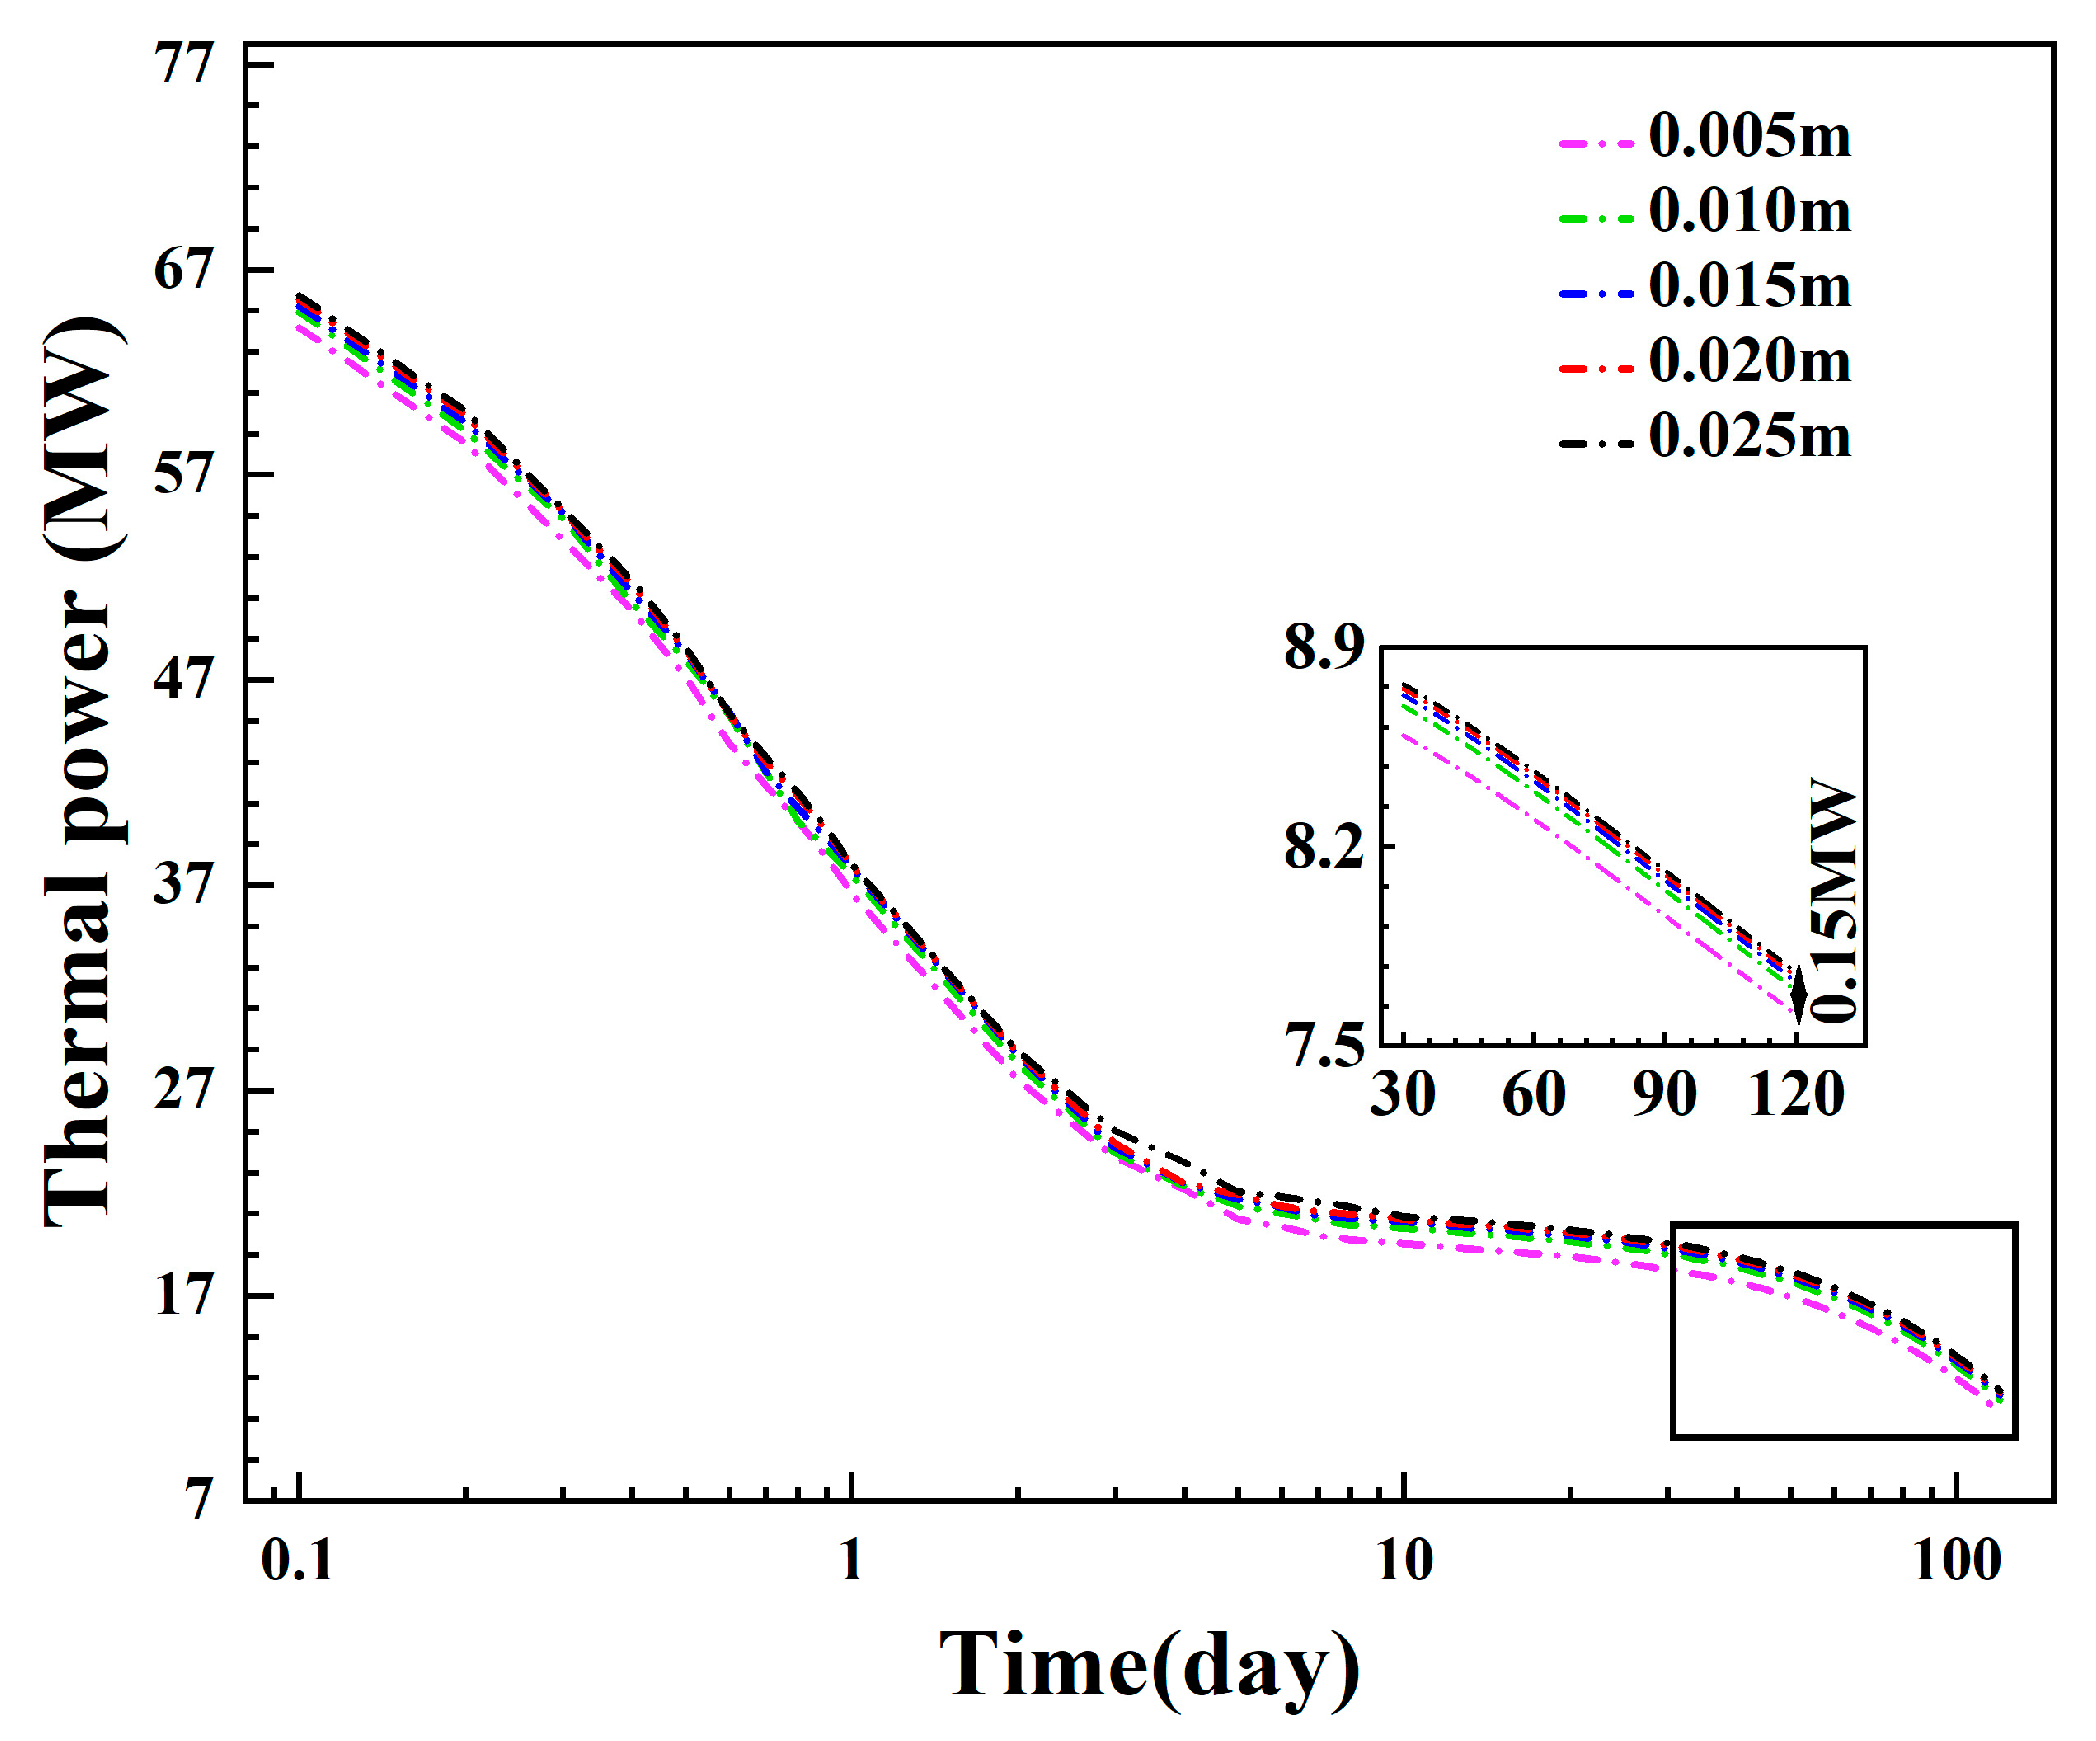
Figure 17 and Figure 18 show the changes in the production flow rate and the thermal power under different inner pipe thicknesses. It can be seen that the thickness of the insulated pipe has almost no impact on the fluid production of the system. As the inner pipe’s thickness gradually decreases, the heat loss of the production fluid continuously increases, leading to a continuous decline in the thermal power of the system. However, compared with the thermal powers of the systems with thermal conductivities of 0.01 W/(m·K) and 1.5 W/(m·K), the change and decrease after 120 days are limited, at about 0.15 MW. In summary, the thickness of the insulated inner pipe has a relatively small impact on wellbore heat transfer but has a significant influence on the injection–production pressure difference. Considering that an increase in the inner pipe’s thickness will lead to higher costs, it is possible to appropriately reduce the inner pipe’s thickness in the wellbore design with various thicknesses of the inner pipe.

3.1.3. Influence of the Diameter of the Insulated Pipe

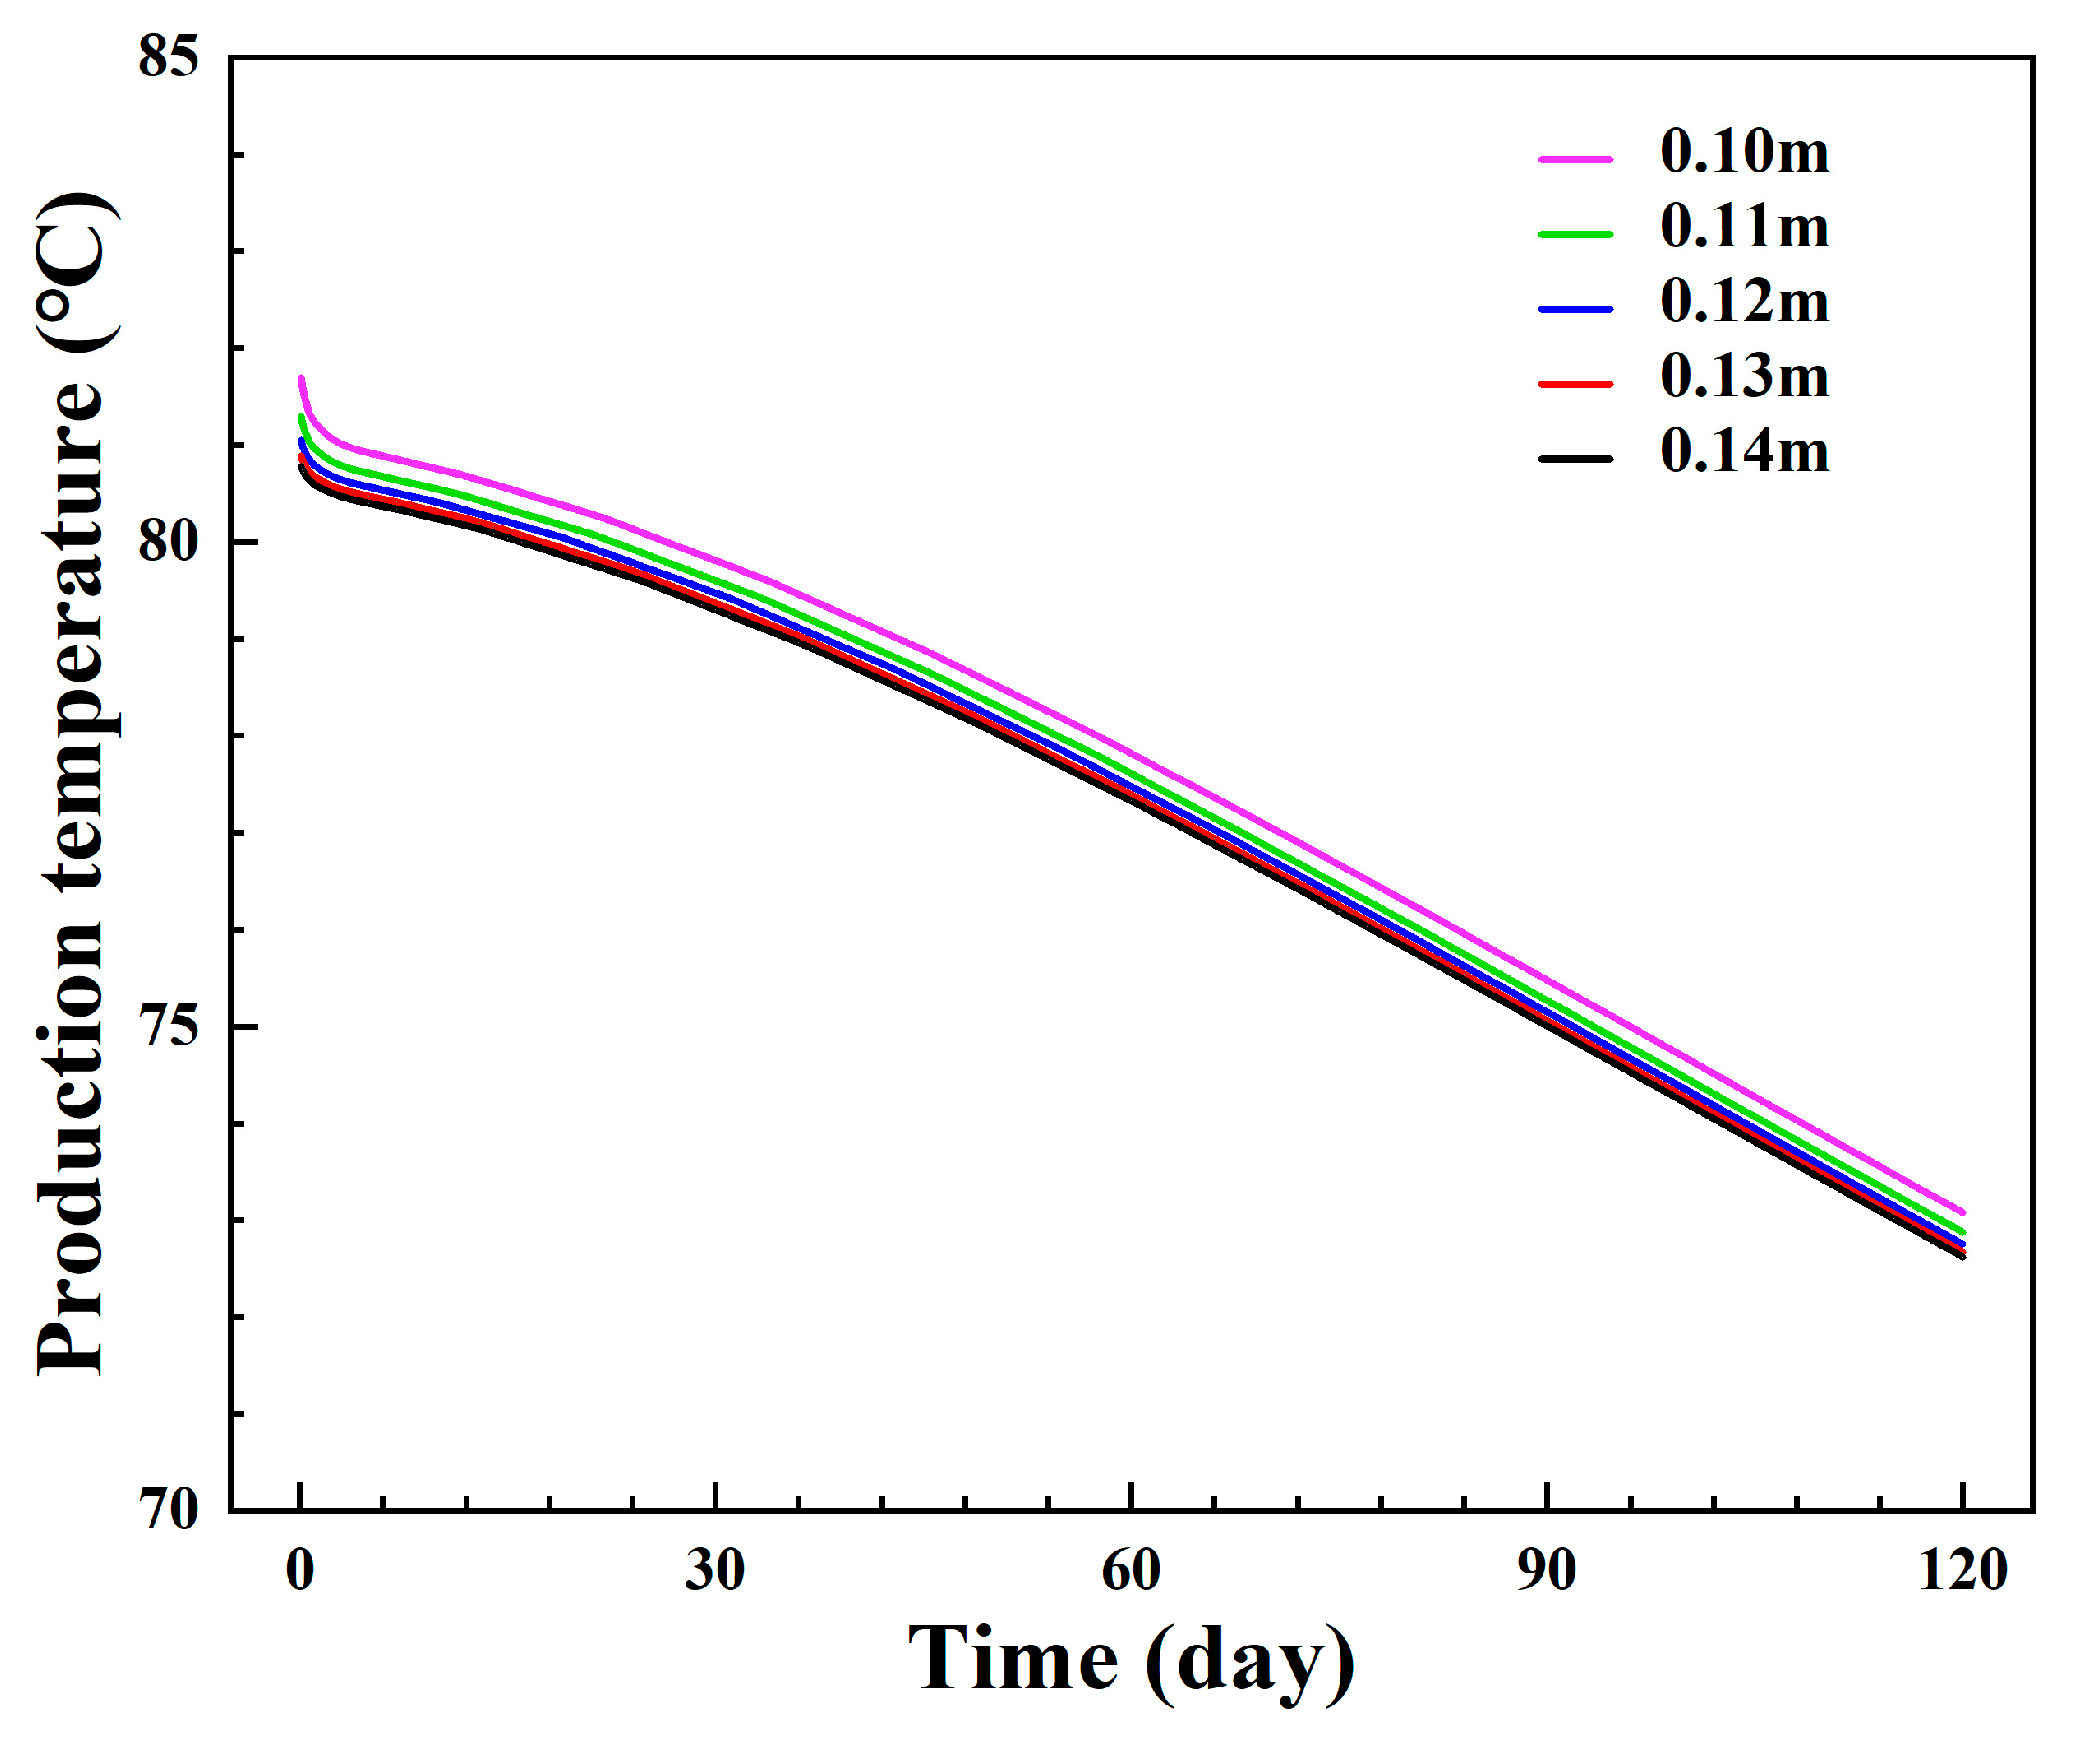
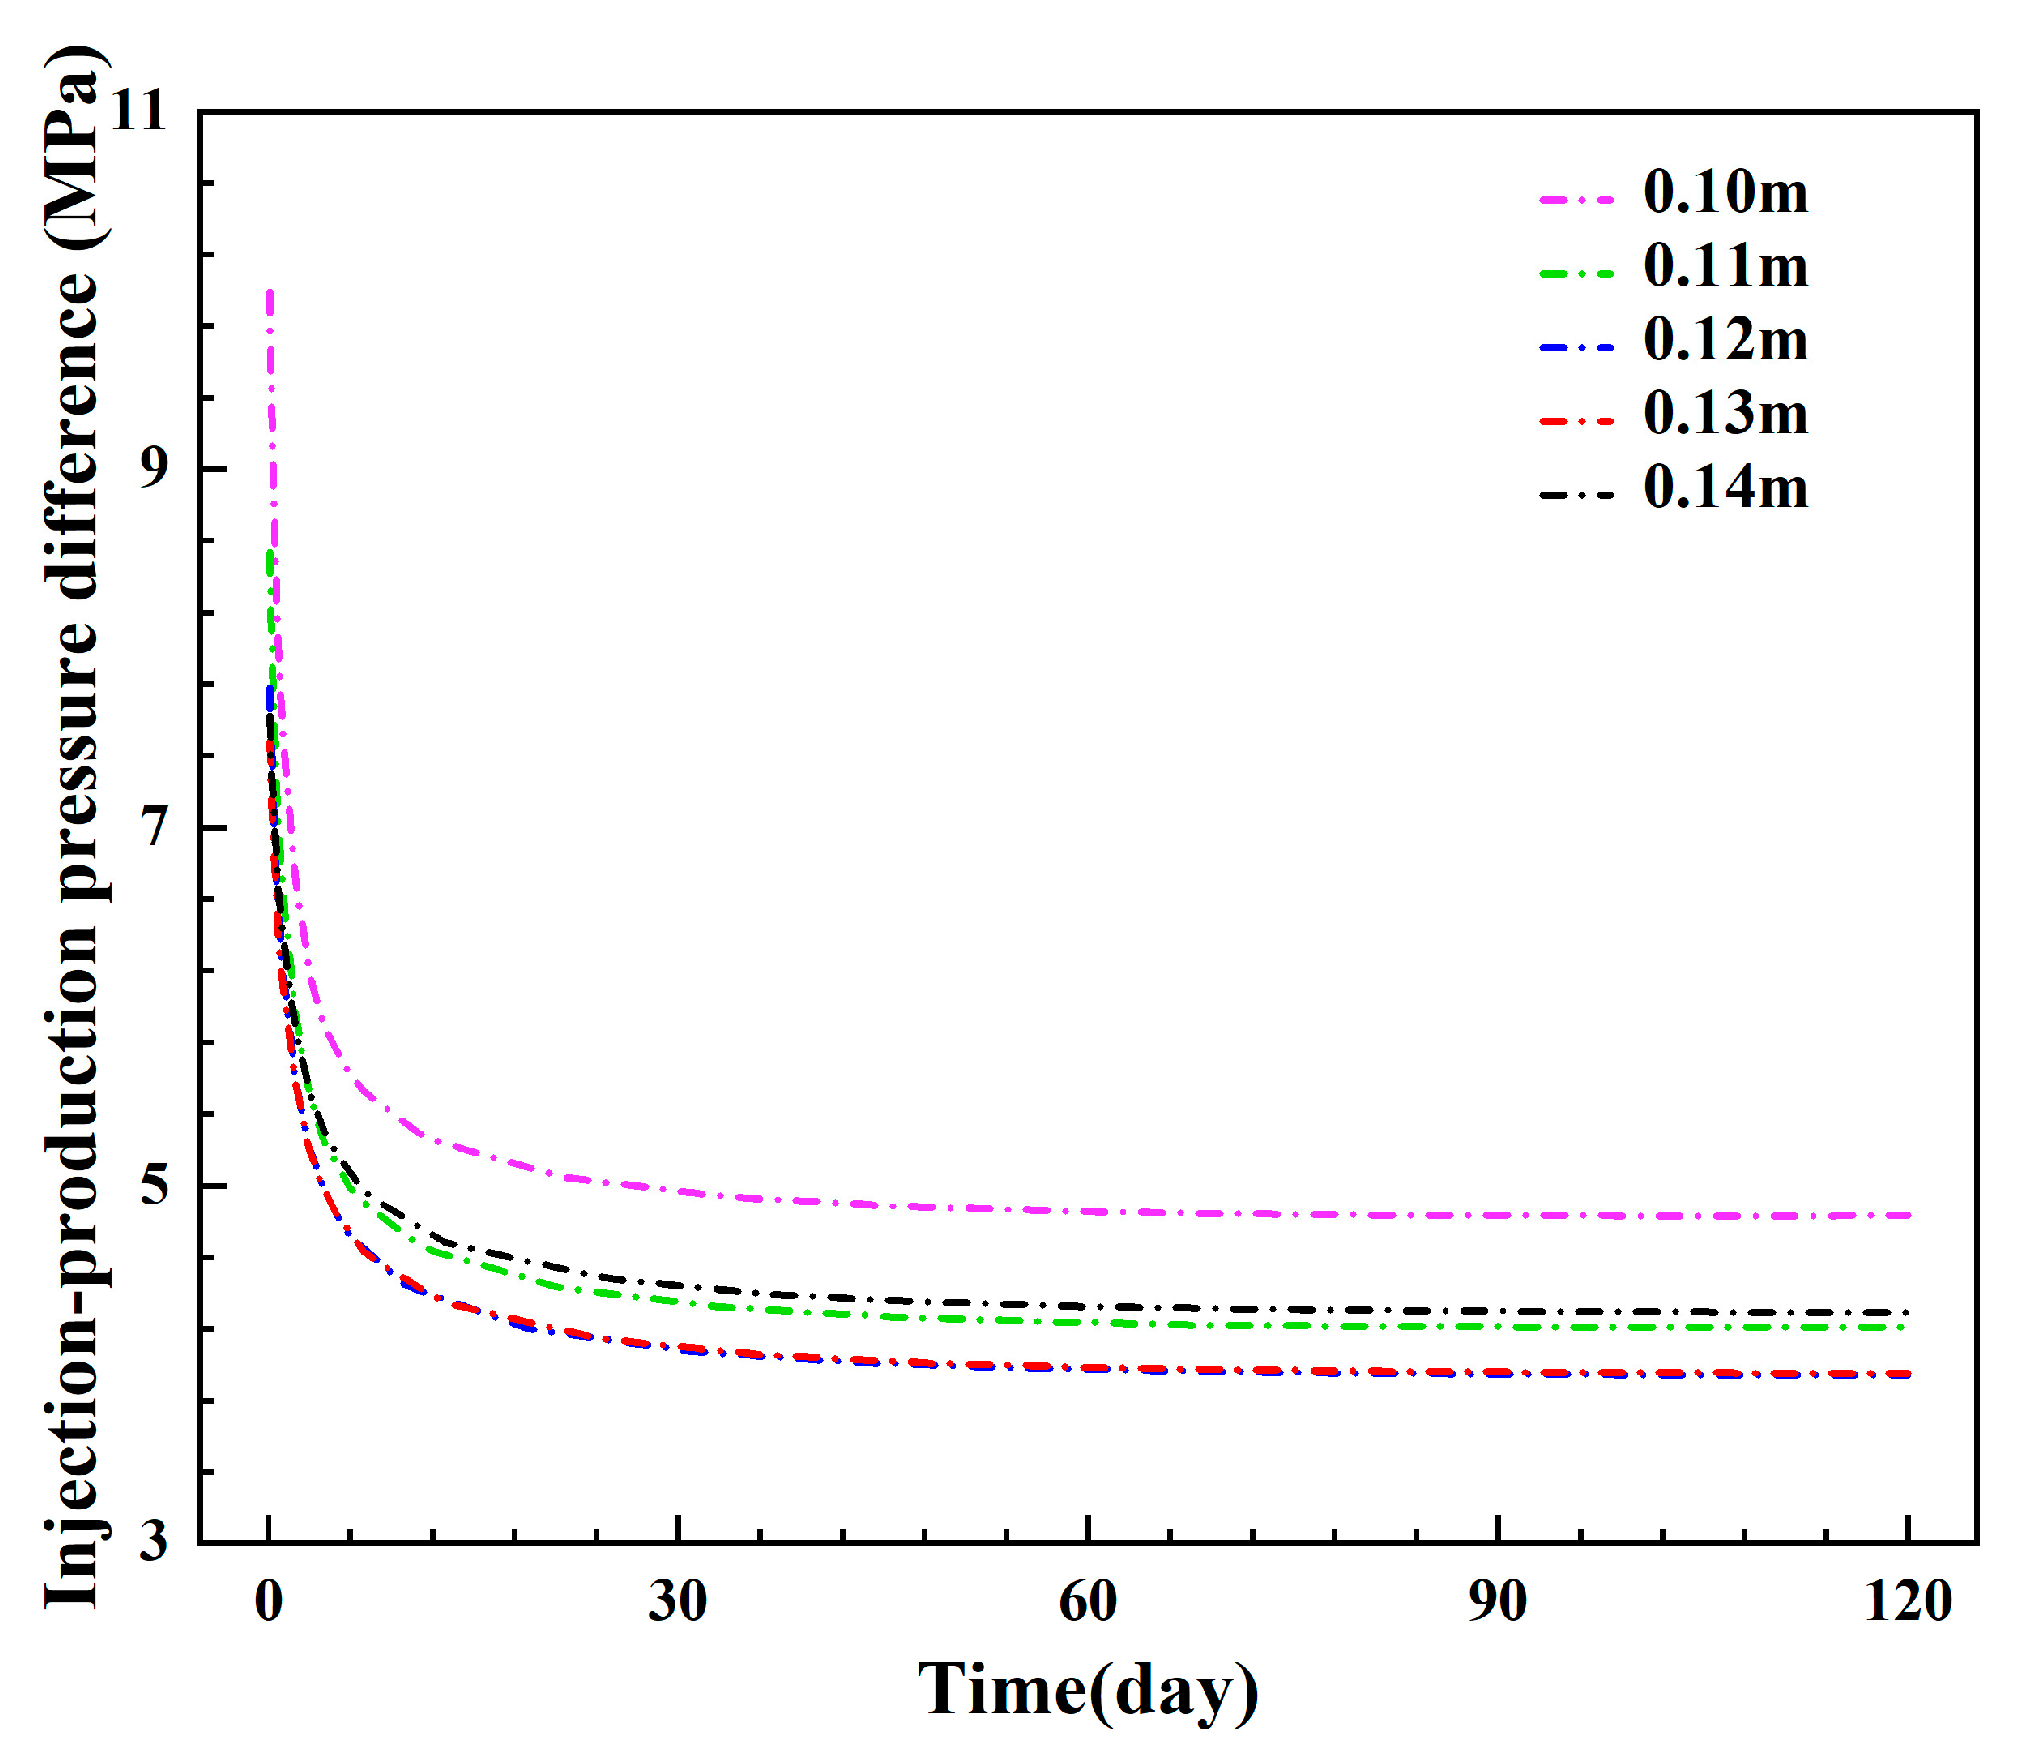
Figure 19 and Figure 20 show the changes in the production temperature and the injection–production pressure difference under different inner pipe diameters. It should be noted that the inner pipe’s thickness remains constant in this case. It can be seen that reducing the inner pipe’s diameter is conducive to increasing the production temperature. However, the change in the production temperature under different inner pipe diameters is relatively limited: only 0.45 °C after 120 days. In addition, Figure 20 shows that as the inner pipe’s diameter decreases, the injection–production pressure difference first decreases and then gradually increases. This is mainly because a smaller inner pipe diameter can help increase the flow space of the wellbore annulus and promote fluid flow, but it will reduce the flow space of the inner pipe and increase the frictional resistance. Therefore, it is necessary to rationally design the spaces of the annulus and the inner pipe. The system’s injection–production pressure difference is the lowest when the inner pipe’s diameter is 0.12 m or 0.13 m. Compared with the injection–production pressure difference when the inner pipe’s diameter is 0.10 m, it can be reduced by 22.26%. Hence, a diameter from 0.12 m to 0.13 m is recommended in the wellbore design.
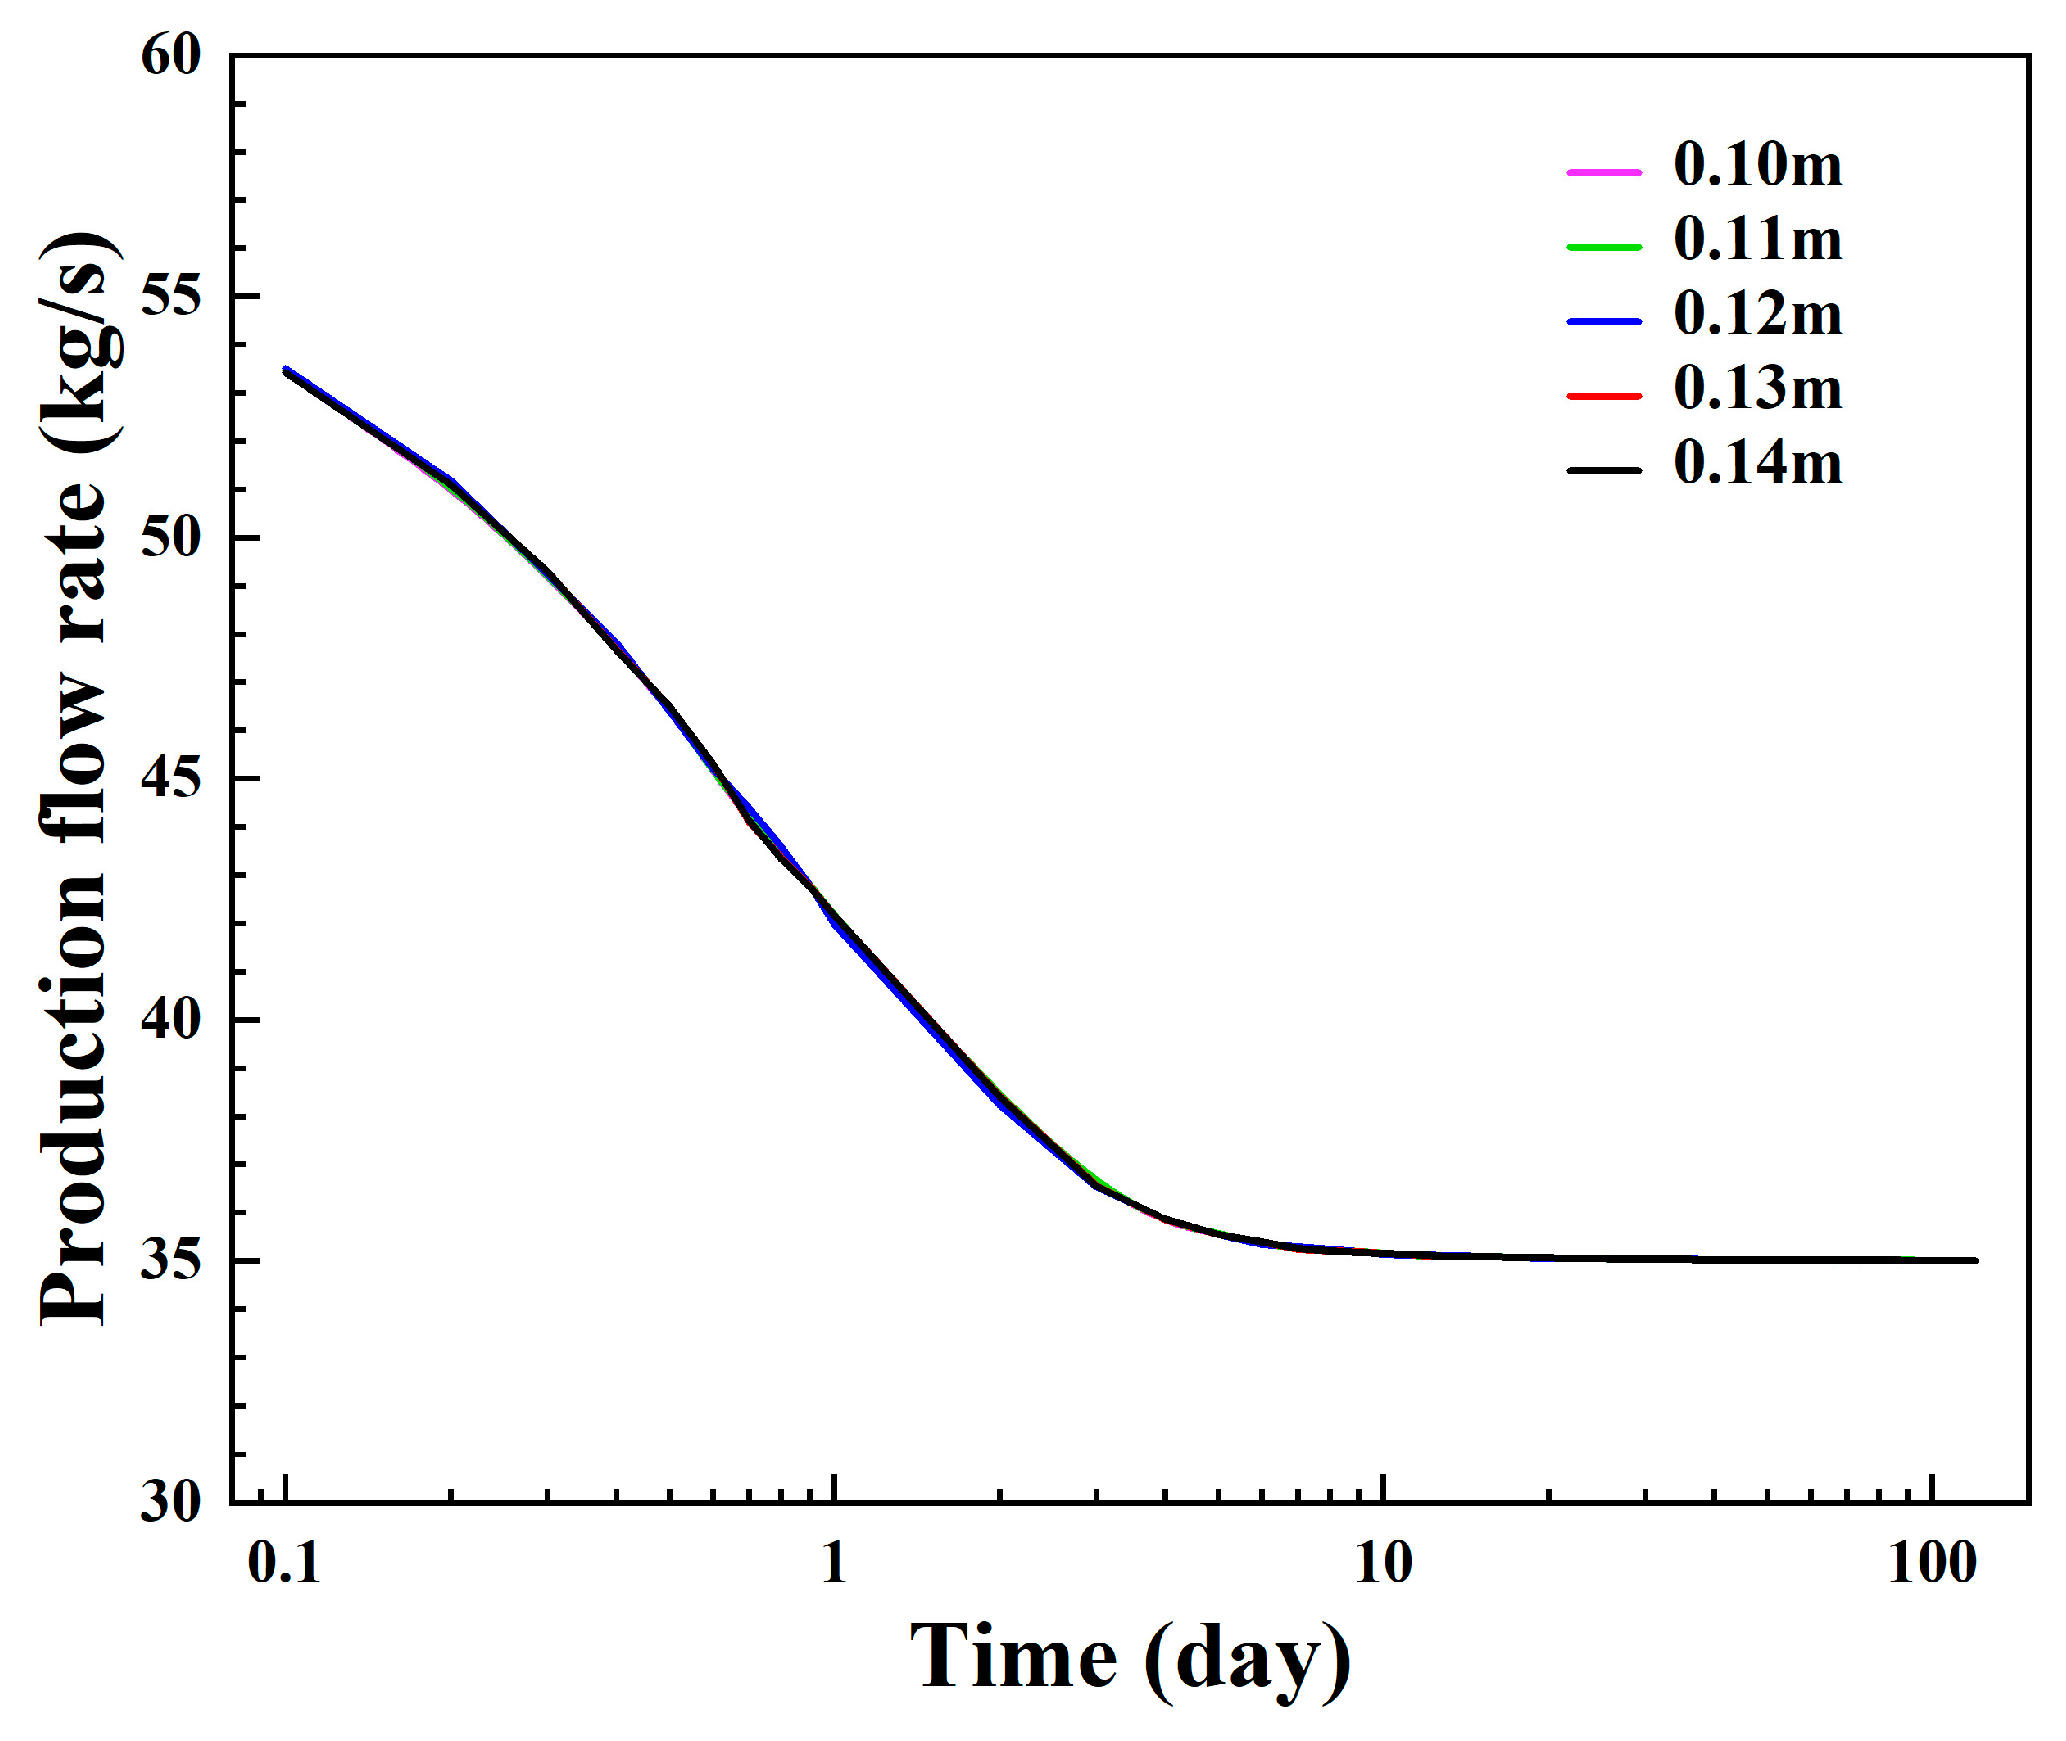
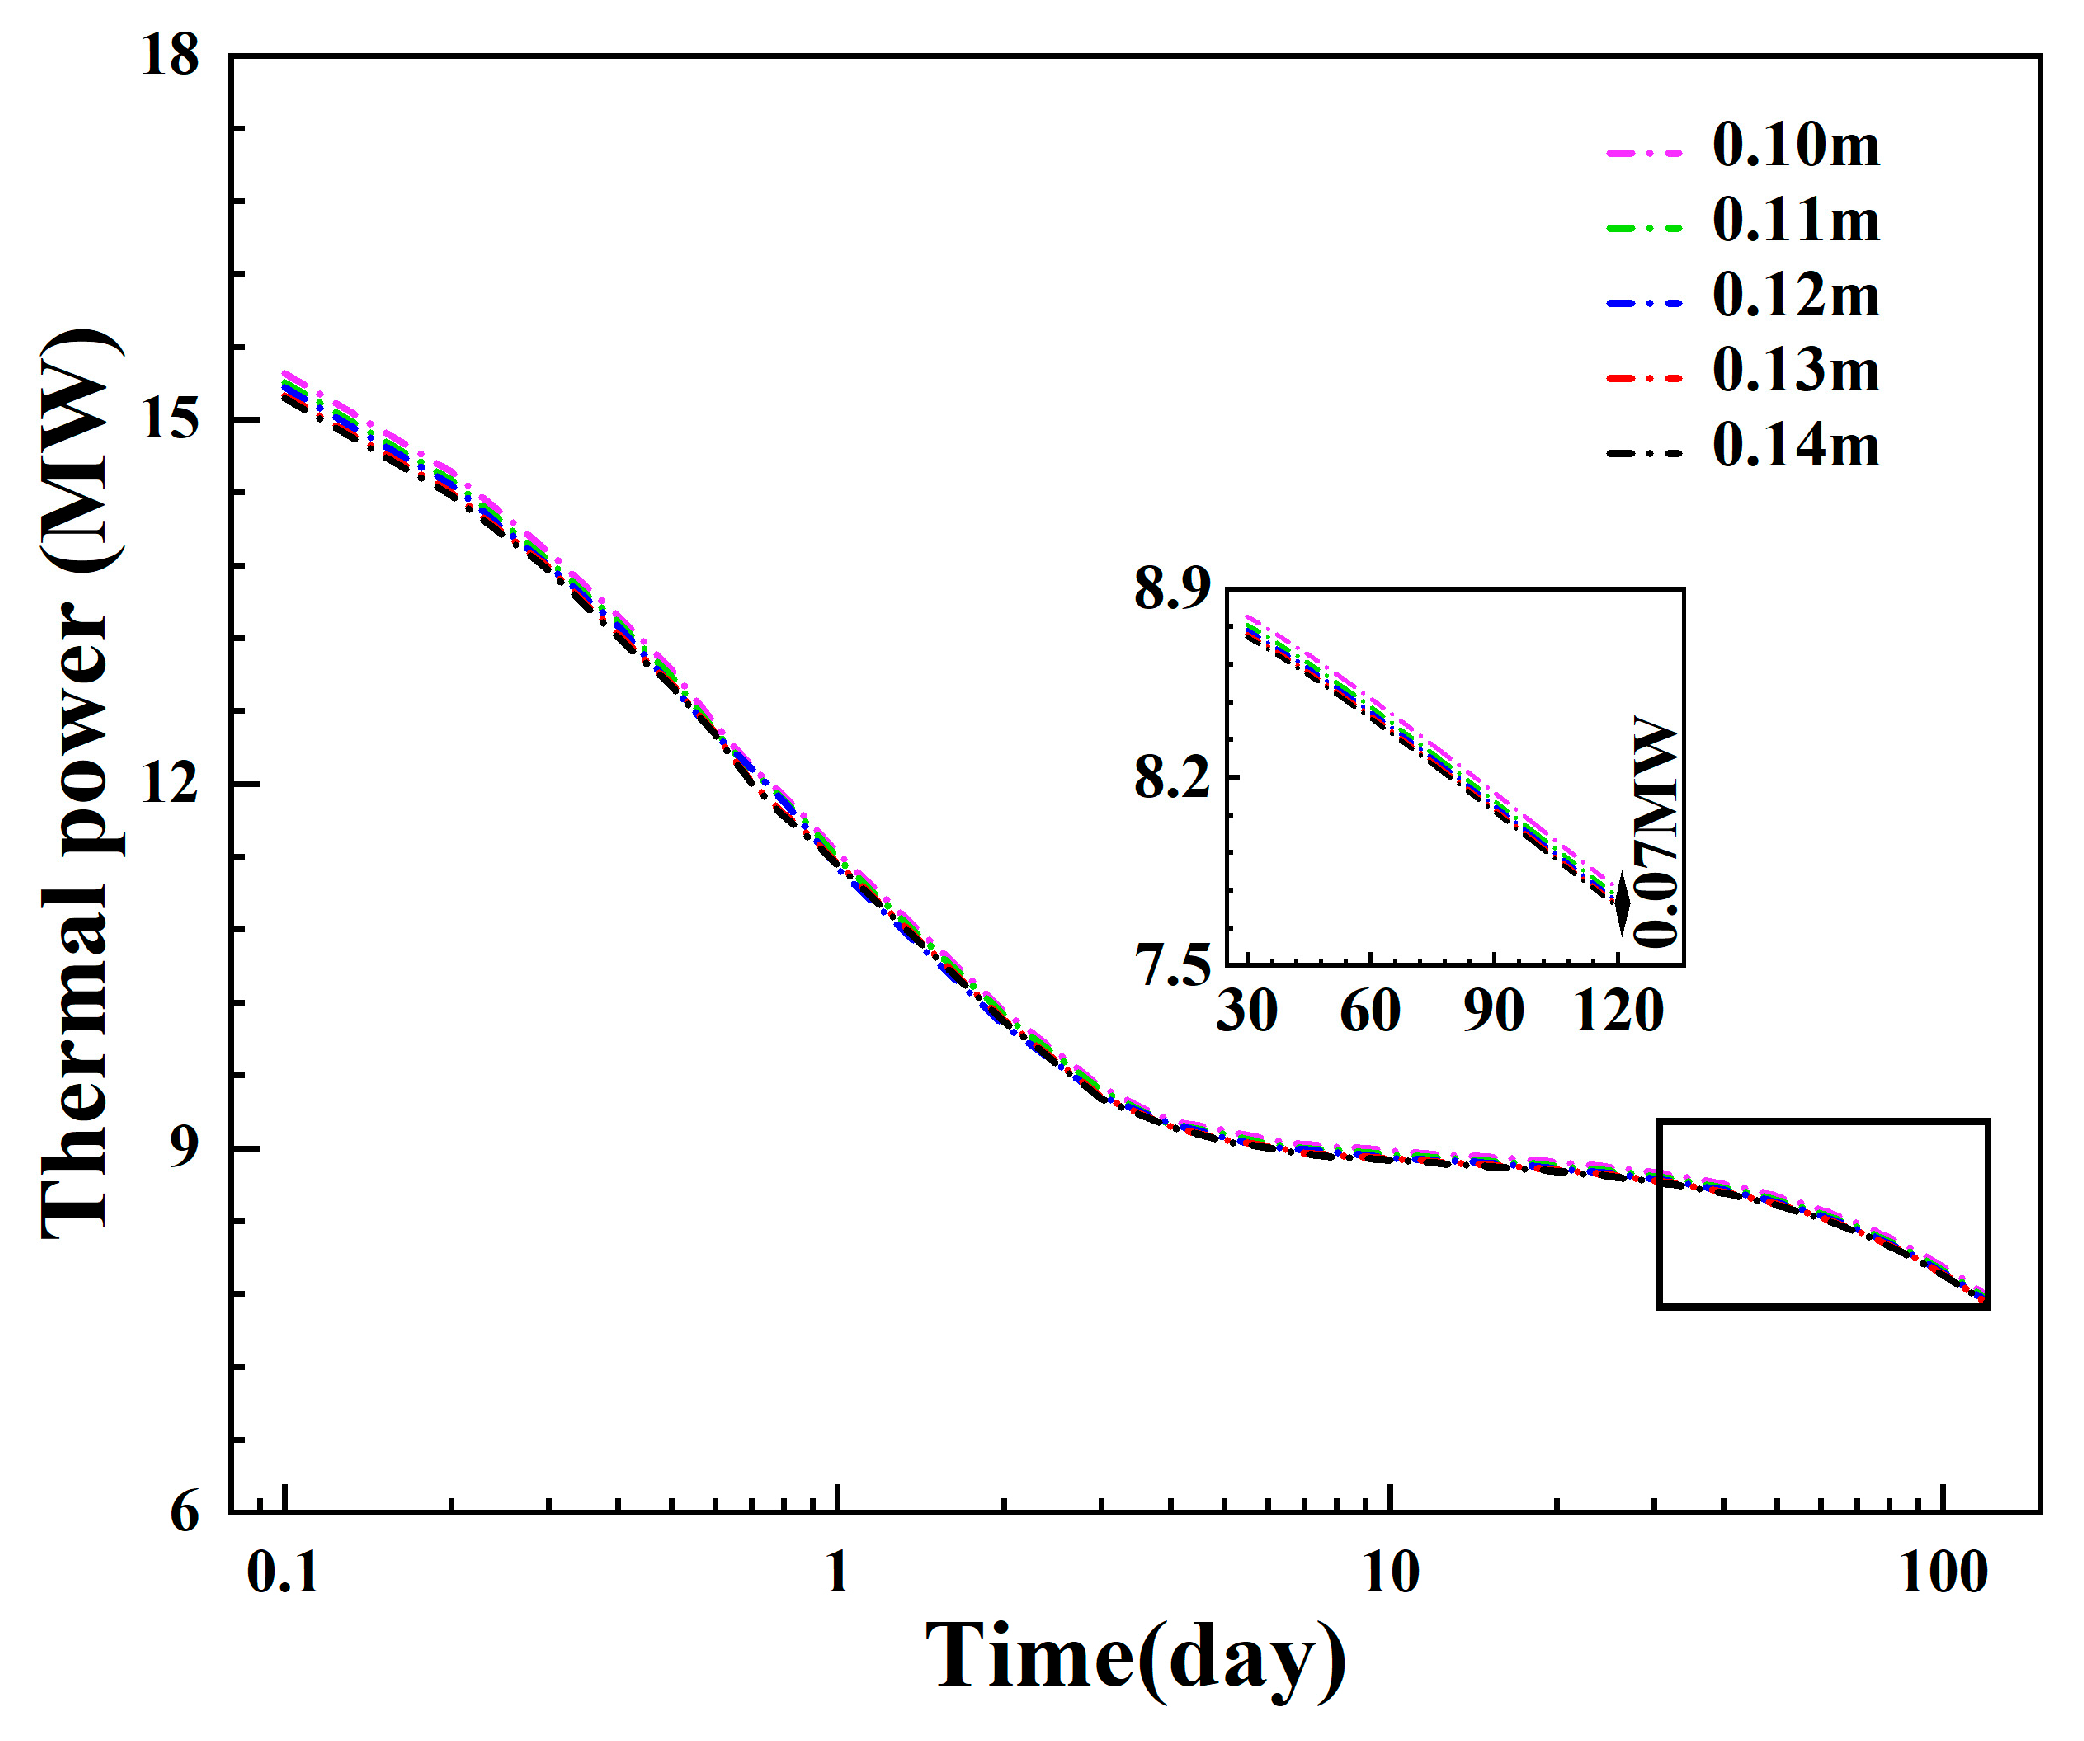
Figure 21 and Figure 22 show the changes in the production flow rate and the thermal power under different inner pipe diameters. It can be seen that the inner pipe’s diameter has a negligible impact on the fluid production of the system. The maximum variation range of the system’s thermal power is only 0.07 MW, indicating that the inner pipe’s diameter has a relatively small impact on the heat production. In summary, the diameter of the insulated inner pipe has a relatively limited impact on wellbore heat transfer, but it can significantly affect the system’s injection–production pressure difference by changing the flow spaces of the inner pipe and the annulus.

3.1.4. Influence of the Injection–Production Spacing

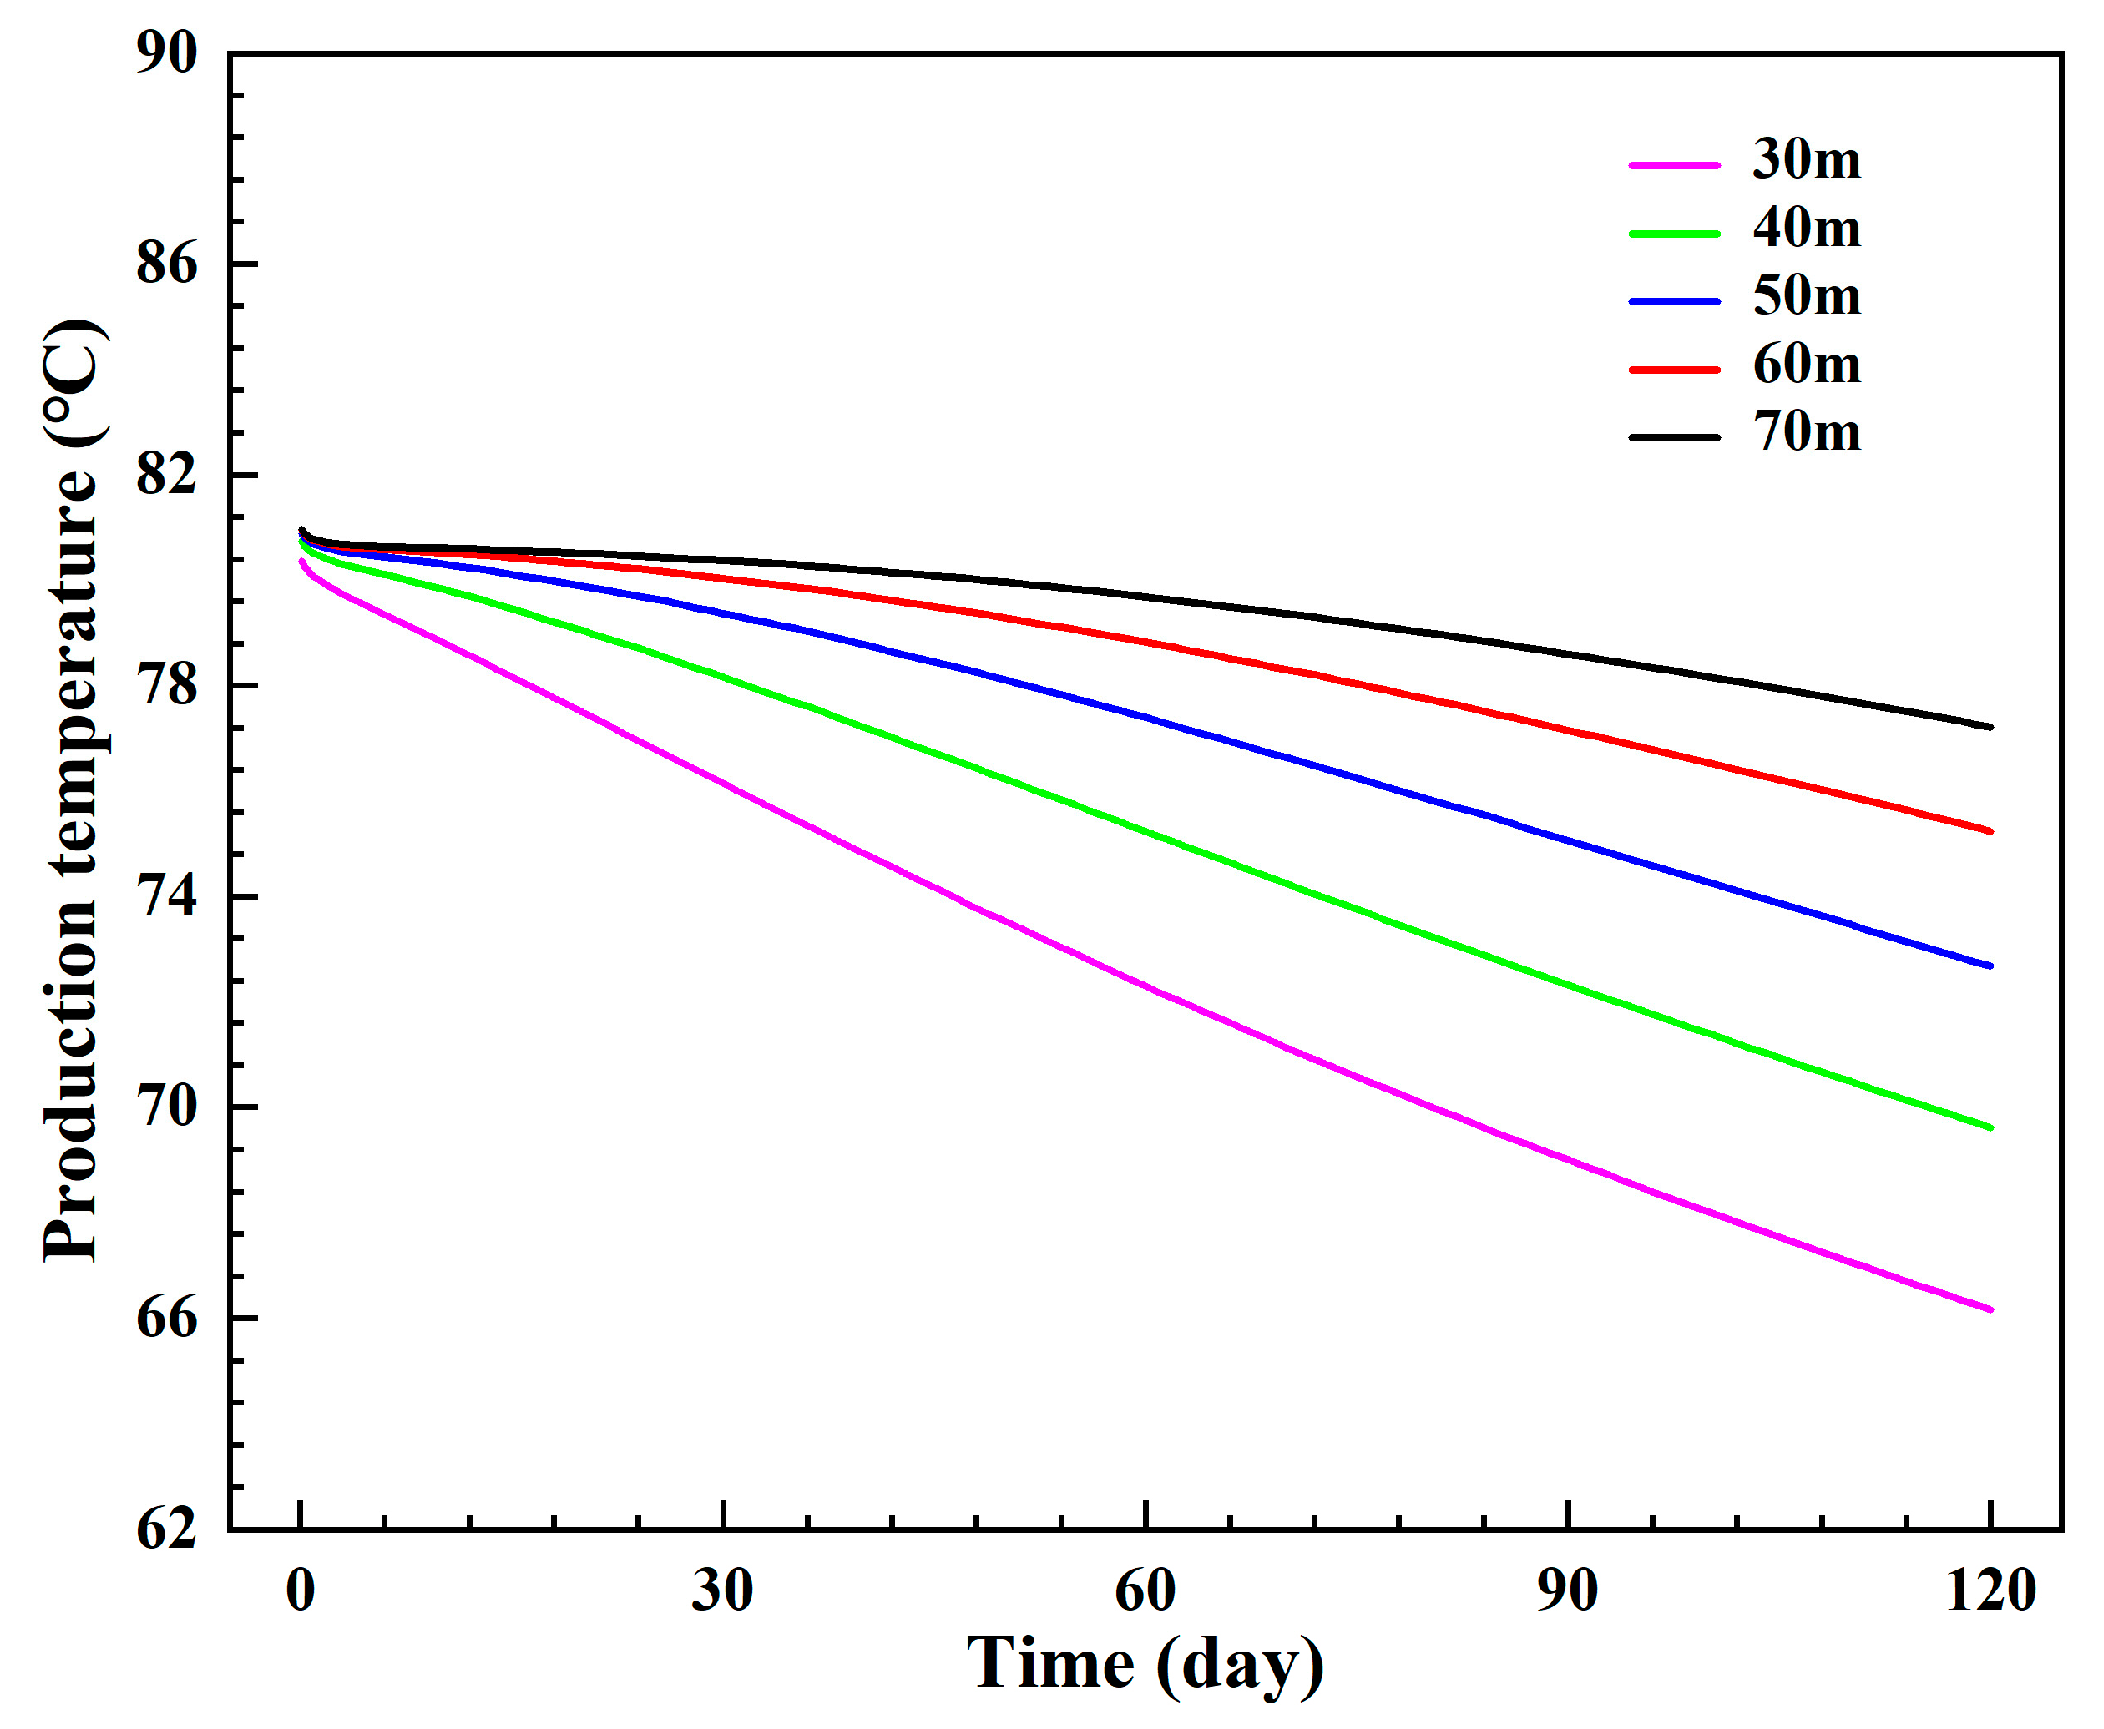
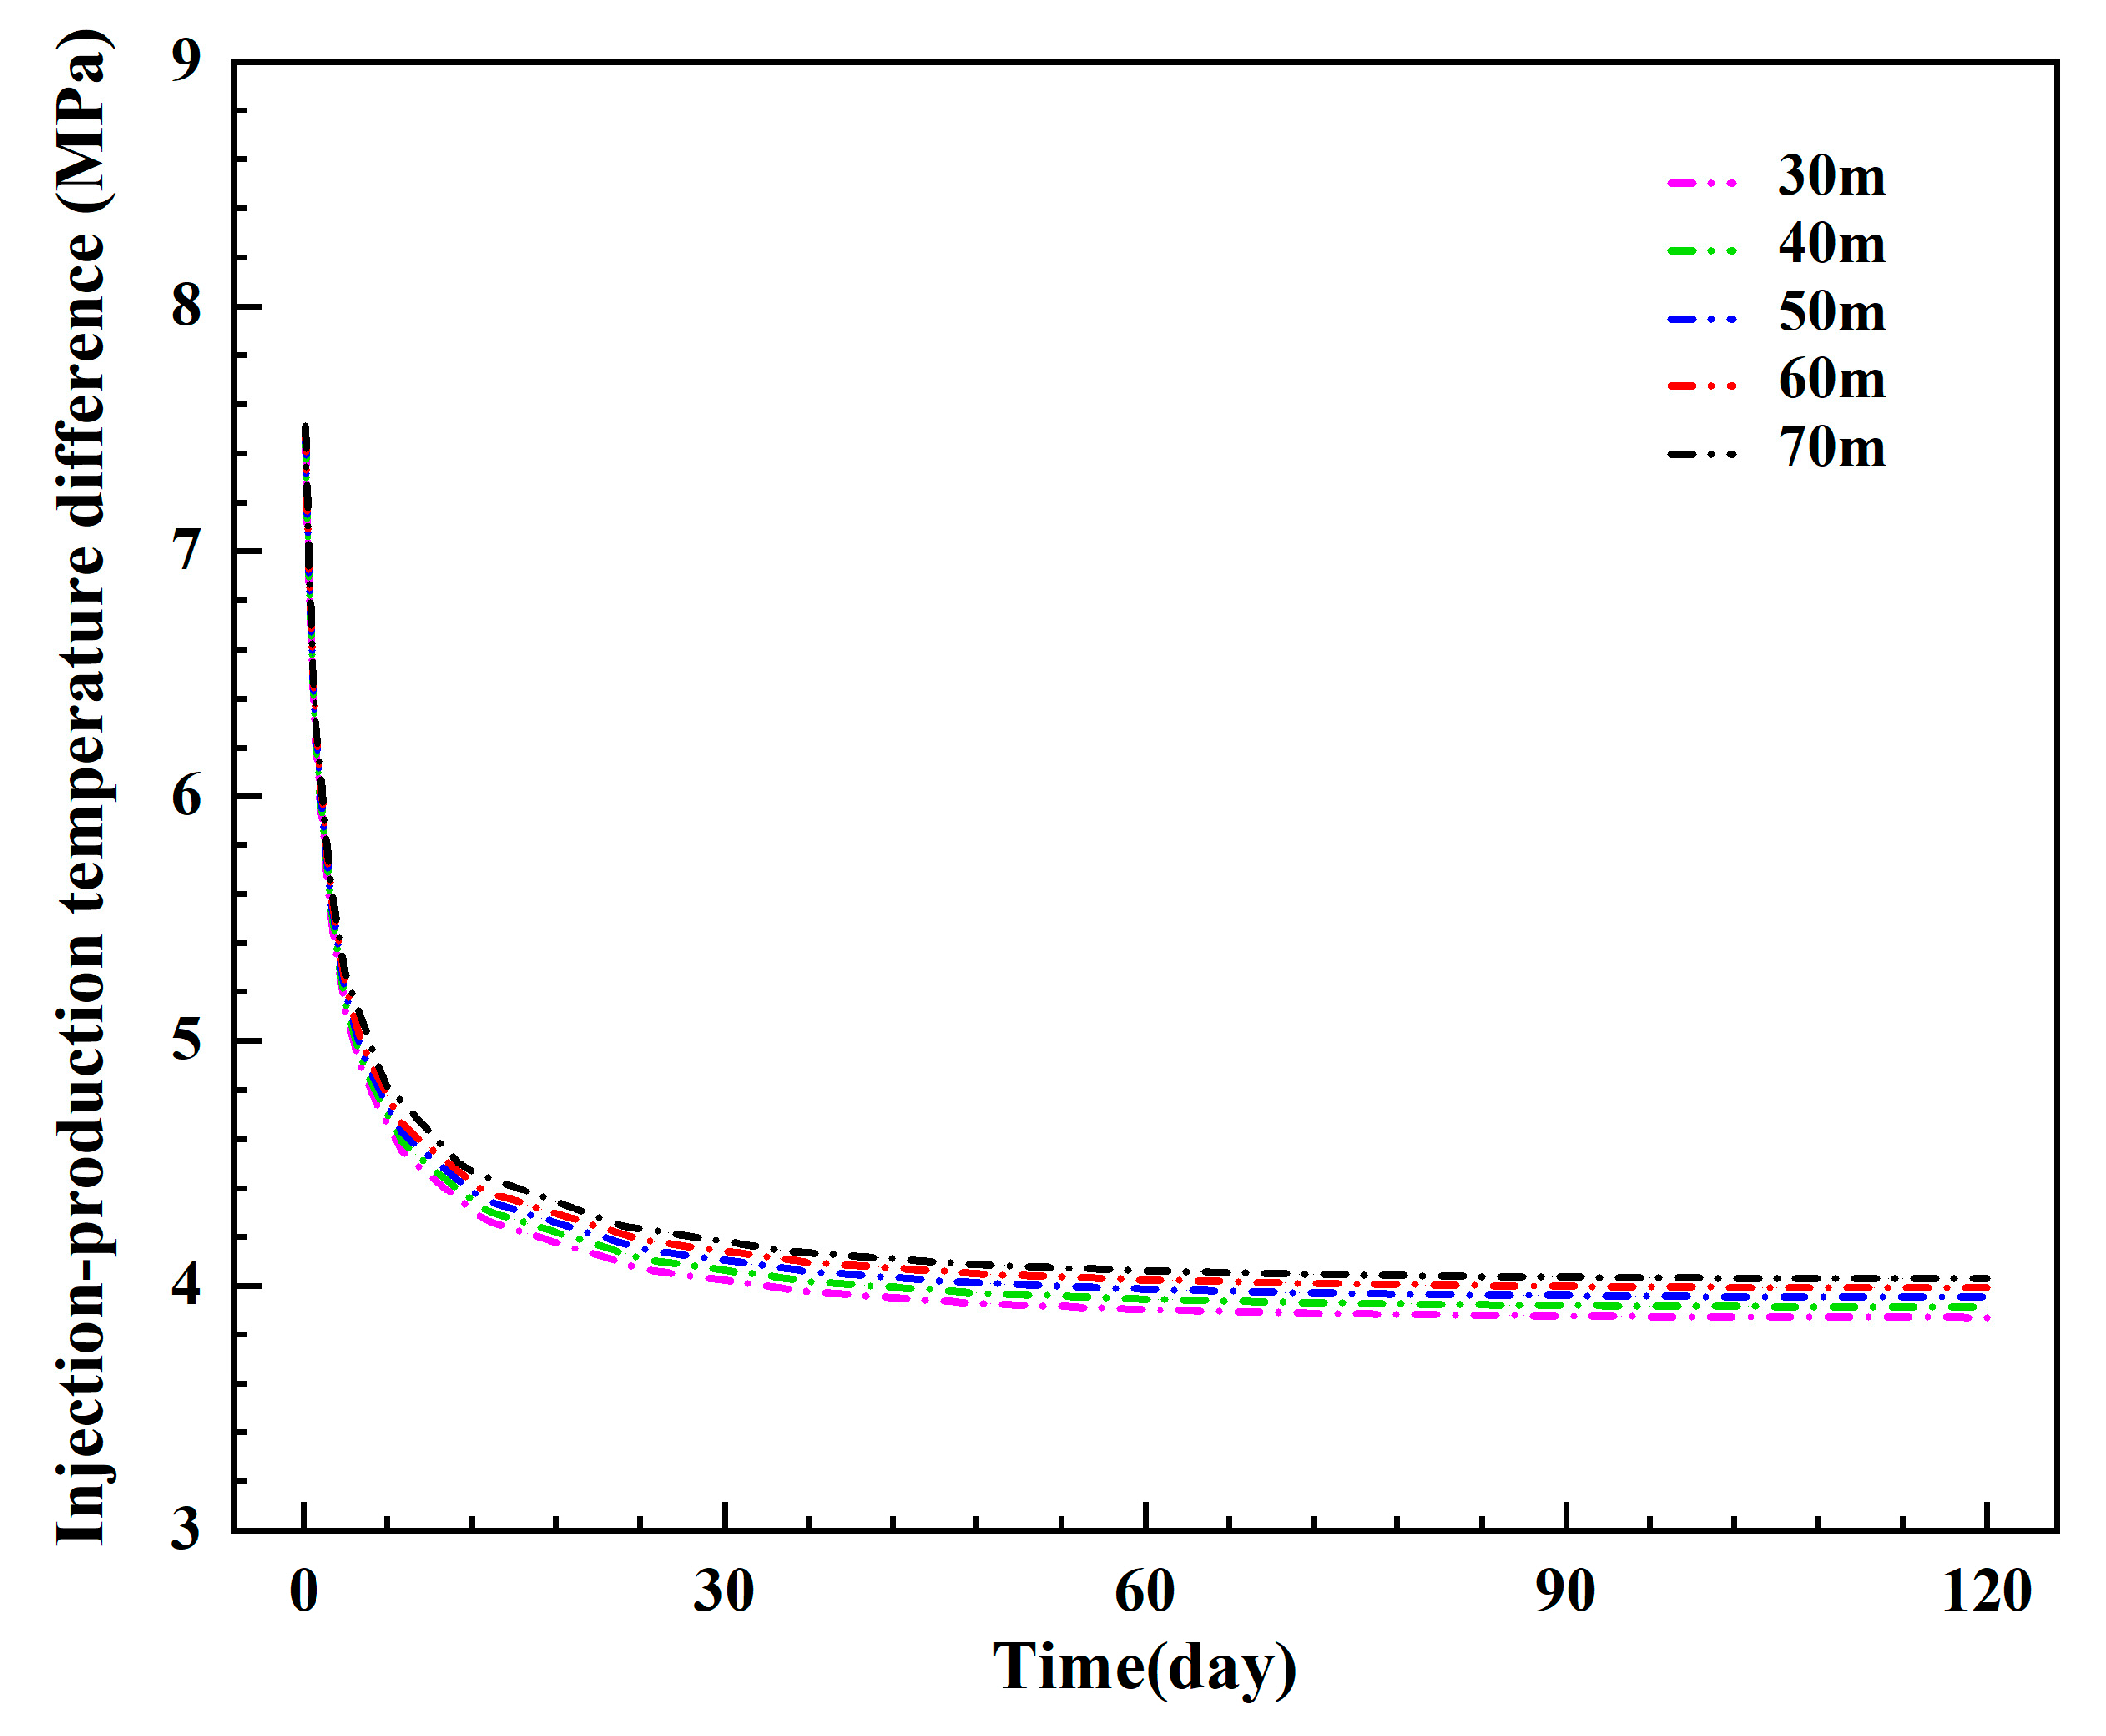
Figure 23 and Figure 24 illustrate the changes in production temperature and injection–production pressure difference under varying injection–production spacings. A decrease in injection spacing leads to a more pronounced thermal breakthrough. This is primarily due to the shorter fluid flow time, which leads to insufficient heat exchange. After 120 days, the outlet temperature of the system with an injection–production spacing of 30 m reaches 66.16 °C, approximately 11.06 °C lower than that of the system with a spacing of 70 m. The temperature reduction with a 70 m spacing is 3.75 °C compared to the original reservoir temperature. Hence, the thermal breakthrough is limited when the injection–production spacing exceeds 70 m. Additionally, a smaller injection–production spacing reduces the flow resistance along the path, thereby facilitating the extraction of injected fluids and slightly decreasing the system’s injection–production pressure difference.
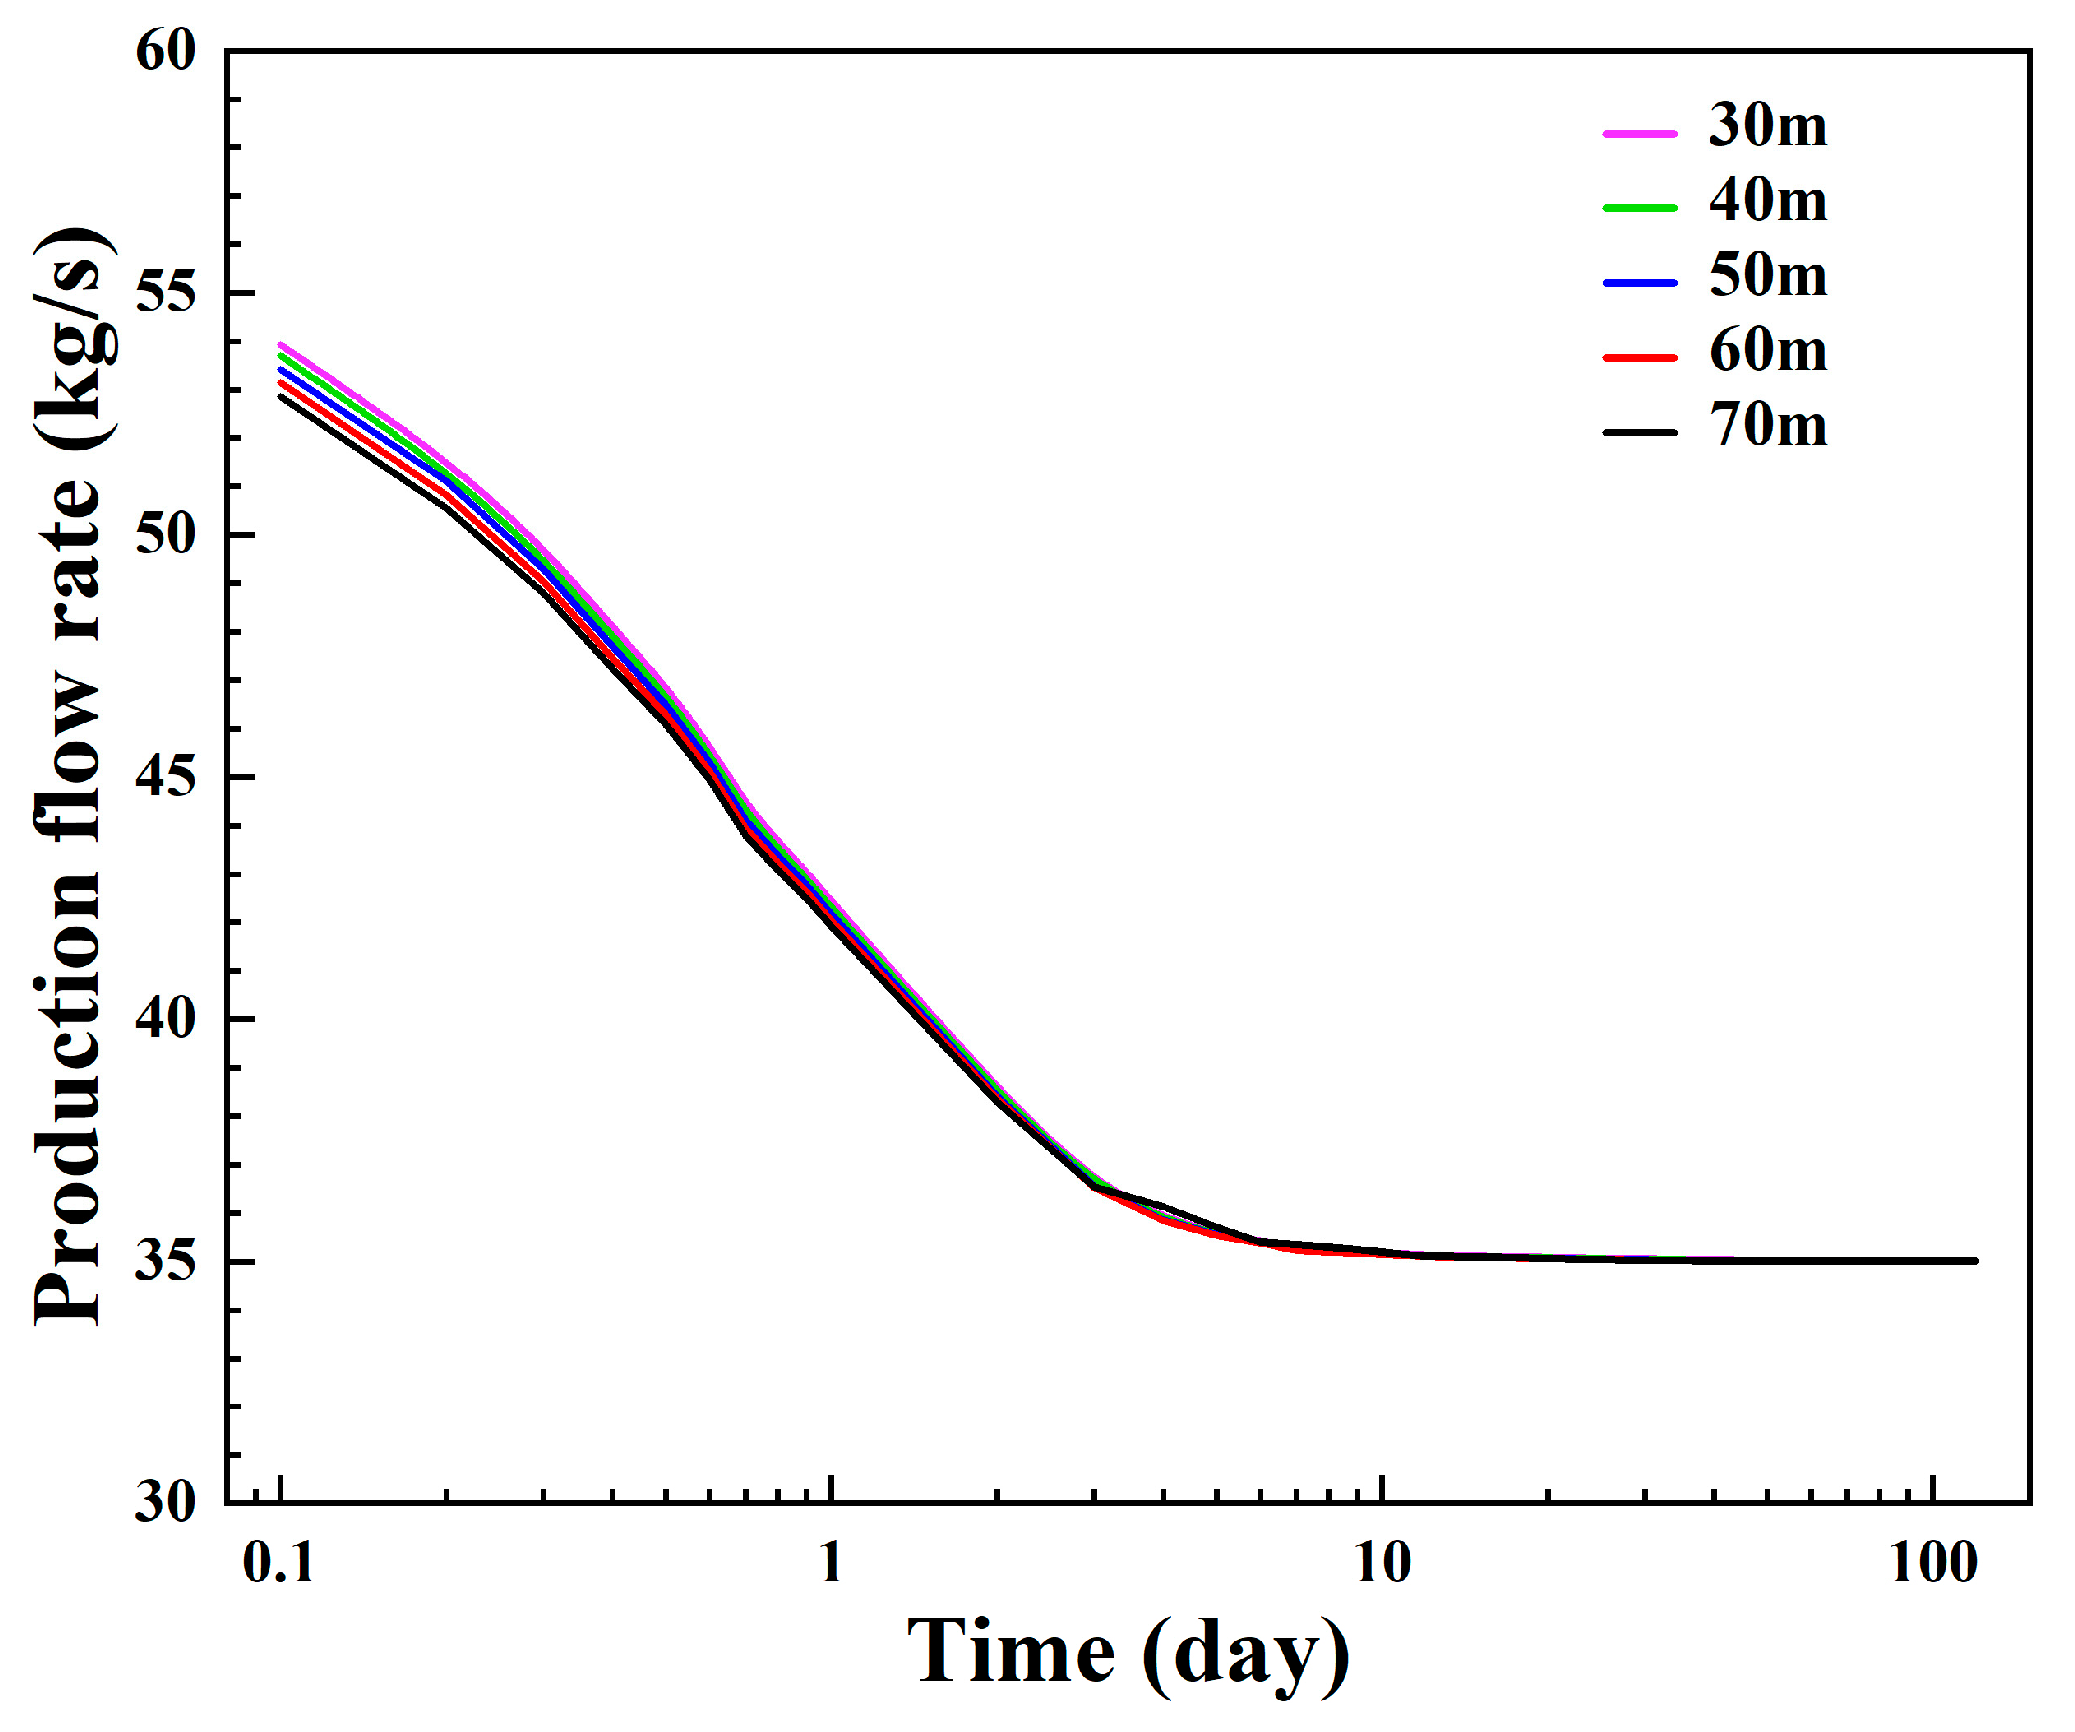
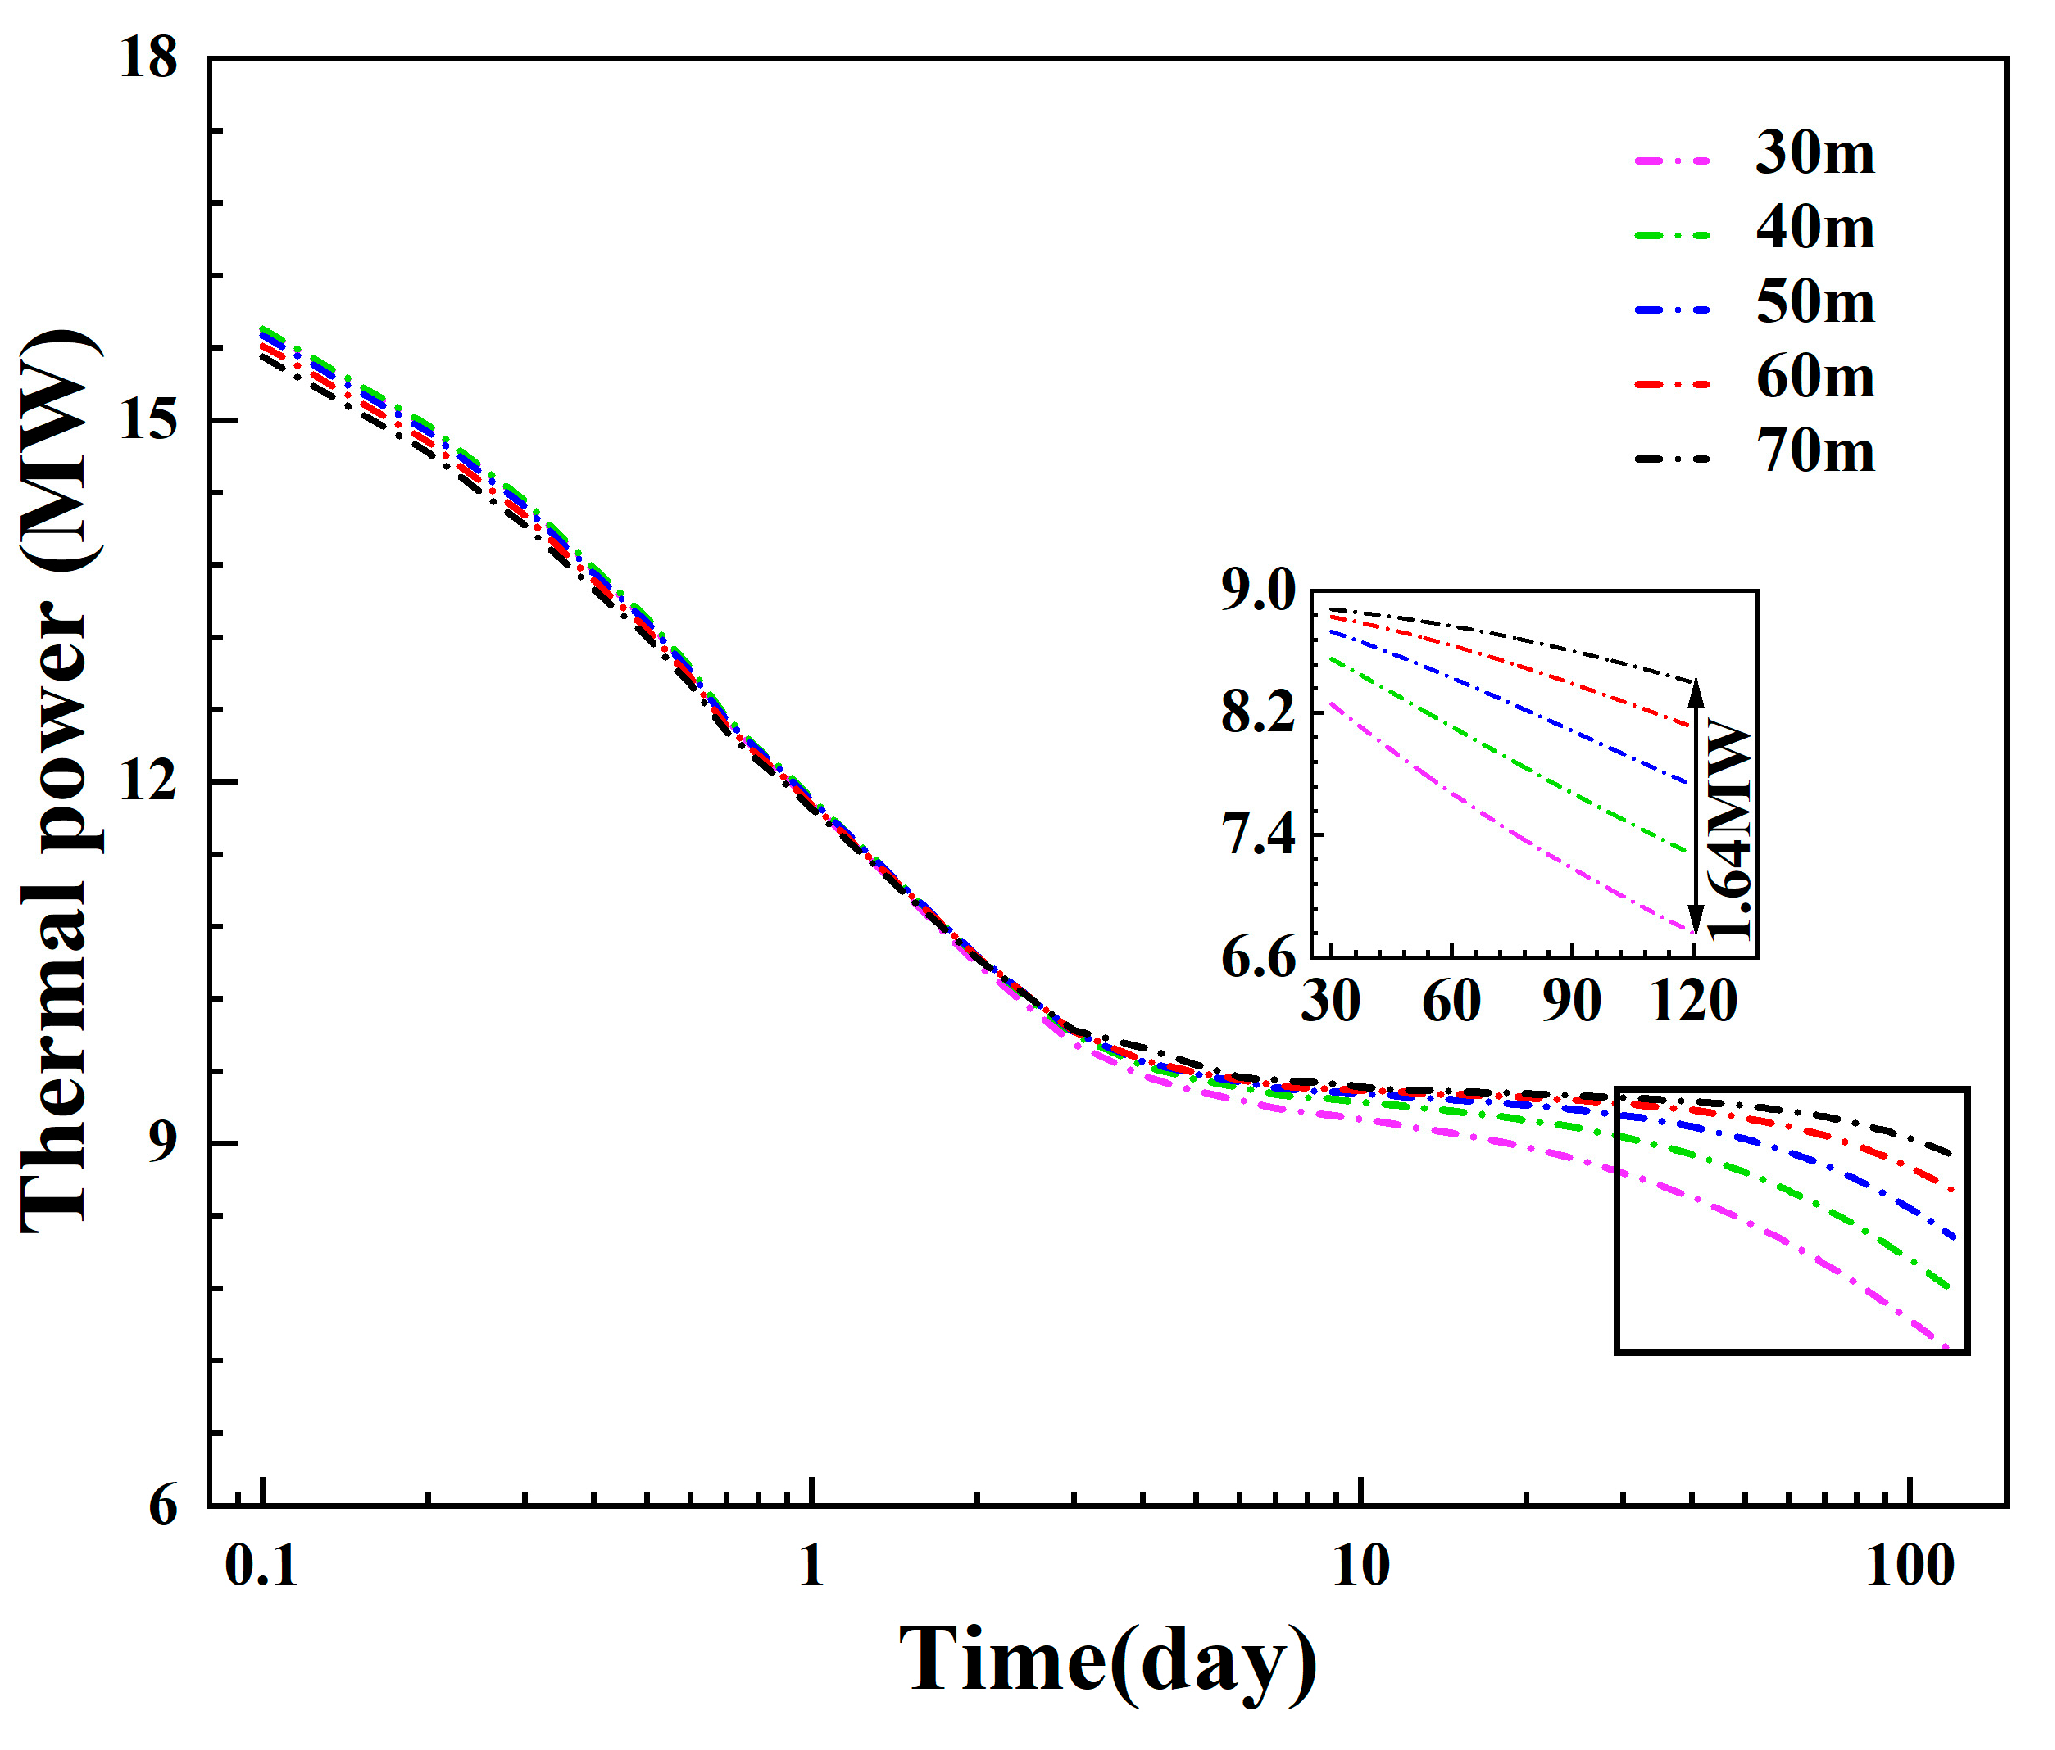
Figure 25 and Figure 26 illustrates the changes in production flow rate and thermal power under different injection–production spacings. The figures show that the injection–production spacing mainly affects fluid production during the early stages, and a larger spacing leads to an increase in heat output. After 120 days, the thermal power of the system with an injection–production spacing of 70 m reaches 8.40 MW, which is an increase of 1.64 MW compared to the system with a spacing of 30 m. This indicates that injection–production spacing has a significant effect on thermal power. In conclusion, the influence of injection–production spacing on the fluid injection and production is limited, but it has a substantial impact on the thermal breakthrough. To enhance heat exchange, it is recommended to use a higher injection–production spacing.

3.2. Sensitivity Analysis of Various Parameters

In this section, a sensitivity analysis was carried out to evaluate the influence degree of different wellbore parameters, obtain sensitive factors, and thus provide guidance for formulating reasonable production plans. It should be noted that since the system production tends to be stable in the middle and late stages, the system’s production temperature, injection–production pressure difference, and thermal power after 120 days were used as evaluation indicators in the sensitivity analysis. In addition, since different parameters have little influence on fluid production, no sensitivity analysis was performed on the system’s production flow rate.
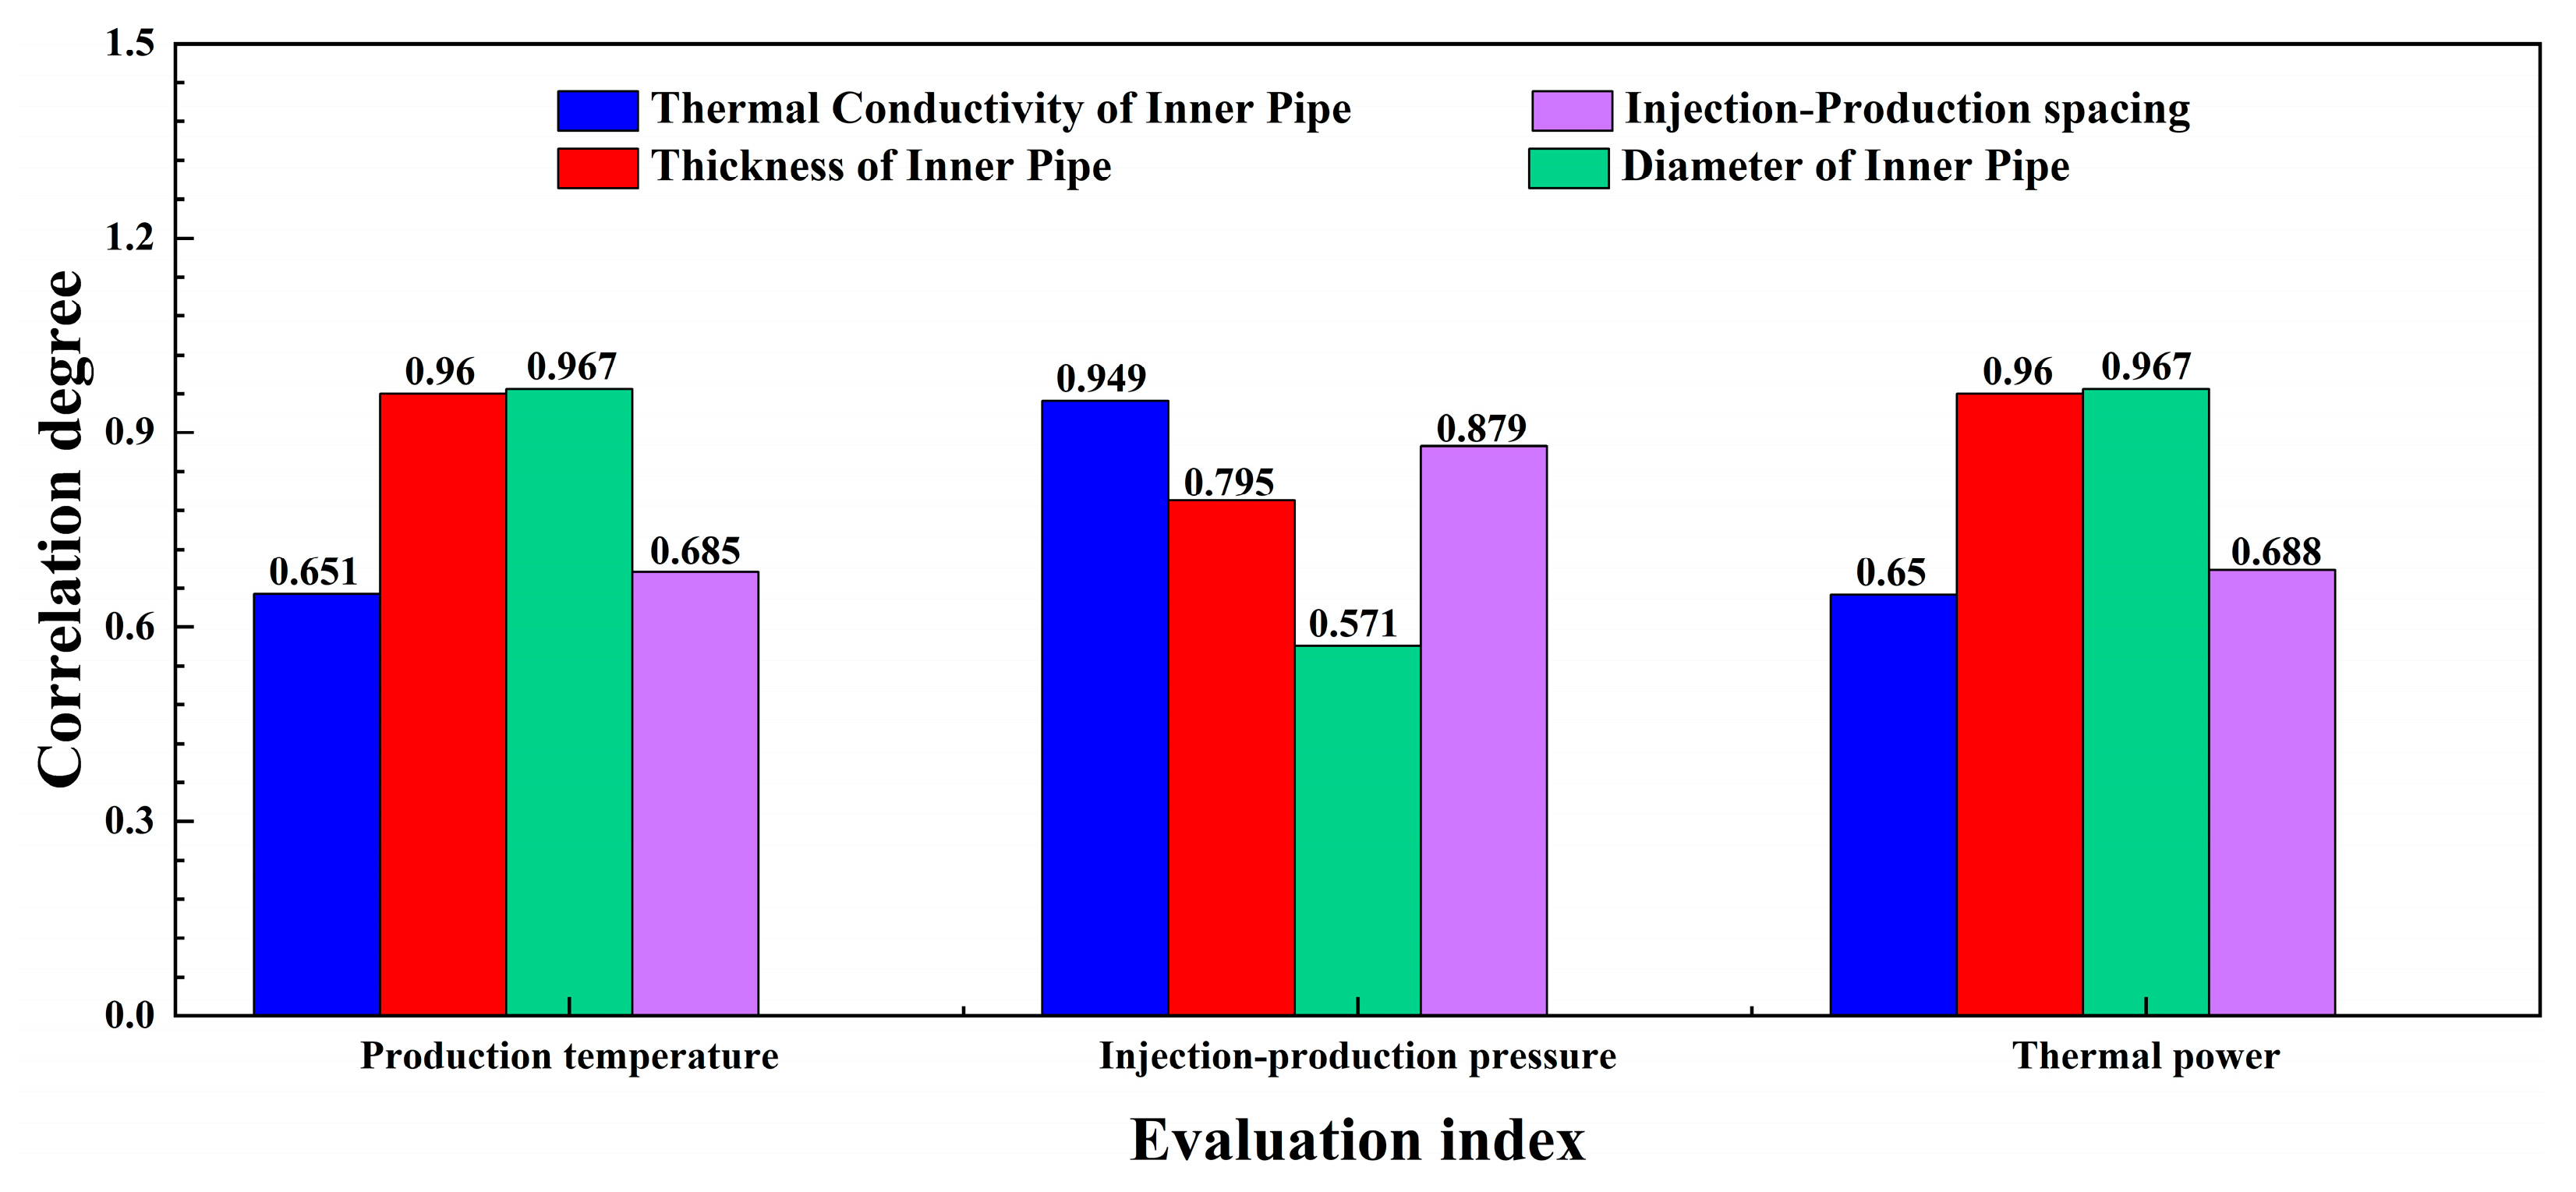
In this section, the grey relational analysis method was used to study the influence degree of different parameters [25]. The principle of this method is to evaluate the similarity of the geometric shapes of sequence curves according to the degree of correlation between sequences. The production temperature, injection–production pressure difference, and thermal power under different wellbore parameters are listed in Table 5, Table 6 and Table 7, respectively. The normalized results obtained through dimensionless processing are listed in Table 8, Table 9 and Table 10, respectively. In addition, x0 = {1, 1, 1, 1, 1} was set as the reference sequence. It can be observed that the sequence values remain unchanged. As the degree of correlation increases, the change trends between the comparison sequence and the reference sequence become closer, which means that the variation range of the system production is more limited. Therefore, the larger the degree of correlation, the smaller the influence of this parameter on the system production.
Figure 27 shows the degrees of correlation under different wellbore parameters. Considering that there are many wellbore parameters and the influence of parameters with a degree of correlation exceeding 0.9 is relatively limited, only the wellbore parameters with a degree of correlation less than 0.9 were included in the ranking. It can be seen from the figure that the sensitivity ranking of wellbore parameters is thermal conductivity of insulated pipe > injection–production spacing for the production temperature and thermal power. It is worth noting that the degrees of correlation of the thermal conductivity of an insulated pipe and injection–production spacing are less than 0.7. This indicates that enough attention should be focused on these two parameters to effectively regulate the production temperature and thermal power. In addition, the sensitivity ranking of wellbore parameters is inner pipe diameter > inner pipe thickness > injection–production spacing for the injection–production pressure difference. Therefore, the effective regulation of the injection–production pressure difference in a geothermal system mainly relies on changing the inner pipe’s diameter.

4. Conclusions

The open-loop geothermal system with a horizontal well is expected to be a favorable method to exploit geothermal energy. The wellbore design of the open-loop geothermal system is significant for enhancing the performance. In this paper, a coupled wellbore–fractured reservoir model is developed. The temperature distribution in the wellbore is studied. Also, the impacts of various wellbore parameters are evaluated. Grey relational analysis is utilized to quantify the sensitivity of wellbore parameters. The main findings are as follows:
(1)
The insulated pipe plays a key role in the heat loss of the production fluid, and the temperature decrease is only 0.29 °C after 120 days if the inner pipe has an excellent insulation performance. The fluid temperature increase in the annulus is only 1.24 °C after 120 days, while it exceeds 50 °C in the geothermal reservoir. Thus, the fractured reservoir dominates the heat extraction capacity of the injection fluid.
(2)
The inner pipe’s thermal conductivity can significantly impact the production temperature and thermal power. To ensure heat output, it is necessary to use an insulated inner pipe with a low thermal conductivity. The production temperature decrease is negligible when the inner pipe’s thermal conductivity is less than 0.023 W/(m·K). Appropriate reductions in the inner pipe’s thickness can help to reduce the injection–production pressure difference, and a thickness of 0.015 m is appropriate to decrease the heat loss and obtain a relatively low injection–production pressure difference.
(3)
The diameter of the inner pipe can affect the injection–production pressure difference by changing the flow spaces of the inner pipe and the annulus, and the injection–production pressure difference is the lowest when the inner pipe’s diameter is 0.12 m or 0.13 m. A longer injection section can effectively delay thermal breakthrough and reduce the injection–production pressure difference. The thermal breakthrough is limited if the injection–production spacing exceeds 70 m.
(4)
For the production temperature and thermal power, the sensitivity of the wellbore parameters is ranked as follows: thermal conductivity of insulated pipe > injection–production spacing. For the injection–production pressure difference, the sensitivity of the wellbore parameters is ranked as follows: diameter of the insulated pipe > thickness of the insulated pipe > injection–production spacing. Hence, sufficient attention should be paid to the diameter and thickness of the insulated pipe to ensure effective regulation of the injection–production pressure difference in the production of a geothermal system.
This study focuses on the rational wellbore design of an open-loop geothermal system with a horizontal well. In this system, the insulation pipe governs heat extraction by controlling the heat loss of the production fluid in the wellbore, whereas the injection–production spacing influences heat extraction by determining the thermal breakthrough in the reservoir. Hence, the reasonable values of thermal conductivity, thickness, and diameter for the insulation pipe are weakly influenced by production time. In contrast, the rational injection–production spacing is strongly dependent on production time, as thermal breakthrough becomes increasingly pronounced with prolonged operation. Thus, the recommended injection–production spacing should be enlarged when the production period exceeds 120 days. In addition, considering the complexity of the underground geothermal reservoir, the heterogeneity and anisotropy should be considered to improve the proposed model. A long-term production simulation needs to be carried out to further investigate the relationship between optimal injection–production spacing and production time.

Author Contributions

Investigation and Supervision, L.X.; Resources and Supervision, Y.L.; Methodology and Writing—Review and Editing, G.W.; Writing—Original Draft Preparation, H.X.; Software and Supervision, F.G.; Data Curation and Project Administration, Y.Z.; Funding Acquisition and Formal Analysis, Y.G.; Funding Acquisition and Visualization, J.S. All authors have read and agreed to the published version of the manuscript.

Funding

This research was supported by the Project of CNOOC Key Laboratory of Liquefied Natural Gas and Low-Carbon Technology (Grant No. CGP2024YF036).

Data Availability Statement

The data presented in this study are available upon request from the corresponding author.

Acknowledgments

The authors are grateful to the editor and anonymous reviewers for their careful reviews and detailed comments.

Conflicts of Interest

Authors Li Xiao, Youwu Li, Feng Gu, Yue Zhang, Ying Gao and Jingyao Sun were employed by the company CNOOC Key Laboratory of Liquefied Natural Gas and Low-Carbon Technology, Beijing, China. The remaining authors declare that the research was conducted in the absence of any commercial or financial relationships that could be construed as a potential conflict of interest.

Abbreviations

The following abbreviations are used in this manuscript:
AfTransfer area of the fractures, m2
AmTransfer area of the matrix, m2
AcCross-section area of flow channel, m2
CThermal capacity of the solid component, (J/(kg·K))
cf, inThermal capacity of inlet fluid, J/(kg·K)
cf, outThermal capacity of outlet fluid, J/(kg·K)
csThermal capacity of rock, J/(kg·K)
diInner pipe diameter, m
hinConvective heat transfer coefficient between produced fluid and wellbore, W/(m2·K)
hmHeat transfer coefficient between injected and produced fluid, W/(m2·K)
hlmHeat transfer coefficient between fracture fluid and solid component, W/(m2·K)
MmfMass exchange rate from matrix to fractures, kg/(m3·s)
eSurface roughness of pipe, μm
fDDarcy friction factor
kfFracture permeability, m2
kmMatrix permeability, m
NuNusselt number
PThermal power, MW
pPressure, Pa
Q1Heat transfer from the produced fluid to injected fluid, W
Q2Heat transfer from the surrounding formation to injected fluid, W
qinVolumetric flow rate of injected fluid, m3/s
qoutVolumetric flow rate of produced fluid, m3/s
ReReynolds number
ri,roInner and outer radius of the pipe, m
TinTemperature of inlet fluid, K
ToutTemperature of outlet fluid, K
ufDarcy velocity in the fractures, m/s
umDarcy velocity in the matrix, m/s

Greek Symbols

αThermal diffusivity, m2/s
βsCompressibility coefficient of the solid phase in the rock, Pa−1
γGravitational acceleration, m/s2
λThermal conductivity, W/(m·K)
λfThermal conductivity of fluid, W/(m·K)
λsThermal conductivity of rock, W/(m·K)
λeffEffective thermal conductivity of the formation, W/(m·K)
ρfDensity of working fluid, kg/m3
ρf, inDensity of inlet fluid, kg/m3
ρf, outDensity of outlet fluid, kg/m3
ρsDensity of rock, kg/m3
ƞpPump efficiency
μfViscosity of working fluid, Pa·s
φmFormation porosity
φfFracture porosity

References

  1. Iacobuţă, G.I.; Brandi, C.; Dzebo, A.; Duron, S.D.E. Aligning climate and sustainable development finance through an SDG lens. The role of development assistance in implementing the Paris Agreement. Glob. Environ. Chang. 2022, 74, 102509. [Google Scholar] [CrossRef]
  2. Babaei, M.; Nick, H.M. Performance of low-enthalpy geothermal systems: Interplay of spatially correlated heterogeneity and well-doublet spacings. Appl. Energy 2019, 253, 113569. [Google Scholar] [CrossRef]
  3. Lei, Z.; Zhang, Y. Investigation on the effect of symmetrical multi-well layout on geothermal energy extraction from a fractured granitic reservoir: A case study in the Gonghe Basin, Northwestern China. Energy Rep. 2021, 7, 7741–7758. [Google Scholar] [CrossRef]
  4. Song, X.; Wang, G.; Shi, Y.; Li, R.; Xu, Z.; Zheng, R.; Wang, Y.; Li, J. Numerical analysis of heat extraction performance of a deep coaxial borehole heat exchanger geothermal system. Energy 2018, 164, 1298–1310. [Google Scholar] [CrossRef]
  5. Ke, T.; Huang, S.; Xu, W.; Li, X. Study on heat extraction performance of multiple-doublet system in Hot Sedimentary Aquifers: Case study from the Xianyang geothermal field, Northwest China. Geothermics 2021, 94, 102131. [Google Scholar] [CrossRef]
  6. Sørensen, S.N.; Reffstrup, J. Prediction of Long-Term Operational Conditions for Single-Well Groundwater Heat Pump Plants. In Proceedings of the 27th Intersociety Energy Conversion Engineering Conference, San Diego, CA, USA, 3–7 August 1992. [Google Scholar]
  7. Capozza, A.; De Carli, M.; Zarrella, A. Investigations on the influence of aquifers on the ground temperature in ground-source heat pump operation. Appl. Energy 2013, 107, 350–363. [Google Scholar] [CrossRef]
  8. Wang, G.; Song, X.; Shi, Y.; Zheng, R.; Li, J.; Li, Z. Production performance of a novel open loop geothermal system in a horizontal well. Energy Convers. Manag. 2020, 206, 112478. [Google Scholar] [CrossRef]
  9. Horne, R. Design Considerations of a Down-Hole Coaxial Geothermal Heat Exchanger. Geothermal Resources Council Transactions. Available online: https://www.osti.gov/biblio/6166794 (accessed on 1 September 1980).
  10. Beier, R.A.; Acuña, J.; Mogensen, P.; Palm, B. Transient heat transfer in a coaxial borehole heat exchanger. Geothermics 2014, 51, 470–482. [Google Scholar] [CrossRef]
  11. Holmberg, H.; Acuña, J.; Næss, E.; Sønju, O.K. Thermal evaluation of coaxial deep borehole heat exchangers. Renew. Energy 2016, 97, 65–76. [Google Scholar] [CrossRef]
  12. Warren, J.E.; Root, P.J. The behavior of naturally fractured reservoirs. Soc. Pet. Eng. J. 1963, 3, 245–255. [Google Scholar] [CrossRef]
  13. Song, X.; Shi, Y.; Li, G.; Yang, R.; Wang, G.; Zheng, R.; Li, J.; Lyu, Z. Numerical simulation of heat extraction performance in enhanced geothermal system with mul-tilateral wells. Appl. Energy 2018, 218, 325–337. [Google Scholar] [CrossRef]
  14. Wang, G.; Ma, X.; Song, X.; Li, G. Production enhancement analysis of a supercritical CO2 multi-stage EGS with horizontal wells. Renew. Energy 2025, 256, 124111. [Google Scholar] [CrossRef]
  15. Huang, Y.; Zhang, Y.; Xie, Y.; Zhang, Y.; Gao, X.; Ma, J. Long-term thermal performance analysis of deep coaxial borehole heat exchanger based on field test. J. Clean. Prod. 2021, 278, 123396. [Google Scholar] [CrossRef]
  16. Cai, X.; Liu, Z.; Xu, K.; Li, B.; Zhong, X.; Yang, M. Numerical simulation study of an Enhanced Geothermal System with a five-spot pattern horizontal well based on thermal-fluid-solid coupling. Appl. Therm. Eng. 2025, 258, 123396. [Google Scholar] [CrossRef]
  17. Shi, Y.; Song, X.; Wang, G.; McLennan, J.; Forbes, B.; Li, X.; Li, J. Study on wellbore fluid flow and heat transfer of a multilateral-well CO2 enhanced geothermal system. Appl. Energy 2019, 249, 14–27. [Google Scholar] [CrossRef]
  18. Benson, A.-L.; Clarkson, C.; Zeinabady, D. Analysis of enhanced geothermal system flowback and circulation test data for fracture and reservoir characterization. Geoenergy Sci. Eng. 2025, 245, 213532. [Google Scholar] [CrossRef]
  19. Zhang, Q.; Zhu, X.; Wang, G.; Ma, F. Characteristics, Formation Periods, and Controlling Factors of Tectonic Fractures in Carbonate Geothermal Reservoirs: A Case Study of the Jixianian System in the Xiong’an New Area, China. Acta Geol. Sin.-Engl. Ed. 2023, 97, 1625–1639. [Google Scholar] [CrossRef]
  20. Wang, Z.; Jiang, G.; Zhang, C.; Hu, J.; Shi, Y.; Wang, Y.; Hu, S. Thermal regime of the lithosphere and geothermal potential in Xiong’an New Area. Energy Explor. Exploit. 2018, 37, 787–810. [Google Scholar] [CrossRef]
  21. Allahvirdizadeh, P. A review on geothermal wells: Well integrity issues. J. Clean. Prod. 2020, 275, 124009. [Google Scholar] [CrossRef]
  22. Wei, G.; Liu, Y.; Zhang, X.; Yu, F.; Du, X. Thermal conductivities study on silica aerogel and its composite insulation materials. Int. J. Heat Mass Transf. 2011, 54, 2355–2366. [Google Scholar] [CrossRef]
  23. Cheng, A.H.; Ghassemi, A.; Detournay, E. Integral equation solution of heat extraction from a fracture in hot dry rock. Int. J. Numer. Anal. Methods Géoméch. 2001, 25, 1327–1338. [Google Scholar] [CrossRef]
  24. Morita, K.; Bollmeier, W.; Mizogami, H. Experiment to Prove the Concept of the Downhole Coaxial Heat Exchanger (DCHE) in Hawaii. Geothermal Resources Council Transactions. 1992. Available online: https://scholarspace.manoa.hawaii.edu/items/29af4c5a-281a-4ab3-95c5-d719663234cd (accessed on 4 October 1992).
  25. Chakraborty, S.; Datta, H.N.; Chakraborty, S. Grey relational analysis-based optimization of machining processes: A compre-hensive review. Process Integr. Optim. Sustain. 2023, 7, 609–639. [Google Scholar] [CrossRef]
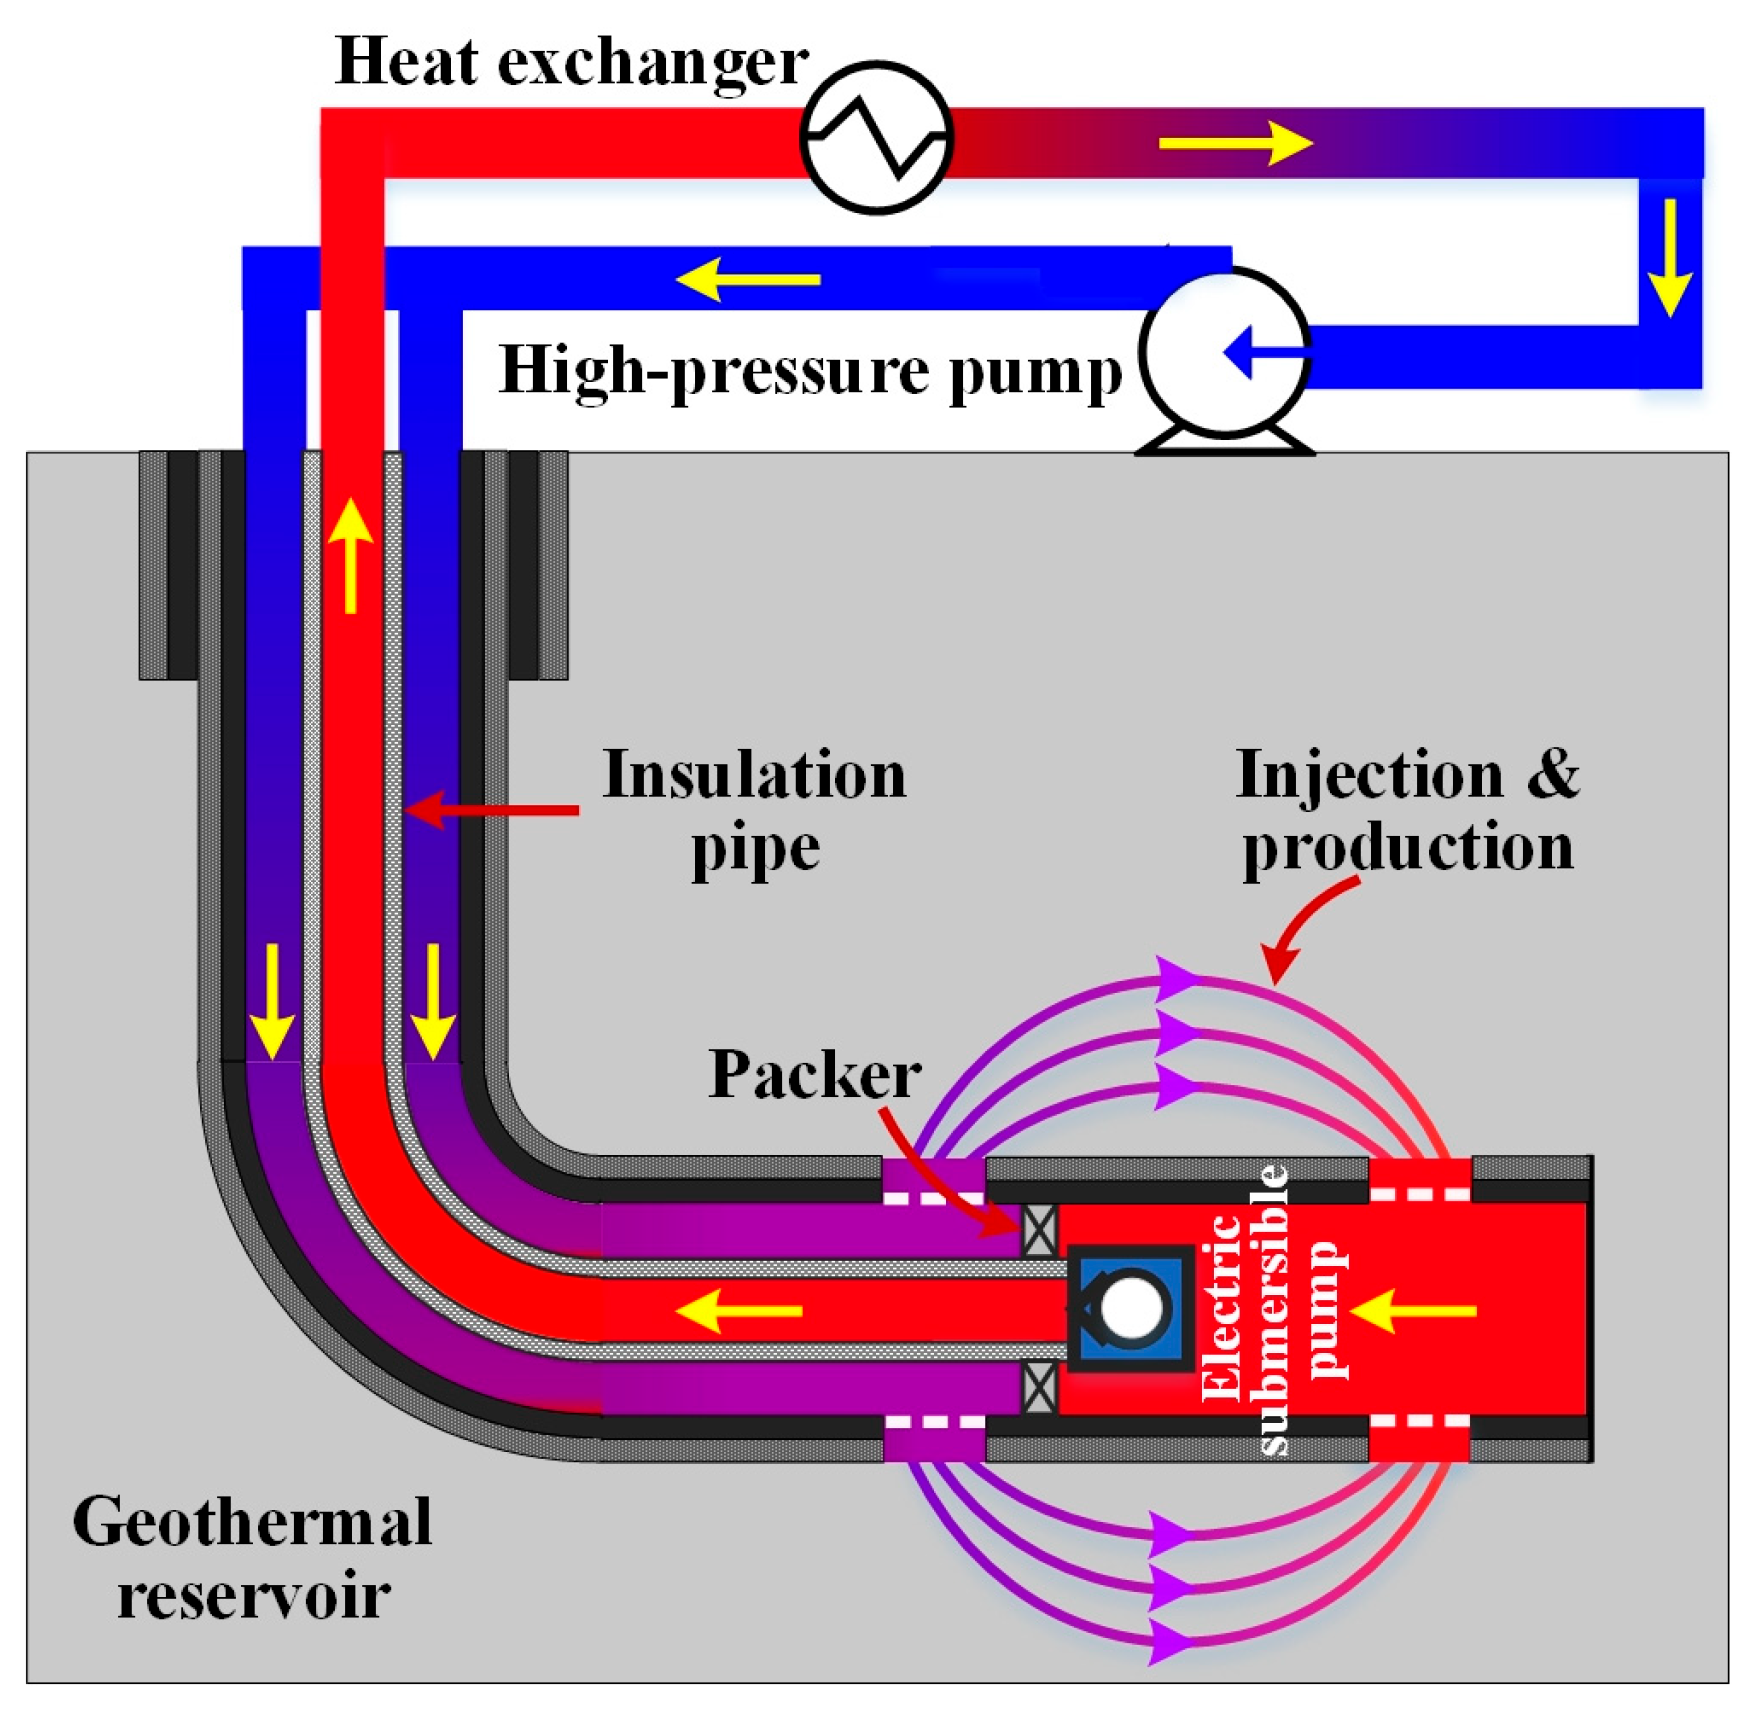
Figure 1. Schematic of production in an open-loop geothermal system with a horizontal well.
Energies 18 06090 g001
Figure 2. Concept of the fractured reservoir model proposed by Warren and Root.
Energies 18 06090 g002
Figure 3. The schematic of the geometry model of the wellbore.
Energies 18 06090 g003
Figure 4. The geometric model of the geothermal reservoir.
Energies 18 06090 g004
Figure 5. Numerical meshing schemes.
Energies 18 06090 g005
Figure 6. The thermal process in a 2D fracture system.
Energies 18 06090 g006
Figure 7. The comparison of the analytical and numerical solutions of the fracture fluid temperature.
Energies 18 06090 g007
Figure 8. The comparison of the analytical and numerical solutions of the surrounding rock temperature.
Energies 18 06090 g008
Figure 9. The comparison of the analytical and numerical solutions of the production temperature in the wellbore.
Energies 18 06090 g009
Figure 10. The fluid temperature distribution in the wellbore.
Energies 18 06090 g010
Figure 11. The change in the production temperature with various thermal conductivities of the inner pipe.
Energies 18 06090 g011
Figure 12. The change in the injection–production pressure difference with various thermal conductivities of the inner pipe.
Energies 18 06090 g012
Figure 13. The change in the production flow rate with various thermal conductivities of the inner pipe.
Energies 18 06090 g013
Figure 14. The change in the thermal power with various thermal conductivities of the inner pipe.
Energies 18 06090 g014
Figure 15. The change in the production temperature with various thicknesses of the inner pipe.
Energies 18 06090 g015
Figure 16. The change in the injection–production pressure difference with various thicknesses of the inner pipe.
Energies 18 06090 g016
Figure 17. The change in the production flow rate with various thicknesses of the inner pipe.
Energies 18 06090 g017
Figure 18. The change in the thermal power with various thicknesses of the inner pipe.
Energies 18 06090 g018
Figure 19. The change in the production temperature with various diameters of the inner pipe.
Energies 18 06090 g019
Figure 20. The change in the injection–production pressure difference with various diameters of the inner pipe.
Energies 18 06090 g020
Figure 21. The change in the production flow rate with various diameters of the inner pipe.
Energies 18 06090 g021
Figure 22. The change in the thermal power with various diameters of the inner pipe.
Energies 18 06090 g022
Figure 23. The change in the production temperature with various injection–production spacings.
Energies 18 06090 g023
Figure 24. The change in the injection–production pressure difference with various injection–production spacings.
Energies 18 06090 g024
Figure 25. The change in the production flow rate with various injection–production spacings.
Energies 18 06090 g025
Figure 26. The change in the thermal power with various injection–production spacings.
Energies 18 06090 g026
Figure 27. The change in the degrees of correlation with various wellbore parameters.
Energies 18 06090 g027
Table 1. The input parameters of the wellbore model.
ItemsValueItemsValue
Inner diameter of insulated pipe (m)0.13Outer diameter of cement (m)0.3111
Outer diameter of insulated pipe (m)0.16Thermal conductivity of insulated pipe
(W/(m·K))
0.023
Inner diameter of annulus (m)0.2224Thermal conductivity of casing
(W/(m·K))
43.75
Outer diameter of casing (m)0.2445Thermal conductivity of cement
(W/(m·K))
0.7
Table 2. The properties of a geothermal reservoir.
ItemsCap RockReservoir MatrixReservoir Fracture
Density(kg/m3)26002500Water
Thermal Conductivity
(W/(m·K))
2.13.0Water
Heat Capacity
(J/(kg·K))
850870Water
Porosity (%)37100
Permeability (m2)10−1810−1510−12
Table 3. The specific model parameters for calculation.
ItemsCap Rock
Density of Water ρf1000 kg/m3
Thermal Capacity of Water cf4200 J/(kg·K)
Viscosity of Water μf0.001 Pa·s
Density of Matrix ρs2700 kg/m3
Thermal Capacity of Matrix cs1000 J/(kg·K)
Thermal Conductivity of Matrix λs2.5 W/(m·K)
Flow Velocity uin0.01 m/s
Inlet Temperature Tin303.15 K
Initial Temperature of Matrix Ti353.15 K
Fracture Aperture d0.001 m
Table 4. Experimental data of the HGP-A well.
ItemsValueItemsValue
Thermal Conductivity of Formation (W/(m·K))1.6Inner Radius of Inner Pipe (m)0.0506
Thermal Conductivity of Cement (W/(m·K))0.99Outer Radius of Inner Pipe (m)0.0890
Thermal Conductivity of Casing (W/(m·K))46.1Inner Radius of Casing (m)0.1617
Thermal Conductivity of Inner Pipe (W/(m·K))0.06Inner Radius of Cement (m)0.1778
Thermal Capacity of Formation (J/(kg·K))870Inner Radius of Wellbore (m)0.2159
Density of Formation (kg/m3)3050Well Depth (m)876.5
Table 5. The production temperature of the system with various wellbore parameters after 120 days.
Wellbore ParametersInner Pipe Thermal ConductivityInner Pipe ThicknessInner Pipe DiameterInjection–Production Spacing
Production
Temperature
(°C)
72.882 °C71.905 °C73.080 °C66.157 °C
72.675 °C72.467 °C72.878 °C69.619 °C
66.146 °C72.675 °C72.754 °C72.675 °C
60.934 °C72.801 °C72.675 °C75.240 °C
56.838 °C72.899 °C72.625 °C77.215 °C
Table 6. The injection–production pressure difference of the system with various wellbore parameters after 120 days.
Wellbore ParametersInner Pipe Thermal ConductivityInner Pipe ThicknessInner Pipe DiameterInjection–Production Spacing
Injection–Production Pressure
(MPa)
3.954 MPa3.512 MPa4.833 MPa3.871 MPa
3.953 MPa3.705 MPa4.209 MPa3.913 MPa
3.940 MPa3.953 MPa3.943 MPa3.953 MPa
3.957 MPa4.280 MPa3.953 MPa3.991 MPa
3.986 MPa4.721 MPa4.292 MPa4.027 MPa
Table 7. The thermal power of the system with various wellbore parameters after 120 days.
Wellbore ParametersInner Pipe Thermal ConductivityInner Pipe ThicknessInner Pipe DiameterInjection–Production Spacing
Thermal Power
(MW)
7.757 MW7.612 MW7.786 MW6.759 MW
7.726 MW7.695 MW7.756 MW7.272 MW
6.758 MW7.726 MW7.738 MW7.726 MW
5.988 MW7.745 MW7.726 MW8.107 MW
5.385 MW7.759 MW7.719 MW8.401 MW
Table 8. The normalization results of the production temperature with various wellbore parameters.
Reference SequenceInner Pipe Thermal ConductivityInner Pipe ThicknessInner Pipe DiameterInjection–Production Spacing
1.0001.0000.9861.0000.857
1.0000.9970.9940.9970.902
1.0000.9080.9970.9960.941
1.0000.8360.9990.9940.974
1.0000.7801.0000.9931.000
Table 9. The normalization results of the injection–production pressure difference with various wellbore parameters.
Reference SequenceInner Pipe Thermal ConductivityInner Pipe ThicknessInner Pipe DiameterInjection–Production Spacing
1.0000.9920.7441.0000.961
1.0000.9920.7850.8710.972
1.0000.9880.8370.8160.982
1.0000.9930.9070.8180.991
1.0001.0001.0000.8881.000
Table 10. The normalization results of the thermal power with various wellbore parameters.
Reference SequenceInner Pipe Thermal ConductivityInner Pipe ThicknessInner Pipe DiameterInjection–Production Spacing
1.0001.0000.9811.0000.805
1.0000.9960.9920.9960.866
1.0000.8710.9960.9940.920
1.0000.7720.9980.9920.965
1.0000.6941.0000.9911.000
Disclaimer/Publisher’s Note: The statements, opinions and data contained in all publications are solely those of the individual author(s) and contributor(s) and not of MDPI and/or the editor(s). MDPI and/or the editor(s) disclaim responsibility for any injury to people or property resulting from any ideas, methods, instructions or products referred to in the content.