Article

Wind-Induced Stability Identification and Safety Grade Catastrophe Evaluation of a Dish Concentrating Solar Thermal Power System

1
School of Mechanical Engineering, Hunan Institute of Engineering, Xiangtan 411104, China
2
Hunan Province Engineering Laboratory of Wind Power Operation Maintenance and Testing Technology, Hunan Institute of Engineering, Xiangtan 411104, China
3
College of Mechanical and Vehicle Engineering, Hunan University, Changsha 410082, China
*
Author to whom correspondence should be addressed.
Energies 2025, 18(23), 6088; https://doi.org/10.3390/en18236088
Submission received: 20 October 2025 / Revised: 15 November 2025 / Accepted: 18 November 2025 / Published: 21 November 2025
(This article belongs to the Special Issue Solar Energy Utilization Toward Sustainable Urban Futures)

Abstract

To avoid the problem of wind-induced resonance damage in a dish concentrating solar thermal power system (DCSTPS), a fluid dynamics model and a finite element analysis model of the DCSTPS were established separately. The wind load was mapped onto the surface of the concentrator of the DCSTPS using the sequential coupling method, and the static analysis and modal analysis of the DCSTPS were established based on the fluid–structure coupling (FSC) method and the validity of the established model was verified. Based on the results, it can be concluded that the upper edge of the dish solar concentrator (DSC) of the DCSTPS and the three cantilever beams near the Stirling generator are the most vulnerable to being damaged, the DCSTPS will not experience strong resonance phenomena, and effects of the FSC will decrease the natural frequencies of each order. The results of the safety grade catastrophe evaluation of the DCSTPS showed that the safety grade of the DCSTPS was 0.2586 and 0.2819 under case 1 (α = 30°, β = 90°) and case 2 (α = 60°, β = 90°), where it was found that the membership value of the moment load was low, resulting in the stress on the connection seat of the altitude angle and the steering device of the base approaching the allowable stress of the material.

1. Introduction

Compared with fossil fuel power generation, solar thermal power generation (STPG) serves as a means to reduce carbon dioxide emissions and decrease coal resource consumption [1,2,3]. Solar thermal power generation technology can be categorized into three types: dish, tower, and trough [4,5,6,7]. Among them, the DCSTPS boasts the highest efficiency of solar thermal power generation [8,9,10,11,12], accounting for approximately 29.4% of the world’s efficiency peak of solar thermal power generation, and is attracting more and more attention due to its high efficiency of solar thermal power generation, compact structure, and convenient installation [13,14,15].
In the past 20 years, there has been a trend in development to exploit the DCSTPS as a high-efficiency solar power generation technology. Broman et al. [16] proposed a simple method for manufacturing rigid and lightweight frames and supporting mirror strips, using slightly curved strips made of flat and bendable materials. According to the necessary mirror making method, two different spotlights were made, forming a parabolic dish concentrator, and the model of the mirror has been built and successfully used for cooking and baking. Johnston et al. [17] introduced a method of installing spherical reflectors with the same parabolic direction on a dish-style spatial frame structure. When traditional parabolic dishes are used for high-throughput/high-magnification solar concentrating devices, reflective elements need to be produced. Different regions of the parabolic surface of the reflective elements have different curvatures, and the manufacturing of multi-faceted concentrators is already somewhat complex. Their method can minimize its complexity. Finally, the article compares the optical performance and manufacturing feasibility of concentrators with such combined surfaces. Kalogirou [18] conducted a relevant analysis on the optics, thermodynamics, and thermodynamics of concentrators, and introduced a method for evaluating their performance. Kumar and Reddy [19] conducted a numerical investigation on the natural convective heat loss of three kinds of receivers from a fuzzy focusing solar concentrator. The results showed that the orientation and geometric dimensions of the receivers can have a significant impact on the natural convective heat loss. Chen et al. [20] used ray tracing to design a dish solar power system concentrator with two radiating mirrors, which can achieve higher concentration ratios with tracking errors. Additionally, elliptical mirrors perform better than hyperbolic mirrors.
Wu et al. [21] proposed a fluorescent solar concentrator with high geometric dimensions to reduce the energy consumption of photovoltaics. However, experiments in hybrid solar concentrators have shown that there is no self-absorption consumption, and the emitted photons increase linearly with the increase in geometric size (from approximately 50 to 200). Mlatho et al. [22] compared a laser diode measurement with a GARDON radiometer measurement using the Sun as a light source, and the results showed good agreement between the laser diode measurement and the radiometer, indicating that laser diode technology can be used to determine the spatial range of the focal point. Munir et al. [23] provided a complete description of the design principles and construction details of a Scheffler concentrator with a surface area of 8 square meters. This design process is simple, flexible, and does not require any special calculation settings, thus providing potential application prospects in China and the industrial landscape. Scheffler fixed-focus concentrators have been successfully used in low-temperature applications around the world. Velazquez et al. [24] proposed a numerical model for using a linear Fresnel reflector condenser in an advanced solar concentrating cooling system and obtained corresponding experimental verification. Zanganeh et al. [25] proposed a solar parabolic concentrator design based on an array of polyester mirror film surfaces clamped by elliptical wheel rims along the edges of the concentrator and a slight vacuum concentration applied through the underlying film, creating an ellipsoidal polyester film solar concentrator. Christo [26] numerically predicted the velocity and pressure fields around a comprehensive parabolic DSC, as well as the trajectories of dust particles in steady-state and unsteady flows. Their study also provides a preliminary evaluation of the effectiveness of various windproof devices installed on top of disk concentrators to reduce air resistance. Liu et al. [27] described the steps for designing a planar concentrator for laboratory research on intermediate temperature processes. They used Monte Carlo ray tracing analysis to obtain the optimal size and position of each face in order to achieve the desired flux characteristics on the focal plane.
Sardeshpande and Pillai [28] provided an explanatory model for two commercialized solar concentrators in India. In the model, the evaluation of the potential acceptance capacity of solar concentrators considers micro-level technical factors and macro-level market effects and trends. Xiao et al. [29] reviewed and compared three measurement methods for measuring the surface shape and optical properties of the concentrator in a disk solar power generation system—video scanning Hartmann optical test (VSHOT), photogrammetry, and deflection—and also proposed other prospects. Ruelas et al. [30] developed and applied a new mathematical model based on the geometric and optical characteristics of the Scheffler-type solar concentrator in Cartesian coordinates to evaluate its intercept factor. The research results showed that the highest concentration was obtained at an edge angle of 45 and finally indicated that the Scheffler-type solar concentrator was suitable for areas where solar height allows for reduced convective heat loss. Cheng et al. [31] introduced a new optical fluid solar concentrator based on electrowetting tracking. This method has the potential to reduce the cost of photovoltaic concentrators and improve operational efficiency by eliminating the power consumption of mechanical tracking. Compared with traditional silicon-based photovoltaic (PV) solar cells, self-tracking technology based on electrowetting will generate 70% more green energy and reduce costs by 50%.
The fluid–structure coupling (FSC) method had been studied in aviation, transportation, shipping, and other fields, and has practical theoretical significance [32,33]. However, there are still few FSC studies on the DCSTPS in this area. The working environment of the DCSTPS is an open flow field under wind loads, and the flowing air has a significant impact on the performance and vibration characteristics of the DCSTPS [34,35,36,37]. At the same time, the disturbance of the DCSTPS will in turn affect the airfield, which is a typical FSC model.
In order to avoid wind-induced resonance damage in the DCSTPS, it is necessary to study the FSC excitation of the DCSTPS. Therefore, a fluid dynamics model and a finite element analysis model of the DCSTPS were established separately. The wind load was mapped onto the surface of the concentrator of the DCSTPS using the sequential coupling method. Moreover, the static analysis and modal analysis of the DCSTPS were established based on the FSC method, and the validity of the established model was verified. Simultaneously, a safety grade evaluation of the DCSTPS was conducted based on the catastrophe theory [38]. The investigation’s results will be helpful for the structural design of the DCSTPS.

2. Fluid–Structure Coupling Simulation Model and Verification

To ensure that the simulation data were of high accuracy, the modeling of the large-scale dish concentrating solar thermal power system (DCSTPS) utilizes 1:1 data from actual engineering equipment. In this work, the main wind-affected structures (concentrators, support trusses, support columns, etc.) were analyzed, and thus they were appropriately simplified as in Figure 1. When the altitude angle and azimuth angle are both 0°, the concentrator satisfies the parabolic equation x2 + z2 = 42.735. The range of y values is (4.6 × 10⁻⁴ m, 1.698 m), and the range of x and z values is (−8.52 m, 8.52 m). The length (namely the distance from the center vertex of the concentrator to the plane at the edge of the concentrator) of the concentrating parabolic surface is about 16.98 m, and the diameter of the concentrating parabolic surface is 17.04 m. Based on the size of the DCSTPS model, a three-dimensional model composed of 180 plate units was designed with a plate unit with a thickness of 0.027 m and a gap distance of 15.5 mm. The overall height of the DCSTPS model is 18.5 m, and there are 12 main trusses and 12 auxiliary trusses supporting the truss. The main and auxiliary trusses are connected by support columns, and the support trusses are connected to the support columns through the central body. The concentrator is connected to the support truss through connecting columns, and the balance box is used to balance the moment brought by the concentrator, cantilever, collector, etc.
Additionally, fiberglass with an elastic modulus of 21.0 GPa, Poisson’s ratio of 0.3, and density of 1.7 × 10³ kg/m3 is used as the mirror material of the concentrator, while Q235 carbon steel with an elastic modulus of 210 GPa, Poisson’s ratio of 0.3, and density of 7.85 × 10³ kg/m3 is used as the supporting structure material of the DCSTPS.
As for the 38 kW DCSTPS, the three-dimensional physical model and finite element model were established as shown in Figure 1, where the support truss, connecting column, cantilever beam, and balance truss are beam elements, the center body and balance box are plate elements, and the connection between the support column and the center body is a solid element.

2.1. Conservation Equations

Due to the instantaneous and pulsating wind load on the DCSTPS, dynamic analysis must be adopted to investigate the structure inertia of the DCSTPS in this work. For the convenience of analyzing problems, we use the subscript “f” to represent fluids and the subscript “s” to represent solids.
(1)
Fluid control equations
The mass conservation equation of the DCSTPS can be expressed as follows:
𝜕 ρ f 𝜕 τ + ρ f U = 0
The momentum conservation equation of the DCSTPS can be expressed as follows:
𝜕 ρ u 𝜕 τ + ρ u U = 𝜕 p 𝜕 x + 𝜕 τ x x 𝜕 x + 𝜕 τ y x 𝜕 y + 𝜕 τ z x 𝜕 z + F f x 𝜕 ρ v 𝜕 τ + ρ v U = 𝜕 p 𝜕 y + 𝜕 τ x y 𝜕 x + 𝜕 τ y y 𝜕 y + 𝜕 τ z y 𝜕 z + F f y 𝜕 ρ w 𝜕 τ + ρ w U = 𝜕 p 𝜕 z + 𝜕 τ x z 𝜕 x + 𝜕 τ y z 𝜕 y + 𝜕 τ z z 𝜕 z + F f z
(2)
Solid control equation
The solid mass conservation equation of the DCSTPS can be expressed as follows:
ρ s d 2 d s d τ 2 = σ s + F s
Considering that the energy transfer of fluids and solids of the DCSTPS cannot be ignored, an energy equation should be added, and the total enthalpy htot in the fluid domain of the DCSTPS can be expressed as follows:
𝜕 ρ h tot 𝜕 τ 𝜕 p 𝜕 τ + ρ f U h tot = ( λ T ) + ( U τ f ) + U ρ F f + S E
(3)
Fluid–structure coupling equation
In the fluid–structure coupling region of the DCSTPS, wind load can alter the vibration mode of the DCSTPS by exerting pressure on it, which in turn affects the distribution of airflow velocity and pressure upstream and downstream of the DCSTPS. Therefore, the calculated flow velocity and pressure of the DCSTPS will be loaded onto the front and rear surfaces of the concentrator of the DCSTPS, and the fluid control equation and solid control equation will be coupled and solved.
At the fluid–structure coupling interface of the DCSTPS, some variables—such as the shear force tensor τf of the fluid domain of the DCSTPS and the stress tensor τs of the solid domain of the DCSTPS, the displacement df in the fluid domain and the displacement ds in the solid domain, the heat flow qf in the fluid domain of the DCSTPS and the heat flow qs in the solid domain of the DCSTPS, and the temperature Tf in the fluid domain of the DCSTPS and the temperature Ts in the solid domain of the DCSTPS—should be equal, that is, they should satisfy Equation (5).
τ f n f = τ s n s d f = d s q f = q s T f = T s
The solution steps for fluid–structure coupling are expressed as follows:
(1)
Using computational fluid dynamics (CFD) software 2025 to solve the average wind pressure p(1) corresponding to the initial shape of the DSC of the DCSTPS;
(2)
Using a static calculation program to determine the deformation x(1) of a DSC of the DCSTPS under the average wind pressure p(1), which will cause a change in the surface wind pressure coefficient of the DSC of the DCSTPS;
(3)
Based on the deformation of x(1), using CFD software again to solve the average wind pressure p(2) of the disk solar concentrator of the DCSTPS, and obtaining the deformation x(2) of the DSC of the DCSTPS under the action of p(2). If x(1)x(2), p(2) is the average wind pressure corresponding to the average deformation of the DSC of the DCSTPS. Otherwise, repeating steps (1) and (2), and continuing to solve x(i) and its corresponding average wind pressure p(i) until x(i−1)x(i), then p(i) is the average wind pressure corresponding to the average deformation of the DSC of the DCSTPS.

2.2. Modal Analysis Equation

(1)
Free mode of the DCSTPS
Considering that the natural frequency and vibration mode of the DCSTPS are independent of external loads, the modal analysis of the DCSTPS can be used to identify the modal parameter of the DCSTPS for the vibration analysis and the vibration prediction of the DCSTPS.
The DCSTPS is a multi degree of freedom system, and the discrete dynamics equation (namely undamped free vibration equation) of the DCSTPS can be expressed as follows:
M { S ¨ } + C { S ˙ } + K { S } = { F }
In order to solve the modal characteristics of the DCSTPS, the actual DCSTPS is regarded as an undamped free vibration system when the node force F of the DCSTP is equal to zero, and its control equation can be simplified as follows:
M { S ¨ } + C { S ˙ } + K { S } = 0
(2)
Fluid–structure coupling mode of the DCSTPS
The influence of pulsating wind action should be considered when the modal analysis of the DCSTPS is performed, and the FSC vibration equation of the DCSTPS can be expressed as follows:
M 0 ρ f R M f S ¨ p ¨ f + C 0 0 C f S ˙ p ˙ f + K 0 0 Κ f S p f = F 0
Free vibration of the DCSTPS is generally in harmonic form, and then
S = Φ x cos ω x t
Substituting Equation (9) into Equation (8), and then
( K ω x 2 M ) Φ x = 0
The condition for Equation (10) to have non-zero solutions (where Φx cannot all be zero) is that the determinant (KΦx2M) must be zero, and the characteristic equation can be expressed as follows:
K ω x 2 M = 0
The eigenvalue ω x 2 can be solved by Equation (11), and by substituting ω x 2 into Equation (9), the corresponding eigenvector Φx can be obtained.

2.3. Simulation Conditions

The setting of the computational domain (CD) model for the fluid domain needs to be performed before setting the boundary conditions of the FSC field. The selection of the physical model is for static steady-state analysis. The selected fluid in the fluid domain of the DCSTPS is air with a constant density of 1.18415 kg/m3. The turbulence model of the DCSTPS is the standard K-Epsilon model. Since the fluid flows at low speed in this fluid domain, a separation solver was used to set simulation conditions in the CD of the DCSTPS.
(1)
Inlet of the DCSTPS: We consider that the fluid flow in this area of the DCSTPS is incompressible, and the initial wind speed is divided into constant wind speeds of 20 m/s, 22 m/s, and 25 m/s.
(2)
Boundary condition at the outlet of the DCSTPS: The boundary condition at the outlet is the pressure outlet, and the pressure is set to one standard atmospheric pressure, and the ambient temperature and ambient pressure are 298 K and 101.325 kPa, respectively.
(3)
Wall conditions in the CD of the DCSTPS: The radius of the DSC is 8.42 m and the maximum orthographic projection area is 222.5102 m2. The boundary conditions of the DCSTPS between the bottom of the CD and the surface of the DSC of the DCSTPS are set to smooth wall, and there is no velocity slip between the viscous fluids and smooth wall. The surface and the ground of the DSC are fixed and do not move, so a non-slip wall condition is set, and slip boundary conditions of the DCSTPS are used at the top, the front, and the back of the CD of the DCSTPS.

2.4. Grid Division and Grid Independence Verification

The DCSTPS is located in the atmospheric boundary layer. When wind flows around the DCSTPS, it is equivalent to the DCSTPS being in a completely open flow field. The wind loads effects on the DCSTPS have a definite range in the DCSTPS, so a definite three-dimensional calculation area in the DCSTPS and corresponding boundary conditions in the numerical simulation of the DCSTPS need to be given. An excessively large fluid region means an excessive number of grids, resulting in a larger computational load and longer computation time. On the other hand, too small a fluid region leads to insufficient flow development and can easily cause distortion of the calculation results. So, it is important to designate a suitable fluid calculation area to reduce the calculation time and ensure calculation accuracy.
The diameter of the concentrator in the DCSTPS is about 17 m and its thickness is 0.27 m. To ensure that the fluid flow in the CD of the DCSTPS reaches a fully developed state, the length of the CD of the DCSTPS is about 10 times the size of the concentrator of the DCSTPS, and the height and the width of the CD of the DCSTPS are about 5 times the size of the concentrator of the DCSTPS. After multiple modeling simulations, 170 × 80 × 80 m is set to be the size of the CD of the DCSTPS, with the center of the DCSTPS at a height of 10 m from the ground of the DCSTPS and the inlet of the DCSTPS at a distance of 55 m from the center of the DCSTPS. The finite element model of the CD for the altitude angle α = 0° and azimuth angle β = 0° of the DSC in the DCSTPS is shown in Figure 1.
The calculation area is divided into three encryption zones using a step-by-step encryption method. As shown in Figure 2, the zones were gradually encrypted from far to near, maintaining a certain degree of continuity. The DCSTPS was individually encrypted to ensure the quality of the CD’s mesh. In order to enhance the accuracy of the calculation results, the polyhedral grids were adopted in the CD of the DCSTPS, which will make it easy to perform grid adaptation in the CD of the DCSTPS.
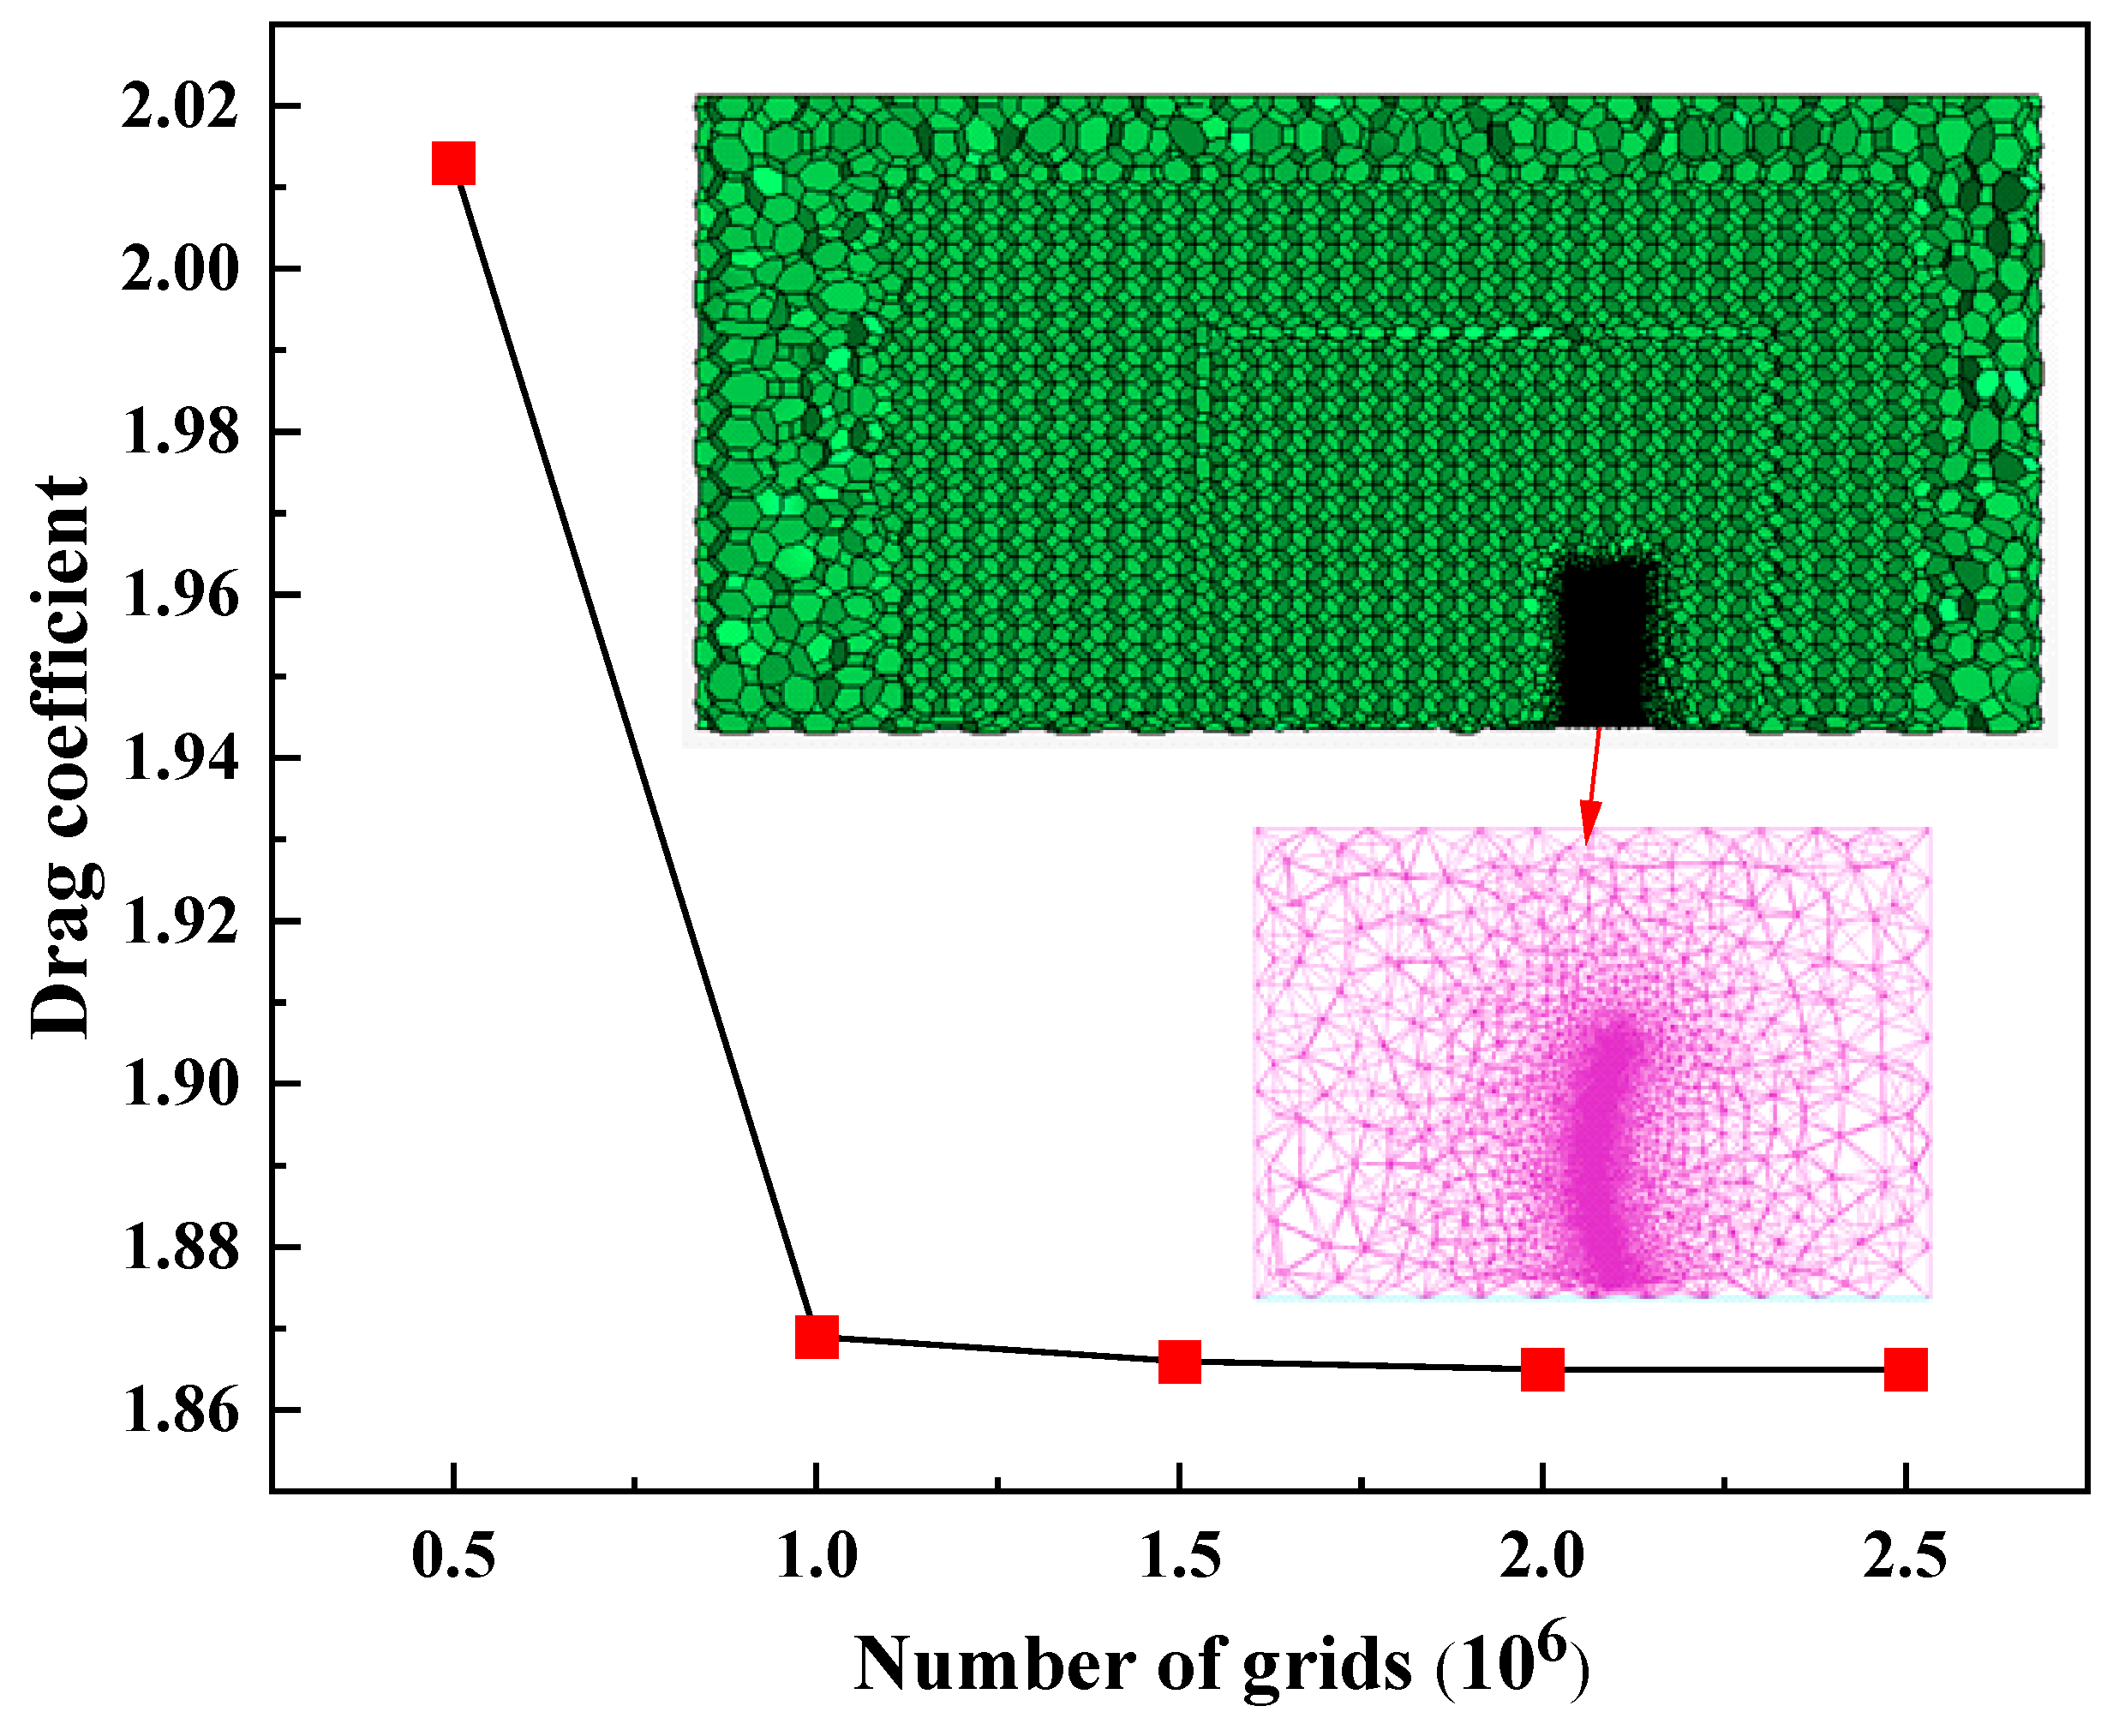
For balancing and meeting the accuracy requirement and computational complexity of CD of the DCSTPS, the grid independence verification must be performed to determine the most suitable grid number for simulation calculations. Figure 3 reveals the change trend of the drag coefficient of the DCSTPS at a wind speed of 20 m/s under different grid numbers. At 1,500,000 grids, the change rate of the drag coefficient is less than 1.0%, and the variation tends to be stable. Therefore, it can be considered that the simulation calculation can converge under this grid number condition. Therefore, under the premise of ensuring computational accuracy, in this work, as shown in Figure 2c, the total number of grids is 1,538,715 under this condition.

2.5. Model Validity Verification

To ensure the accuracy of the simulation research, it is necessary to verify the validity of the established model. Selecting experimental data from Uzair et al. [39], the drag coefficient and lift coefficient of the DCSTPS were compared at an azimuth angle of 0° with previous research data, and we observed whether the changes in the two coefficients with altitude angle were consistent. Figure 4a,b show a comparison of the results of the drag coefficient and lift force coefficient in this work with previous studies [39], and the results show that the behavior of the two coefficients with respect to altitude angle is consistent with previous research results from Uzair et al. [39]. The drag coefficient decreases uniformly and reaches its maximum at an altitude angle of 0°, while the lift force coefficient reaches its trough value at an altitude angle of 60°. Also, deviations between the simulation results and Uzair’s experimental data were 4.91–6.69% for drag coefficient and 3.92–7.28% for lift force coefficient.
Potential causes include the following: Due to the differences in the size and shape of the research object compared with previous studies from Uzair et al. [35], and the simplification of the model during modeling; there are no components such as the base, collector, or other supporting trusses. The simplified model base and other structures are the result of streamlining, which can reduce the wind load coefficient of the entire system to a certain extent. Therefore, the wind load coefficient in this paper is greater in absolute value than in previous studies. Therefore, it can be considered that the established computational model is valid.

3. Results and Discussion

The wind load was mapped onto the surface of the concentrator of the DCSTPS using the sequential coupling method. The specific operation process was expressed as follows: (1) extracting the boundary of the concentrator that needs to be coupled in the finite element analysis model; (2) importing it into the computational fluid dynamics model and making the fluid boundary of the concentrator basically coincide with the structural boundary; (3) coupling the pressure data obtained from the above calculation to each node element on the surface of the concentrator; (4) exporting the INP file back to the finite element analysis model for strength calculation.

3.1. Static Analysis of the Dish Concentrating Solar Thermal Power System

Conducting static analysis on the DCSTPS can help evaluate its structural performance, stability, and safety, and ensure that the DCSTPS can meet design and lifespan requirements under actual working conditions. By analyzing the load situation, reasonable structural optimization can be carried out to evenly distribute the stress and deformation of different components of the DCSTPS, thereby improving the overall performance and lifespan of the DCSTPS.
To obtain the stress concentration and location in the DCSTPS model, without considering the influence of wind load on the model, the main loads on the model are the gravity of the DCSTPS and the pressure of the Stirling generator on the cantilever structure of the DCSTPS.
The gravity effect of the DCSTPS can be obtained by defining the material properties and adding gravitational acceleration. The Stirling generator weighs about 1500 kg, so a downward pressure of 15.0 kN is applied at the connection between the cantilever structure and the Stirling generator to simulate the influence of the gravity of the Stirling generator on the entire model.
In order to balance the gravity effect on both sides of the supporting components of the DCSTPS, the structure of the balance box was redesigned. Unlike the original structure, which balances the torque produced by the Stirling generator, concentrator, and supporting structure through counterweights, the balance box can flexibly and effectively balance the torque under various working conditions by injecting different medium masses, which can effectively reduce the vibration of the overall structure under wind load and provide new ideas for subsequent anti-vibration research in this project.
The DCSTPS has many daily operating conditions, but under the maximum wind load, the DCSTPS is generally at an altitude angle (vertical rotation angle) of 0° and an azimuth angle (horizontal rotation angle) of 0°. Therefore, only the DCSTPS with an altitude angle of 0° and an azimuth angle of 0° is subjected to static analysis.
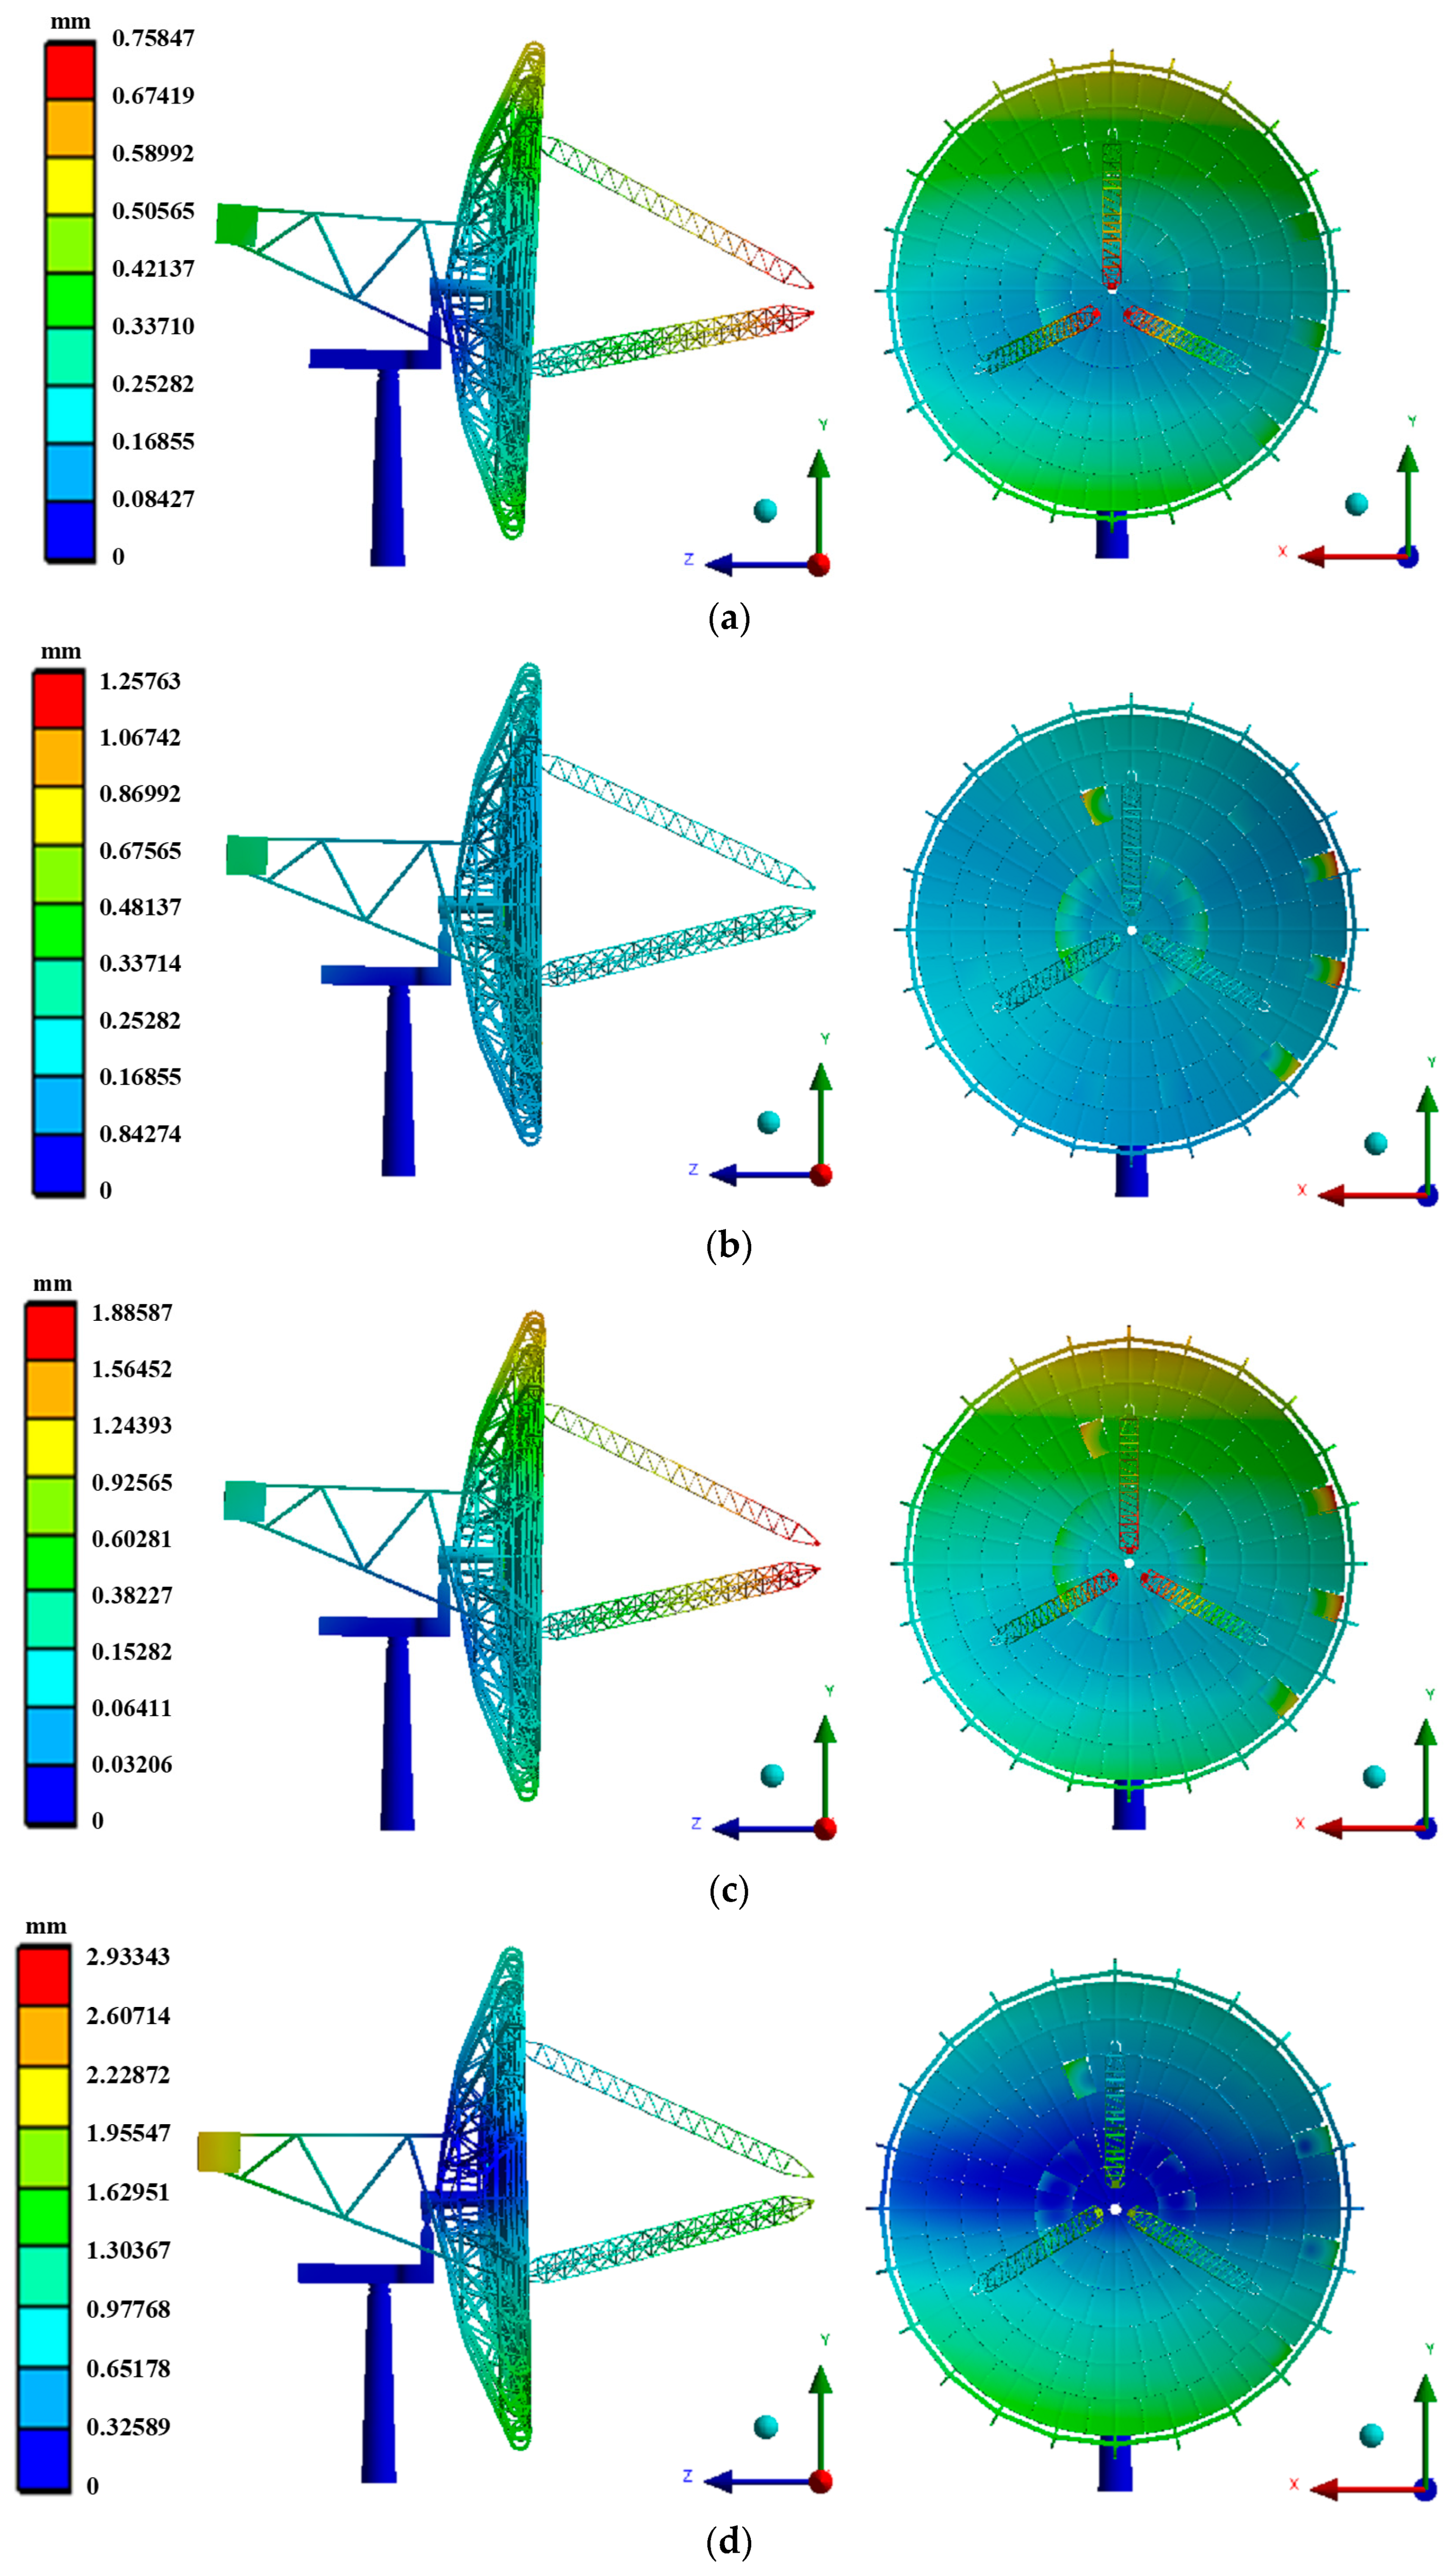
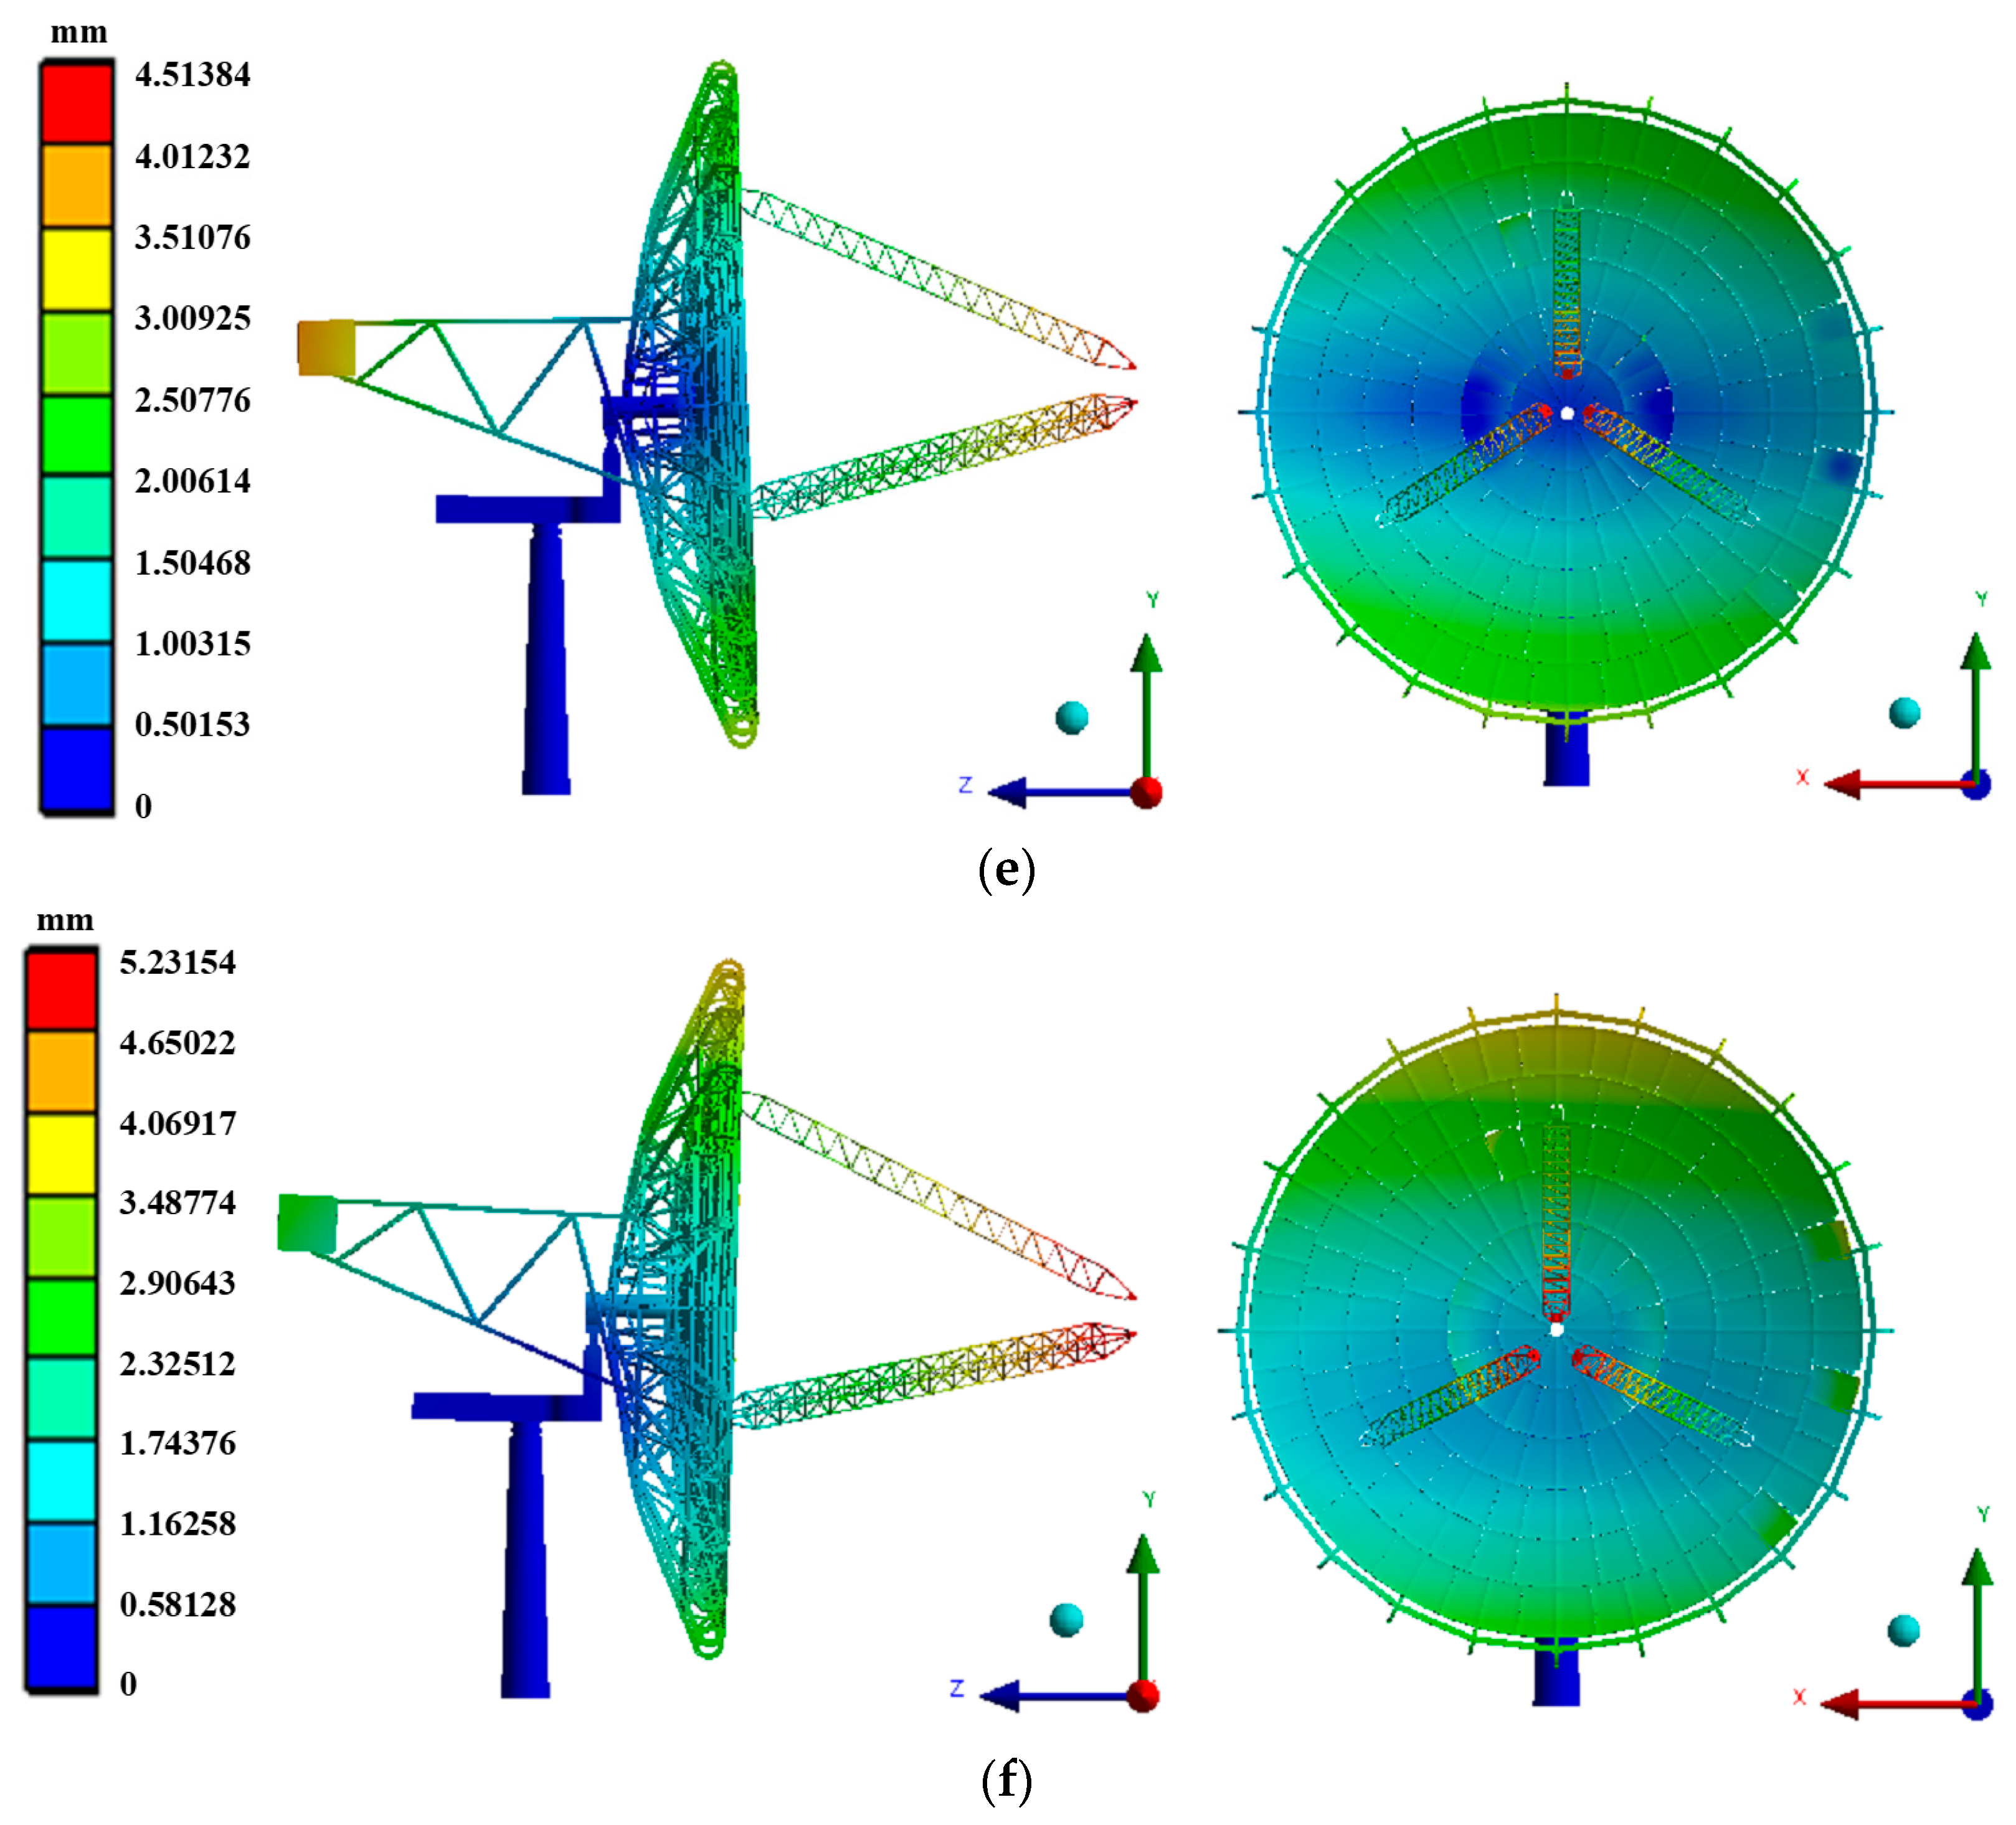
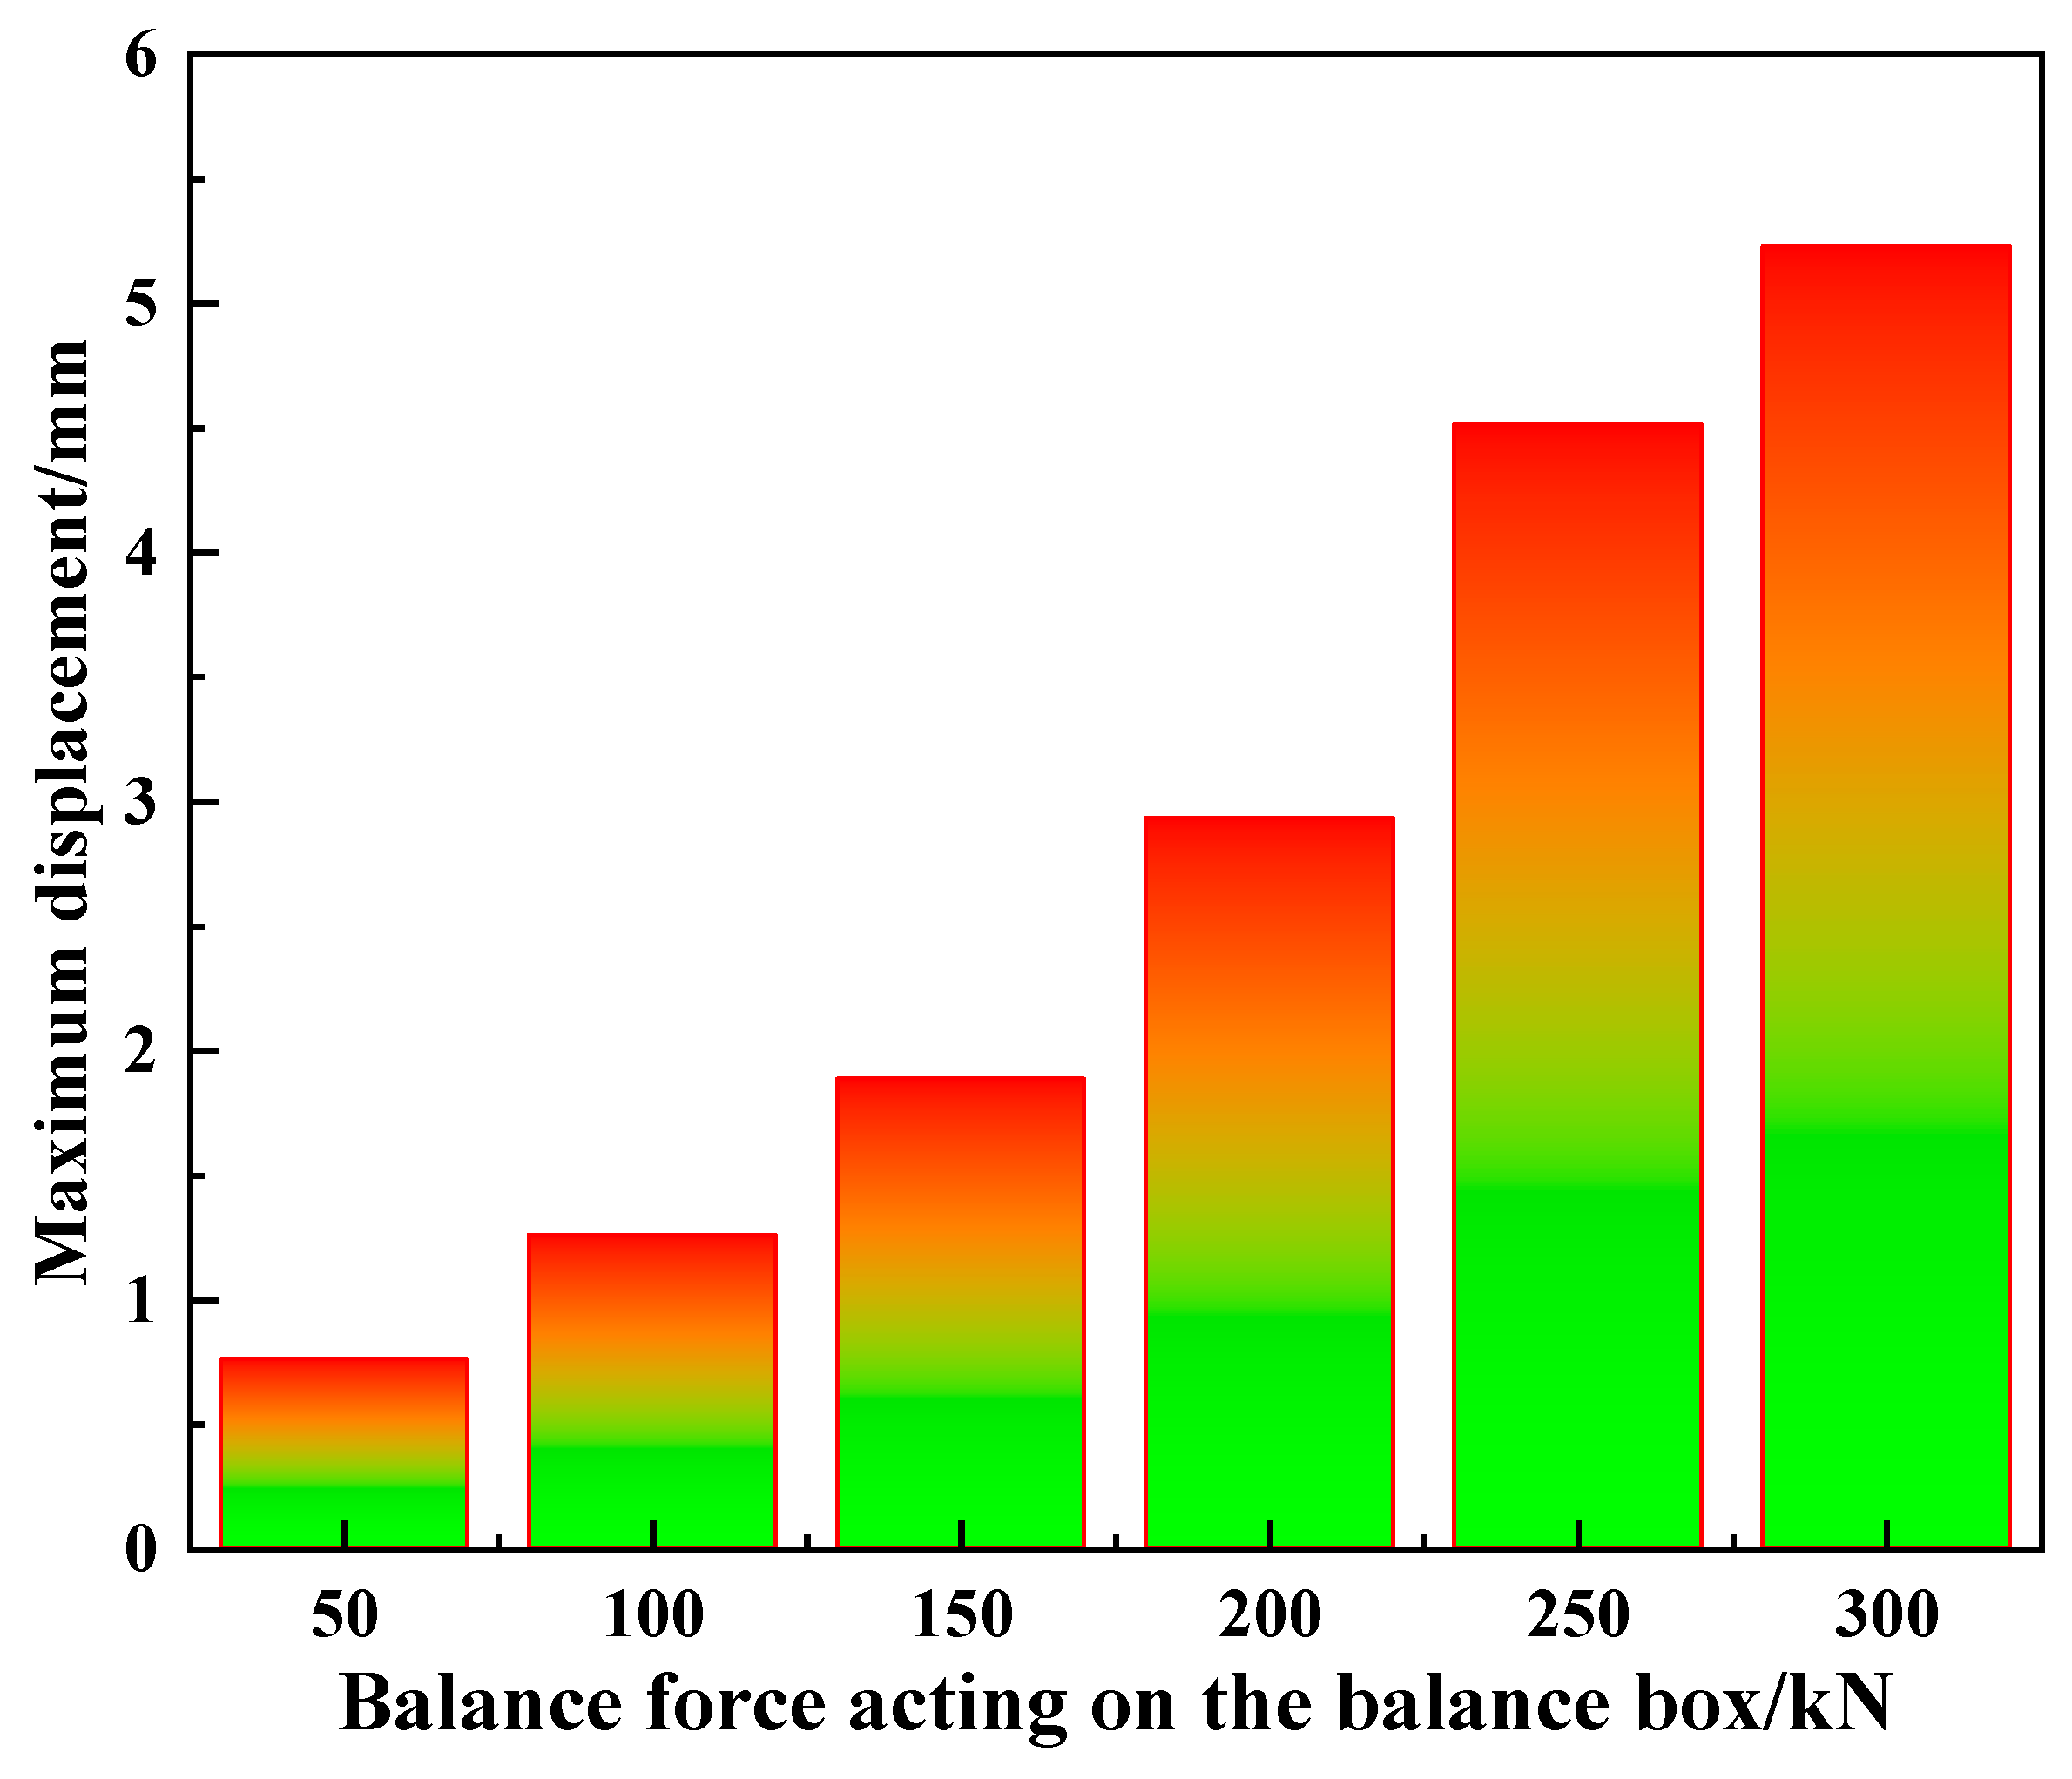
According to the specific working conditions, for the structure of the balance box, the maximum torque that needs to be balanced is about 4 × 10⁶ N·m, so the force that needs to be balanced is about 300 kN. Therefore, at intervals of 50 kN, the balance forces of 50 kN, 100 kN, 150 kN, 200 kN, 250 kN, and 300 kN were applied, totaling six working conditions, to verify the balance effect of the structure design of the balance box. Figure 5 shows the displacement cloud map of the DCSTPS under various operating conditions, and Figure 6 shows the maximum displacement of the DCSTPS under various operating conditions.
Under the condition of an altitude angle of 0 ° and an azimuth angle of 0°, based on Figure 5 and Figure 6, the following analysis and explanation can be performed:
(1) The maximum displacement of the DCSTPS is located at the connection between the cantilever and the Stirling generator, while the maximum deformation of the support structure is mainly distributed at the edges of the upper and lower parts of the concentrator. (2) Applying different balance forces to the balance box has a significant impact on the overall deformation of the DCSTPS model, and the maximum deformation of the DCSTPS is 0.75847 mm, 1.25763 mm, 1.88587 mm, 2.93343 mm, 4.51384 mm, and 5.23154 mm. This proves that in practical working conditions, this design can flexibly and effectively adjust the DCSTPS’s stress, which is beneficial for balancing the DCSTPS’s stress under different working conditions and increasing the safety and stability of the DCSTPS structure.

3.2. Modal Analysis

A dual-axis tracking system is adopted in the dish solar thermal power generation system under the daily operating conditions, and generally the maximum wind load altitude angle α = 0° and the azimuth angle β = 0°. Therefore, due to the fact that the DCSTPS is subjected to the maximum wind load, a modal analysis of the DCSTPS at an altitude angle α = 0° and an azimuth angle β = 0° was calculated in this work.
When calculating the natural frequency and completing the corresponding modal analysis, considering that the high-order modes of the DCSTPS will not have a significant impact on the DCSTPS, only the first six modes of the DCSTPS were calculated.
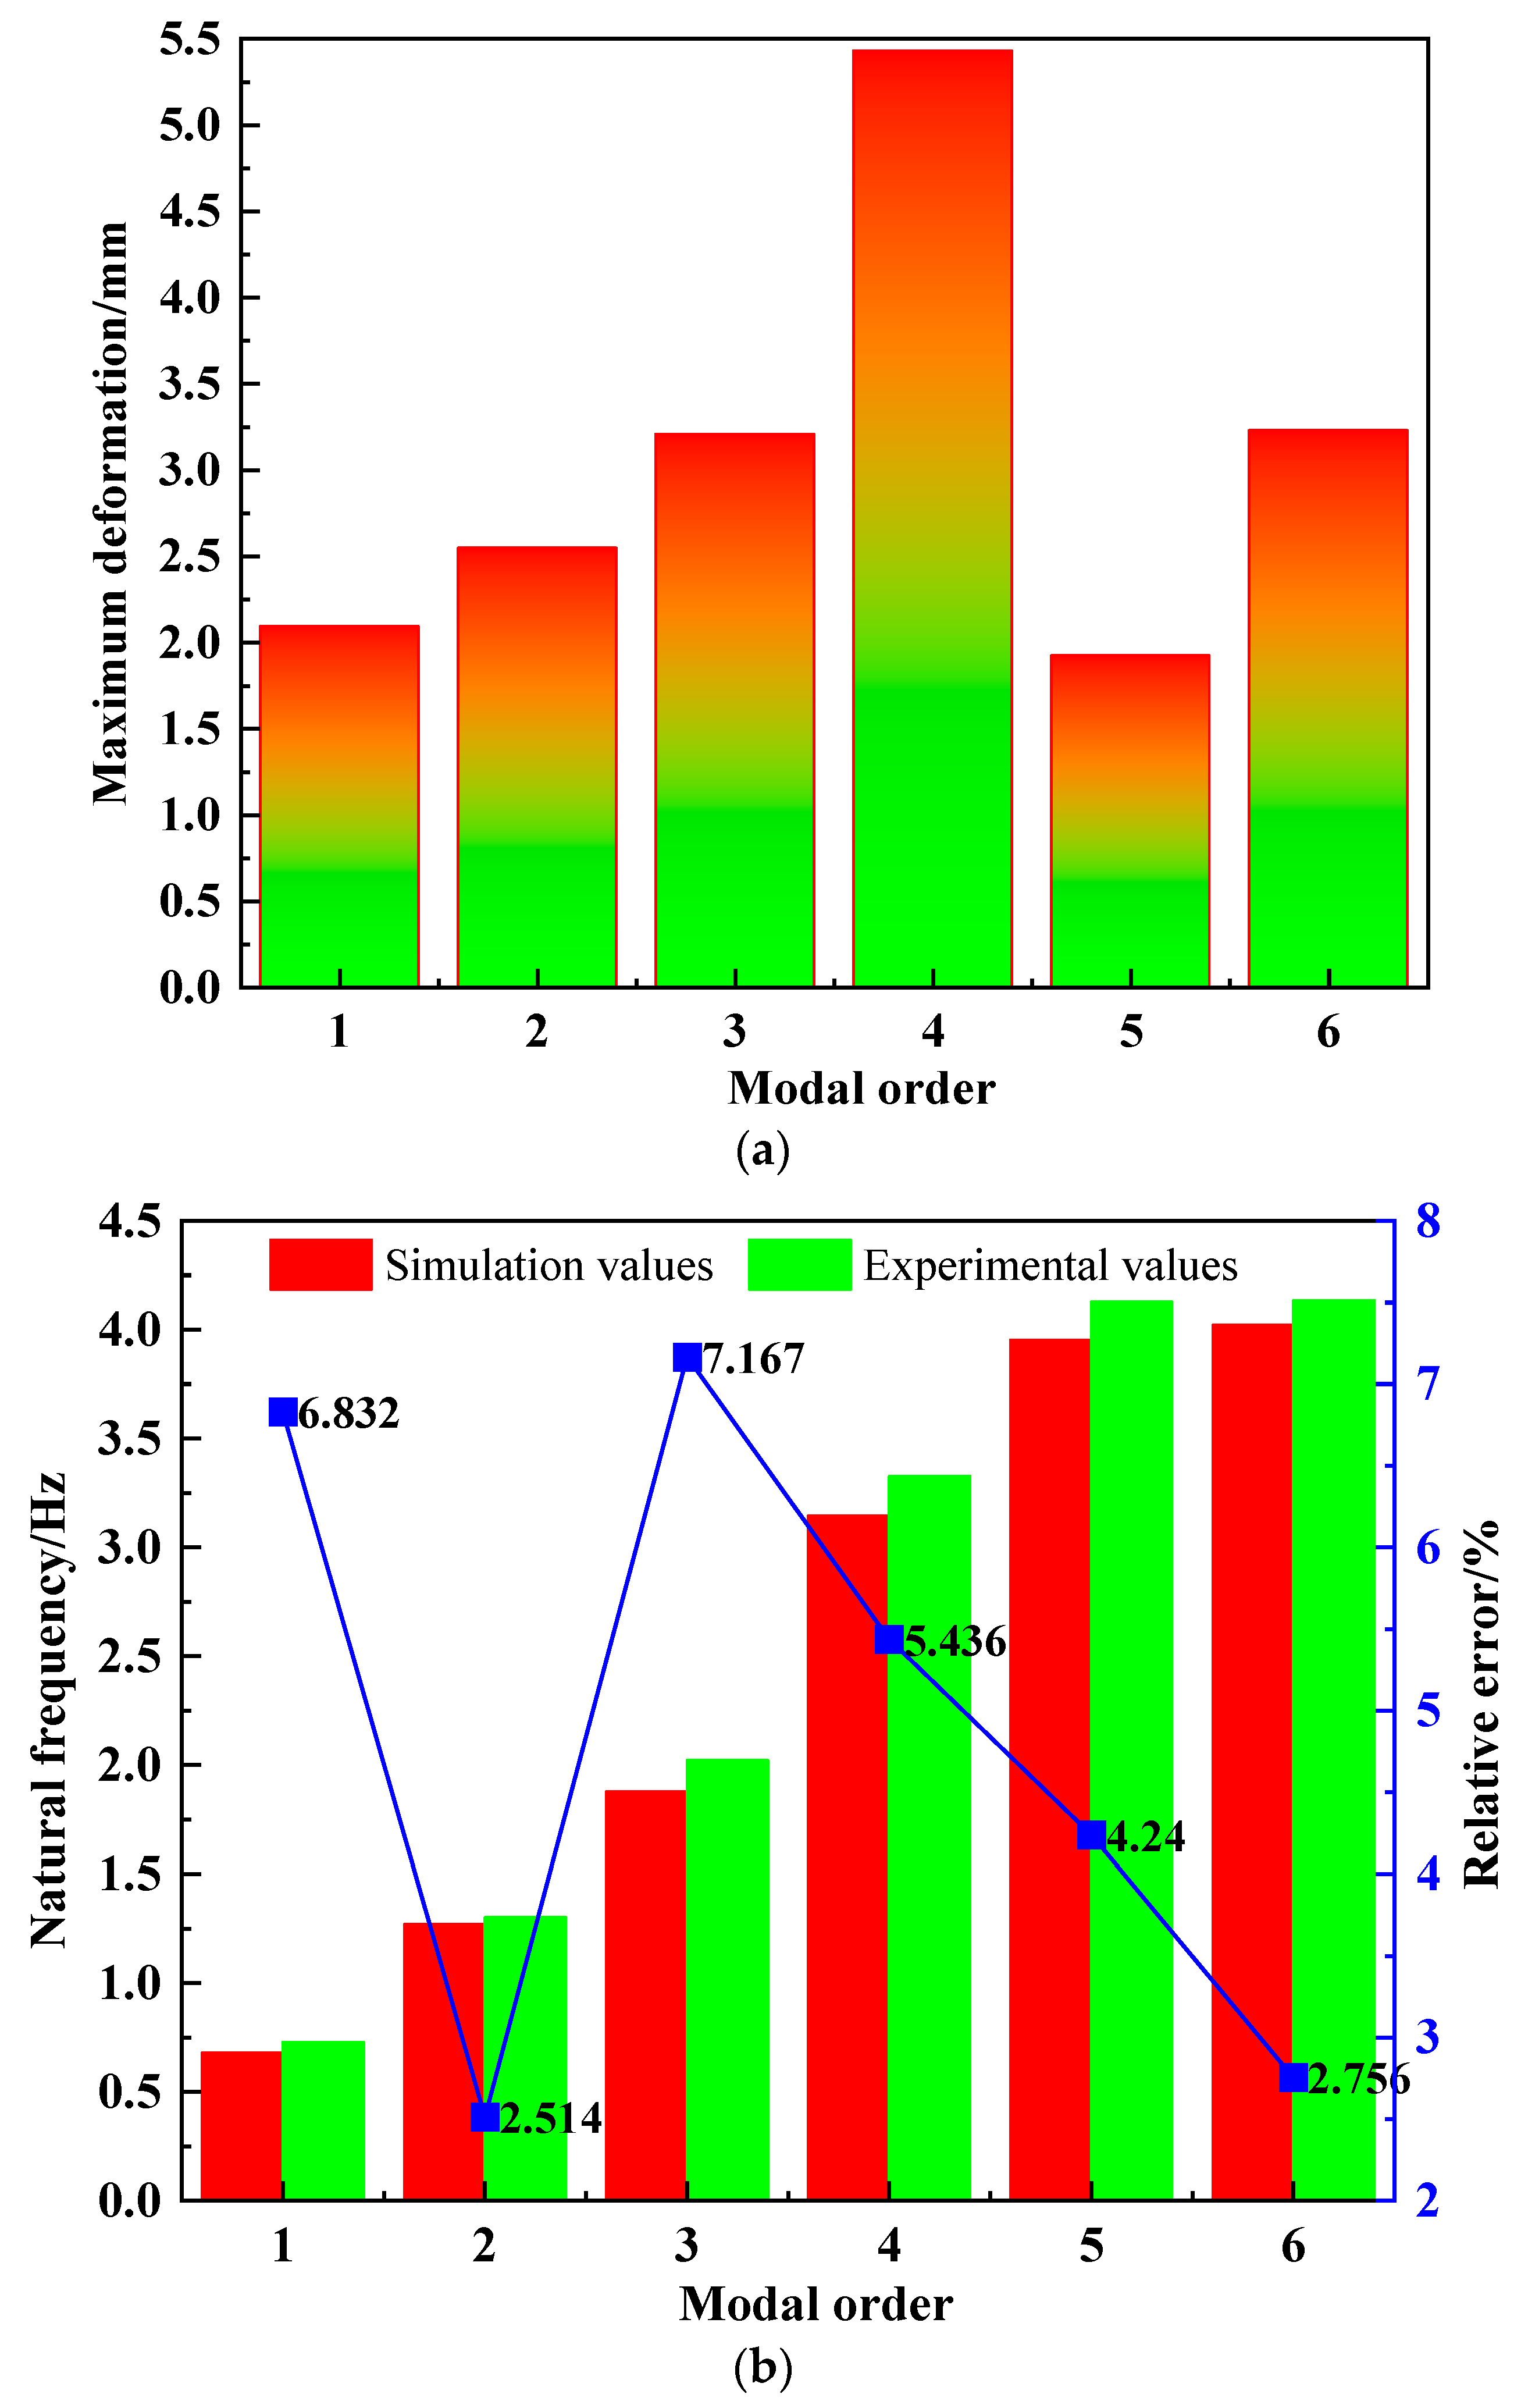
The constraints to the bottom of the support column of the DCSTPS model were applied, and FSC was used to investigate the natural frequencies and maximum deformation corresponding to the first six modes of the DCSTPS. The comparisons of the modal diagrams, maximum deformations, and natural frequency errors of the DCSTPS with the first- to sixth-order modal shape under α = 0° and β = 0° are shown in Figure 7 and Figure 8, respectively.
Based on Figure 7, the following analysis and explanation can be performed: (1) the first modal shape of the DCSTPS is the rotation of the DCSTPS downwards around the X-axis; (2) the second modal shape is the rotation of the DCSTPS upwards around the X-axis; (3) the third modal shape is the rotation of the DCSTPS upwards around the X-axis; (4) the fourth modal shape is the rotation of the DCSTPS downwards around the X-axis; (5) the fifth modal shape is the rotation of the DCSTPS downwards around the X-axis; (6) the sixth modal shape is the rotation of the DCSTPS left and right around the Y-axis.
In addition, as shown in Figure 7c, the deformation of the entire DCSTPS is relatively large during the third-order modal vibration process, especially at the upper edge of the concentrator, where the deformation reaches 3.2076 mm, which makes it prone to damage; therefore, the stiffness of the DCSTPS needs to be improved. From Figure 7d, it can be seen that during the fourth mode vibration process, the three cantilever beams supporting the Stirling generator undergo significant deformation, and the part near the Stirling generator reached 5.4318 mm, which makes it prone to damage; therefore, the stiffness of the parts of the three cantilever beams near the Stirling generator needs to be increased.
Based on the natural frequencies and maximum deformation of the first- to sixth-order modal shapes shown in Figure 8, the following analysis and explanation can be performed:
(1)
Compared with previous experimental values [40], the relative error is above 2.514–7.167%, indicating that the design of the balance box will reduce the natural frequency of the DCSTPS to a certain extent. At the same time, there are small differences in the material, structure, and other parameters between the established DCSTPS model and the experimental model [26], resulting in a small relative error, but the trend fluctuation of this relative error is not significant, which also proves the validity of the established DCSTPS model.
(2)
The fundamental natural frequency of the DCSTPS structure is 0.67910 Hz, and the natural frequency is much higher than the dominant frequency of the pulsating wind load (0.001~0.01 Hz), so the DCSTPS structure will not experience resonance phenomenon.
(3)
The most strongly vibrating parts of the DCSTPS structure are the edge area of the concentrator grid and the front and rear ends of the truss. The individual positions with protruding deformation are caused by an uneven distribution of model vibration, which belongs to the design problem of the DCSTPS model structure and has no impact on the overall mode of the DCSTPS in practice.
(4)
According to the modal analysis, the subsequent safety evaluation of the wind-induced vibration characteristic parameters of the DCSTPS model should focus on analyzing the edge position of the concentrator and the position with the strongest natural vibration, which will provide a basis for node selection.

3.3. Effects of Fluid–Structure Coupling on Natural Frequency and Maximum Deformation

When considering the effect of FSC and not considering the effect of FSC, the 1st–6th-order modal shapes of the DCSTPS are basically the same, but there are significant differences in the 1st–6th-order natural frequencies and their maximum deformations. Moreover, there is little effect on the modal vibration of the DCSTPS from the constant wind speed.
As for ith modal shape, the natural frequencies and maximum deformations of the DCSTPS while considering the effect of the FSC are fsi and δsi, respectively, and the natural frequencies and maximum deformations of the DCSTPS without considering the effect of FSC are fci and δci. The relative errors of the natural frequencies and maximum deformations of the DCSTPS are ηf = (fsifci) × 100%/fci and ηδ = (δsiδci) × 100%/δci, respectively.
A comparison of the natural frequencies and maximum deformations at the 1–6-order modal under α = 0° and β = 0° are shown in Figure 9.
According to Figure 9a, it can be seen that the 1st–6th-order natural frequencies of the DCSTPS considering the effect of FSC are all lower than those obtained without considering the effect of FSC, and the relative errors are −9.89%, −4.39%, −2.69%, −1.72%, −2.86%, and −2.26%, respectively. Additionally, considering the influence of FSC, the natural frequencies of all orders have decreased, with the first-order natural frequency showing the most significant decrease. For the above results, the main reason is that the fluid has a greater effect on the lower order natural frequency of the DCSTPS, while having a smaller effect on the higher order natural frequency of the DCSTPS; therefore, FSC has the effect of suppressing the natural mode coefficient of the DCSTPS.
In summary, to avoid the premature failure of the DCSTPS due to its resonance from external excitation, the influence of FSC on the change in natural frequencies should not be ignored.
According to Figure 9b, for the 1st to 6th-order modal, compared with the maximum deformation of the DCSTPS obtained without considering the effects of the FSC, the relative errors of the maximum deformation of the DCSTPS considering the effects of the FSC are 9.27%, 6.41%, 3.63%, 4.53%, 3.50, and 3.59%, respectively. It is evident that the relative error of the maximum deformation of the DCSTPS decreases overall with the increase in the order.
This is mainly because fluid impact has the effect of suppressing the higher order modal deformation of the DCSTPS. The fluid has a greater impact on the maximum deformation of the DCSTPS at a lower order modal, while having a smaller impact on the maximum deformation of the DCSTPS at a higher order modal.

3.4. Safety Grade Evaluation of the Dish Concentrating Solar Thermal Power System Based on Catastrophe Modeling

In this work, the catastrophe modeling (for example, cusp point type and dovetail type) [38,41], as shown in Table 1, will be used to evaluate the safety grade of the DCSTPS.
(1)
Evaluation standards for safety grade of the DCSTPS
The safety grade of the DCSTPS was divided into four categories, low safety grade of the DCSTPS, average safety grade of the DCSTPS, high safety grade of the DCSTPS, and very safety high level of the DCSTPS, and the evaluation criteria of the safety grade were [0.00, 0.35], [0.35, 0.60], [0.60, 0.85], and [0.85, 1.00].
(2)
Safety grades of the DCSTPS normalized by Catastrophe models
Considering that the raw data of the different operating condition parameters in the DCSTPS is of generally different significance, it is meaningless to compare the raw data of the different operating condition parameters directly. Therefore, after the raw data of the different operating condition parameters in the DCSTPS is normalized in the interval [0, 1] by catastrophe models, the safety grade of the DCSTPS can be evaluated based on the catastrophe models and the evaluation criteria of the safety grade.
The safety evaluation index system of the DCSTPS is divided into wind load, force load, and moment load, which are defined by u, v, and w, respectively. The safety evaluation index system of the DCSTPS is a first-level indicator, namely, the target layer. Wind load (u), force load (v), and moment load (w) are the secondary indicator layer. Wind load (u) includes two third indicator layers such as the maximum surface wind pressure (u1) and the air velocity (u2); force load (v) includes three third indicator layers such as the lateral force (v1), the drag (v2), and the lift force (v3); and moment load (w) includes three third indicator layers such as the pitch moment (w1), rolling moment (w2), and azimuth moment (w3). Among them, the parameters of all indicators in the same layer were sorted from top to bottom based on their importance as shown in Table 2.
Considering that Figure 1c provides these angles and their relative positional relationship (altitude angle α and azimuth angle β), simulation cases for the safety performance of the DCSTPS are shown in Table 3. Based on the simulation results, the safety performance of the DCSTPS will replace the evaluation scores as in Table 4.
Due to the negative correlation between safety performance and the indicators u1, u2, v1, v2, v3, w1, w2, and w3 of the DCSTP, the indicators u1, u2 in the third indicator layers were normalized using Equation (11), and the indicators v1, v2, v3, w1, w2, and w3 in the third indicator layers were normalized using Equation (12).
min | X i | X i
The cusp point-type model for the normalized formula is
x u = u x v = v 3
The dovetail-type model for the normalized formula is
x u = u x v = v 3 x w = w 4
According to the safety evaluation index system of the DCSTPS established in Table 2, the normalized results on safety evaluation index system of the DCSTPS are given in Table 5.
As for the third indicator layer in case 1, the indicators u1, u2, v1, v2, v3, w1, w2, and w3 of the DCSTP were normalized using the cusp point-type model and dovetail-type model.
x u 1 = u 1 = 0.9755 = 0.9877 x u 2 = u 2 3 = 1.0000 3 = 1.0000
x v 1 = v 1 = 0.0003 = 0.0173 x v 2 = v 2 3 = 1.0000 3 = 1.0000 x v 3 = v 3 4 = 0.2160 4 = 0.6817
x w 1 = w 1 = 0.9242 = 0.9614 x w 2 = w 2 3 = 0.0198 3 = 0.2705 x w 3 = w 3 4 = 0.0002 4 = 0.1189
Considering that there is no interconnection between the u1, u2, v1, v2, v3, w1, w2, and w3 of the DCSTP, the minimum normalized value was selected as the value of the secondary indicator layer in the DCSTP.
(1)
For case 1: xu = 0.9877; xv = 0.0173; xw = 0.1189.
(2)
Similarly, for case 2: xu = 1.0000, xv = 0.0224, xw = 0.1316; case 3: xu = 0.9262, xv = 0.5628, xw = 0.4819; case 4: xu = 0.9178, xv = 0.3828, xw = 0.6231; case 5: xu = 0.8352, xv = 0.4257, xw = 0.3420; case 6: xu = 0.8150, xv = 0.2198, xw = 0.2839; and case 7: xu = 0.8149, xv = 0.3097, xw = 0.4130.
The safety evaluation values of the indicator grade of the DCSTPS are expressed in Figure 10.
Wind load, force load, are moment load are normalized according to Equation (14). Since wind load, force load, and moment load cannot be substitutable with each other, taking case 1 as an example, wind load (xu = 0.9877), force load (xv = 0.0173), and moment load (xw = 0.1189) are normalized using a dovetail-type model to obtain
x 1 = x u = 0.9877 = 0.9938 x 2 = x v 3 = 0.0173 3 = 0.2586 x 3 = x w 4 = 0.1189 4 = 0.5872
Therefore, the minimum value for the {0.9938, 0.2586, 0.5872} was chosen as the safety evaluation value of the target grade of the DCSTPS as follows:
x = min{0.9938 0.2586 0.5872} = 0.2586
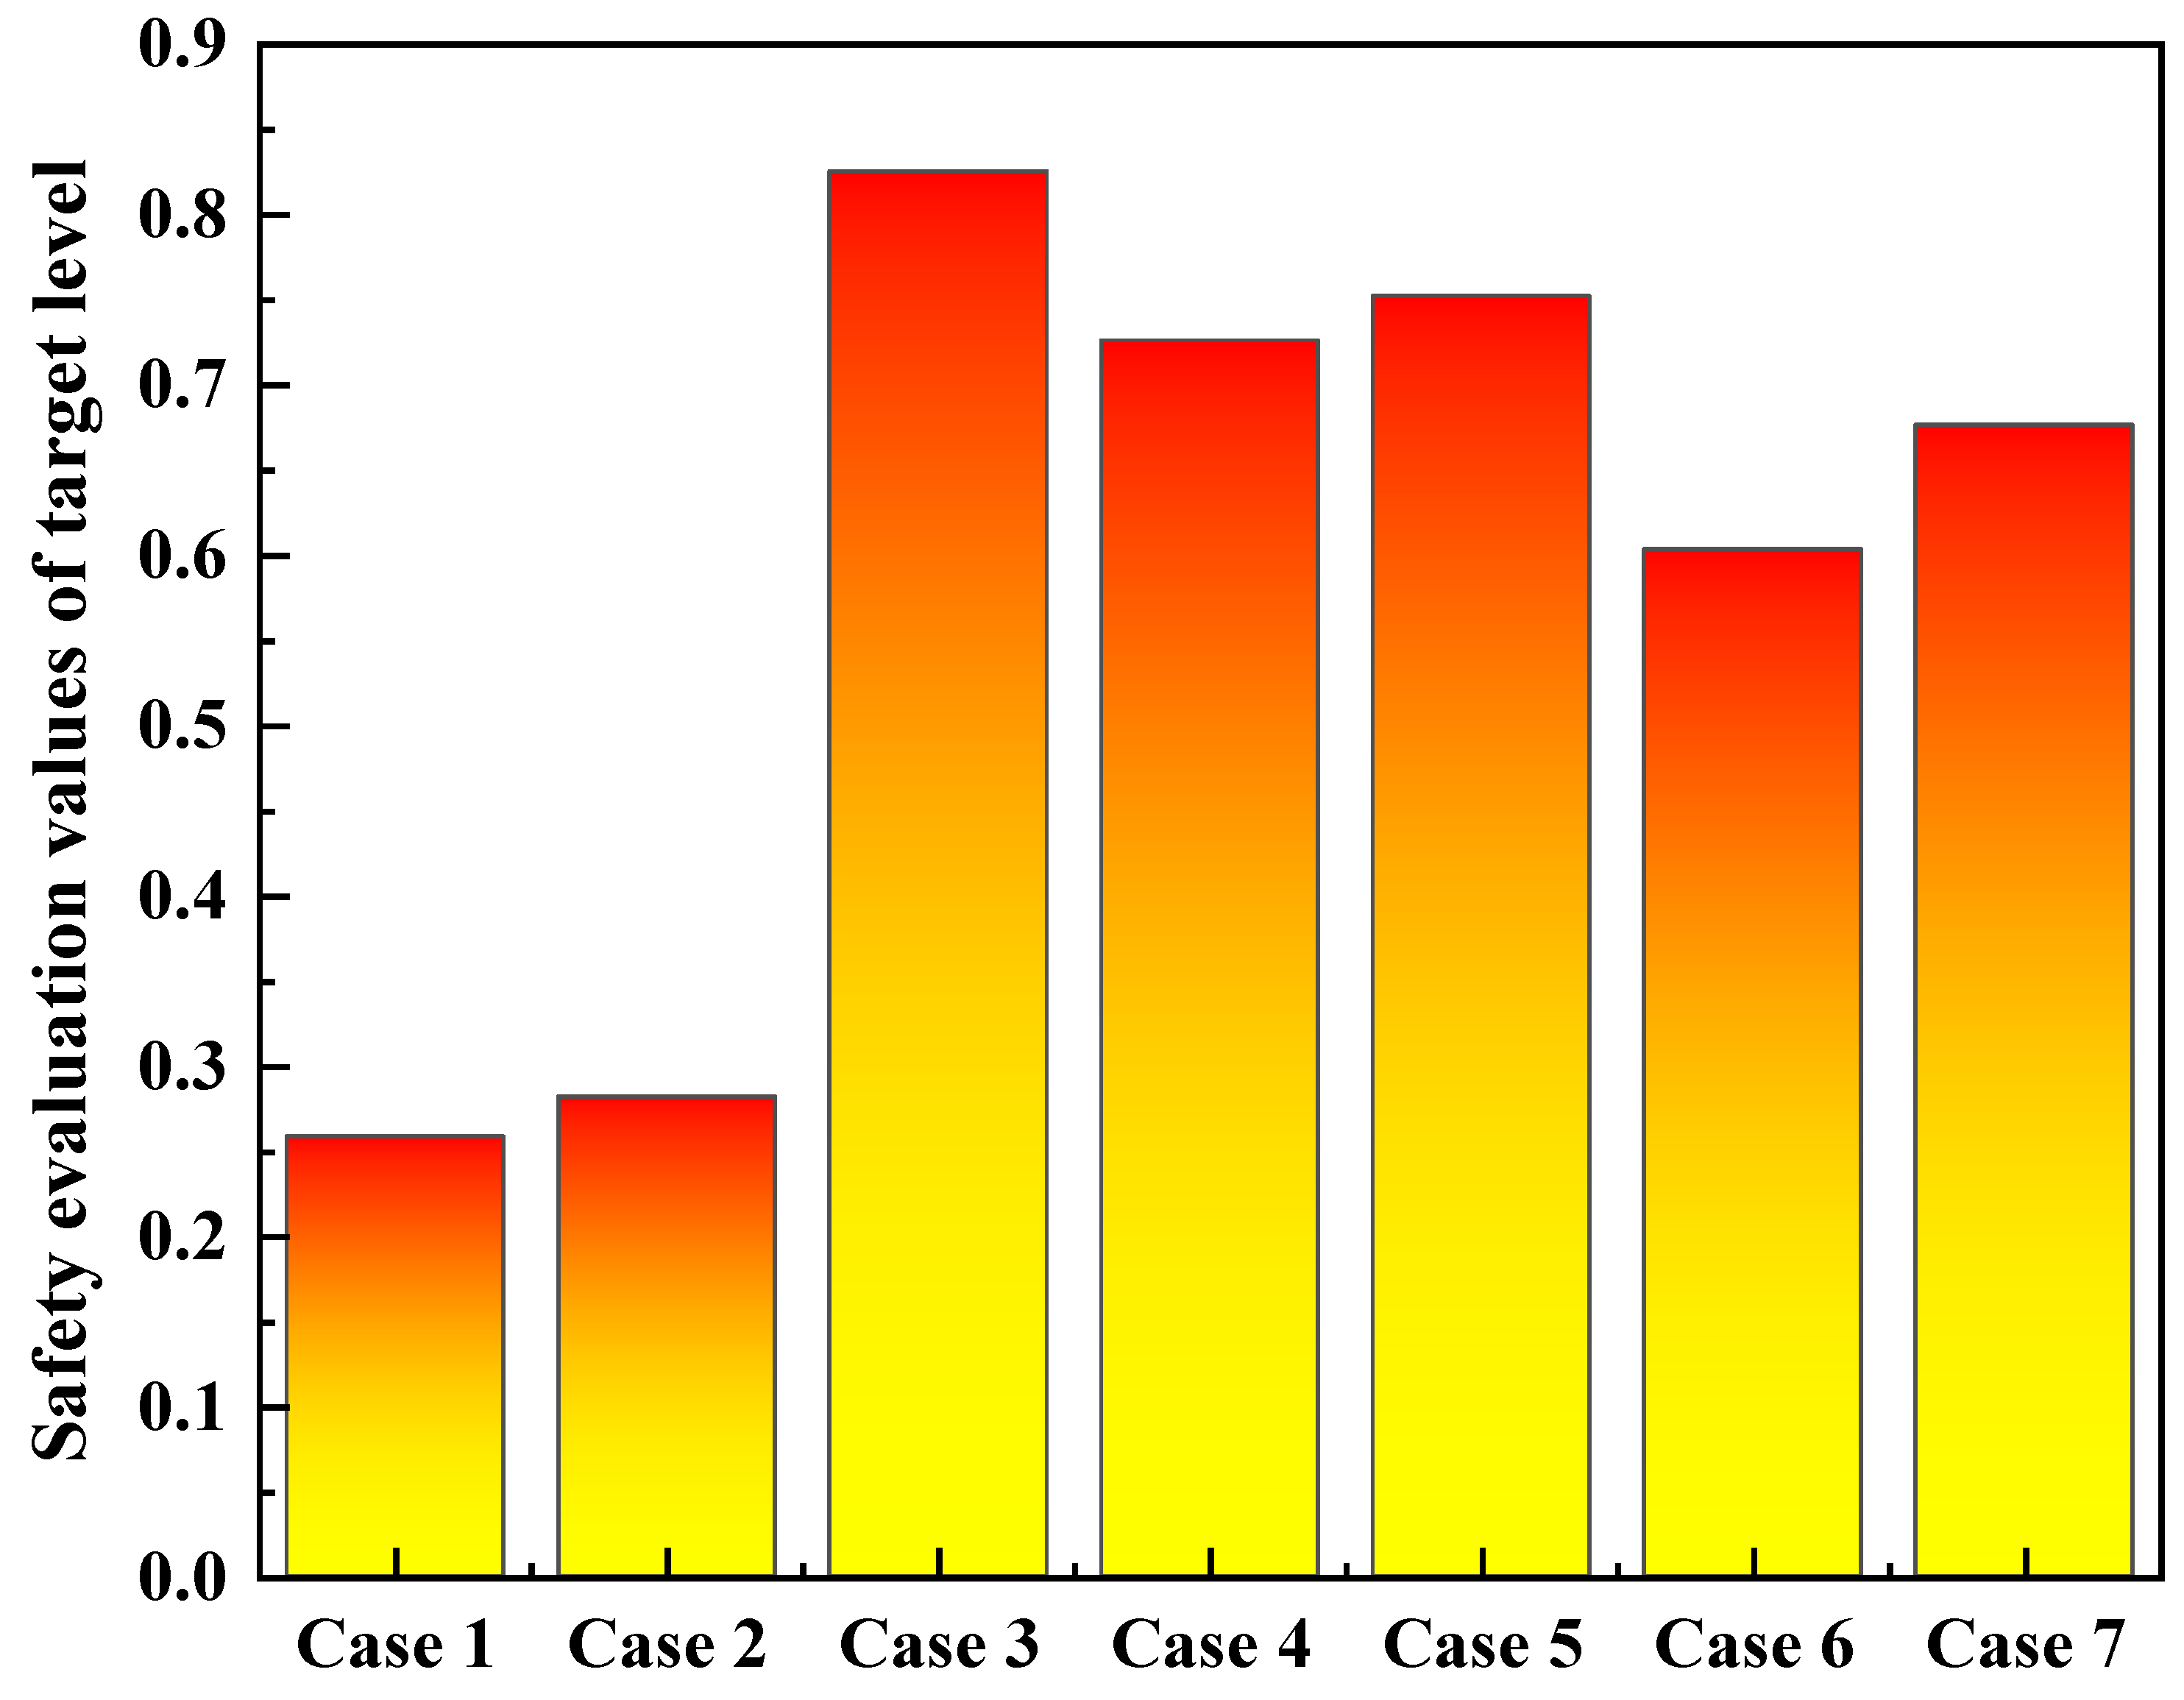
Similarly, based on the above calculation process, the other safety evaluation values of the target grade of the DCSTPS can also be obtained as case 2: x = 0.2819; case 3: x = 0.8256; case 4: x = 0.7261; case 5: x = 0.7523; case 6: x = 0.6035; and case 7: x = 0.6766. Thus, the safety evaluation values of the target level of the DCSTPS can be expressed as in Figure 11.
From the above, it can be seen that the safety evaluation values of the target grade are 0.2586, 0.2819, 0.8256, 0.7261, 0.7523, 0.6035, and 0.6766.
Due to the established evaluation criteria of the safety grade, the results indicate that the safety evaluation values of the DCSTPS were 0.2586 and 0.2819 under case 1 and case 2, which were in the low safety grade, and the safety evaluation values of the DCSTPS under case 3, case 4, case 5, case 6, and case 7 are in the high safety grade. Among them, the highest safety evaluation value of the DCSTPS is found in case 3 in relation to the other cases.
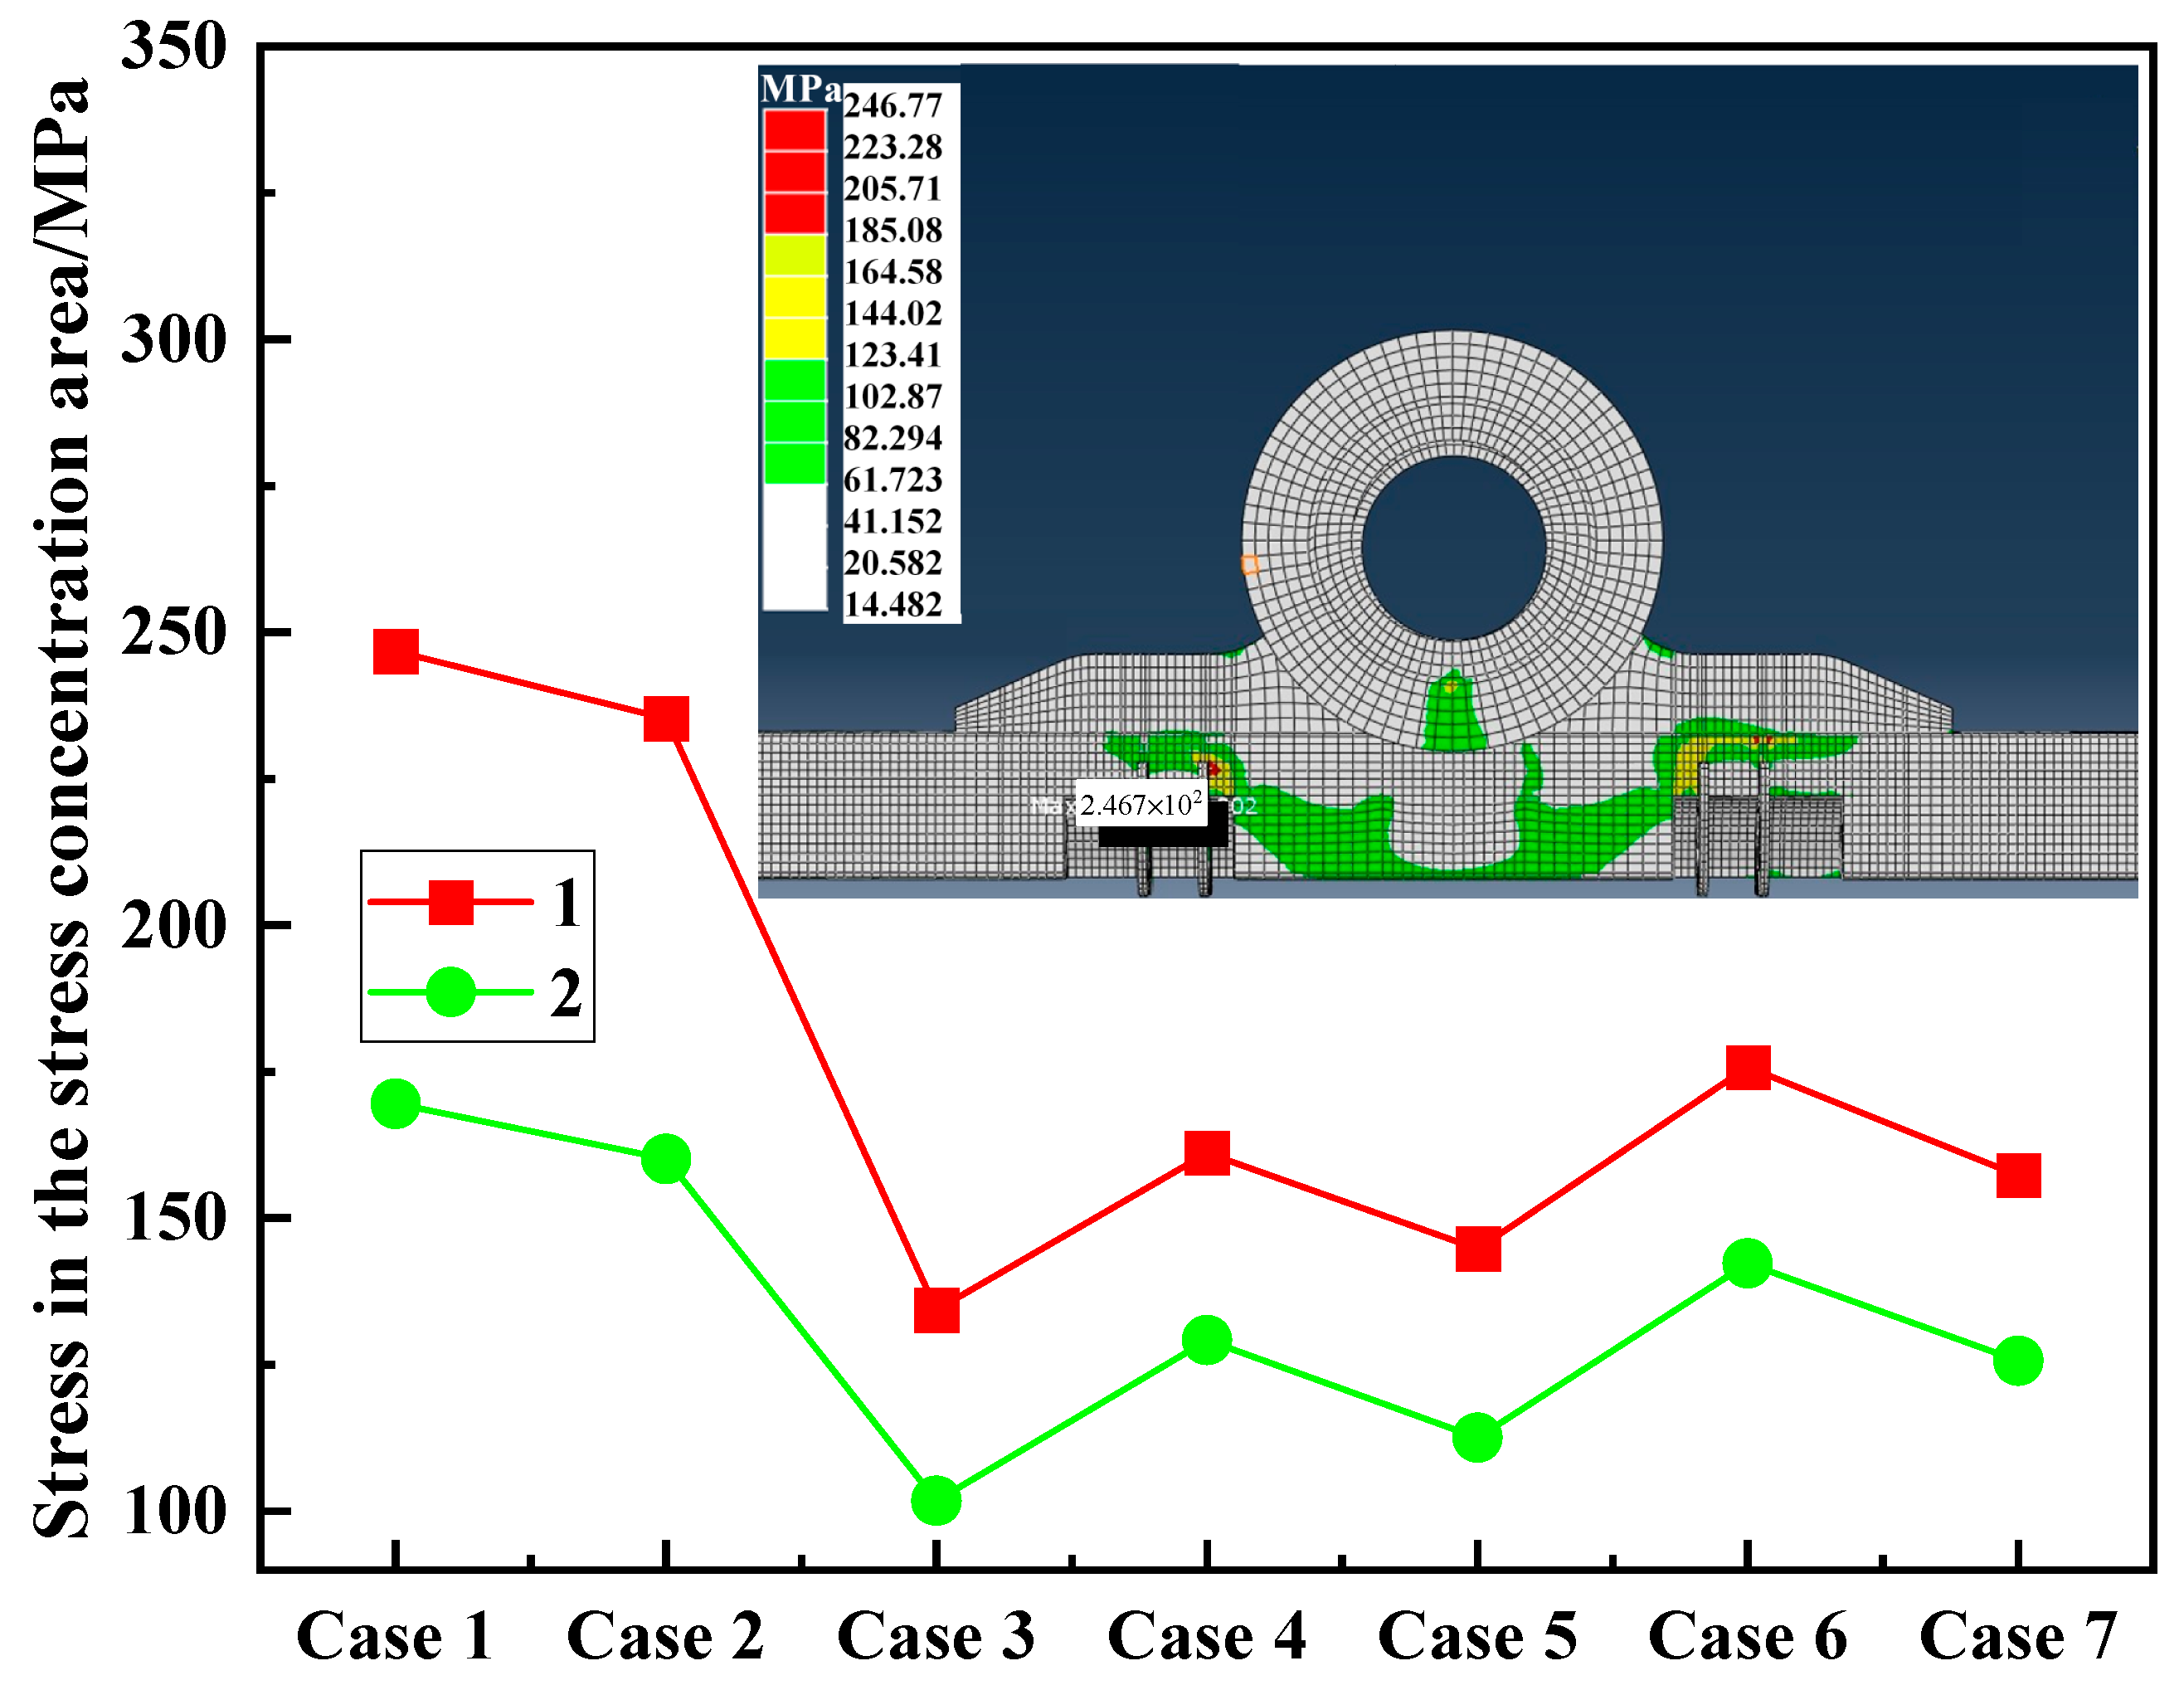
Figure 12 shows the calculation results for the stress on the connection seat of the altitude angle in the DCSTPS and the steering device of the base in the DCSTPS under the seven operating conditions. It can be seen that the maximum stress on the connection seat of the altitude angle under the seven operating conditions is 246.81 MPa, and the maximum stress on the steering device of the base is 169.5 MPa.
The material used in the connection seat of the altitude angle in the DCSTPS is Q345 and the material used in the steering device of the base in the DCSTPS is Q235. The yield limit of Q345 is σs1 = 345 MPa, the yield limit of Q235 is σs2 = 235 MPa, and the safety factor of the material is γ = 1.375. Therefore, the allowable stresses of Q345 and Q235 are [σ1] = σs1/γ = 250.9 MPa and [σ2] = σs2/γ = 170.9 MPa, respectively.
According to the maximum stress values of σmax1 = 246.81 MPa < [σ1] = 250.9 MPa and σmax2 = 169.5 MPa < [σ2] = 170.9 MPa, the maximum stress value on the connection seat of the altitude angle and the steering device of the base under working condition 1 is close to the allowable stress of Q345 and Q235, and there is a high possibility of the plastic deformation or the failure during operation. In future research, design optimization will be carried out to minimize the stress concentration near the connection seat of the altitude angle and the steering device of the base.

4. Conclusions

(1)
According to the static analysis results, applying different forces to the balance box has a significant impact on the overall deformation of the DCSTPS model. Under α = 0° and β = 0°, the maximum displacement of the DCSTPS is basically at the connection between the cantilever and the Stirling generator, while the deformation of the support structure is mainly at the edges of the upper and lower parts of the concentrator.
(2)
According to the modal analysis results, the most strongly vibrating parts of the DCSTPS are the edge area of the concentrator grid and the front and rear ends of the truss grid. The fundamental natural frequency of the DCSTPS is 0.67910 Hz, and the natural frequency of the DCSTPS is much higher than the dominant frequency of the pulsating wind load (0.001~0.01 Hz), so the DCSTPS will not experience strong resonance phenomena.
(3)
The absolute values of the relative errors of the natural frequency of the DCSTPS and the maximum deformation of the DCSTPS decrease with the increase in the modal order considering the effect of FSC. This is mainly because the FSC has the effect of suppressing the deformation of higher order modes of the DCSTPS. Therefore, the fluid has a greater effect on the maximum deformation of a lower order DCSTPS, while having a smaller effect on the maximum deformation of a higher order DCSTPS. Additionally, considering the effect of FSC, the natural frequencies of all orders decrease, with the first-order natural frequency showing the most significant decrease.
(4)
Taking the safety grade evaluation index of the DCSTPS as the target layer, wind load, force load, and moment load as the criterion layer, and establishing relevant index layers below the criterion layer, a safety grade evaluation index system for the DCSTPS was ultimately established. On this basis, a safety grade evaluation of the DCSTPS was conducted based on the catastrophe theory. The results showed that the safety grade of the DCSTPS was 0.2586 and 0.2819 under case 1 and case 2. Through analysis and calculation, it was found that the membership value of the moment load was low, resulting in the stress on the connection seat of the altitude angle and the steering device of the base approaching the allowable stress of the material. This indicates that there are weak links in the system’s structural design, and such safety issues should be avoided in future design optimization work.

Author Contributions

Conceptualization, H.Z. and J.E.; Methodology, H.Z. and J.E.; Software, Y.S. and J.L.; Validation, H.Z., Y.S., J.L., G.J., M.C., D.N. and J.E.; Formal analysis, H.Z., Y.S., J.L., G.J., M.C., D.N. and J.E.; Investigation, H.Z., Y.S., J.L., G.J., M.C., D.N. and J.E.; Data curation, H.Z., Y.S., J.L., G.J., M.C., D.N. and J.E.; Writing—original draft, H.Z. and Y.S.; Writing—review & editing, J.L., G.J., M.C., D.N. and J.E.; Supervision, J.E.; Funding acquisition, H.Z. All authors have read and agreed to the published version of the manuscript.

Funding

This work is supported by the National Natural Science Foundation of China (No. 52175135).

Data Availability Statement

The original contributions presented in this study are included in the article. Further inquiries can be directed to the corresponding author.

Conflicts of Interest

The authors declare that they have no conflicts of interests regarding the publication of this paper.

Nomenclature

C damping matrix of the DCSTPS; CMx pitching moment coefficient of the DCSTPS; CMy roll moment coefficient of the DCSTPS; CMz azimuth moment coefficient of the DCSTPS; Cx side force coefficient of the DCSTPS; Cy resistance force coefficient of the DCSTPS; Cz lift force coefficient of the DCSTPS; df displacement in the fluid domain, m; ds local displacement in the solid domain, m; d2ds/dt2 acceleration vector of the solid node; e stress tensor of the fluid velocity, e = 0.5 ( v + v T ) , N; Ff volumetric force in the fluid domain of the DCSTPS, kg/(m2·s2); Fs volumetric force in the solid domain of the DCSTPS, kg/(m2·s2); Ffx, Ffy, Ffz force components of unit volume in the x, y and z directions; htot total enthalpy in the fluid domain of the DCSTPS, J/kg; p fluid pressure in computational domain of the DCSTPS, Pa; pf fluid pressure vector in the fluid domain of the DCSTPS, Pa; qf heat flow in the fluid domain of the DCSTPS, W; qs heat flow in the solid domain of the DCSTPS, W; i unit tensor as x directions; I unit tensor; j unit tensor as y directions; k unit tensor as z directions; K stiffness matrix of the DCSTPS; Kf stiffness matrix of the fluid; M mass matrix of the DCSTPS; Mf mass matrix of the fluid; nf normal unit vector of the fluid at the fluid–structure coupling interface; ns normal unit vector of the solid at the fluid–structure coupling interface; R fluid–structure coupling matrix; S node displacement vector of the DCSTPS, m; SE energy source terms in the solid domain of the DCSTPS, kg/(m·s3); Tf temperature in the fluid domain of the DCSTPS, K; Ts temperature in the solid domain of the DCSTPS, K. U fluid velocity vector in the fluid domain of the DCSTPS, m/s; u, v, w components of vector U in the x, y and z directions

Greek Letters

▽ Hamiltonian operator, ▽ = (∂/∂x)i + (∂/∂y)j + (∂/∂z)k; ρf fluid density in the fluid domain of the DCSTPS, kg/m3; ρs solid density in the solid domain of the DCSTPS, kg/m3; σs cauchy’s stress tensor in the solid domain of the DCSTPS, Pa; λ thermal conductivity of the fluid domain of the DCSTPS, W/(m·K); τ working time of the DCSTPS, s; τf shear force tensor of the fluid domain of the DCSTPS, Pa; τs stress tensor of the solid domain of the DCSTPS, Pa; τxx, τxy, τxz components of the viscous force on the surface of microelements generated by molecular viscosity; Φx feature vector of the x-th-order natural frequency; ωx x-th-order natural frequency, rad/s; μ dynamic viscosity of fluid in computational domain of the DCSTPS, Pa·s.

References

  1. He, Y.L.; Qiu, Y.; Wang, K.; Yuan, F.; Wang, W.Q.; Li, M.J.; Guo, J.Q. Perspective of concentrating solar power. Energy 2020, 198, 117373. [Google Scholar] [CrossRef]
  2. Yu, Q.; Li, X.; Wang, Z.; Zhang, Q. Modeling and dynamic simulation of thermal energy storage system for concentrating solar power plant. Energy 2020, 198, 117183. [Google Scholar] [CrossRef]
  3. Shi, P.; Li, J.; Song, Y.; Xu, N.; Zhu, J. Cogeneration of clean water and valuable energy/resources via interfacial solar evaporation. Nano Lett. 2024, 19, 5673–5682. [Google Scholar] [CrossRef]
  4. Conceição, R.; González-Aguilar, J.; Merrouni, A.A.; Romero, M. Soiling effect in solar energy conversion systems: A review. Renew. Sustain. Energy Rev. 2022, 162, 112434. [Google Scholar] [CrossRef]
  5. Ho, C.K.; Iverson, B.D. Review of high-temperature central receiver designs for concentrating solar power. Renew. Sustain. Energy Rev. 2014, 29, 835–846. [Google Scholar] [CrossRef]
  6. Paneru, B.; Paneru, B.; Alexander, V.; Nova, S.; Bhattarai, N.; Poudyal, R.; Narayan Poudyal, K.; Dangi, M.B.; Boland, J.J. Solar energy for operating solar cookers as a clean cooking technology in South Asia: A review. Sol. Energy 2024, 283, 113004. [Google Scholar] [CrossRef]
  7. Ho, C.K. Advances in central receivers for concentrating solar applications. Sol. Energy 2017, 152, 38–56. [Google Scholar] [CrossRef]
  8. Gomez-Garcia, F.; Gonzalez-Aguilar, J.; Tamayo-Pacheco, S.; Olalde, G.; Romero, M. Numerical Analysis of Radiation Attenuation in Volumetric Solar Receivers Composed of a Stack of Thin Monolith Layers. Energy Procedia 2014, 57, 457–466. [Google Scholar] [CrossRef]
  9. Ho, C.K.; Khalsa, S.S.; Kolb, G.J. Methods for probabilistic modeling of concentrating solar power plants. Sol. Energy 2011, 85, 669–675. [Google Scholar] [CrossRef]
  10. Ho, C.K. A review of high-temperature particle receivers for concentrating solar power. Appl. Therm. Eng. 2016, 109, 958–969. [Google Scholar] [CrossRef]
  11. González-Pardo, A.; González-Aguilar, J.; Romero, M. Analysis of glint and glare produced by the receiver of small heliostat fields integrated in building façades. Methodology applicable to conventional central receiver systems. Sol. Energy 2015, 121, 68–77. [Google Scholar] [CrossRef]
  12. Xu, X.; Zhang, L.; Zhang, H.; Ma, J.; Sambatmaryde, K. Performance analysis of a novel small-scale integrated solar-ORC system for power and heating. Sol. Energy 2024, 274, 112605. [Google Scholar] [CrossRef]
  13. Martínez-Hernández, A.; Conceição, R.; Asselineau, C.-A.; Romero, M.; González-Aguilar, J. Advanced surface reconstruction method for solar reflective concentrators by flux mapping. Sol. Energy 2023, 266, 112162. [Google Scholar] [CrossRef]
  14. Khan, M.I.; Asfand, F.; Al-Ghamdi, S.G.; Bicer, Y.; Khan, M.; Faqooq, M.; Pesyridis, A. Realizing the promise of concentrating solar power for thermal desalination: A review of technology configurations and optimizations. Renew. Sustain. Energy Rev. 2024, 208, 115022. [Google Scholar] [CrossRef]
  15. Rodriguez, J.; Canadas, I.; Monterreal, R.; Enrique, R.; Galindo, J. PSA SF60 solar furnace renewed. AIP Conf. Proc. 2019, 2126, 030046. [Google Scholar] [CrossRef]
  16. Broman, L.; Broman, A. Parabolic dish concentrators approximated by simple surfaces. Sol. Energy 1996, 57, 317–321. [Google Scholar] [CrossRef]
  17. Johnston, G.; Lovegrove, K.; Luzzi, A. Optical performance of spherical reflecting elements for use with paraboloidal dish concentrators. Sol. Energy 2003, 74, 133–140. [Google Scholar] [CrossRef]
  18. Kalogirou, S.A. Solar thermal collectors and applications. Prog. Energy Combust. Sci. 2004, 3, 231–295. [Google Scholar] [CrossRef]
  19. Kumar, N.S.; Reddy, K.S. Comparison of receivers for solar dish collectors system. Energy Convers. Manag. 2008, 49, 812–819. [Google Scholar] [CrossRef]
  20. Chen, C.F.; Lin, C.H.; Jan, H.T. A solar concentrator with two reflection mirrors designed by using a ray tracing method. Opt. Int. J. Light Electron Opt. 2010, 121, 1042–1051. [Google Scholar] [CrossRef]
  21. Wu, W.; Wang, T.; Wang, X.; Wu, S.; Luo, Y.; Tian, X.; Zhang, Q. Hybird solar concentrator with zero self-absorption loss. Sol. Energy 2010, 84, 2140–2145. [Google Scholar] [CrossRef]
  22. Mlatho, J.S.P.; McPherson, M.; Mawire, A.; Heetkamp, V.R.J.J. Determination of the spatial extent of the focal point of a parabolic dish reflector using a red laser diode. Renew. Energy 2010, 35, 1982–1990. [Google Scholar] [CrossRef]
  23. Munir, A.; Hensel, O.; Scheffler, W. Design principle and calculations of a Scheffler fixed focus concentrator for medium temperature applications. Sol. Energy 2010, 84, 1490–1502. [Google Scholar] [CrossRef]
  24. Velazquez, N.; García-Valladares, O.; Sauceda, D.; Beltrán, R. Numerical simulation of a Linear Fresnel Reflector Concentrator used as direct generator in a Solar-GAX cycle. Energy Convers. Manag. 2010, 51, 434–445. [Google Scholar] [CrossRef]
  25. Zanganeh, G.; Bader, R.; Pedretti, A.; Pedretti, M.; Steinfeld, A. A solar dish concentrator based on ellipsoidal polyester membrane facets. Sol. Energy 2012, 86, 40–47. [Google Scholar] [CrossRef]
  26. Christo, F.C. Numerical modelling of wind and dust patterns around a full-scale paraboloidal solar dish. Renew. Energy 2012, 39, 356–366. [Google Scholar] [CrossRef]
  27. Liu, Z.; Lapp, J.; Lipiński, W. Optical design of a flat-facet solar concentrator. Sol. Energy 2012, 86, 1962–1966. [Google Scholar] [CrossRef]
  28. Sardeshpande, V.; Pillai, I.R. Effect of micro-level and macro-level factors on adoption potential of solar concentrators for medium temperature thermal applications. Energy Sustain. Dev. 2012, 16, 216–223. [Google Scholar] [CrossRef]
  29. Xiao, J.; Wei, X.; Lu, Z.; Yu, W.; Wu, H. A review of available methods for surface shape measurement of solar concentrator in solar thermal power applications. Renew. Sustain. Energy Rev. 2012, 16, 2539–2544. [Google Scholar] [CrossRef]
  30. Ruelas, J.; Velazquez, N.; Cerezo, J. A mathematical model to develop a Scheffler-type solar concentrator coupled with a Stirling engine. Appl. Energy 2013, 101, 253–260. [Google Scholar] [CrossRef]
  31. Cheng, J.; Park, S.; Chen, C.L. Optofluidic solar concentrators using electrowetting tracking: Concept design and characterization. Sol. Energy 2013, 89, 152–161. [Google Scholar] [CrossRef]
  32. Ye, W.; Liu, J.; Gan, L.; Wang, H.; Qin, L.; Zang, Q.; Bordas, S.P. Fluid-structure coupling analysis in liquid-filled containers using scaled boundary finite element method. Comput. Struct. 2024, 303, 107494. [Google Scholar]
  33. Sun, Q.; Liu, B.; Wang, X.; Peng, W.; Lei, S. Fluid-structure coupling for particle deposition-resuspension predictions in tube bundle heat exchangers based on dynamic mesh method. Chem. Eng. Sci. 2024, 297, 120313. [Google Scholar] [CrossRef]
  34. John, G.S.; Lakshmanan, T. Cost optimization of dish solar concentrator system for improved scalability decisions. Renew. Energy 2017, 114, 600–613. [Google Scholar]
  35. Faddouli, A.; Hajji, M.; Fadili, S.; Hartiti, B.; Labrim, H.; Habchi, A. A comprehensive review of solar, thermal, photovoltaic, and thermoelectric hybrid systems for heating and power generation. Int. J. Green Energy 2024, 21, 413–447. [Google Scholar] [CrossRef]
  36. Pratik, N.A.; Ali, M.H.; Lubaba, N.; Hasan, N.; Asaduzzaman, M.; Miyara, A. Numerical investigation to optimize the modified cavity receiver for enhancement of thermal performance of solar parabolic dish collector system. Energy 2024, 290, 130133. [Google Scholar] [CrossRef]
  37. Yan, J.; Peng, Y.; Xie, X.; Liu, Y. Optical performance maintenance of solar dish collector system under service loads based on tracking compensation and receiver translational compensation methods. Energy 2024, 313, 134125. [Google Scholar] [CrossRef]
  38. Zuo, H.; Liu, G.; Zuo, W.; Wei, K.; Hu, W.; Tan, J.; Zhong, D. Catastrophic analysis on the stability of a large dish solar thermal power generation system with wind-induced vibration. Sol. Energy 2019, 183, 40–49. [Google Scholar] [CrossRef]
  39. Uzair, M.; Anderson, T.N.; Nates, R.J. The impact of the parabolic dish concentrator on the wind induced heat loss from its receiver. Sol. Energy 2017, 151, 95–101. [Google Scholar] [CrossRef]
  40. Zuo, H.; Tan, J.; Wei, K.; Huang, Z.; Zhong, D.; Xie, F. Effects of different poses and wind speeds on wind-induced vibration characteristics of a dish solar concentrator system. Renew. Energy 2021, 168, 1308–1326. [Google Scholar] [CrossRef]
  41. E, S.; Liu, Y.; Cui, Y.; Wu, A.; Yin, H. Effects of composite cooling strategy including phase change material and cooling air on the heat dissipation performance improvement of lithium ion power batteries pack in hot climate and its catastrophe evaluation. Energy 2023, 283, 129074. [Google Scholar] [CrossRef]
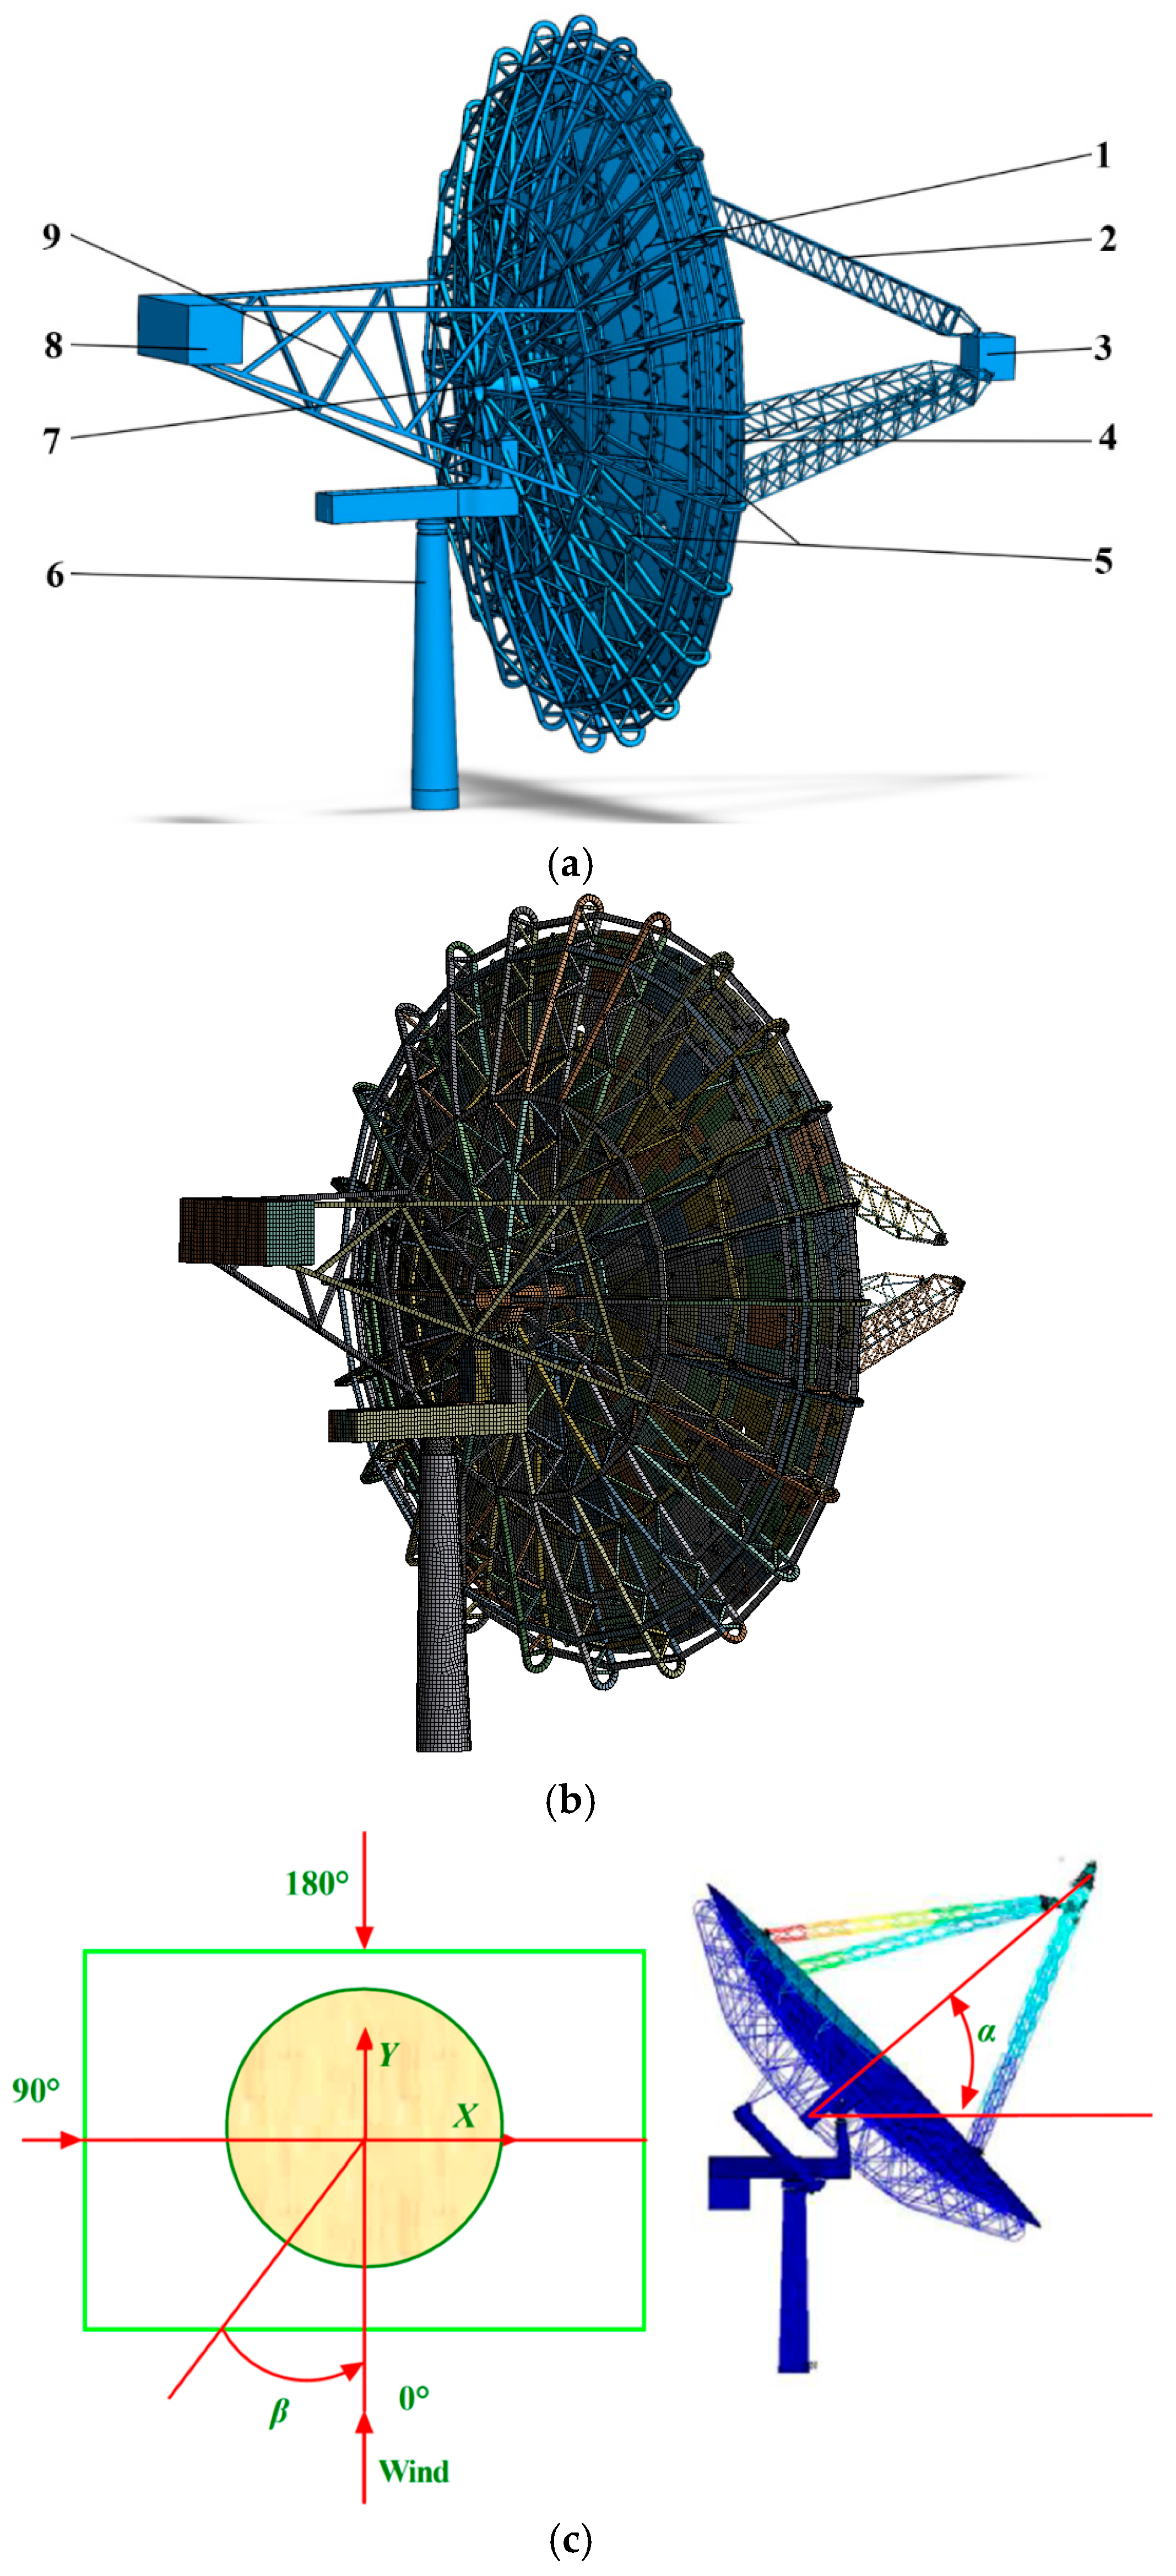
Figure 1. Three-dimensional physical model and simulation model of the DCSTPS. (a) Three-dimensional physical model. 1—dish concentrator; 2—cantilever beam; 3—heat absorber and other devices; 4—connecting column; 5—support truss; 6—support column; 7—center body; 8—balance box; 9—balance truss. (b) Finite element simulation model. (c) Altitude angle α and azimuth angle β.
Energies 18 06088 g001
Figure 2. Fluid domain mesh division of the computational domain. (a) Altitude view. (b) Left view. (c) Computational domain and its encrypted area mesh. (d) Mesh encryption area.
Energies 18 06088 g002
Figure 3. Verification of the grid independence of the DCSTPS under α = 0° and β = 0°.
Energies 18 06088 g003
Figure 4. Comparison of drag coefficient and lift coefficient at different altitude angles [39]. (a) Drag coefficient. (b) Lift force coefficient.
Energies 18 06088 g004
Figure 5. Displacement cloud map of the DCSTPS under various operating conditions. (a) Balance forces of 50 kN. (b) Balance forces of 100 kN. (c) Balance forces of 150 kN. (d) Balance forces of 200 kN. (e) Balance forces of 250 kN. (f) Balance forces of 300 kN.
Energies 18 06088 g005aEnergies 18 06088 g005b
Figure 6. Maximum displacement of the DCSTPS under various operating conditions.
Energies 18 06088 g006
Figure 7. 1st to 6th-order modal diagrams. (a) First-order mode shape. (b) Second-order mode shape. (c) Third-order mode shape. (d) Fourth-order mode shape. (e) Fifth-order mode shape. (f) Sixth-order mode shape.
Energies 18 06088 g007aEnergies 18 06088 g007b
Figure 8. Comparison of the maximum deformation and the 1st–6th-order natural frequencies under α = 0° and β = 0°. (a) Maximum deformation. (b) Comparison of natural frequencies.
Energies 18 06088 g008
Figure 9. Comparison of natural frequencies and maximum deformations at 1–6-order modal under α = 0° and β = 0°. (a) Natural frequency. (b) Maximum deformation.
Energies 18 06088 g009
Figure 10. Safety evaluation values of the indicator grade of the DCSTPS.
Energies 18 06088 g010
Figure 11. Safety evaluation values of the target grade of the DCSTPS.
Energies 18 06088 g011
Figure 12. Stress on the connection seat of the altitude angle and stress on the steering device of the base in the DCSTPS. 1—Stress on the altitude angle connection seat; 2—stress on the steering device of the base.
Energies 18 06088 g012
Table 1. Cusp point-type model and dovetail-type model.
Type of CatastropheControl VariableState VariablePrimary Potential FunctionsDivergence Equation
Cusp point-type model21V(x) = x4 + Ux2 + VxU = 6x2, V = 8x3
Dovetail-type model31V(x) = x5 + Ux3 + Vx2 + WxU = 6x2, V = 8x3, W = 3x4
Table 2. Safety evaluation index system of the DCSTPS.
Target LayerSecondary Indicator LayerThird Indicator Layer
Dish concentrating solar thermal power system safety evaluation index systemWind load, uMaximum surface wind pressure p (Pa), u1
Air velocity (m/s), u2
Force load, vLateral force (kN), v1
Drag (kN), v2
Lift force (kN), v3
Moment load, wPitch moment (N·m), w1
Rolling moment (N·m), w2
Azimuth moment (N·m), w3
Table 3. Simulation cases for the safety performance of the DCSTPS.
CaseAltitude Angle αAzimuth Angle β
13090
26090
390135
430180
560180
60180
700
Table 4. Simulation results for the safety performance of the DCSTPS.
Caseu1/Pau2/m·s−1v1/Nv2/Nv3/Nw1/N·mw2/N·mw3/N·m
13.38 × 10220.01.46 × 1044.60 × 103−8.46 × 1034.50 × 104−8.24 × 1027.80 × 104
23.30 × 10220.08.47 × 1034.65 × 103−1.47 × 1047.83 × 104−45.84.52 × 104
33.84 × 10222.0−6.465.80 × 103−1.82 × 1051.13 × 105−1.45 × 10211.7
43.91 × 10222.04.068.20 × 1044.09 × 1041.07 × 10550.768. 9
54.73 × 10225.0−22.44.24 × 1045.50 × 1041.76 × 105−4.07 × 10²−2.61 × 10²
64.96 × 10225.0−84.01.28 × 1052.80 × 103−5.60 × 10⁴−16.3−1.80 × 10³
74.97 × 10225.021.91.55 × 105−1.83 × 10³−4.16 × 10⁴−29.4−4.03 × 10²
Table 5. The normalized results on safety evaluation index system of the DCSTPS.
Caseu1 (−)u2 (−)v1 (−)v2 (−)v3 (−)w1 (−)w2 (−)w3 (−)
10.97551.00000.00031.00000.21600.92420.01980.0002
21.00001.00000.00050.98940.12460.53140.35570.0003
30.85790.90910.62850.79350.10030.36740.11191.0000
40.84240.90911.00000.05610.04460.38830.32100.1702
50.69760.80000.18120.10850.03320.23630.04000.0450
60.66430.80000.04830.03600.65370.74361.00000.0065
70.66400.80000.18510.02971.00001.00000.55300.0291
Disclaimer/Publisher’s Note: The statements, opinions and data contained in all publications are solely those of the individual author(s) and contributor(s) and not of MDPI and/or the editor(s). MDPI and/or the editor(s) disclaim responsibility for any injury to people or property resulting from any ideas, methods, instructions or products referred to in the content.