Article

Comparative Experimental Analysis of Wet-State Thermal Performance in Pipe Mineral Wool Insulation with Different Hydrophobic Treatments

1
Department of Energy Supply of Enterprises, Construction of Buildings and Structures, Kazan State Power Engineering University, 51 Krasnoselskaya Street, 420066 Kazan, Russia
2
Institute of Mechanical Engineering for Chemical and Petrochemical Industry, Kazan National Research Technological University, 68 Karl Marx Street, 420015 Kazan, Russia
*
Author to whom correspondence should be addressed.
Energies 2025, 18(22), 6074; https://doi.org/10.3390/en18226074 (registering DOI)
Submission received: 22 October 2025 / Revised: 13 November 2025 / Accepted: 18 November 2025 / Published: 20 November 2025
(This article belongs to the Special Issue Research and Application of Building Thermal Insulation Materials)

Abstract

Pipeline insulation is critical for energy-efficient building heating systems, as moisture ingress significantly degrades thermal performance and increases energy losses. This study experimentally evaluated how quality characteristics of mineral wool affect the thermal performance of pipe insulations (wired mats) at temperatures ranging from 20 °C to 85 °C with moisture content up to 12% by weight. Thermal conductivity measurements were performed on two representative samples using the “guarded hot pipe” and direct water injections. Thermal conductivity measurements confirmed the expected increase with rising temperature and moisture content for both samples. In a dry state, quality parameters have practically no effect on the thermal conductivity (0.036–0.041 W∙m−1·K−1). In a low-temperature regime, the inferior quality sample (Sample A) at a maximum moisture content of 12% exhibited thermal conductivity of 0.042 W∙m−1·K−1, and the sample with the best hydrophobic treatment (Sample B) had a thermal conductivity of 0.050 W∙m−1·K−1. At an elevated temperature at a moisture content of 12%, Sample A and Sample B had thermal conductivity of 0.077 W∙m−1·K−1, and 0.109 W∙m−1·K−1, respectively. The results suggest that highly hydrophobic materials are advantageous only in high-temperature applications where rapid moisture removal occurs after short-term ingress, providing critical data for optimizing insulation selection and improving energy conservation in heating networks.

1. Introduction

1.1. Thermal Conductivity of Mineral Wool in Moist Conditions

(Hereinafter, thermal conductivity refers to the effective thermal conductivity of a fibrous porous medium which accounts for all heat and mass transfer effects.) The efficient thermal insulation of pipelines is critically important for modern building heating and hot water supply systems. Pipelines are a significant part of the energy infrastructure in residential, commercial, and industrial buildings, and thermal losses due to insufficient insulation directly translate into increased operational expenses and reduced energy efficiency. Understanding the thermal performance of mineral wool insulation under realistic moisture and temperature conditions typical for district heating networks and building services is essential to optimize system design and ensure long-term reliability. Moisture ingress in pipe insulation is a common cause of insulation degradation, yet its impact on wet-state thermal conductivity, especially in hydrophobically treated materials of different quality, remains poorly characterized.
Abdou and Budaiwi [1] investigated several fibrous insulation materials (mineral wool, fiberglass, and rock wool) over a broad range of moisture contents (from dry up to 8% by weight). They measured thermal conductivity at temperatures between 10 and 40 °C and found that thermal conductivity increases linearly at first, then almost exponentially when moisture content exceeds typical hygroscopic levels (about 1.5–2% by weight). In low-density mineral wool, the thermal conductivity rose from 0.035 W∙m−1∙K−1 (dry) to over 0.060 W∙m−1∙K−1 at high moisture, with a 70% increase for the most absorbent material. The results clearly showed the impact of retained moisture after initial conditioning and aging on insulation performance. Anh [2] reviewed the main factors affecting insulation materials’ thermal conductivity, highlighting that not only moisture, but temperature, density, and micro structural changes (e.g., aging, compaction, fiber orientation) were significant drivers. Literature collected showed measurement methods typically used hot plate or heat flow meter tests, generally at temperatures from 5 °C up to 70 °C, and humidity between 30% and 95% relative humidity, depending on targeted applications (buildings, pipelines, cold storage). Antepara [3] focused on hydrophilic mineral wool, measuring the thermal conductivity with the transient hot-wire method from dry conditions up to near-full water saturation at room temperature (about 20 °C). Results were interpreted with an effective medium theory. As water filled the material, thermal conductivity increased by more than 200% compared to dry, particularly for modified hydrophilic samples, emphasizing the risk for material design in high-humidity environments or after liquid water exposure. Gusyachkin et al. [4] performed guarded hot plate experiments on mineral wool, varying its moisture content from 0% to 10% by weight at a mean temperature of 25 °C. 10% increases in moisture content yielded nearly triple the thermal conductivity. The study also noted that thermal conductivity began to rise rapidly after only minor wetting due to the high affinity of the rock wool structure for capillary water. Hayrullin et al. [5] examined both the effect of moisture and repeated wetting–drying cycles for mineral wool using two measurement methods (“guarded hot plate” and “guarded hot pipe”). They tested samples at 25 °C and progressively added moisture up to 5% by mass, finding thermal conductivity increases of 90–94%. Further, after several wetting–drying cycles, the baseline of the thermal conductivity did not return to its original value, showing structural changes and irreversible loss in insulation performance. Jerman [6] explored the coupled transport and storage of heat and moisture in various thermal insulation materials, with tests conducted across 10–40 °C and relative humidity up to 97%. He found that the increase in thermal conductivity upon wetting was most pronounced at low temperatures (close to the freezing point), while at higher temperatures, evaporation effects could partially mitigate moisture’s thermal effects. Jiřičková et al. [7] studied partially water-saturated mineral wool using both surface and needle probe techniques, with the temperature of measurements held at 23 °C. Their results demonstrated that the thermal conductivity values for dry and lightly moist samples approached the theoretical lower limit (Wiener’s bound), but at higher saturation levels, these values aligned with the upper bound (representing a one-dimensional, layered series of air and water). They also examined how different admixtures affect this relationship. Karamanos et al. [8] focused on stone wool subjected to conditions from 10 °C to 40 °C and relative humidity up to 95%. They demonstrated that the rise in the thermal conductivity is particularly sharp when approaching dew point, with data confirming that in real wall structures, capillary condensation is the main threat to insulation function under humid and mild thermal gradients. Ochs and Müller-Steinhagen [9] investigated the simultaneous influence of temperature (10–70 °C) and moisture. Carefully controlled experiments on slab and pipe fragments showed that in real-life temperature-humidity cycles (mimicking condensation or aging), mineral wool’s thermal conductivity increased up to 50% in wet states and did not always revert back after drying, indicating the importance of design for reversibility. Finally, Zhu et al. [10] ran an extensive program with mechanical fibrous pipe insulation operating at below-ambient temperature, subjecting samples to moist air, fog, and direct water exposure, with thermal conductivity measured between −10 °C and 25 °C, and water contents up to 40% by weight. They found that the thermal conductivity increased more than twice from dry to fully wet and that significant moisture accumulation occurred even in common service conditions, stressing the need for robust material selection and ongoing monitoring.

1.2. Thermal Conductivity of Mineral Wool Pipe Insulations

The thermal conductivity of different insulation materials was tested on test pipes up to about 100 °C in Zehendner’s early work [11]. This study laid the groundwork for calculating pipe insulation thickness in industrial applications. Cai et al. [12] reviewed how moisture ingress, when water vapor penetrates insulation degrades, thermal performance. They summarized mechanisms of vapor condensation and liquid water transport under both dry and wet condensing conditions, emphasizing the need to include moisture in insulation design for pipes operating below ambient dew point. Hayrullin et al. [13] compared the “guarded hot plate” and “guarded hot pipe” methods on stone wool samples (density 80–105 kg∙m−3) at 25 °C with moisture contents up to 5%. They observed thermal conductivity rising from about 0.038 W∙m−1∙K−1 (dry) to 0.074 W∙m−1∙K−1 (5% moisture)—an increase of 90–94%. Differences between methods were under 10%, confirming that even small moisture levels greatly degrade performance. Hayrullin et al. [14] conducted experimental tests on pipe insulation with mineral wool to assess the impact of moisture ingress on heat losses. Their results showed that even a small increase in moisture content (up to 5% by mass) nearly doubled the thermal conductivity of the insulation at 25 °C, highlighting the critical role of moisture control for maintaining effective thermal protection in pipe systems. Lu et al. [15] combined experiments and two-dimensional simulations on wet mineral-wool pipe insulation 30 mm thick wrapped around a tube carrying oil at 120 °C. They tested dry, fully submerged, and drained states. When moisture content reached about 12%, thermal conductivity increased by 20–25%. After draining, it dropped back to 0.045 W∙m−1∙K−1, and after full drying to 0.042 W∙m−1∙K−1 (dry baseline 0.038 W∙m−1∙K−1). Simulations showed gravity and capillary forces control liquid distribution and that hydrophobic coatings lose effectiveness at high temperatures. Dragovic et al. [16] studied drying dynamics in mineral wool on a vertical heated pipe under cladding. They injected known volumes of water, recorded humidity and temperature profiles, and found drying occurred in two stages: a rapid evaporation phase controlled by liquid water diffusion, followed by a slower phase influenced by moisture adsorbed on fibers. Drying time scaled with the amount of water added. Behnamian et al. [17] conducted field measurements on steam mains insulated with 50 mm of mineral wool at temperatures above 100 °C. They documented that increasing moisture content from 2% to 8% raised thermal conductivity from 0.040 W∙m−1∙K−1 to 0.052 W∙m−1∙K−1 and led to microcracks in the protective cladding.

1.3. Effects of the Quality Mineral Wool on the Insulation Thermal Performance

Most studies use only mineral wool density as a determining factor in characterizing samples. In dry conditions, higher density generally corresponds to lower pore volume and thus slightly higher thermal conductivity, as fewer air-filled pores reduce the insulation’s ability to trap air. For example, Abdou and Budaiwi [1] compared three fibrous materials of varying densities (65–150 kg∙m−3) at 20 °C and found that the lowest-density sample (65 kg∙m−3) had a dry thermal conductivity of 0.032 W∙m−1∙K−1, while the highest-density sample (150 kg∙m−3) measured 0.038 W∙m−1∙K−1. Similarly, Hayrullin et al. [5] tested stone wool at densities of 80, 95, and 105 kg∙m−3 in the dry state at 25 °C, observing thermal conductivity values of 0.038, 0.041, and 0.044 W∙m−1∙K−1, respectively. Nagy et al. [18] analyzed mineral wool previously installed on a flat roof. While some samples were spoiled, others were still able to support workloads. It was shown that, regardless of the condition of the samples for temperatures from 10 to 23 °C, with a density change from 100 to 130 kg∙m−3, the thermal conductivity ranged from 0.035 to 0.040 W∙m−1∙K−1 only. Only the softened samples showed the greatest increase in thermal conductivity with an increase in sorption moisture content.
Under wet conditions, the effect of density on moisture-induced conductivity increases and becomes more pronounced. In the same study, Abdou and Budaiwi [1] reported that at 8% moisture content by weight, thermal conductivity rose by 60% in the 65 kg∙m−3 material but only by 40% in the kg∙m−3 sample, indicating that higher-density mineral wool is less sensitive to moisture. Hayrullin et al. [5] measured the effect of adding 5% moisture to their 80–105 kg∙m−3 samples and found conductivity increases of 94%, 88%, and 82%, respectively, confirming that denser materials exhibit smaller relative increases in the thermal conductivity when wet. These findings suggest that while denser mineral wool has higher baseline thermal conductivity, it better resists moisture-related degradation, making density a key design parameter for insulation systems where water ingress is likely.
While most studies of mineral wool insulation under moist conditions focus on density and porosity, the fiber morphology-fiber diameter, non-fibrous inclusions, pore structure, and fiber orientation also plays a crucial role in both thermal performance and moisture behavior yet remains underrepresented in wet-state analyses. Farouk et al. [19] optimized the microstructure of basalt-based fibers to improve thermal and acoustic insulation. By adjusting fiber diameter (2–10 μm) and reducing shot content, they achieved a 15% reduction in thermal conductivity at 25 °C and 50% relative humidity. Ivanič et al. [20] examined basalt glass fiber wool with diameters of 4–6 μm, finding that moisture uptake (up to 10% by weight) not only raised thermal conductivity by 20% but also altered fiber morphology, swelling fibers and closing pores, leading to irreversible changes in structure and mechanical stiffness. Kosiński [21] used X-ray tomography to characterize the pore network in loose fibrous insulation (fiber diameters 3–8 μm, porosity 90%), correlating tortuosity and pore size distribution with moisture transport coefficients. They showed that materials with a higher fraction of fine pores (<10 μm) exhibited slower moisture ingress but higher adsorptive capacity, affecting the time-dependent thermal response under wet conditions. Liu & Wang [22] also used X-ray computed tomography to look at the pore structure of fibrous insulation materials in detail. They developed an effective medium model, finding that an increase in mean pore radius from 15 to 30 μm raised thermal conductivity by 8% under dry conditions and by 20% when moisture content reached 8% by mass. Shishulkin et al. [23] investigated how slag and ash impurities, non-fibrous inclusions ranging from 1 to 50 μm, affect the thermal conductivity of basalt wool. They found that 5% by weight of impurities increased the thermal conductivity by 12% at 25 °C and 60% relative humidity, due to localized heat paths and disrupted fiber networks. Together, these studies demonstrate that fiber diameter, pore morphology, fiber orientation, and non-fibrous inclusions significantly impact both dry and wet thermal performance of mineral wool insulation. Integrating detailed morphological characterization into moisture-thermal analyses is essential for accurate performance prediction and improved insulation design.
Despite the critical role of hydrophobic and hydrophilic treatments in controlling moisture ingress and thus preserving the thermal performance of mineral wool insulation, most studies on wet-state thermal conductivity ignore this factor. Only a few authors have explicitly compared treated and untreated materials to quantify the benefit of water-repellent modifications. Jiřičková et al. [24] (2006) performed detailed measurements of thermal conductivity on mineral wool with hydrophobic, hydrophilic, and no treatment at 23 °C over moisture contents from 0% to 30% by weight. Hydrophobic samples absorbed less than 5% moisture and showed only a 10–20% increase in conductivity, whereas hydrophilic samples absorbed 15–25% moisture and experienced conductivity increases of 50–100% once saturation exceeded 10% by weight. Antepara [3] applied effective medium theory to hydrophilic mineral wool and validated it against measurements from dry to near-full saturation, demonstrating that hydrophilic treatments can more than double thermal conductivity at moisture contents above 20% by mass. The study highlighted the necessity of accounting for treatment type in model predictions. Jeon et al. [25] compared glass wool and mineral wool samples coated with a polysiloxane-based hydrophobic agent against uncoated controls. At 25 °C and 80% relative humidity, coated samples absorbed 70% less water and exhibited thermal conductivity increases under 15%, while uncoated samples saw increases of 35–45%. Pokorný et al. [26] investigated moisture transport properties of hydrophilic mineral wool, measuring adsorption isotherms, liquid diffusion coefficients, and thermal conductivity up to 20% moisture at room temperature. They found that hydrophilic treatments increased diffusivity by 30% and raised conductivity by an additional 10% compared to untreated samples at equivalent moisture levels. Together, these works confirm that hydrophobic treatments significantly mitigate moisture-induced losses in thermal performance, while hydrophilic modifications exacerbate them.
Existing studies demonstrate that today, mineral wool density and porosity are the primary parameters used to characterize thermal performance under dry and moist conditions during the day. Fiber morphology, including diameter, orientation, pore structure, and shot content, strongly influences both dry and wet thermal conductivity but remains largely unconsidered in pipe insulation studies. Hydrophobic treatments significantly mitigate moisture-induced losses; however, only a handful of works have quantified this effect for mineral wool materials. However, studies that account for these effects in pipeline insulation under conditions close to real operation are, to date, extremely limited. A comprehensive evaluation of mineral wool pipe insulation under realistic heat (20–85 °C) and moisture (up to 12%) conditions integrating density, morphology, and chemical treatment is a critical research gap. Such research will enable accurate thermal performance prediction and inform the design of durable, water-resistant pipeline insulation.

2. Material Selection and Characterization

The study was conducted on flexible wired mineral (rock) wool mats from different manufacturers to evaluate the performance of pipe insulation in moisture conditions. The selection process comprised three sequential stages: preliminary screening, comprehensive characterization, and final selection. Initial screening involved collecting mineral wool mats from various manufacturers representing different quality grades commonly used in pipe insulation applications. All samples had the nominal density of 80–90 kg∙m−3 and the thickness of 50–60 mm, corresponding to standard applications in heating systems. They were initially screened based on their physical characteristics, including density, morphological properties, and water-repellent features, with the following methods.
Bulk density was measured using the gravimetric method at controlled laboratory conditions (ambient temperature of 25 ± 1 °C and relative humidity of 30 ± 5%) by measuring the mass and geometric dimensions (length, width, and thickness) of each sample [27]. All specimens had dimensions of at least 500 mm. For the thickness measurement, a calibrated plate with a pressure of 500 Pa and a caliper with a pointed depth blade were used. The sample volume was calculated based on these dimensions, and density was defined as the ratio of sample mass to volume, accounting for the moisture content present in the material. The moisture content was calculated by comparing the mass of the small sample of the wool (weight 5 g) before and after drying at a temperature of 105 °C and normalized to the dry mass. To determine the average fiber diameter and the content of non-fibrous inclusions (shots) of mineral wool, samples weighing at least 50 g were utilized. Binders were removed by firing at 600 °C for 15–20 min. From the prepared samples, a bundle of fibers was taken, which was carefully separated and placed in a thin, even layer on a microscope slide in a rosin solution. After drying, the preparations were placed under a microscope with immersion optics, where the diameter of at least 100 fibers was measured at 2520× magnification [27]. The average diameter was calculated as the arithmetic mean of all measurements and rounded to 1 μm. To separate the shots, the resulting calcined material was ground with a rubber stopper on a 60 mesh sieve so that only inclusions remained on it. The content of non-fibrous inclusions in percentage was calculated as double the mass of the residue on the sieve. Water-repellent properties were evaluated through water absorption tests on mineral wool samples in rectangular form with a length and width of 100 mm. The water absorption capacity was determined with a protocol involving 24 h of full immersion in water at a temperature of 22 ± 1 °C. The water capacity is calculated in percentage as a mass ratio of the absorbed water and dry sample [27].

3. Thermal Conductivity Measurements

3.1. Experimental Setup

Thermal conductivity measurements were performed using the “guarded hot pipe” method in accordance with GOST 32025-2012 (EN ISO 8497:1996) standards [28]. To determine the thermal conductivity of insulation materials, a consistent radial heat flow through the material is generated, and the temperature difference between the insulation’s outside and the heater (inside) is measured. Practically, to realize this method, a thermally insulated chamber and a stationary heated pipe placed in the middle are used [29]. Technical details of an experimental installation are shown in Figure 1. As shown in the section view in Figure 1a, the central pipe is divided into three parts: the middle is the test zone (working zone); the two outer zones are guard zones to prevent heat losses along the pipe. More detailed description of hot pipe construction can be found in the paper of Hayrullin et al. [14]. The tested insulation sample is wrapped around a heated pipe, which serves as the core heat source. Guard zone insulations are installed at both ends to minimize axial heat loss. For heating or cooling the outer surface, a coil of a plastic tube surrounds the sample to maintain the surface temperature, and the entire assembly is covered with a flexible insulated outer layer for thermal stability. The coil is attached to a low-temperature thermostat (a chiller) CRYO-VT-01 (Termex, Tomsk, Russia), which maintains the constant temperature of air in the chamber (Figure 1b). Temperature sensors are positioned on both the outer “hot pipe” (TE7-14) and the outer surface of the tested sample (TE18-25), enabling precise monitoring of temperature gradients in the sample. To measure temperatures of the metal wall of the pipe, resistance temperature detectors (RTD) of type M50 (Owen, Moscow, Russia) were used with an accuracy of ±(0.30 + 0.005|t|) °C, where t is an actual temperature. A plate temperature sensor based on a thermocouple type K was created to enhance the accuracy of temperature measurements on the non-uniform outer surface of the sample. The thermocouple junction with a diameter of 0.25 mm was pressed into an aluminum plate with a thickness of 0.5 mm and dimensions of 30 mm × 40 mm (Figure 1c). Positions of the temperature sensors on the pipe’s wall are analogous to the work [14]. A detailed arrangement of the temperature sensors around the sample on the outer surface is shown in Figure 1c. Before the experiment, the RTDs and the thermocouples were calibrated analogously to the work [30] for a temperature range of 0 to 90 °C. The chiller, the precise platinum RTD PT100 with an accuracy of 0.01 °C and the digital precision temperature meter MIT 2.05M (IzTex, Zelenograd, Russia) with an accuracy of 0.0001 °C were used. After the calibration, the maximal uncertainty of the RTDs was below ±0.05 (0.95)°C and for the thermocouples below ±0.1 (0.95)°C. For monitoring air conditions in the chamber, two temperature/humidity transmitters CWT-TH03S-H-M (ComWinTop, Shenzhen City, China) with the accuracy of temperature ±0.5 °C and humidity ±5% were used (TTAT16—above, TTAT 17—below the sample in Figure 1b). All instrumentation is integrated and linked to a data acquisition system (DAQ) based on a personal computer (PC) for continuous recording and management of the experimental parameters (TRC1). The DAQ regulated the wall temperatures of the pipe’s zones with pulse-width modulated converter (TT6) and three solid-state relays (TZ3-5). The power for heating the working zone was registered with an electric energy meter WB-MAP6S (WirenBoard, Dolgoprudny, Russia) with relative accuracy 1% (JQT2). Additionally, Figure 1d shows real views of the experimental setup in the laboratory.

3.2. Sample and Test Rig Preparation

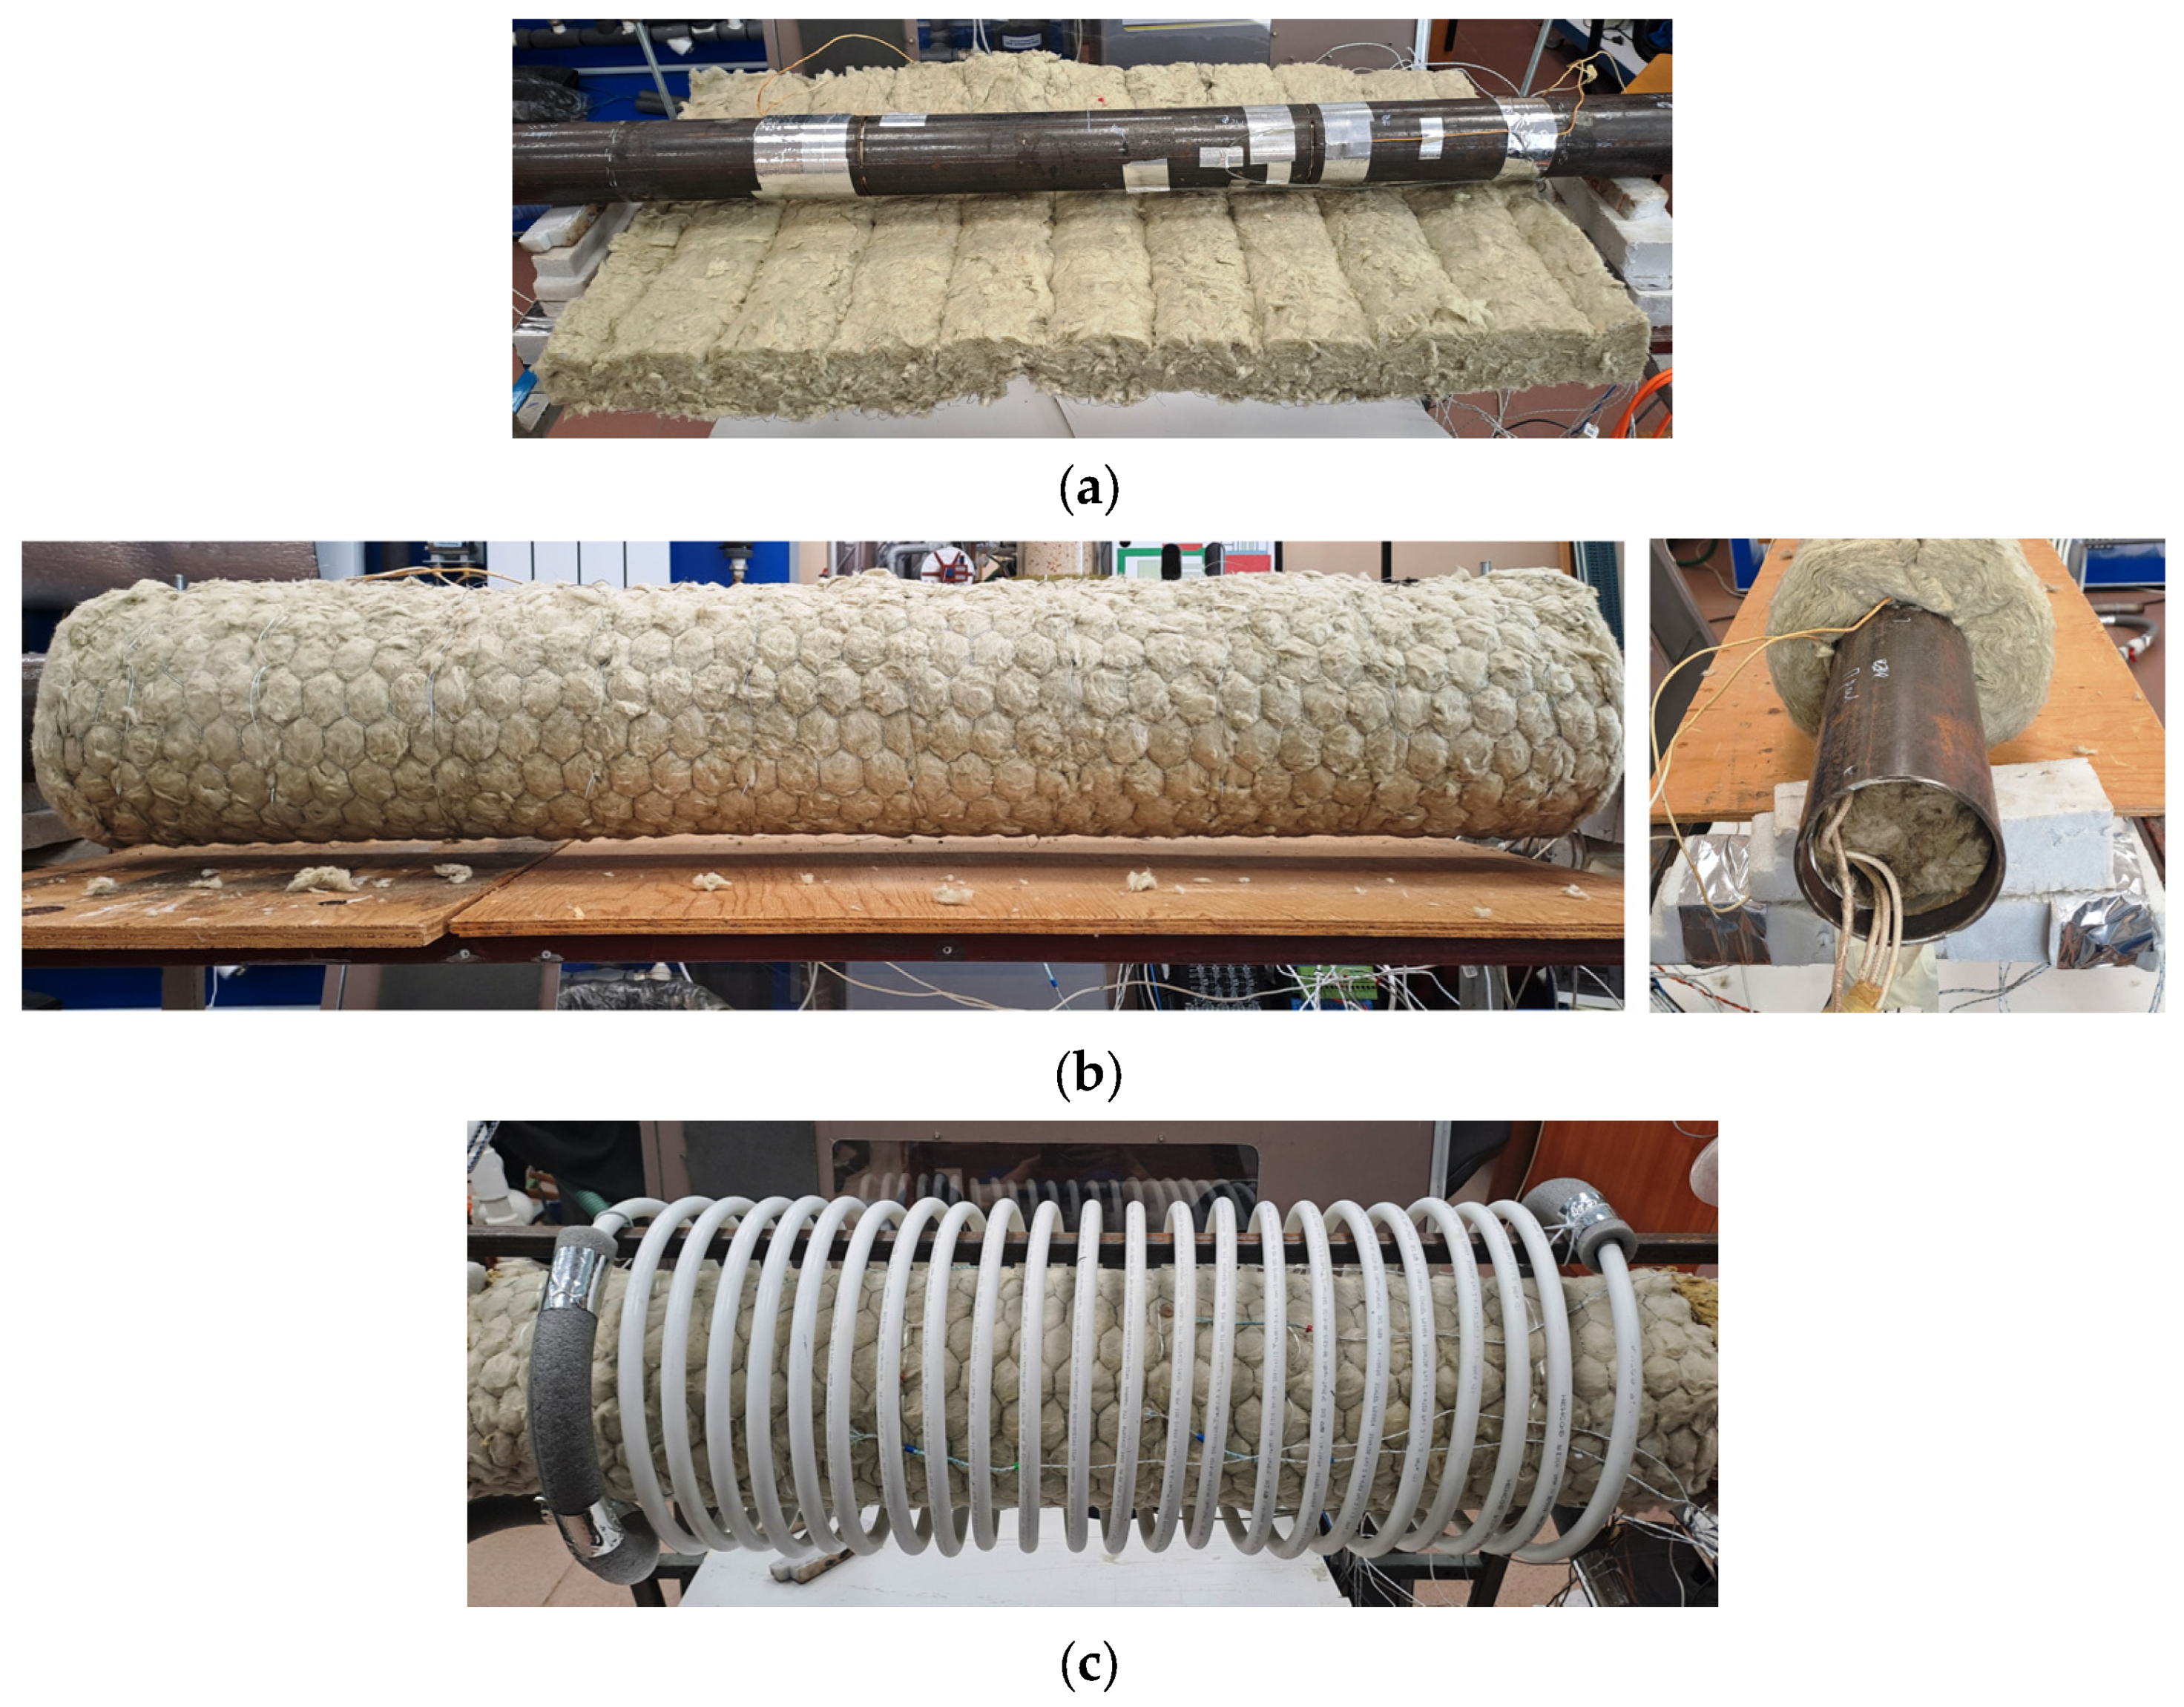
The preparation of samples and assembly of the experimental setup for thermal conductivity measurements were carried out as follows. Insulation samples were cut from a standard roll with a width of 1000 ± 20 mm (Figure 2a), selecting the length such that the sample could be wrapped around the test pipe to form a tight seam without any gaps or overlaps. Each sample was then wrapped onto the heated test pipe and secured using binding wire (Figure 2b). The combined mass of the pipe and sample was measured with an accuracy of ±10 g, and the sample’s mass was calculated accordingly. In the working section, the average external diameter was determined by dividing the working zone into intervals of approximately 50 mm; the circumference of the insulation was measured at each interval using a tape with ±1 mm precision, which was then converted to diameter values. The mean diameter was obtained as the arithmetic average across all intervals. The uniformity of insulation thickness around the circumference was assessed by measuring the insulation depth at increments of 15–20 degrees using a thin probe and ruler (±1 mm accuracy). The actual density of the sample on the test pipe was determined by dividing the measured sample mass by its volume, which was calculated using the mean diameter. External temperature and humidity sensors were installed in accordance with the arrangement shown in Figure 1c. The heating/cooling coil was fitted (Figure 2c) and connected to the chiller. The test section was then wrapped with the external insulation using broad bandages (Figure 1d). Finally, the DAQ was activated, and the measurement procedure started.

3.3. Moisture Ingress Protocol

For wetting of the insulation, a direct water injection method was employed, similar to the approaches used in studies [14,16]. This method is better suited for simulating real-world moisture ingress situations in insulation caused by heat carrier leakage from damaged pipelines [12]. Specifically, the direct injection mimics the localized, internal influx of water or steam, which represents a forced penetration of fluid into the porous structure under pressure, rather than a gradual absorption process. This approach allows for a realistic assessment of the rapid degradation of insulation performance following a pipeline failure.
Initially, based on the specified (target) moisture content (ratio of water mass to wet material mass) and the sample mass in the working zone, the required mass of distilled water for injection into the insulation was calculated. Using a 10 mL syringe, water was injected into the sample to a depth of 30–40 mm. The water was uniformly distributed in small portions of up to 1 mL along the length and circumference within the working zone (Figure 3). For accurate measurement of the water quantity introduced into the sample, the syringe was weighed before and after injection with an accuracy of ±0.01 g. Due to the hydrophobic nature of mineral wool, partial backflow of liquid from the samples occurred during injection. To account for this effect and evaluate the actual moisture content of the samples, additional moisture conditioning experiments were conducted. In samples wrapped around the pipe, water was introduced into the upper, middle, and lower regions of the insulation. The drainage water was continuously collected and weighed with an accuracy of ±0.01 g until it stopped draining (effectively up to 10 min). The obtained values for all zones of each sample were averaged and accounted for in calculating the final (overall) moisture content uncertainty. The technique of the water injection and the drainage evaluation can be seen also in Figure 3 (also see in Videos S1 and S2 in the Supplementary Materials).

3.4. Measurement Procedure

The measurement of thermal conductivity on a wetted sample began with preliminary conditioning in which the specimen was held at 100 ± 5 °C until its thermal conductivity stabilized for at least two hours. Once dry-state measurements were completed under the target temperature conditions, the sample was humidified using the direct water injection technique described above. For this, the outer insulation was slightly opened, and distilled water was injected into the working zone. After injection, the insulation was closed, and the chamber’s temperature profile was restored. Once the system returned to a steady state, the thermal conductivity of the wet sample was fixed.
The following variables were continuously measured and computed in the experiment. Average temperatures of the inner and outer surfaces of the tested sample were calculated as:
t i n , o u t = 1 / N s i = 1 N s t i in , out ,
where t i in , out are the temperatures of each sensor on the hot pipe’s wall or the outer sample’s surfaces, respectively; Ns is the number of sensors (Ns = 4 for the RTDs, Ns = 8 for the thermocouples). And its time-averaged values were defined as:
t i n , o u t = 1 / T a v g 0 T a v g t i n , o u t d τ 1 / N t i m e i = 1 N t i m e t i i n , o u t ,
where τ is current time; Tavg is a time-averaging interval; Ntime is a discrete number of values during the time-averaging procedure, and its value was from 10 to 20.
The average temperature of the sample was calculated approximately as:
t a v g t i n D i n + t o u t D o u t / D i n + D o u t ,
where D out = 1 / N l i = 1 N l D i out is the average outer diameter of the sample, Nl is the number of measuring intervals (Nl = 10); D i n is the diameter of the hot pipe; L is the length of the working zone.
The heat rate was computed as the time-average power consumed to maintain the temperature of the hot pipe in the working zone:
Q = 1 / T a v g ( E ( τ ) E ( τ T a v g ) ) ,
where E is the energy collected with the electric energy meter.
Thermal conductivity was computed using Fourier’s law for a cylindrical wall:
λ = Q ln ( D out / D i n ) 2 π L ( t i n t o u t ) .
The moisture content was defined as:
w = m 1 m 2 m 1 m 2 + m 3 100 ,
where m1, m2, m3 are masses of the injected water, of the drainage water and of the sample in the work zone, respectively. It was assumed that the sample’s mass in the work zone was equivalent to one-third of the sample’s total mass.
A residual was defined as the ratio between the last measured quantity’s value and its average value during the previous hour. An averaged residual was defined as a mean value of all temperature and humidity residuals. When the averaged residual was less than 1.0%, it was accepted that the quasi-steady state had been achieved. And the time-averaged value of the thermal conductivity was calculated in a time interval where its residual was below a threshold. The thresholds are given below in the results.

3.5. Uncertainty Analysis

With a confidence level of 0.95, the uncertainty analysis was carried out using the approach outlined in [31]. The instruments used in the experiments had bias limits provided in Section 3.1. The overall uncertainty of the thermal conduction was estimated as follows:
Δ λ = Δ Q λ Q 2 + Δ L λ L 2 + Δ D out λ D out 2 + Δ D i n λ D i n 2 + Δ t i n λ t i n 2 + Δ t o u t λ t o u t 1 / 2 ,
where Δ Q ,   Δ L ,   Δ D out ,   Δ D i n ,   Δ t i n ,   Δ t o u t are the overall uncertainties of measured variables in Equation (6). The overall uncertainties of wall temperatures were calculated as [32]:
Δ t i n , o u t = Δ t r e f + t N τ 1 Δ t s 2 / N s + σ 2 / N s + σ t i m e 2 / N t i m e 1 / 2 ,
where Δ t r e f is the calibration reference standard uncertainty; t N τ 1 is the Student’s multiplier; Δ t s is the uncertainty of temperature sensors after calibration; σ is the mean spatial standard deviation of sensor readings, calculated as the average of standard deviations across Ntime measurement times; σ τ is the temporal standard deviation of the spatial average temperature measurements. The main source of temperature uncertainty was the spatial deviation of the sensor readings. It should also be noted that, although the measurement uncertainty of thermal conductivity in each experiment trial did not exceed 6.5%, under wet conditions the main source of uncertainty in the mean value was poor repeatability across repeated tests for each case. This was due to the unpredictable behavior of moisture inside the insulation and difficulty in manually reproducing stable moisture introduction conditions. Detailed information regarding uncertainty for each case is provided further.

4. Results and Discussion

4.1. Results of Material Selection

Based on the comprehensive characterization results, two representative samples were selected for the thermal performance testing. These samples were chosen specifically to cover the full spectrum of quality parameters observed in commercially available mineral wool products.
Sample A was selected as an “inferior quality” reference material, characterized by significantly higher water absorption capacity, less effective moisture protection, and suboptimal structural properties. Conversely, Sample B represents the “superior quality” extreme, including effective hydrophobic treatment and controlled fiber morphology. Measured properties of the samples are provided in Table 1.
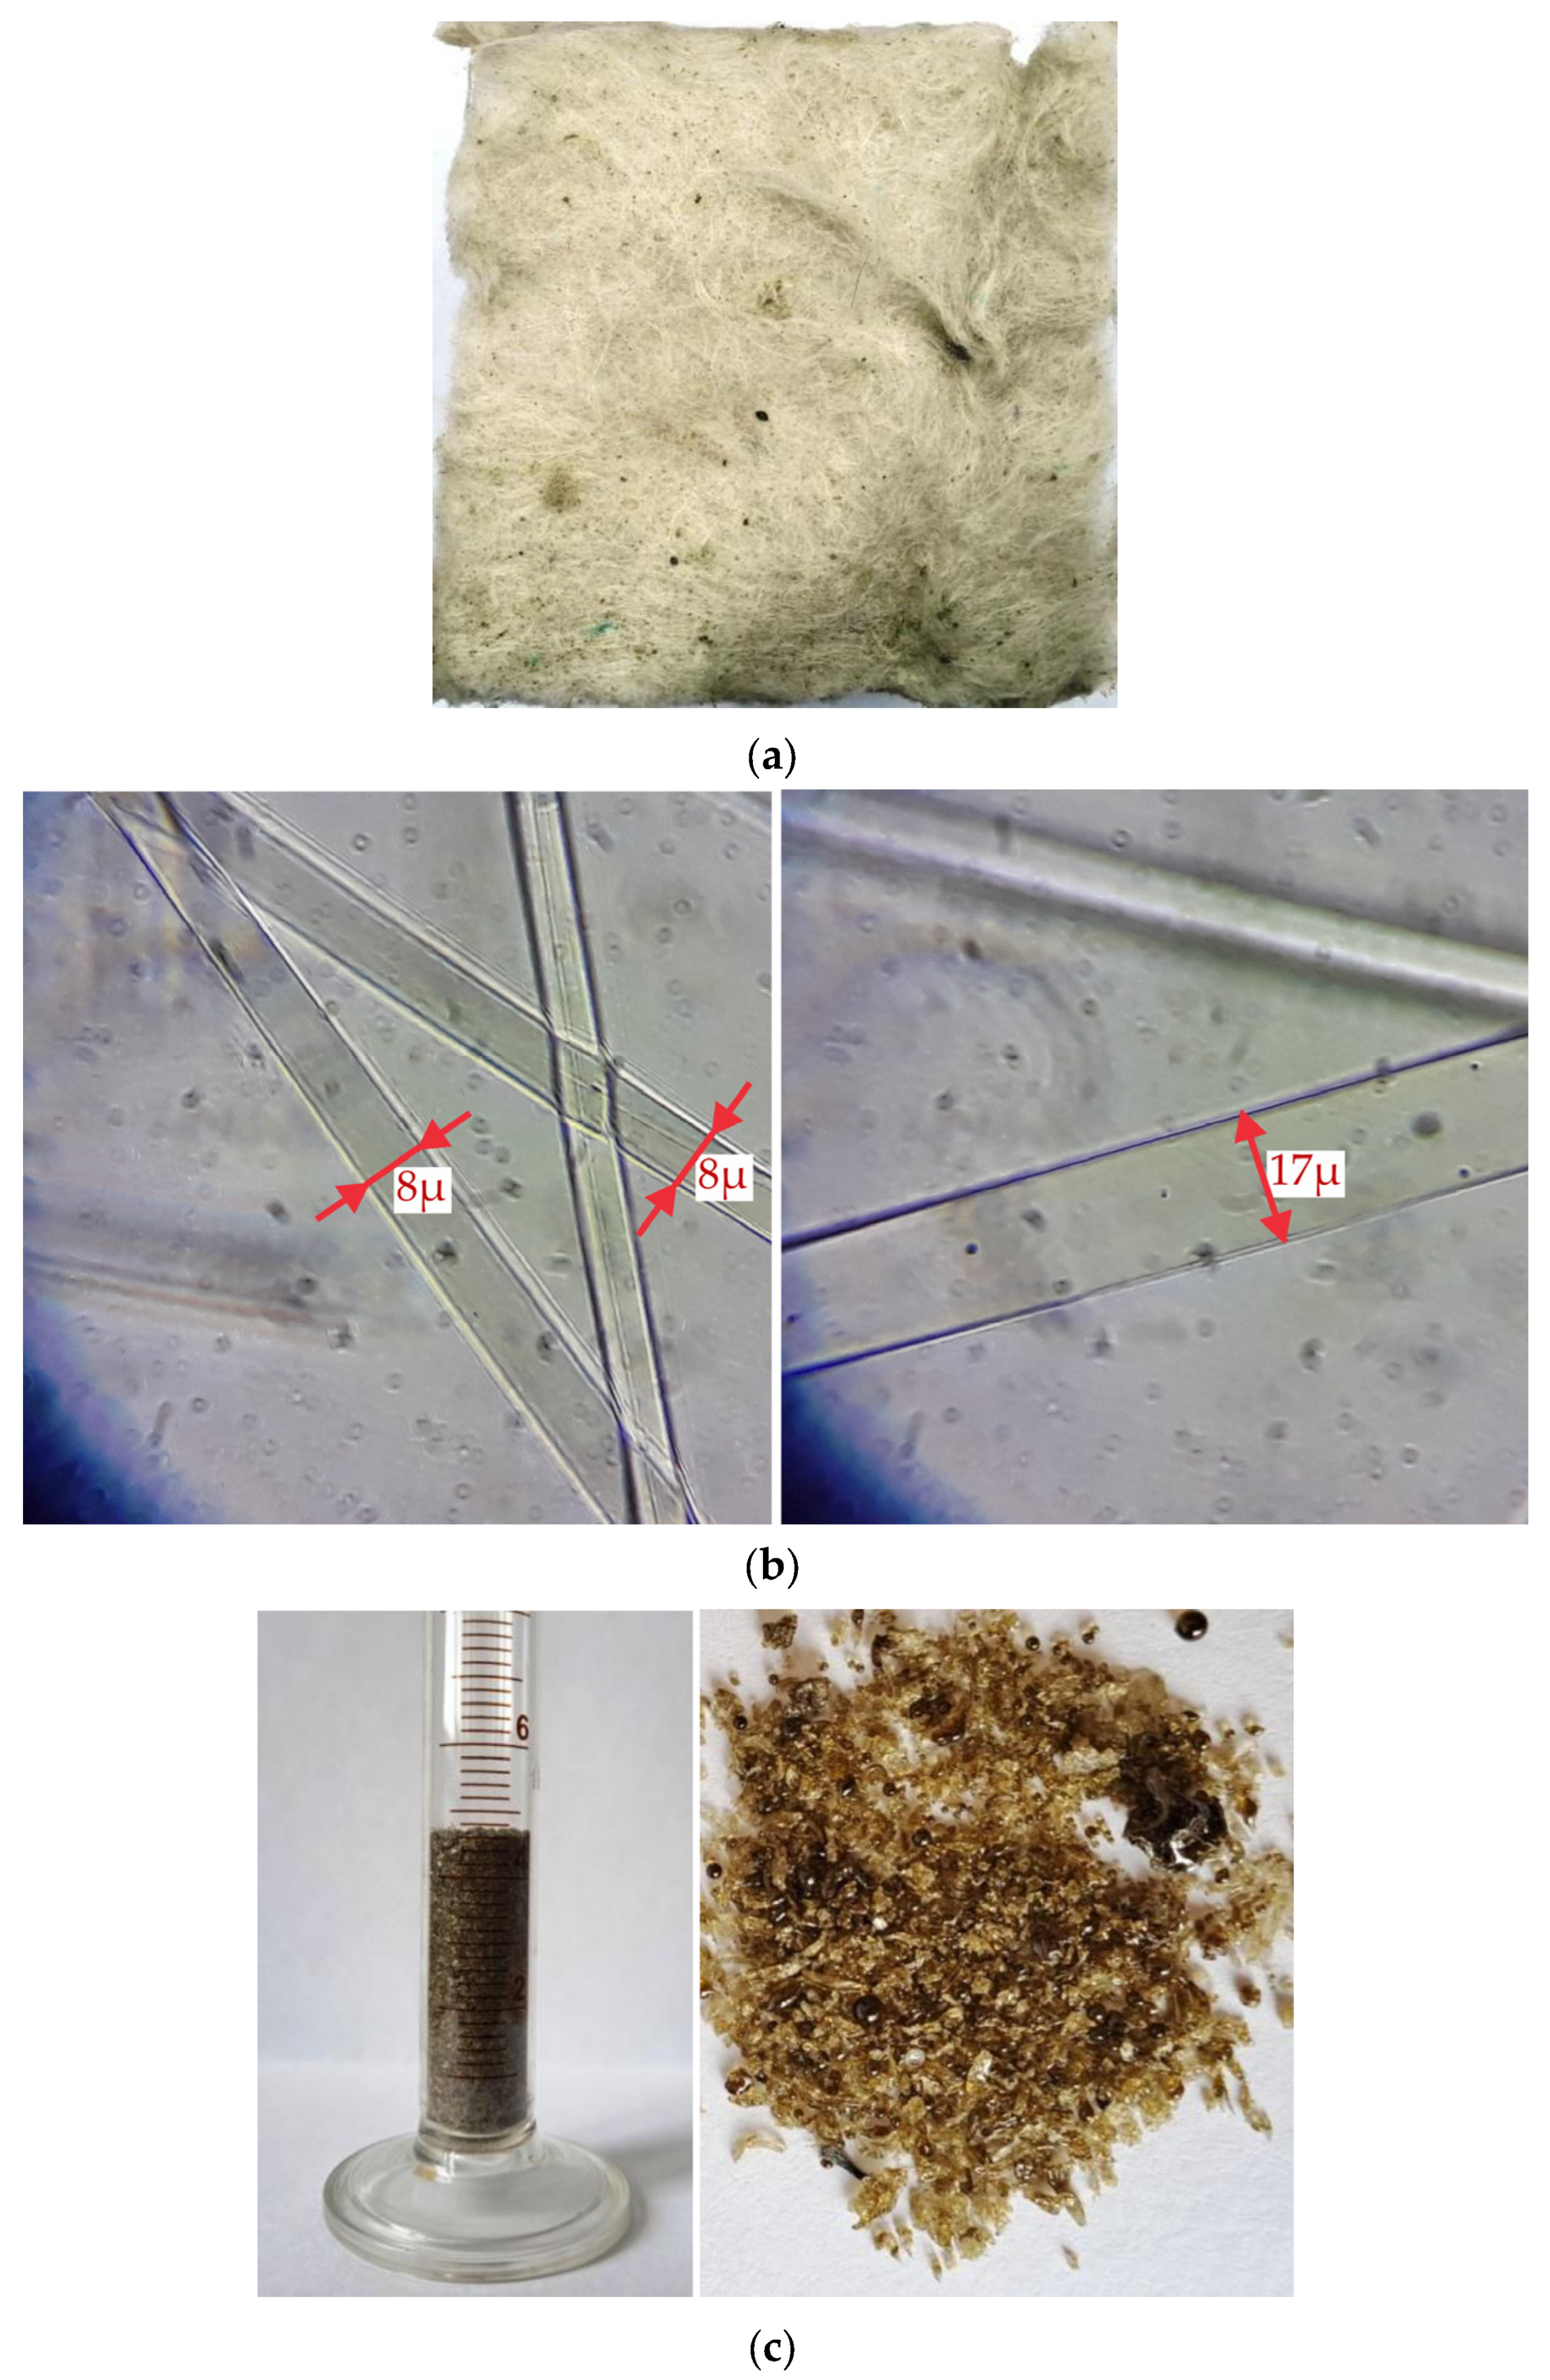
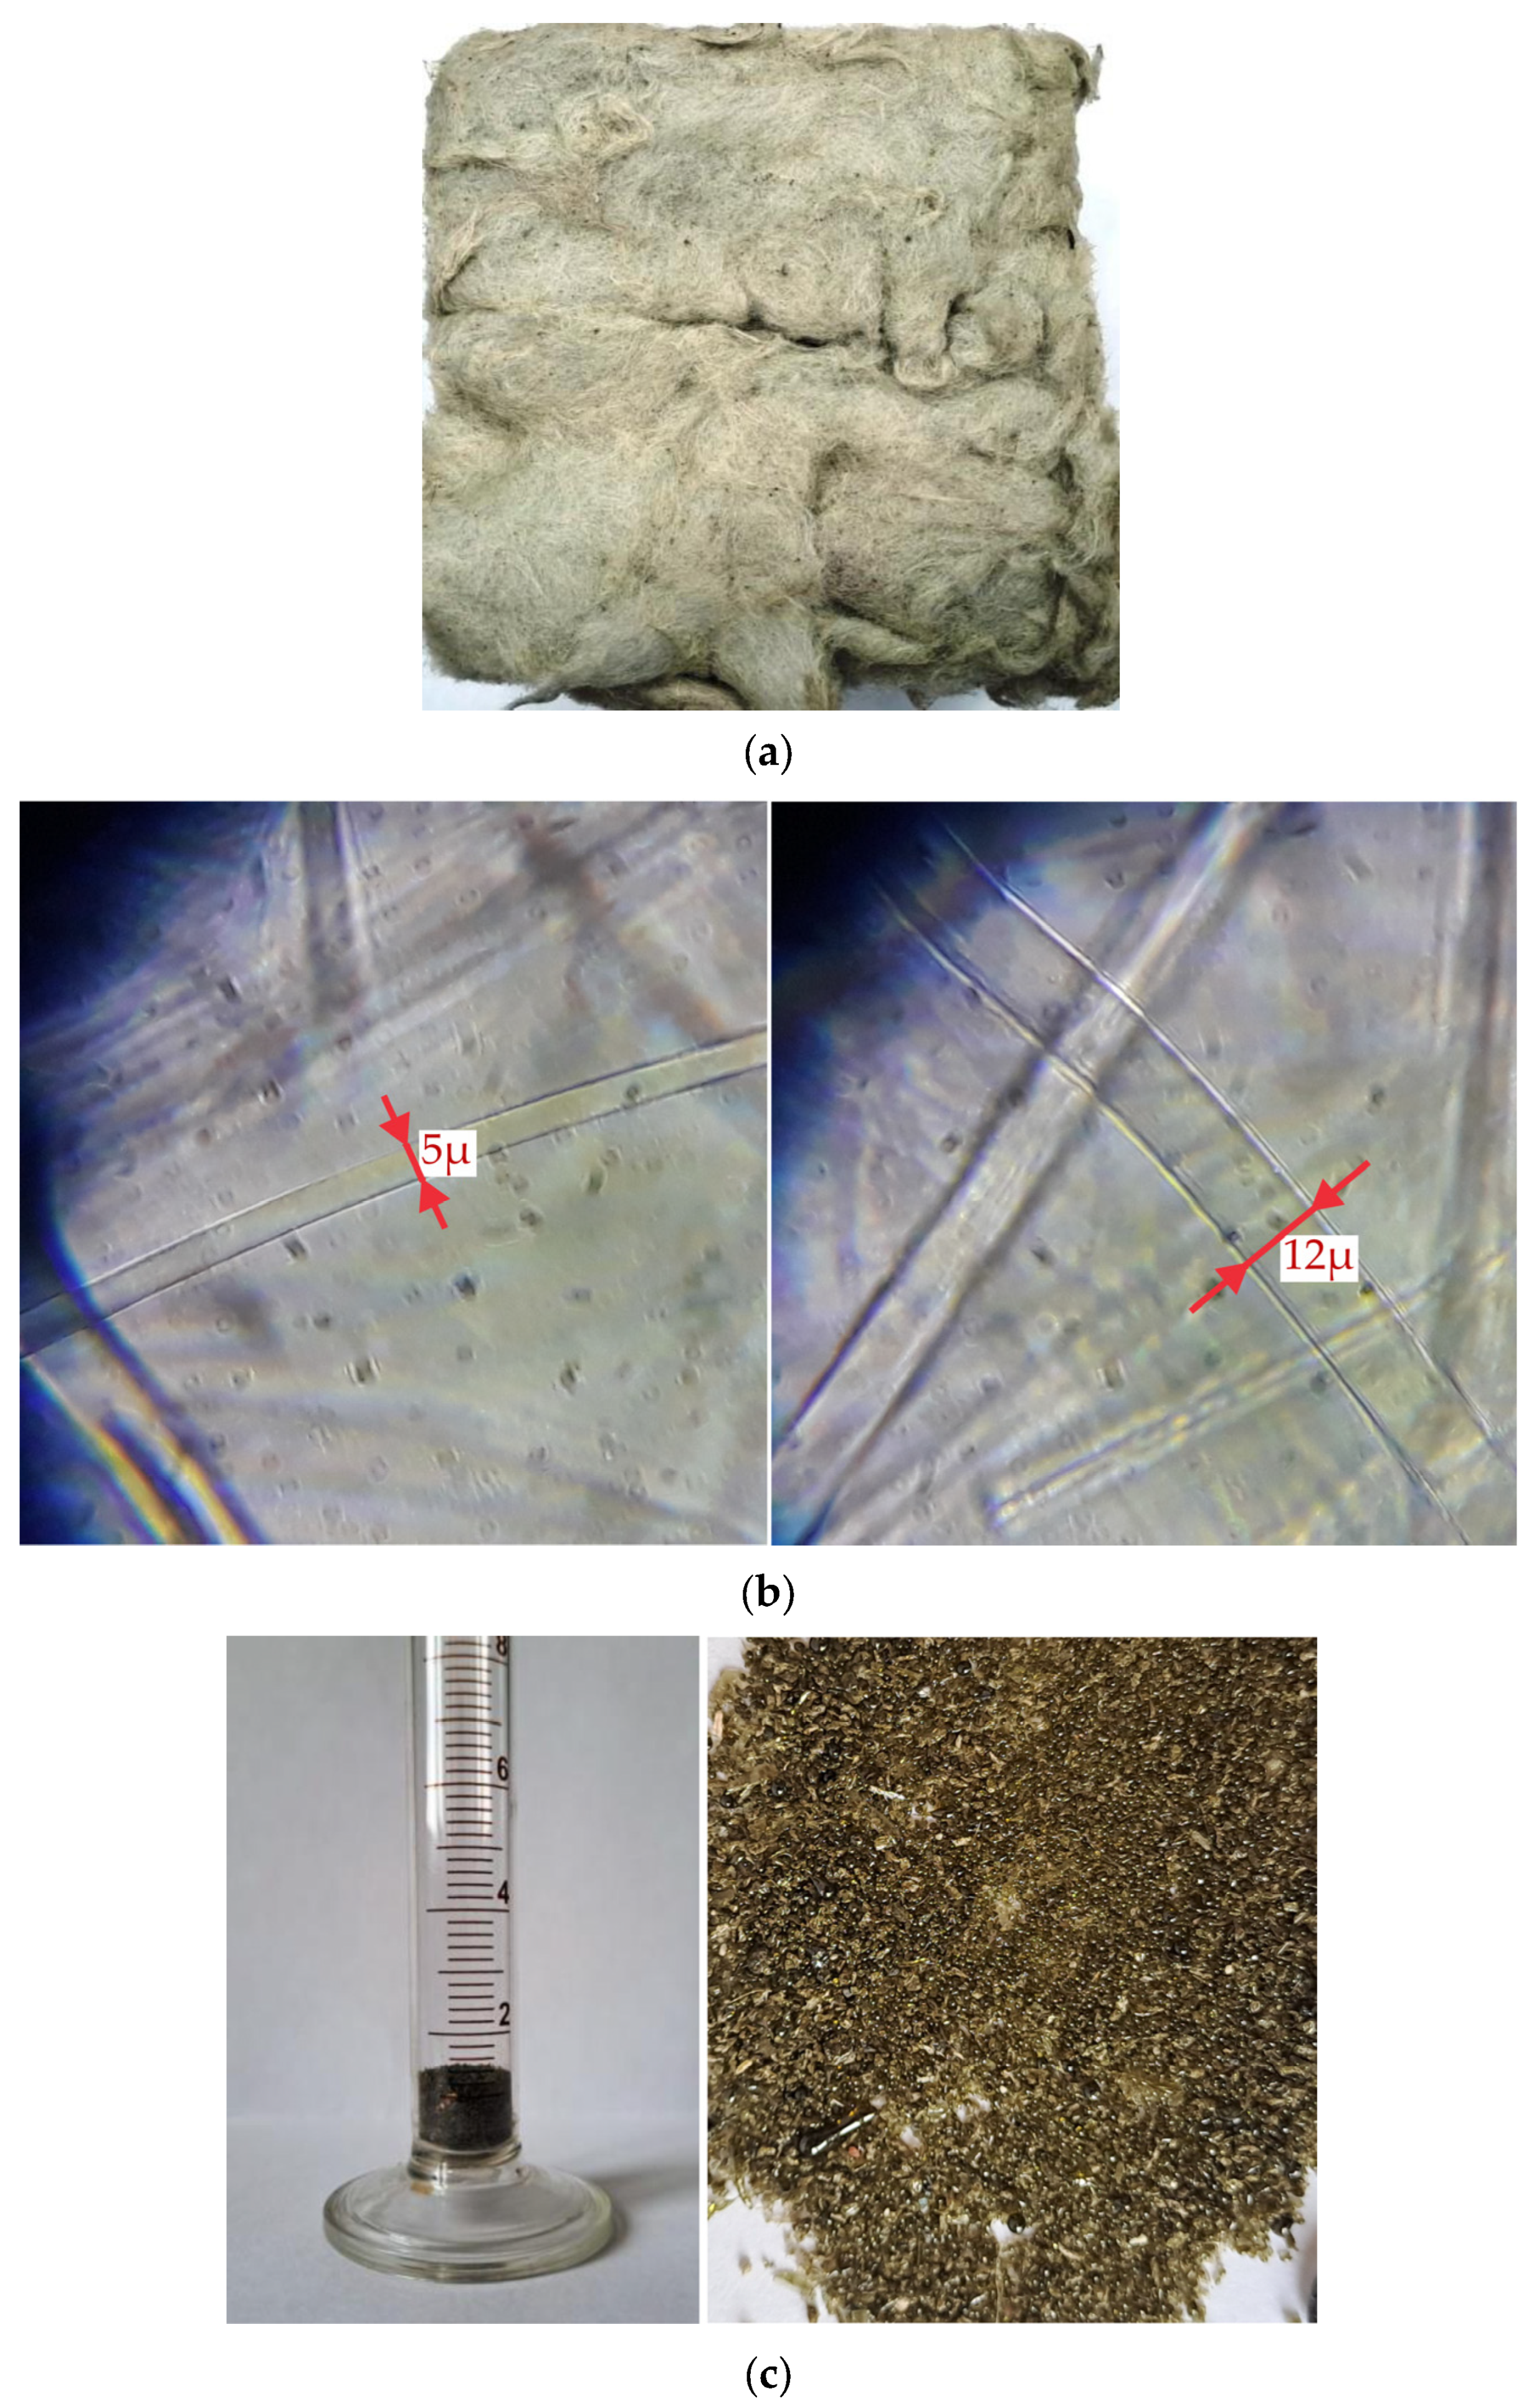
Sample A showed significantly higher water absorption capacity (more than four times higher than Sample B), a broader fiber diameter range, and elevated shot content, making it representative of lower-quality mineral wool products susceptible to rapid moisture-related performance degradation. Sample B exhibited low water absorption, controlled fiber diameter distribution, and minimal non-fibrous inclusions, thus representing optimal material performance potential. Views of samples and examples of its morphological elements are shown in Figure 4 and Figure 5.

4.2. The Aim and Constraints of the Thermal Conductivity Measurement

The present study aims to experimentally determine the thermal conductivity of mineral wool pipe insulation across a temperature range of 20 °C to 85 °C with moisture contents up to 12% by weight. This investigation addresses the identified research gap in thermal performance data for intermediate temperature and moisture conditions typical of real pipeline applications. Two mineral wool samples (Sample A and Sample B) were selected for testing, with one specimen of each sample type used throughout the investigation. The samples represent different mineral wool formulations commonly used in pipeline insulation, enabling comparative analysis under identical environmental conditions. To ensure statistical reliability, thermal conductivity measurements for each thermo-hygroscopic regime were repeated a minimum three times per specimen. This protocol provides statistical confidence in results and allows calculation of measurement uncertainty and standard deviations for each test condition. The investigation assumes quasi-steady-state conditions where moisture distribution has reached equilibrium prior to thermal conductivity determination. This study scope does not systematically investigate time-dependent effects like moisture redistribution during testing.

4.3. Physical and Mechanical Properties of Samples

Table 2 shows the results of the analysis of the samples’ properties mounted for testing on the heated pipe. When flexible insulation is installed on a pipe, it compacts, increasing its density and decreasing its thickness. To evaluate this effect, a compaction factor (CF) was used—the ratio of the nominal mat thickness to its actual thickness. As can be seen, Sample A compacted more strongly (CF = 1.34), indicating its softer structure compared to Sample B (CF = 1.25). This effect is obviously due to the morphological differences between the samples, namely, the larger fiber diameter and percentage of inclusions in Sample A. Despite the increased density of the samples (about 15–20%), this minor change does not significantly affect the thermal conductivity of mineral wool insulation [18]. To achieve a uniform heat flow when measuring thermal conductivity, the samples must be evenly installed on the pipe along its circumference and length. A thickness variation coefficient of approximately 5% indicates that this condition was met for both samples. The quality of installation can also be assessed in Figure 2b. As mentioned above, moisture drainage occurred when injected into the samples. To evaluate this effect, the table provides the average water drainage coefficient—an average estimate of the proportion of water leaking from the insulation to the total amount of water introduced into the sample. As expected, this value is higher for the more hydrophobic Sample B, being almost twice as high. Finally, the table shows the actual moisture content values achieved during the measurements, taking drainage into account. These values had minor deviations from the target values of 6% and 12% (including taking into account uncertainty). Thus, for convenience, further in the article, moisture content values rounded to an integer are used.

4.4. Results of the Thermal Conductivity Test of the Sample A

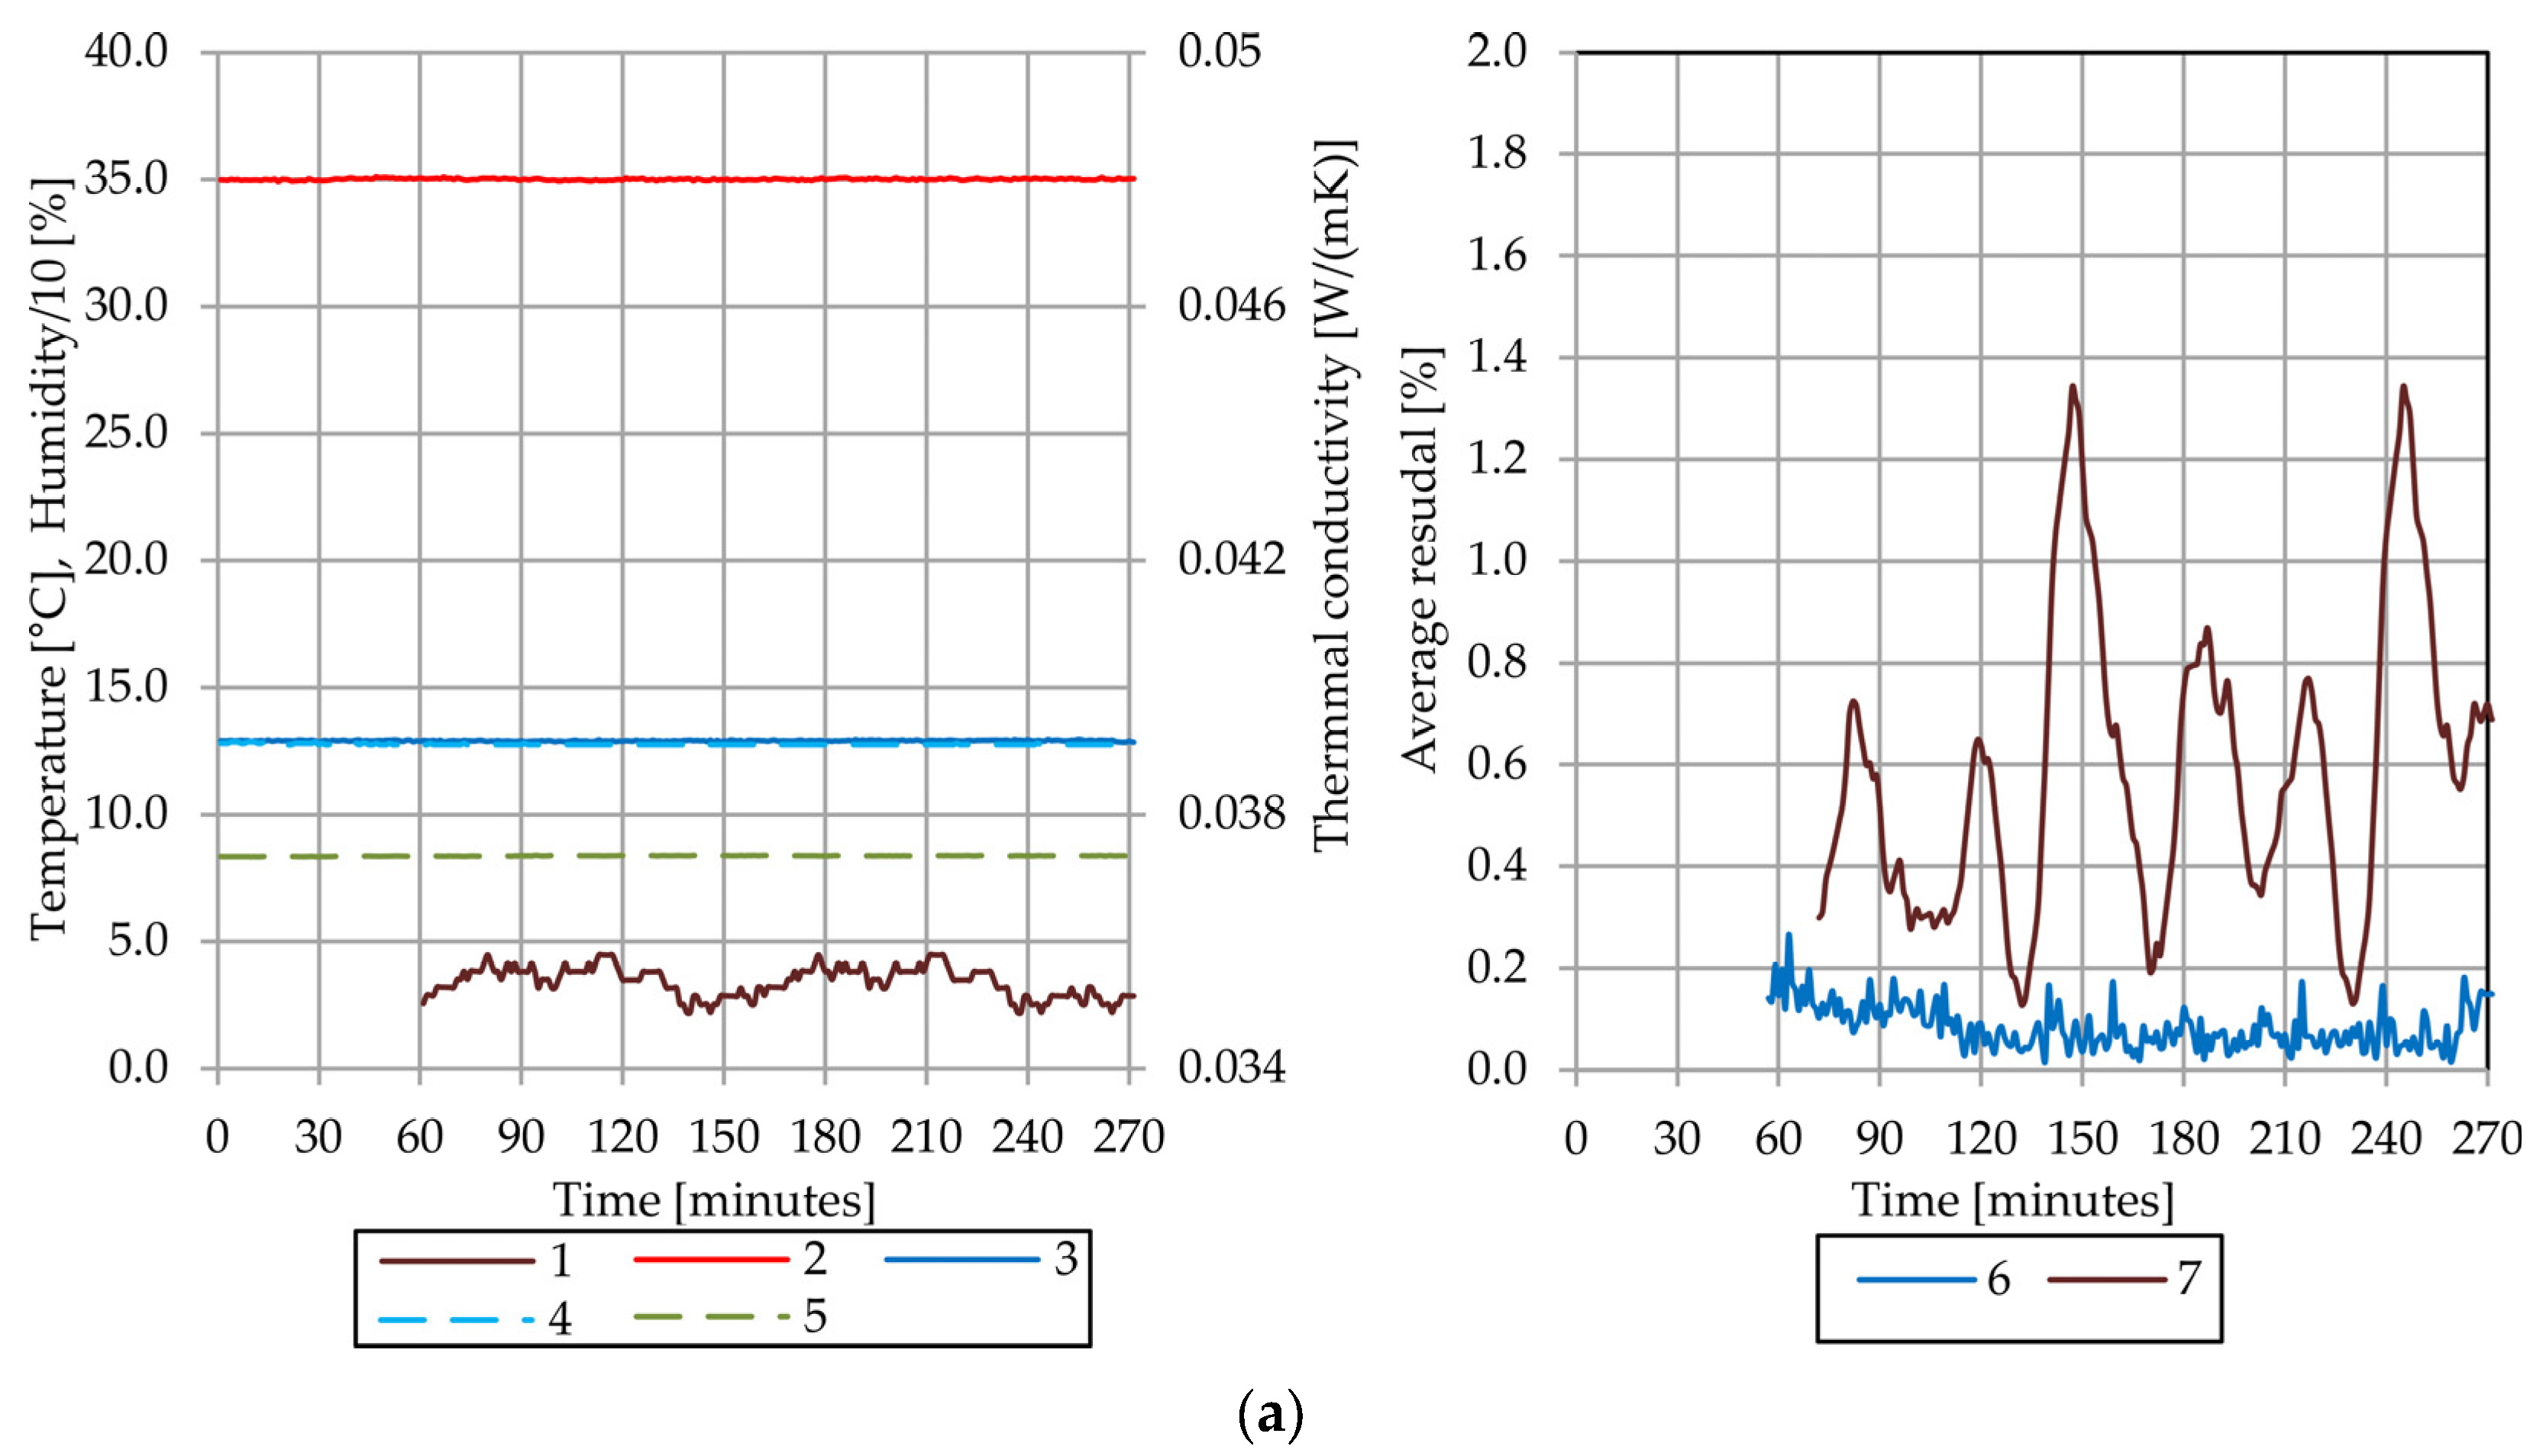
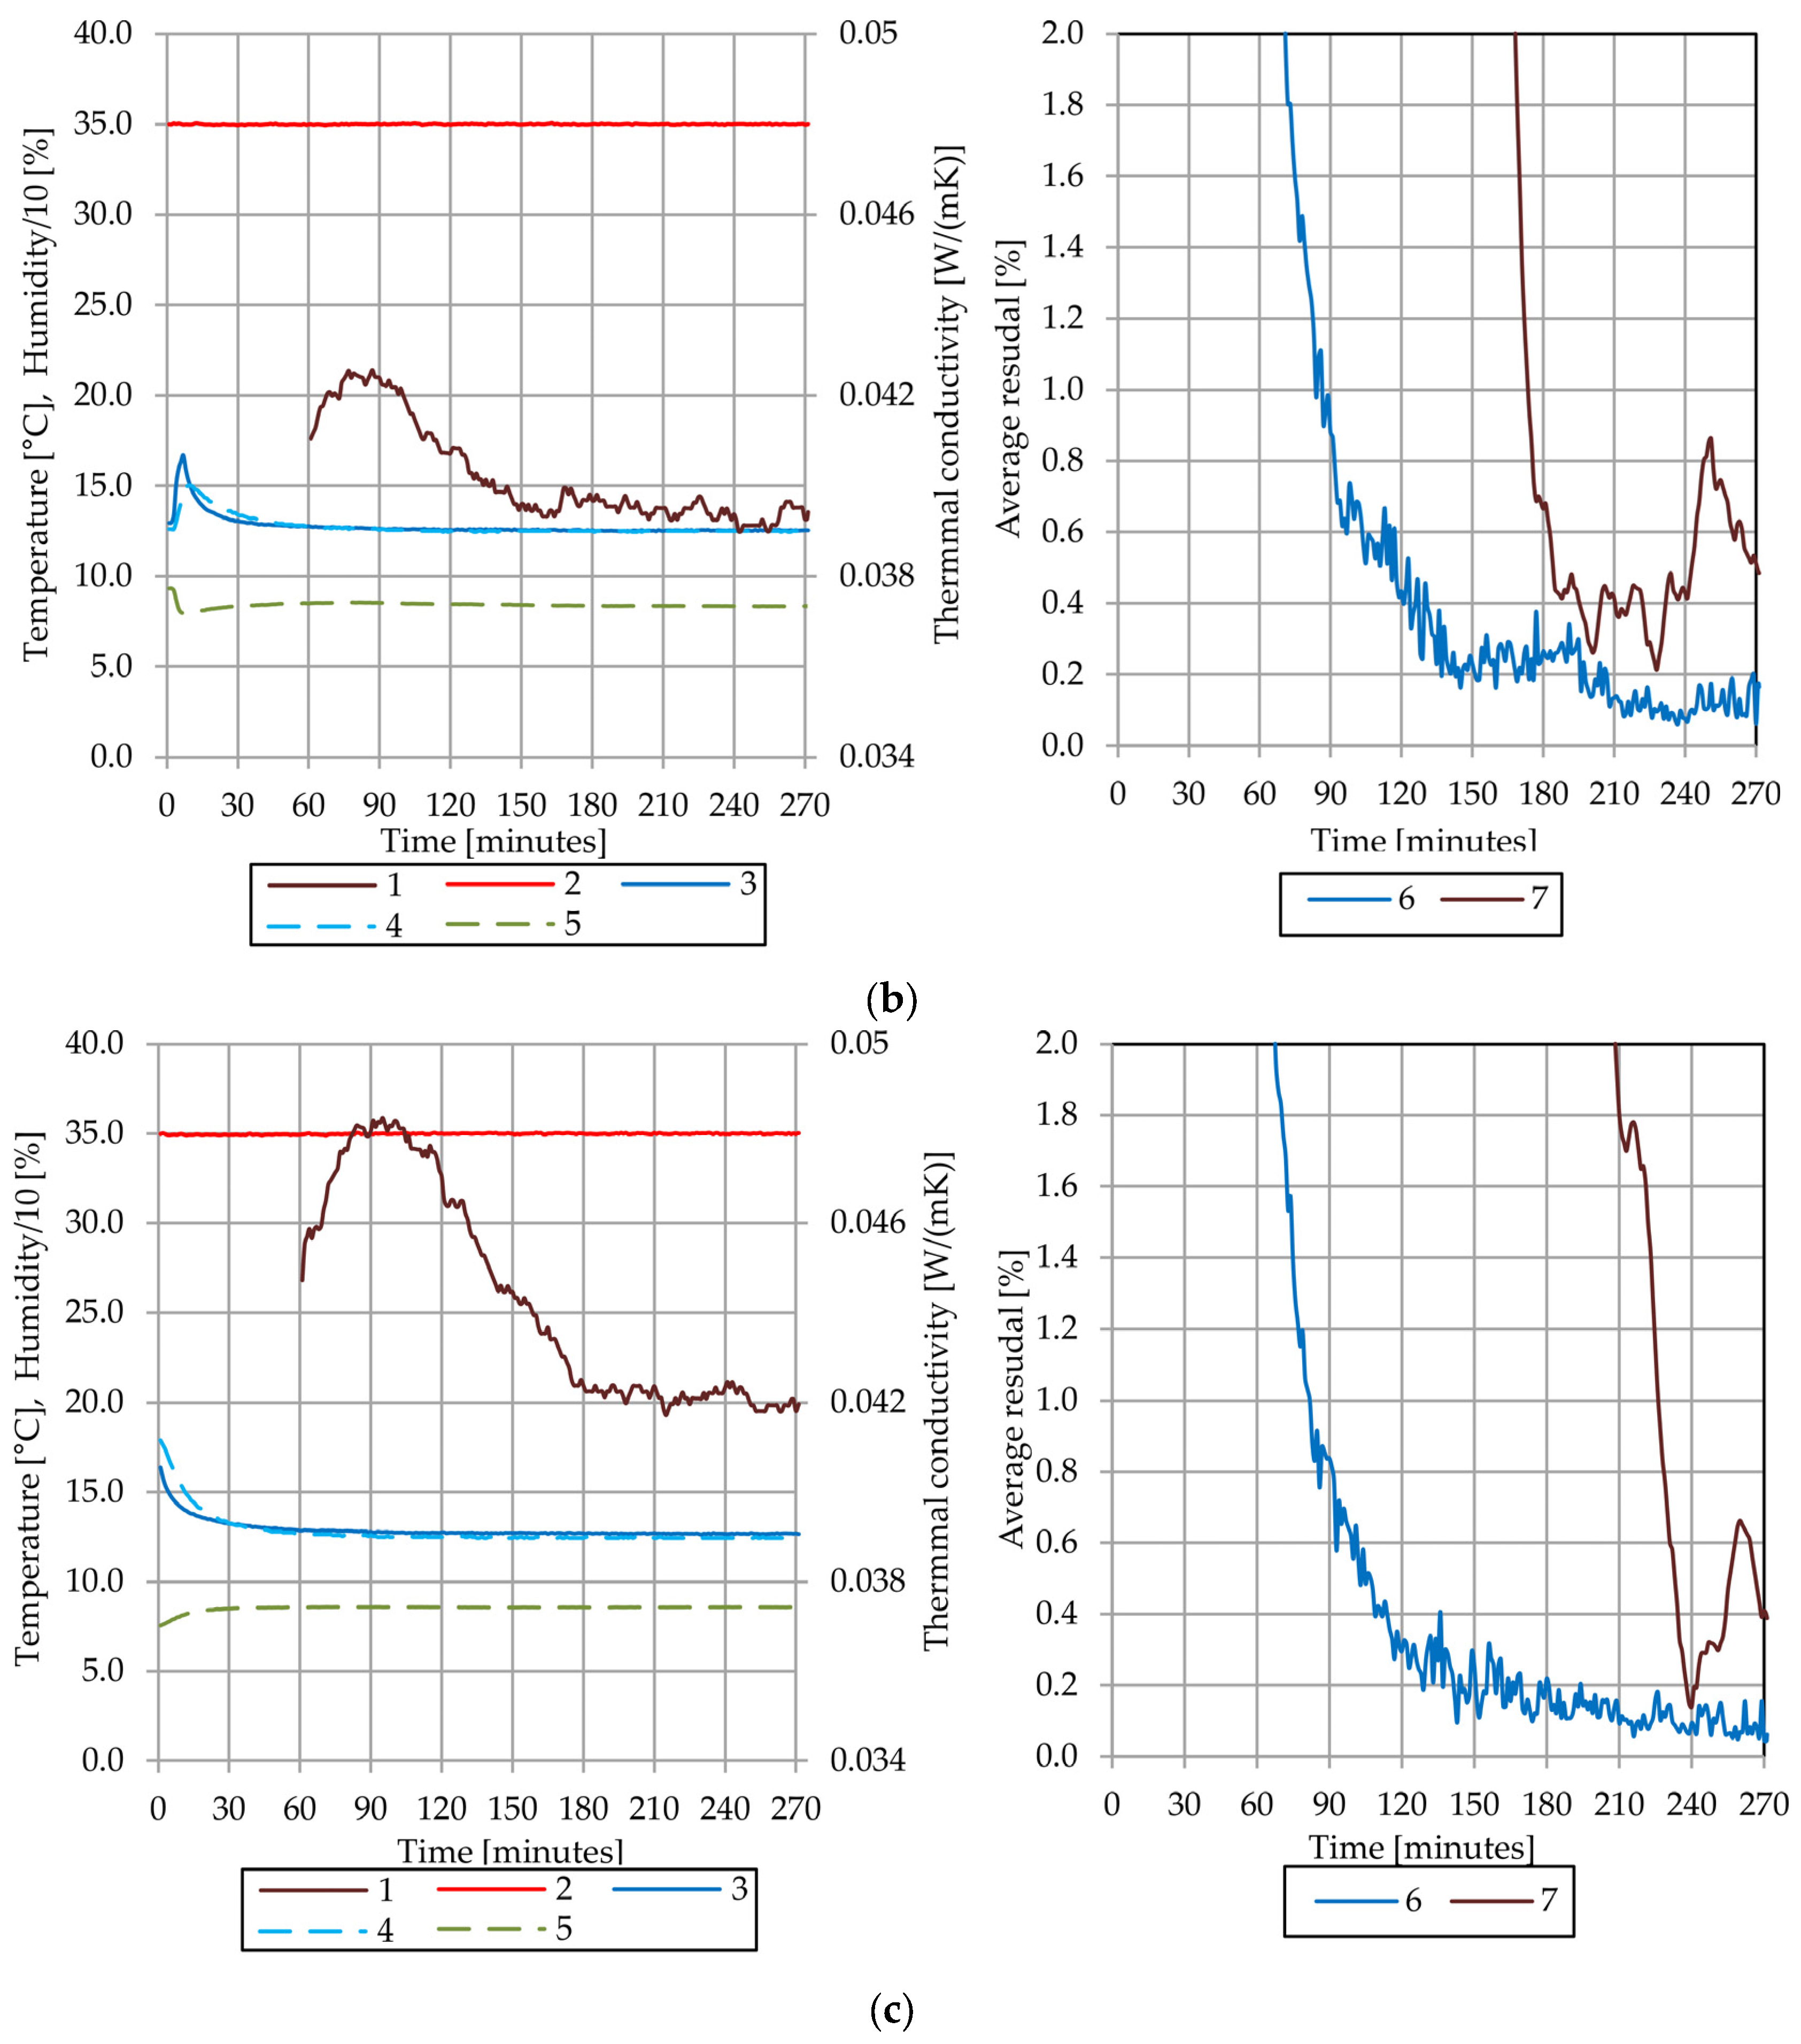
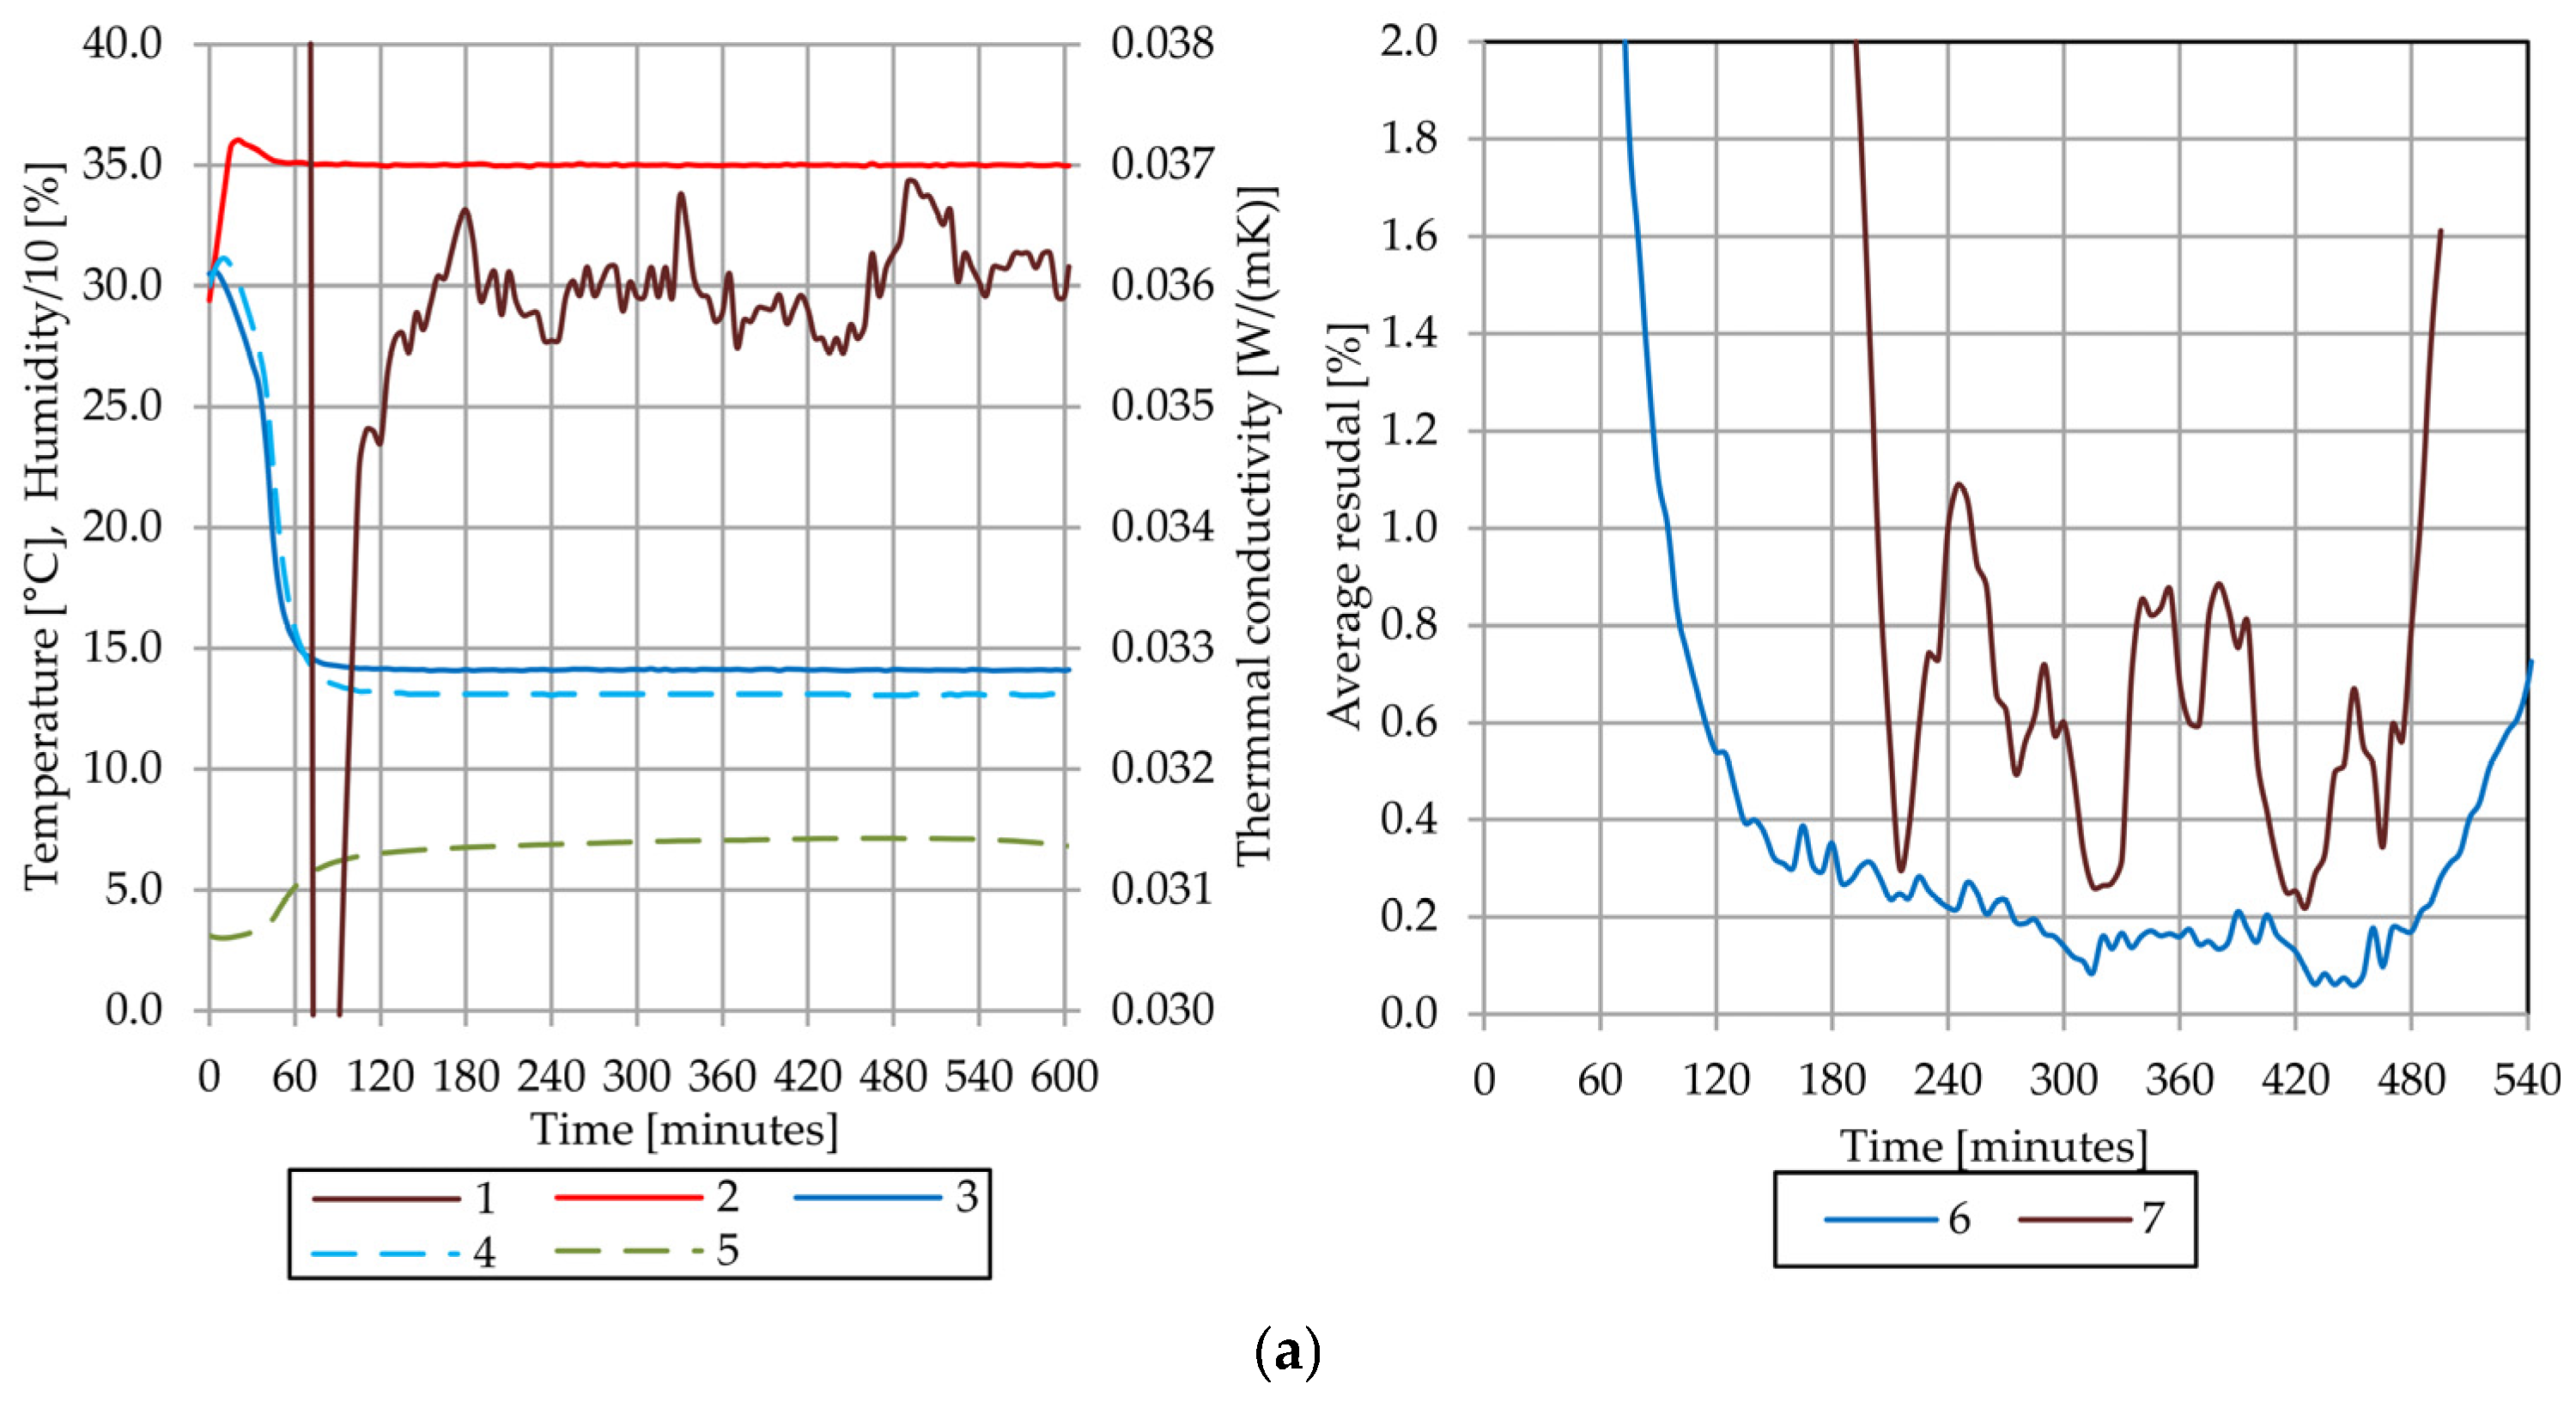
This section presents the results of thermal conductivity analysis for Sample A under varying moisture and temperature conditions. Figure 6 demonstrates the temporal evolution of thermal and moisture parameters during thermal conductivity measurements at an average sample temperature of 20.0 °C. The test configuration employed the chiller temperature of 10.0 °C and the hot pipe temperature of 35.0 °C to establish the required temperature gradient across the sample. The actual average sample temperature was maintained at 19.5 ± 0.7 °C throughout the measurement series. Under dry conditions (Figure 6a), the thermal conductivity measurements exhibited rapid stabilization with minimal fluctuations throughout the test duration. These fluctuations are related to a specific way of regulating the hot pipe wall temperature using PWM. Moreover, the variation coefficient of thermal conductivity over time during the stabilized period did not exceed 1.0%. The inner temperature (curve 2) remained stable at approximately 35.0 ± 0.5 °C, while the outer temperature (curve 3) was maintained at about 12.9 ± 0.9 °C, providing a consistent temperature difference across the sample. Temperature residuals (curve 6) remained consistently below 0.2% after the initial equilibration period. The thermal conductivity values (curve 1) showed steady-state behavior with conductivity residuals (curve 7) maintained below 1.0%, indicating reliable measurement conditions. Due to the absence of evaporation processes under dry conditions, the chamber temperature and humidity (curves 4 and 5) remained stable throughout the test. The chamber air temperature maintained values near or below 12.5 ± 0.5 °C, confirming minimal thermal disturbance and optimal measurement conditions.
The introduction of 6% moisture content (Figure 6b) revealed a characteristic three-stage behavior pattern while maintaining stable thermal boundary conditions. The first stage occurred immediately following the opening of the chamber to moisture injection, characterized by thermal system perturbation and chamber environmental recovery. During this phase (about 60 min), temperature residuals exceeded 2% initially but progressively decreased as the system approached thermal equilibrium. Despite the moisture introduction, the absence of significant evaporation at low temperatures resulted in minimal changes to chamber air temperature and humidity. Its values were close to the dry condition baselines. The second stage is the thermal conductivity stabilization period, during which the injected moisture achieved uniform distribution throughout the sample matrix. This phase was marked by a gradual reduction in thermal conductivity residuals from approximately 1.5% to below 1.0%, corresponding to the establishment of stable heat transfer pathways through the moistened insulation structure. The inner and outer wall temperatures maintained their values of 35.0 ± 0.3 °C and 12.5 ± 0.9 °C, respectively, with temperature residuals decreasing below 0.2%. The third stage represented the quasi-steady-state measurement period, during which time-averaged thermal conductivity values were determined. This phase was characterized by thermal conductivity residuals consistently maintained below 1.0%, ensuring measurement accuracy and reliability. The average sample temperature remained stable at 19.3 ± 0.6 °C throughout this important measurement period.
At the highest investigated moisture level of 12% (Figure 6c), the three-stage pattern became more pronounced with extended stabilization periods. The first stage exhibited greater thermal system disturbance, with temperature residuals exceeding 2.0% initially due to the substantial thermal capacity of the injected water content. However, the chamber environmental conditions remained stable due to limited evaporation, with chamber air temperature and outer wall temperature maintaining values near 12.5 ± 0.5 °C. The second stage demonstrated prolonged stabilization behavior, requiring extended time (more than about 60 min) for thermal conductivity residuals to decrease below 1.0%. The quasi-steady-state stage showed increased thermal conductivity values compared to lower moisture conditions, reflecting enhanced heat transfer through liquid water pathways within the porous structure.
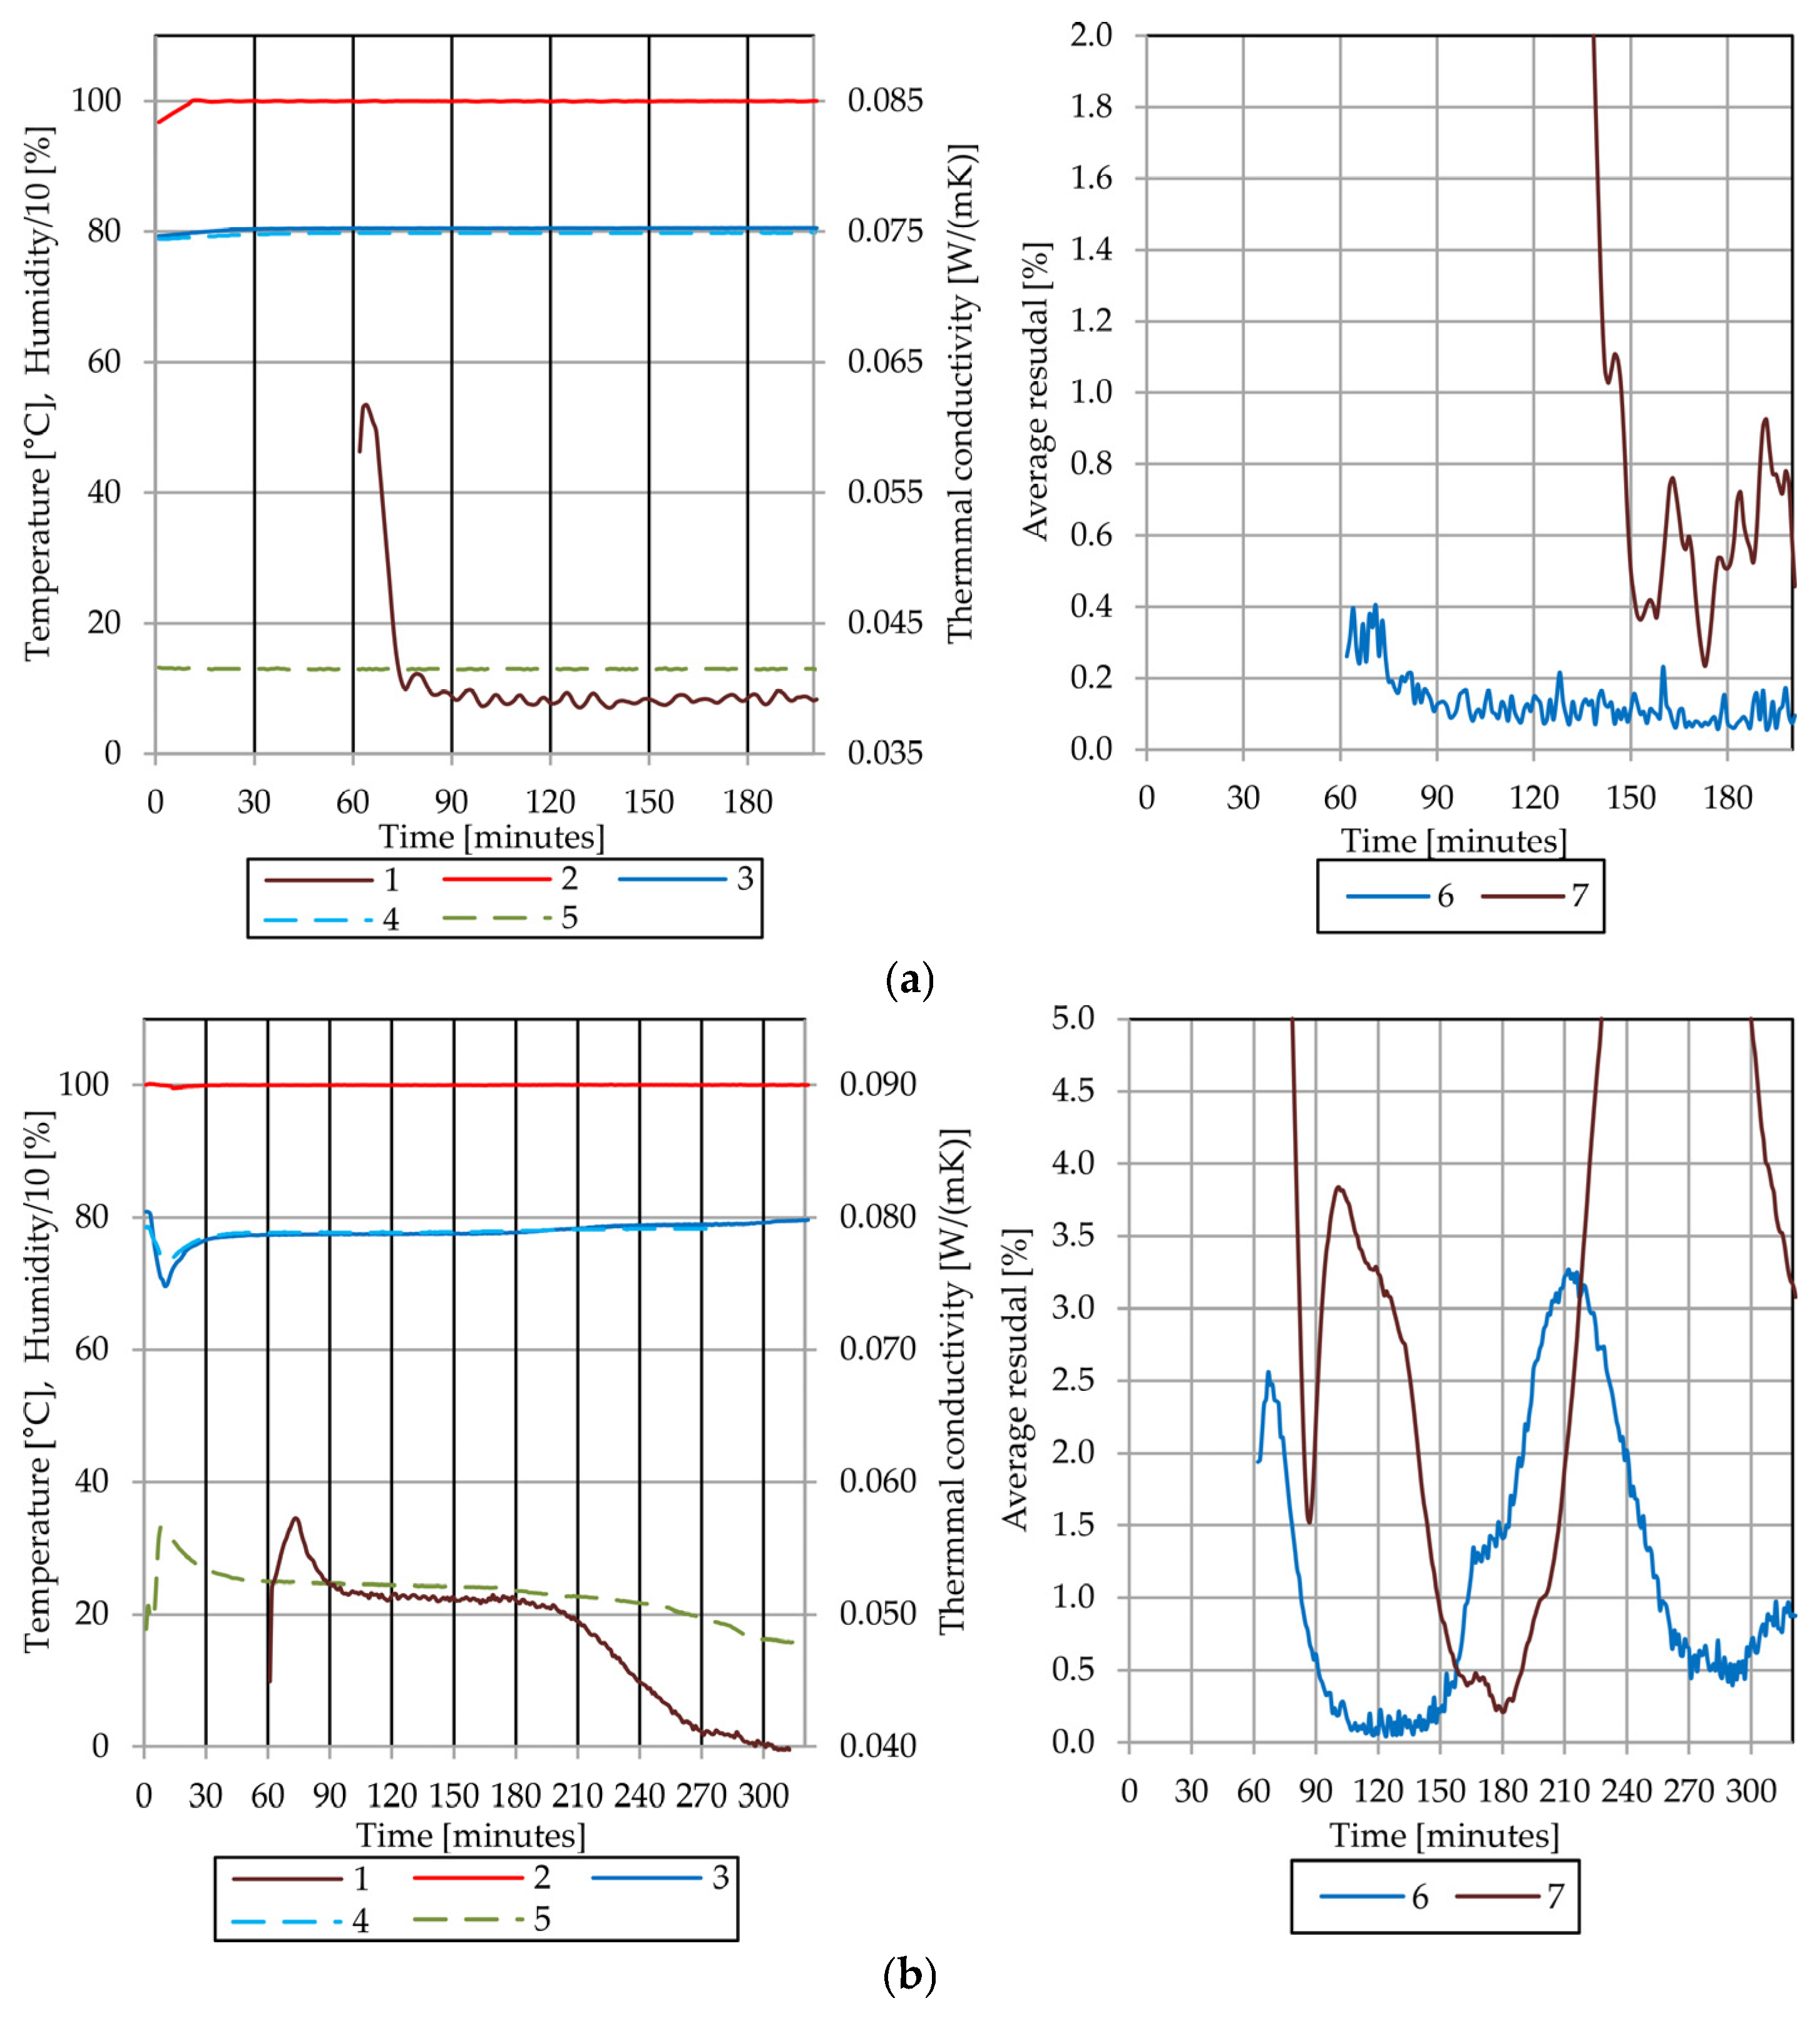
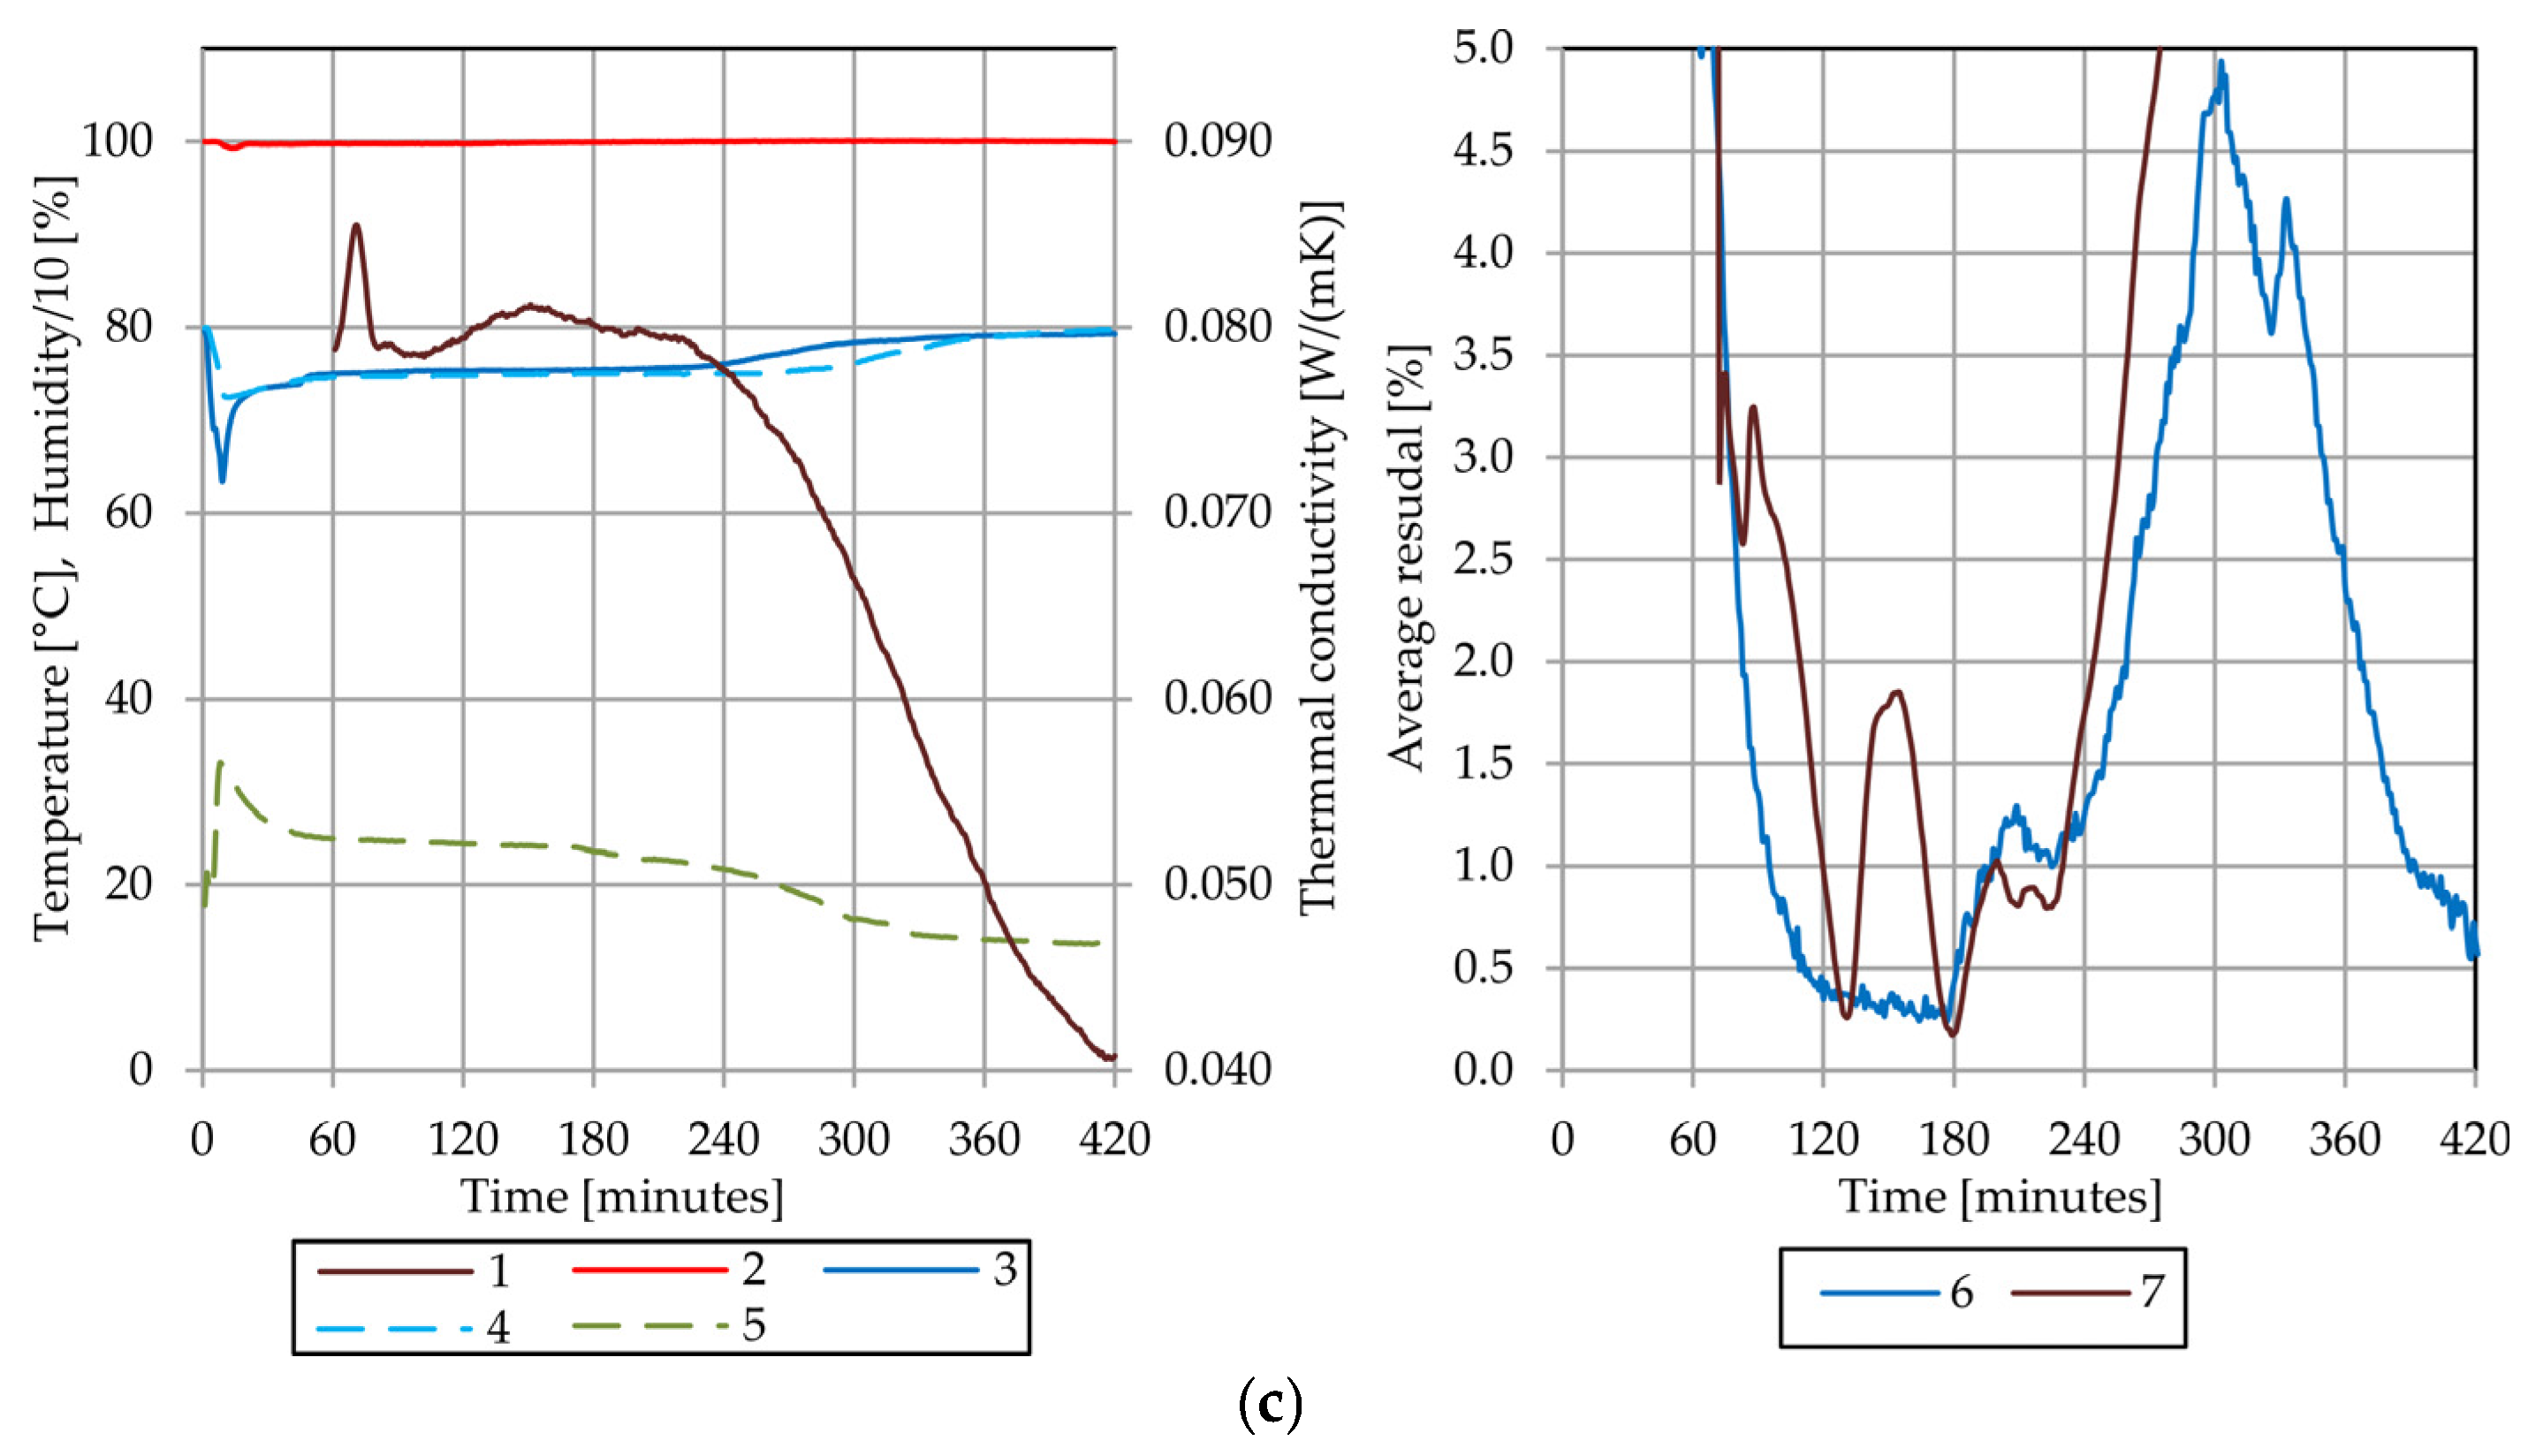
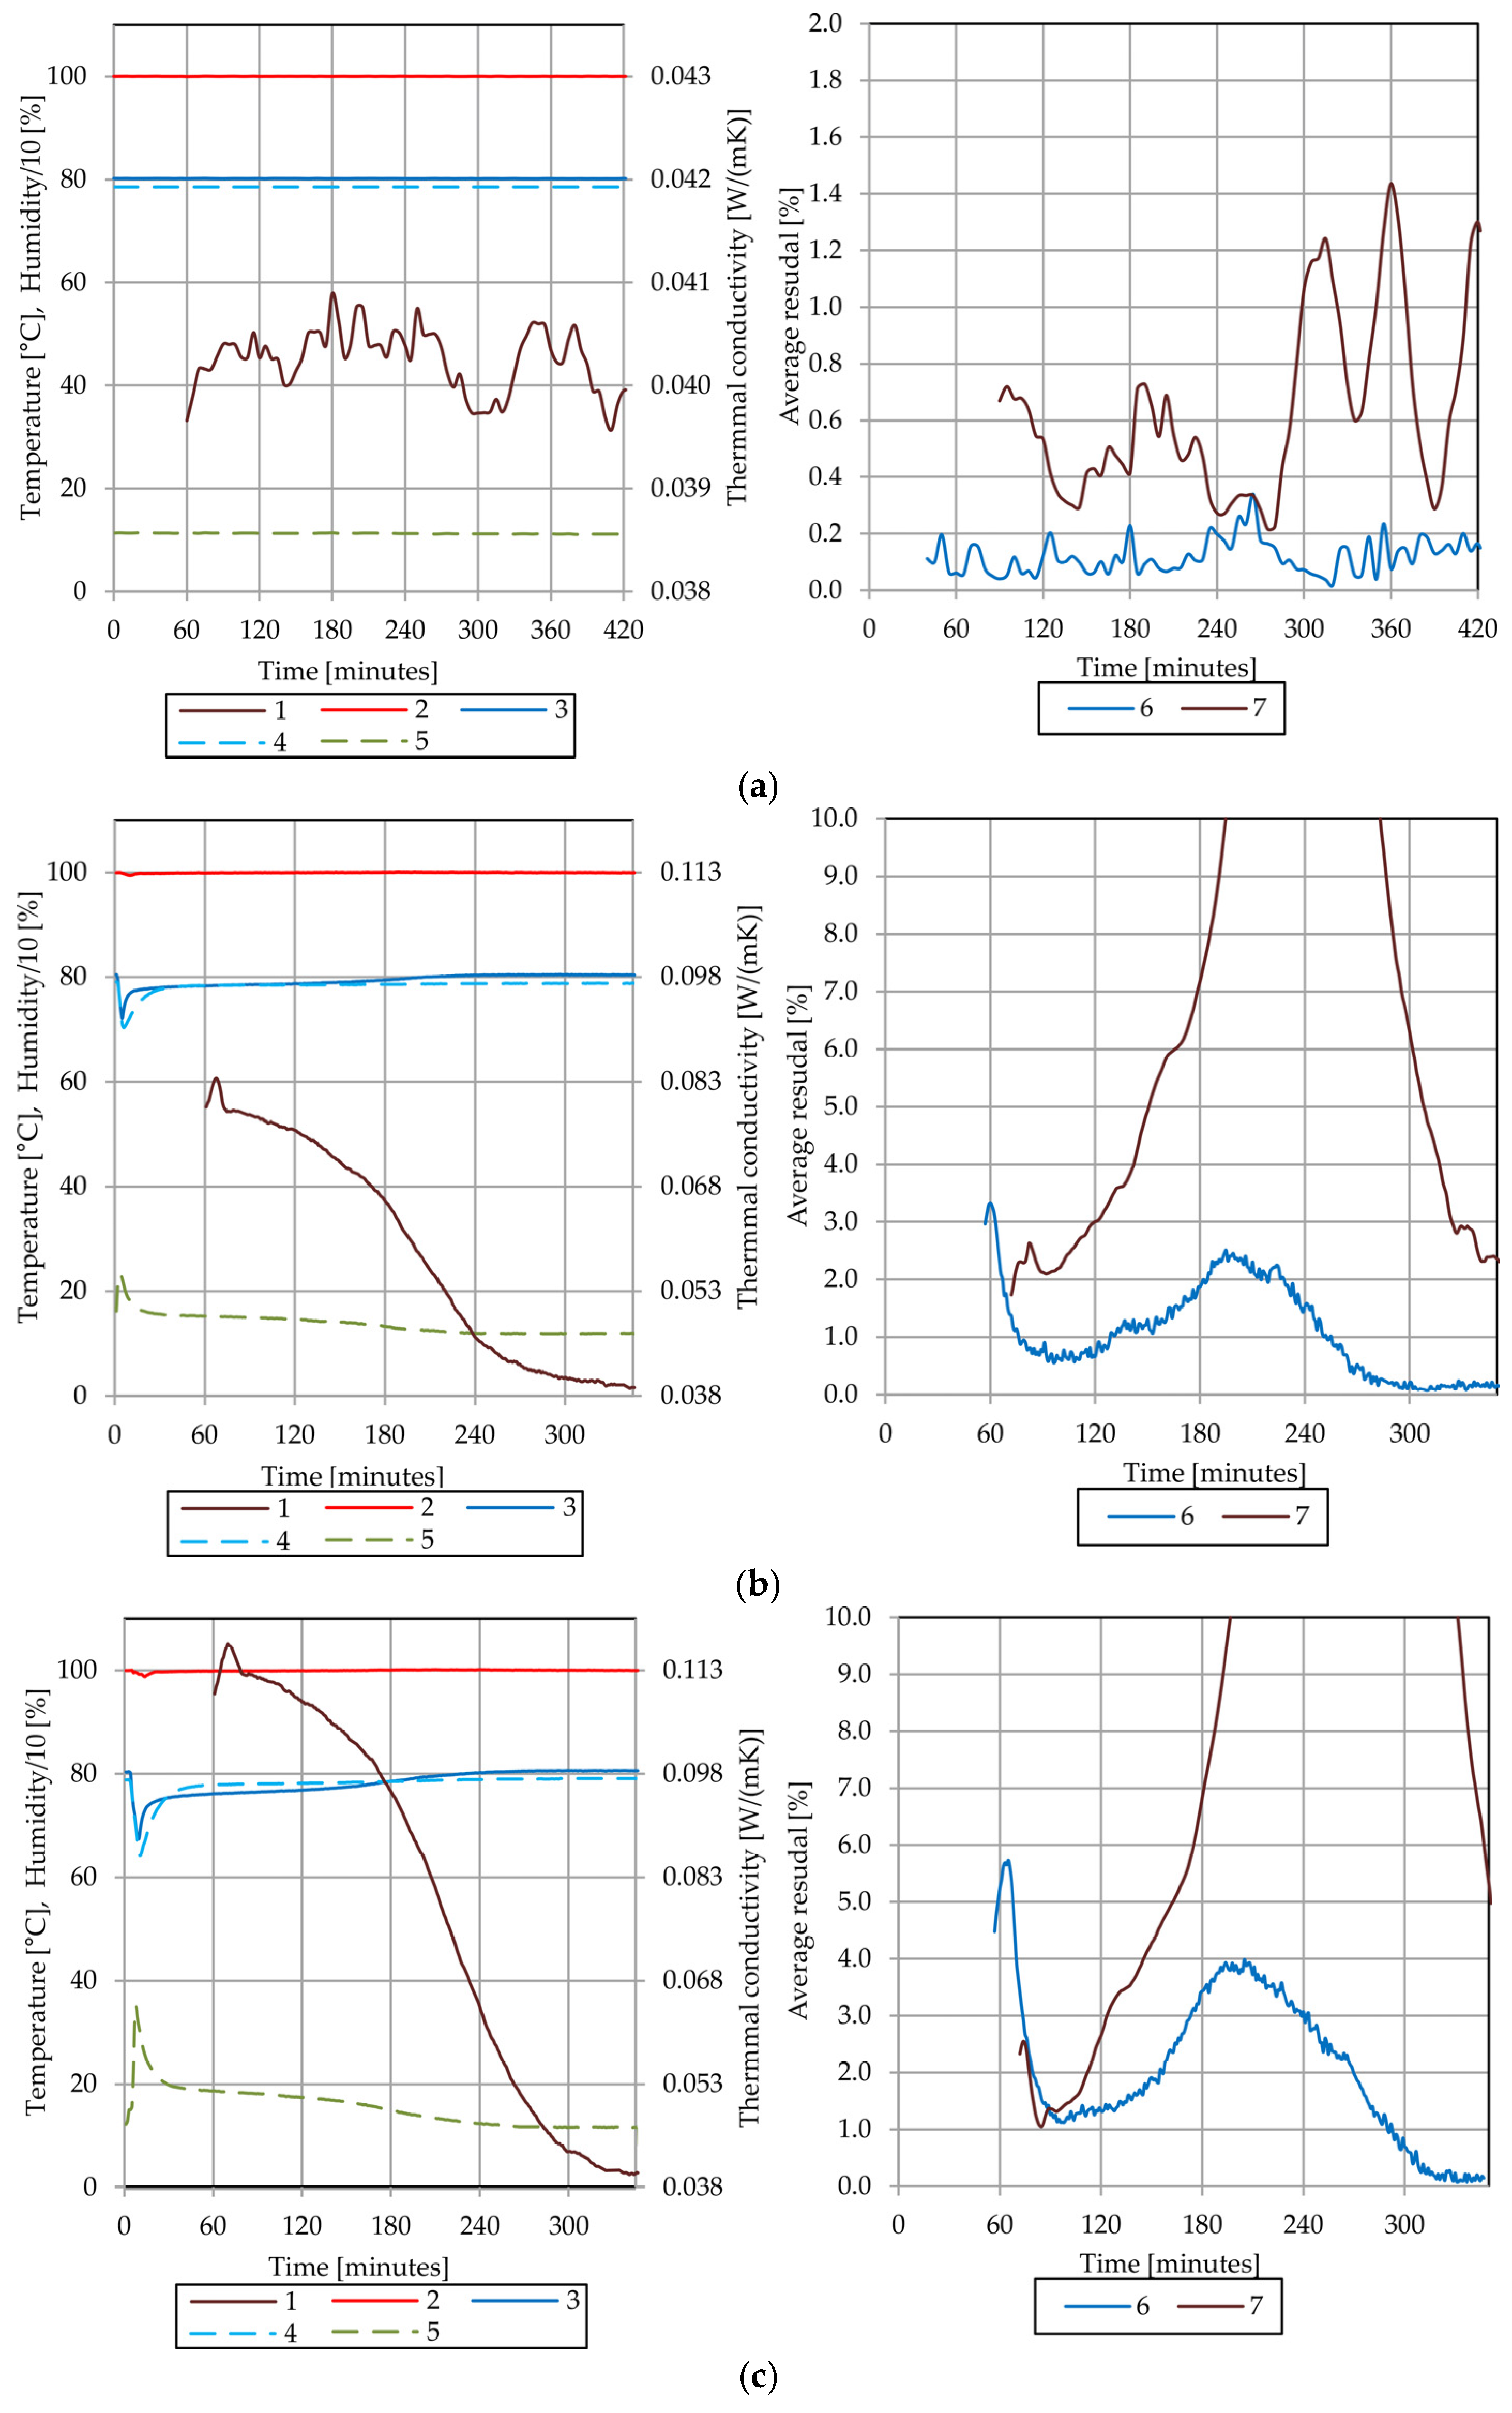
Figure 7 presents corresponding thermal conductivity measurement data at elevated temperature conditions, achieved through the chiller and hot pipe temperatures of 80.0 °C and 100.0 °C, respectively. The elevated temperature conditions demonstrated distinct thermal behavior patterns compared to the low-temperature measurements. Significant environmental effects occurred due to moisture evaporation processes. Under dry high-temperature conditions (Figure 7a), thermal conductivity values exhibited higher absolute values compared to low-temperature measurements. This is consistent with the positive temperature coefficient characteristic of mineral wool materials. The sample inner wall temperature was maintained at 100.0 ± 0.9 °C while the outer wall temperature was set to 80.6 ± 1.3 °C. The average sample temperature achieved 86.4 ± 0.9 °C under these conditions. Temperature stability was maintained with residuals below 0.2%, while thermal conductivity residuals remained below 1.0% throughout the measurement period. The chamber environmental conditions demonstrated excellent control. The chamber air temperature and outer wall temperature both stabilized near 80.0 ± 0.5 °C.
The 6% moisture content tests at elevated temperature (Figure 7b) revealed modified five-stage behavior significantly influenced by evaporation and drying processes. The first stage exhibited accelerated thermal equilibration compared to low-temperature conditions, attributed to increased vapor mobility and heat transfer rates. However, evaporation effects caused noticeable changes in chamber environmental conditions: chamber air humidity increased by 10–20% proportionally to the moisture content, while evaporation-induced cooling resulted in outer wall temperatures decreasing below the target 80 °C. Due to these evaporation effects, the actual average sample temperature was reduced to approximately 84.2 ± 2.4 °C rather than the nominal 85 °C. Temperature residuals decreased more rapidly than in low-temperature tests, typically achieving values below 1.0% within shorter time periods. The second stage demonstrated faster thermal conductivity stabilization, with residuals approaching 1% more quickly than observed in low-temperature tests. This behavior reflects enhanced thermal diffusion and moisture redistribution processes at elevated temperatures. In the third stage, a quasi-steady state was achieved, indicated by the plateau on curve 1 in Figure 7b. During this phase, time-averaged thermal conductivity values were determined. This phase was characterized by thermal conductivity residuals consistently maintained below 1.0%. On stage four with prolonged thermal loading, evaporation accelerates, and the sample begins to dry. This step initiates noticeable reductions in both chamber humidity and thermal conductivity and can be seen as a descending slope on the thermal conductivity plot and as a peak on the residual plot. Simultaneously, the temperatures of the outer wall and air gradually recover to their nominal values of 80 ± 0.5 °C as the evaporative cooling effect drops. This stage indicates the progressive transition of the insulation from moist to dry states, directly reflected in heat transfer measurements. Finally, the system reaches a new steady state (stage five) corresponding to the fully dried condition of the sample. In this final stage, measured thermal conductivity returns to the values characteristic of the dry insulation. The residuals of thermal conductivity decrease once again below 1% with the low variability of the initial dry measurements. Environmental parameters (outer wall and air temperatures) also recover to baseline levels, confirming the end of the drying process.
At 12% moisture content and high temperature (Figure 7c), the thermal system demonstrated complex behavior involving intensive evaporation and drying processes similar to the previous case. The first stage showed significant thermal perturbation with temperature residuals exceeding 4% initially, reflecting substantial thermal effects of moisture evaporation and associated cooling. Chamber air humidity increased substantially proportionally to the moisture content, while evaporation-induced cooling caused outer wall temperatures to drop significantly below 80 °C. The actual average sample temperature under these conditions was approximately 82.7 ± 1.4 °C due to evaporation cooling effects. The second stage required extended stabilization periods due to complex heat and mass transfer interactions within the saturated porous structure, complicated by continuous evaporation and vapor transport processes. The remaining stages proceeded similarly to the 6% case. The plateau on curve 1 in Figure 7c represents the quasi-steady state that was reached in the third stage, where thermal conductivity residuals were kept below 1.0%. During this phase, the time-averaged thermal conductivity was calculated. The drying procedure in step four needed a longer time period because of the higher initial moisture content. The system enters the steady state (stage five) following the drying phase. The drying process is confirmed when the residuals of thermal conductivity fall below 1% a second time and the air and outer wall temperatures return to their baseline values.
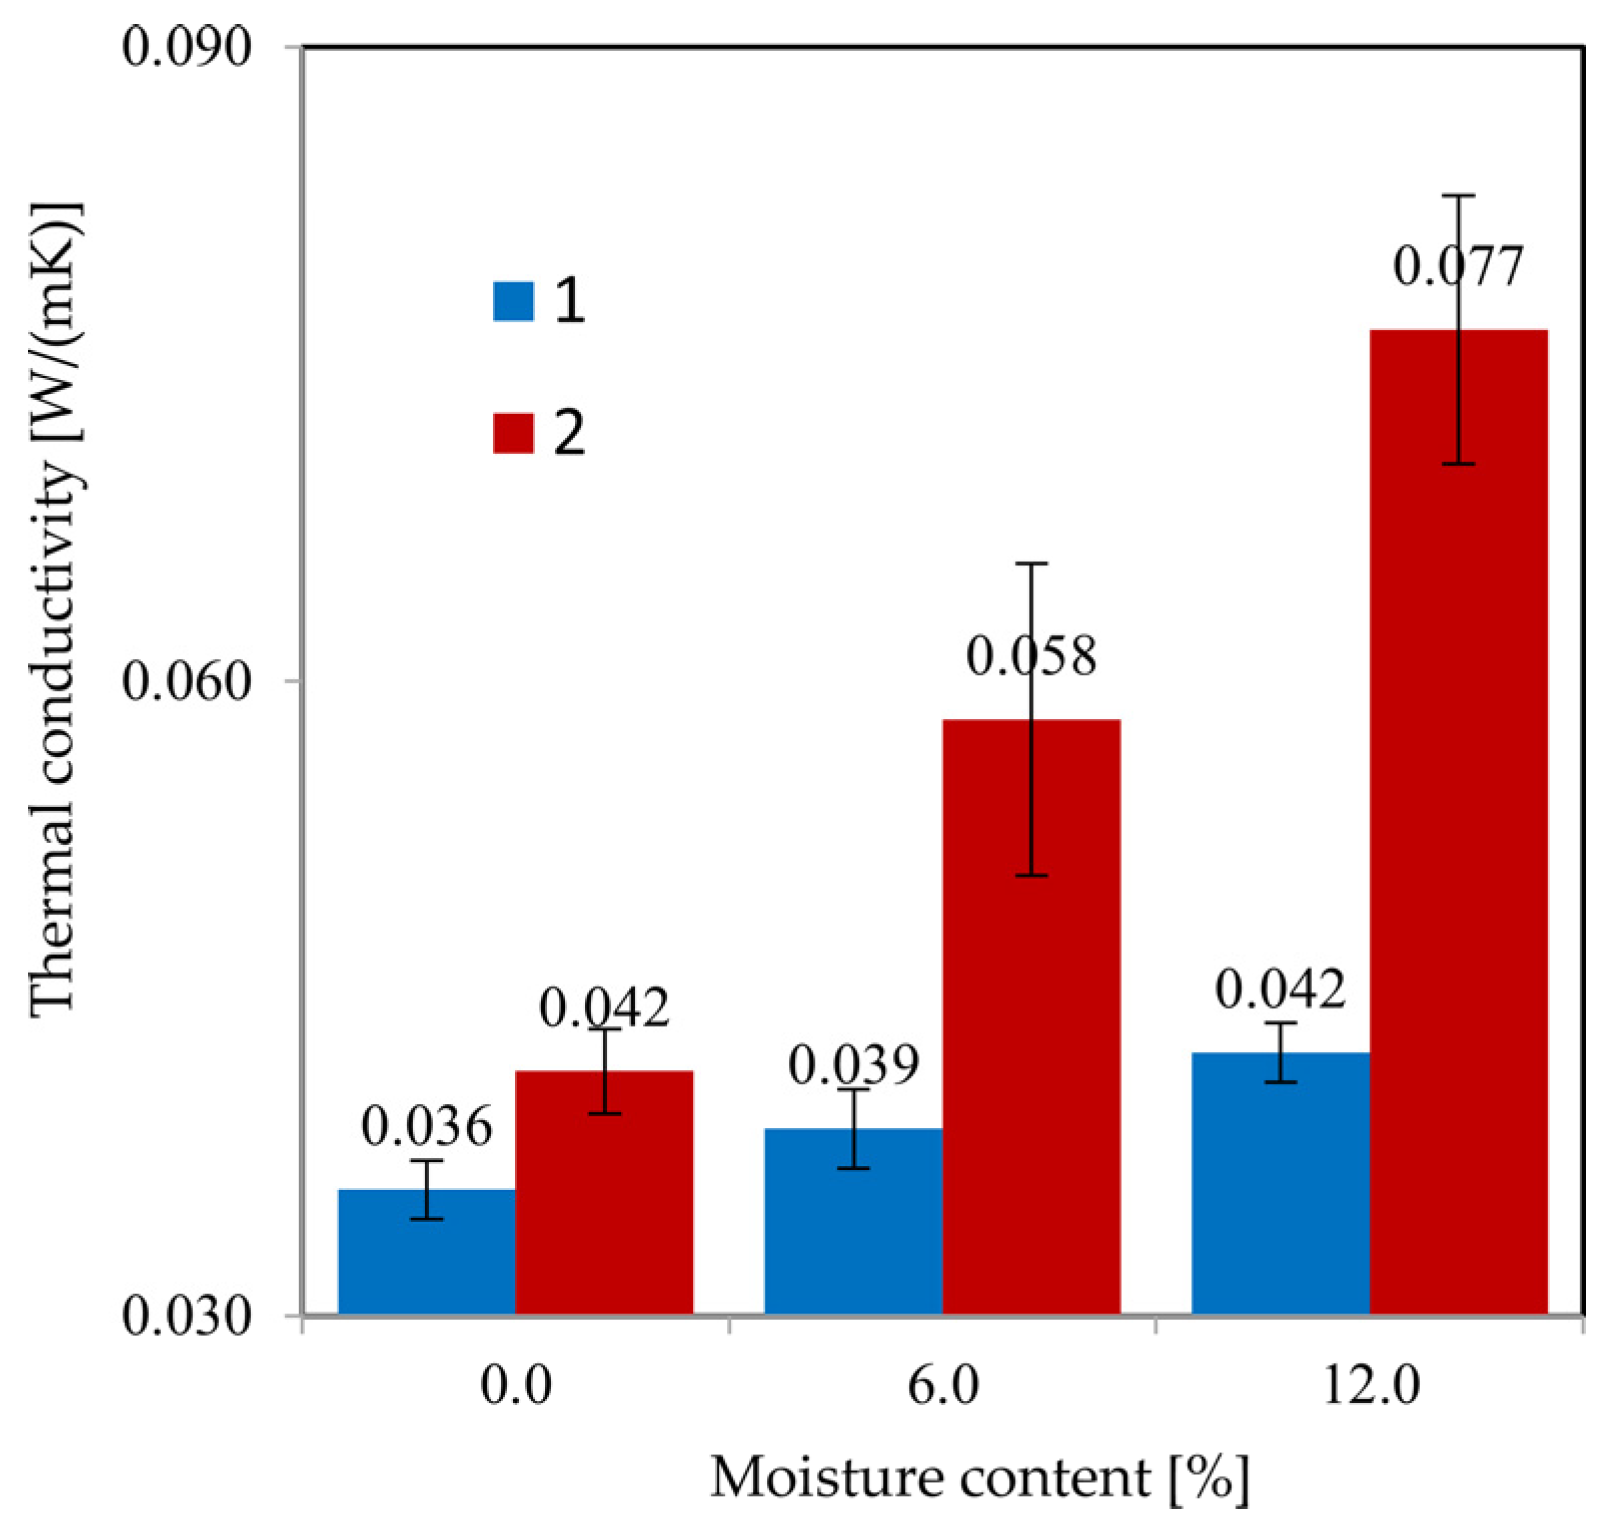
Figure 8 provides a systematic comparison of Sample A thermal conductivity as a function of moisture content at both temperature levels. The measurements were conducted at actual sample temperatures of about 19.4 ± 0.7 °C and 84.4 ± 1.7 °C (rather than the nominal 20 °C and 85 °C due to evaporation effects). The temperature-dependent behavior shows consistent thermal conductivity increases both with temperature and moisture content, confirming the complex interdependence of thermal and moisture effects in mineral wool insulation systems. In the dry state, thermal conductivity values increased from 0.036 ± 0.002 W·m−1·K−1 at 19.5 °C to 0.042 ± 0.003 W·m−1·K−1 at 86.4 °C, indicating the characteristic positive temperature coefficient typical for mineral wool insulation materials. The introduction of moisture content significantly affected thermal performance, with 6% moisture resulting in thermal conductivity increases to 0.039 ± 0.002 W·m−1·K−1 at 19.4 °C and 0.058 ± 0.009 W·m−1·K−1 at 84.2 °C. At the highest investigated moisture level (12%), thermal conductivity reached 0.042 ± 0.005 W·m−1·K−1 at 19.4 °C and 0.077 ± 0.009 W·m−1·K−1 at 82.7 °C, representing approximately 17% and 83% increases relative to dry conditions at low and high temperatures, respectively. Thus, as the temperature increases, the insulation’s sensitivity to moisture becomes more pronounced.
The data demonstrate the linear relationship between thermal conductivity and moisture content. Table 3 contains the coefficients for the linear correlation equations relating thermal conductivity (λ) and moisture content in percentage (w) for Sample A. This information may be helpful in practical calculations involving mineral fiber insulation with quality parameters comparable to Sample A’s characteristics.

4.5. Results of the Thermal Conductivity Test of the Sample B

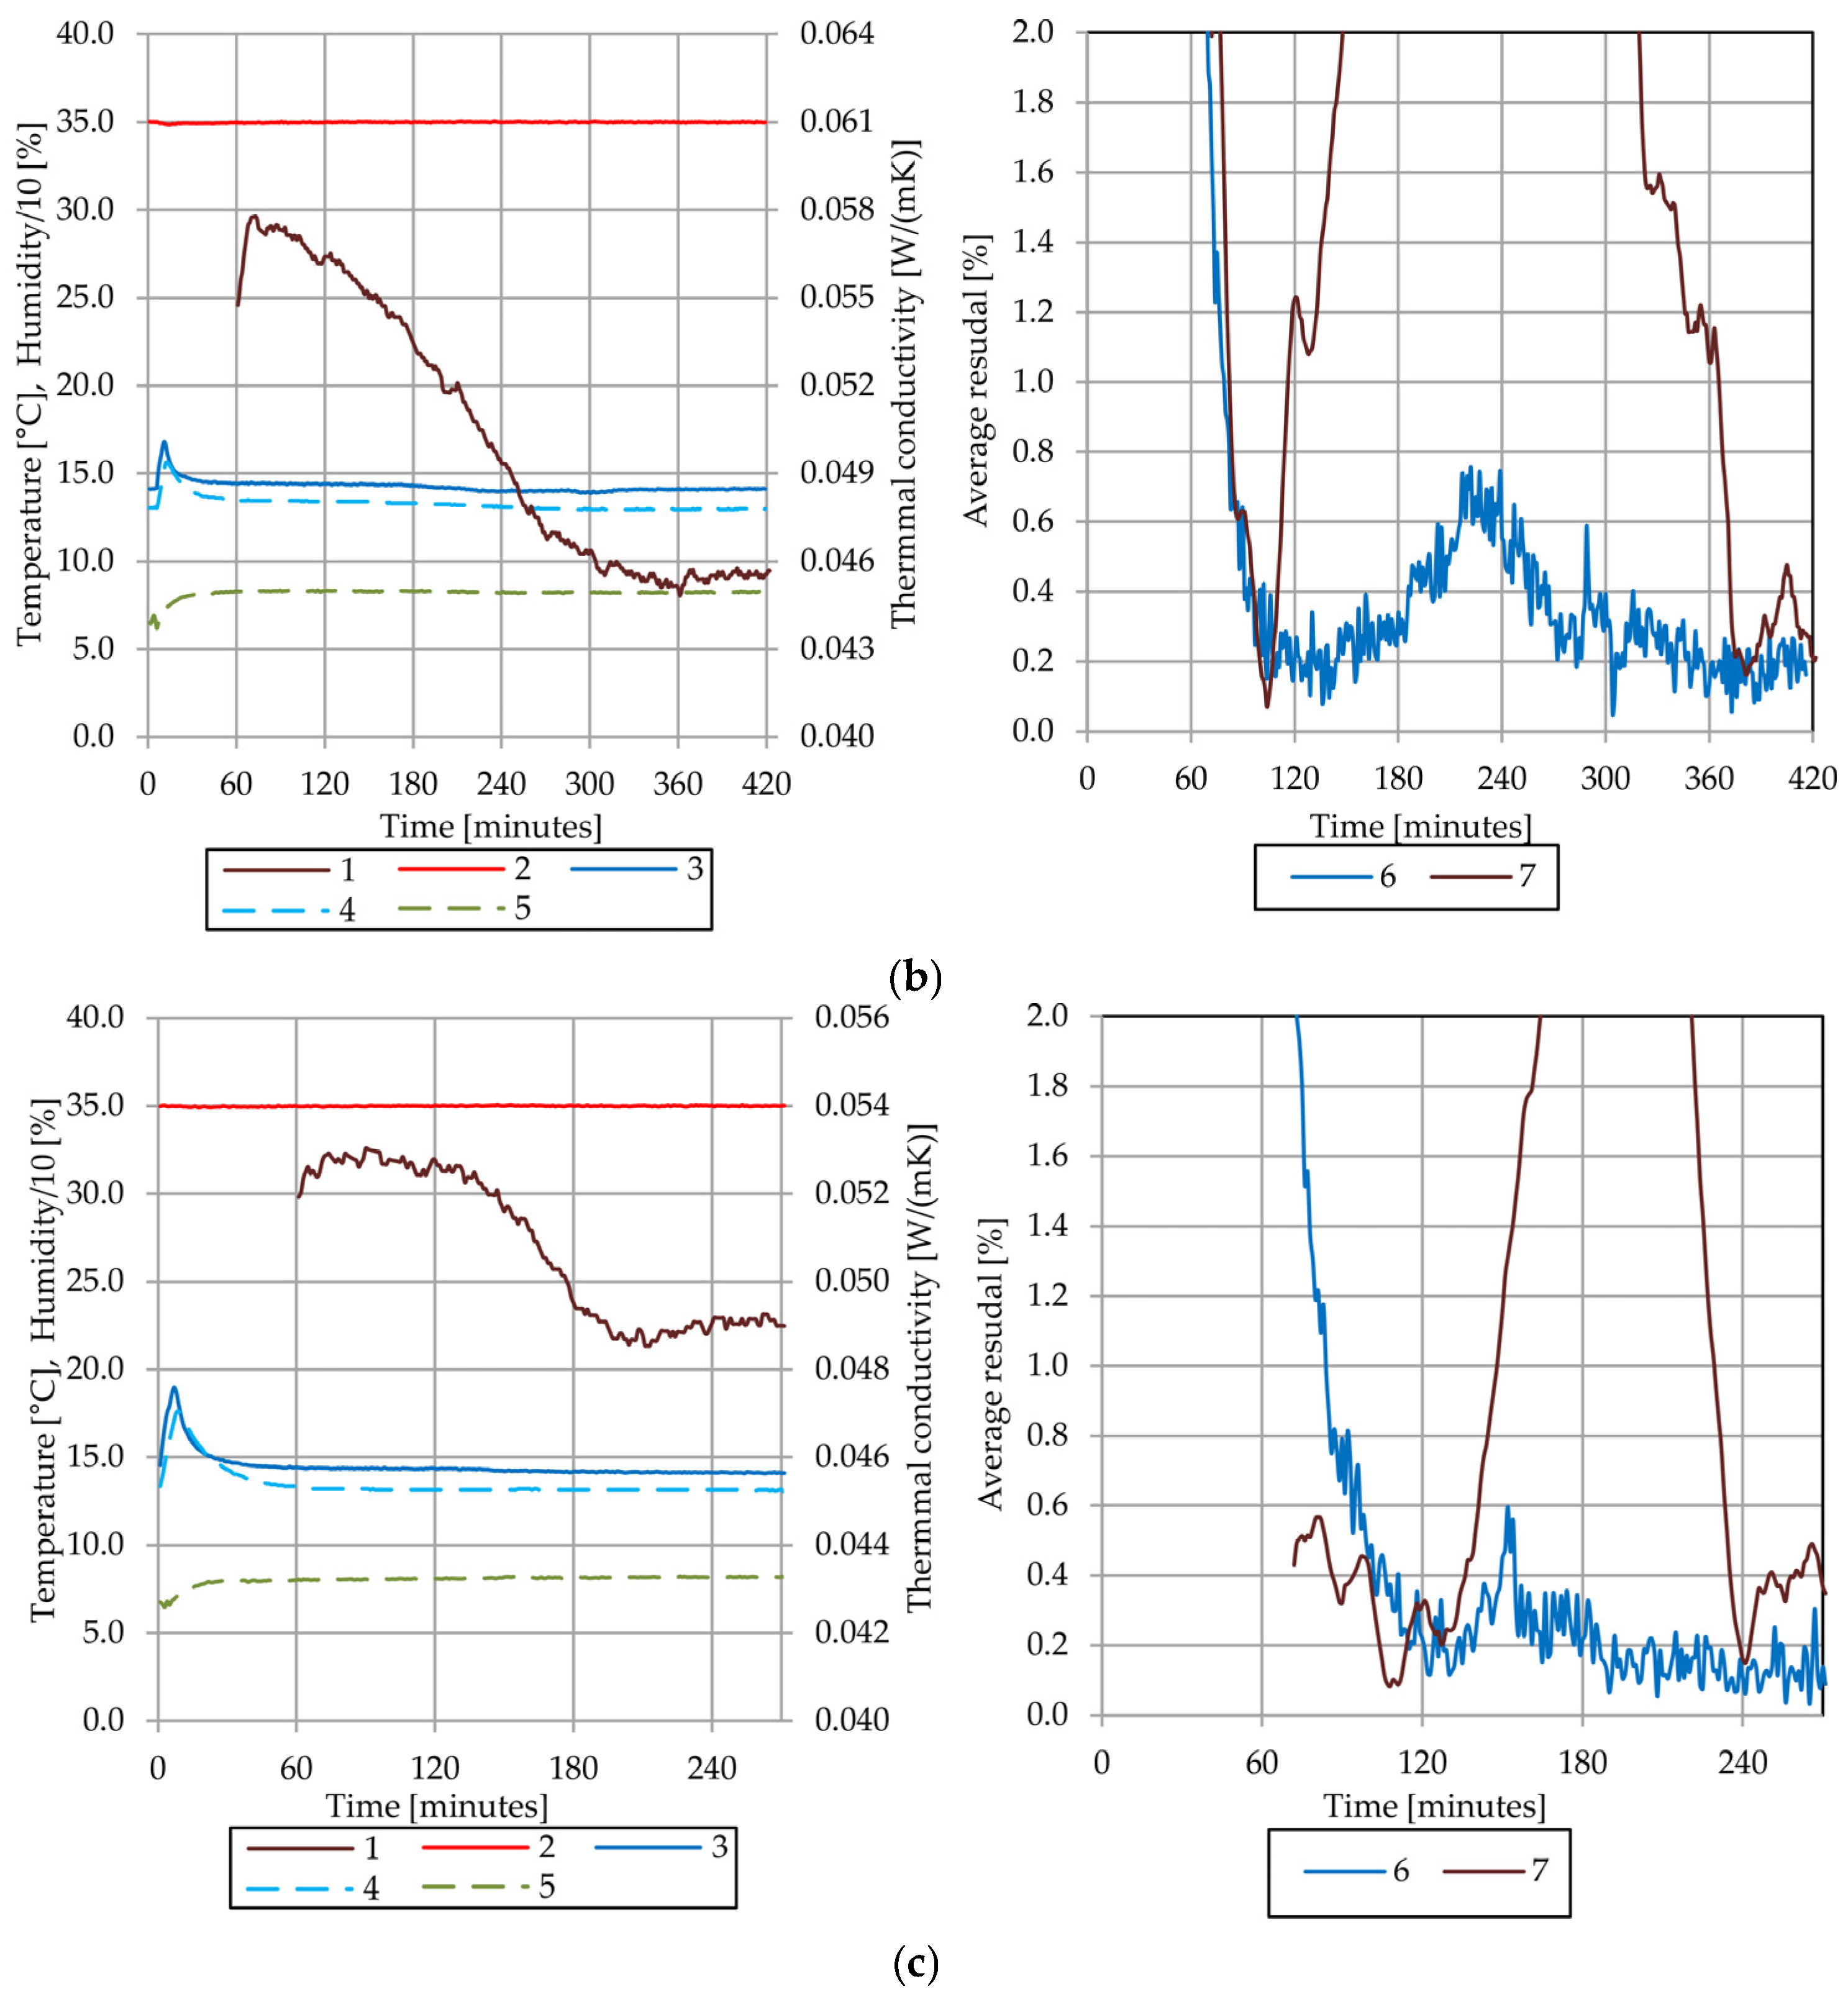
This section presents the results of thermal conductivity analysis for Sample B under varying moisture and temperature conditions. Figure 9 demonstrates the temporal evolution of thermal and moisture parameters during thermal conductivity measurements at an average sample temperature of 20.0 °C. The test configuration employed the chiller temperature of 10.0 °C and hot pipe temperature of 35.0 °C. The actual average sample temperature was maintained at 20.9 ± 0.2 °C throughout the measurement series. Under dry conditions (Figure 9a), Sample B exhibited similar stabilization behavior to Sample A, with thermal conductivity measurements showing rapid stabilization and minimal fluctuations throughout the test duration. The inner temperature remained stable at approximately 35.0 ± 0.2 °C, while the outer temperature was maintained at about 14.1 ± 0.3 °C. Temperature residuals remained consistently below 0.2% after the initial equilibration period, and thermal conductivity residuals were maintained below 1.0%, indicating reliable measurement conditions for Sample B. The average sample temperature remained stable at 20.9 ± 0.2 °C.
The introduction of 6% moisture content (Figure 9b) revealed a characteristic three-stage behavior pattern, but with distinct differences from Sample A. During the second stage, Sample B demonstrated significantly higher thermal conductivity increases compared to Sample A, indicating enhanced moisture sensitivity at low temperatures. The thermal conductivity stabilization period showed more pronounced changes in heat transfer pathways through the moistened insulation structure. Thermal conductivity residuals are decreasing from approximately 3.0% to below 1.0%. The temperatures of the inner wall, outer wall and average temperature of the sample were maintained at 35.0 ± 0.2 °C, 14.1 ± 0.3 °C and 20.9 ± 0.3 °C, respectively.
At 12% moisture content (Figure 9c), Sample B showed similar three-stage patterns but with extended stabilization periods and higher absolute thermal conductivity values compared to the corresponding conditions in Sample A, confirming the enhanced moisture sensitivity of this material at low temperatures. Moreover, the thermal conductivity residual also decreased below 1.0% at this stage, and temperature conditions did not change significantly.
Figure 10 presents thermal conductivity measurement data at elevated temperature conditions for Sample B. There was a constant temperature differential throughout the sample, with the outside temperature held at roughly 80.1 ± 0.4 °C and the inner temperature remaining steady at near 100.0 ± 0.8 °C. For the course of the measurement series, the real average sample temperature remained at 86.6 ± 0.4 °C. Under dry conditions (Figure 10a), Sample B exhibited thermal conductivity values consistent with the positive temperature coefficient characteristic of mineral wool materials, with temperature residuals below 0.2% and thermal conductivity residuals maintained below 1.5%.
The 6% moisture content tests (Figure 10b) revealed significantly modified behavior compared to Sample A. Sample B demonstrated practically no plateau during the third stage, with thermal conductivity beginning to decrease almost immediately after the initial stabilization. This rapid transition from the second to fourth stage indicates accelerated drying behavior and reduced moisture retention capacity at elevated temperatures. Due to this rapid drying process, thermal conductivity measurements had to be conducted during periods when conductivity residuals were below 3.0% rather than the typical 1% criterion used for Sample A. With temperature residuals decreasing below 1.5%, the inner and outer wall temperatures were steady at 100.0 ± 0.5 °C and 78.6 ± 0.8 °C, respectively. The average sample temperature remained stable at 85.6 ± 0.6 °C throughout this critical measurement period.
Similarly, at 12% moisture content (Figure 10c), Sample B showed the absence of a sustained plateau phase, with the thermal system transitioning rapidly through the moisture retention and drying stages. The drying process proceeded much more rapidly than observed in Sample A. The actual average sample temperature remained near 84.4 ± 0.7 °C due to evaporation effects. The temperatures of the outer and inner walls remained stable at 76.9 ± 0.9 °C and 100.0 ± 0.7 °C, respectively. Instead of using the 1.0% criterion for Sample A, thermal conductivity measurements had to be made when conductivity residuals were less than 2.0%.
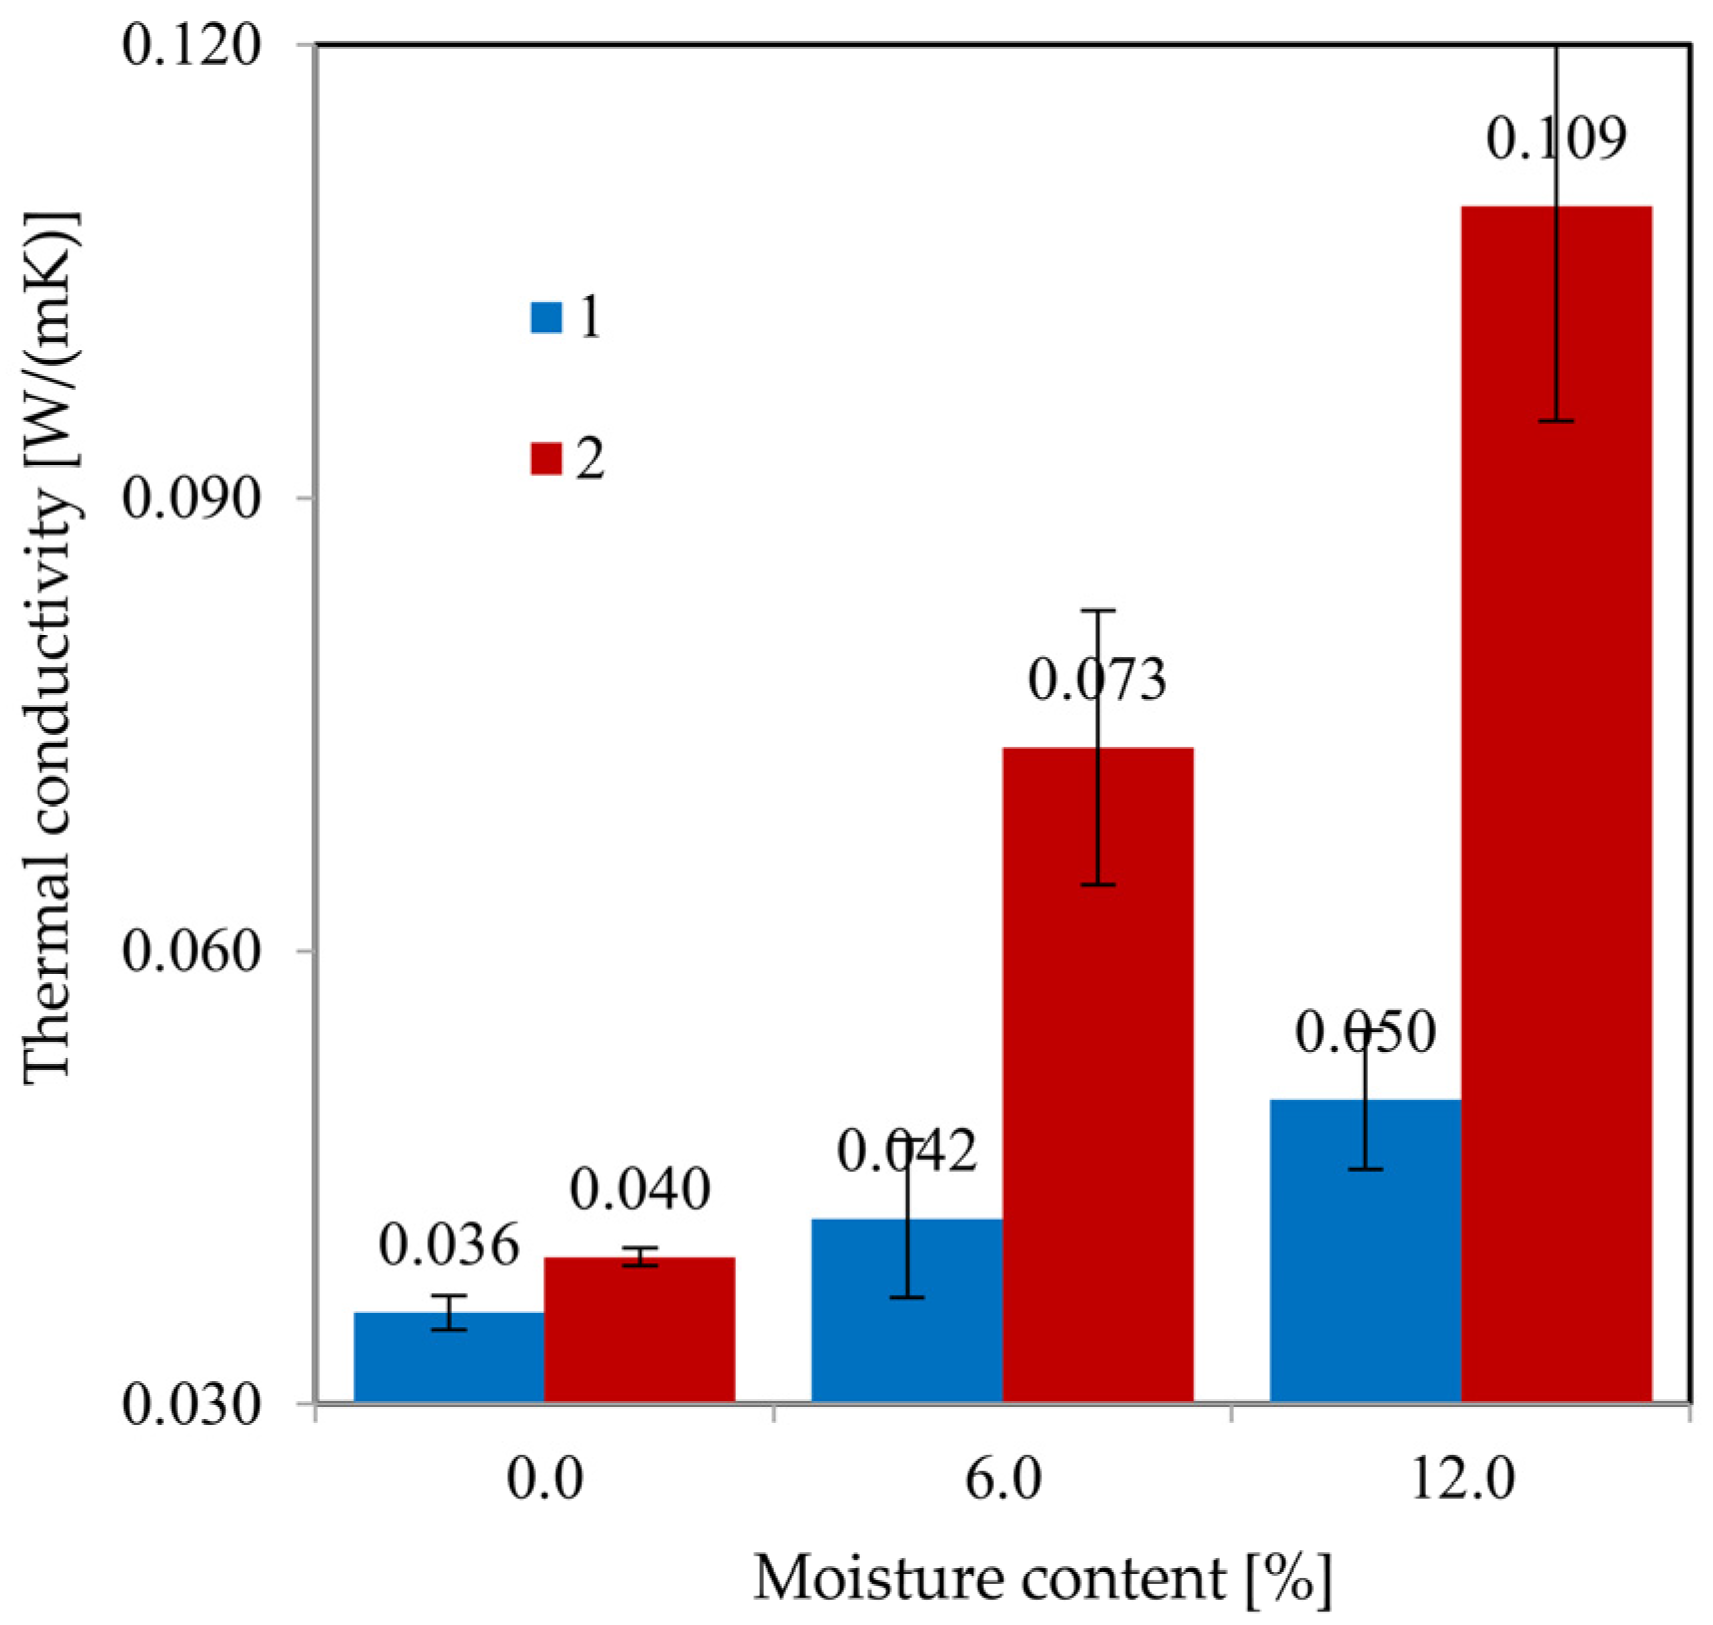
Figure 11 provides a systematic comparison of Sample B thermal conductivity as a function of moisture content at both temperature levels. The measurements were conducted at actual sample temperatures of 20.9 ± 0.2 °C and 85.5 ± 0.8 °C. In the dry state, thermal conductivity values increased from 0.036 ± 0.001 W·m−1·K−1 at 20.9 °C to 0.040 ± 0.002 W·m−1·K−1 at 86.6 °C, showing that mineral wool insulation materials tend to have a positive temperature coefficient. The introduction of moisture content significantly affected thermal performance, with 6% moisture resulting in thermal conductivity increases to 0.042 ± 0.005 W·m−1·K−1 at 20.9 °C and 0.073 ± 0.009 W·m−1·K−1 at 85.6 °C. At the highest investigated moisture level (12%), thermal conductivity reached 0.050 ± 0.004 W·m−1·K−1 at 20.9 °C and 0.109 ± 0.014 W·m−1·K−1 at 84.4 °C, representing approximately 38% and 276% increases relative to dry conditions at low and high temperatures, respectively. Thus, sample B confirmed the trend observed for sample A and exhibits an even greater sensitivity to temperature increases under moist conditions.
Similarly to Sample A, the data show a linear relationship between moisture content and thermal conductivity. The coefficients for the linear correlation equations for Sample B are provided also in Table 3. This data might benefit practical calculations involving mineral fiber insulation that use quality parameters similar to Sample B.

4.6. Comparative Analysis of Sample A and Sample B

Figure 12 presents a systematic comparison of thermal conductivity performance between Sample A and Sample B across varying moisture contents at two temperature levels.
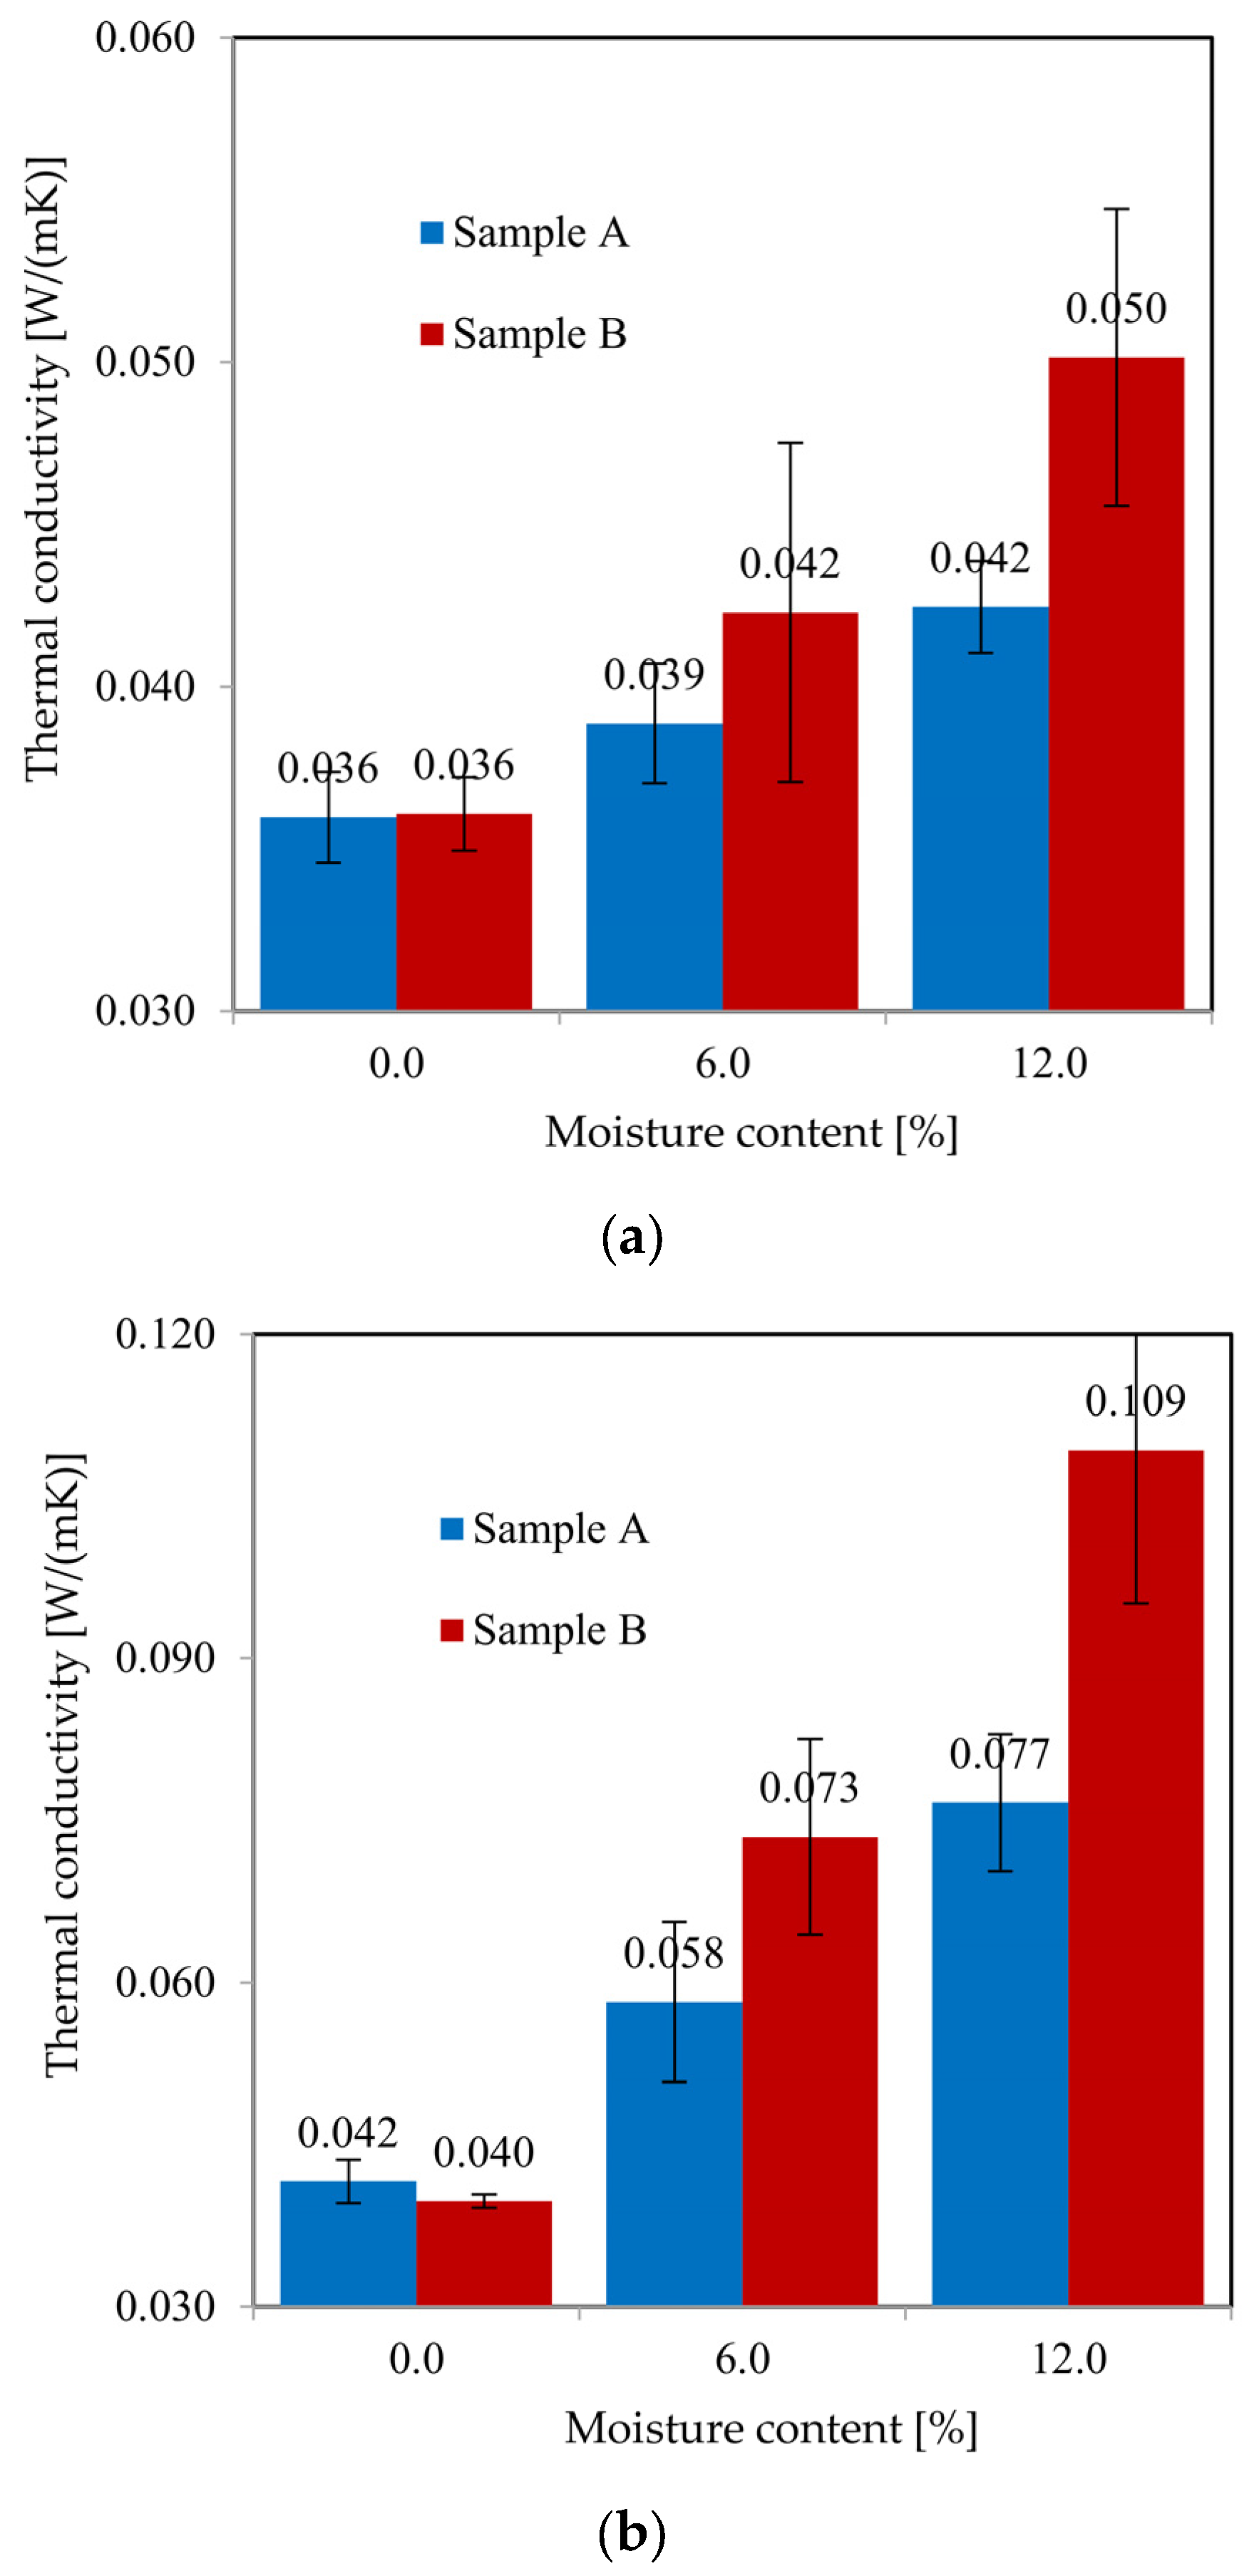
At low temperature conditions (Figure 12a), both samples demonstrate the characteristic increase in thermal conductivity with moisture content, but with distinctly different magnitudes and patterns. Under dry conditions, samples exhibit similar thermal conductivities with values of 0.036 W∙m−1·K−1 despite Sample B’s superior fiber morphology and reduced shot content. At 6% moisture content, Sample B shows a 16.7% increase in thermal conductivity compared to only 8.3% for Sample A. At 12% moisture content, this difference becomes even more pronounced: Sample B exhibits a 39.0% increase, while Sample A shows only a 16.7% increase. Consequently, Sample B’s thermal conductivity exceeds Sample A’s by approximately 19% at maximum moisture content.
At elevated temperatures, the performance hierarchy does not shift significantly. Under dry conditions, Sample B has a minor advantage with approximately 5.0% lower thermal conductivity than Sample A. At elevated temperatures (Figure 12b), Sample B exhibits greater moisture-induced thermal conductivity increases than Sample A across all moisture contents. At 6% moisture content, Sample B shows an 82.5% increase in thermal conductivity compared to only 38.0% for Sample A. At 12% moisture content, this difference becomes even more pronounced: Sample B exhibits a 272.5% increase, while Sample A shows only an 83.3% increase. Consequently, Sample B’s thermal conductivity exceeds Sample A’s by approximately 41.5% at maximum moisture content. Thus, despite superior hydrophobic treatment, Sample B shows consistently higher relative thermal conductivity growth than Sample A by approximately 25–42% under moist high-temperature conditions.

4.7. Discussion of Observed Phenomena

The results obtained under dry conditions are in good agreement with data in studies [1,12,15,18], which can be considered confirmation of the validity of the experimental procedure. Particularly noteworthy is the satisfactory agreement with Porzuczek’s work [29], which used specialized commercial equipment to analyze pipe insulations. At temperatures from 20 °C to 80 °C, the thermal conductivity in his study also varied linearly from about 0.035 to 0.041 W m−1K−1.
For wet conditions, the results were predictable: an increase in moisture content leads to an increase in the thermal conductivity of the samples. At the low temperature, both samples showed growth of the thermal conductivity by 17–40%, similar to the studies [1,5,8,9]. In the high-temperature regime, the thermal moisture system exhibited complex behavior characterized by intensive evaporation and drying processes, akin to the findings of Dragovic [16], which identified a two-stage drying process. At elevated temperatures, the samples demonstrated a dramatic increase in thermal conductivity, rising by 80% to 270%. This is substantially higher than the 30% increase reported by Lu [15] and Behnamian [17], who conducted their tests on hot pipes up to 100 °C but with ambient external temperature, resulting in an average insulation temperature near 40 °C. Therefore, the lower conductivity increase in their results is more consistent with studies under moderate temperature conditions. The comparative analysis of the samples showed that the thermal conductivity of sample B exceeded that of sample A by 19–45% at maximum moisture content. Thus, the sample with the superior hydrophobic treatment (211% water absorption vs. 944% for Sample A in Table 1) paradoxically contributes to its higher moisture sensitivity. Jiřičková [7] reported similar counterintuitive thermal performance behavior in insulation materials with advanced moisture protection systems under laboratory protocols for moisture introduction. For instance, a hydrophobic sample’s thermal conductivity was nearly twice as high as that of a hydrophilic material in an experiment that used a surface probe to measure thermal conductivity perpendicular to the fibers. Our work thus provides, for the first time, a direct experimental comparison of two high-quality hydrophobic mineral wool samples with differing degrees of hydrophobic treatment. While previous research has largely focused on comparing hydrophilic and hydrophobic materials [3,24,25,26] and consistently reports poorer thermal insulating properties for hydrophilic samples, there is a notable gap regarding the behavior of hydrophobic materials with different treatment qualities. Our study addresses this gap, demonstrating that even among hydrophobic insulations, treatment quality can significantly affect moisture sensitivity and wet-state thermal conductivity.
The thermal performance differences between the samples can be explained through analysis of their micro structural characteristics and moisture transport mechanisms. Sample B’s more uniform fiber diameter distribution and lower shot content (Table 1) create a more homogeneous pore structure. While this typically improves dry thermal performance [19,23], it also facilitates more uniform moisture distribution when water is introduced. The controlled pore geometry enables moisture to penetrate deeper into the fiber matrix. Perhaps this creates continuous liquid water pathways that significantly enhance heat transfer through conduction mechanisms. Sample B’s lower compaction factor during installation (Table 2) indicates better structural integrity. However, this maintained fiber architecture provides more efficient pathways for moisture transport when water penetrates the hydrophobic barrier, which leads to an emergence of new conductive heat transfer routes.
The hydrophobic surface treatment delays initial water absorption but concentrates moisture in specific regions once the treatment is overcome. This localized moisture concentration creates high-conductivity pathways within a low-conductivity matrix, resulting in disproportionate thermal performance degradation. At elevated temperatures, Sample B’s accelerated drying behavior (observed as the absence of plateau phases in time-series data in Figure 10b,c) becomes advantageous. The rapid moisture release destroys stable liquid water networks, reducing the thermal conductivity. Sample A’s higher moisture retention capacity becomes detrimental at high temperatures, maintaining elevated thermal conductivity for extended periods. The different vapor transport characteristics between samples become critical at elevated temperatures. Sample B’s controlled pore structure facilitates more efficient vapor phase transport, enabling faster moisture removal and recovery of dry-state thermal performance. Sample A’s broader pore size distribution, higher shot content and compaction factor impede vapor transport, prolonging moisture-related thermal performance degradation. Thus, Sample B’s superior baseline properties and hydrophobic treatment provide advantages primarily under dry conditions and high-temperature applications where rapid moisture removal occurs. It should be emphasized that these results are valid specifically for the moisture penetration protocols similarly described in this study, which involve the introduction of moisture into the insulation matrix for a short period of time. However, for applications involving sustained moisture exposure, the enhanced moisture sensitivity may offset the baseline performance benefits.
The observed behavior may initially appear counterintuitive, but when considering the primary purpose of hydrophobic treatment, which is to prevent moisture penetration into the insulation from external sources and prevent wetting (such as during water condensation from ambient air, pipeline flooding, etc.), the situation becomes clearer. When moisture penetrates the insulation from internal sources (for example, due to pipeline damage, seal failure, or leaks), hydrophobic treatment should facilitate more rapid moisture removal (“expulsion”) from the insulation matrix. Under such conditions, overall convective heat transfer becomes intensified due to additional moisture movement outward driven by capillary effects and hydrophobic repulsion forces. The hydrophobic treatment creates preferential pathways for vapor transport while simultaneously resisting liquid water retention, leading to enhanced mass transfer processes. This combination of accelerated moisture transport and convective enhancement contributes to the increase in effective thermal conductivity observed in Sample B under controlled moisture introduction conditions. Despite this, the apparent performance penalty of hydrophobic treatment in the experimental moisture injection protocol may actually benefit real-world conditions involving internal moisture sources like pipeline leaks. Findings reveal that traditional material quality indicators may not directly correlate with moisture-related thermal performance under all operating conditions. More hydrophobic materials have advantages primarily under dry conditions and high-temperature applications where rapid moisture removal occurs after short-term moisture ingress. However, for applications involving sustained moisture exposure, the enhanced moisture sensitivity may offset the baseline performance benefits.
The results suggest that optimal insulation selection requires consideration of specific operating conditions, including temperature range, moisture exposure duration, and drying potential. For high-temperature applications with intermittent moisture exposure, the rapid drying of more hydrophobic insulation provides superior long-term performance. For moderate temperature applications with sustained moisture presence, lower moisture sensitivity of insulation may prove more beneficial despite its inferior baseline properties.

5. Conclusions

Mineral wool insulation is valued for its low thermal conductivity and reliability in modern construction. However, even limited moisture greatly reduces its insulating performance, making the investigation of wet-state properties essential for effective real-world application. This study experimentally evaluated how quality characteristics affect the thermal performance of pipe insulations made from wired mats at temperatures ranging from 20 °C to 85 °C with moisture content up to 12% by weight.
Two representative samples were selected: Sample A (inferior quality/less effective moisture protection) and Sample B (superior quality/effective hydrophobic treatment). Measurements were performed using the “guarded hot pipe” method. Both samples showed the expected increase in thermal conductivity with rising temperature and moisture content. In a dry state, the insulation quality parameters have practically no effect on the thermal conductivity of the material; both samples exhibited similar thermal conductivities (approx. 0.036 W∙m−1·K−1 at low T, 0.04 W∙m−1·K−1 at high T).
The key finding is the performance under wet conditions: the sample with the better hydrophobic treatment (Sample B) showed greater sensitivity to moisture. At maximum moisture content (12%), Sample B’s thermal conductivity significantly exceeded Sample A’s (by 7–19% at low T, and by 26–42% at high T). This counterintuitive effect is explained by improved heat and mass transfer in the more hydrophobic material due to large capillary forces pushing moisture and vapor through the insulation matrix.
The results suggest that highly hydrophobic materials have advantages primarily in high-temperature applications where rapid moisture removal (drying potential) occurs after short-term moisture ingress. To improve energy efficiency, the selection of optimal insulation must account for all operating conditions, including temperature range, duration of moisture exposure, and drying dynamics, rather than just initial dry-state properties or hydrophobicity alone.

Supplementary Materials

The following supporting information can be downloaded at: https://www.mdpi.com/article/10.3390/en18226074/s1, Video S1: The injection procedure of Sample A. Video S2: The injection procedure of Sample B.

Author Contributions

Conceptualization, A.H. (Aidar Hayrullin); Methodology, A.S., A.H. (Aidar Hayrullin), A.H. (Aigul Haibullina) and V.I.; Validation, J.D. and M.K.; Formal Analysis, M.K., D.B. and V.B.; Investigation, A.S., A.H. (Aidar Hayrullin), D.B., M.K., V.B., J.D. and A.H. (Aigul Haibullina); Resources, V.I., V.B. and D.B.; Data Curation, A.S.; Writing—Original Draft Preparation, A.S.; Writing—Review and Editing, A.S. and A.H. (Aidar Hayrullin); Visualization, J.D.; Supervision, A.H. (Aidar Hayrullin); Project Administration, V.I.; Funding Acquisition, A.H. (Aidar Hayrullin). All authors have read and agreed to the published version of the manuscript.

Funding

We would like to acknowledge financial supports for this work provided by the Russian Science Foundation, grant number 24-29-00461, https://rscf.ru/en/project/24-29-00461/, accessed on 20 October 2025.

Data Availability Statement

The data presented in this study are available on request from the corresponding author. The data are not publicly available due to privacy.

Conflicts of Interest

The authors declare no conflicts of interest.

Abbreviations

Nomenclature
CFcompaction factor
Ddiameter, m
Eelectric energy, J
Llength, m
mmass, kg
Nnumber
Qelectric power, W
ttemperature, °C
Ttime period, s
wmoisture content, %
Greek symbols
Δuncertainty
λeffective thermal conductivity, W∙m−1∙K−1
σstandard deviation
τcurrent time, s
Subscripts
iindex
lmeasuring intervals along the length
ssensor
timetime intervals
1,2,3injected water, drainage water, a work zone of the sample
Supersubscripts
avgaverage value
in, outa inner wall, a outer wall

References

  1. Abdou, A.; Budaiwi, I. The variation of thermal conductivity of fibrous insulation materials under different levels of moisture content. Constr. Build. Mater. 2013, 43, 533–544. [Google Scholar] [CrossRef]
  2. Anh, L.D.H.; Pásztory, Z. An overview of factors influencing thermal conductivity of building insulation materials. J. Build. Eng. 2021, 44, 102604. [Google Scholar] [CrossRef]
  3. Antepara, Í. Moisture dependent thermal properties of hydrophilic mineral wool: Application of the effective media theory. Mater. Sci. 2015, 21, 449–454. [Google Scholar] [CrossRef]
  4. Gusyachkin, A.; Sabitov, L.; Khakimova, A.; Hayrullin, A. Effects of moisture content on thermal conductivity of thermal insulation materials. IOP Conf. Ser. Mater. Sci. Eng. 2019, 570, 012029. [Google Scholar] [CrossRef]
  5. Hayrullin, A.; Haibullina, A.; Gusyachkin, A. Thermal Conductivity of Insulation Material: Effect of Moisture Content and Wet-Drying Cycle. Mater. Sci. Forum 2023, 1085, 119–124. [Google Scholar] [CrossRef]
  6. Jerman, M.; Černý, R. Effect of moisture content on heat and moisture transport and storage properties of thermal insulation materials. Energy Build. 2012, 53, 39–46. [Google Scholar] [CrossRef]
  7. Jiřičková, M.; Pavlík, Z.; Fiala, L.; Černý, R. Thermal Conductivity of Mineral Wool Materials Partially Saturated by Water. Int. J. Thermophys. 2006, 27, 1214–1227. [Google Scholar] [CrossRef]
  8. Karamanos, A.; Hadiarakou, S.; Papadopoulos, A. The impact of temperature and moisture on the thermal performance of stone wool. Energy Build. 2008, 40, 1402–1411. [Google Scholar] [CrossRef]
  9. Ochs, F.; Müller-Steinhagen, H. Temperature and Moisture Dependence of the Thermal Conductivity of Insulation Materials; NATO Advanced Study Institute on Thermal Energy Storage for Sustainable Energy Consumption (TESSEC): Izmir, Turkey, 2005; pp. 1–6. [Google Scholar]
  10. Zhu, W.; Cai, S.; Cremaschi, L. Thermal performance and moisture accumulation of fibrous mechanical pipe insulation systems operating at below-ambient temperature in wet conditions with moisture ingress. Sci. Technol. Built Environ. 2015, 21, 862–875. [Google Scholar] [CrossRef]
  11. Zehendner, H. Thermal Conductivity of Thermal Insulation Materials on Pipes. J. Therm. Insul. 1983, 7, 52–68. [Google Scholar] [CrossRef]
  12. Cai, S.; Cremaschi, L.; Ghajar, A.J. Pipe Insulation Thermal Conductivity Under Dry and Wet Condensing Conditions with Moisture Ingress: A Critical Review, HVAC&R Research. 2014. Available online: https://www.tandfonline.com/doi/abs/10.1080/10789669.2014.882678 (accessed on 7 October 2025).
  13. Hayrullin, A.; Haibullina, A.; Sinyavin, A. Insulation thermal conductivity heating networks during transportation thermal energy under dry and moisturizing condition: A comparative study of the guarded hot plate and guarded hot pipe method. Transp. Res. Procedia 2022, 63, 1074–1080. [Google Scholar] [CrossRef]
  14. Hayrullin, A.; Habibullina, I.; Haibullina, A.; Ilyin, V. Experimental study pipe insulation heat losses with moisture ingress. IOP Conf. Ser. Earth Environ. Sci. 2022, 979, 012125. [Google Scholar] [CrossRef]
  15. Lu, F.; Kaviany, M.; Williams, J.; Addison-Smith, T. Heat, mass and momentum transport in wet mineral-wool insulation: Experiment and simulation. Int. J. Heat Mass Transf. 2024, 228, 125644. [Google Scholar] [CrossRef]
  16. Dragovic, H.; Damaceno, D.S.; Meyer, O.H.H.; Ervik, Å. Water transport and corrosion under insulation: Experimental investigations of drying in mineral wool. Process Saf. Environ. Prot. 2024, 190, 198–210. [Google Scholar] [CrossRef]
  17. Behnamian, Y.; Serate, D.; Yuen, S.; Guo, H.; Mehta, N.; Soni, N.; Bohra, S.; Mcdonald, A. A Case Study of External Cracking in Steam Piping under Mineral Wool Insulation. In Proceedings of the CONFERENCE 2025, Nashville, TN, USA, 6–10 April 2025. [Google Scholar] [CrossRef]
  18. Nagy, B.; Simon, T.K.; Nemes, R. Effect of built-in mineral wool insulations durability on its thermal and mechanical performance. J. Therm. Anal. Calorim. 2020, 139, 169–181. [Google Scholar] [CrossRef]
  19. Farouk, M.; Soltan, A.; Schlüter, S.; Hamzawy, E.; Farrag, A.; El-Kammar, A.; Yahya, A.; Pollmann, H. Optimization of microstructure of basalt-based fibers intended for improved thermal and acoustic insulations. J. Build. Eng. 2021, 34, 101904. [Google Scholar] [CrossRef]
  20. Ivanič, A.; Kravanja, G.; Kidess, W.; Rudolf, R.; Lubej, S. The Influences of Moisture on the Mechanical, Morphological and Thermogravimetric Properties of Mineral Wool Made from Basalt Glass Fibers. Materials 2020, 13, 2392. [Google Scholar] [CrossRef]
  21. Kosiński, P. Moisture Transport in Loose Fibrous Insulations under Steady-State Boundary Conditions. Materials 2023, 16, 7656. [Google Scholar] [CrossRef]
  22. Liu, K.; Wang, Y. Pore structure characterization and effective thermal conductivity modeling of fibrous building thermal insulation materials based on X-ray tomography. Int. Commun. Heat Mass Transf. 2024, 154, 107410. [Google Scholar] [CrossRef]
  23. Shishulkin, S.Y.; Starinskiy, I.V.; Tran, P.L.; Shaidorov, A.A. Influence of incineration ash and slag waste impurities on thermal conductivity of mineral basalt wool. ESSUTM Bull. 2024, 3, 98–108. [Google Scholar] [CrossRef]
  24. Jiřičková, M.; Černý, R. Effect of hydrophilic admixtures on moisture and heat transport and storage parameters of mineral wool. Constr. Build. Mater. 2006, 20, 425–434. [Google Scholar] [CrossRef]
  25. Jeon, C.-K.; Lee, J.; Chung, H.; Kim, J.-H.; Park, J. A Study on Insulation Characteristics of Glass Wool and Mineral Wool Coated with a Polysiloxane Agent. Adv. Mater. Sci. Eng. 2017, 2017, 3938965. [Google Scholar] [CrossRef]
  26. Pokorný, J.; Pavlíková, M.; Žumár, J.; Pavlík, Z.; Černý, R. Moisture Transport Properties of Hydrophilic Mineral Wool. Adv. Mater. Res. 2014, 982, 6–10. [Google Scholar] [CrossRef]
  27. GOST 17177-94; Thermal Insulating Materials and Products for Construction. Test Methods. МНТКС: Khabarovsk, Russia, 1996. Available online: https://docs.cntd.ru/document/901710454 (accessed on 1 September 2025).
  28. GOST 32025-2012; Thermal Insulation Products for Building Applications. Determination of Steady-State Thermal Transmission Properties of Thermal Insulation for Circular Pipes (EN ISO 8497:1996). МНТКС: Khabarovsk, Russia, 2013. Available online: https://www.neostrom.ru/gosts/32025-2012.pdf (accessed on 1 September 2025).
  29. Porzuczek, J. Comparative Study on Selected Insulating Materials for Industrial Piping. Materials 2024, 17, 1601. [Google Scholar] [CrossRef]
  30. Hayrullin, A.; Sinyavin, A.; Haibullina, A.; Ilyin, V. Experimental investigation of the heat transport and pressure drop in open-cell polyurethane foams. Int. J. Heat Mass Transf. 2023, 217, 124709. [Google Scholar] [CrossRef]
  31. Moffat, R.J. Describing the uncertainties in experimental results. Exp. Therm. Fluid Sci. 1988, 1, 3–17. [Google Scholar] [CrossRef]
  32. Nakos, J.T. Uncertainty Analysis of Thermocouple Measurements Used in Normal and Abnormal Thermal Environment Experiments at Sandia’s Radiant Heat Facility and Lurance Canyon Burn Site. Sandia National Laboratories. 2004. Available online: https://core.ac.uk/download/pdf/71304534.pdf (accessed on 12 September 2025).
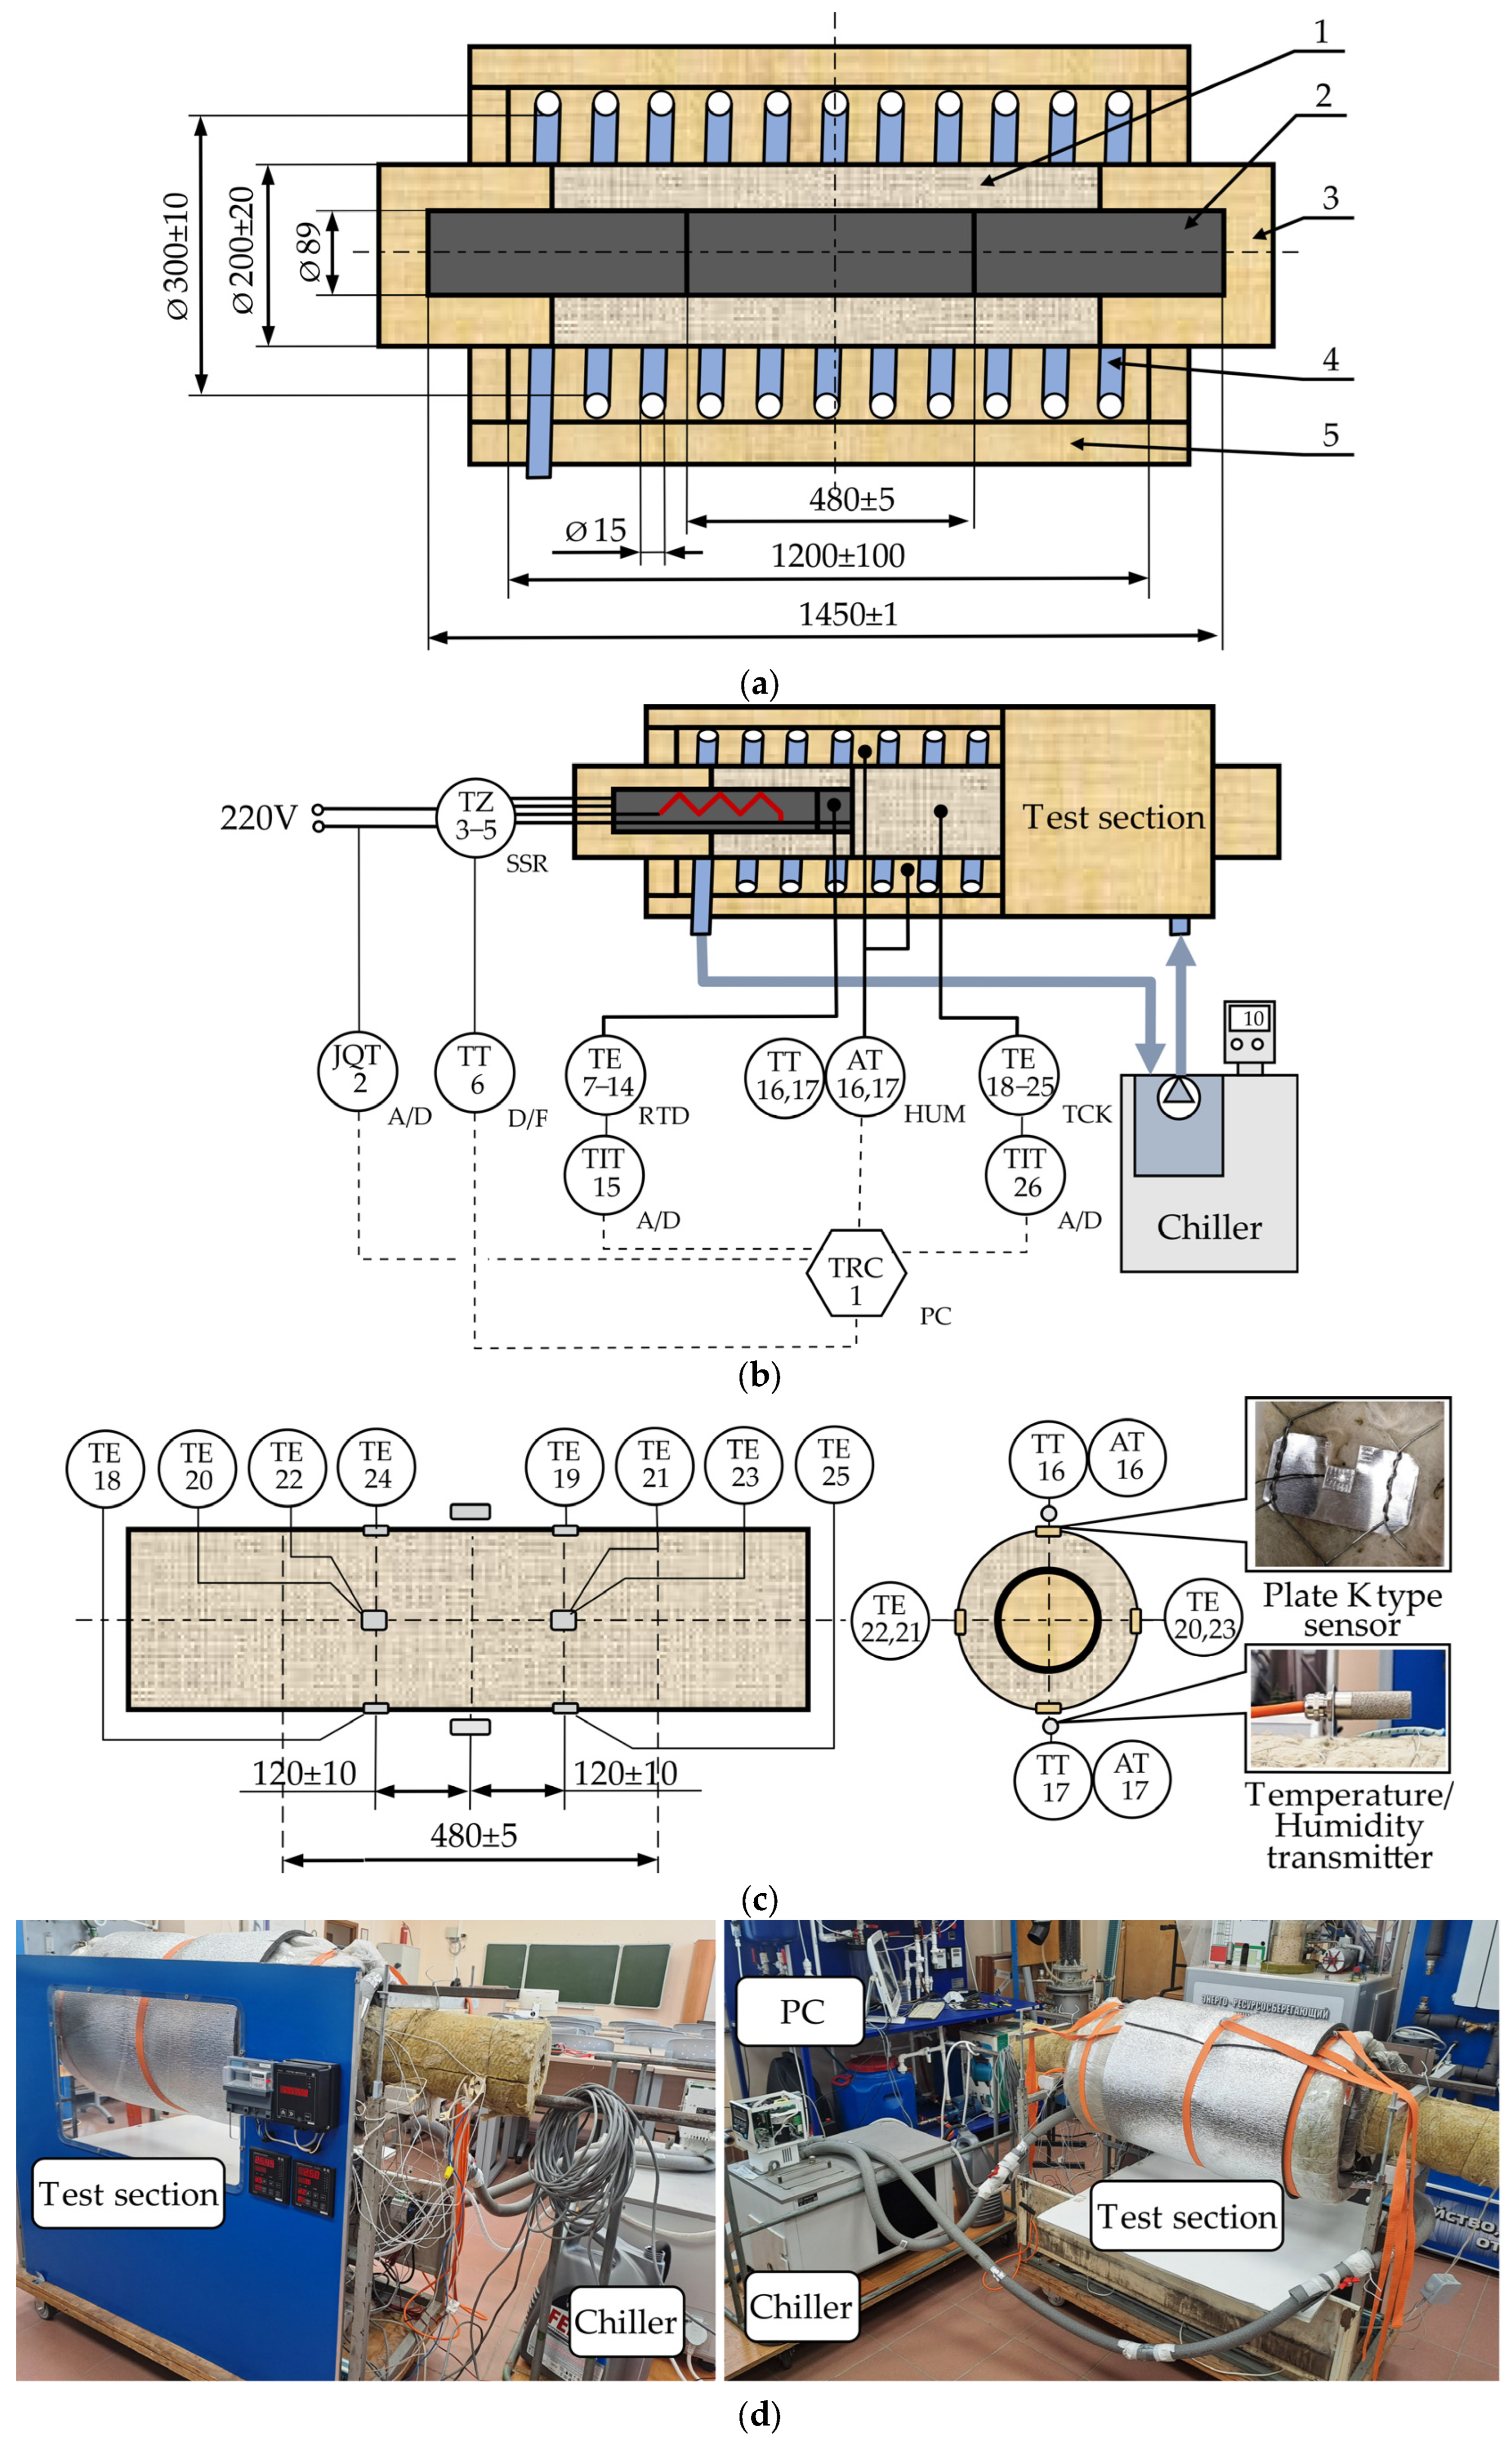
Figure 1. The experimental setup: (a) The section view of the test section (1—the tested sample; 2—“hot pipe”; 3—guard zone insulations; 4—the heating/cooling coil; 5—an outer flexible insulated cover); (b) the instrumentation diagram; (c) the arrangement of the sensors on the sample’s outer surface in the working zone; (d) photographs of the front and back views.
Energies 18 06074 g001
Figure 2. The sample preparation: (a) The cut sample; (b) the wrapped sample; (c) the fitted coil.
Energies 18 06074 g002
Figure 3. The fragments of the injection procedure.
Energies 18 06074 g003
Figure 4. Sample A: (a) The general view; (b) the microphotograph of the fiber view; (c) the total amount of shots in 50 g of the tested sample and appearance of shots.
Energies 18 06074 g004
Figure 5. Sample B: (a) The general view; (b) the microphotograph of the fiber view; (c) the total amount of shots in 50 g of the tested sample and appearance of shots.
Energies 18 06074 g005
Figure 6. Examples of raw data of Sample A tests with the low temperature: (ac) the moisture contents are 0, 6, 12%, respectively (1—the thermal conductivity (λ); 2—the inner temperature (tin); 3—the outer temperature (tout); 4, 5—the average temperature and humidity of the air in the chamber, respectively; 6, 7—residuals of the temperatures (humidity) and the thermal conduction, respectively).
Energies 18 06074 g006aEnergies 18 06074 g006b
Figure 7. Examples of raw data of Sample A tests in the high-temperature regime: (ac) the moisture contents are 0, 6, 12%, respectively (1—the thermal conductivity (λ); 2—the inner temperature (tin); 3—the outer temperature (tout); 4, 5—the average temperature and humidity of the air in the chamber, respectively; 6, 7—residuals of the temperatures (humidity) and the thermal conduction, respectively).
Energies 18 06074 g007aEnergies 18 06074 g007b
Figure 8. Thermal conductivity of Sample A with various moisture contents: 1, 2—the average temperature is about 20 °C and 85 °C, respectively.
Energies 18 06074 g008
Figure 9. Examples of raw data of Sample B tests with the low temperature: (ac) the moisture contents are 0, 6, 12%, respectively (1—the thermal conductivity (λ); 2—the inner temperature (tin); 3—the outer temperature (tout); 4, 5—the average temperature and humidity of the air in the chamber, respectively; 6, 7—residuals of the temperatures (humidity) and the thermal conduction, respectively).
Energies 18 06074 g009aEnergies 18 06074 g009b
Figure 10. Examples of raw data of Sample B tests in the high-temperature regime: (ac) the moisture contents are 0, 6, 12%, respectively (1—the thermal conductivity (λ); 2—the inner temperature (tin); 3—the outer temperature (tout); 4, 5—the average temperature and humidity of the air in the chamber, respectively; 6, 7—residuals of the temperatures (humidity) and the thermal conduction, respectively).
Energies 18 06074 g010
Figure 11. Thermal conductivity of Sample B with various moisture contents: 1, 2—the average temperature is about 20 °C and 85 °C, respectively.
Energies 18 06074 g011
Figure 12. Thermal conductivity of the Samples with various moisture contents: (a), (b) the average temperature is about 20 °C and 85 °C, respectively.
Energies 18 06074 g012
Table 1. Mineral wool properties of selected samples (confidence probability is 0.95).
PropertySample ASample B
Density, kg∙m−389 ± 679 ± 5
Nominal thickness, mm80 ± 560 ± 4
Average fibers’ diameter, μm9 ± 57 ± 4
Max fiber diameter, μm3421
Min fiber diameter, μm12
Shots percentage, %22.0 ± 2.46.7 ± 1.1
Water absorption, %944 ± 53211 ± 31
Table 2. Properties of selected samples (confidence probability is 0.95).
PropertySample ASample B
Mean out diameter (Dout), mm208 ± 6185 ± 2
Mean thickness, mm60 ± 348 ± 1
Compaction factor1.34 ± 0.101.25 ± 0.09
Actual density, kg∙m−3102 ± 795 ± 7
Coefficient of variance of thicknesses’ distribution, %5.14.6
The average drainage water percentage, %1.2 ± 0.72.3 ± 0.3
Actual average values of moisture content (w), %5.9 ± 0.2
11.8 ± 0.3
5.8 ± 0.3
11.6 ± 0.5
Table 3. Coefficients for the linear correlation equations.
SampleAverage TemperatureSlopeInterceptDetermination Coefficient R2
A200.00050.03590.996
A850.00290.04130.991
B200.00580.03940.9997
B850.00120.03580.9954
Disclaimer/Publisher’s Note: The statements, opinions and data contained in all publications are solely those of the individual author(s) and contributor(s) and not of MDPI and/or the editor(s). MDPI and/or the editor(s) disclaim responsibility for any injury to people or property resulting from any ideas, methods, instructions or products referred to in the content.