Article

Investigation of the Sealing and Mechanical Stability of Cap Rock for Offshore CO2 Sequestration in Saline Aquifers

1
State Key Laboratory of Coal Mine Disaster Dynamics and Control, Chongqing University, Chongqing 400044, China
2
School of Resources and Safety Engineering, Chongqing University, Chongqing 400044, China
3
State Key Laboratory of Earthquake Dynamics, Institute of Geology, China Earthquake Administration, Beijing 100029, China
*
Author to whom correspondence should be addressed.
Energies 2025, 18(22), 6033; https://doi.org/10.3390/en18226033
Submission received: 14 October 2025 / Revised: 14 November 2025 / Accepted: 14 November 2025 / Published: 19 November 2025
(This article belongs to the Section B3: Carbon Emission and Utilization)

Abstract

Offshore saline aquifer CO2 sequestration relies heavily on the sealing integrity and mechanical stability of mudstone caprocks, yet their responses to supercritical CO2 (scCO2) remain inadequately constrained for marine geological settings. Here, we integrate permeability measurements, scCO2 breakthrough pressure tests, and uniaxial mechanical experiments on natural and reconstituted core samples from the Pearl River Mouth Basin to address this gap. Our results reveal extreme vertical permeability heterogeneity (spanning 10−6 to 10−1 mD) within Yuehai and Hanjiang Formation caprocks. Critically, permeability and scCO2 breakthrough pressure are decoupled: breakthrough pressure is controlled by maximum pore-throat radius, while breakthrough time depends on post-breakthrough pore network topology. ScCO2-brine-rock interactions induce pronounced geomechanical weakening, with uniaxial compressive strength decreasing by up to 71.7% and the elastic modulus reducing, while a substantial increase in Poisson’s ratio signifies a fundamental transition from brittle to ductile behavior. We have developed a comprehensive framework to delineate potential CO2 migration pathways. Hanjiang Formation Section 1 (represented by sample A3) exhibits exceptional sealing properties, characterized by ultra-low permeability (2.41 × 10⁻⁶ mD), high breakthrough pressure (>16 MPa), and extended breakthrough time (>30 min). These attributes suggest that CO2 injection into the target saline aquifer at depths between 1470 and 1500 m, situated beneath this interval, can be deemed secure with a high potential for effective long-term containment. These findings provide essential insights for optimizing offshore CO2 sequestration site selection and injection pressure management to ensure long-term containment security.

1. Introduction

As a critical approach to CO2 geological sequestration, the process of CO2 sequestration in saline aquifers involves injecting captured CO2 into subsurface saline formations. This method relies on the natural pressure and sealing capacity of the overlying caprock and strata to ensure the long-term containment of CO2. As a critical geological unit in CO2 sequestration projects within saline aquifers, the mechanical stability of the caprock is directly linked to the safety and efficacy of the sequestration process [1]. If the mechanical stability of the caprock is inadequate, it may fracture or deform under external stress, potentially leading to CO2 leakage and resulting in a series of environmental and safety concerns [2]. The sealing capability of the caprock is influenced by various factors, including the pore structure and morphology of the rock, as well as its porosity and permeability characteristics. Following the breakthrough of supercritical CO2 into the caprock, alterations in the pore structure and mechanical properties of the caprock are inevitable [3], consequently impacting its sealing effectiveness. Alterations in mechanical properties render the caprock increasingly prone to deformation, fracturing, or even collapse under the pressure exerted by overlying strata. Consequently, conducting comprehensive research on the sealing capacity and mechanical stability of the caprock is of paramount importance [4].
Permeability is a critical parameter for evaluating the capacity of fluids to traverse porous media. In the context of mudstone caprocks, permeability plays a decisive role in determining the diffusion and migration rates of fluids, such as carbon dioxide, within the caprock. Lower permeability effectively mitigates fluid leakage through the caprock, thereby enhancing its sealing performance [4,5]. The permeability of caprock is influenced by a multitude of factors. In cases where the caprock exhibits a strong adsorption capacity for CO2, changes in CO2 content predominantly govern the permeability variations of ultra-low permeability samples through CO2 adsorption mechanisms [5]. Moreover, variations in the dimensions, morphology, connectivity, and mineral composition of pores within the caprock will result in differing permeabilities [6]. In addition, in the geological setting of the caprock, the flow rate of formation fluids may fluctuate due to causes such as tectonic movements and injection and production activities. Variations in flow rate may induce the migration of particles within the caprock pores, resulting in pore obstruction or alterations in the caprock’s original structure, thus affecting permeability [7]. The pore volume of the mudstone caprock is controlled by the dissolution of minerals such as feldspar, plagioclase, and chlorite, with less precipitation of secondary minerals like kaolinite, amorphous silica, and gibbsite [8]. The damage status, quantity, and orientation of natural cracks in cores significantly influence permeability [9]. In summary, the permeability of the caprock varies under different conditions, and changes in permeability can significantly influence the breakthrough pressure of the caprock. Therefore, conducting in-depth research on the permeability of the caprock is essential for accurately assessing its sealing capability.
Breakthrough pressure serves as a critical measure for evaluating the sealing capacity of caprocks, representing their ability to impede fluid migration under specific conditions. This parameter is intrinsically linked to factors such as the permeability of the caprock [3]. From the standpoint of mineral composition and pore structure, the characteristics of the critical connected pore network significantly influence the breakthrough pressure [6]. Furthermore, variations in the pore structure of mudstone under different effective pressures significantly impact the relationship between permeability and breakthrough pressure [10]. To further investigate the mechanism by which pore structure influences breakthrough pressure, Gao et al. [11] designed a CO2 breakthrough pressure measurement device utilizing the pulse attenuation method. The study revealed that breakthrough pressure is influenced by the mineral composition and consolidation degree of the rock, with factors such as depth and diagenesis significantly affecting its magnitude. Additionally, external conditions, including temperature, pressure, and fluid properties, also impact breakthrough pressure [12]. Under the high-temperature and high-pressure conditions of geological formations, organic-rich mudstone caprocks can generate hydrocarbons, leading to alterations in pore structure and pore volume, thereby influencing breakthrough pressure [13]. In summary, breakthrough pressure and permeability are intricately interrelated. Therefore, a comprehensive investigation of both permeability and breakthrough pressure is essential for accurately evaluating the sealing capacity of the caprock.
Currently, research on the effects of CO2-water-rock interactions on rocks primarily focuses on lithologies such as shale, coal, and sandstone [14,15]. These studies predominantly investigate microscopic mechanisms and changes in chemical composition [16]. Limited research has been conducted on the mechanical properties of mudstone following supercritical CO2-water-rock interactions [17]. Su et al. [18] utilized bituminous coal samples from Datong, Shanxi, China, and observed that the reduction in uniaxial compressive strength and elastic modulus was more pronounced in cyclically saturated samples compared to continuously saturated ones. After 13 days of cyclic saturation, the uniaxial compressive strength decreased by 61.05%, whereas after 13 days of continuous saturation, it decreased by 47.17%. Supercritical CO2 treatment alters the creep characteristics of caprock mudstone, leading to a reduction in both its long-term strength and ultimate compressive strength [19]. The aforementioned studies primarily concentrate on the mechanisms by which CO2 impacts rocks. In contrast, Zhang et al. [20] conducted a comprehensive analysis of the combined effects of water and CO2 saturation on the mechanical properties of coal. The findings indicated that the adsorption of CO2 and water diminished the strength of coal by 22.91% and the elastic modulus by 19.06%. The compressive strength of sandstone samples soaked with CO2-NaCl solution was 7~15% inferior to that of dry samples under the same testing conditions [21]. Akono et al. [22] conducted macroscopic creep studies on CO2-treated sandstone, revealing that the macroscopic creep modulus fluctuated with microporosity and the relative proportions of quartz and feldspar. The linear elastic modulus of sandstone subjected to CO2-water coupling was markedly inferior to that of sandstone treated just with CO2 [23].
Furthermore, it is crucial to examine the elements impacting rock mechanical impacts from a microscopic viewpoint. A comprehensive examination of the mechanisms, processes, and stages of rock mineral transformation during CO2 geological sequestration is crucial for elucidating the factors influencing alterations in mechanical characteristics. Research indicates that the injection of supercritical CO2 can alter the pore structure, mineral composition, and micromorphology of mudstone, consequently impacting its mechanical characteristics [16,24,25,26,27,28,29]. These alterations may encompass an augmentation in pore volume, a modification in specific surface area, and mineral dissolution. Zhou et al. [30] observed that supercritical CO2-water-rock interactions can promote the expansion of primary pores or the formation of new pore fractures, resulting in stress concentration. This process may further lead to the deterioration of rock mechanical properties, such as reductions in compressive strength and elastic modulus. The CO2-water-rock reaction facilitates the dissolution of clay minerals in mudstone while precipitating feldspar minerals, with carbonate content remaining relatively stable [16]. Notably, the dissolution of minerals during CO2-water-rock interactions induces the formation of microcracks and intricate fracture networks within the rock mass, further driving crack propagation and leading to rock weakening [31]. Consequently, conducting mechanical property tests on mudstone before and after exposure to supercritical CO2 provides a robust scientific basis for accurately assessing the sealing performance of caprocks [32].
While the aforementioned studies highlight the importance of individual factors like permeability, breakthrough pressure, and mechanical stability, a critical knowledge gap exists in the integrated assessment of these properties for offshore mudstone caprocks under realistic sequestration conditions. Most research has focused on onshore analogues or different lithologies (e.g., shale, sandstone). The unique diagenetic history and hydrochemical environment influenced by seawater may alter the reactivity of marine caprock minerals, but the investigation of initial sealing capacity is rarely coupled with subsequent chemo-mechanical degradation. The recent launch of China’s first offshore CO2 sequestration project in the Pearl River Mouth Basin provides an urgent and specific motivation to address this gap. The unique marine depositional environment and diagenetic history of these caprocks necessitate a site-specific investigation. Therefore, this study aims to provide a comprehensive evaluation of the caprock integrity in this basin. The primary objectives are as follows: (a) To systematically characterize the heterogeneity in key sealing properties (permeability and scCO2 breakthrough pressure) of the target Yuehai and Hanjiang Formation caprocks. (b) To quantify the extent of geomechanical weakening (changes in UCS, elastic modulus, and Poisson’s ratio) induced by scCO2-brine-rock interactions. (c) To develop an integrated risk assessment framework based on these experimental results to evaluate the long-term containment security and identify potential CO2 migration pathways, thereby providing a critical scientific basis for safe and effective offshore CO2 sequestration.

2. Material and Methods

2.1. Sample Preparation

The well core sample analyzed in this study was obtained from Well J-6, situated in an offshore oilfield within the Pearl River Mouth Basin (Figure 1a). The mudstone samples were carefully prepared using a wire-cutting technique and subsequently preserved in a dedicated core storage box to maintain their integrity for further analysis.
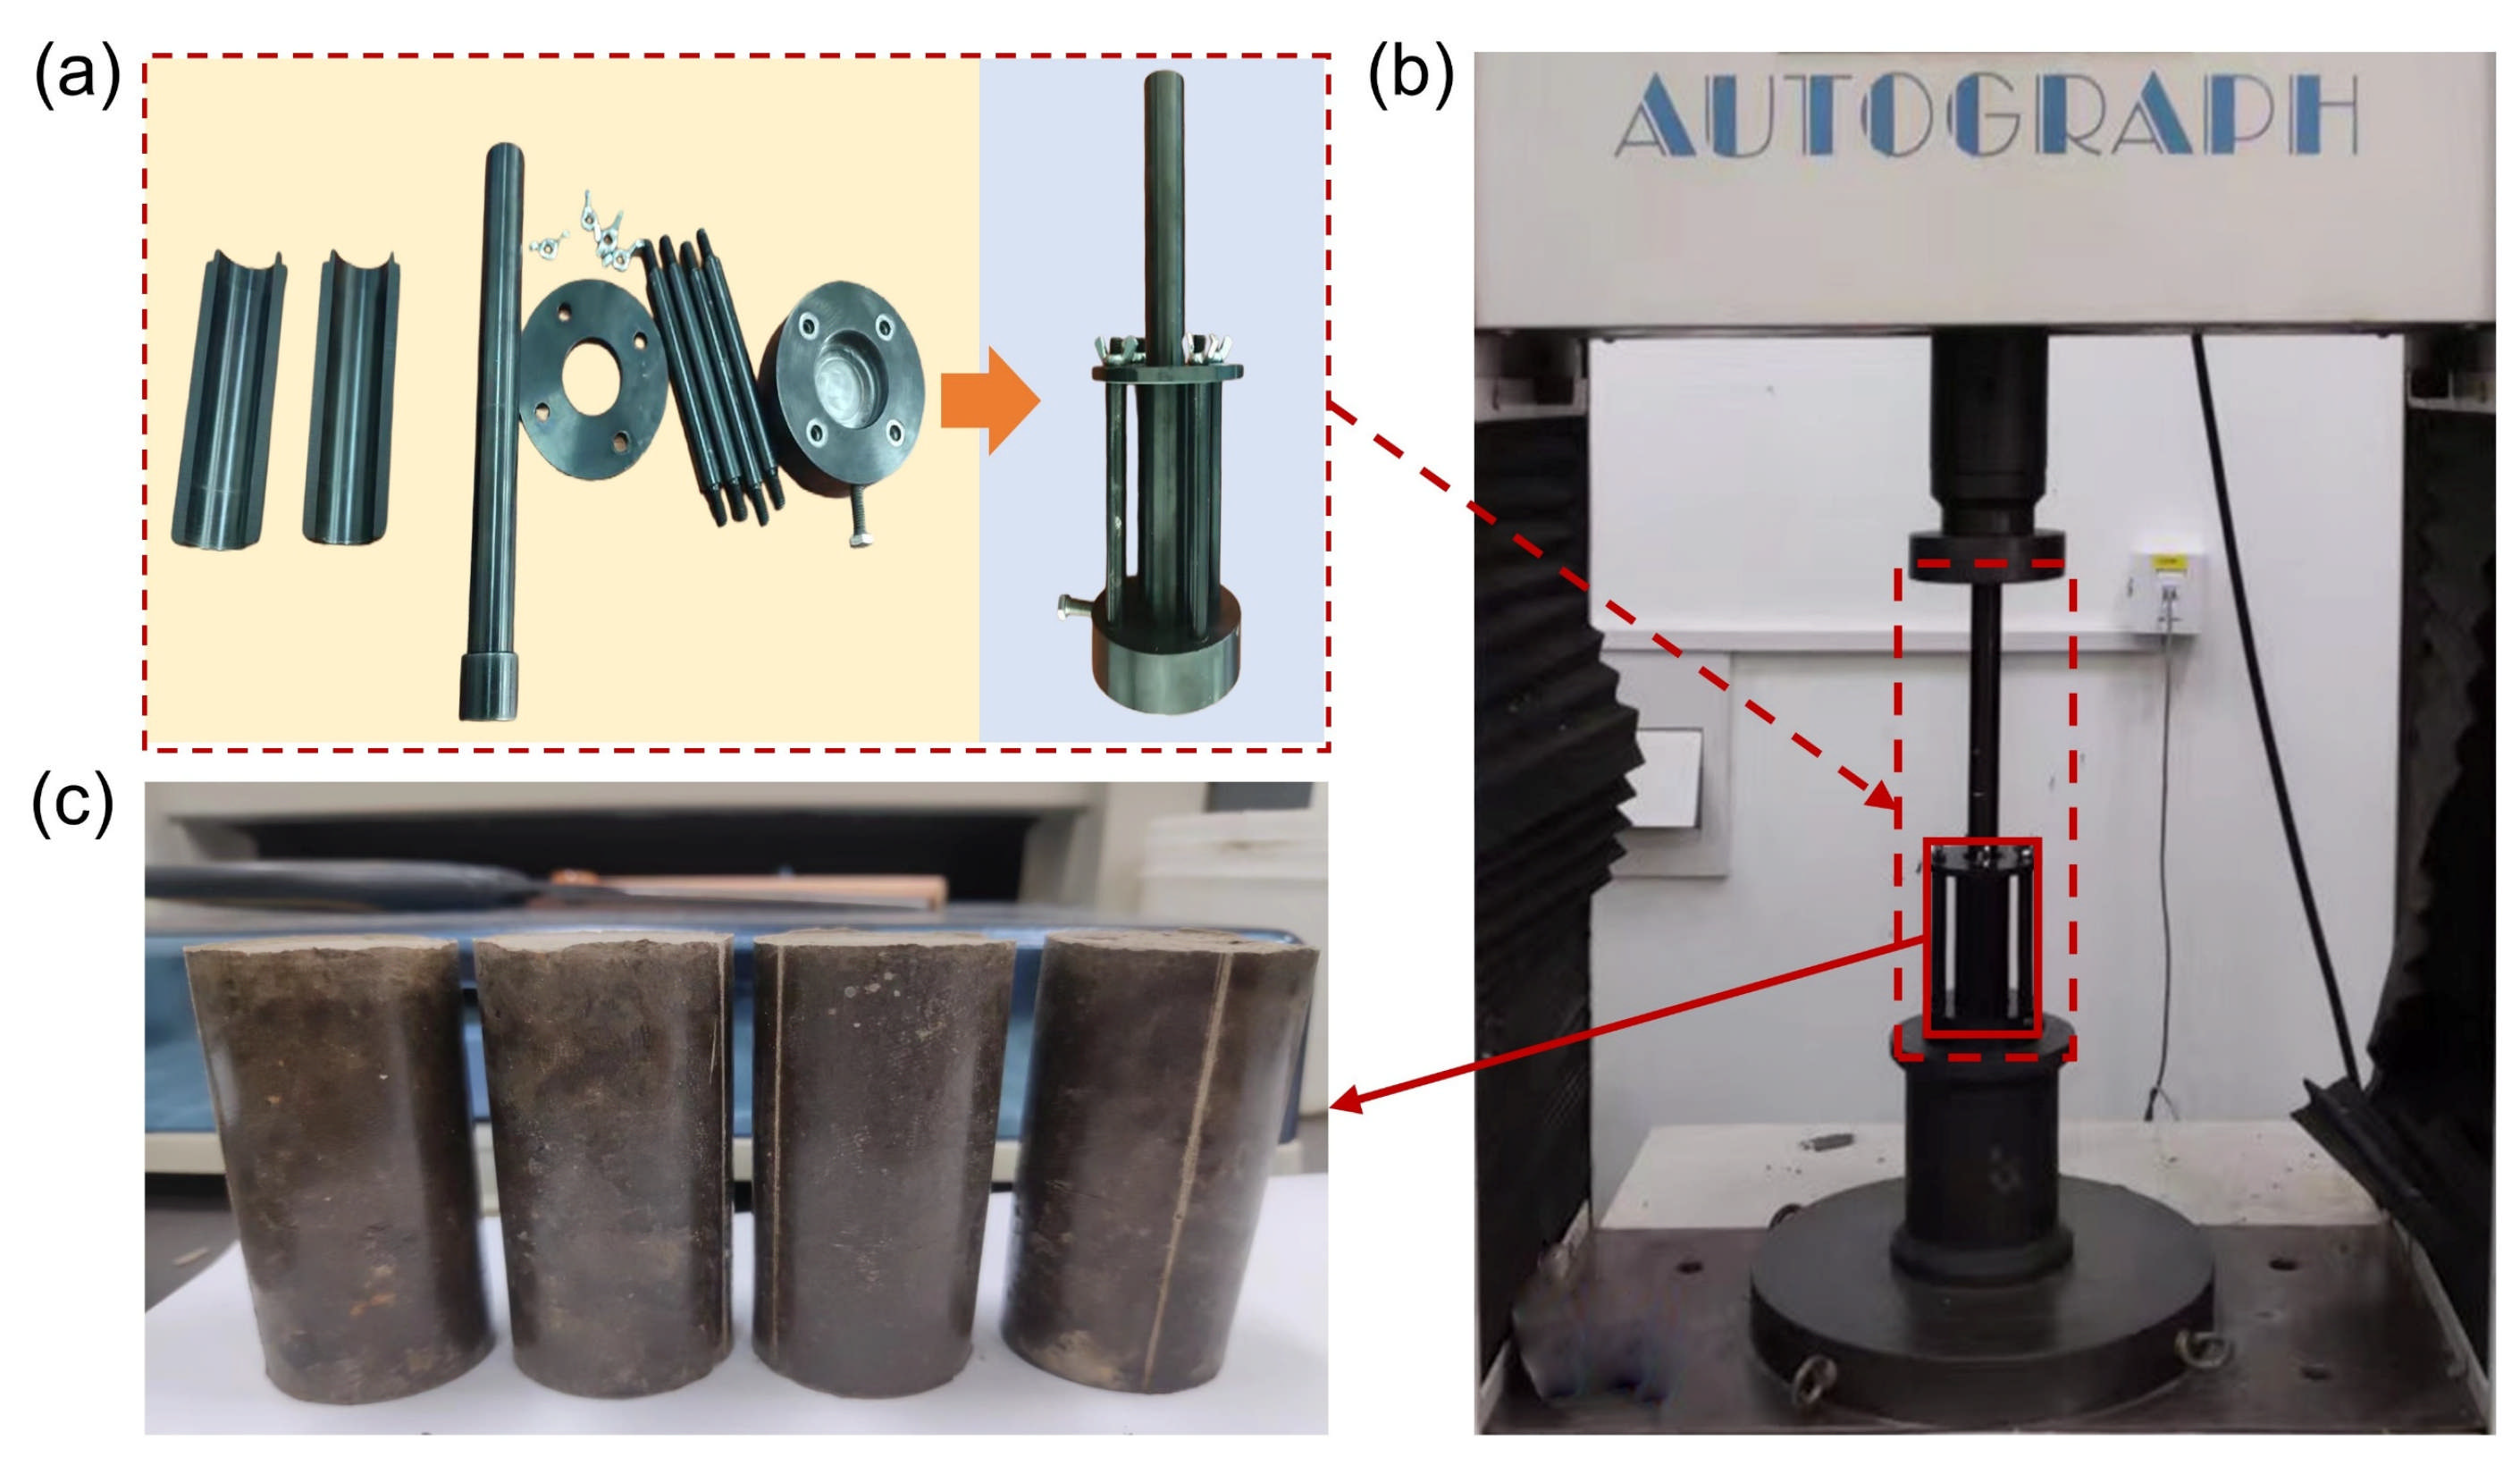
To establish a homogeneous and standardized benchmark for investigating the intrinsic constitutive behavior and hydro-mechanical sensitivity of mudstone, The retrieved mud was segregated by location into individual beakers and subjected to repeated cycles of soaking, stirring, and rinsing with purified water until the supernatant became clear, confirming the complete removal of drilling fluid residues. The purified mud was then dried. For each sampling location (Figure 1b), the requisite mass of mud for fabricating ∅25 × 50 mm samples were determined based on the in situ density, sampling depth, and target porosity of the mudstone. As illustrated in Figure 2, the reconstituted cores were formed using a hydraulic press and a precision mold, with each sample maintained under constant pressure for 20 min to ensure structural integrity and dimensional conformity. This process mitigates the effects of natural heterogeneity and ensures replicable sample geometry, thereby enhancing the accuracy and reliability of experimental data.
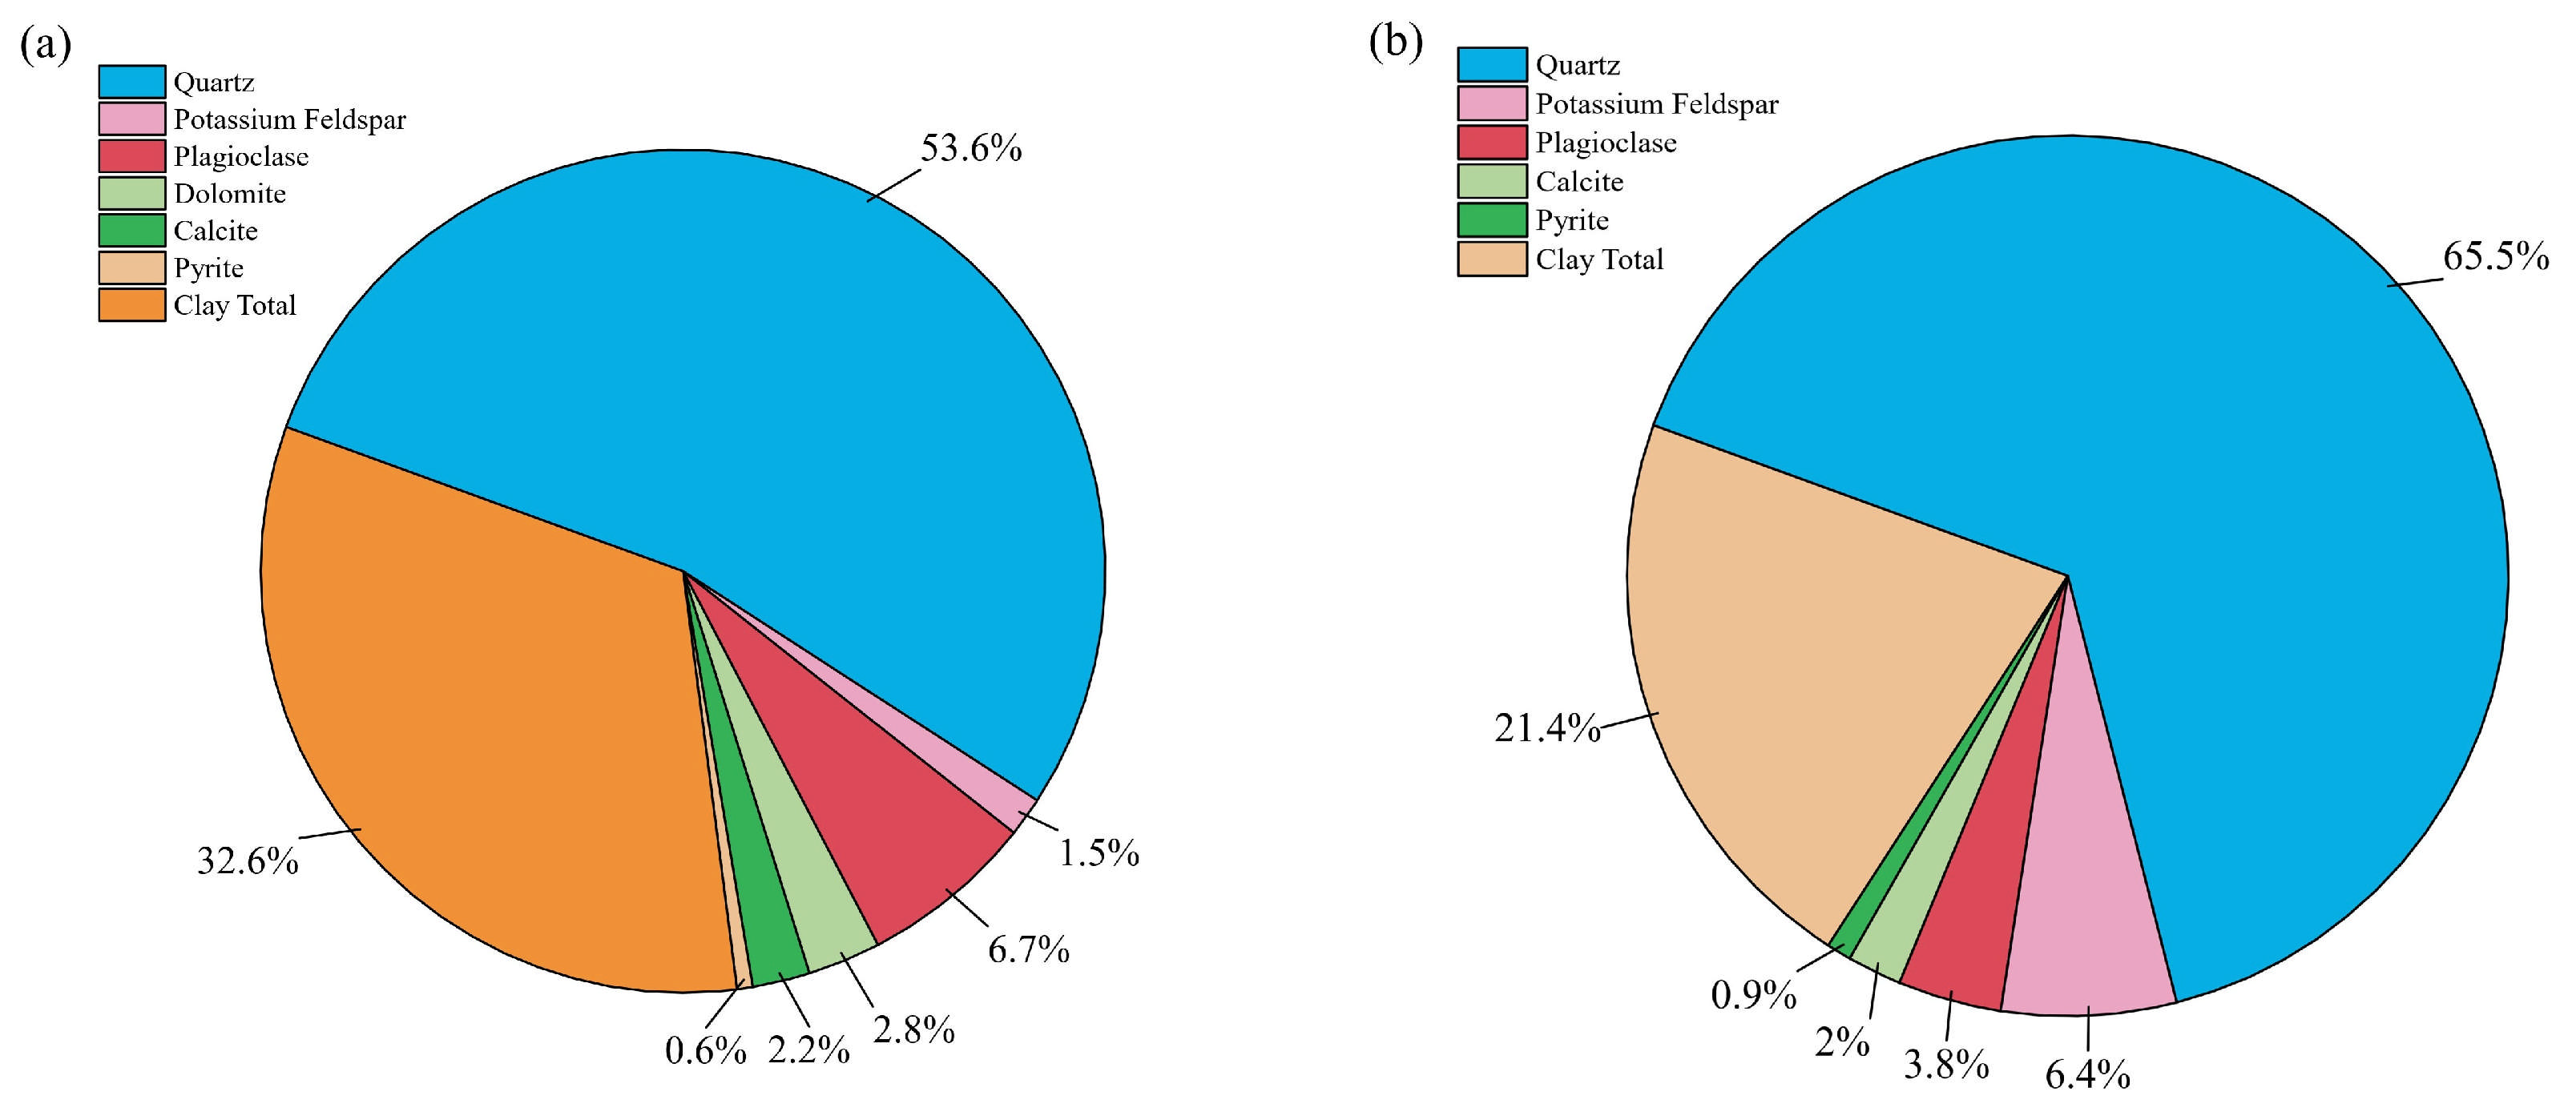
We have conducted X-ray Diffraction (XRD) analysis on representative core samples (A1 and B1). The XRD analysis confirms that both the natural (A1) and reconstituted (B1) cores are composed of the same suite of minerals: quartz, feldspars, carbonates, and clays (Figure 3). They share this fundamental mineralogical composition, ensuring that the chemical reaction mechanisms observed are directly relevant to the natural system. The mechanical weakening mechanisms we investigate are primarily driven by the chemical reactions between the acidic scCO2-brine solution and these susceptible minerals (especially carbonates and feldspars). Since the fundamental mineralogical composition is identical, the chemical reaction pathways and the resultant alteration in the mineral framework are considered to be representative.

2.2. Experimental Methods

In this study, a series of laboratory experiments were conducted to characterize the properties of reservoir core samples from an offshore oilfield in the Pearl River Mouth Basin. Permeability measurements were performed on intact core specimens retrieved from multiple depths of Well J-6. Supercritical CO2 breakthrough pressure tests were carried out on reconstituted core samples obtained from Wells J-1, J-2, and J-5 at varying depths. Furthermore, the uniaxial mechanical properties of mudstone samples were evaluated after saturation with supercritical CO2. The detailed experimental program is summarized in Table 1.

2.2.1. Permeability Measurement of Well Core Samples

Permeability measurements were conducted utilizing an ultra-low permeability measurement apparatus. The system comprises a confining pressure unit, a pore pressure unit, a core holder, an intermediate container, and a data acquisition and processing module, as illustrated in Figure 4. The equipment is capable of applying confining pressures up to 200 MPa and pore pressures up to 40 MPa, with a permeability measurement range spanning from 10−7 mD to 104 mD.
For each sample set, the pore pressure was assigned according to the hydrostatic pressure at the original reservoir depth, whereas the confining pressure was applied to match the effective overburden stress, as calculated using Equation (1).
P H = 0.0098 ( ρ D ρ w ) × H
where p H : effective overburden pressure, MPa;  ρ D : weighted average density, (g/cm3), ρ D is the weighted average overburden density calculated using Equation (2); ρ w : formation water density, (g/cm3); H: sampling depth, m; the constant 0.0098 is a coefficient that combines the acceleration due to gravity and unit conversion factors.
ρ D = ρ 1 ¯ h 1 + ρ 2 ¯ h 2 + ρ 3 ¯ h 3 + + ρ n ¯ h n h 1 + h 2 + h 3 + + h n
where ρ 1 ¯ , ρ 2 ¯ , ρ 3 ¯ , , ρ n ¯ are the average densities of layers 1, 2, 3, ⋯, n, and h 1 , h 2 , h 3 , , h n are the thicknesses of layers 1 , 2 , 3 , , n .
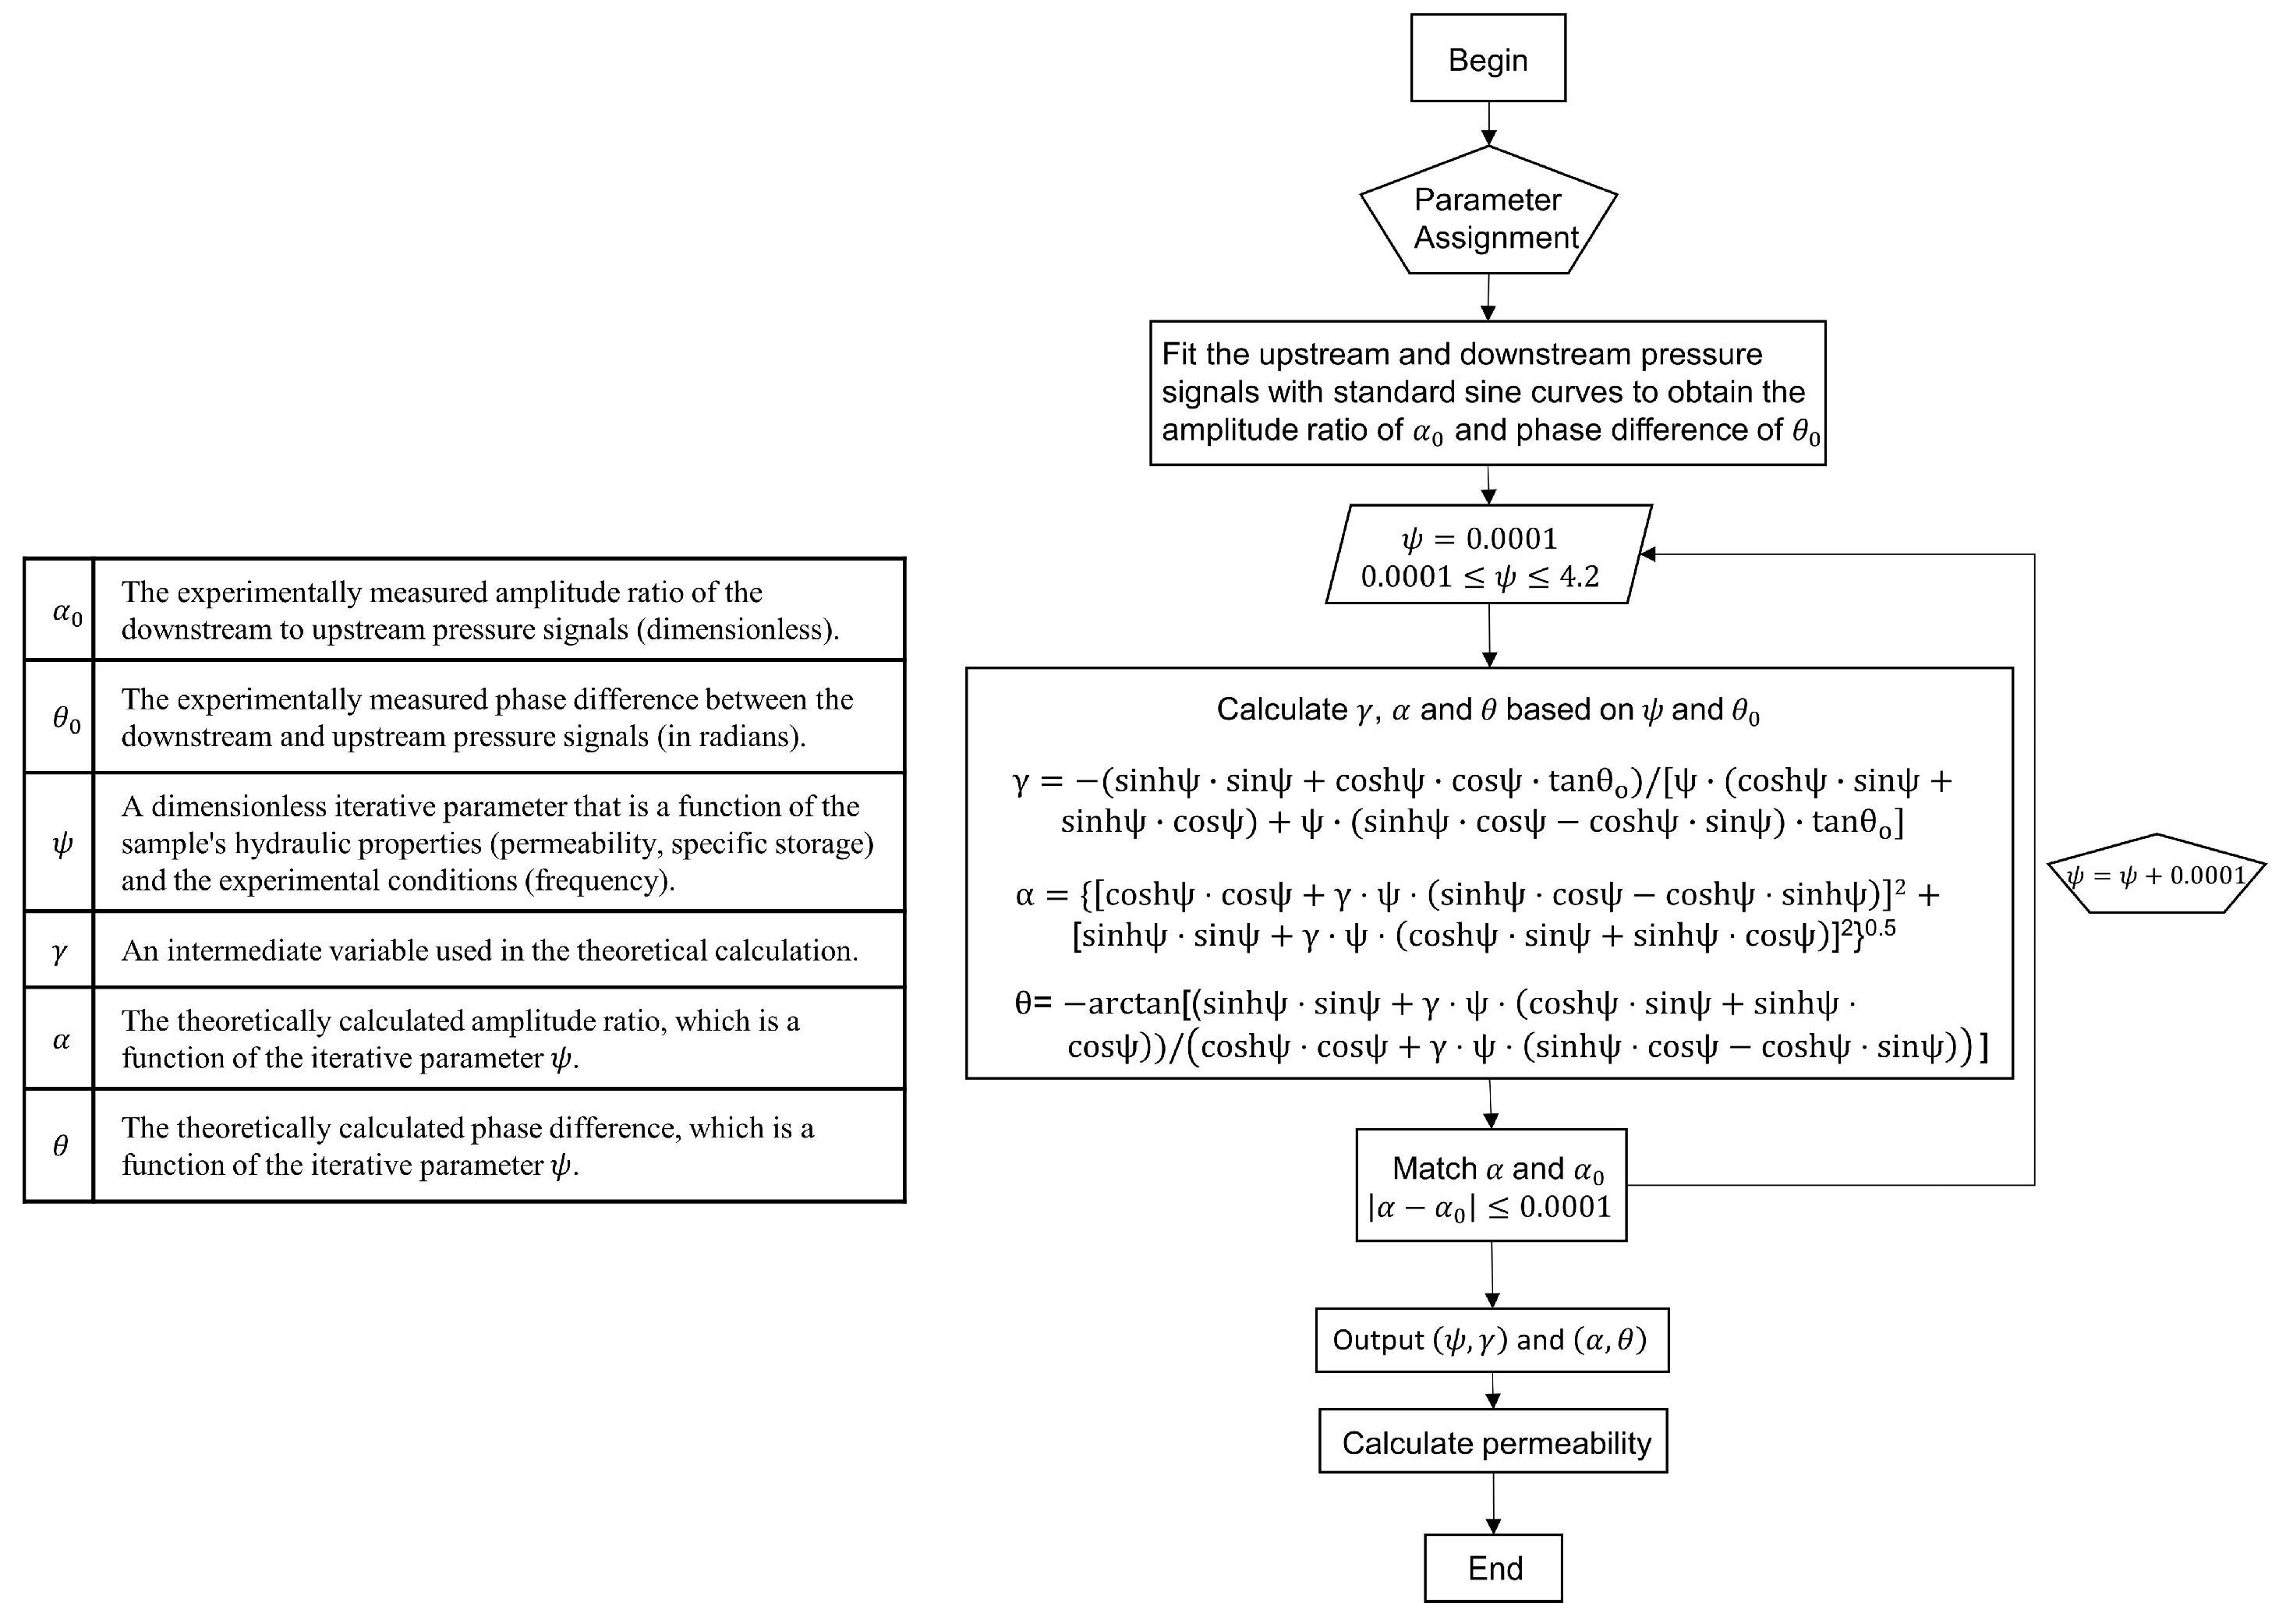
Permeability measurements were performed using an ultra-low permeability system based on the pore pressure oscillation method. In this technique, a defined oscillating pressure typically sinusoidal is applied at the upstream end of the core sample [33].
The detailed computational procedure is presented in Figure 5 [34]. This non-destructive technique preserves the sample’s original microstructure and mechanical properties, making it particularly suitable for subsequent mechanical testing.

2.2.2. Supercritical CO2 Breakthrough Experiment

Prior to testing, a synthetic brine was prepared with a mass ratio of NaCl:CaCl2: MgCl2·6H2O = 7:0.6:0.4 and a mass fraction of 8% for saturating the mudstone samples. The supercritical CO2 breakthrough experiments were conducted in strict accordance with the Chinese energy industry standard “Method for Determination of Rock Gas Breakthrough Pressure” (SY/T 5748-2020 [11]). The experimental setup, provided by the State Key Laboratory of Coal Mine Disaster Dynamics and Control at Chongqing University, consists of a GCTS rock mechanics testing system, a high-precision high-pressure plunger pump, and precision pressure transducers.
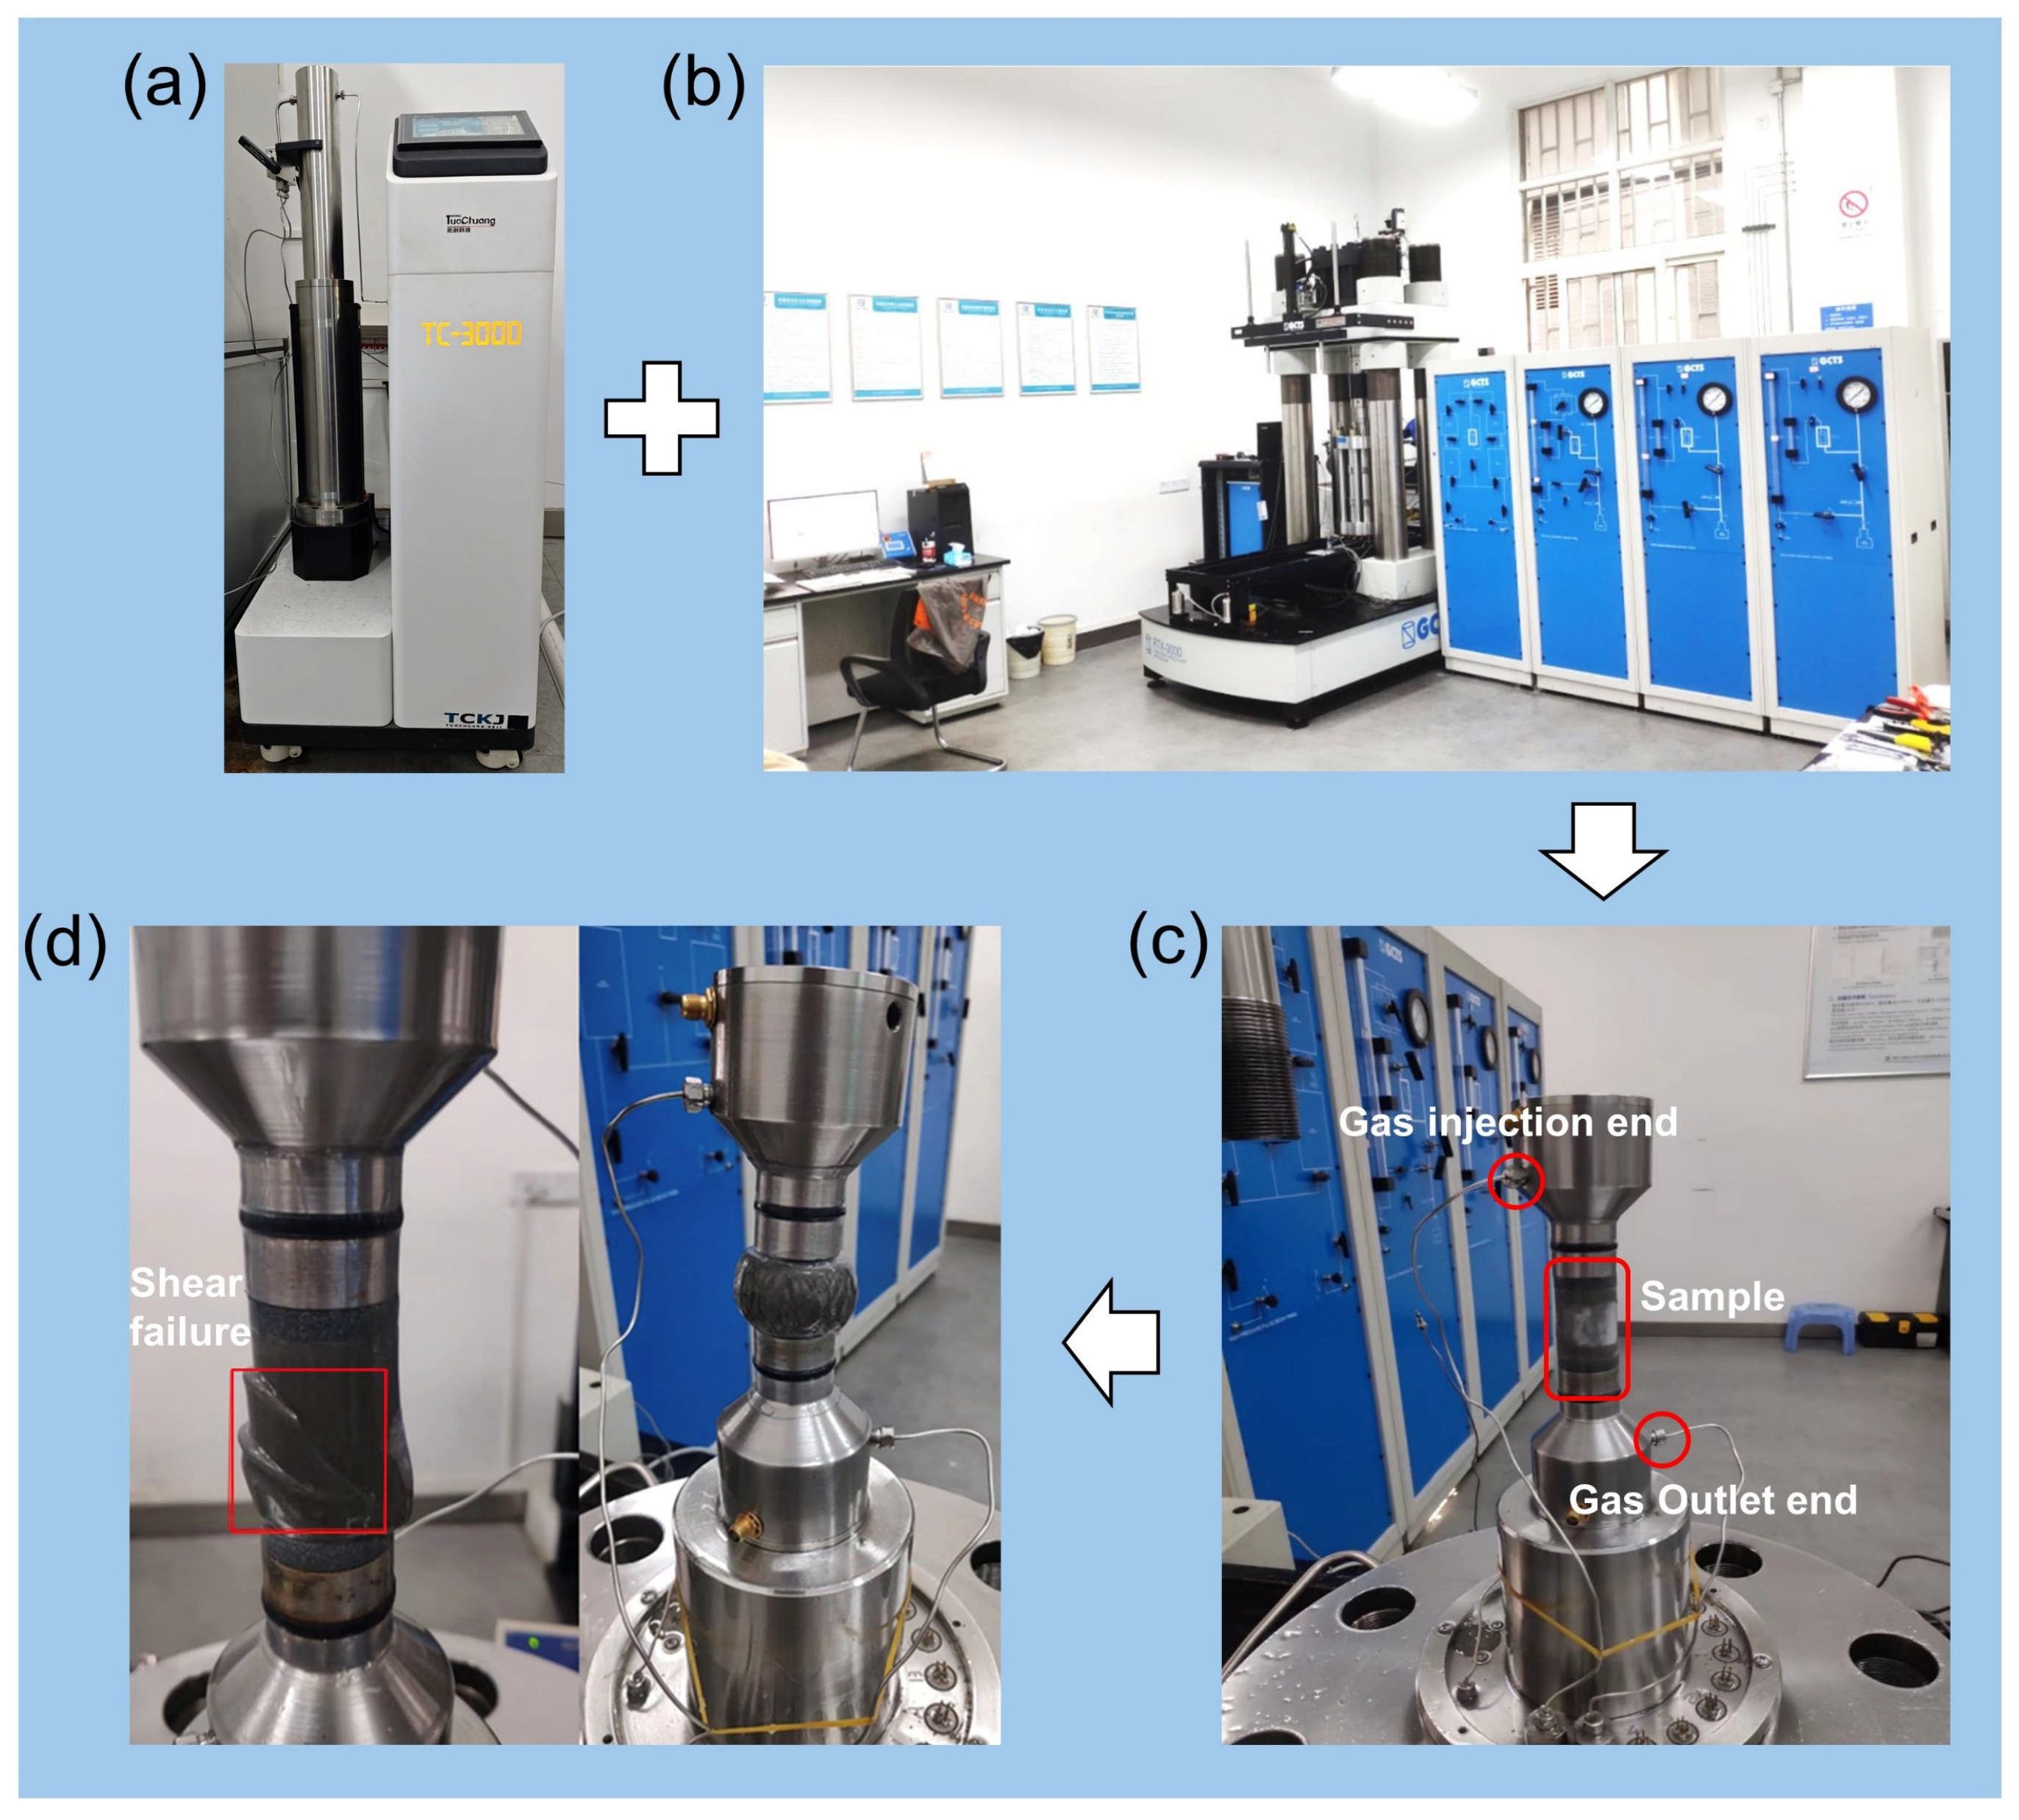
The testing procedure is depicted in Figure 6, and the specific experimental steps are outlined below: (1) The saturated rock sample was equipped with permeable stones at both ends, encapsulated using heat-shrink tubing, and subsequently mounted into the sample chamber. (2) The net confining pressure was applied based on the burial depth of the rock sample and an overburden pressure gradient of 0.024 MPa/m. To achieve the supercritical state of CO2, the temperature was set to 40 °C. Gas injection commenced after the system stabilized at the target temperature for 30 min. (3) During the measurement process, the outlet end of the rock sample was monitored using a flow detection device. The experiment was terminated when a continuous and uniform stream of gas bubbles was observed. The corresponding pressure value at the inlet end was recorded as the gas breakthrough pressure of the sample.

2.2.3. Uniaxial Compressive Strength Test

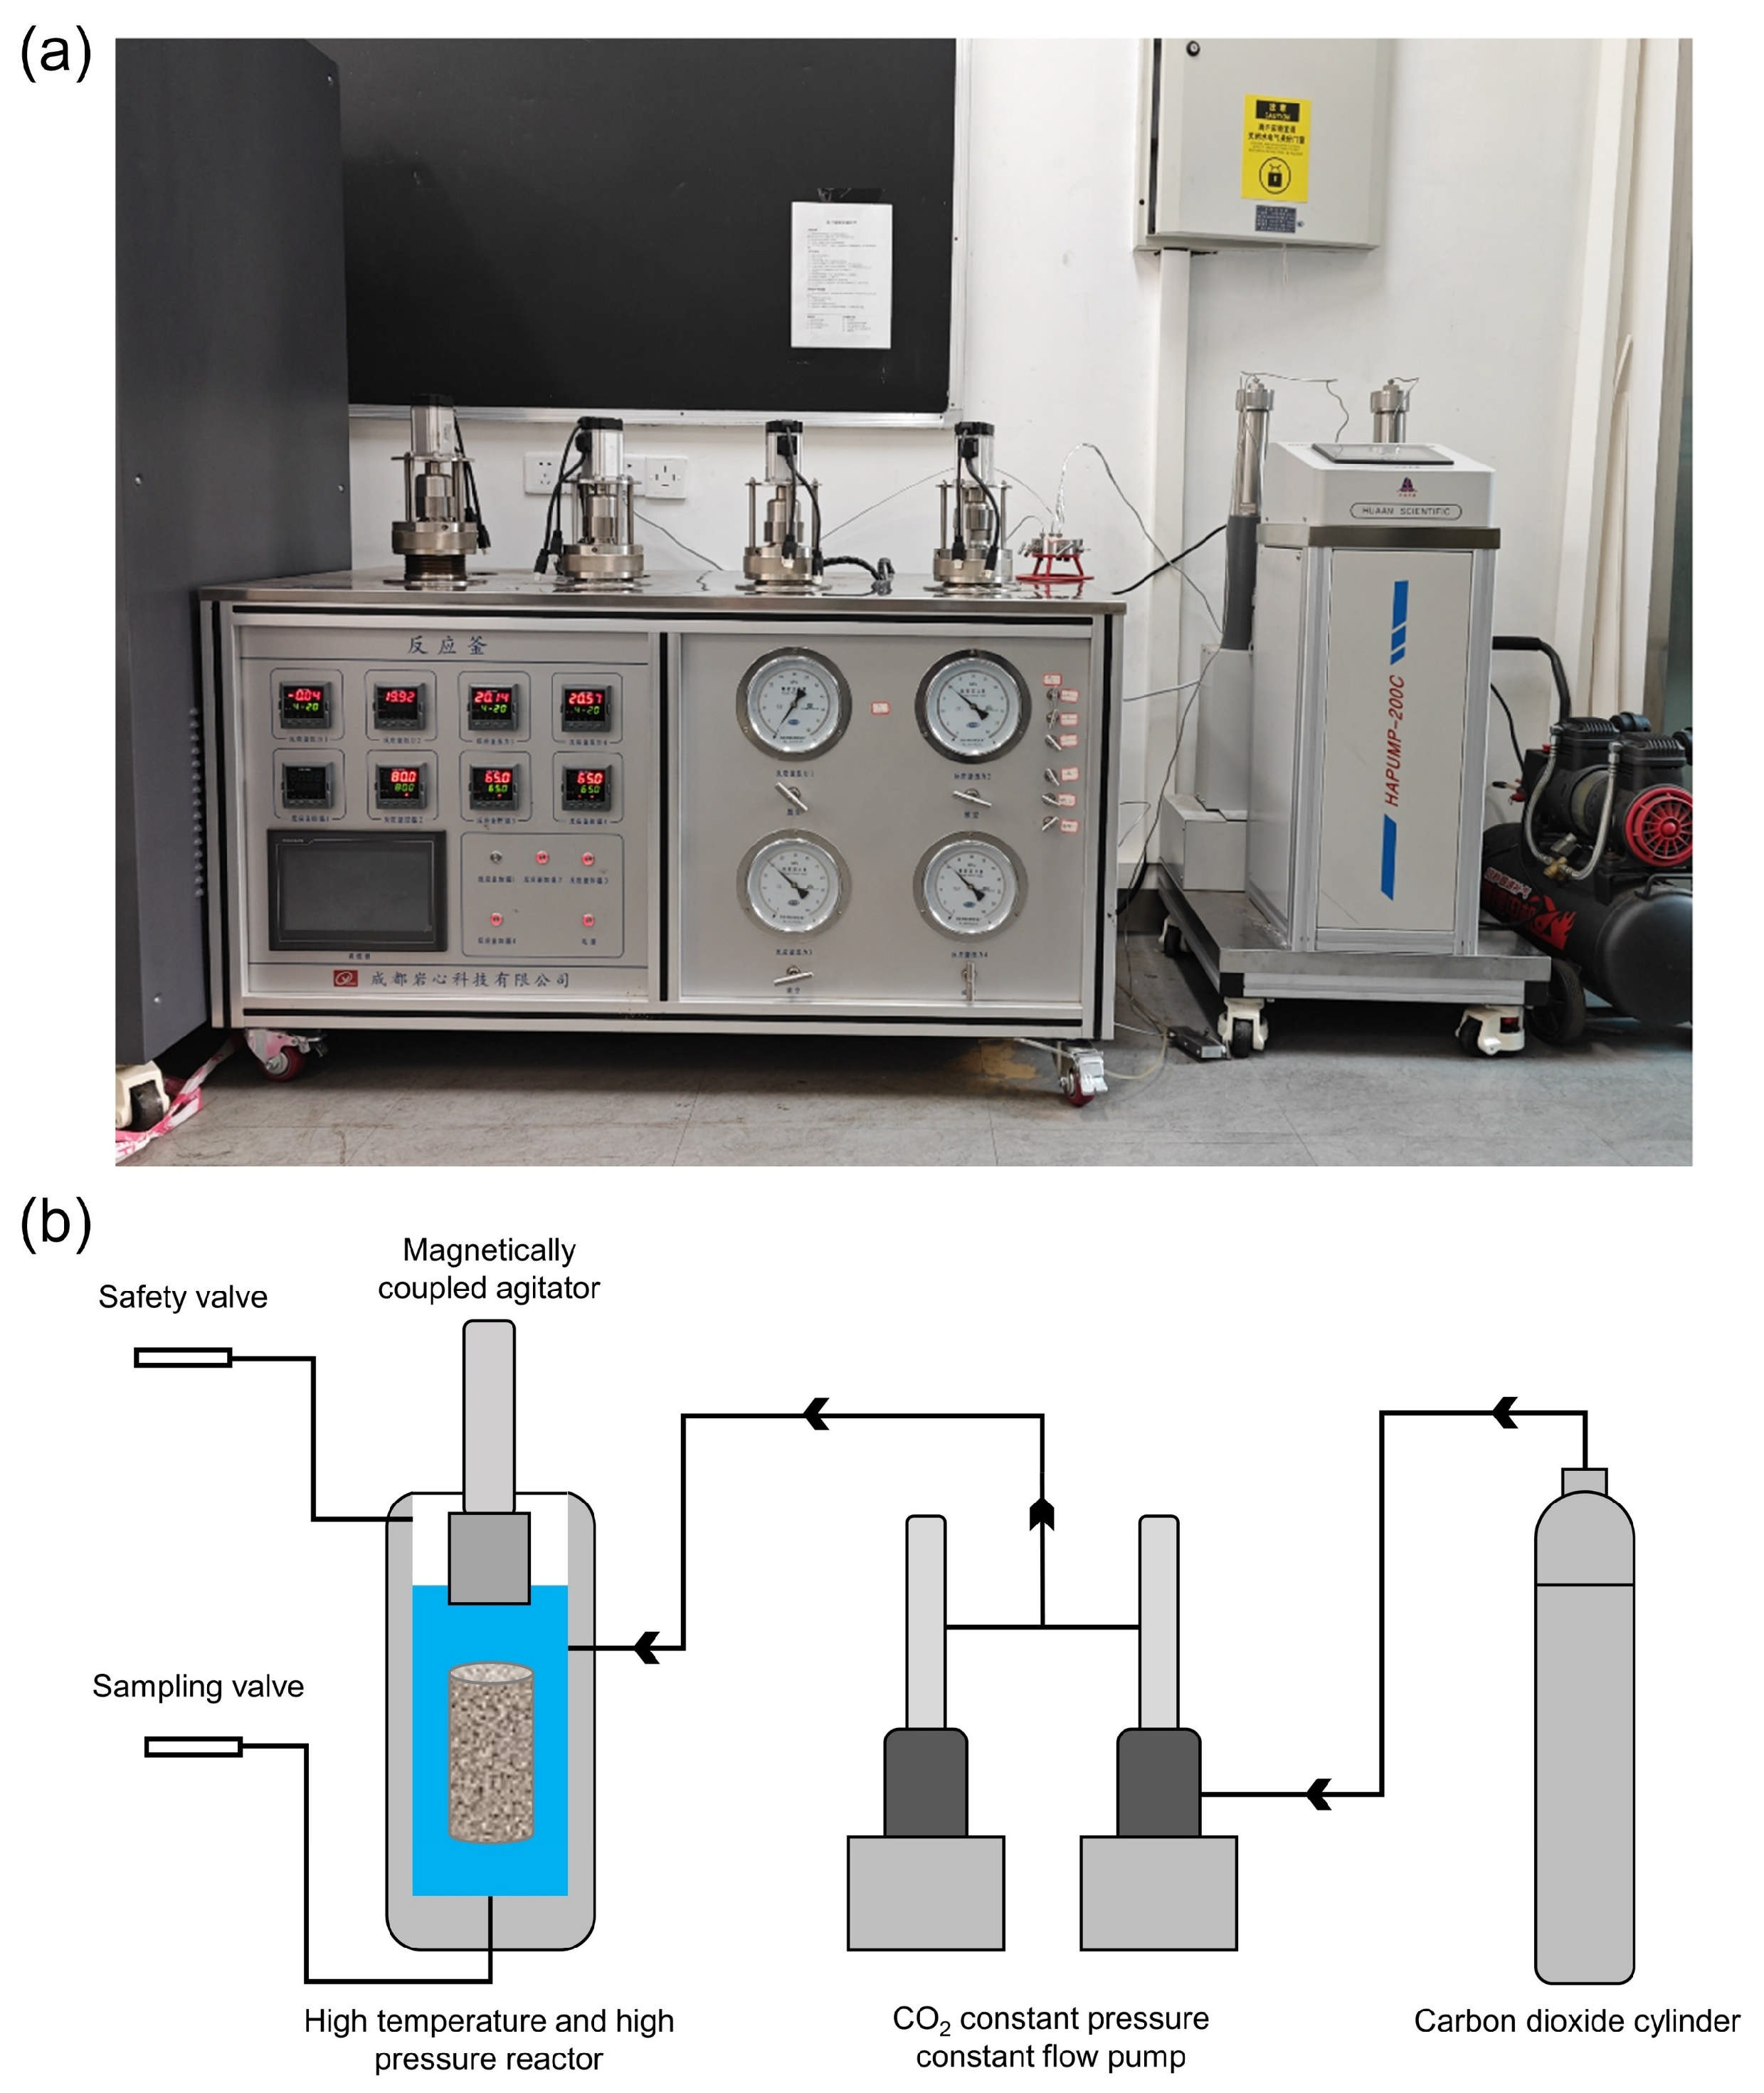
Natural wellbore cores typically exhibit significant heterogeneity. In contrast, reconstituted core sample can eliminate structural uncertainties through standardized preparation, thereby enabling a clearer identification of the intrinsic effects of supercritical CO2-mudstone interactions on mechanical properties. Accordingly, this experiment was designed with two sets of tests: one involving uniaxial mechanical tests on reconstituted core sample without supercritical CO2 soaking, and the other conducted on samples after 15 days of supercritical CO2 immersion. The variations in uniaxial compressive strength, elastic modulus, and Poisson’s ratio were compared between the two groups. The remolded samples were first saturated with brine under vacuum conditions. Subsequently, the samples were placed in a high-temperature and high-pressure reaction vessel. To ensure that CO2 reached the supercritical state, CO2 was injected using a constant-pressure and constant-flow piston pump to maintain a stable gas pressure of 8 MPa. The experiment was conducted at a temperature of 40 °C, with an immersion duration of 15 days (Figure 7). After the soaking process, the samples were dried at 35 °C for 48 h to prepare them for subsequent uniaxial mechanical tests.
The uniaxial mechanical tests were conducted using the electronic precision testing machine from the State Key Laboratory of Coal Mine Disaster Dynamics and Control at Chongqing University. This equipment is capable of measuring fundamental mechanical parameters of solid materials, including compressive strength, deformation, elastic modulus, and Poisson’s ratio. It also enables the acquisition of full stress–strain curves during uniaxial compression. The maximum axial load of the testing machine is 250 kN, with a stiffness of 15 GN/m. The loading speed range spans from 0.0005 to 1000 mm/ms, with a load accuracy of ±0.5% and displacement measurement accuracy of ±0.1%.
Two resistance strain gauges, with a grid length of 0.5 mm and a grid width of 1 mm, and a sensitivity coefficient of 2.13, were affixed to the center of the sample to measure its strain. To ensure the accuracy of the experimental results and prevent the pressure head from descending too rapidly, the rate of descent was controlled at 0.2 mm per minute during the test.

2.2.4. Micro-CT Scanning and Pore Network Modeling

To directly characterize and compare the three-dimensional pore structures, representative samples A1 and A2 were selected for high-resolution X-ray micro-computed tomography (Micro-CT) analysis. The raw projection data was reconstructed into a 3D grayscale volume representing the sample’s internal structure.
The reconstructed 3D volume was then processed using GeoDict 2022 software. This process included (a) applying a non-local means filter to reduce image noise, (b) segmenting the grayscale image into pore space and solid matrix using a watershed algorithm, and (c) labeling the distinct pore regions. From the segmented pore space, a pore network model (PNM) was extracted. This model simplifies the complex pore geometry into a computationally efficient network of pore bodies (represented as spheres) and the connecting constrictions, or throats (represented as cylinders). This simplification allows for the quantitative analysis of key geometric and topological properties, including pore and throat size distributions, coordination number (a measure of local connectivity), and tortuosity of flow paths.

3. Experimental Results

3.1. Permeability Measurement Data of Well Core Samples

This study evaluates the sealing capacity of the caprock within the target aquifer intervals (930–990 m and 1470–1500 m) based on permeability measurements performed on wellbore core samples. The corresponding permeability data are summarized in Table 2. The measured permeability values span five orders of magnitude. This variability is particularly pronounced within the deeper aquifer unit (1467–1468 m), where permeability differs by up to two orders of magnitude over a vertical interval of less than one meter (1.97 × 10⁻¹ mD versus 6.724 × 10⁻⁴ mD). Such extreme heterogeneity within a single genetic formation suggests that hydraulic properties are not solely governed by macroscopic lithology, but are predominantly controlled by highly localized, pore-scale diagenetic processes. The sample obtained from a depth of 1200 m, with a permeability of 2.41 × 10⁻⁶ mD, likely represents a significant flow barrier that contributes to the compartmentalization of vertical fluid flow. The permeability within the interval of 1444–1468 m exhibits significant fluctuations, reflecting strong heterogeneity of the rock mass.

3.2. Supercritical CO2 Breakthrough Pressure Test Results

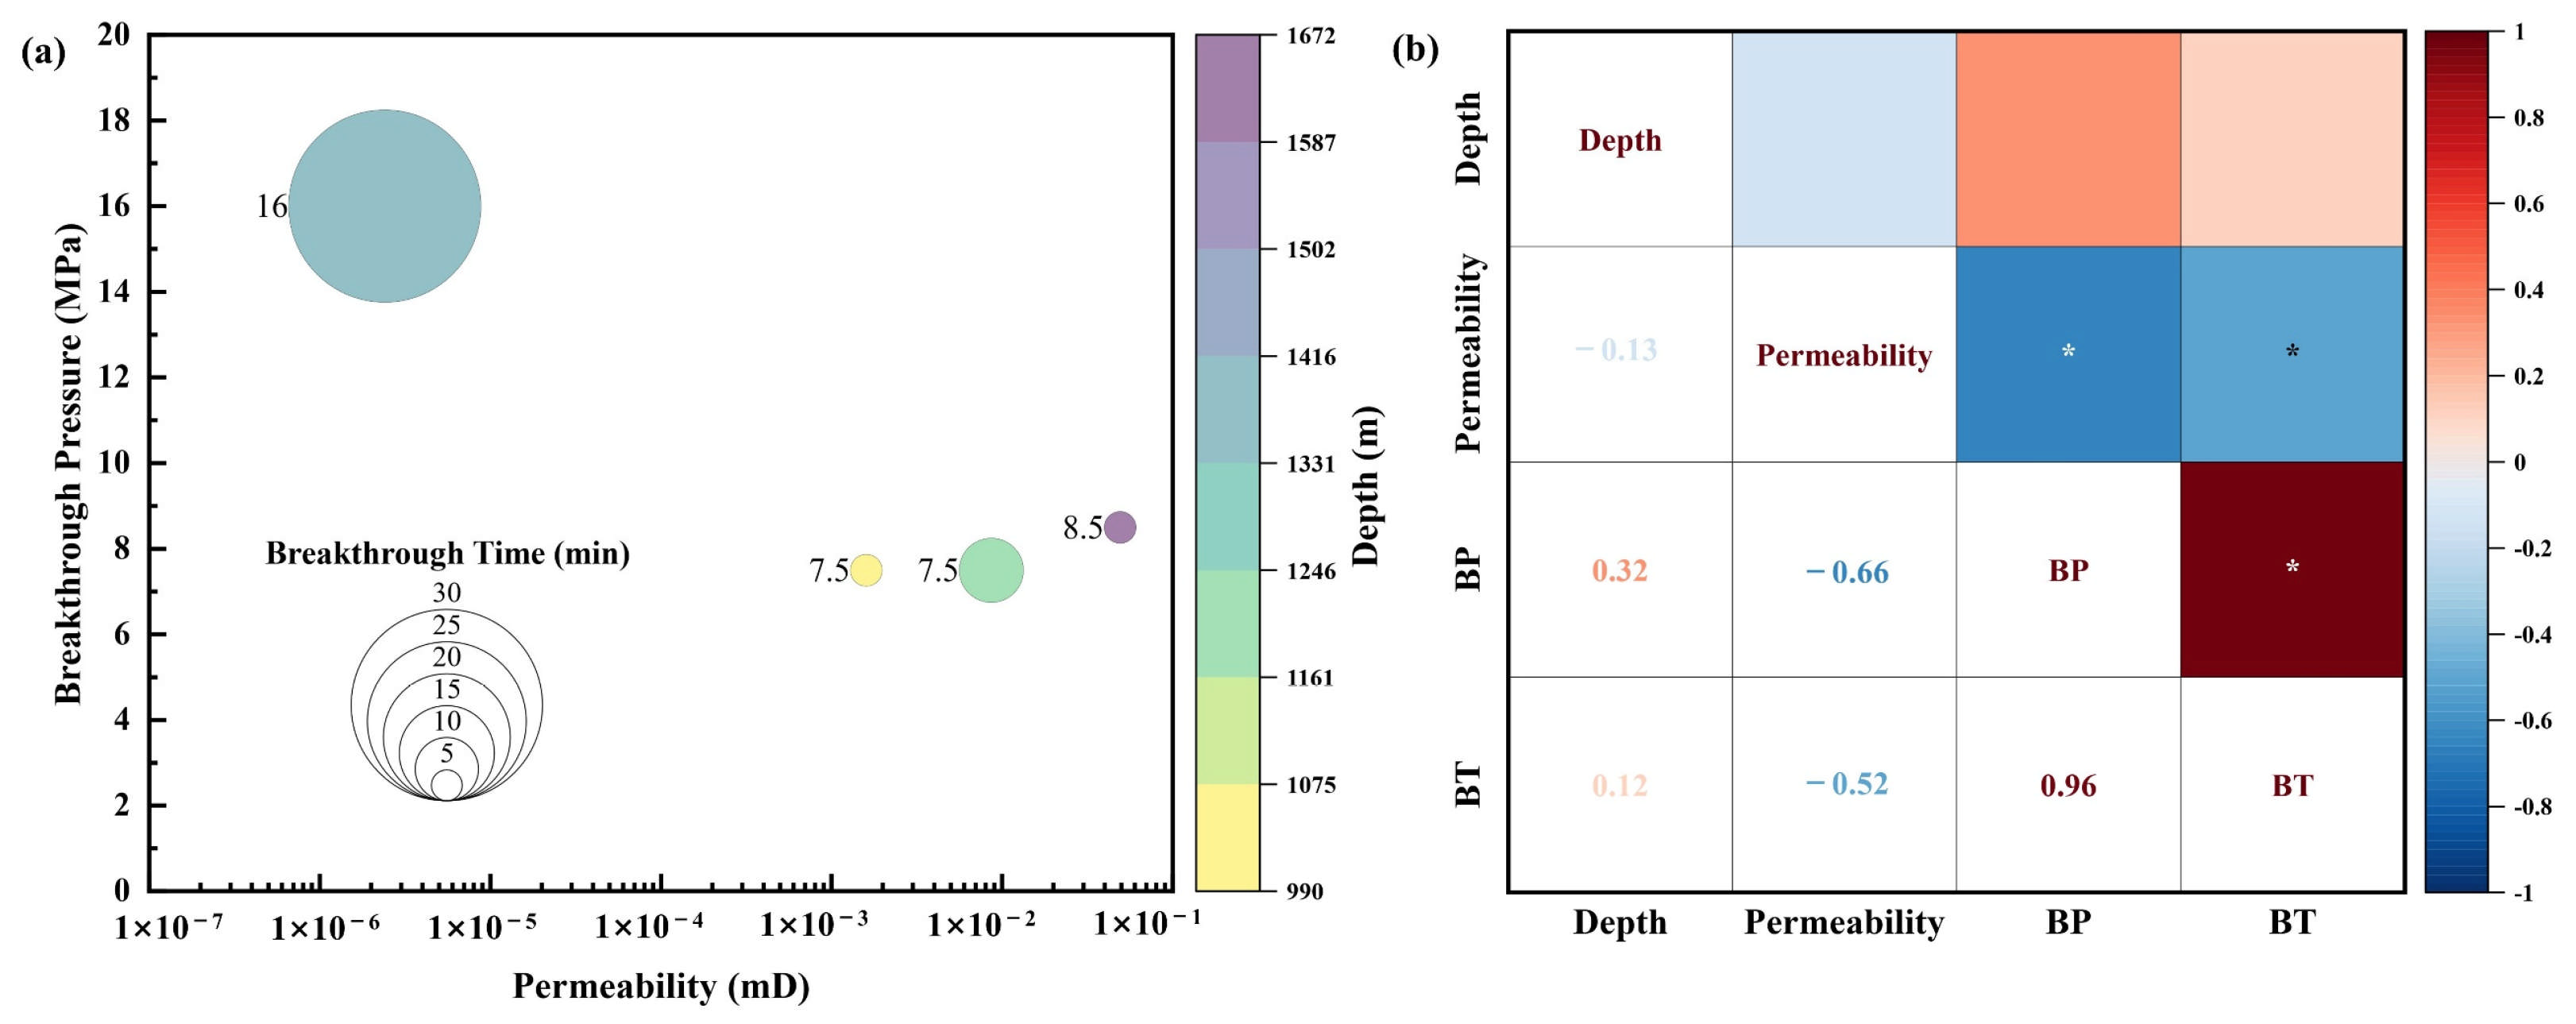
In geological carbon sequestration, the integrity of caprocks is paramount to preventing the escape of scCO2. Our experimental analysis reveals a critical decoupling between intrinsic permeability and capillary sealing efficiency-a finding that challenges conventional reservoir assessment models. As illustrated in the accompanying correlation heatmap (Figure 8b), breakthrough pressure (BP) and breakthrough time (BT) exhibit a strong positive correlation, underscoring the coupled physical processes governing scCO2 migration. This relationship aligns with capillary theory, wherein narrower pore throats impose greater resistance to nonwetting phase invasion, thereby elevating both the pressure threshold and time required for scCO2 breakthrough.
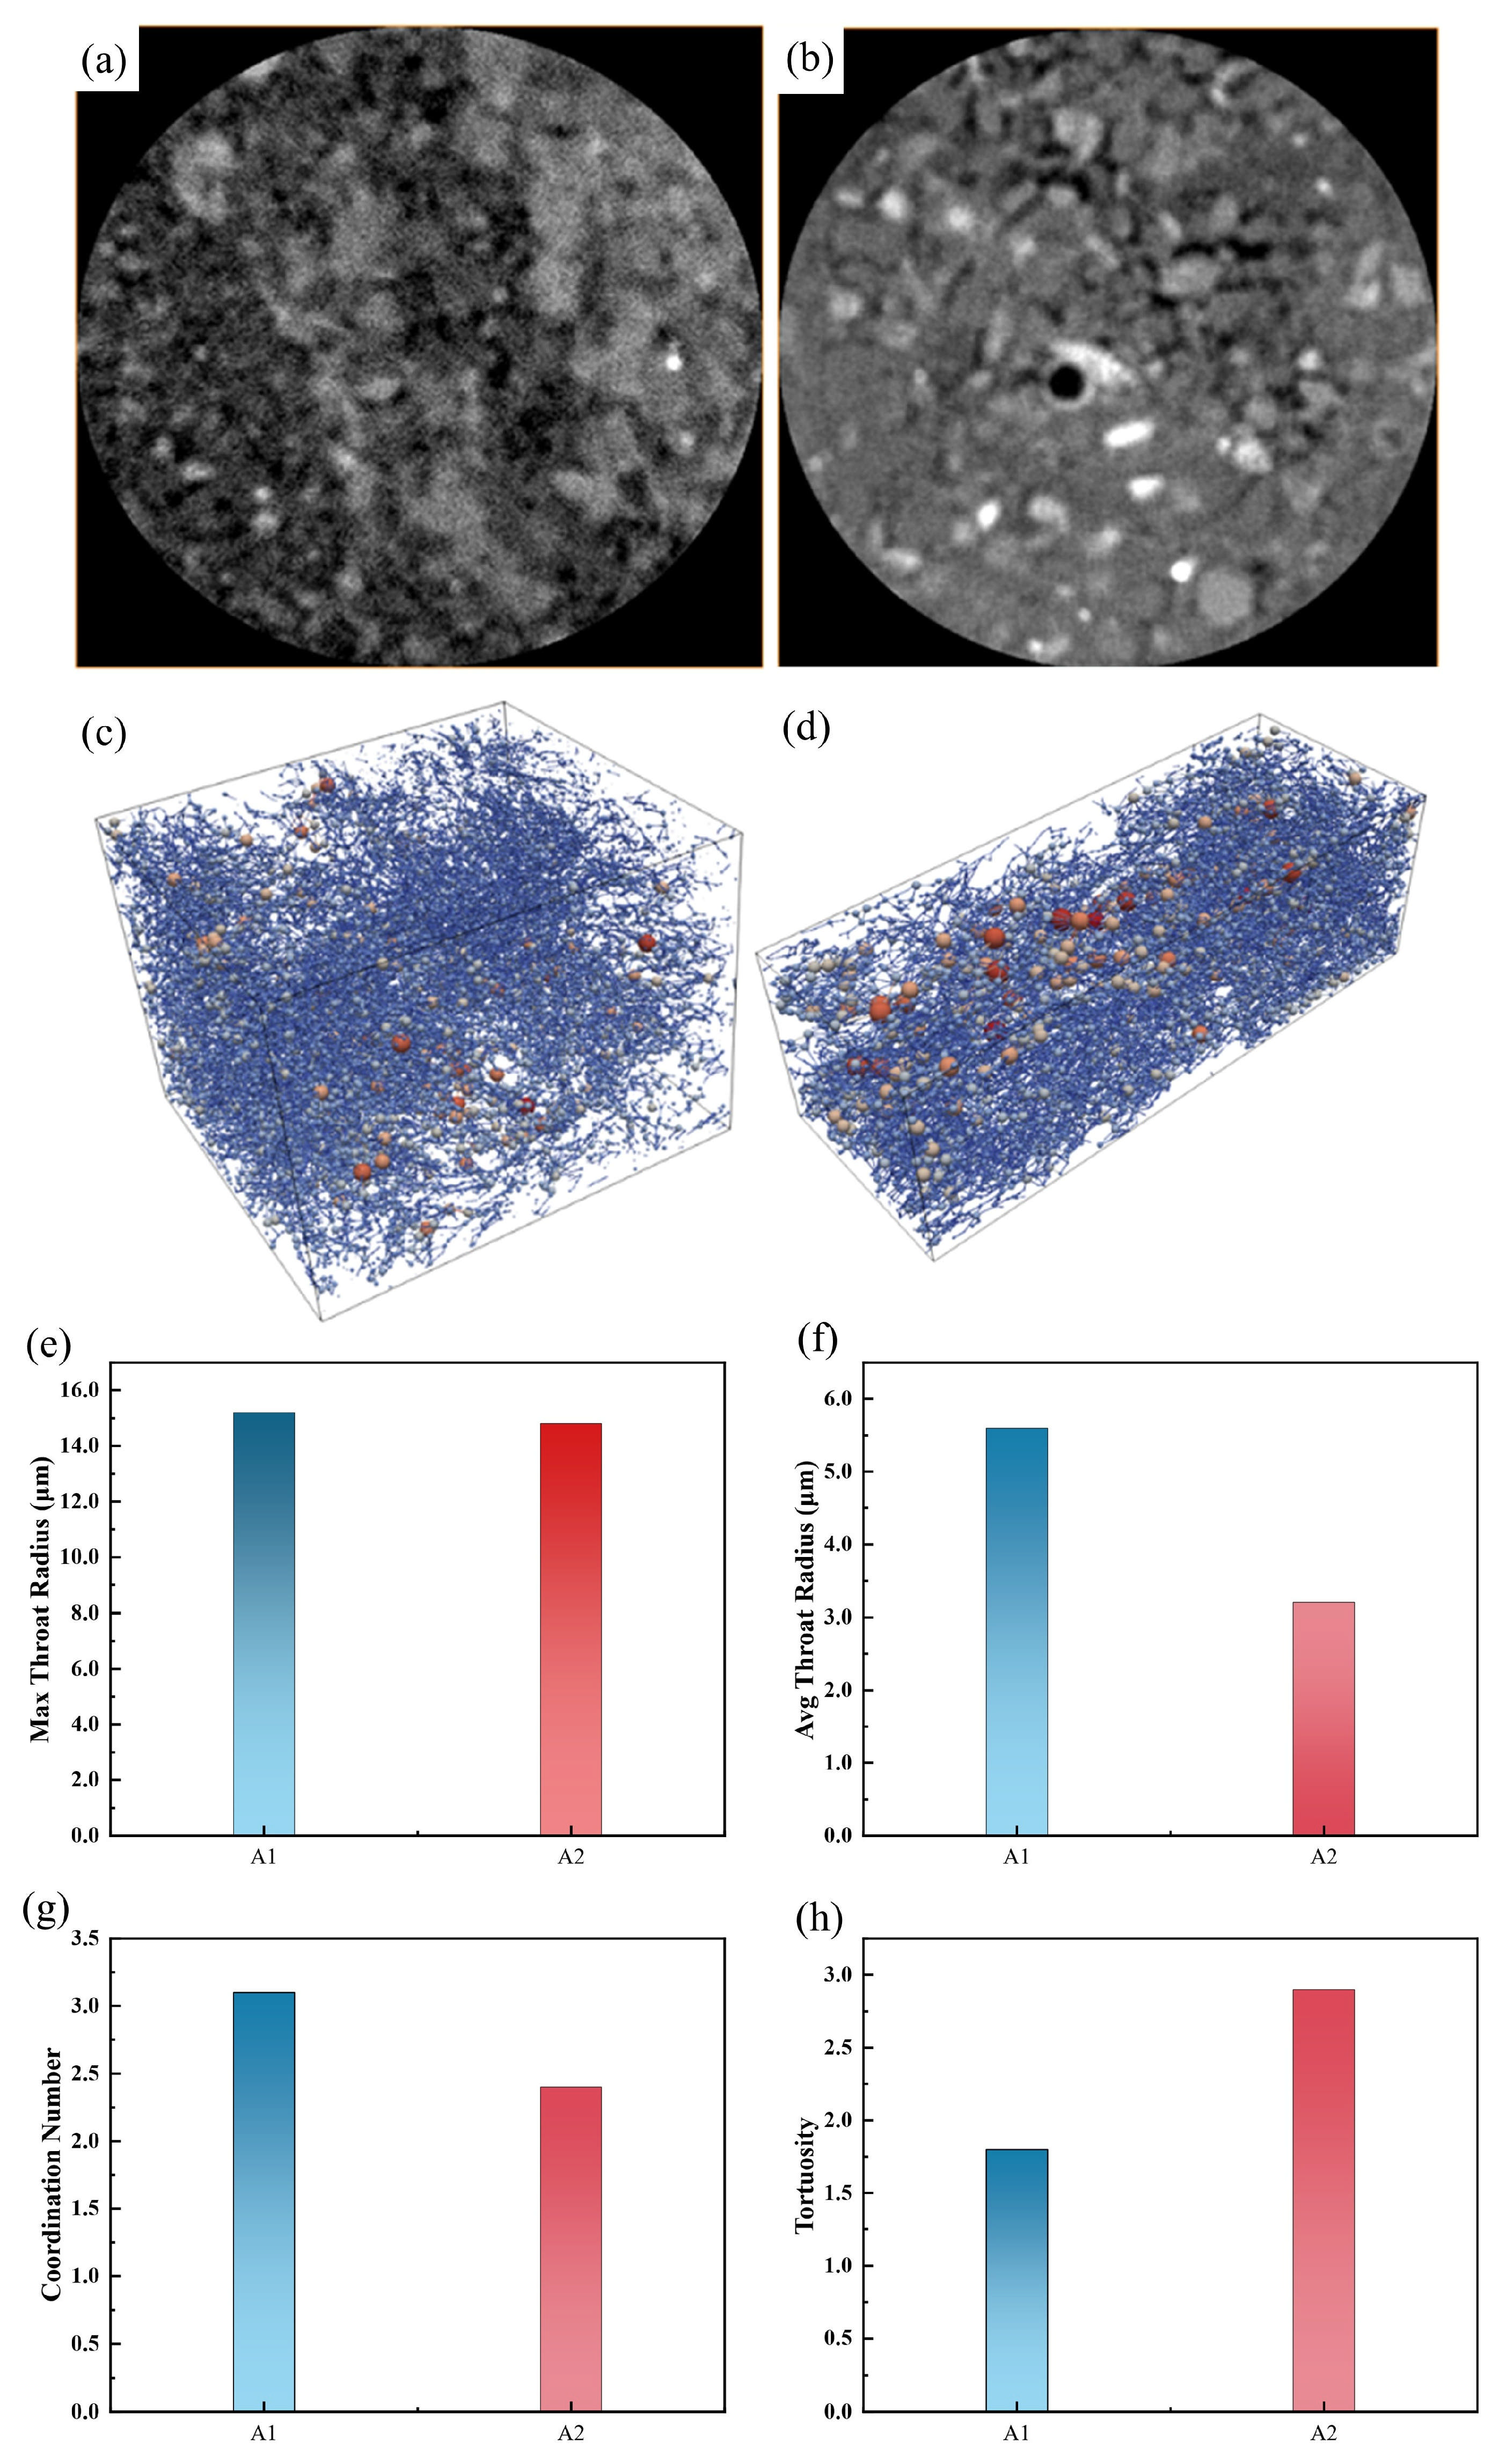
Notably, permeability shows a pronounced negative correlation with both BP and BT. This inverse relationship highlights that permeability-often used as a proxy for seal quality-fails to capture the full complexity of pore-throat architecture. For instance, samples from the Yuehai Formation (A1 and A2) display similar breakthrough pressures (7.5 MPa) despite an order-of-magnitude difference in permeability, indicating that the largest connected pore throats dictate capillary sealing behavior. (Figure 9). Based on the principles of computed tomography (CT) imaging, pixels can be classified into three categories according to their grayscale values: macro-pore pixels, micro-pore pixels, and solid pixels [35]. Macro-pore pixels, which appear black with the lowest grayscale values within the core, represent pores larger than the current resolution. Micro-pore pixels are gray blocks with intermediate grayscale values; these voxels contain sub-resolution pores and clay minerals rich in nanopores [36]. The presence of these micropores reduces the grayscale value of the pixel block, with lower grayscale values indicating higher porosity within the block. Bright pixels with higher grayscale values correspond to solid grains such as quartz and feldspar. Furthermore, analysis of the pixel grayscale distribution reveals that Sample A1 has a greater abundance of both macro-pore and micro-pore pixels compared to Sample A2 (Figure 9a,b), along with better connectivity. To mitigate the impact of large rock grains and pyrite nodules on pore structure characterization, sub-regions with relatively homogeneous clay distribution are selected. Connectivity analysis is subsequently performed on both the macro-pores and micro-pores within these sub-regions, followed by pore network modeling (Figure 9c,d). This process aims to accurately represent the geometric topology and connectivity of the rock.
A key finding is that the maximum connected throat radii for both samples are nearly identical, at 15.2 μm for A1 and 14.8 μm for A2 (Figure 9e). This microstructural result directly corroborates our macroscopic observation of nearly identical breakthrough pressures (7.5 MPa) for these two samples, providing powerful evidence that capillary breakthrough in these mudstones is indeed controlled by the bottleneck of the single largest continuous pathway. The average throat radius in A1 (5.6 μm) is significantly larger than in A2 (3.2 μm). Furthermore, the connectivity of the network, quantified by the average coordination number, is substantially higher in A1 (3.1) than in A2 (2.4). Conversely, the tortuosity of the flow paths in A2 (2.9) is much higher than in A1 (1.8). Therefore, despite a similar breakthrough pressure, the flow “pathways” within A2 are narrower, less connected, and more tortuous, which perfectly explains its longer breakthrough time.
In contrast, the Hanjiang Formation sample (A3), with nano-Darcy permeability, exhibits both high breakthrough pressure (>16 MPa) and extended breakthrough time (30 min) (Figure 8a), consistent with a uniformly fine pore network that effectively resists scCO2 penetration. Although the sample with higher permeability contains a greater abundance of interconnected pores, the geometry, size, and distribution of these pores are likely heterogeneous, potentially leading to divergent flow and capillary properties. This irregularity can cause fluid flow to encounter greater resistance. Furthermore, rocks with higher permeability may also contain more microcracks or defects, which can expand or close under fluid pressure, thereby resulting in higher breakthrough pressures for those samples with higher permeability. During the breakthrough pressure testing of reconstituted mudstone, it was observed that stratification occurred within the mudstone under the influence of confining pressure, and shear failure was evident at multiple locations in some samples (Figure 6d). This indicates that the internal structure of the mudstone was compromised by the high-pressure gas, leading to significant deformation on the outer surface as well. The presence of supercritical CO2 had a considerable impact on the overall stability of the mudstone. Additionally, the reconstituted mudstone had undergone repeated compression and damage during sampling and preparation, which caused destruction of internal particles and fabric.
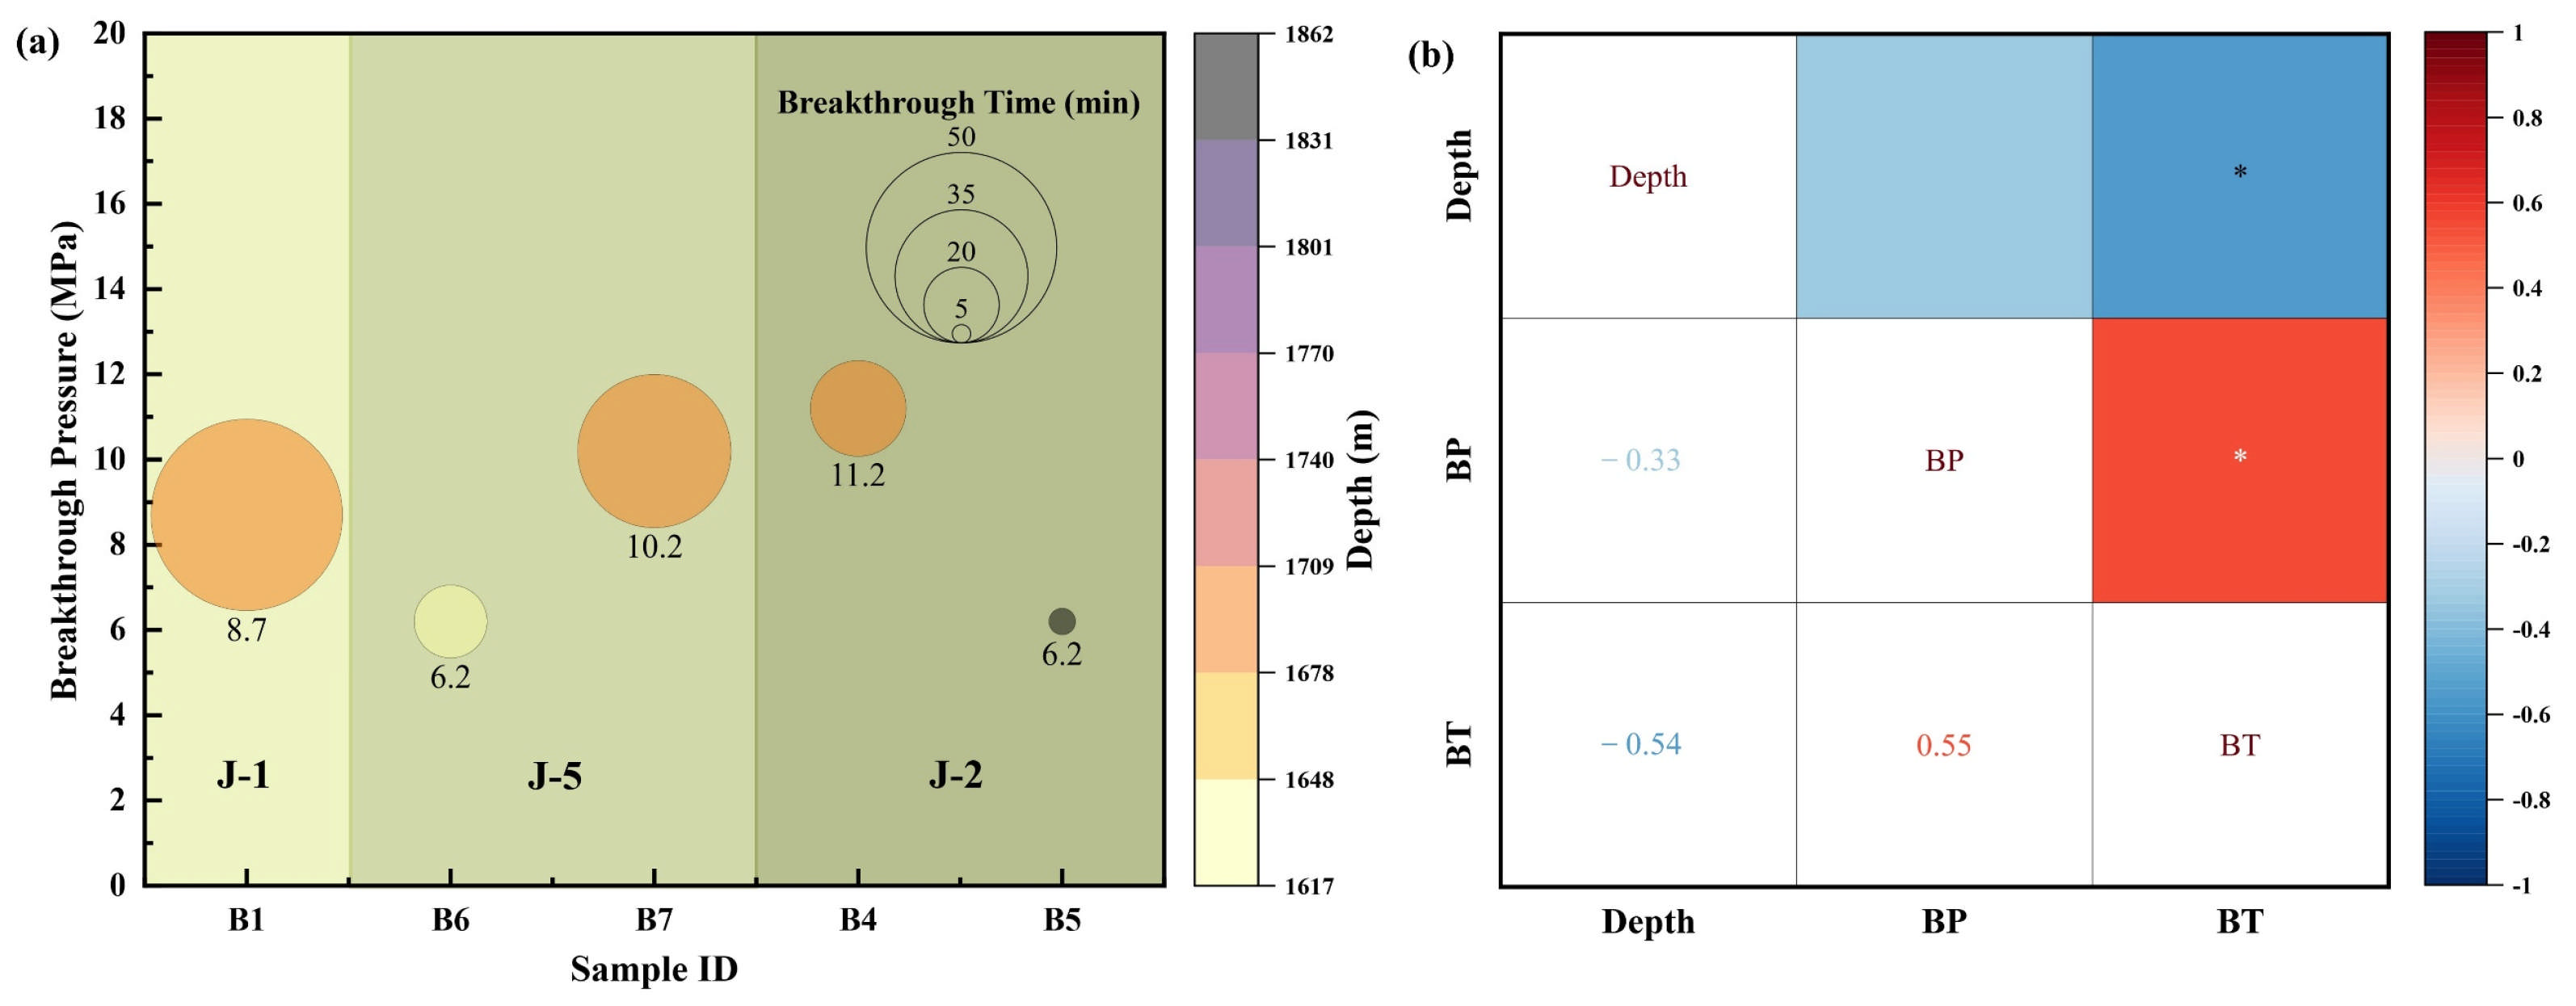
The reconstituted cores further validate these trends, with BP-BT correlation patterns reinforcing that breakthrough behavior is not merely a function of bulk permeability but is intricately tied to the topology of the critical pore network (Figure 10). The persistence of these relationships across both native and reconstituted systems suggests that the underlying pore-scale mechanisms are robust and reproducible, independent of sampling disturbance.
These results emphasize that predictive models of caprock integrity must integrate not only permeability but also pore-throat size distribution and connectivity. The robust correlation between BP and BT further provides a practical dual-indicator framework for evaluating long-term seal performance under scCO2 exposure-a vital insight for ensuring the security of carbon sequestration initiatives.

3.3. Uniaxial Mechanical Properties Test Results

In the initial loading phase, the untreated specimen (a) exhibits a characteristic concave-upward curve, indicative of pore space compaction and crack closure (Figure 11). Following this compaction stage, the curve transitions into a robust linear elastic domain, characterized by a high Young’s modulus. In stark contrast, the ScCO2-treated specimen (b) demonstrates a markedly subdued compaction response. The more direct entry into a less steep linear phase suggests that pre-existing micro-fractures have been either widened or new ones generated by ScCO2, reducing the volume of closable voids. Crucially, the significant reduction in the slope of the elastic segment signifies a substantial decrease in Young’s modulus. This elastic softening is a direct consequence of scCO2-induced dissolution of calcite and other cementing minerals at grain boundaries, which weakens the rock’s inherent stiffness.
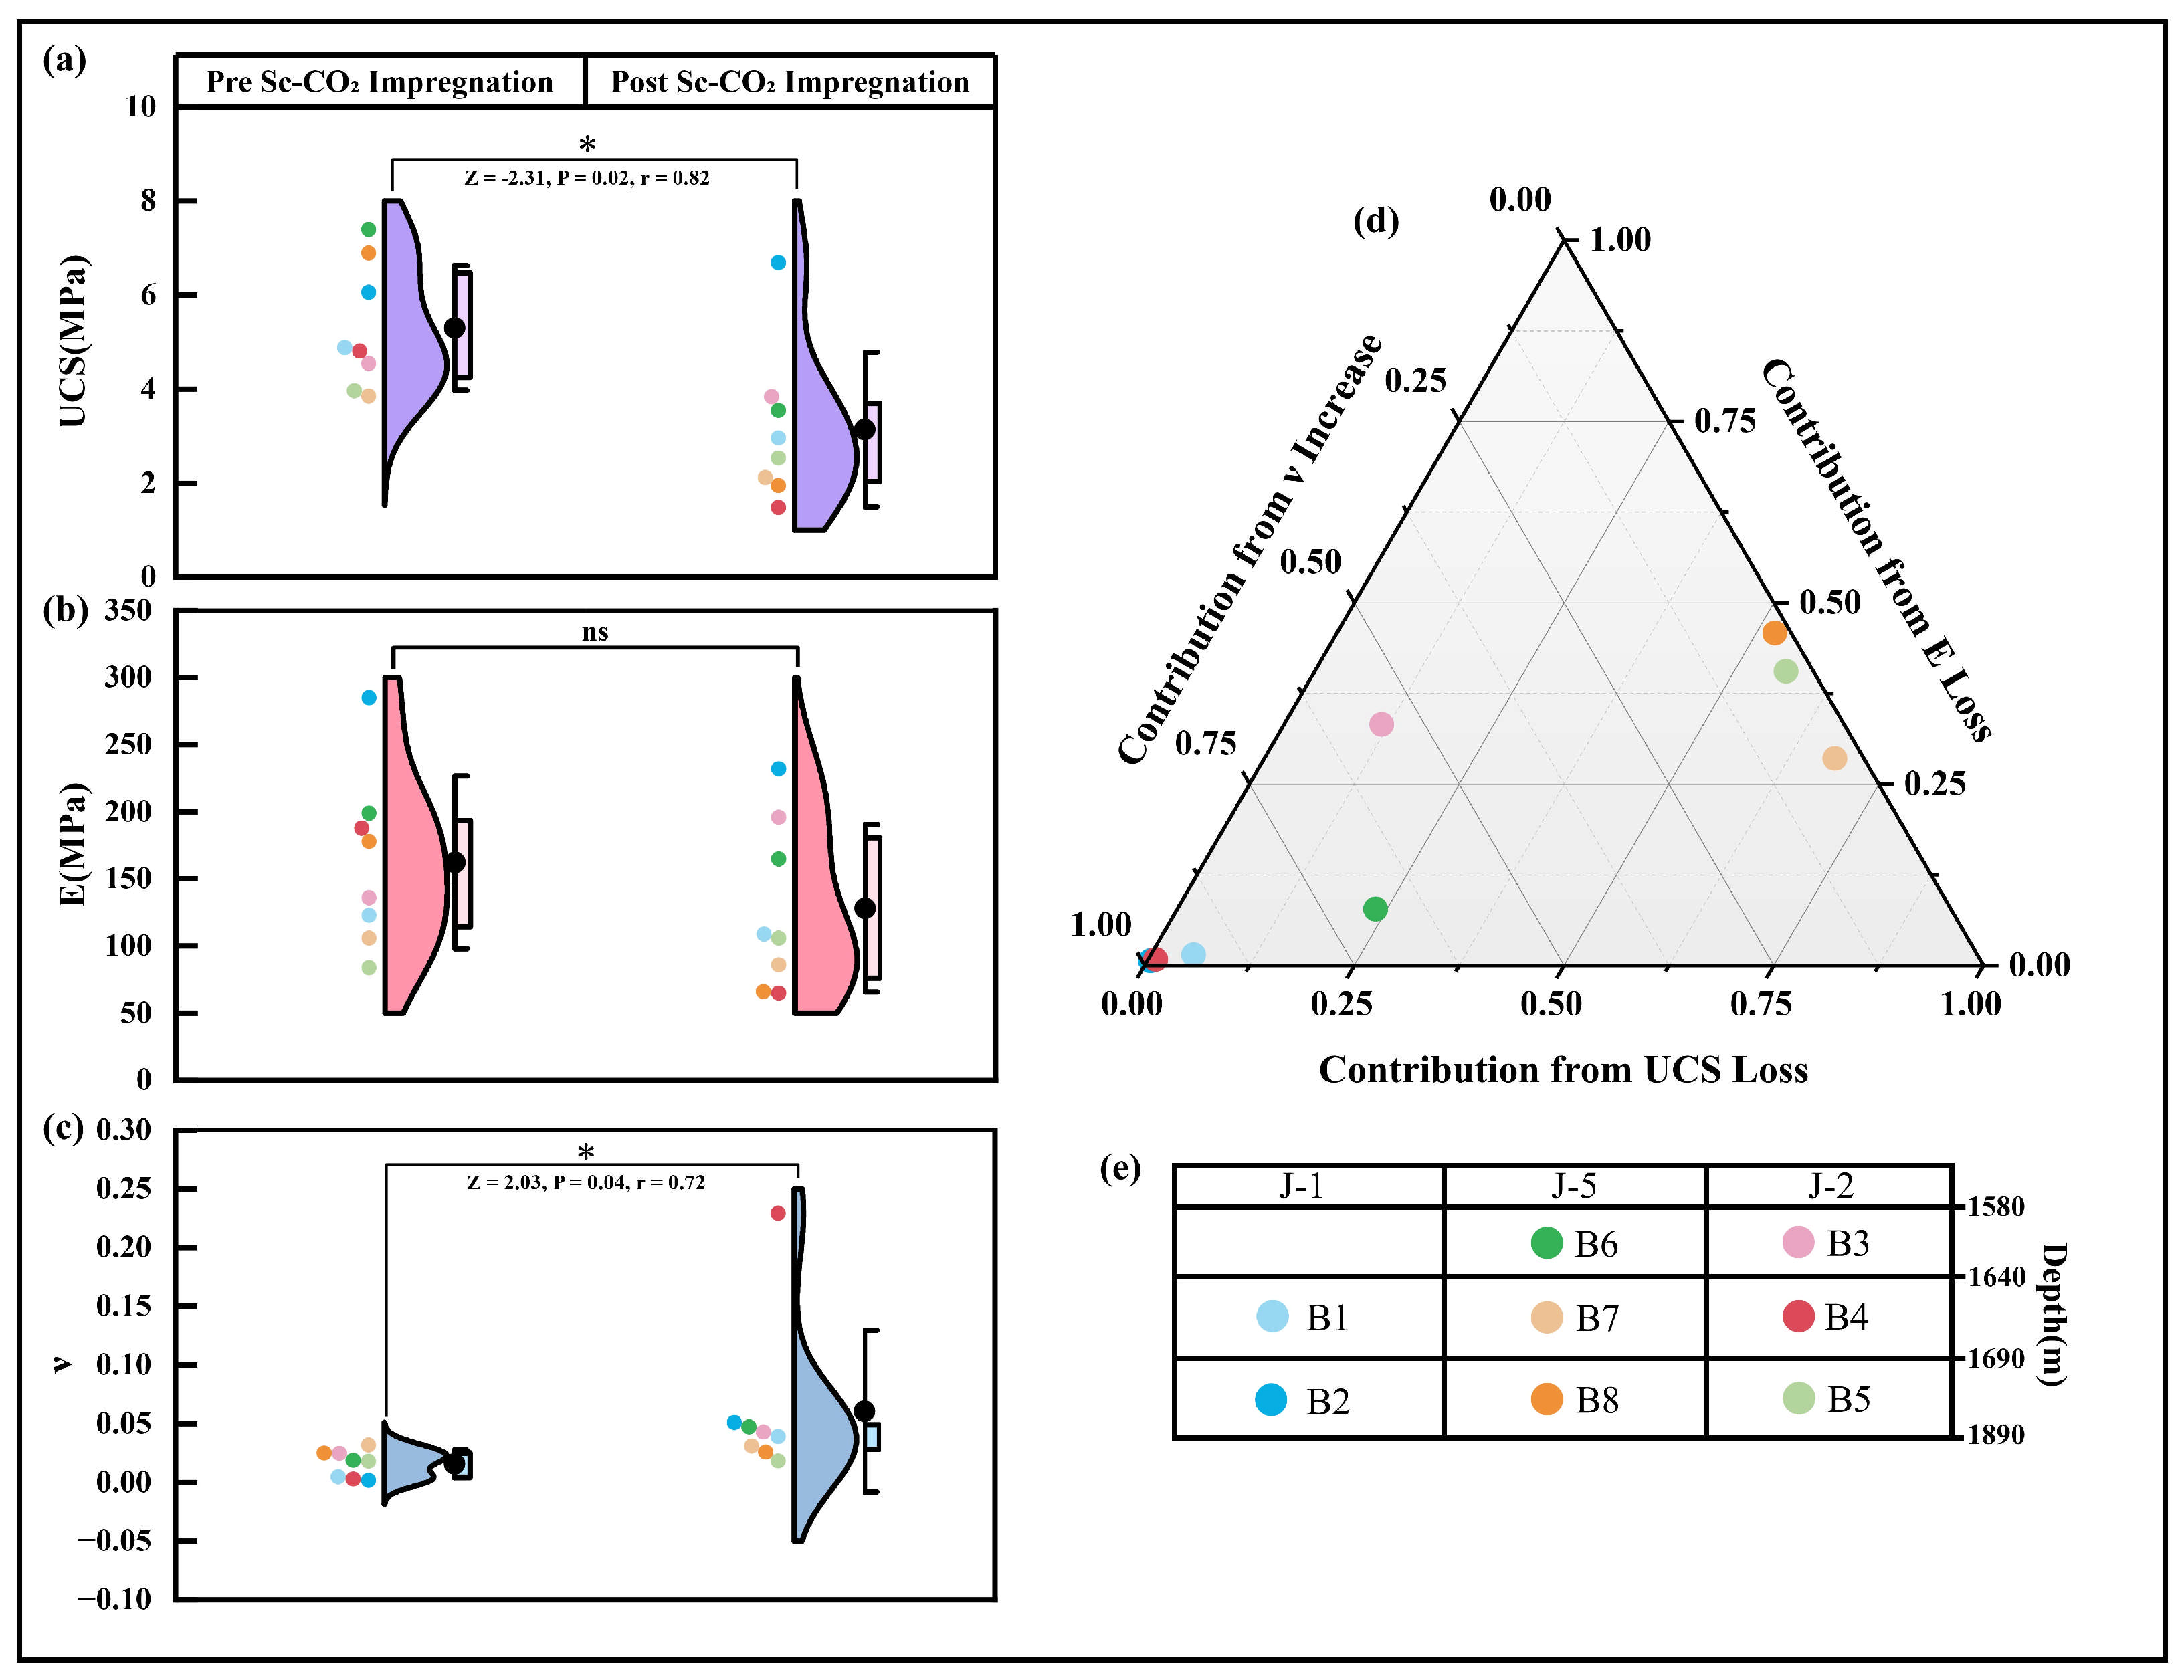
Given the non-normal distribution of some mechanical parameters, the Wilcoxon signed-rank test was employed for all paired comparisons-including uniaxial compressive strength, elastic modulus, and Poisson’s ration-to ensure methodological consistency in evaluating scCO2-induced alterations. The results indicate that scCO2 impregnation significantly compromises the mechanical integrity of the reservoir rock, as evidenced by statistically meaningful changes in its key mechanical properties. A marked reduction in uniaxial compressive strength was observed following scCO2 treatment (Z = −2.31, p = 0.02, effect size r = 0.82), indicating substantial weakening of the rock’s load-bearing capacity (Figure 12a). This degradation is attributed primarily to geochemical processes-notably mineral dissolution and microcrack formation-initiated by scCO2-rock-fluid interactions, which collectively diminish cohesive strength within the rock matrix.
Concurrently, a pronounced elevation in Poisson’s ratio was documented (Z = 2.03, p = 0.04, r = 0.72), reflecting a transition in mechanical response toward enhanced ductility (Figure 12b). This shift is indicative of amplified lateral deformation under axial stress, aligning with a diminished propensity for brittle failure. The underlying mechanism may involve either the closure of pre-existing microfractures or an augmentation in internal compliance within the rock matrix. A significant alteration was observed in the Poisson’s ratio (Figure 13). It is crucial to first highlight that these results pertain to laboratory-reconstituted, weakly cemented mudstone cores. In their initial state, these samples behave mechanically like unconsolidated granular assemblies rather than well-lithified natural rock. Under initial axial loading, their deformation is predominantly governed by the compaction of pore spaces and the rearrangement of grains, resulting in negligible lateral strain. This physical behavior leads to an anomalously low initial Poisson’s ratio, with measured values often close to zero. With the exception of mudstone sample B7, whose Poisson’s ratio decreased by 2.3%, all other samples exhibited an increase in Poisson’s ratio (Figure 13). The most striking transformation was observed in samples B2 and B4. For instance, the Poisson’s ratio of sample B4 increased from its initial near-zero value of 0.003 to a final value of 0.23. Similarly, the value for sample B2 increased from 0.002 to 0.05. Across the sample set, the general trend was a transition from initial Poisson’s ratios typically below 0.01 to final values falling within a range of 0.05 to 0.25. This marked increase in absolute value signifies a fundamental shift in the material’s mechanical response from brittle to ductile, now characterized by significant lateral deformation under load. Sample B5 and B8 exhibited only slight increases of 2.1% and 2.7%, respectively. These results indicate that supercritical CO2 has a notable impact on both the lateral and longitudinal strain behavior of mudstone, significantly altering its deformation characteristics. A higher Poisson’s ratio means that for a given axial stress, the lateral strain of the mudstone becomes more pronounced. The mudstone is constantly subjected to pressure from the stored CO2 and the overlying strata, this enhanced lateral strain can gradually cause the mudstone to deform more in the lateral direction. Over time, such deformation can lead to the development of micro-fractures or the widening of existing ones within the mudstone. These fractures can then serve as pathways for CO2 leakage, thereby compromising the sealing integrity of the caprock.
The elastic modulus is a key parameter for evaluating rock brittleness, as it reflects the rock’s capacity to resist deformation and its susceptibility to damage when microcracks form under external load. In contrast, the elastic modulus exhibited no statistically significant alteration (ns) (Figure 12c). This divergence signifies a heterogeneous mechanical response to scCO2-water-rock interactions within the mudstone matrix. Whereas the marked strength degradation predominantly stems from dissolution of cementing phases, the integrity of the elastic modulus-a fundamental indicator of intrinsic stiffness-is preserved through the persistence of a rigid skeletal architecture, predominantly quartz grains, that remains essentially unmodified under transient geochemical exposure.
To deconvolve the synergistic yet heterogeneous weakening of the mudstone caprock following scCO2-brine-rock interactions, we employed a ternary diagram to visualize the dominant mode of mechanical degradation for each sample. The conceptual foundation is that the scCO2-induced alteration can manifest through three distinct pathways: (1) a catastrophic loss of load-bearing capacity (UCS decrease), (2) a reduction in material stiffness (E decrease), and (3) a fundamental transition in deformation behavior from brittle to ductile (ν increase). The ternary diagram quantifies which of these pathways is the predominant signature for a given sample. For each specimen, the absolute values of the percentage changes in UCS (|ΔUCS|%), E (|ΔE|%), and ν (|Δν|%) were first calculated. Subsequently, the relative contribution of each parameter to the Total Change Magnitude was computed as follows: contribution from UCS loss (|ΔUCS|/Total Change Magnitude), contribution from E loss (|ΔE|/Total Change Magnitude) and contribution from ν loss (|Δν|/Total Change Magnitude).
The ternary diagram (Figure 12d) provides a definitive visualization of the principal geomechanical alteration pathways induced by scCO2-brine-rock interactions in the mudstone caprock. The data reveal a systematic and profound shift in the failure mode of the rock, characterized by a pronounced clustering of samples towards the “Contribution from ν Increase” apex. This spatial distribution indicates that the predominant geomechanical signature of scCO2 alteration is not merely a uniform weakening but a fundamental brittle-to-ductile transition. The dramatic increase in Poisson’s ratio signifies that the rock’s deformation behavior evolves to accommodate significantly more lateral strain under axial stress. In the context of geologicalCO2 sequestration, this implies that the caprock’s failure mechanism may shift from abrupt, brittle fracturing to time-dependent, aseismic deformation such as plastic compaction and creep. Such a transition poses a distinct long-term risk, as seal integrity could be compromised gradually through continuous deformation without a distinct, easily detectable seismic event. The observed mechano-chemical evolution can be attributed to a multi-stage process: Initial dissolution of calcite and other reactive minerals preferentially attacks grain boundaries, generating micro-porosity and sub-critical fractures. This process efficiently reduces the cohesive strength and stiffness of the rock. Concurrently, the chemical environment alters clay mineral surfaces and facilitates interlayer expansion in susceptible phases, which disproportionately enhances the material’s capacity for volumetric strain, thereby driving the pronounced increase in Poisson’s ratio. Our findings align with the conceptual model that chemo-mechanical interactions first enhance material compliance and ductility before leading to complete structural collapse. In conclusion, the ternary analysis reveals that the primary threat to the long-term sealing integrity of the caprock under scCO2 conditions is not a simple reduction in strength, but a fundamental alteration in its constitutive behavior. Risk assessments and predictive models must, therefore, evolve to incorporate this chemo-mechanical ductility enhancement as a critical failure pathway, moving beyond criteria based solely on strength or permeability.

4. Discussion

4.1. Extreme Permeability Heterogeneity and Its Diagenetic Controls

Our high-resolution permeability profiling of sidewall core samples reveals a startling degree of vertical heterogeneity within the caprock intervals of the Yuehai and Hanjiang Formations. Permeability values span five orders of magnitude (10−6 to 10−1 mD), with variations of up to two orders of magnitude occurring over a vertical interval of less than one meter (e.g., between 1467 m and 1468 m). This extreme heterogeneity is not primarily controlled by depositional facies but is a profound signature of diagenetic reorganization of the pore network, a phenomenon increasingly recognized in fine-grained sedimentary sequences as a key control on fluid flow [8]. The permeability architecture is dictated by the competing effects of mineral dissolution and authigenic precipitation. Dissolution of reactive minerals such as feldspars and carbonate cements enhances porosity and creates interconnected pathways, leading to higher permeability zones [37]. Conversely, the precipitation of diagenetic phases selectively occludes pore throats, drastically reducing hydraulic connectivity without necessarily eliminating pore volume [1]. This diagenetic overprint creates a complex, heterogeneous pore system where permeability is not a simple function of depth or lithology but a reflection of localized fluid-rock interactions that have operated over geological timescales [38]. Critically, this diagenetic heterogeneity establishes a spatially variable capillary framework within the caprock. Zones of extensive cementation exhibit nano-Darcy permeability and act as efficient capillary barriers [2], while intervals with preserved porosity but constricted throats form the heterogeneous, yet critically important, transition zone at the reservoir-seal interface [3].

4.2. Mechanisms Underlying the Variation in Breakthrough Time

Identical breakthrough pressures imply similar maximum pore-throat radii between the samples; however, divergent breakthrough times reveal distinct pore-throat distributions, highlighting the decoupling of entry pressure from flow efficiency [4]. The duration of breakthrough time is primarily governed by effective post-breakthrough flow capacity, which is controlled by the pore-scale topology beyond the breakthrough point [39]. Sidewall core samples A1 and A2, along with remolded core samples B5 and B6, exhibit identical breakthrough pressures yet differ in breakthrough time [40,41,42,43,44]. A prolonged breakthrough time suggests that even after the largest connected pore throat is breached by CO2, the subsequent migration pathways remain relatively tortuous and constricted [1,17]. scCO2 must overcome greater capillary and viscous resistances to establish stable and continuous flow channels [45,46,47], a process governed by the connectivity and geometry of the pore network [6]. In contrast, a shorter breakthrough time indicates that once the breakthrough pressure threshold is reached, scCO2 can rapidly establish a flow network within the rock, strongly implying the presence of a highly connected and relatively large pore-throat network [7]. While the maximum pore-throat size determines the breakthrough pressure, the total volume and size distribution of connected pore throats govern post-breakthrough flow rates and thus dictate breakthrough time. A comparison between samples A1 and A2 reveals that although A2 exhibits higher permeability, A1 demonstrates a shorter breakthrough time. This further supports the interpretation that preferential flow pathways likely developed in A1 following supercritical CO2 breakthrough, underscoring that permeability measured with brine may not fully capture the two-phase flow dynamics during CO2 invasion [8].

4.3. Geomechanical Weakening Mechanisms of Caprock Following scCO2-Brine-Rock Interactions

The interaction between supercritical CO2, formation brine, and caprock minerals initiates a complex set of hydro-chemo-mechanical processes that can significantly alter the geomechanical integrity of the sealing formation [48]. Our XRD analysis confirms that our mudstone samples contain several minerals that are susceptible to acidic fluid attack. Specifically, the samples contain 2–3% carbonate minerals (calcite, dolomite) and 5–10% feldspars. The dissolution of these minerals in the weakly acidic environment created by scCO2 injection is an inevitable process, as has been demonstrated by numerous experimental and modeling studies [49,50]. This selective dissolution preferentially occurs on mineral grains that act as cements or part of the load-bearing framework, directly weakening the rock’s cohesion and strength. Furthermore, the creation of new pores or enlargement of existing throats at the micro-scale during dissolution can induce stress concentrations, leading to the initiation and propagation of microcracks. The dramatic reduction in uniaxial compressive strength and the significant increase in Poisson’s ratio (indicating a brittle-to-ductile transition) that we observed are fully consistent with such a damage accumulation process, driven by chemical dissolution and amplified by micro-fracturing [51,52]. The large fraction of clay minerals (21–33%) may also contribute to the weakening process through alterations in their surface properties. We therefore attribute the significant mechanical weakening observed to a synergistic combination of these micro-scale damage mechanisms. The primary weakening mechanisms are driven by mineral dissolution and subsequent fabric destabilization.
Quantitative assessment of caprock integrity following geochemical alteration by scCO2 requires normalization of multiparametric geomechanical and petrophysical data to enable cross-comparison between disparate physical quantities. Our normalization protocol establishes three fundamental metrics for mechanical response: Structural Load-Bearing Retention (SLR), calculated as the ratio of the post-exposure strength to the pre-exposure strength unconfined compressive strength, serves as a direct indicator of residual mechanical competence; Elastic Stiffness Retention (ESR), derived from the equivalent ratio of elastic moduli, quantifies the preservation of deformation resistance; and Lateral Strain Susceptibility (LSS), expressed as the inverse ratio of post-exposure to pre-exposure Poisson’s ratio, captures the propensity for fracture-induced dilatancy. For containment security evaluation, we introduce two complementary indices: the Seal Capacity Index (SCI), a min-max normalized representation of breakthrough pressure, and the Containment Stability Index (CSI), quantifying the temporal resilience of the seal system. Our investigation reveals a fundamental disconnect between pre-existing seal properties and scCO2 induced mechanical degradation patterns in caprocks. The pre-exposure indices SCI and CSI show no clear correlation with subsequent mechanical alteration pathways, indicating that initial seal quality cannot reliably predict scCO2 vulnerability [53].
Comparative analysis of stratigraphically equivalent samples from distinct well locations (B1, B4, B7) reveals that initial mineralogical composition fundamentally determines the selection of damage mechanisms (Figure 14a). In samples characterized by high carbonate content (e.g., B4), dissolution-dominated damage is typically observed, manifested by significant reductions in both SLR and ESR (reductions of 65% were recorded) [54,55,56]. ScCO2, acidified upon dissolution in formation brine, promotes the dissolution of key cementing minerals [57], particularly carbonates and susceptible aluminosilicates [5]. This process selectively attacks the grain-to-grain contacts and the mineral matrix that provides cohesion, effectively reducing the rock’s intrinsic strength and stiffness. The resultant increase in porosity and generation of new or enlarged microcracks act as stress concentrators, facilitating failure at lower applied stresses. Conversely, samples rich in clay minerals (e.g., B1) are found to exhibit pronounced strain localization tendencies, where LSS is dramatically increased to eight times the baseline value. This mechanical response, although accompanied by moderate strength retention, is correlated with compromised long-term containment stability. The acidic environment can alter clay minerals, potentially leading to ion exchange and swelling in certain clay types (e.g., smectite) [6]. Even in low-swelling clays, the alteration in interlayer cations and the hydration state can weaken the attractive forces between clay particles, reducing the frictional resistance and promoting intergranular sliding. The observed increase in Poisson’s ratio indicates a shift from brittle to more ductile deformation behavior. This implies that the caprock may become susceptible to time-dependent compaction and gradual strain accumulation under constant effective stress, potentially leading to long-term seal integrity loss through mechanical creep, rather than abrupt brittle failure [7]. The net geomechanical response is highly heterogeneous and depends on the initial mineralogical composition, which dictates the competition between dissolution-driven weakening and potential precipitation-enhanced strengthening through secondary mineralization [8]. Accurate prediction of caprock stability therefore requires a fundamental understanding of these competing processes and their rates under in situ conditions.
Through vertical profiling of paired well samples (B4, B5) and (B6, B7) (Figure 14b,c), a consistent pattern is established: samples obtained from greater depths are shown to maintain significantly superior mechanical integrity following scCO2 exposure. For instance, the deeper B5 specimen demonstrates remarkable structural competence preservation (SLR = 0.64, ESR = 1.26), whereas its shallower counterpart B4 undergoes catastrophic mechanical degradation (SLR = 0.35, ESR = 0.35). The minimal LSS alteration observed in deeper samples (0.98), when compared to the substantial reduction measured in shallower equivalents (0.01), provides further evidence for this depth-dependent enhancement in scCO2 resistance. This trend can be attributed to the natural diagenetic effects of greater burial depth, such as increased grain contact area, more pressure-solution welding, and the development of more resilient, quartz-dominated cementation, which collectively create a rock fabric less susceptible to chemical attack [36]. The optimal caprock performance is identified in specimens demonstrating high SLR/ESR retention coupled with moderate LSS values (B7), where superior mechanical integrity is effectively integrated with sustained sealing stability.

4.4. Evaluation of Cap Rock Sealing Performance for Offshore CO2 Sequestration in Saline Aquifers

Following CO2 injection into the J-6 well, potential migration pathways may include both vertical leakage through the caprock and lateral flow along permeable strata. Evaluation of the vertical sealing effectiveness indicates that the Hanjiang Formation Section 1 (represented by sample A3) exhibits exceptional sealing properties, characterized by ultra-low permeability (2.41 × 10⁻⁶ mD), high breakthrough pressure (>16 MPa), and extended breakthrough time (>30 min). These attributes suggest that CO2 injection into the target saline aquifer at depths between 1470 and 1500 m, situated beneath this interval, can be deemed secure with a high potential for effective long-term containment [58]. In contrast, the sealing capacity of the overlying Yuehai Formation Section 3 (930–990 m) exhibits significant dependence on injection pressure. Samples from this interval (A1, A2) display moderate breakthrough pressures of approximately 7.5 MPa, coupled with shorter breakthrough times, indicating a relatively higher-risk capillary threshold. Effective containment within this zone is only achievable if injection pressures are strictly controlled below 7.5 MPa; exceeding this critical pressure may lead to capillary failure and initiate vertical or lateral CO2 migration [40].
A dual-index framework was employed for the quantitative assessment of caprock integrity in CO2 geological sequestration, comprising the Integrated Containment Index (ICI) and the Mechanical Damage Index (MDI). The Integrated Containment Index was defined by the equation ICI = (breakthrough pressure/maximum breakthrough pressure) × (breakthrough time/maximum breakthrough time), through which the breakthrough pressure, representing the static threshold, and the breakthrough time, reflecting dynamic stability, were integrated into a unified metric. This index is bounded between 0 and 1, with values approaching unity indicating superior immediate containment efficacy. Complementarily, the MDI was designed to quantify the mechanical degradation induced by scCO2-rock interactions, calculated as MDI = 0.4 × |UCS loss rate| + 0.3 × |elastic modulus change rate| + 0.3 × |Poisson’s ratio change rate| [59]. We propose that when applying this framework to a new setting, researchers should first identify the dominant damage mechanisms, and then could use a data-driven method like PCA to calibrate or tune the weighting coefficients to better reflect the primary damage modes under those specific conditions. Significant weighting was assigned to the Poisson’s ratio change due to its sensitivity as an indicator of micro-fracture network development and the transition from brittle to ductile behavior [53]. This multi-parameter approach is supported by comprehensive reviews of CO2-brine-rock interactions, which emphasize that chemomechanical alterations manifest as significant changes in these fundamental mechanical properties [14,60]. Consequently, elevated MDI values signify greater microstructural instability of the caprock, corresponding to increased long-term integrity risks. This dual-index system advances the evaluation of seal capacity beyond static property prediction towards forecasting its long-term chemo-mechanical evolution.
Specifically, sample B7 (ICI = 0.73, MDI = 24.3) is characterized by superior integrated containment capacity and stable mechanical properties, thereby being classified as an ideal caprock (Figure 15a). In contrast, sample B1 (ICI = 0.78, MDI = 235.2), despite its high initial containment performance, is identified as a high-risk warning caprock due to its significant mechanical degradation, which indicates potential long-term failure risks. A stark contrast is presented by sample B4 (ICI = 0.50, MDI = 2334.7), where the exceptionally low Integrated Containment Index value, coupled with the extremely high Mechanical Damage Index value, demonstrates that catastrophic mechanical damage has been incurred, resulting in its classification as an unsuitable caprock.
In the J-5 injection scenario, the caprock is demonstrated to exhibit effective sealing capacity, with the interval represented by sample B7 showing superior containment characteristics corresponding to Routes 2, 3, and 4 (Figure 15b). However, critical risks are identified in adjacent intervals represented by samples B1 and B4. Although characterized by high ICI values, these intervals are compromised by exceptionally high MDI values, indicating severe mechanical degradation that may lead to long-term failure under persistent sequestration conditions. When CO2 injection is targeted at the 1648–1709 m interval, a multi-well breakthrough sequence may be initiated through these mechanically compromised zones. The presence of high MDI samples (B1, B4) facilitates the development of preferential migration pathways. Initial leakage at J-5 is likely to propagate laterally through the weakened intervals, ultimately leading to caprock breaching at J-1 or J-2. Additionally, the interval corresponding to sample B5, marked by a low ICI value, suggests that Route 1 may serve as a potential conduit for CO2 migration. Therefore, B7 interval identified as the most suitable caprock unit for ensuring secure, long-term CO2 containment, whereas intervals with high MDI values pose substantial risks for containment integrity over time.
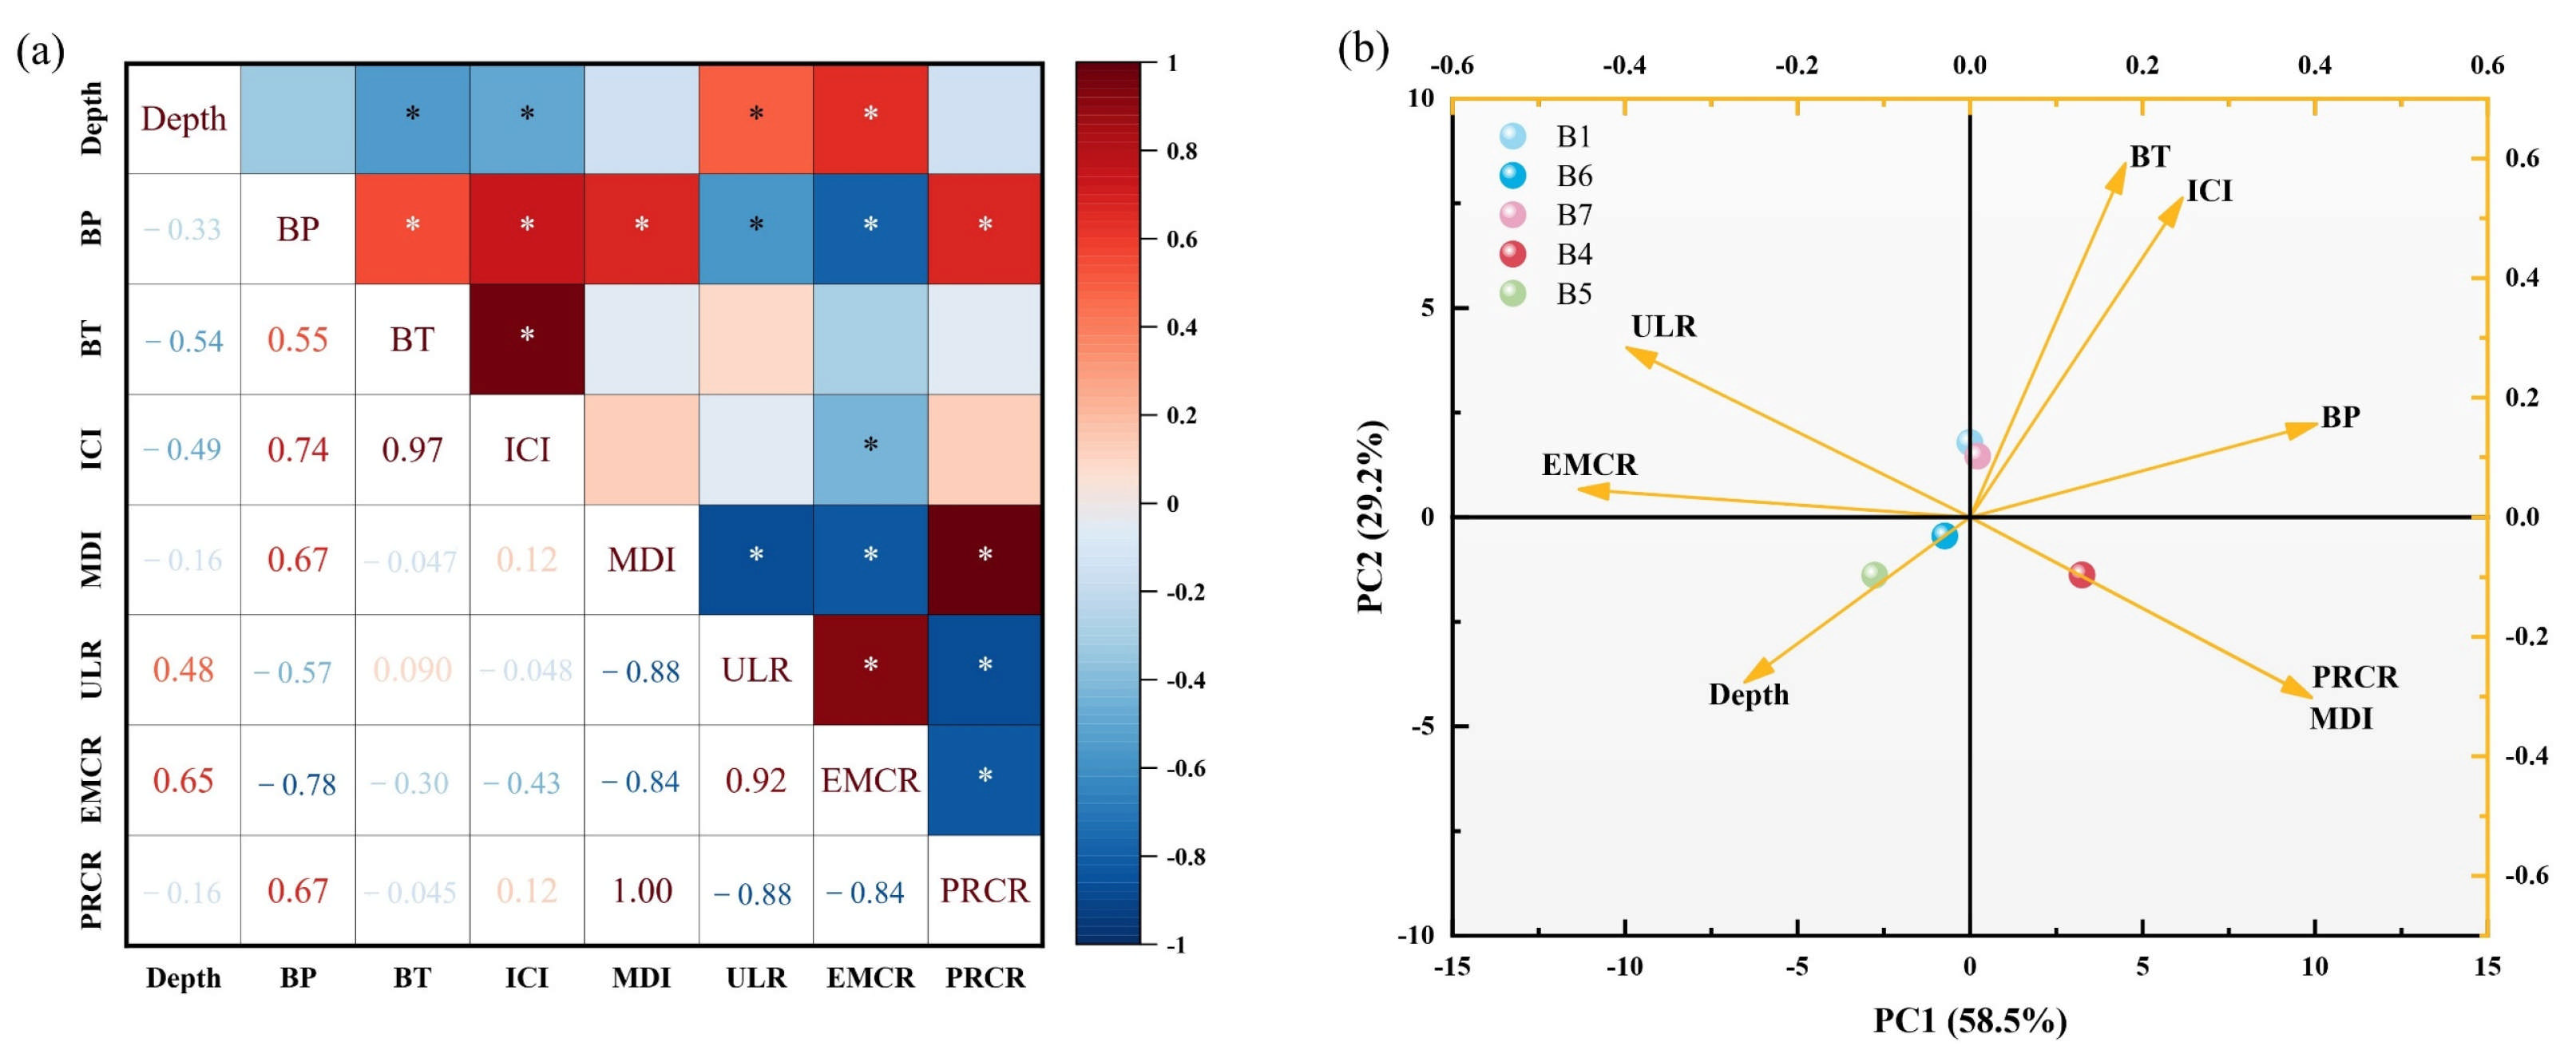
The correlation matrix provides critical statistical validation for the caprock sealing evolution mechanism (Figure 16a), where a strong negative correlation (r = −0.88) between the MDI and ICI mathematically confirms mechanical degradation as the fundamental driver of sealing performance deterioration. Complete collinearity (r = 1.00) between the MDI and Poisson’s Ratio Change Rate establishes dramatic Poisson’s ratio variation as both the ultimate representation of microstructural damage and a key early-warning indicator for caprock failure. A moderate positive correlation (r = 0.55) between breakthrough pressure and breakthrough time supports the necessity of the composite ICI, while the absence of significant correlations between key parameters (ICI, MDI, mechanical parameters) and burial depth indicates lithology and CO2-rock interactions are dominant controlling factors over macroscopic geological context [60]. This heatmap statistically integrates microscopic mechanical mechanisms with macroscopic sealing performance, constructing a complete evidence chain.
The PCA successfully reduced our complex, multivariate data into two principal components that collectively explain a remarkable 87.7% of the total variance (Figure 16b). The first principal component (PC1, 58.5%) clearly defines an axis of “Strength/Stiffness Degradation,” being heavily loaded by the UCS Loss Rate (ULR) and Elastic Modulus Change Rate (EMCR) in the negative direction. B4 positioned in the lower-right quadrant with a high positive score on PC1, is characterized by the most dramatic increase in ductility (highest PRCR and MDI) coupled with a relatively high breakthrough pressure (BP). However, its dynamic sealing efficiency (ICI, BT) is not prominent. This strongly indicates that the dominant weakening mode for B4 is a fundamental structural brittle-to-ductile transition rather than a change in pore network connectivity. In stark contrast, B7 and B1 occupy the upper-left quadrant, representing a behavior of “high sealing efficiency with moderate strength degradation.” These samples exhibit the most favorable dynamic sealing performance (highest ICI and BT). While they also experience a degree of strength and stiffness loss (ULR, EMCR), it is far less severe than in other samples. Consequently, these two samples represent the most ideal caprock material, capable of effectively retarding CO2 migration without undergoing catastrophic mechanical failure. B5 and B6 are located in the left quadrants with the most negative scores on PC1, identifying them as archetypes of “severe strength and stiffness degradation”. ULR and EMCR are identified by PCA as belonging to the same, dominant damage dimension. Within this dimension, the loading of ULR is slightly higher than that of EMCR, which aligns perfectly with our rationale of assigning ULR the highest weight (0.4) to emphasize its primary importance. The PCA demonstrates that ULR, EMCR, and PRCR are precisely the three key variables that collectively define the primary axis of damage (PC1). Assigning significant and comparable weights (0.3) to EMCR and PRCR appropriately reflects their crucial roles as the other key components defining this spectrum.
While our model does not incorporate thickness, we fully agree that it is a first-order control on overall containment security. Our indices characterize the quality of the seal material. The overall risk is a function of both this quality and the seal’s geometric dimensions. Thickness acts as a crucial scaling factor. For instance, a caprock interval with a high Mechanical Damage Index (MDI) might still be deemed acceptable if it possesses a substantial thickness. Conversely, an interval with excellent material properties (high Integrated Containment Index, ICI) would carry a high risk if it is perilously thin, as it would have minimal tolerance for any geological defects.

4.5. Implications for Reservoir-Scale Modeling and Upscaling

We propose that the caprock should no longer be treated as a homogeneous unit. Instead, based on our experimental data, stochastic fields or multi-layered geological models should be employed to represent its extreme permeability heterogeneity. To capture the mechanical weakening process, we propose the development of a damage evolution constitutive model within geomechanical simulators. The core of this model is to link the mechanical parameters (UCS, E, ν) to a “chemical damage variable (D)”. Ultimately, the goal is to integrate the above points into a fully coupled THMC (Thermo-Hydro-Mechanical-Chemical) model (Figure 17).

5. Conclusions

This paper integrates permeability measurements, supercritical CO2 (scCO2) breakthrough pressure tests, and uniaxial mechanical experiments to systematically investigate the sealing integrity and mechanical stability of mudstone caprocks for offshore saline aquifer CO2 sequestration in the Pearl River Mouth Basin. The key findings and conclusions are as follows:
(1)
Our results reveal extreme vertical permeability heterogeneity (10−6–10−1 mD) in Yuehai and Hanjiang Formation caprocks, driven by diagenetic processes rather than macroscopic lithology. Permeability is decoupled from scCO2 breakthrough pressure—breakthrough pressure is governed by maximum pore-throat radius, whereas breakthrough time depends on post-breakthrough pore network topology.
(2)
ScCO2-brine-rock interactions induce pronounced geomechanical weakening, with uniaxial compressive strength decreasing by up to 71.7% and the elastic modulus reducing, while a substantial increase in Poisson’s ratio signifies a fundamental transition from brittle to ductile behavior.
(3)
Hanjiang Formation Section 1 (sample A3) exhibits optimal sealing (2.41 × 10⁻⁶ mD permeability, breakthrough pressure greater than 16 MPa), ensuring secure CO2 sequestration in the underlying 1470–1500 m aquifer. Yuehai Formation Section 3 requires injection pressures less than 7.5 MPa to prevent leakage, with multi-well scenarios demanding pressure control and stability monitoring.

Author Contributions

J.L.: Writing—original draft, Writing—review and editing, Visualization, Software, Investigation, Formal analysis. J.C.: Data curation, Project administration, Supervision. J.P.: Validation, Methodology, Writing—review and editing, Resources. Y.M.: Writing—review and editing, Methodology, Supervision. Q.G.: Funding acquisition, Conceptualization, Project administration. All authors have read and agreed to the published version of the manuscript.

Funding

The research project is funded by the Fundamental Research Funds for the Central Universities (Project No. 2023CDJKYJH041) and the Natural Science Foundation of Chongqing, China (Grant No. CSTB2024NSCQ-MSX0433).

Data Availability Statement

The original contributions presented in this study are included in the article. Further inquiries can be directed to the corresponding author.

Conflicts of Interest

The authors declare that there are no conflicts of interest regarding the publication of this article.

References

  1. Liu, G.; Shang, D.; Zhang, L.; Xie, S.; Pan, W. Short-term interactions between Longmaxi shale and carbon dioxide-based fracturing fluids. Heliyon 2024, 10, e38575. [Google Scholar] [CrossRef]
  2. Zhang, M.; Qiu, Y.; Li, C.; Cui, T.; Yang, M.; Yan, J.; Yang, W. A Habitable Earth and Carbon Neutrality: Mission and Challenges Facing Resources and the Environment in China—An Overview. Int. J. Environ. Res. Public Health 2023, 20, 1045. [Google Scholar] [CrossRef]
  3. Lu, P.; Liu, W.; Gao, C.; Zhao, J.; Bai, Y. Evaluation of carbon dioxide storage in the deep saline layer of the Ordovician Majiagou Formation in the Ordos Basin. IOP Conf. Ser. Earth Environ. Sci. 2021, 675, 012058. [Google Scholar] [CrossRef]
  4. Skerbisch, L.; Misch, D.; Drews, M.; Stollhofen, H.; Sachsenhofer, R.F.; Arnberger, K.; Schuller, V.; Zamolyi, A. Regional mudstone compaction trends in the Vienna Basin: Top seal assessment and implications for uplift history. Int. J. Earth Sci. 2023, 112, 1901–1921. [Google Scholar] [CrossRef]
  5. Wu, W.; Zoback, M.D.; Kohli, A.H. The impacts of effective stress and CO2 sorption on the matrix permeability of shale reservoir rocks. Fuel 2017, 203, 179–186. [Google Scholar] [CrossRef]
  6. Li, Y.; Zha, M.; Song, R.; Aplin, A.C.; Bowen, L.; Wang, X.; Zhang, Y. Microstructure and pore systems of shallow-buried fluvial mudstone caprocks in Zhanhua depression, east China inferred from SEM and MICP. Mar. Pet. Geol. 2021, 132, 105189. [Google Scholar] [CrossRef]
  7. Han, H.; Zhang, Q.; Lv, W.; Han, L.; Ji, Z.; Zhang, S.; Zhao, C.; Kang, H.; Sun, L.; Shen, R. Experimental evaluation of velocity sensitivity for conglomerate reservoir rock in Karamay oil field. Sci. Eng. Compos. Mater. 2023, 30, 20220204. [Google Scholar] [CrossRef]
  8. Jayasekara, D.W.; Ranjith, P.G.; Wanniarachchi, W.A.M.; Rathnaweera, T.D.; Van Gent, D. CO2-brine-caprock interaction: Reactivity experiments on mudstone caprock of South-west Hub geo-sequestration project. J. Pet. Sci. Eng. 2020, 189, 107011. [Google Scholar] [CrossRef]
  9. Lin, R.; Ren, L.; Zhao, J.; Tan, X.; Rasouli, V.; Wang, X.; Wu, J.; Song, Y.; Shen, C. Stress and pressure dependent permeability of shale rock: Discrete element method (DEM) simulation on digital core. J. Pet. Sci. Eng. 2022, 208, 109797. [Google Scholar] [CrossRef]
  10. Fujii, T.; Uehara, S.-i.; Sorai, M. Effective Confining stress Depending on Fluid Flow and Capillary Sealing Properties of Mudstones for CO2 Geological Sequestration. Energy Procedia 2014, 63, 3305–3312. [Google Scholar] [CrossRef]
  11. Gao, S.; Wei, N.; Li, X.; Wang, Y.; Wang, Q. Cap Rock CO2 Breakthrough Pressure Measurement Apparatus and Application in Shenhua CCS Project. Energy Procedia 2014, 63, 4766–4772. [Google Scholar] [CrossRef]
  12. Gao, T.; Wang, X.; Wang, H.; Gu, C.; Zhou, Z.; Yang, Z. A Study on the Breakthrough Pressure of Porous Rock Formations in Gas Storage Reservoirs. Processes 2024, 12, 2193. [Google Scholar] [CrossRef]
  13. Yang, W.; Bai, Y.; Sun, X.; Wang, J.; Long, G.; Li, H.; Zuo, M.; Li, H. The influence of hydrocarbon generation on the sealing capability of mudstone caprock rich in organic matter. Sci. Rep. 2024, 14, 1846. [Google Scholar] [CrossRef]
  14. Vafaie, A.; Cama, J.; Soler, J.M.; Kivi, I.R.; Vilarrasa, V. Chemo-hydro-mechanical effects of CO2 injection on reservoir and seal rocks: A review on laboratory experiments. Renew. Sustain. Energy Rev. 2023, 178, 113270. [Google Scholar]
  15. Lyu, Q.; Deng, J.; Shen, Y.; Ding, Y.; Shi, Y.; Feng, G.; Tan, J. Effects of supercritical CO2, water, and supercritical CO2-based water on the mechanical properties and fracturability of shale. J. Rock Mech. Geotech. Eng. 2024, 17, 3001–3017. [Google Scholar] [CrossRef]
  16. Wang, Z.; Tang, X.; Jing, T.; Du, K.; Zhao, W.; Shan, Y.; Guan, Z.; Li, Z. Comparison of mineral transformation in CO2 geological storage under CO2-water-sandstone and mudstone reactions. Geoenergy Sci. Eng. 2024, 242, 213215. [Google Scholar]
  17. Li, Y.; Tian, H.L.; Zhuo, Z.; Sun, Y. The Potential Effect of CO2-Water-Rock Reaction on The Caprock Formation (Mudstone) Case Study. Adv. Mater. Res. 2012, 518–523, 140–143. [Google Scholar]
  18. Su, E.; Liang, Y.; Chang, X.; Zou, Q.; Xu, M.; Sasmito, A.P. Effects of cyclic saturation of supercritical CO2 on the pore structures and mechanical properties of bituminous coal: An experimental study. J. CO2 Util. 2020, 40, 101208. [Google Scholar] [CrossRef]
  19. Rohmer, J.; Pluymakers, A.; Renard, F. Mechano-chemical interactions in sedimentary rocks in the context of CO2 storage: Weak acid, weak effects? Earth-Sci. Rev. 2016, 157, 86–110. [Google Scholar]
  20. Zhang, X.; Ranjith, P.G.; Lu, Y.; Ranathunga, A.S. Experimental investigation of the influence of CO2 and water adsorption on mechanics of coal under confining pressure. Int. J. Coal Geol. 2019, 209, 117–129. [Google Scholar] [CrossRef]
  21. Zheng, H.; Feng, X.-T.; Pan, P.-Z. Experimental investigation of sandstone properties under CO2–NaCl solution-rock interactions. Int. J. Greenh. Gas Control 2015, 37, 451–470. [Google Scholar]
  22. Akono, A.-T.; Dávila, G.; Druhan, J.; Shi, Z.; Jessen, K.; Tsotsis, T. Influence of geochemical reactions on the creep behavior of Mt. Simon sandstone. Int. J. Greenh. Gas Control 2020, 103, 103183. [Google Scholar] [CrossRef]
  23. Hu, S.; Li, X.; Bai, B.; Shi, L.; Liu, M.; Wu, H. A modified true triaxial apparatus for measuring mechanical properties of sandstone coupled with CO2-H2O biphase fluid. Greenh. Gases Sci. Technol. 2016, 7, 78–91. [Google Scholar] [CrossRef]
  24. Cui, G.; Wang, Y.; Rui, Z.; Chen, B.; Ren, S.; Zhang, L. Assessing the combined influence of fluid-rock interactions on reservoir properties and injectivity during CO2 storage in saline aquifers. Energy 2018, 155, 281–296. [Google Scholar] [CrossRef]
  25. Cui, G.; Zhang, L.; Tan, C.; Ren, S.; Zhuang, Y.; Enechukwu, C. Injection of supercritical CO2 for geothermal exploitation from sandstone and carbonate reservoirs: CO2-water-rock interactions and their effects. J. CO2 Util. 2017, 20, 113–128. [Google Scholar] [CrossRef]
  26. Farquhar, S.M.; Pearce, J.K.; Dawson, G.K.W.; Golab, A.; Sommacal, S.; Kirste, D.; Biddle, D.; Golding, S.D. A fresh approach to investigating CO2 storage: Experimental CO2-water-rock interactions in a low-salinity reservoir system. Chem. Geol. 2015, 399, 98–122. [Google Scholar] [CrossRef]
  27. Lin, H.; Fujii, T.; Takisawa, R.; Takahashi, T.; Hashida, T. Experimental evaluation of interactions in supercritical CO2-water-rock minerals system under geologic CO2 sequestration conditions. J. Mater. Sci. 2008, 43, 2307–2315. [Google Scholar]
  28. Park, J.; Choi, B.-Y.; Lee, M.; Yang, M. Porosity changes due to analcime in a basaltic tuff from the Janggi Basin, Korea: Experimental and geochemical modeling study of CO2-water-rock interactions. Environ. Earth Sci. 2021, 80, 81. [Google Scholar]
  29. Wang, T.; Wang, H.; Zhang, F.; Xu, T. Simulation of CO2-water-rock interactions on geologic CO2 sequestration under geological conditions of China. Mar. Pollut. Bull. 2013, 76, 307–314. [Google Scholar] [CrossRef]
  30. Zhou, X.; Sang, S.; Niu, Q.; Zhang, K.; Liu, F.; Wang, W.; Chang, J. Changes of Multiscale Surface Morphology and Pore Structure of Mudstone Associated with Supercritical CO2-Water Exposure at Different Times. Energy Fuels 2021, 35, 4212–4223. [Google Scholar] [CrossRef]
  31. Khosravi, M.H.; Kheirollahi, M.; Liu, B.; Gentzis, T.; Liu, K.; Morta, H.B.; Ostadhassan, M. Physico-chemo-mechanical impact of sc-CO2 on shale formations: The Bakken. Gas Sci. Eng. 2023, 112, 204945. [Google Scholar] [CrossRef]
  32. Berrezueta, E.; Kovacs, T.; Herrera-Franco, G.; Mora-Frank, C.; Caicedo-Potosí, J.; Carrion-Mero, P.; Carneiro, J. Laboratory studies on CO2-brine-rock interaction: An analysis of research trends and current knowledge. Int. J. Greenh. Gas Control 2023, 123, 103842. [Google Scholar] [CrossRef]
  33. Winhausen, L.; Amann-Hildenbrand, A.; Fink, R.; Jalali, M.; Khaledi, K.; Hamdi, P.; Urai, J.L.; Schmatz, J.; Amann, F. A comparative study on methods for determining the hydraulic properties of a clay shale. Geophys. J. Int. 2021, 224, 1523–1539. [Google Scholar] [CrossRef]
  34. Faulkner, D.R.; Rutter, E.H. Comparisons of water and argon permeability in natural clay-bearing fault gouge under high pressure at 20 °C. J. Geophys. Res. Atmos. 2000, 105, 16415–16426. [Google Scholar]
  35. Blunt, M.J.; Bijeljic, B.; Dong, H.; Gharbi, O.; Iglauer, S.; Mostaghimi, P.; Paluszny, A.; Pentland, C. Pore-scale imaging and modelling. Adv. Water Resour. 2013, 51, 197–216. [Google Scholar] [CrossRef]
  36. Dewhurst, D.N.; Aplin, A.C.; Sarda, J.P. Influence of clay fraction on pore-scale properties and hydraulic conductivity of experimentally compacted mudstones. J. Geophys. Res. Solid Earth 1999, 104, 29261–29274. [Google Scholar] [CrossRef]
  37. Bjørlykke, K. Relationships between depositional environments, burial history and rock properties. Some principal aspects of diagenetic process in sedimentary basins. Sediment. Geol. 2014, 301, 1–14. [Google Scholar] [CrossRef]
  38. McBride, E.F. Quartz cement in sandstones: A review. Earth-Sci. Rev. 1989, 26, 69–112. [Google Scholar] [CrossRef]
  39. Tyrologou, P.; Vamvaka, A.; Koukouzas, N.; Pedro, J.; Fleury, M.; Carneiro, J.; Ribeiro, C.; Ghikas, D.; Mpatsi, A.; Barradas, J.P.; et al. Progress for carbon dioxide geological storage in West Macedonia: A field and laboratory-based survey. Open Res. Eur. 2023, 3, 85. [Google Scholar] [CrossRef]
  40. Hildenbrand, A.; Schlömer, S.; Krooss, B.M. Gas breakthrough experiments on fine-grained sedimentary rocks. Geofluids 2002, 2, 3–23. [Google Scholar] [CrossRef]
  41. Schowalter, T.T. Mechanics of secondary hydrocarbon migration and entrapment. AAPG Bull. 1979, 63, 723–760. [Google Scholar] [CrossRef]
  42. Hildenbrand, A.; Schlömer, S.; Krooss, B.; Littke, R. Gas breakthrough experiments on pelitic rocks: Comparative study with N2, CO2 and CH4. Geofluids 2004, 4, 61–80. [Google Scholar] [CrossRef]
  43. Amann-Hildenbrand, A.; Ghanizadeh, A.; Krooss, B.M. Transport properties of unconventional gas systems. Mar. Pet. Geol. 2012, 31, 90–99. [Google Scholar] [CrossRef]
  44. Chalmers, G.R.; Bustin, R.M.; Power, I.M. Characterization of gas shale pore systems by porosimetry, pycnometry, surface area, and field emission scanning electron microscopy/transmission electron microscopy image analyses: Examples from the Barnett, Woodford, Haynesville, Marcellus, and Doig units. AAPG Bull. 2012, 96, 1099–1119. [Google Scholar] [CrossRef]
  45. Berg, S.; Ott, H.; Klapp, S.A.; Schwing, A.; Neiteler, R.; Brussee, N.; Makurat, A.; Leu, L.; Enzmann, F.; Schwarz, J.-O. Real-time 3D imaging of Haines jumps in porous media flow. Proc. Natl. Acad. Sci. USA 2013, 110, 3755–3759. [Google Scholar] [CrossRef]
  46. Tokunaga, T.K.; Wan, J.; Jung, J.W.; Kim, T.W.; Kim, Y.; Dong, W. Capillary pressure and saturation relations for supercritical CO2 and brine in sand: High-pressure Pc (Sw) controller/meter measurements and capillary scaling predictions. Water Resour. Res. 2013, 49, 4566–4579. [Google Scholar] [CrossRef]
  47. Busch, A.; Amann-Hildenbrand, A. Predicting capillarity of mudrocks. Mar. Pet. Geol. 2013, 45, 208–223. [Google Scholar] [CrossRef]
  48. Iglauer, S. Dissolution Trapping of Carbon Dioxide in Reservoir Formation Brine—A Carbon Storage Mechanism; INTECH Open Access Publisher: London, UK, 2011. [Google Scholar]
  49. Bhuiyan, M.H.; Agofack, N.; Gawel, K.M.; Cerasi, P.R. Micro-and macroscale consequences of interactions between CO2 and shale rocks. Energies 2020, 13, 1167. [Google Scholar] [CrossRef]
  50. Gaus, I. Role and impact of CO2–rock interactions during CO2 storage in sedimentary rocks. Int. J. Greenh. Gas Control 2010, 4, 73–89. [Google Scholar] [CrossRef]
  51. Zhang, Y.; Lebedev, M.; Sarmadivaleh, M.; Barifcani, A.; Iglauer, S. Change in Geomechanical Properties of Limestone Due to Supercritical CO2 Injection. In Proceedings of the SPE Asia Pacific Oil and Gas Conference and Exhibition, Perth, Australia, 25–27 October 2016. [Google Scholar]
  52. Marbler, H.; Erickson, K.P.; Schmidt, M.; Lempp, C.; Pöllmann, H. Geomechanical and geochemical effects on sandstones caused by the reaction with supercritical CO2: An experimental approach to in situ conditions in deep geological reservoirs. Environ. Earth Sci. 2013, 69, 1981–1998. [Google Scholar] [CrossRef]
  53. Rutqvist, J. The geomechanics of CO2 storage in deep sedimentary formations. Geotech. Geol. Eng. 2012, 30, 525–551. [Google Scholar] [CrossRef]
  54. Hangx, S.; van der Linden, A.; Marcelis, F.; Bauer, A. The effect of CO2 on the mechanical properties of the Captain Sandstone: Geological storage of CO2 at the Goldeneye field (UK). Int. J. Greenh. Gas Control 2013, 19, 609–619. [Google Scholar] [CrossRef]
  55. Liu, F.; Lu, P.; Griffith, C.; Hedges, S.W.; Soong, Y.; Hellevang, H.; Zhu, C. CO2–brine–caprock interaction: Reactivity experiments on Eau Claire shale and a review of relevant literature. Int. J. Greenh. Gas Control 2012, 7, 153–167. [Google Scholar] [CrossRef]
  56. Al-Ameri, W.A.; Abdulraheem, A.; Mahmoud, M. Long-term effects of CO2 sequestration on rock mechanical properties. J. Energy Resour. Technol. 2016, 138, 012201. [Google Scholar] [CrossRef]
  57. Rathnaweera, T.; Ranjith, P.; Perera, M. Experimental investigation of geochemical and mineralogical effects of CO2 sequestration on flow characteristics of reservoir rock in deep saline aquifers. Sci. Rep. 2016, 6, 19362. [Google Scholar] [CrossRef]
  58. Song, J.; Zhang, D. Comprehensive Review of Caprock-Sealing Mechanisms for Geologic Carbon Sequestration. Environ. Sci. Technol. 2012, 47, 9–22. [Google Scholar] [CrossRef]
  59. Ozotta, O.; Kolawole, O.; Lamine Malki, M.; Ore, T.; Gentzis, T.; Fowler, H.; Liu, K.; Ostadhassan, M. Nano- to macro-scale structural, mineralogical, and mechanical alterations in a shale reservoir induced by exposure to supercritical CO2. Appl. Energy 2022, 326, 120051. [Google Scholar] [CrossRef]
  60. An, Q.; Zhang, Q.; Zhang, X.; Li, X.; Yu, H.; Liu, Y. Influence of Mineralogy on Rock Mechanical Behaviour Considering Dynamic Alteration Damage Caused by scCO2: A Comparative Study on Different Rock Types. Rock Mech. Rock Eng. 2022, 55, 3129–3151. [Google Scholar] [CrossRef]
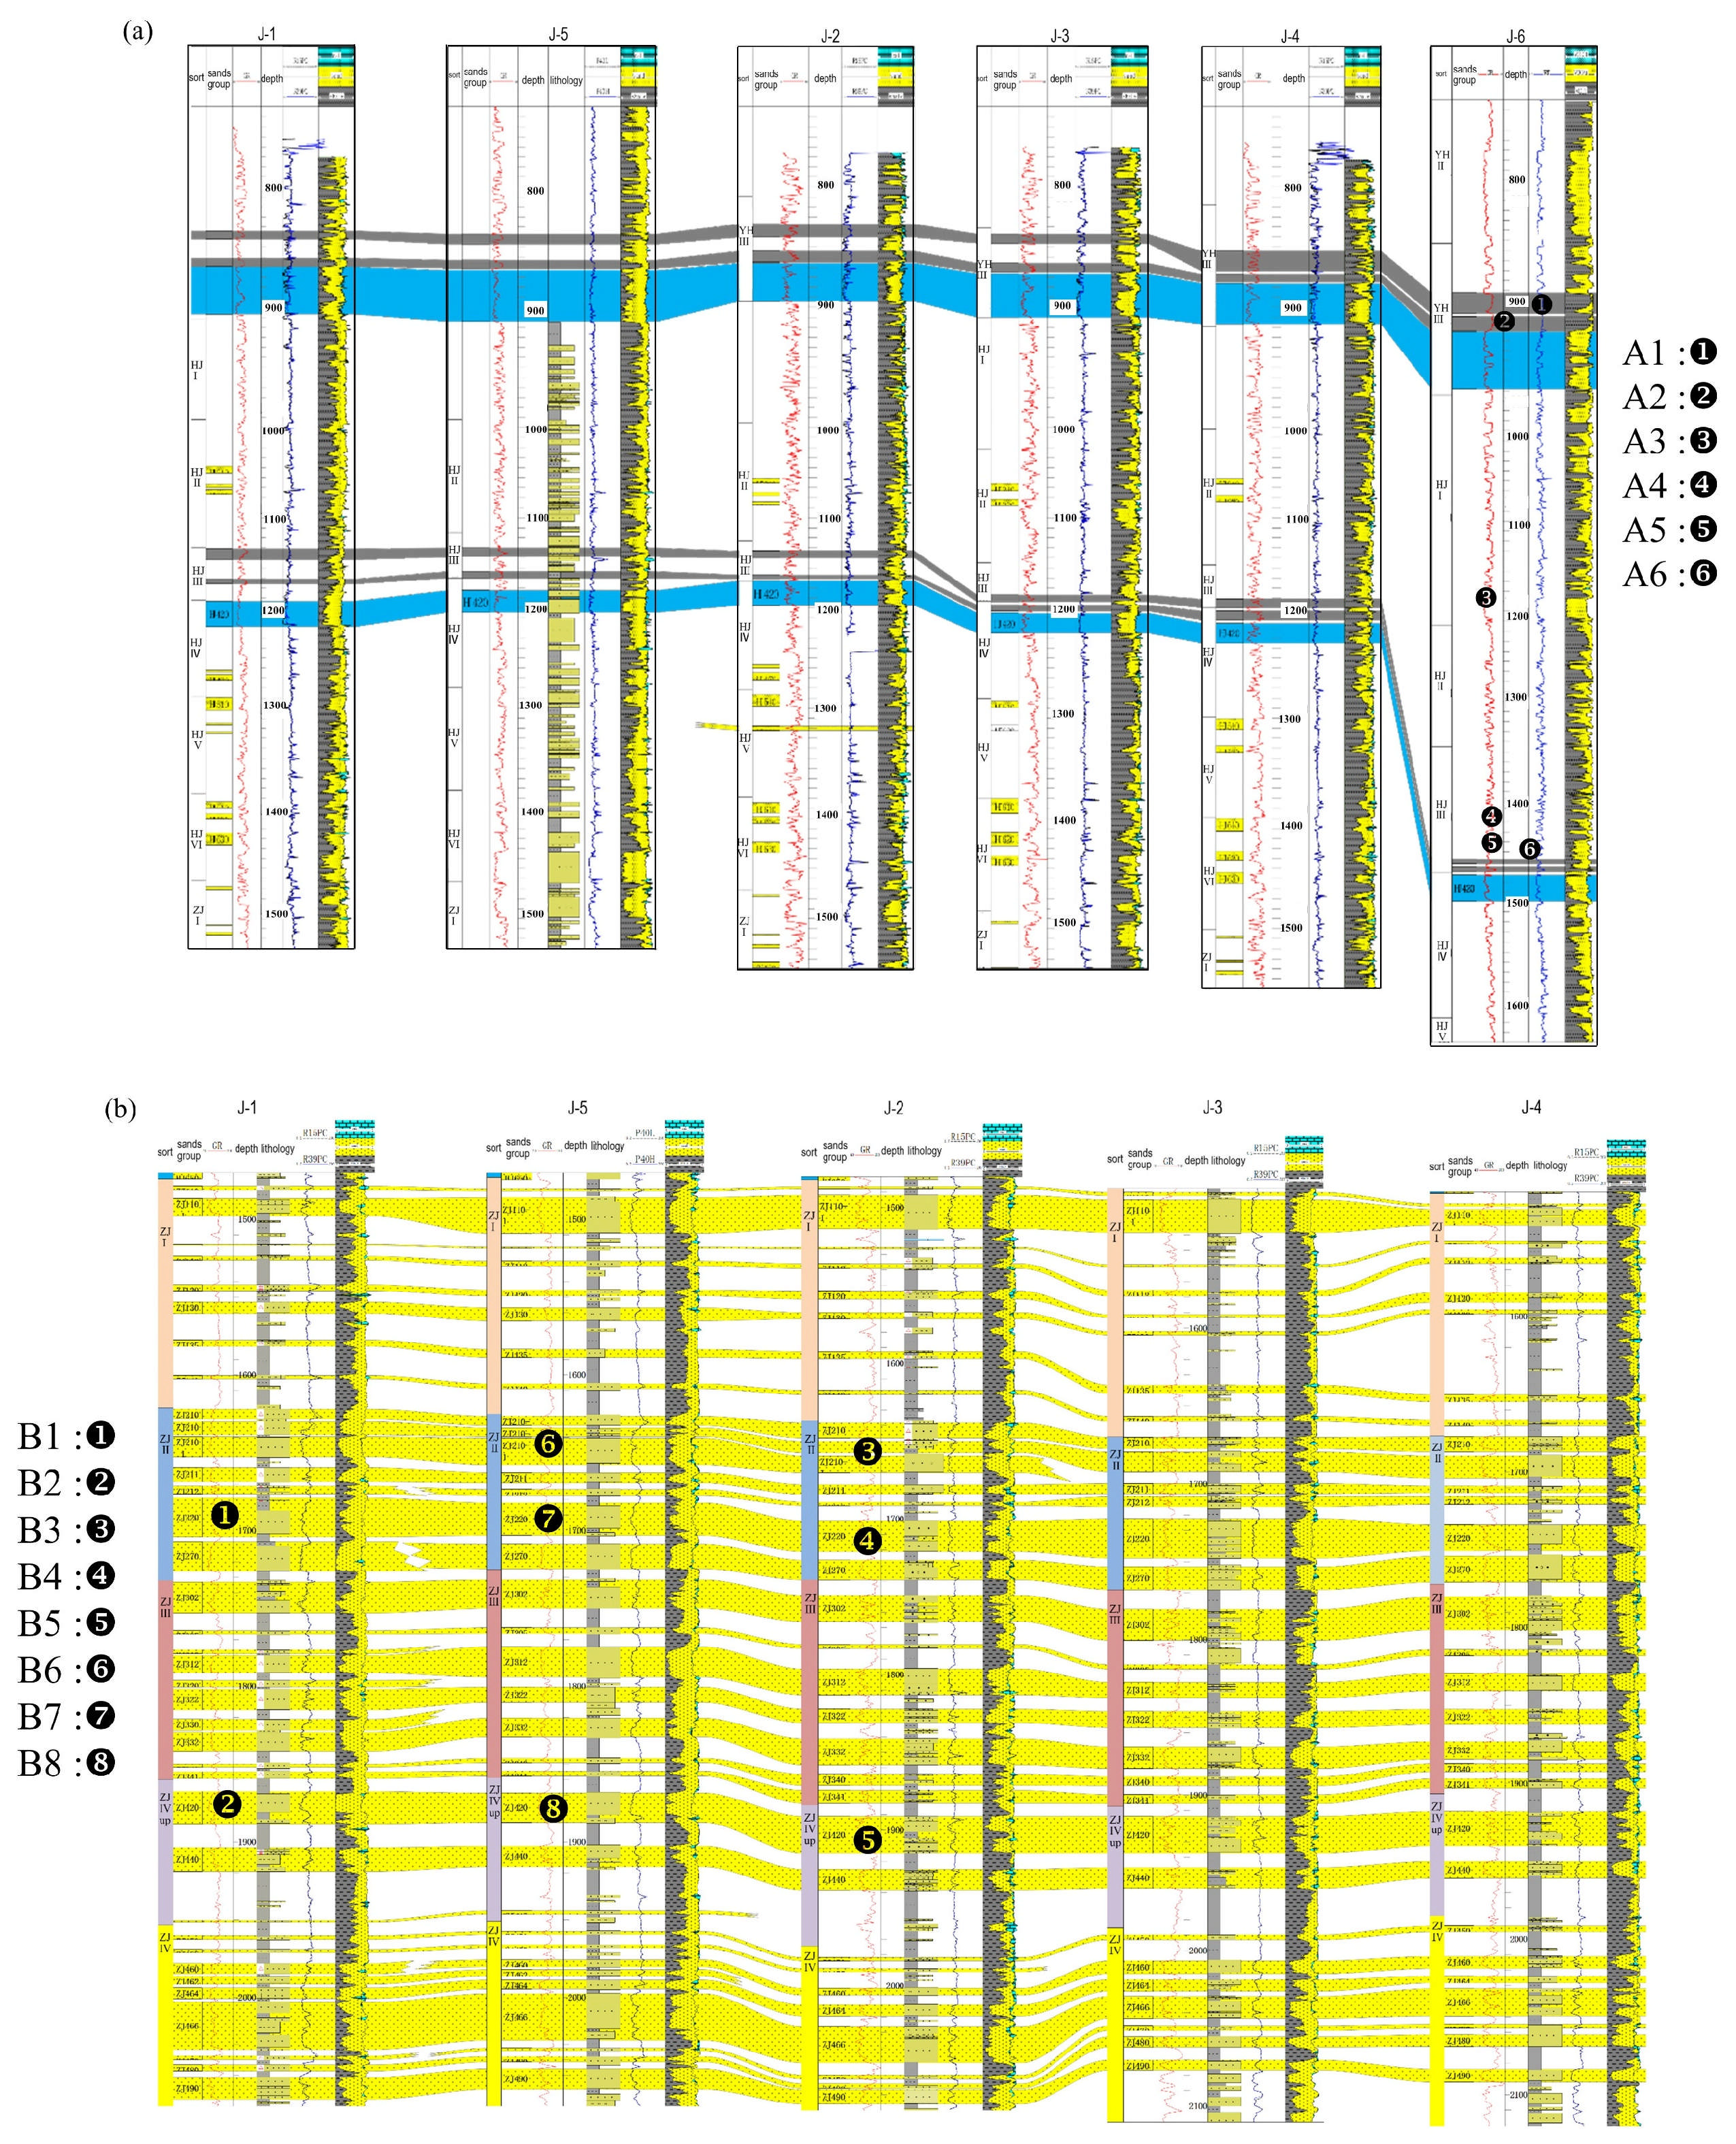
Figure 1. (a) Coring well section diagram. (b) Reconstituted core sample sampling site.
Energies 18 06033 g001
Figure 2. (a) Homemade mold. (b) Sample preparation. (c) Formed sample.
Energies 18 06033 g002
Figure 3. Comparison of the bulk mineral compositions from X-ray diffraction (XRD) analysis for (a) the representative natural core A1 and (b) the reconstituted core B1.
Energies 18 06033 g003
Figure 4. Ultra-low permeability measurement system. (a) Physical drawing. (b) Schematic drawing.
Energies 18 06033 g004
Figure 5. Flow Block Diagram of the Permeability Calculation Program Using the Oscillation Method.
Energies 18 06033 g005
Figure 6. (a) CO2 constant pressure constant flow pump. (b) Supercritical CO2 gas breakthrough device. (c) Loading sample. (d) Part of the sample breakthrough phenomenon.
Energies 18 06033 g006
Figure 7. Flow chart of soaking system equipment. (a) Physical drawing. (b) Schematic drawing.
Energies 18 06033 g007
Figure 8. (a) The experimental results of supercritical CO2 breakthrough in well core samples. Colors correspond to sampling depth, and point sizes scale with breakthrough time. (b) Matrix of pairwise Pearson’s correlation coefficients for depth, permeability, breakthrough pressure (BP), and breakthrough time (BT). p < 0.05 is marked with asterisks.
Energies 18 06033 g008
Figure 9. Micro-CT imaging and pore network model (PNM) analysis of samples A1 and A2. Representative 2D cross-sectional slices from the reconstructed 3D volumes of A1 (a) and A2 (b). 3D visualizations of the extracted pore network models for A1 (c) and A2 (d). In the PNMs, the spheres represent pore bodies, scaled by their volume, and the blue cylinders represent the connecting throats. (eh) Quantitative comparison of key geometric and topological parameters extracted from the PNM.
Energies 18 06033 g009
Figure 10. (a) Experimental results of supercritical CO2 breakthrough in reconstituted core sample. Color gradients correspond to sampling depths, while point sizes scale proportionally with breakthrough time. (b) Matrix of pairwise Pearson’s correlation coefficients for depth, breakthrough pressure (BP), and breakthrough time (BT). p < 0.05 is marked with asterisks.
Energies 18 06033 g010
Figure 11. Evolution of the mechanical behavior of mudstone following supercritical CO2 immersion. The complete stress–strain curves show the (a) initial, pristine state compared to the (b) post-saturation state, characterized by a pronounced decrease in peak strength, elastic modulus, and a transition towards more brittle failure.
Energies 18 06033 g011
Figure 12. Impact of scCO2 immersion on the mechanical properties and degradation modes of mudstone caprock. (ac) Statistical distribution of key mechanical parameters before and after scCO2 immersion. (a) Uniaxial compressive strength, (b) Elastic modulus, (c) Poisson’s ratio. Data are presented as half-violin plots, with internal box plots showing the median and interquartile range. Asterisks indicate statistical significance based on the Wilcoxon signed-rank test (ns: not significant; * p < 0.05). (d) Ternary diagram of mechanical degradation modes. The diagram illustrates the dominant factors governing the mechanical changes in different samples, with positions determined by the relative contributions of uniaxial compressive strength loss, elastic modulus loss, and Poisson’s ratio increase. (e) Geographical location and vertical distribution of samples.
Energies 18 06033 g012
Figure 13. Variation in Poisson’s ratio before and after supercritical CO2 immersion.
Energies 18 06033 g013
Figure 14. Radar chart analysis reveals distinct mechanical degradation regimes in caprocks following scCO2 exposure, (a) investigates the lateral heterogeneity of the caprock properties by comparing samples from the same depth but different wells, (b,c) examine the vertical evolution of the caprock properties with burial depth by comparing samples from the same well but at different depths.
Energies 18 06033 g014
Figure 15. Risk Assessment and 3D Distribution of Caprock Seal Integrity after scCO2 Exposure. (a) Seal integrity risk matrix. The cross-plot of the Mechanical Damage Index (MDI) against the Integrated Containment Index (ICI) classifies the mudstone samples into four distinct risk categories. Samples in the optimal zone (IV) exhibit high containment capacity and minimal mechanical damage. Samples in the high-risk warning zone (III) possess high initial containment but severe mechanical damage, indicating high long-term failure risk. The critically damaged zone (II) shows both compromised containment and catastrophic mechanical degradation. The stable but inefficient zone (I) comprises samples with low containment capacity but high mechanical stability. The dashed lines indicate the threshold values (ICI = 0.5; MDI = 100). (b) Three-dimensional distribution of seal integrity and potential scCO2 migration pathways. Arrows schematically indicate potential scCO2 migration pathways, which preferentially develop through intervals characterized by high MDI values.
Energies 18 06033 g015
Figure 16. (a) Correlation Matrix of Key Parameters Governing Caprock Seal Integrity. The correlation coefficients between depth, breakthrough pressure (BP), breakthrough time (BT), Integrated Containment Index (ICI), Mechanical Damage Index (MDI), uniaxial compressive strength loss rate (ULR), elastic modulus change rate (EMCR), and Poisson’s ratio change rate (PRCR) are displayed. p < 0.05 is marked with asterisks. (b) Principal Component Analysis (PCA) biplot, showing the relationship between the original variables (orange vectors, corresponding to the top/right axes) and the sample scores (colored points, corresponding to the bottom/left axes) in the space of the first two principal components.
Energies 18 06033 g016
Figure 17. Integrated Framework for Reservoir-Scale CO2 sequestration Modeling Framework, “*” for p < 0.05 (significant), “ns” indicates a non-significant correlation (p > 0.05).
Energies 18 06033 g017
Table 1. Test scheme.
Experimental ContentTarget HashtagMeasuring Depth (m)Sample TypeLayerSample No.
Permeability testJ-6905Well coreYuehai Formation Section 3A1
929Yuehai Formation Section 3A2
1200Hanjiang Formation Section 1A3
1444Hanjiang Formation Section 3A4
1467Hanjiang Formation Section 3A5
1468Hanjiang Formation Section 3A6
Supercritical CO2 breakthrough pressure testJ-6905Well coreYuehai Formation Section 3A1
929Yuehai Formation Section 3A2
1200Hanjiang Formation Section 1A3
1444Hanjiang Formation Section 1A4
J-11677~1687Reconstituted the coreZhujiang 220 caprockB1
J-21684~1690Zhujiang 220 caprockB4
1883~1890Zhujiang 420 caprockB5
J-51609~1625Zhujiang 210 caprockB6
1677~1684Zhujiang 220 caprockB7
Uniaxial mechanical properties testJ-11677~1687Reconstituted the coreZhujiang 220 caprockB1
1859~1869Zhujiang 420 caprockB2
J-21583~1638Zhujiang 210 caprockB3
1684~1690Zhujiang 220 caprockB4
1883~1890Zhujiang 420 caprockB5
J-51609~1625Zhujiang 210 caprockB6
1677~1684Zhujiang 220 caprockB7
1858~1868Zhujiang 420 caprockB8
Table 2. J-6 core cover permeability measurement results.
Sample No.A1A2A3A4A5A6
Sampling depth/m9059291200144414671468
Sampling layerYuehai Formation Section 3Yuehai Formation Section 3Hanjiang Formation Section 1Hanjiang Formation Section 3Hanjiang Formation Section 4Hanjiang Formation Section 4
Calculate the amplitude ratio0.12170.46210.00820.850.89040.1024
Calculate the phase difference/rad−1.683−1.37−2.605−0.57−0.54−1.51
Specific storage rate/10−10 Pa−10.2291.8110.720.241.150.022
Permeability/mD1.6 × 10−38.64 × 10−32.41 × 10−64.93 × 10−21.97 × 10−16.72 × 10⁻⁴
Disclaimer/Publisher’s Note: The statements, opinions and data contained in all publications are solely those of the individual author(s) and contributor(s) and not of MDPI and/or the editor(s). MDPI and/or the editor(s) disclaim responsibility for any injury to people or property resulting from any ideas, methods, instructions or products referred to in the content.