Article

Feasibility and Operability of CO2 Circulation in a CO2 Storage-Enabled Geothermal System with Uncertainty Insights from Aquistore

by
Alireza Rangriz Shokri
* and
Rick Chalaturnyk
Department of Civil and Environmental Engineering, University of Alberta, Edmonton, AB T6G 2R3, Canada
*
Author to whom correspondence should be addressed.
Energies 2025, 18(22), 6031; https://doi.org/10.3390/en18226031
Submission received: 14 October 2025 / Revised: 12 November 2025 / Accepted: 14 November 2025 / Published: 18 November 2025

Abstract

CO2 circulation between subsurface wells is a promising approach for geothermal energy recovery from deep saline formations originally developed for Carbon Capture and Storage (CCS). This study evaluates the feasibility, operability, and performance of sustained CO2 flow between an injector and a producer at the Canadian Aquistore site, a location with active CO2 injection and an established geological model. A high-resolution sector model, derived from a history-matched parent simulation, was used to conduct a comprehensive uncertainty analysis targeting key operational and subsurface variables, including injection and production rates, downhole pressures, completion configurations and near-wellbore effects. All simulation scenarios retained identical initial and boundary conditions to isolate the impact of each variable on system behavior. Performance metrics, including flow rates, pressure gradients, brine inflow, and CO2 retention, were analyzed to evaluate CO2 circulation efficiency. Simulation results reveal several critical findings. Elevated injection rates expanded the CO2 plume, while bottomhole pressure at the producer controlled brine ingress from the regional aquifer. Once the CO2 plume was fully developed, producer parameters emerged as dominant control factors. Completion designs at both wells proved vital in maximizing CO2 recovery and suppressing liquid loading. Permeability variations showed limited influence, likely due to sand-dominated continuity and established plume connectivity at Aquistore. Visualizations of water saturation and CO2 plume geometry underscore the need for constraint optimization to reduce fluid mixing and stabilize CO2-rich zones. The study suggests that CO2 trapped during circulation contributes meaningfully to permanent storage, offering dual environmental and energy benefits. The results emphasize the importance of not underestimating subsurface complexity when CO2 circulation is expected to occur under realistic operating conditions. This understanding paves the way to guide future pilot tests, operational planning, and risk mitigation strategies in CCS-enabled geothermal systems.

1. Introduction

This study evaluates the feasibility of circulating CO2 between an injector and a producer within a deep saline formation at the Aquistore site in Saskatchewan, Canada. The concept supports CCS-enabled geothermal systems such as CO2 Plume Geothermal (CPG), which offer dual benefits of geothermal energy extraction and permanent CO2 storage [1]. As global efforts intensify to meet net-zero targets, technologies that integrate carbon capture, utilization, and storage (CCUS) with clean energy production are gaining traction [2,3]. The use of transmission fluids such as CO2, water, and hydrogen for geothermal energy extraction has emerged as a promising strategy for repurposing subsurface assets, particularly in depleted or deep saline reservoirs. Recent studies have emphasized the versatility of fluid-mediated systems in enhancing reservoir utilization. For instance, Ref. [4] explored the transition from CO2 sequestration to hydrogen storage in depleted gas reservoirs, highlighting the evolving role of subsurface infrastructure in multi-purpose energy applications. Similarly, Ref. [5] analyzed the influence of geological factors and transmission fluids on geothermal resource exploitation, offering a mechanistic framework for evaluating reservoir performance under fluid circulation regimes.
These insights reinforce the relevance of our study, which focuses on emerging technologies such as CPG that advance this integration by using CO2 as a working fluid for both power generation and subsurface sequestration (Figure 1).
Rather than focusing on energy output, this study centers on validating stable CO2 circulation, excluding brine, between two wells within the CO2 plume. Aquistore’s extensive geological characterization, long-term injection history, and robust monitoring infrastructure make it an ideal site for testing this concept under realistic field conditions [6]. Using five years of injection data and high-resolution monitoring, we conduct a simulation-based feasibility analysis. Custom MATLAB® tools (R2021b version) were developed to process injection data for history matching and input into commercial reservoir simulators, and key subsurface and operational parameters influencing CO2 circulation performance are identified.
Unlike prior Aquistore modeling focused on plume migration or injection performance, this study evaluates active CO2 circulation between wells using a seismic-constrained, history-matched sector model. It also differs from Cranfield thermosiphon analyses by emphasizing pressure-driven flow rather than passive buoyancy recovery. These distinctions position the study as a first-of-its-kind feasibility assessment for CCS-enabled geothermal circulation under realistic field conditions. This work contributes by (i) characterizing dynamic CO2 behavior in a deep, hot saline aquifer, (ii) establishing a practical framework for circulation test evaluation, and (iii) informing future pilot design through identification of dominant control factors. These findings support the advancement of CCS-enabled geothermal systems as a synergistic solution for clean energy production and carbon mitigation.

1.1. Background on CCS-Enabled Geothermal Systems

Geothermal energy is widely recognized as a clean and renewable resource for electricity generation. Conventional systems typically target deep (>2.5 km), high-temperature (>250 °C) formations known as Hot Dry Rock (HDR) [7,8]. However, most geothermal reservoirs lack sufficient natural permeability, requiring engineered solutions such as hydraulic stimulation to create fluid pathways, collectively referred to as Enhanced Geothermal Systems (EGS). Water has traditionally served as the working fluid due to its favorable thermophysical properties, but its use in EGS presents challenges, including freshwater demand, scaling, and geochemical reactivity under high-pressure, high-temperature conditions [9,10].
To address these limitations and align geothermal development with carbon mitigation goals, supercritical CO2 has been proposed as an alternative working fluid [8,11]. CO2 offers several advantages: gas-like viscosity enables higher flow rates at lower pressure gradients; liquid-like density improves mobility; and reduced geochemical interactions minimize scaling and precipitation [12,13]. Moreover, its high expansivity supports buoyancy-driven flow, and CO2 loss during circulation contributes to permanent geologic sequestration [11,14,15,16]. These attributes make CO2 suitable for shallower, lower-temperature formations and offer economic incentives through tax credits and offsetting of injection costs. Building on these principles, CCS-enabled geothermal systems offer a dual-purpose solution for heat extraction and CO2 storage. In emerging technologies such as CPG, CO2 is injected into a subsurface formation, displacing brine and forming a plume. Once sufficient saturation is achieved, CO2 can be circulated between injector(s) and producer(s), extracting heat for power generation or direct use [17]. A critical step involves displacing native fluids to establish a dry reservoir, enabling efficient heat recovery and minimizing multiphase flow complications.
Extensive modeling has explored the reservoir dynamics, power cycles, and cost structures of CCS-enabled geothermal systems [1,18,19,20,21,22]. Compared to water-based EGS, CPG can generate 2–5 times more electricity, avoid issues related to hydraulic fracturing and freshwater use, and remain cost-competitive in shallower (>2 km), less hot (>100 °C), and transmissible (>5000 mD·m) reservoirs [21]. Literature suggests that CPG is viable for both deep and shallow applications, with significantly higher heat mining rates than traditional EGSs [17,23,24]. Despite its promise, no full-scale field trial of a CPG system has been conducted. A closely related experiment, the Cranfield CO2 Thermosiphon Test, was performed in a saline aquifer at 3.2 km depth under reservoir conditions of 32.5 MPa and 129 °C [25,26]. Although initial modeling predicted a self-sustaining thermosiphon, the test revealed rapid flow decay, significant water production, and challenges related to heterogeneity, irreducible water saturation, and multiphase flow [27,28,29,30]. Key lessons included the importance of understanding water mobility, the impact of reservoir structure on CO2/brine dynamics, and operational risks such as liquid loading, salt precipitation, and clathrate formation.
To advance the technology readiness level of CPG, Refs. [18,31] investigated CO2/brine fractional flow behavior at the Aquistore site. Their analysis showed that CO2 could enter the producer with 85–90% saturation, largely independent of permeability assumptions. They emphasized that a CO2 circulation test, focused on achieving stable flow between injector and producer, is a critical next step. Aquistore, with its extensive geological data and injection history, offers a unique opportunity to validate CPG feasibility under realistic field conditions. This study builds on prior work and addresses key challenges for a circulation test at Aquistore, including reservoir characterization, heterogeneity, and well completion design. A successful test would mark a significant milestone in the development of CCS-enabled geothermal technologies.

1.2. Overview of Aquistore Site and CO2 Injection History

The Aquistore site in Saskatchewan, Canada, serves as the geological CO2 storage component of the Boundary Dam Integrated Carbon Capture and Storage (CCS) project, operated by the Petroleum Technology Research Centre. CO2 captured from a coal-fired power station is injected into a deep saline formation via a single well at approximately 3.4 km depth. By early 2021, cumulative injection exceeded 350 kilotonnes, with rates reaching up to ~600 tonnes/day [6]. The target reservoir spans the Deadwood Formation and the Black Island sandstone member of the Winnipeg Formation, with four perforated zones totaling 88 m in thickness. These intervals were selected for their high permeability and are sealed by the shaly Icebox member and the Prairie Evaporite, which act as primary and secondary barriers to upward migration [32,33]. Aquistore’s estimated CO2 storage capacity ranges between 8 and 27 million tonnes [34].
An observation well, located 151 m from the injector, was drilled to monitor reservoir response, including pressure changes and plume migration. It is cased and hydraulically isolated from the aquifer, except for a fluid recovery system (FRS) port that enables sampling of formation fluids [35]. Both wells are equipped with downhole pressure and temperature gauges, as well as Distributed Temperature Sensing (DTS) systems. Surface-based monitoring infrastructure includes broadband seismometers, geophones, tiltmeters, InSAR reflectors, and water and soil gas sampling stations, supporting a comprehensive MMV program [6].
Aquistore’s historical injection data reveal persistent thermal and pressure perturbations near the injector, with bottomhole temperature reductions during injection and recovery during shut-in [36]. Injectivity has generally improved over time, showing an inverse correlation with bottomhole temperature [37,38]. Interested readers are directed to consult [36] for full access to the published injectivity data and visualizations. Brine chemistry indicates high salinity and saturation with halite and anhydrite, with salt precipitation observed in lower-permeability zones, highlighting the importance of near-wellbore dynamics in circulation performance [39]. Aquistore’s depth (>3.2 km), temperature (>120 °C), and high transmissibility (~9000 mD·m) meet the criteria for CPG systems, making it a strong candidate for a CO2 circulation test [20]. This study leverages Aquistore’s extensive dataset and monitoring infrastructure to assess the feasibility of stable CO2 circulation between injector and producer wells, laying the groundwork for future CCS-enabled geothermal pilot testing.

2. Methodology

2.1. Geological Modeling Framework and Reconstruction

To support dynamic simulation of CO2 injection and circulation at the Aquistore site, a full-field static geological model was reconstructed using integrated geological and geophysical datasets. These included well trajectories, wireline logs, core data, and interpreted seismic horizons [6,32]. Gamma ray log-derived depth markers were used to align seismic horizons with well tops from both the injection and observation wells, correcting for depth mismatches in the seismic interpretation. The model spans the stratigraphic interval from the Winnipeg Icebox Member to the Precambrian erosional surface, covering a 5 km × 5 km area corresponding to Aquistore’s seismic monitoring footprint. Stratigraphic subdivision was guided by log-derived parameters such as shale volume index, lithology, and porosity, and informed by regional geological knowledge of southern Saskatchewan. Each unit was assigned a distinct number of vertical layers to capture heterogeneity, particularly the alternation of sand and shale zones, and to enable accurate distribution of petrophysical properties [34].
Following quality control of structural surfaces, seismic horizons, and well tops, a rectangular grid was generated for reservoir simulation. The grid encompassed the full 5 km × 5 km domain, with a locally refined 2 km × 2 km region centered around the injection well. This refinement was informed by sensitivity analyses of CO2 plume extent from prior history-matched simulations and time-lapse seismic surveys [37]. Grid cell dimensions were set to 32 m × 32 m near the wells and coarsened to 250 m × 250 m toward the model boundaries. For high-resolution simulation of mass and heat transport in the CO2 plume region, the 32 m × 32 m cells were further refined to 4 m × 4 m, forming the final sector model used as input for dynamic simulations (Figure 2); this model is referred to as the “high-resolution sector model” of the CO2 circulation test. Boundary conditions for the sector model were assigned as constant pressure on the lateral boundaries to reflect regional hydraulic continuity, and no-flow boundaries at the top and bottom to represent stratigraphic confinement. These settings preserve the dominant flow pathways and pressure responses observed in the full-field model, ensuring that the sector model remains representative of the CO2 circulation dynamics under investigation.
Well log analysis from the injection and observation wells revealed consistent lithological sequences and sand/shale alternations. Petrophysical properties were estimated from log data and calibrated using laboratory measurements from core samples. Twenty full-diameter core plugs were analyzed for density, porosity, and gas/liquid permeability, while routine core analyses were available for 22 sidewall samples. Depth corrections aligned core data with log measurements. Permeability logs were derived from calibrated porosity–permeability correlations developed by the Energy & Environmental Research Center (EERC), based on Deadwood Formation core data measured at the North Dakota Geological Survey core library [32,33,34]. Due to limited well control, initial property distributions were implemented using a layer cake approach, assigning porosity and permeability values uniformly across each horizontal layer. This method emphasized vertical heterogeneity while neglecting lateral variations.
To enhance spatial characterization of reservoir properties, 3D Amplitude Versus Offset (AVO) inversion volumes in the time domain were used for lithology prediction and porosity estimation within the target reservoir interval. However, acquisition footprints in the inversion data posed challenges to interpretation [40]. To mitigate this, Ref. [41] applied azimuthal (kx–ky) filtering to the AVO volumes and derived lithology and porosity sub-volumes, following techniques outlined by [42]. Filtered inversion volumes were converted to depth using a Strata model, anchored to injection well log data and interpreted seismic horizons. The resulting depth-domain acoustic impedance volume was resampled to match the fluid flow grid. Gaussian random function simulation was employed to improve porosity distribution beyond the layer cake model, honoring well log data, input distributions, and variograms (Table 1). A negative correlation (−0.80) between porosity and acoustic impedance was assumed based on available well log data from the Aquistore site; Specifically, crossplots from the injection well logs show a correlation coefficient in the range of −0.65 to −0.80, confirming a strong negative correlation consistent with sandstone-dominated intervals and established rock physics relationships, e.g., [43,44]. Collocated co-kriging was applied using the acoustic impedance volume as a secondary variable, and it was later treated as a variable in the uncertainty workflow, enabling generation of multiple porosity-permeability realizations.
Figure 3a–c illustrates the acoustic impedance volume and resulting stochastic porosity distributions, both with and without seismic constraints. Porosity-permeability cross plots (Figure 3d) were generated for available facies [34], serving as secondary variables for permeability population. The final permeability distribution reflects a combination of direct well measurements, porosity-permeability correlations, and the influence of the acoustic impedance volume (Figure 3e,f).
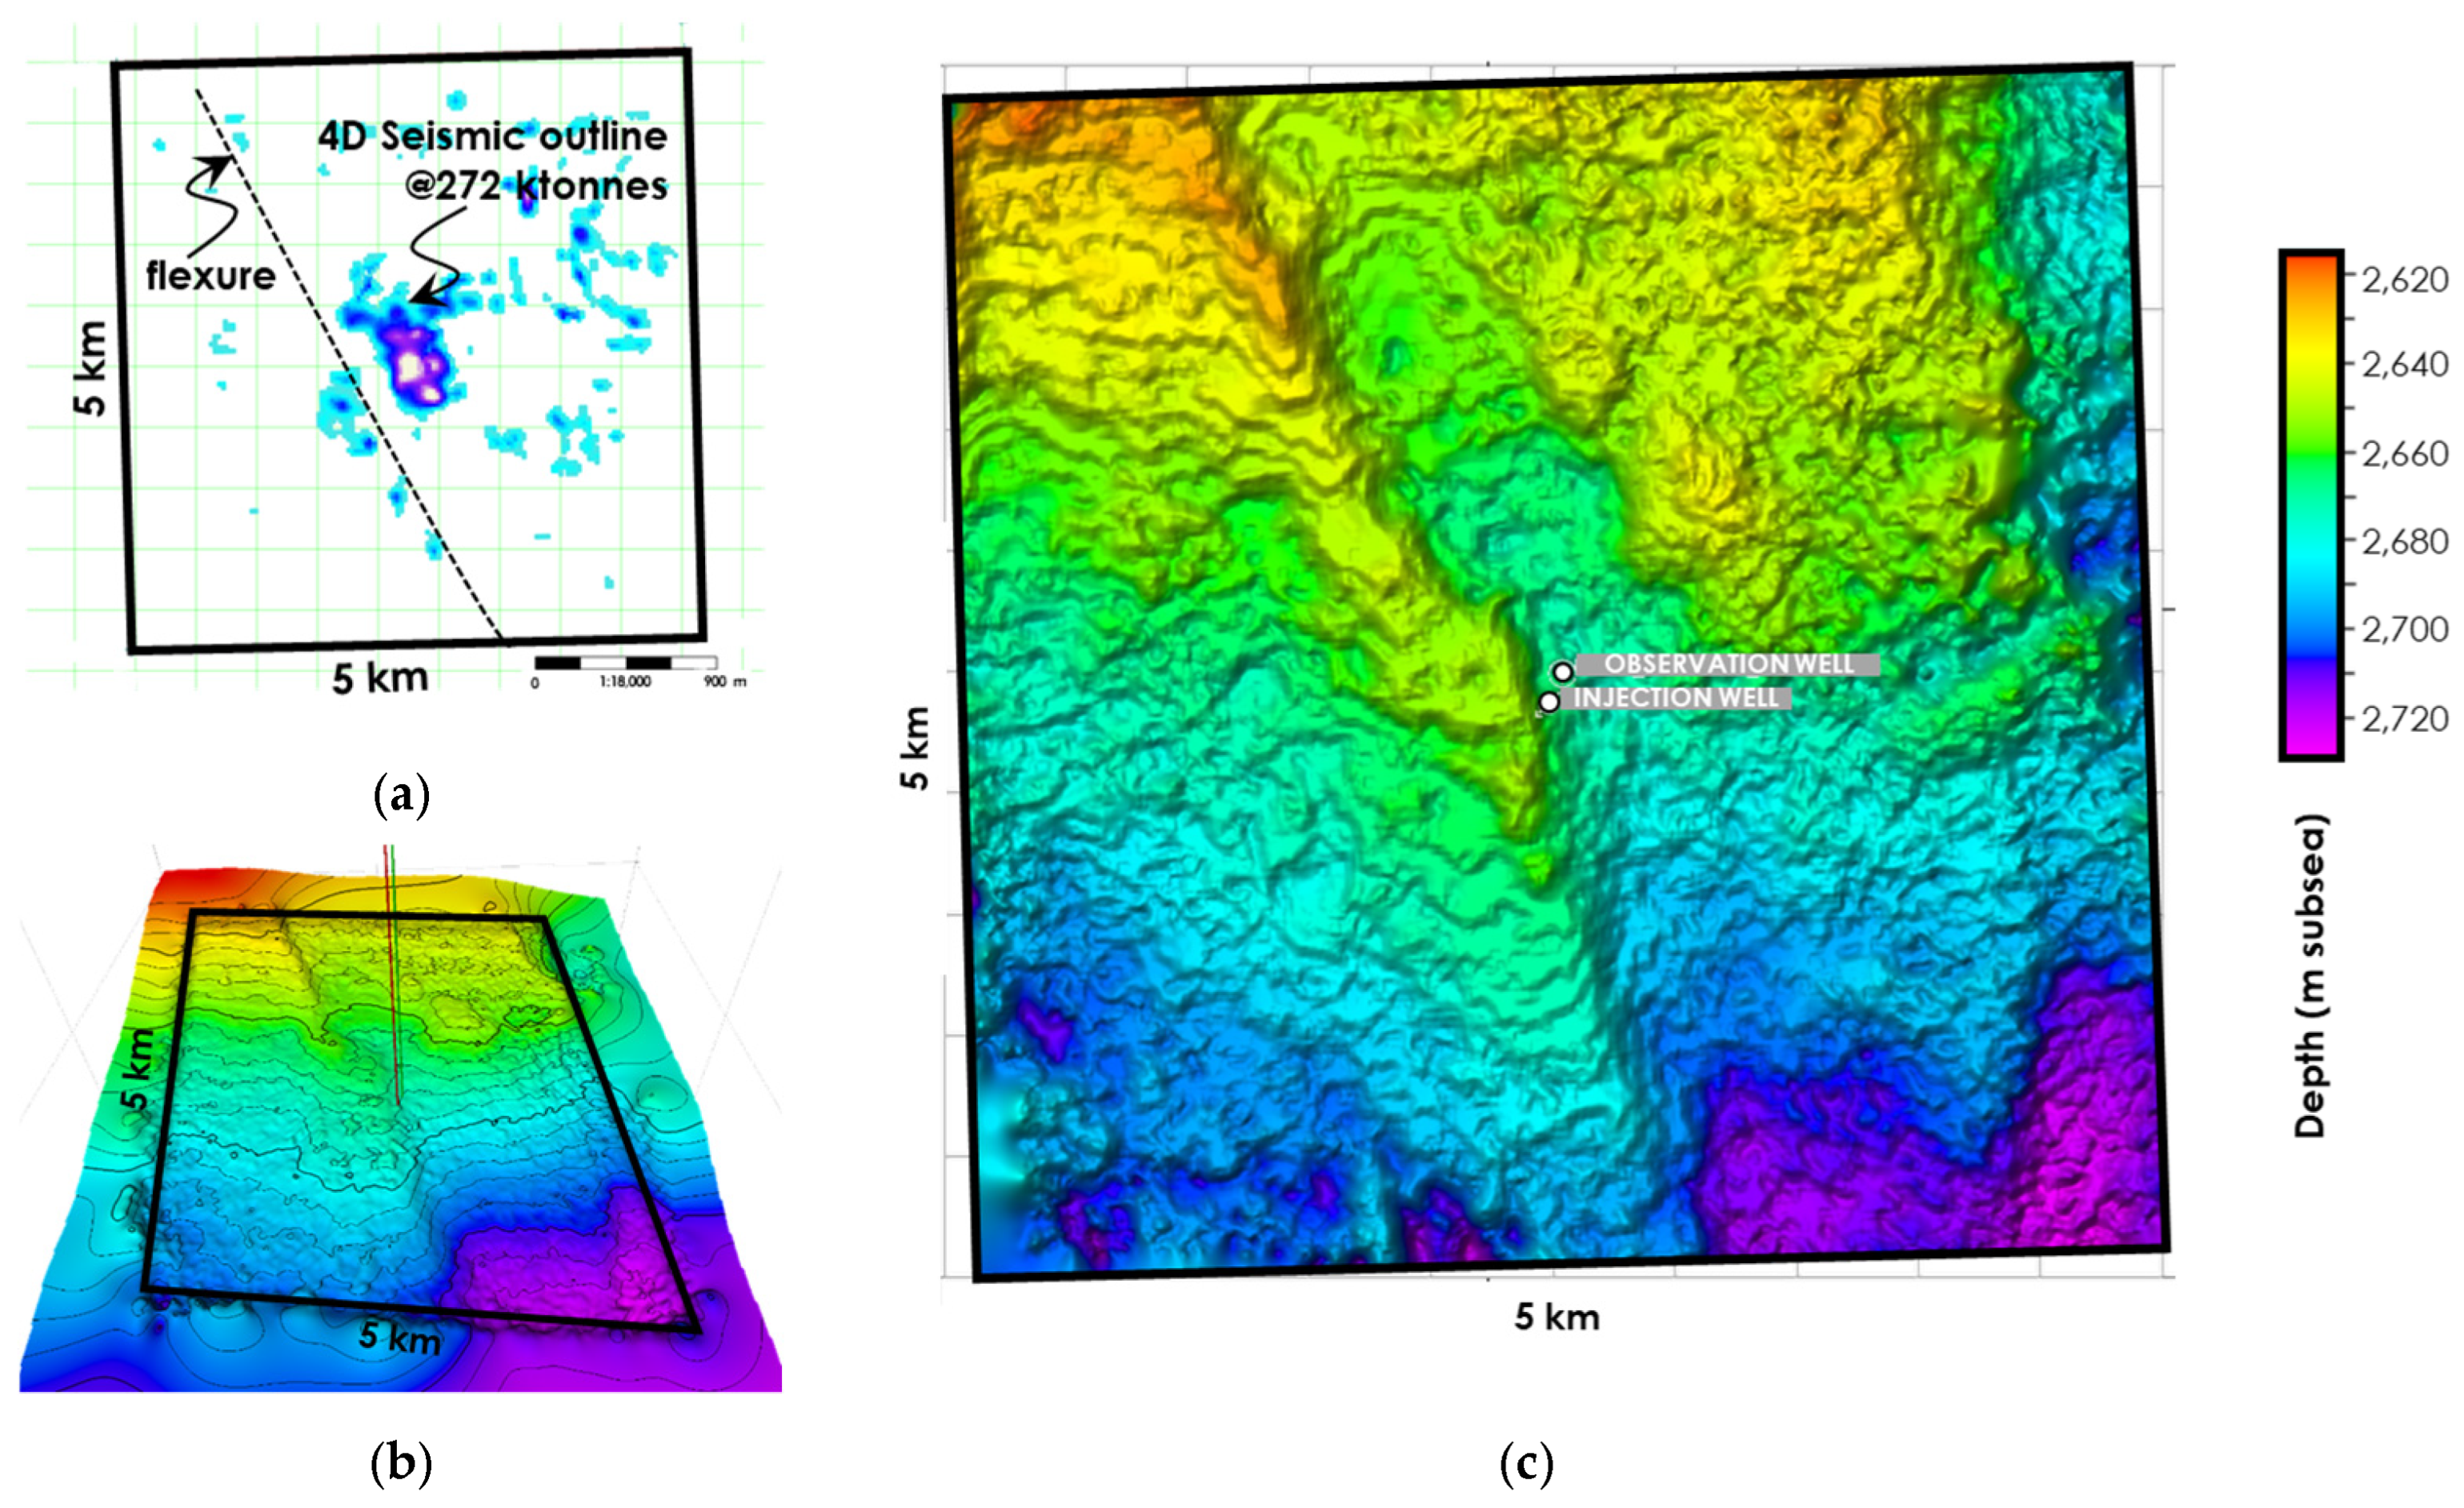
During initial site screening, a pseudo-3D geophysical model was constructed using six legacy 2D seismic lines spanning an 8 km × 6 km area. Preliminary interpretation revealed no evidence of vertical faulting or missing reservoir horizons beneath the injection site [33]. However, integration of high-resolution 3D seismic data with geological and geophysical information from the injection well revealed a previously unrecognized sub-vertical basement structure [45]. This fault-like flexure, located ~1 km northwest of the injection well, trends NNW-SSE (Figure 4) and is oriented at an azimuth of 75–85° relative to the regional maximum horizontal stress, suggesting low susceptibility to reactivation under current injection conditions [46,47]. The structural flexure was incorporated into the geological model as a low-permeability feature to represent a flow barrier, as shown in Section 3.1 to control plume geometry and pressure response, matching both 4D seismic surveys and observation well data. For a comprehensive analysis of the flexure’s role in plume dynamics and long-term reservoir deformation, the reader is referred to [46].

2.2. Dynamic Simulation Setup

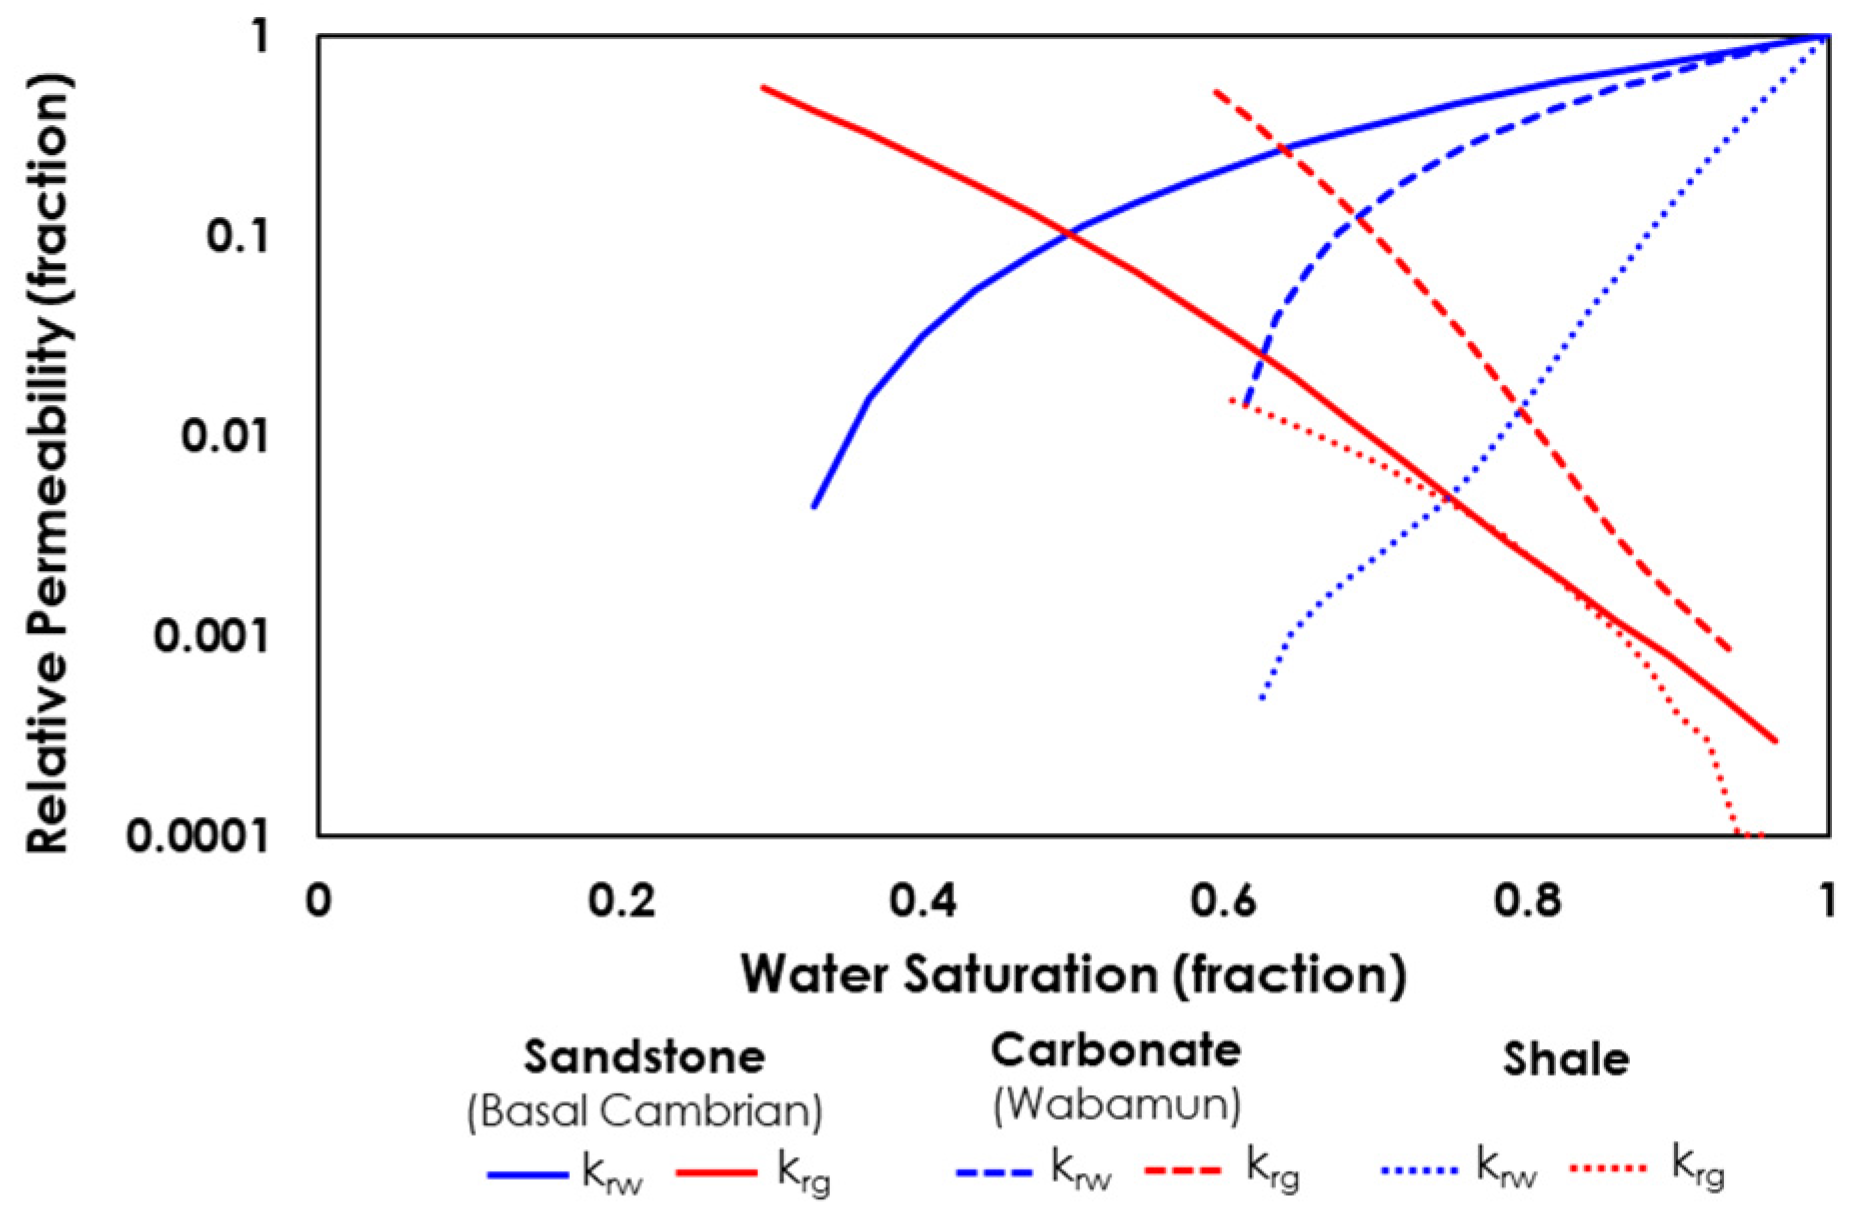
To simulate CO2 circulation, a non-isothermal compositional flow model was developed using CMG-GEM. The model was calibrated to match injection history and CO2 breakthrough at the observation well. A Peng-Robinson equation of state [47] was applied to the brine-CO2 system, with a trace amount of methane (0.001 mol%) added for numerical stability. This practice is widely recognized in compositional modeling workflows, as pure-component systems often cause convergence issues in flash calculations (e.g., [48,49]). The addition of methane had negligible impact on plume geometry or pressure response. Fluid properties were modeled using Harvey’s solubility correlation with adjustment for salinity [50], Rowe and Chow’s brine density [51], and Kestin et al. viscosity correlation [52]. Initial reservoir conditions were set at 34.13 MPa and 112.8 °C at 3173 m depth, with full brine saturation and salinity of 300,000 ppm. A pressure gradient of 10.7 kPa/m was assumed, and boundary conditions were connected to an infinite-acting aquifer [37]. The relative permeability functions used in the simulations were not derived from Aquistore core samples due to the absence of site-specific experimental data. Instead, we adopted representative curves from published literature based on measurements in analogous formations, including basal Cambrian sandstone, Wabamun carbonate, and shale units (Figure 5). These functions have been previously validated in CO2 circulation studies and offer physically plausible behavior for the target reservoir [53,54,55,56]. Hysteresis effects were not explicitly modeled in this feasibility study due to the lack of site-specific experimental data required to constrain saturation path dependencies. However, we acknowledge their potential impact on cyclic injection behavior and recommend incorporating hysteresis if data become available in future pilot-scale simulations to improve predictive accuracy.
CO2 injection was distributed across four perforated intervals with multiple spinner survey data indicating limited contribution from third lower perforated interval (Perforation 3) and the lower half of Perforation 4. History matching was performed using daily averaged injection rates, bottomhole pressures, and temperature data collected between April 2015 and April 2020. A dynamic skin factor was applied to reflect changes in flow regime, thermal fracturing, and salt precipitation. Specifically, high-rate injection periods were best matched by applying negative skin values, indicative of localized permeability enhancement.
Calibration of CO2 breakthrough in the observation well was supported by pulsed neutron logs, which showed a sharp increase in CO2 saturation near Perforation 2 between December 2015 and March 2016 [45]. Early simulations showed limited pressure buildup, confirming sufficient aquifer capacity and informing brine disposal strategies [57]. Seismic amplitude difference maps were used to validate lateral plume extent, with saturation thresholds estimated at ~10% [58]. These maps, overlaid on acoustic impedance volumes, helped constrain spatial plume evolution.
In the high-resolution sector model, the existing observation well was assumed to act as a production well for the CO2 circulation test. This strategy was intended to minimize drilling costs and leverage existing infrastructure, should the test be implemented in the field. Throughout this study, the terms observation well and producer are used interchangeably. Operational parameters for injection and production wells were defined based on infrastructure constraints (Table 2).
The base-case scenario assumes no salt precipitation or thermal fracturing at the producer. This reflects a deliberate isolation of variables to evaluate CO2 circulation feasibility under controlled conditions. While salt precipitation and thermal fracturing are acknowledged as important near-wellbore processes, particularly under high drawdown and cooling, excluding them in the base case allows us to assess baseline system behavior without introducing additional model complexity or uncertainty. These processes are discussed in the context of operational risks and are relevant for future field implementation and design optimization.

2.3. Uncertainty Analysis

Uncertainty in CO2 circulation at the Aquistore site stems from geological heterogeneity, operational constraints, and evolving reservoir conditions. Key factors include plume geometry, saturation distribution, anisotropic permeability influenced by shale baffles, and dynamic changes such as salt precipitation and thermal fracturing. The behavior of the regional aquifer adds complexity, particularly its potential to mobilize brine into CO2-rich zones or low-pressure sinks such as the production well [39]. To evaluate these uncertainties, the high-resolution sector model was used for scenario testing. Initial and boundary conditions were held constant across all realizations to isolate the effects of uncertain parameters, including porosity, permeability, injectivity, and completion design. Geological variability was captured through 200 stochastic realizations, incorporating facies, porosity, permeability, and structural features. Porosity and permeability distributions were constrained by acoustic impedance using collocated co-kriging, with the P50 realization selected as the base case. Table 3 summarizes the variables explored, including geological, petrophysical, and operational parameters that influence plume behavior, brine displacement, and injectivity. The selection of uncertain parameters was informed by three sources: (1) sensitivity analysis from the history-matching process, which identified parameters with the greatest influence on pressure and saturation response, (2) variability observed in site-specific data, including core measurements, well logs, and operational records, and (3) reported ranges from similar formations involved in CO2 injection and geothermal projects across the region.
In this study, injection was modeled across four intervals to reflect the actual completion of the Aquistore injector, which was designed to promote vertical sweep and plume development. Production was limited to the second interval, corresponding to the most transmissive zone based on well logs and prior injection performance. This simplified completion allows for focused evaluation of circulation feasibility and brine exclusion under controlled drawdown. While this approach isolates key flow dynamics, alternative producer completions, such as multi-interval production or zonal isolation, not considered in this study, may offer improved control over vertical segregation and early brine entry.
Multiple key performance indicators (KPIs) were selected to evaluate the operability and efficiency of the CO2 circulation test including (i) rates (CO2 mass injection, CO2 mass production, brine production), (ii) cumulatives (injected CO2 mass, produced CO2 mass, permanently stored CO2, produced brine), (iii) pressures (injection pressure, production pressure, inter-well pressure drop within CO2 plume) and other metrics (gas-to-water ratio, dry-out time, brine inflow from regional aquifer). Dry-out time was defined as the period required for CO2 circulation between the injector and producer to approach steady-state operation [18]. In this study, dry-out time is quantified as the elapsed time from the onset of production until the gas-to-water ratio (GWR) at the producer exceeds 1 rm3/m3 and remains above this threshold for at least 10 consecutive days. This conservative benchmark reflects the onset of CO2-dominant flow while allowing for some brine co-production. In field operations, dry-out would be diagnosed using inline GWR monitoring, produced fluid sampling (e.g., salinity, water cut), temperature and density shifts, and tracer diagnostics if deployed. Sampling cadence during early production would typically range from hourly to daily, depending on well response and instrumentation. For scenarios requiring complete brine exclusion, a higher GWR threshold (on the order of 10 to 100 rm3/m3) may be more suitable, depending on operational goals and fluid sensitivity. All simulations assumed injection pressure ranges below the fracturing threshold, and production pressure below CO2 plume pressure, but close to or above the pressure of the regional aquifer.

2.4. Wellbore Dynamics and Multiphase Flow Modeling

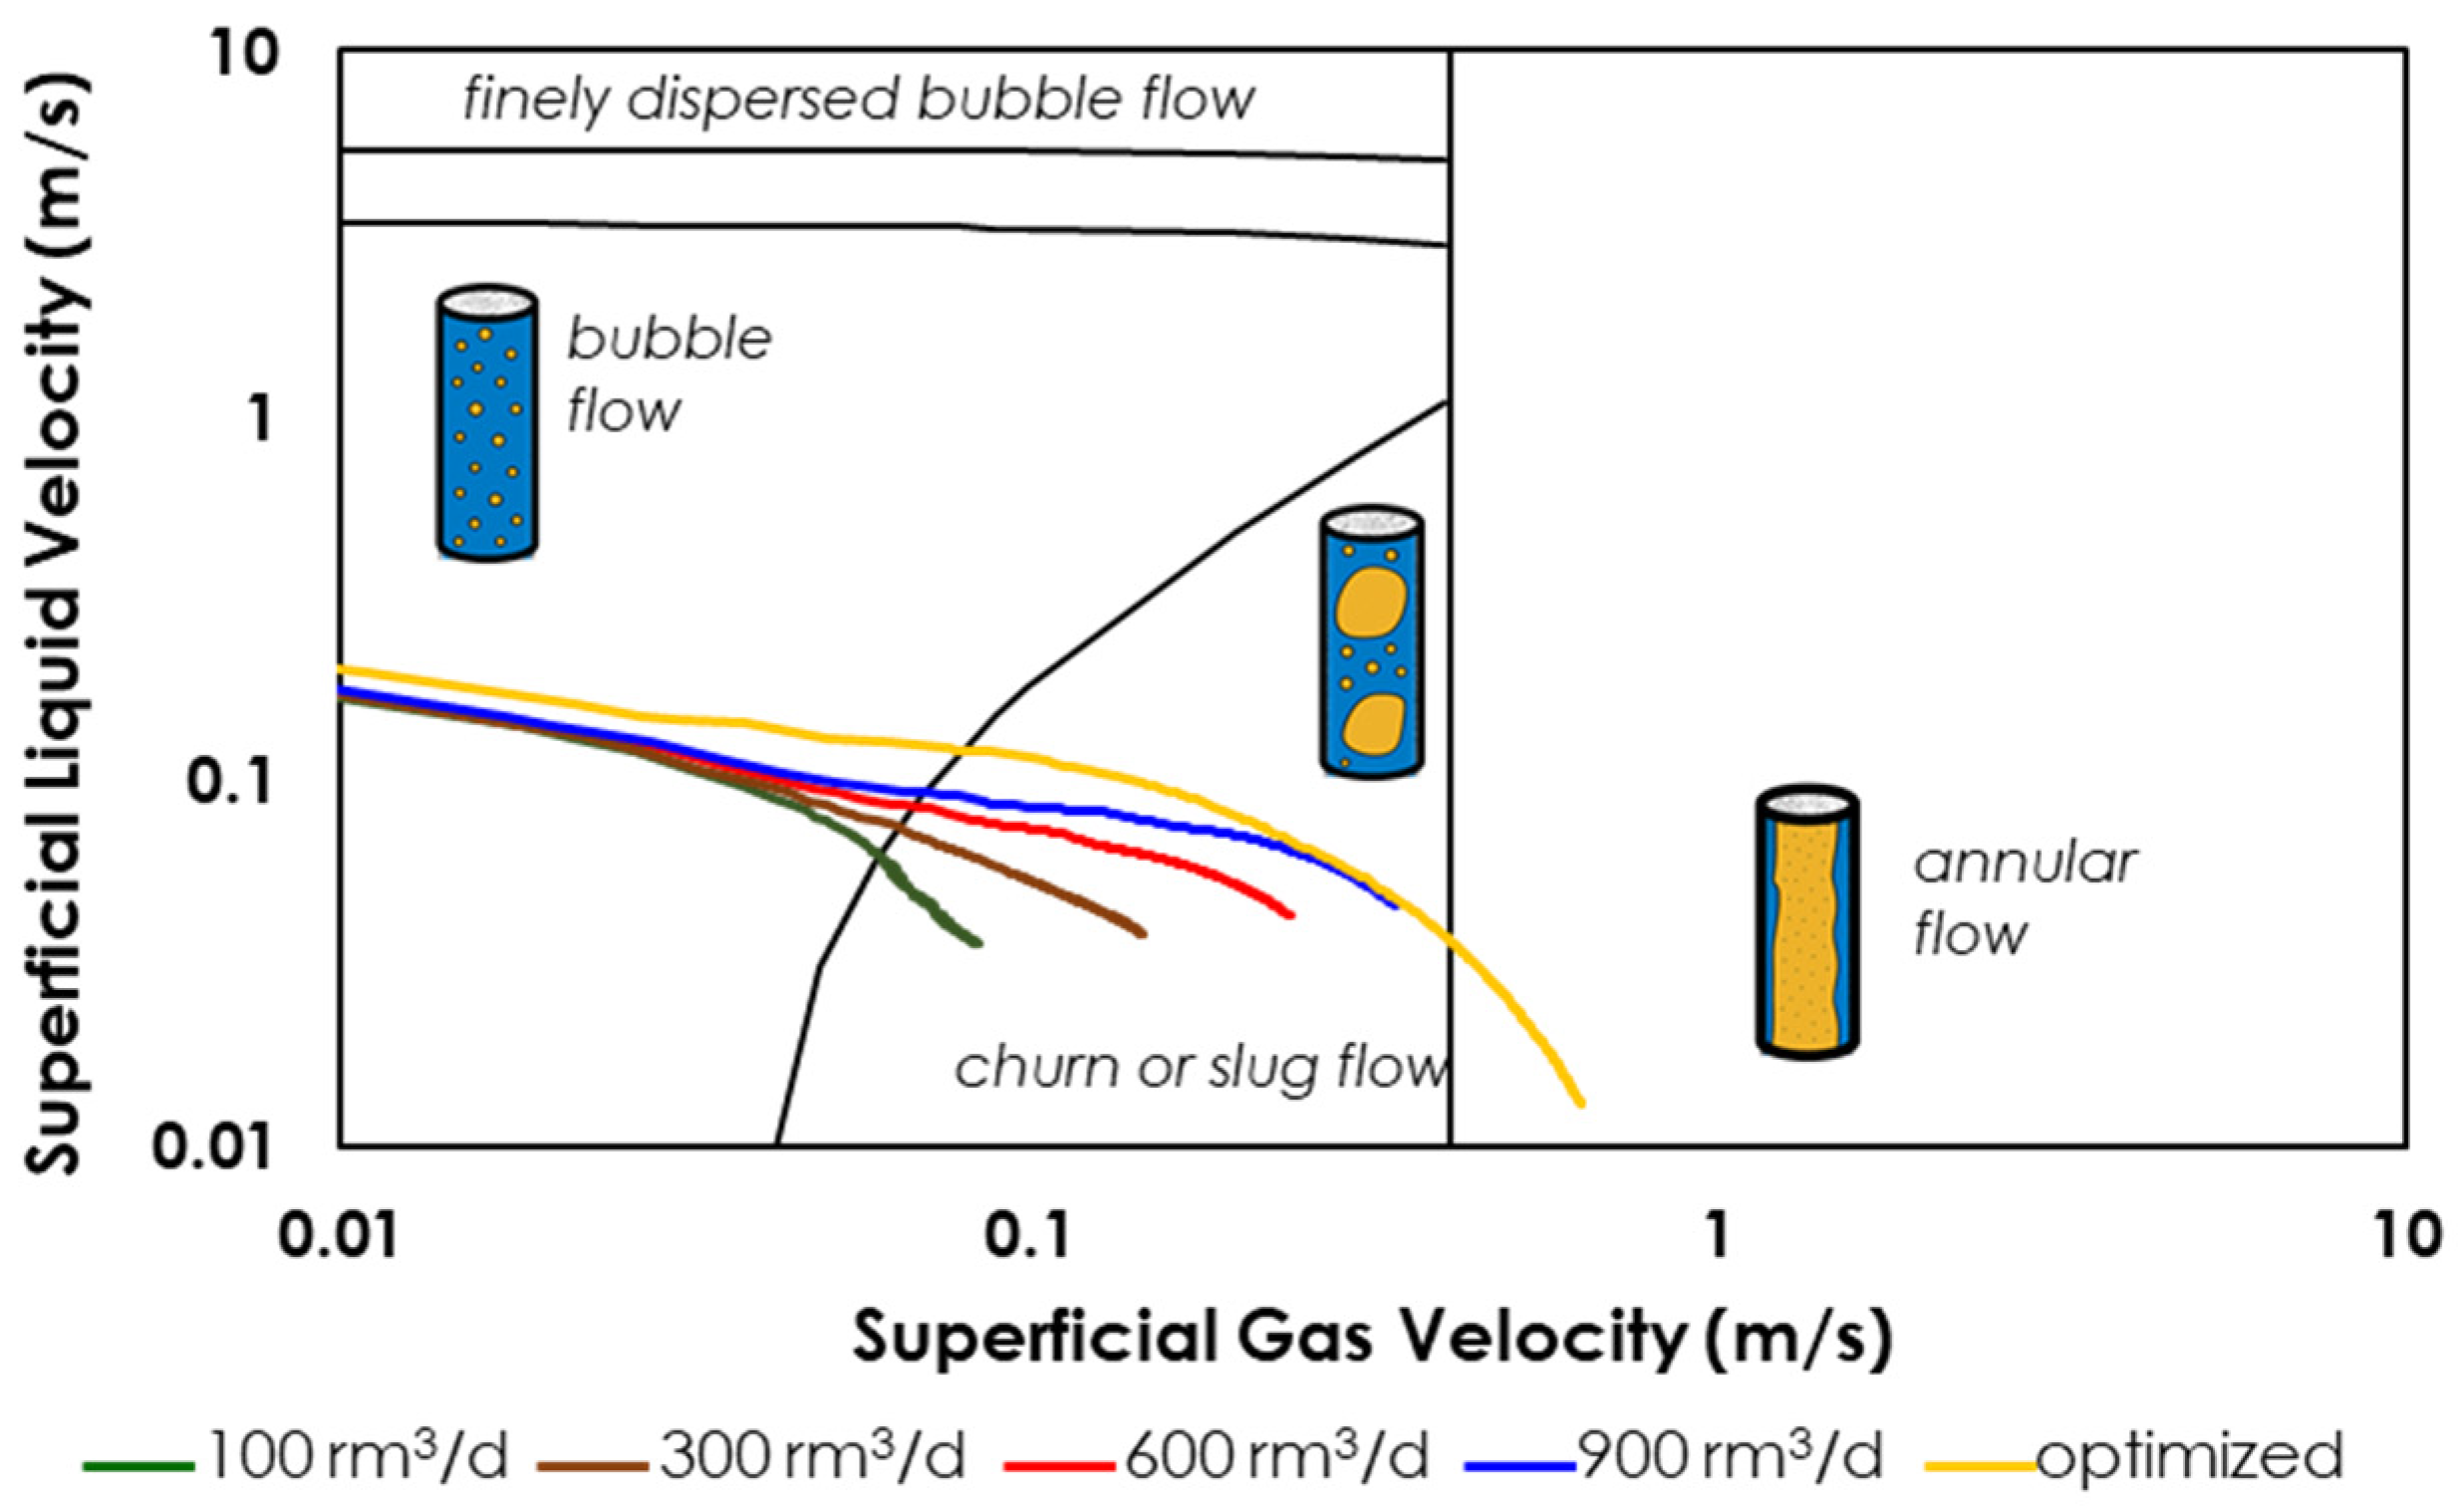
To evaluate potential impact of CO2-brine co-production during the circulation test, we employed a two-phase vertical flow model. This approach provides an estimate of wellbore behavior under varying operational conditions and highlights the risk of liquid loading, which can compromise production efficiency and continuity [59]. Vertical flow of gas (CO2) and liquid (brine) in the production well was characterized using flow regime maps based on superficial velocities. Flow regimes, ranging from fine bubble to annular, were determined by the relative velocities of the gas and liquid phases. Transition boundaries between these regimes were estimated using the steady-state equations developed by [60], which relate superficial phase velocities to fluid properties and wellbore geometry. For the case of vertical two-phase flow, these equations were applied to determine regime transitions as functions of superficial liquid and gas velocities, as follows:
Bubble flow:
U S , L = 4 D 0.429 ( σ / ρ L ) 0.089 ( μ L / ρ L ) 0.072   ρ g ρ L 0.446 U S , G
Slug/churn flow:
U S , L = 1.15 σ ρ g ρ L 2 0.25 + 3 U S , G
Annular flow:
U S , G = 3.1 σ ρ g ρ G 2 0.25
where US,L is superficial liquid velocity, US,G is superficial gas velocity, D is wellbore diameter, σ is interfacial tension, ρL is liquid density, ρG is gas density, ∆ρ is the density difference between liquid and gas phases, µL is liquid viscosity, and g is gravitational acceleration. It seems that only the bubble flow regime is a function of the wellbore diameter. Superficial velocities were calculated by dividing simulated flow rates at the producer by the cross-sectional area of the wellbore. Assumed input conditions included a wellbore diameter range of 11–33 cm, average reservoir pressure of 36 MPa, temperature of 115 °C, brine salinity of 300,000 ppm, CO2-brine interfacial tension of 0.033 N/m, brine density of 1087 kg/m3, CO2 density of 667 kg/m3, gravitational acceleration of 9.81 m/s2, and brine viscosity of 0.0001 Pa·s [37,59] and [61,62,63]. These calculations enabled the construction of flow regime maps, which were used to assess operational thresholds and predict flow behavior under circulation test conditions.

3. Results

3.1. History Matching and Model Validation Using MMV Constraints

Time-lapse (4D) seismic surveys were instrumental in constraining CO2 plume evolution and validating simulation outputs. Seismic amplitude difference maps in the upper Deadwood zone (Figure 6), overlaid on P-wave acoustic impedance, served as proxies for lateral CO2 extent at Perforation 2, located within a high-permeability interval. Given the variable noise across surveys, particularly in the 141 kilotonnes monitor dataset [41], a thresholding approach was applied to isolate meaningful plume signals. The resulting outlines delineate regions with minimum detectable CO2 saturation of approximately 10%, although seismic sensitivity diminishes at higher saturations [58]. Asymmetric plume migration was consistently observed, with dominant northward propagation from the injection well. This behavior is attributed to regional dip toward the SSE, the orientation and proximity of the basement flexure, and anisotropic petrophysical properties within the Deadwood Formation.
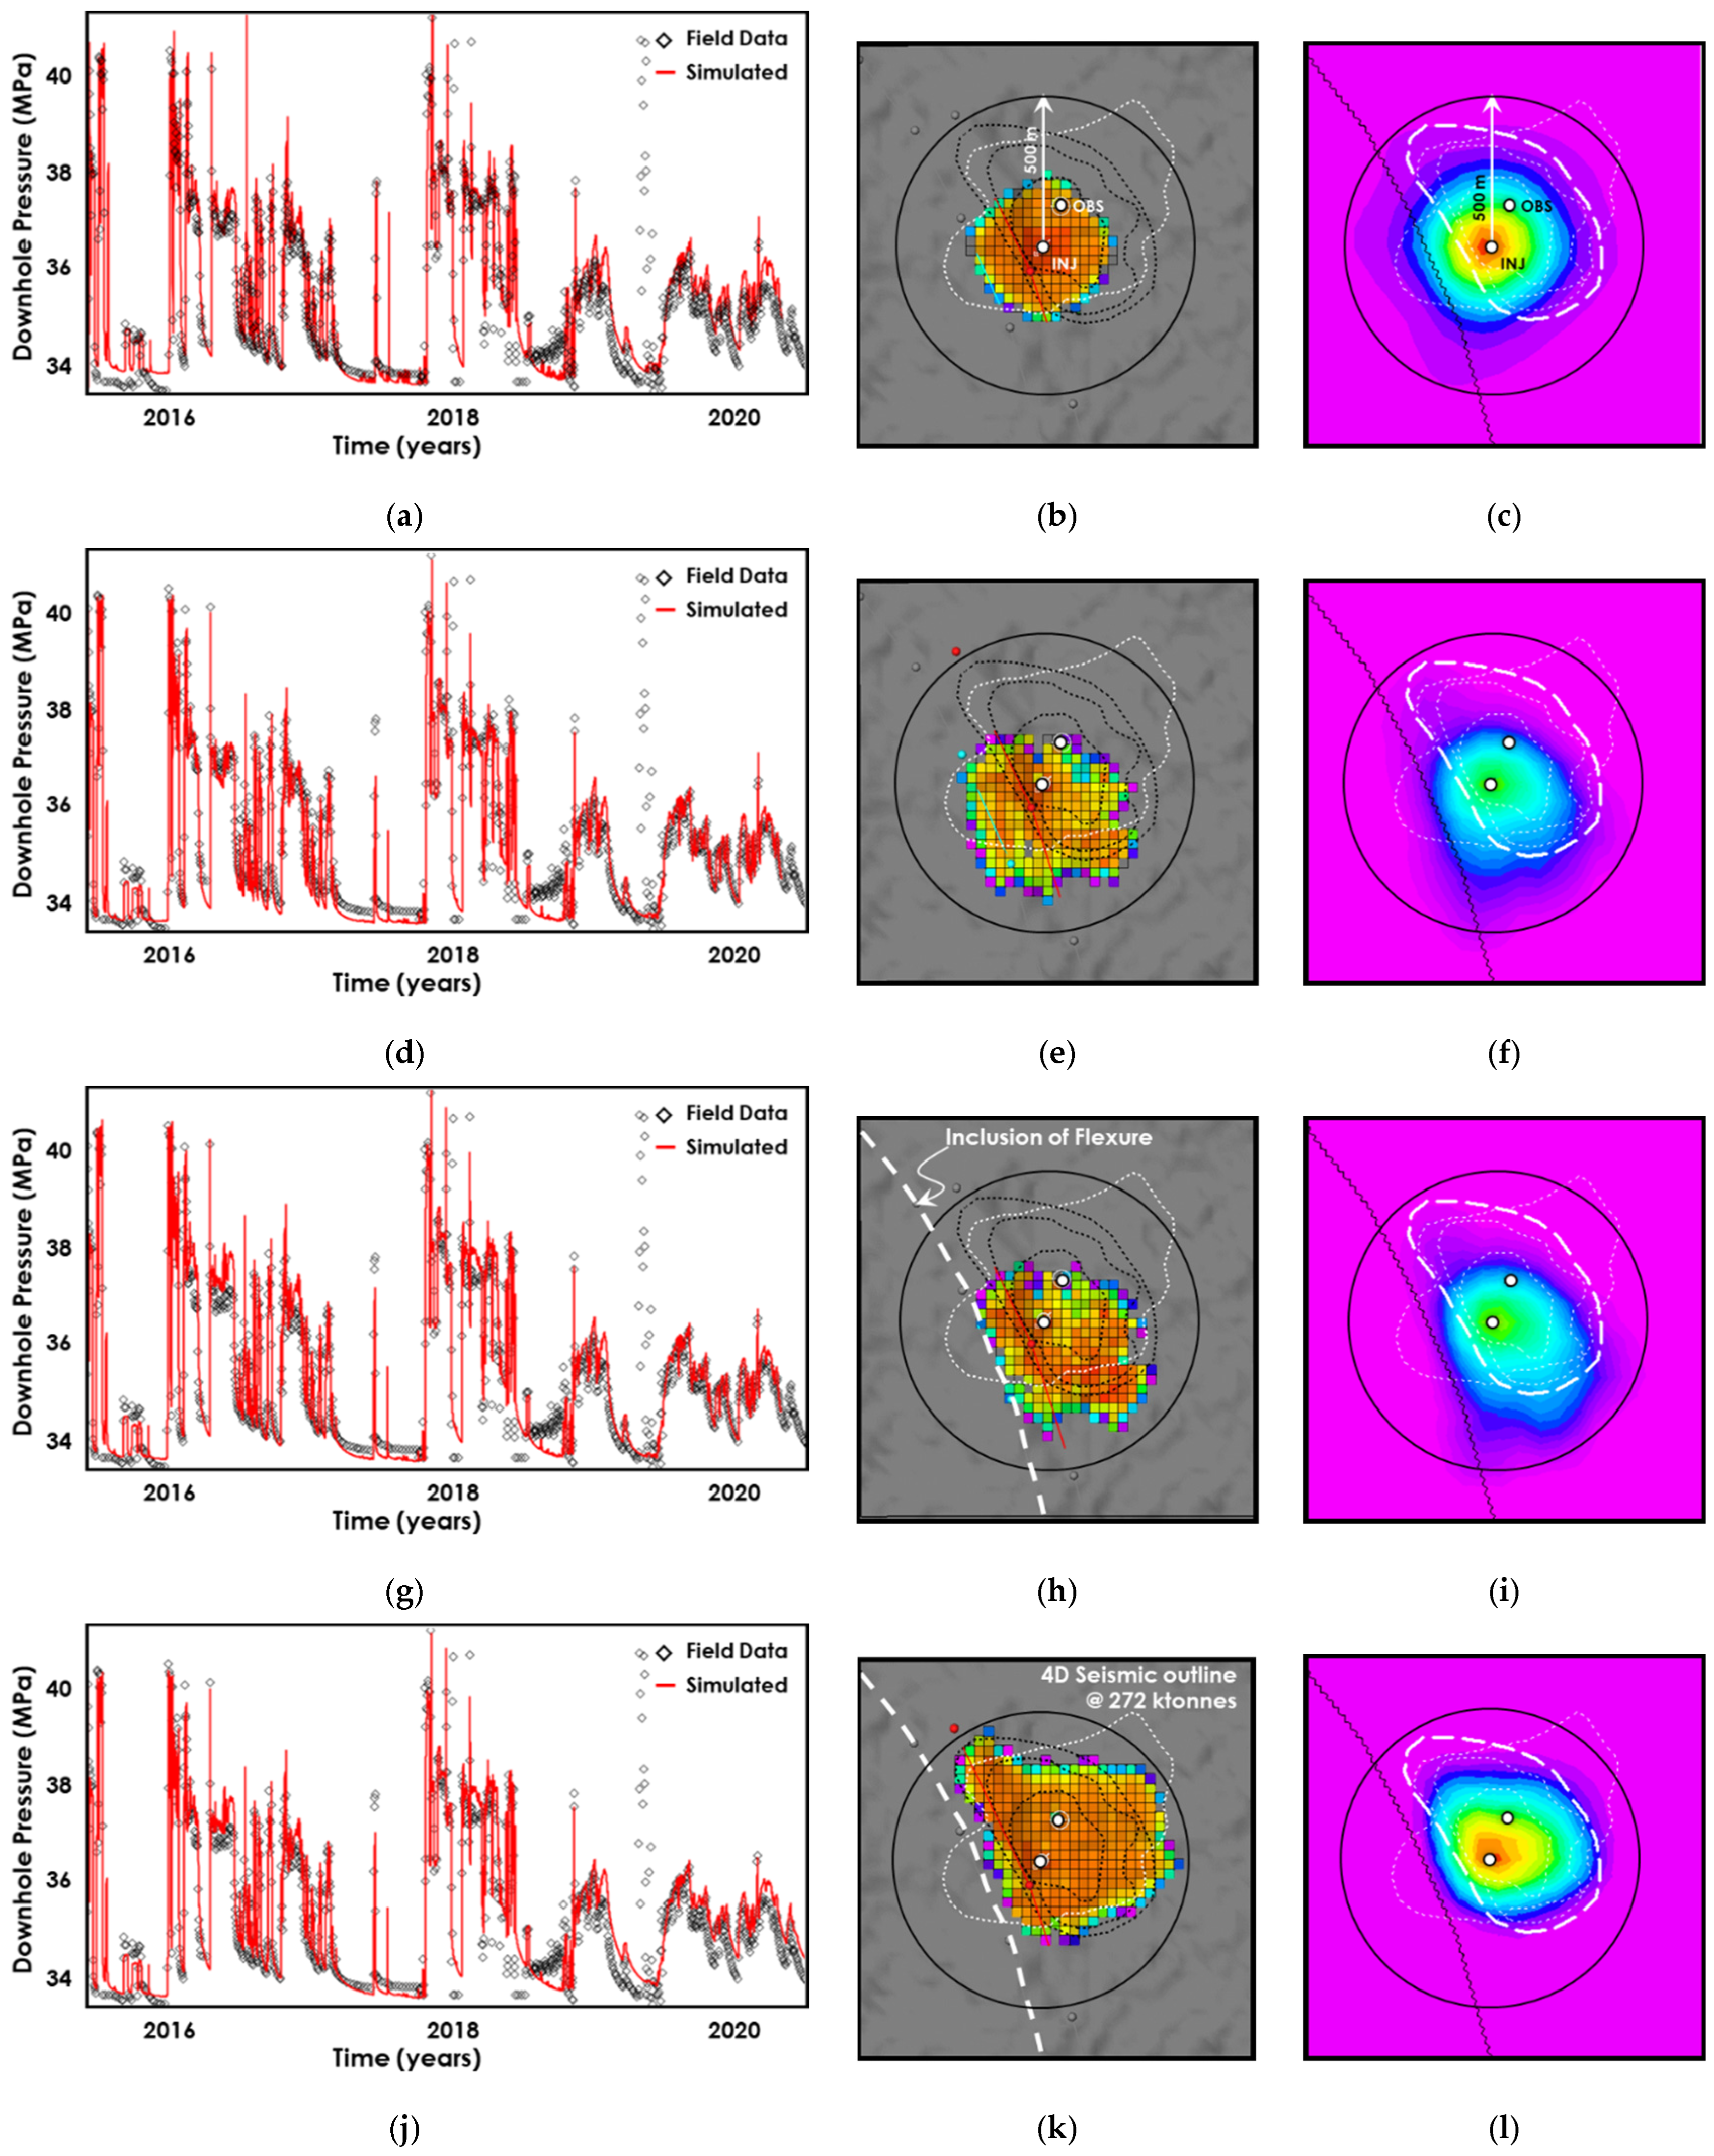
To ensure consistency with observed reservoir behavior and provide a robust foundation for predictive analysis, the full reservoir model was first calibrated against injection history, spanning April 2015 to April 2020. Initial simulations accurately reproduced downhole conditions, including bottomhole pressure, temperature, and injection rates, but yielded a geologically unrealistic, symmetric “penny-shaped” plume (Figure 7b) due to the absence of MMV (monitoring, measurement, and verification) integration. The revised model (Figure 7k) incorporated iterative history matching to simultaneously honor well-based injection data, plume morphology derived from repeated 4D seismic surveys, the NNW–SSE trending flexure above the Precambrian basement, and near-wellbore and field measurements including DTS fiber-optic temperature data and pressure responses at the observation well. All subplots in Figure 7 provide a comparison of simulated downhole injection pressures with observed field data across multiple realizations: (i) a layer cake model, (ii) stochastic petrophysical distributions with and (iii) without the flexure, and (iv) stochastic properties constrained to acoustic impedance. Although omitted for brevity, the cumulative injected CO2 mass closely matched observed data across all realizations. While each scenario yields high-quality history matches, they produce varying estimates of plume morphology, highlighting the critical role of seismic-derived constraints in reducing uncertainty for predictive modeling.
Figure 7b,e,h,k compare simulated CO2 saturation in the top Deadwood D layer across multiple realizations with interpreted plume outlines from seismic surveys. Corresponding saturation-thickness maps (Figure 7c,f,i,l) across all layers demonstrate improved alignment when heterogeneity is incorporated, petrophysical properties are constrained to acoustic impedance, and the flexure is modeled as a permeability baffle. The revised simulation confirms that injected CO2 remains confined within the Deadwood-Winnipeg storage complex. Lateral migration is governed by stratigraphy and lithologic heterogeneity, with high-permeability sandstone beds facilitating preferential flow and shale-rich barriers acting as vertical restrictors.
Simulated pressure responses at the observation well for the layer cake model deviated significantly from real-time measurements obtained via a bubble tube system (Figure 8a). In contrast, the model incorporating P-wave acoustic impedance constraints and the basement flexure yielded pressure profiles that closely matched observed data (Figure 8b). This alignment provides an additional line of evidence supporting the predictive reliability of the latter model. It enhances confidence in its application for forecasting the CO2 circulation scenarios and further confirms hydraulic connectivity and reservoir compliance across multiple intervals. Additionally, no anomalous pressure spikes or gradients were reported, indicating the absence of leakage or vertical migration [35].

3.2. Base Case CO2 Circulation Test

The feasibility of CO2 circulation at the Aquistore site was evaluated using the fine-scale sector model between the injection and observation (i.e., production) wells. This model preserved geological heterogeneity, honored well log data, and was statistically validated before being initialized using the final state of the history-matched full-field simulation (April 2015–April 2020). A modified non-isothermal CMG-GEM model, calibrated to site-specific geological and operational conditions, was employed for the base-case simulation. A central assumption in this feasibility study was the repurposing of the existing observation well, located approximately 151 m from the injection well, as the production well during the circulation test.
Simulations across multiple plume realizations indicate that the layer cake assumption tends to overestimate gas saturation near the production well. Although initial saturation values are comparable across models, saturation rises rapidly within days of injection. The most pronounced increase occurs in the realization constrained by seismic data and incorporating the flexure structure. These findings suggest that geological heterogeneity, anisotropy, and structural complexity, rather than simplified stratigraphy, can significantly influence CO2 circulation performance by altering plume migration and trapping behavior.
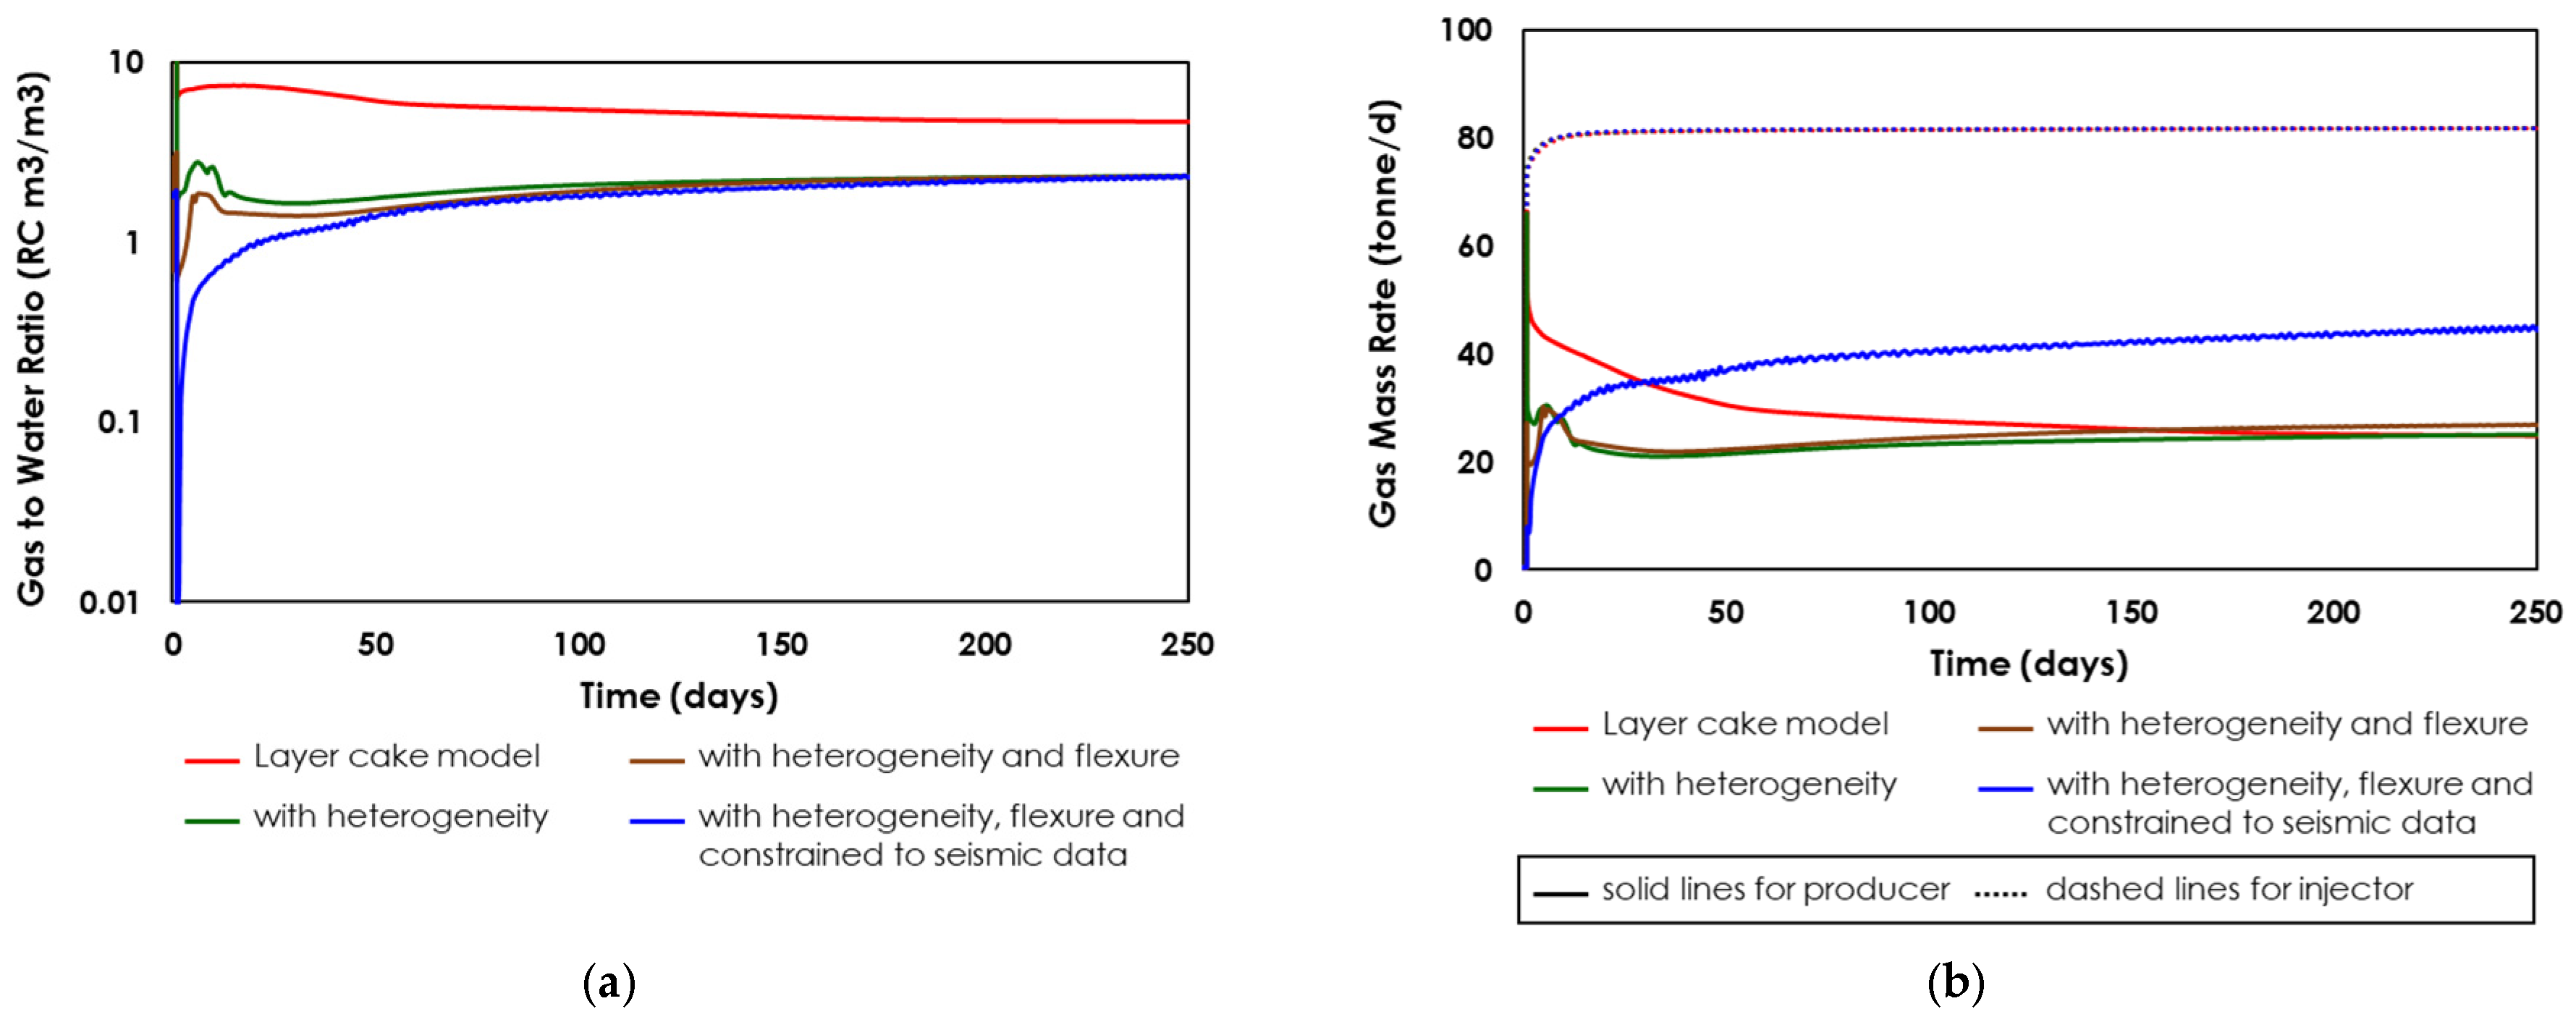
Figure 9a presents the gas-to-water ratio at the production well. While the layer cake model yields a more favorable ratio, all realizations exhibit a characteristic dip followed by increased CO2 recovery as the circulation test progresses. In the base-case scenario, injection occurs through four perforated intervals, whereas production is limited to Perforation 2. This asymmetry in completion design underscores the need to optimize well configurations to better manage CO2 and brine co-production. Figure 9b shows the CO2 mass rate at both the injection and production wells, enabling direct comparison across realizations. Although injected CO2 mass remains nearly identical in all cases, produced CO2 consistently falls short, indicating subsurface loss and partial trapping. This necessitates the use of makeup fluid (i.e., additional captured CO2) to maintain injection volumes across cycles. Circulating losses were defined as the difference between injected and produced CO2 volumes over a given circulation period. These losses can be tracked using surface flow meters and mass balance calculations, corrected for temperature, pressure, and phase behavior. In simulation, losses were allocated to trapping mechanisms based on spatial and temporal plume analysis; residual trapping was inferred from immobilized CO2 saturation, solubility trapping from dissolution into brine under local pressure and salinity conditions, and structural trapping from plume migration into low-permeability zones. In field operations, make-up CO2 volumes would be sourced from inventory and injected to maintain circulation continuity. These volumes are tracked as part of surface operations and reconciled in accounting as subsurface retention, subject to regulatory reporting and model-based attribution.
Notably, the highest produced CO2 mass occurs in the realization constrained by seismic data and flexure, reinforcing the potential for simultaneous circulation and storage. Given the presence of interbedded shale layers and multi-interval completions, production well perforation design remains a critical variable, particularly for mitigating voidage imbalance, water coning, CO2 gravity override, and buoyancy effects.
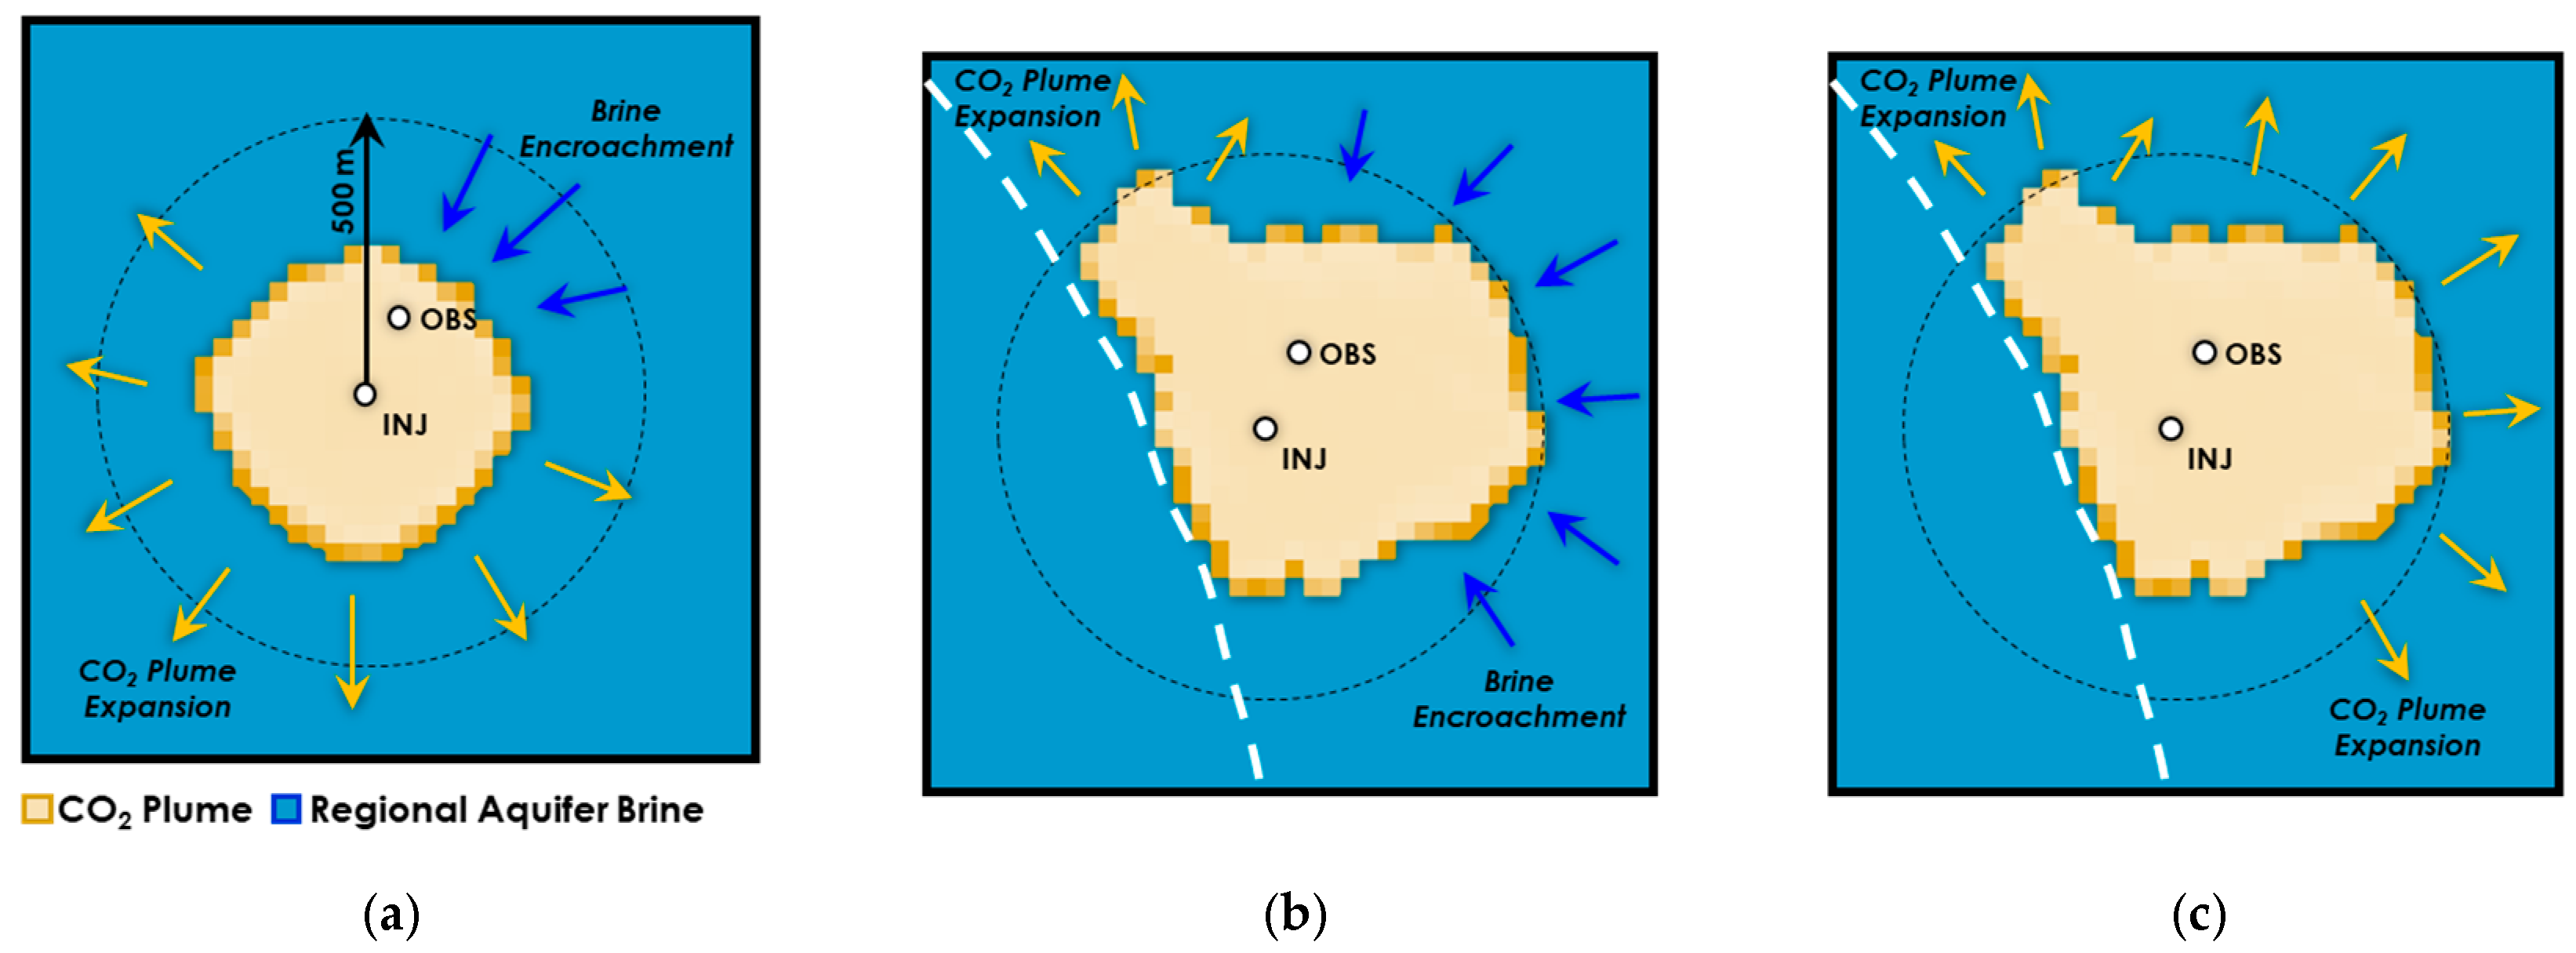
Figure 10 presents top-view maps of water saturation near the injection and production wells during CO2 circulation, comparing the layer cake model with a realization incorporating flexure and seismic constraints. Early simulation results indicate a risk of brine encroachment into the CO2 plume from the regional aquifer through the production well in both cases (Figure 10a,b). Notably, Figure 10b shows that geological heterogeneity and structural flexure significantly influence CO2 and brine migration relative to the simplified layer cake model, although brine production is expected in both scenarios. To mitigate this, the bottomhole pressure at the production well should be maintained above the regional aquifer pressure. An elevated injection rate of 900 rm3/day during the CO2 circulation test reduces brine ingress and promotes plume expansion, as illustrated in Figure 10c. These results highlight the critical role of operational parameters, such as injection and production rates and pressures, in minimizing brine intrusion and maintaining stable CO2 circulation between wells in CCS-enabled geothermal systems.

3.3. Dynamic Uncertainty Analysis of the CO2 Circulation Test

Dynamic uncertainty in CO2 injection arises from limited confidence in defining plume extent and geometry, the distribution of brine and CO2 saturations, and the heterogeneity and anisotropy of petrophysical properties and geological structures, such as shale baffles and flexures. Additional uncertainty stems from reservoir alterations, including permeability reduction due to salt precipitation and potential injectivity enhancement from localized thermal fracturing. Aquifer behavior further complicates predictions, particularly its capacity to mobilize brine into CO2-rich zones or low-pressure sinks, as well as the brine backflow observed during shut-in periods under intermittent injection conditions [39].
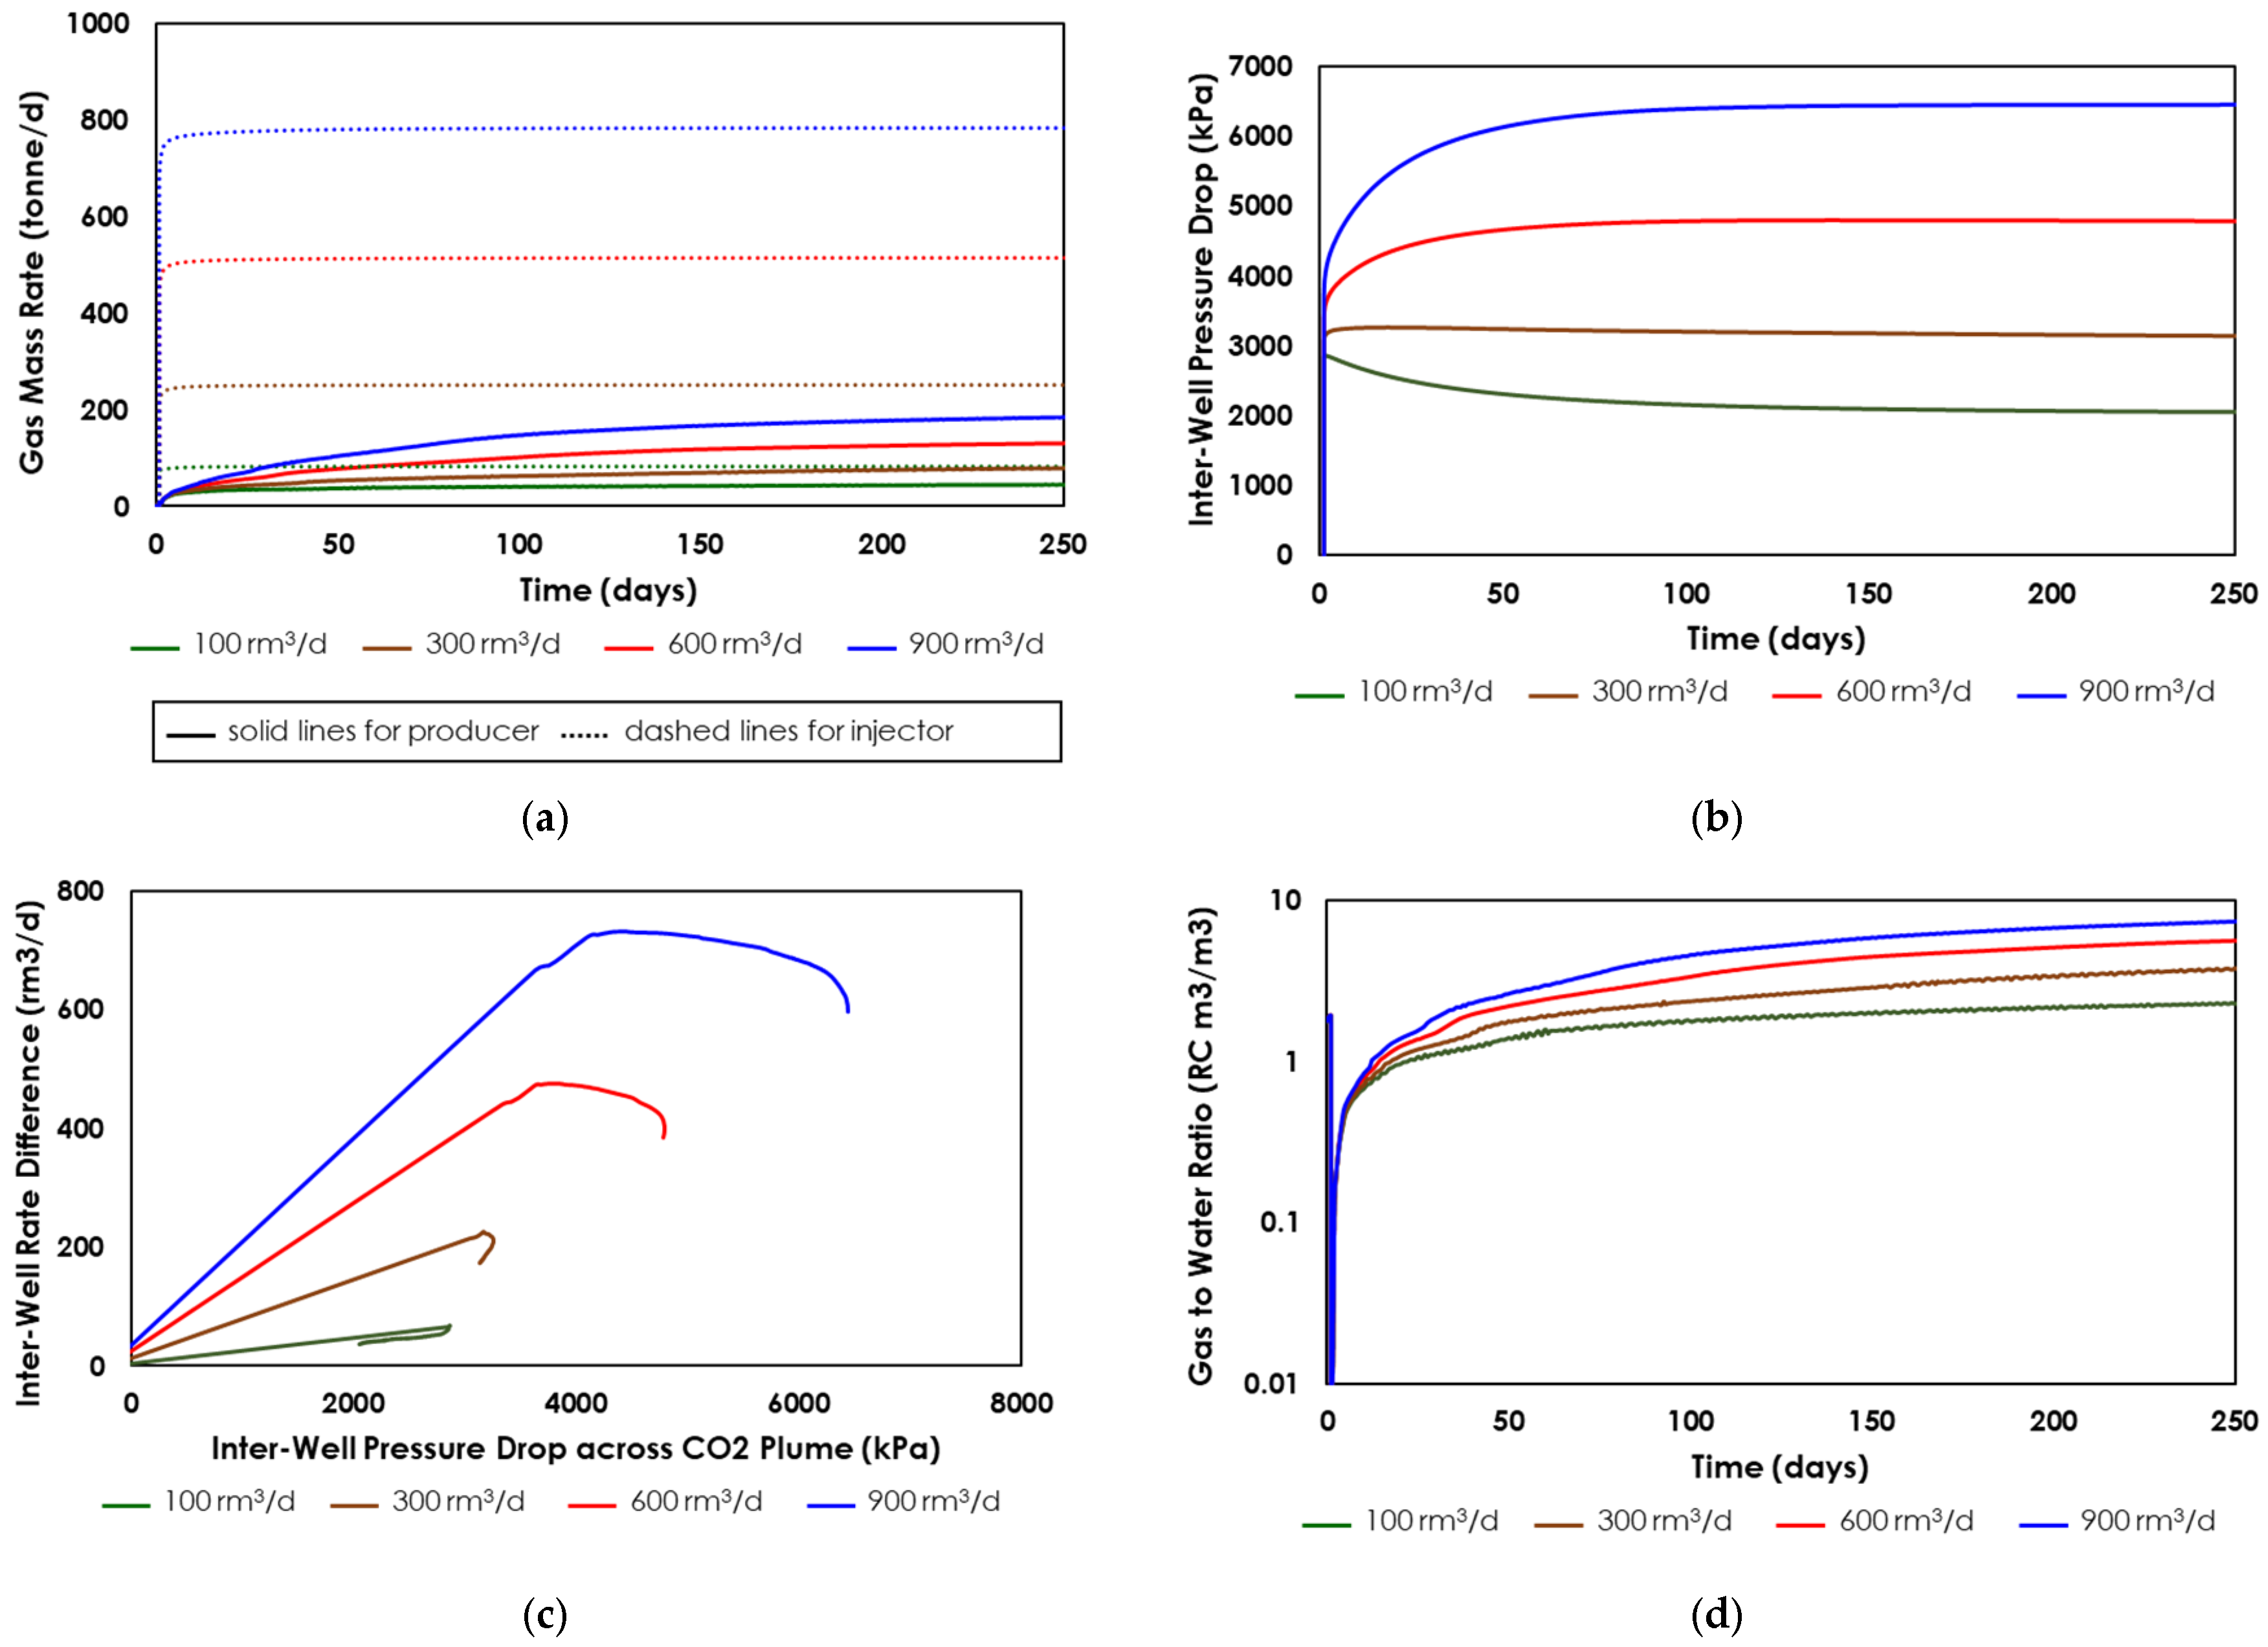
To address these uncertainties, simulations explored the influence of operational parameters, namely injection rate, bottomhole pressure, and well completion design, on CO2 circulation dynamics (Table 3). Across a range of injection rates (100–900 rm3/day), higher rates accelerated plume development, with the saline formation demonstrating sufficient injectivity to accommodate elevated CO2 volumes without significant disruption (Figure 11a). However, the time required to reach steady-state conditions, defined by stabilization of the production rate, increased with injection rate due to pressure buildup and saturation front propagation.
In practice, initial formation pressure is estimated from pre-injection well tests, static pressure surveys, and regional hydrogeological data. Aquifer pressure, representing the brine-saturated zone surrounding the plume, is inferred from offset wells, monitoring arrays, and simulation boundary conditions. Plume pressure, which reflects the dynamic pressure within the CO2-saturated zone, is estimated from history-matched simulation outputs and downhole measurements near the injector. Uncertainties in these estimates arise from spatial heterogeneity, limited sensor resolution, and evolving fluid distributions during circulation. These uncertainties directly influence producer BHP setpoints, as excessive drawdown may induce brine ingress or salt precipitation, while conservative settings may limit CO2 recovery. In this study, BHP setpoints were selected to balance recovery and exclusion, informed by site-specific constraints and sensitivity analysis.
Maintaining injection pressure above the CO2 plume pressure proved essential for sustained injectivity and plume propagation. Injection pressure approaches steady-state across all scenarios, with stabilization time governed by plume extent and internal pressure. In this case, the initial formation pressure was 34.2 MPa, while the average plume pressure prior to circulation was estimated at 36 MPa. The deviation between injection pressure and plume pressure appears to control the rate of pressure stabilization and how fast the pressure reaches steady-state conditions (Figure 11b). Bottomhole pressure exerted a strong influence on circulation performance. At the injector, higher rates required elevated BHPs, capped at 42.5 MPa (95% of the fracturing threshold). At the producer, a minimum BHP of 33 MPa was enforced. Operating below aquifer or plume pressure consistently led to brine inflow, confirming producer BHP as a dominant control on fluid mobility. Optimizing this pressure to remain above aquifer levels while allowing sufficient drawdown for CO2 recovery is essential. Given the injector’s pressure ceiling, producer BHP emerged as the primary factor in managing plume behavior and fluid production. Simulations revealed a near-linear relationship between injector–producer pressure differential, CO2 mass balance, and stabilized circulation performance (Figure 11c).
Completion design also strongly affected recovery efficiency and liquid loading. In the base case, CO2 was injected through four perforated intervals, while production was limited to a single interval at the production well. This asymmetry restricted the drainage area, increased the risk of localized saturation buildup, and heightened susceptibility to liquid loading during early brine breakthrough. As shown in Figure 11d, gas-to-water ratios improved with higher injection rates but remained sensitive to completion design. Vertical flow segregation, exacerbated by shale interbeds, further reduced sweep efficiency. Expanding the producer’s completion to include additional intervals could mitigate these issues, enhance CO2 recovery, and improve pressure management.
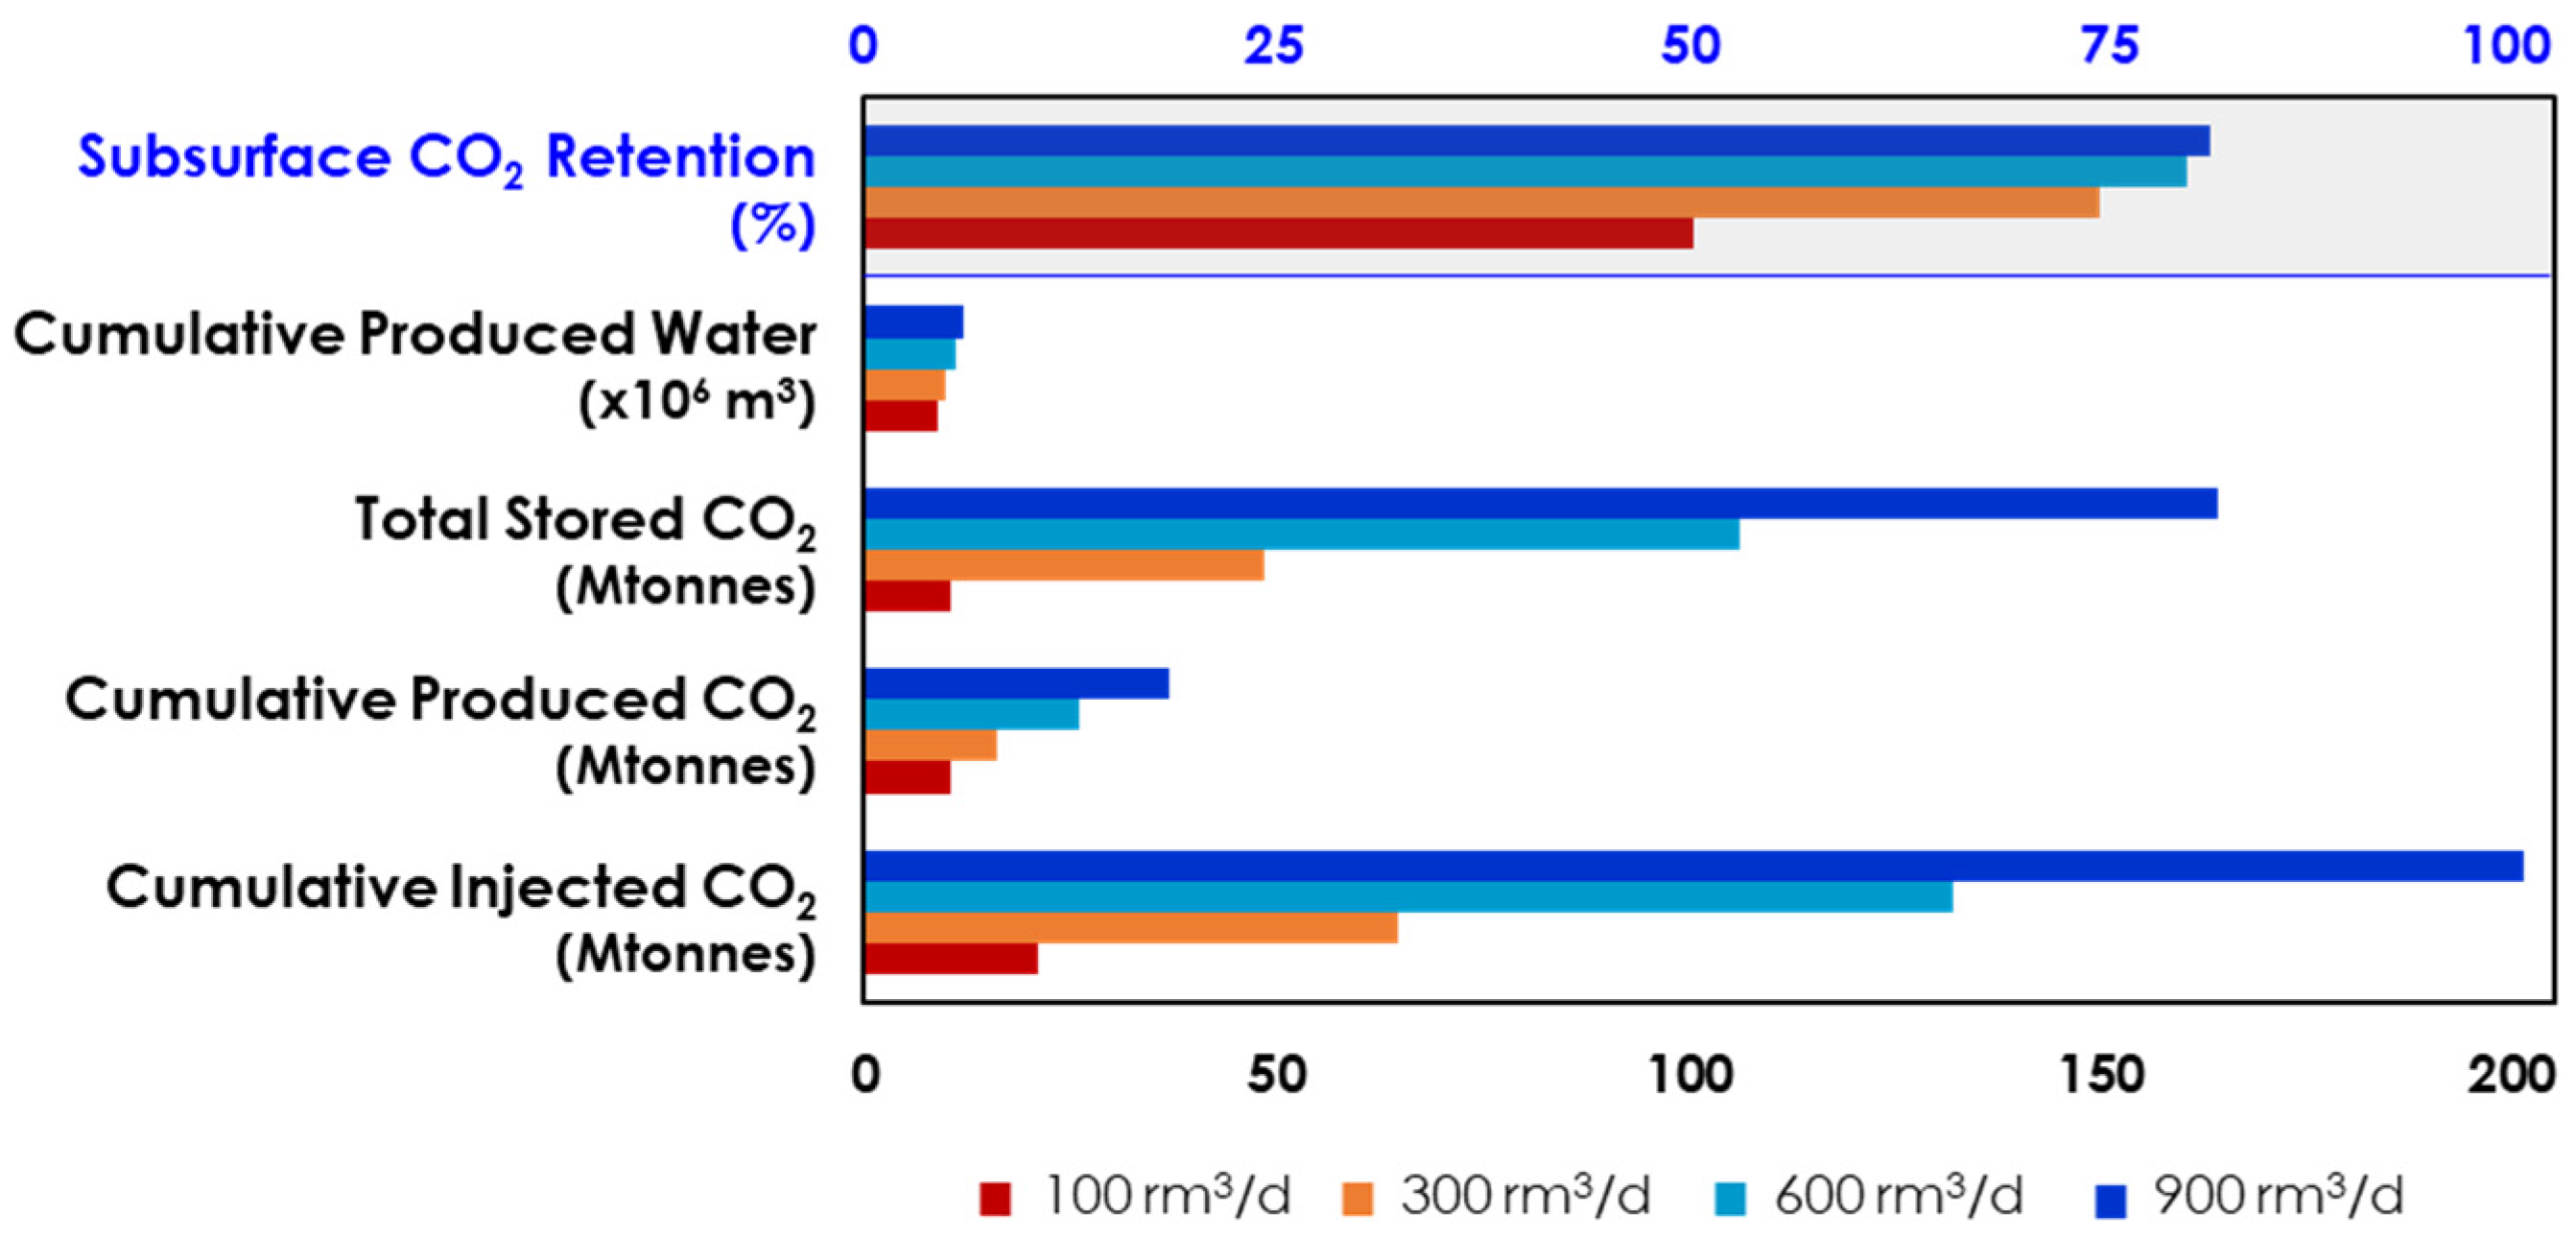
Although both production rate and cumulative CO2 production increased with higher injection rates, recovery efficiency declined; the ratio of produced to injected mass dropped from 49% to 24%, while storage efficiency improved from 50% to 82%. These trends reinforce the dual benefit of circulation and sequestration, indicating that higher rates promote greater CO2 retention within the formation, likely due to enhanced trapping mechanisms and multi-horizon flow complexity (Figure 12). All simulations showed an initial brine surge followed by a sharp decline, suggesting that circulation tests may encounter early liquid loading that subsequently stabilizes. This underscores the need for considering proper surface facilities to manage initial brine production without interrupting operations. Importantly, early brine breakthrough should not be misinterpreted as a failed or immature pilot test. Premature shut-in of the production well may compromise the evaluation of long-term circulation dynamics and storage behavior. Brine production also increased slightly with higher injection rate, pointing to stronger aquifer displacement and potential for early brine breakthrough. These findings underscore the need for careful operational planning to balance CO2 recovery, brine management, and long-term injectivity.
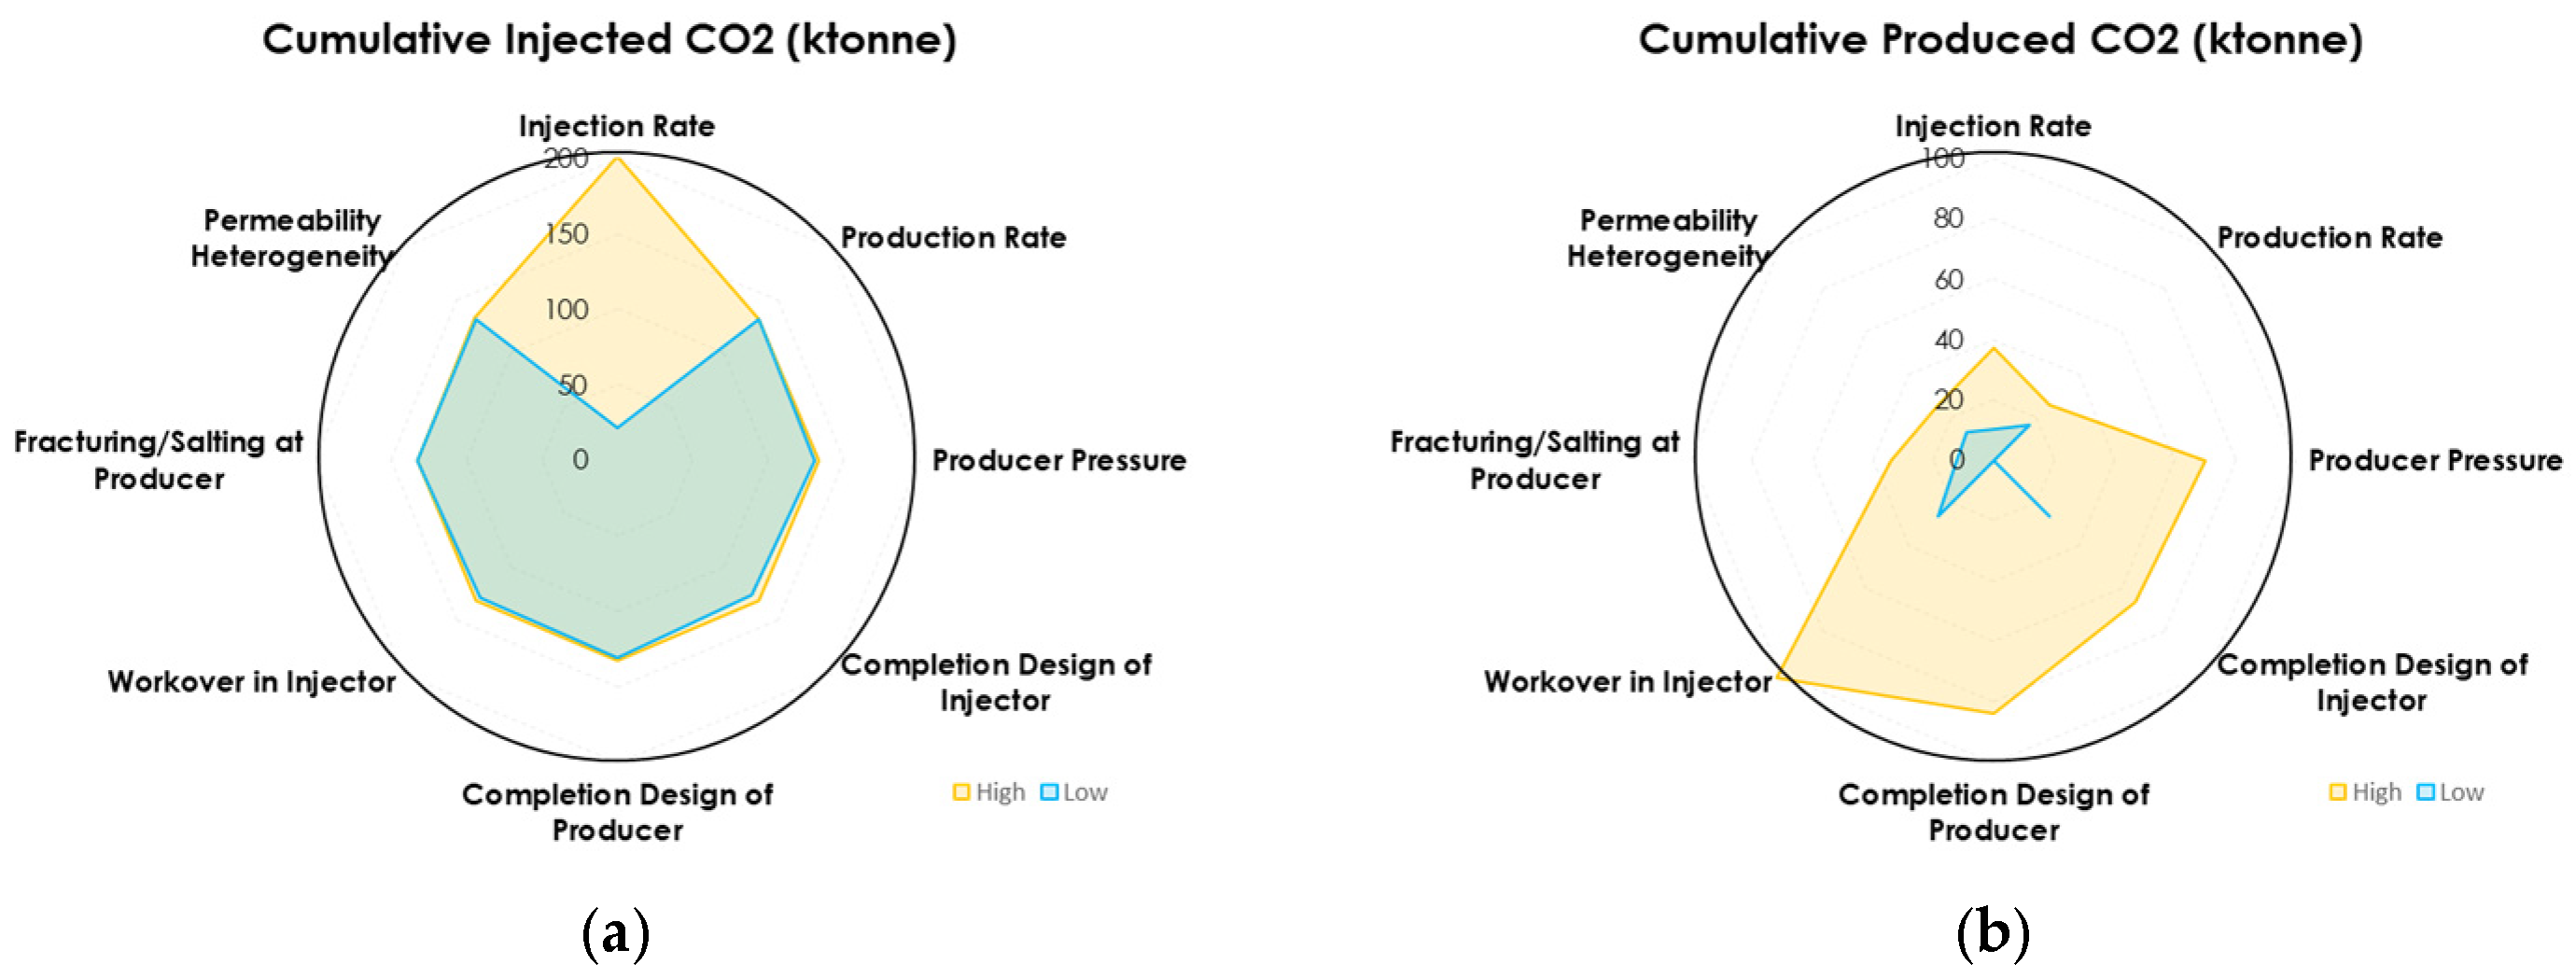
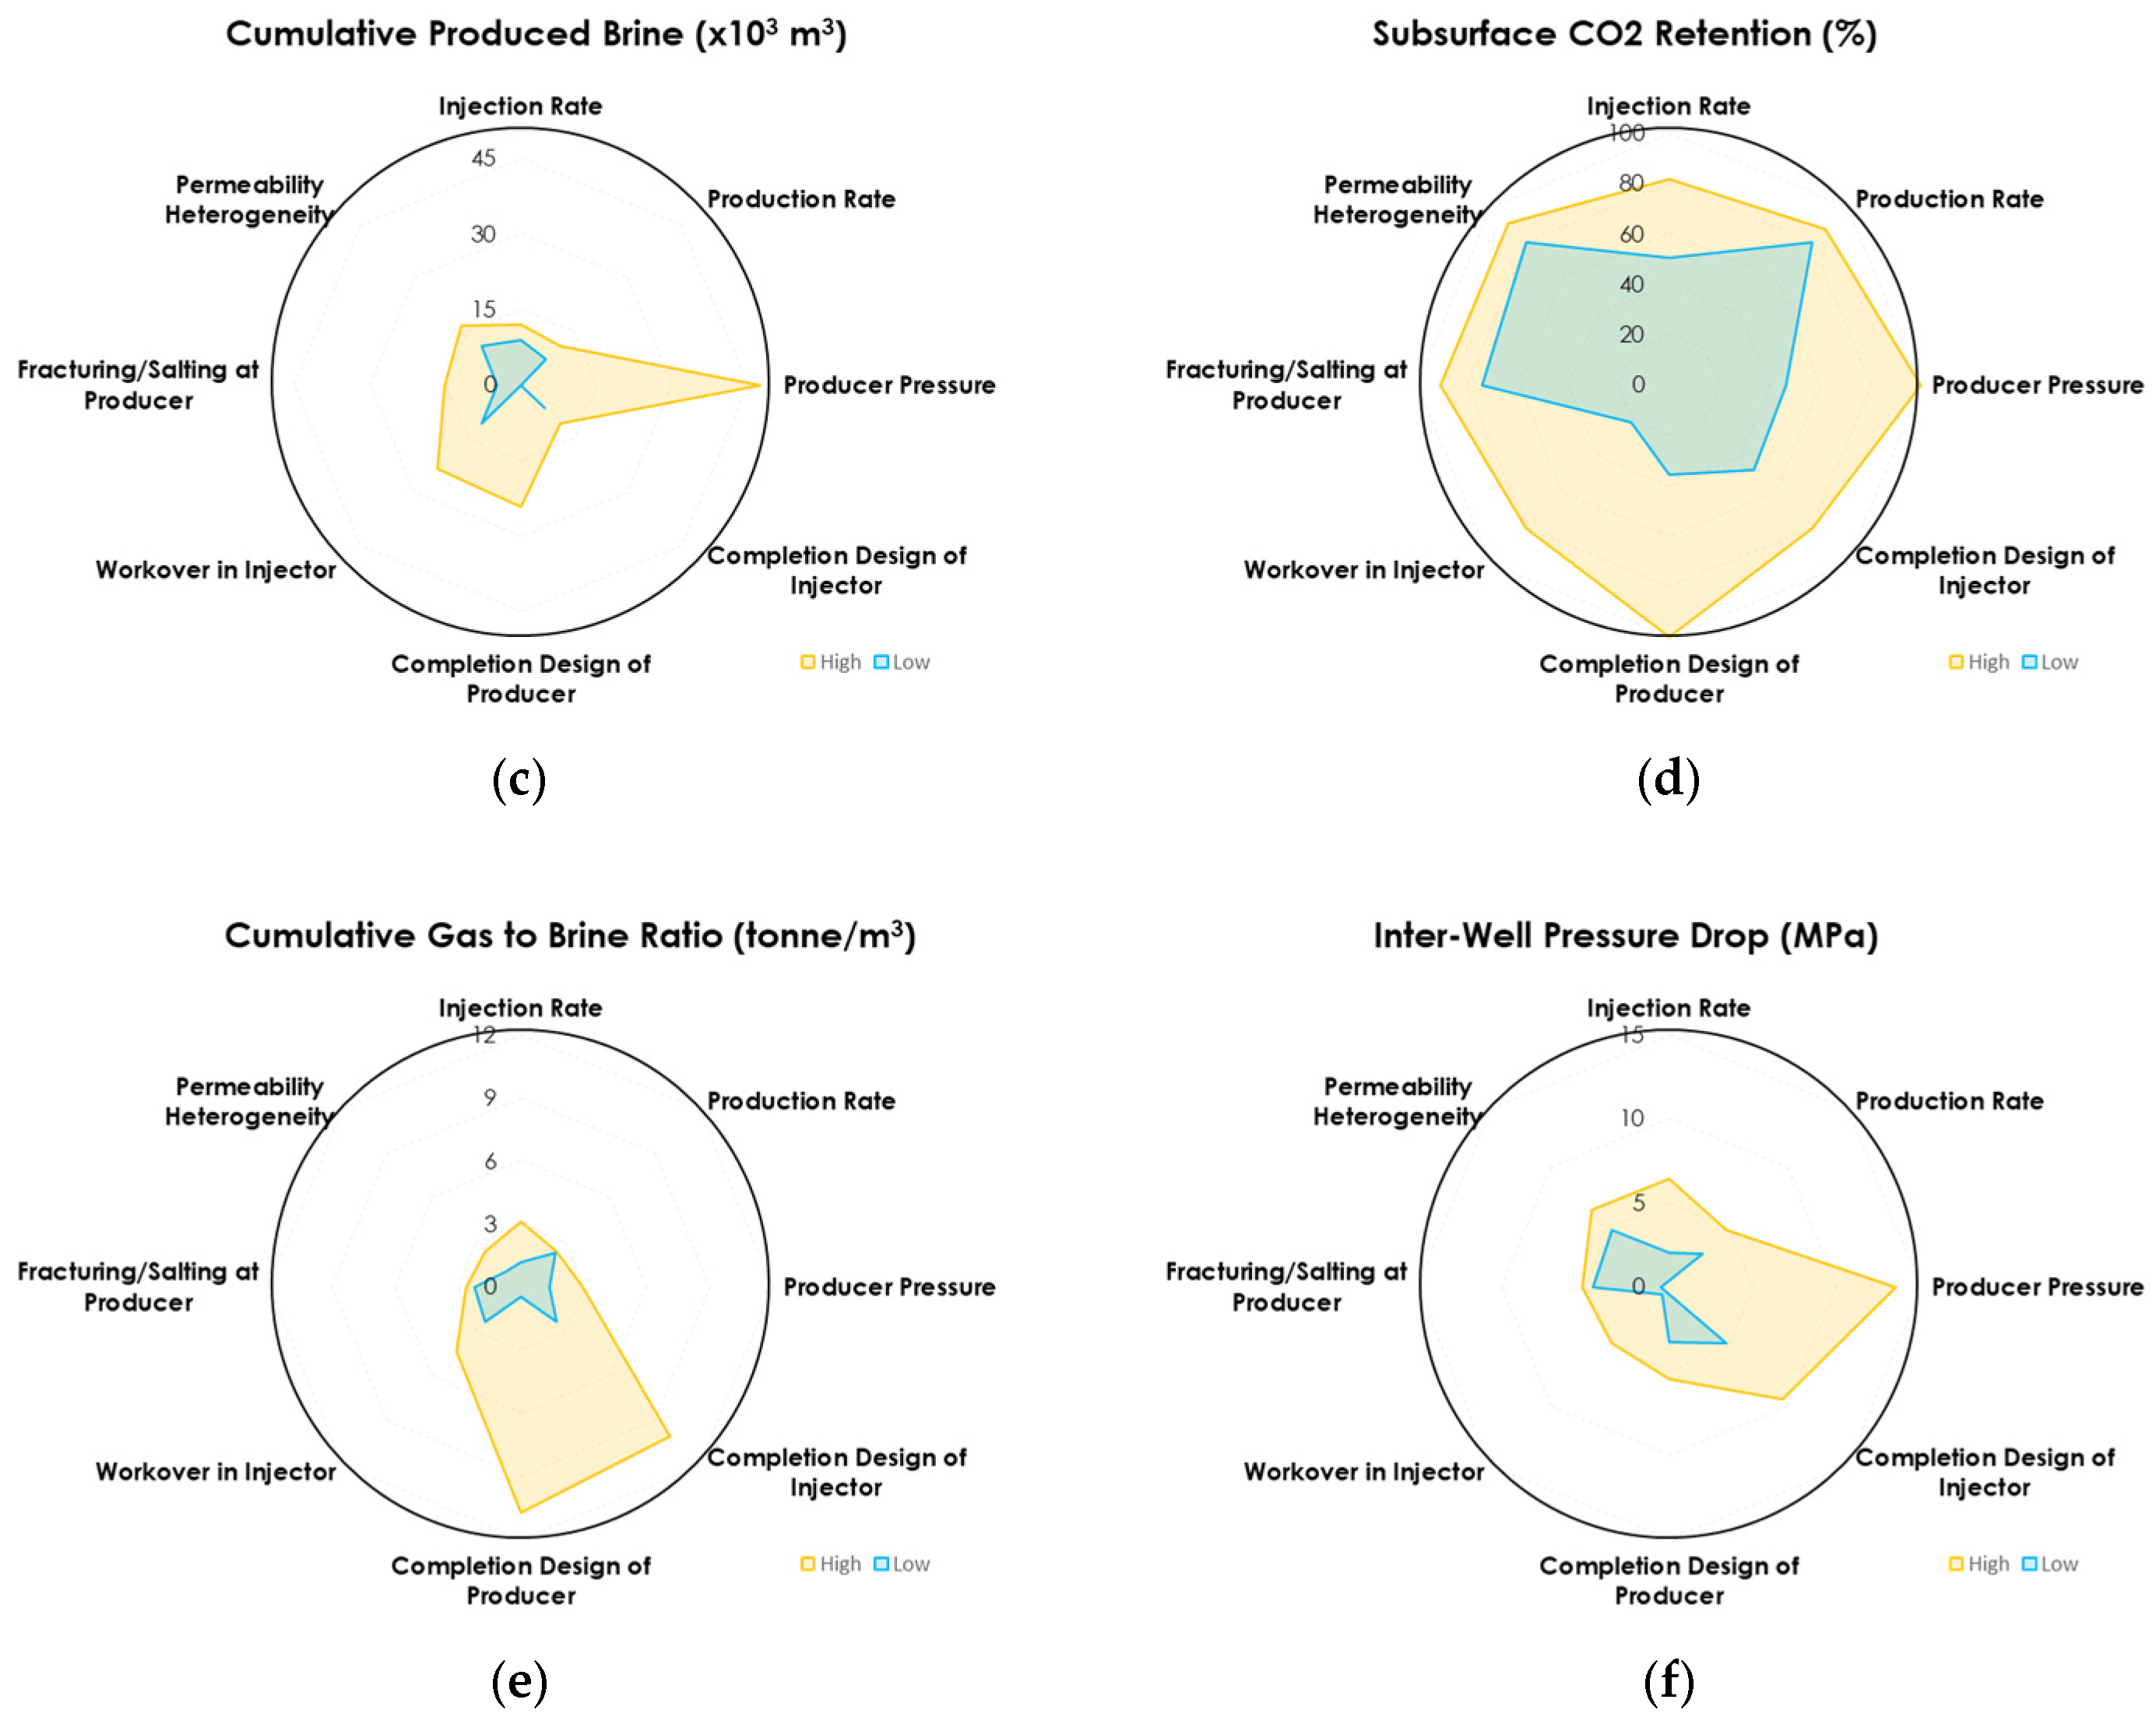
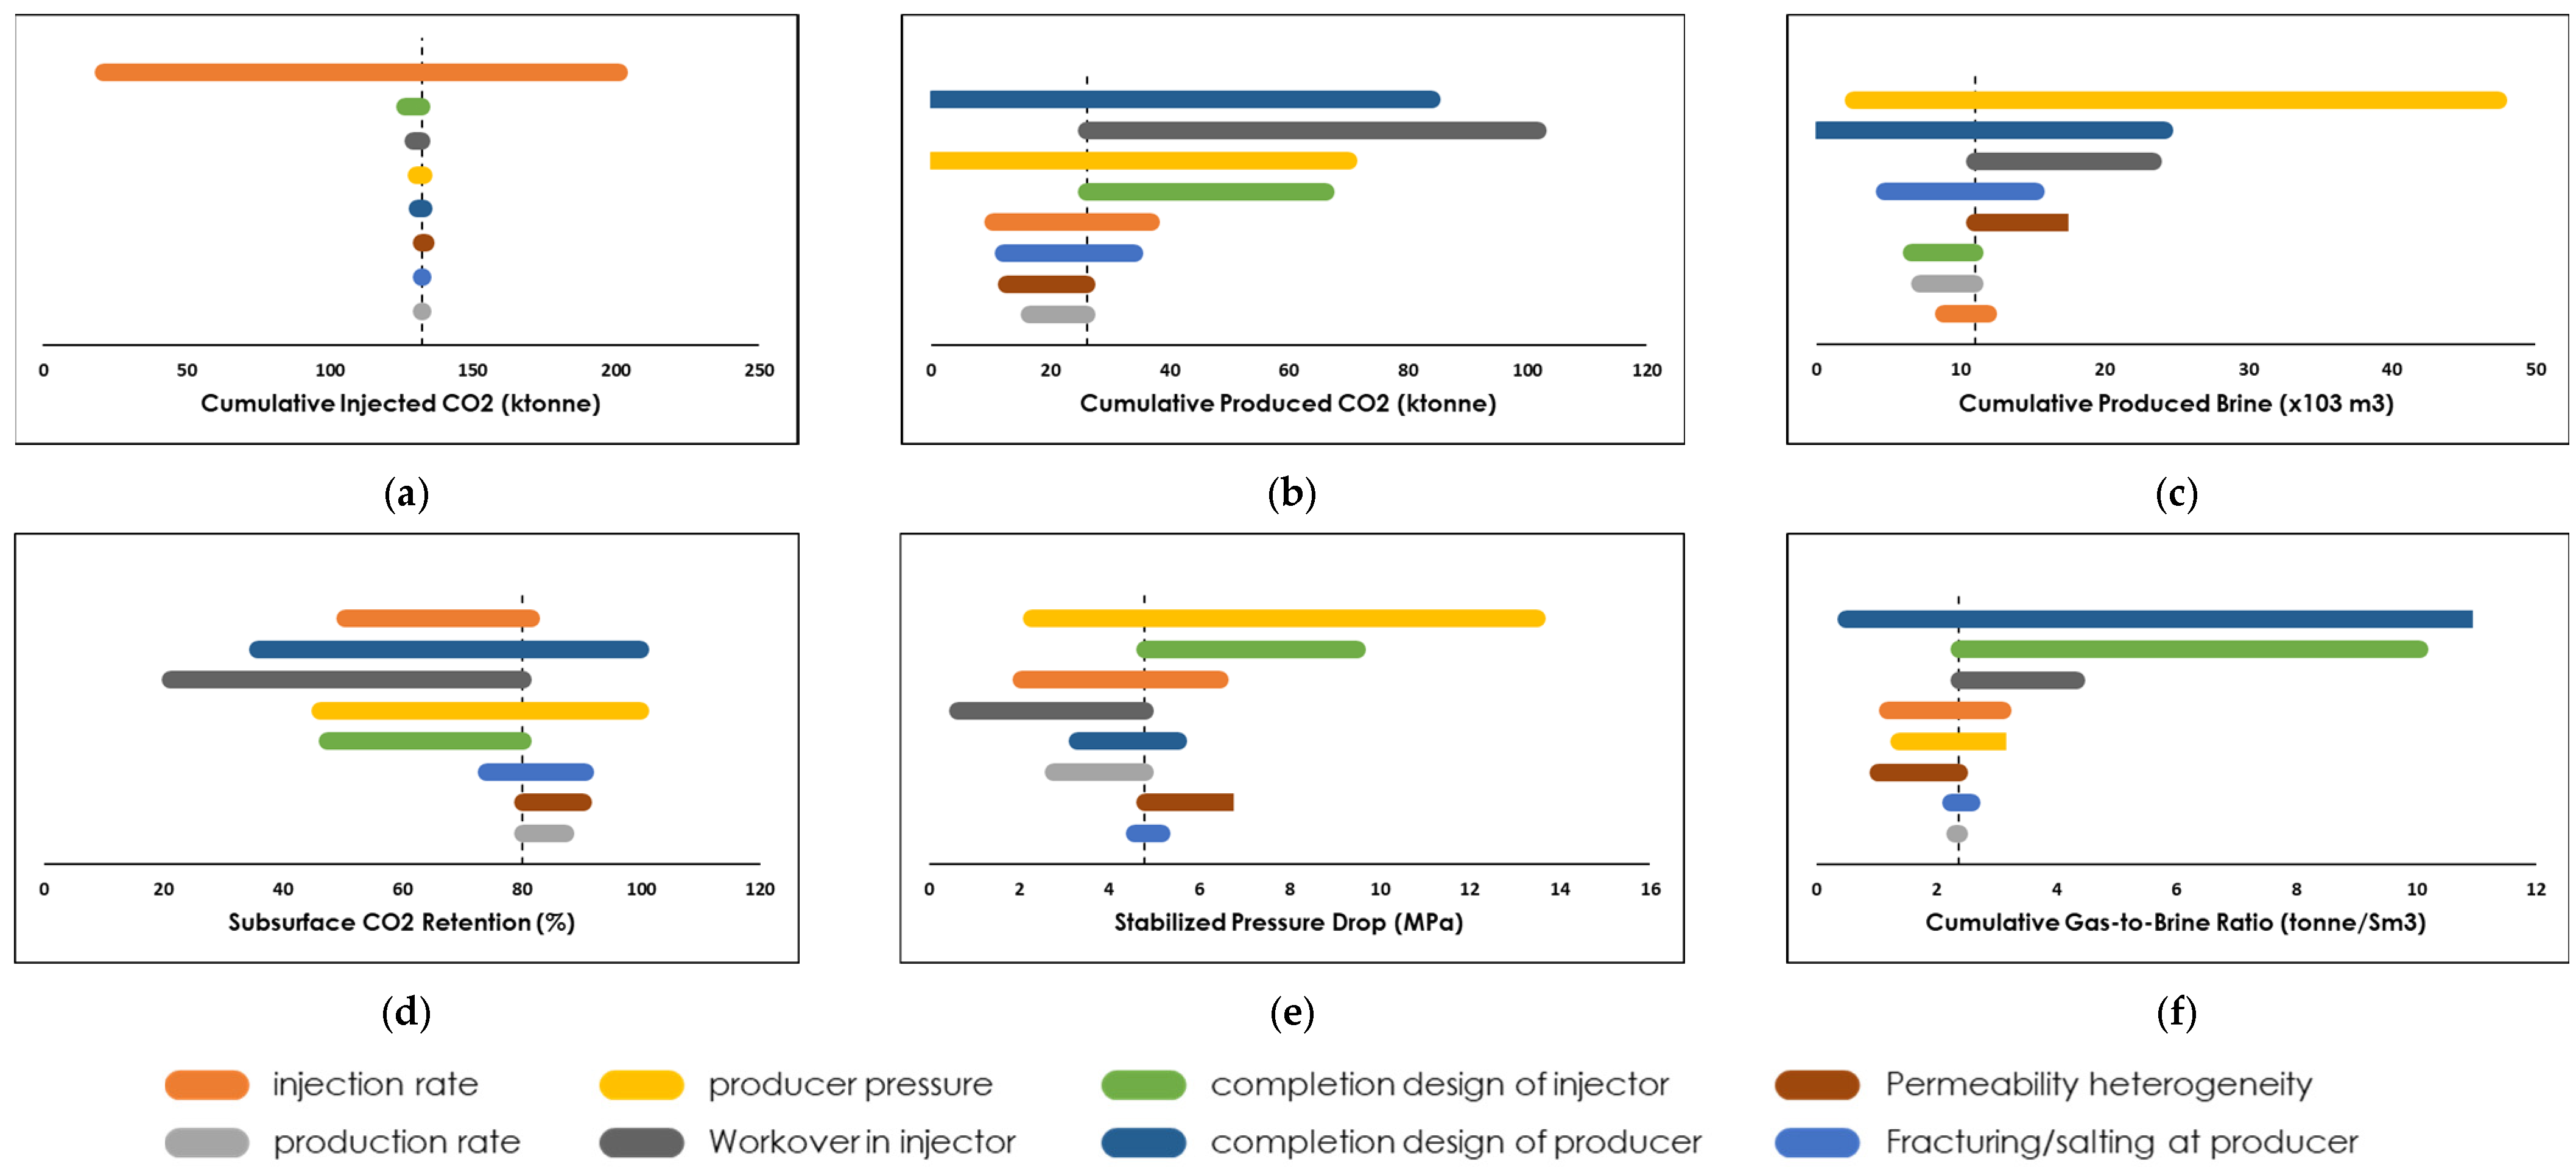
Post-workover scenarios simulating 10× to 100× increases in injectivity yielded up to 300% increases in CO2 production and 85% improvements in gas-to-water ratio. These enhancements mitigated liquid loading and reduced brine production, improving overall test viability. Scenario ranking was based on multi-metric appraisal, with realizations evaluated for both short-term production gains and long-term plume containment. High-performing cases demonstrated favorable pressure gradients, minimal brine inflow, and sustained CO2 retention. Figure 13 and Figure 14 presents spider and tornado plots summarizing the sensitivity of key performance metrics to operational parameters. Cumulative injected CO2 was most influenced by injector completion design and post-workover changes, with injection rate also playing a major role (Figure 13a). Cumulative produced CO2 depended more on producer completion design, post-workover changes, and producer BHP; injector constraints rank lower due to the CO2 plume acting as a secondary source in early production stages (Figure 13b). Brine production was primarily controlled by producer BHP. Operating below the pressure of the CO2 plume and aquifer consistently led to brine inflow, emphasizing the need to maintain plume pressure above aquifer pressure through careful balancing of injection and production parameters (Figure 13c). Subsurface CO2 retention was most sensitive to injection rate; higher rates promote larger plume expansion and increase trapping potential. Multi-well configurations could further reduce CO2 loss and surface fluid requirements (Figure 13d). The gas-to-brine ratio was influenced by the completion designs of both wells (Figure 13e), while producer BHP largely determined the pressure drop across the plume, affecting fluid mobility and production stability (Figure 13f).
In short, the uncertainty analysis revealed that injection rate, completion design, and producer BHP were the dominant factors across multiple key performance indicators. Injection rate governed plume development, trapping efficiency, and brine displacement. Completion design determined sweep efficiency and risk of liquid loading. Producer BHP controlled brine inflow from the aquifer. While geological heterogeneity played a role, operational parameters provided the most effective levers for optimization. Limited sensitivity to permeability variations was observed, likely due to the pre-established plume spanning both wells and the massive, continuous sand bodies of the Aquistore formation. Nonetheless, permeability enhancements from fracturing or salt migration could further improve flow. Thermal effects, such as heat exchange and CO2 retention time, also warrant further investigation to assess their influence on injectivity and long-term circulation viability.

3.4. Operational Implications of Flow Regime Transition in Production Well

Simulation results revealed that the vertical flow behavior within the production well is governed by a complex interplay of gas and liquid velocities, bottomhole pressure, and completion design. These factors collectively determine the prevailing flow regime, which in turn influences CO2 recovery efficiency and brine management. Flow regime evolution with injection rate is shown in Figure 15. At lower injection rates, the system predominantly exhibits bubble and slug flow regimes, characterized by intermittent gas pockets within a continuous liquid phase. These regimes are prone to liquid accumulation, increasing the risk of liquid loading and reduced gas lift efficiency. As injection rates increase, the system transitions toward churn and eventually annular flow, where gas becomes the continuous phase, entraining liquid droplets and minimizing liquid holdup. Annular flow is particularly favorable for sustained CO2 production, as it enhances gas mobility and mitigates the risk of wellbore flooding. Notably, the transition to annular flow is not solely dependent on injection rate. It also requires sufficient drawdown at the producer to maintain high gas velocities. Simulations indicate that unrestricted production rates and optimized bottomhole pressure settings are critical to achieving this regime.
Completion design and reservoir conditions also play a pivotal role in flow regime stability. Wells completed with multiple perforated intervals and enhanced permeability zones exhibit more robust transitions to annular flow. In contrast, wells with limited perforation or heterogeneous permeability profiles tend to remain in slug or churn regimes, increasing operational risk. Workover operations, such as acidizing, hydraulic fracturing, or salt removal, significantly improved injectivity and permeability between the injector and producer. These enhancements shifted the flow regime toward annular conditions, supporting sustained CO2 recovery and reducing brine accumulation. In formations with pre-developed CO2 plumes (e.g., Aquistore), minor heterogeneities had limited impact on regime transitions. In contrast, significant features such as shale barriers or stratigraphic discontinuities could disrupt flow paths, leading to localized liquid holdup and delayed regime evolution.
From an operational standpoint, maintaining annular flow is essential to avoid liquid loading and sustain continuous CO2 production. This requires careful balancing of injection rate, bottomhole pressure, and completion strategy. Annular flow can be sustained by controlling producer BHP to maintain a favorable pressure gradient and prevent brine influx. Setpoints are selected based on sensitivity analysis to optimize CO2 recovery and flow regime stability. In field operations, regime diagnostics would rely on wellhead pressure and temperature trends, gas-to-water ratio evolution, and transient pressure responses. If available, distributed temperature sensing (DTS) could further confirm vertical flow structure. Excessive drawdown at the producer can induce brine influx from the aquifer, while insufficient gas velocity may lead to regime collapse. The production well modeling results underscore the need for dynamic pressure management and real-time monitoring during CO2 circulation tests. Incorporating flow regime diagnostics into operational workflows can help identify early signs of liquid loading and guide corrective actions.

4. Discussion and Field Implications

This study demonstrates that CO2 circulation at the Aquistore site is not only technically feasible, but also operationally robust under realistic field conditions. The simulation framework, grounded in seismic-constrained geology and dynamic reservoir behavior, confirms that the saline formation can support both CO2 circulation and permanent storage. Operational performance hinges on the interplay between injection rate, bottomhole pressure, and completion design. While higher injection rates expand the plume and enhance trapping, they also introduce challenges in recovery efficiency and brine displacement. The key lies in balancing injectivity with drawdown to maintain stable flow regimes and avoid excessive brine production.
Across all simulated scenarios, injected CO2 consistently exceeded produced volumes, indicating retention through residual trapping and dissolution. Higher injection rates enhanced storage by increasing plume-rock interaction, while multi-horizon injection promoted stratigraphic distribution and immobilization. These outcomes suggest that CO2 circulation can serve as a storage phase, advancing long-term sequestration goals while providing real-time insights into plume behavior. Future CCS-enabled geothermal pilot projects should treat circulation testing as a strategic element of the injection-storage lifecycle, emphasizing operational controls that maximize both fluid/heat recovery and CO2 retention. To mitigate risks associated with running a CO2 circulation test, several key lessons emerge for future pilot design and operations:
  • Brine production is not failure. Early brine breakthrough is transient and manageable. Surface systems must be designed to accommodate initial brine volumes without disrupting operations.
  • Flow regime stability is essential. Sustaining annular flow requires precise control of production rates, bottomhole pressure, and completion geometry. Liquid loading remains a primary risk if these factors are misaligned.
  • Operational flexibility outweighs limited geological uncertainty. Once the plume spans both wells, permeability variations exert minimal influence. Adaptive well design and pressure control are more impactful than subtle subsurface variability.
  • Salt precipitation near the producer, particularly under high drawdown conditions, may contribute to wellbore scaling, reduced injectivity, and long-term flow assurance challenges. These risks highlight the need for near-wellbore management strategies in future CO2 circulation operations.
  • Hydrate formation must be anticipated. Preventive measures, including thermal management, chemical inhibition, and flow assurance design are critical, particularly in surface infrastructure and tubing bends where CO2 clathrates may form due to localized drops in pressure and temperature. Although hydrate formation was beyond the scope of this study, thermodynamic screening indicates that such conditions are plausible under both downhole and surface scenarios. Historical evidence from the Cranfield pilot test underscores this concern, where surface-level clathrate formation disrupted flow. If not mitigated, hydrates can restrict tubing capacity, reduce injectivity, and promote secondary effects such as salt precipitation.
  • The current well spacing at Aquistore (151 m) appears to balance plume development, pressure, and brine control. While optimal spacing for integrated geothermal systems such as CPG depends on heat extraction and flow recovery, this study focuses solely on circulation feasibility between two existing wells. Future well placement should consider site-specific geology and operational constraints.
These insights emphasize the need for integrated planning that combines predictive simulation, flexible completions, and responsive surface operations to ensure safe and informative testing. Optimization strategies should focus on (i) multi-zone completions targeting high-permeability layers, (ii) production rate tuning to sustain CO2 lift, and (iii) workovers to remove obstructions and improve injectivity. These interventions stabilize flow regimes, reduce operational risks, and enhance both recovery efficiency and long-term storage performance. Future work may benefit from fully coupled thermo-hydro-mechanical (THM) modeling to capture stress evolution, permeability changes, and fracture behavior under cyclic injection. Recent studies [64] show how THM coupling can improve flow regime prediction and support operational diagnostics in CCS and geothermal systems. The dynamics of CO2 circulation open pathways for hybrid CCS-geothermal systems. CO2’s favorable thermophysical properties make it an efficient medium for heat extraction, particularly in permeable formations. At Aquistore, reservoir conditions support dual-purpose operations. The developed plume between injector and producer wells offers a natural conduit for sustained thermal exchange. Integrating geothermal recovery with CO2 storage could enhance project economics, improve pressure management, and deliver renewable energy co-benefits. Future pilots should explore this synergy, optimizing well configurations and flow regimes to maximize both storage and energy outputs.

5. Conclusions and Remarks

This study presents a comprehensive simulation-based evaluation of CO2 circulation in a deep saline formation at the Aquistore site, integrating reservoir modeling, wellbore flow analysis, and operational feasibility. Results confirm that CO2 circulation is viable under realistic subsurface conditions and offer insights into the operability of integrated CO2-geothermal systems.
Simulations show that a substantial portion of injected CO2 remains retained within the formation, primarily through residual trapping and dissolution. Multi-horizon injection enhances stratigraphic distribution and contact with trapping structures, supporting long-term sequestration goals. Operational performance is governed by injection rate, bottomhole pressure, and completion design. While higher injection rates promote plume expansion and increase storage potential, they reduce recovery efficiency. Annular flow is identified as the preferred regime for sustained CO2 lift, requiring adequate gas velocity, optimized perforation, and minimal flow restrictions.
To ensure successful field implementation, several design considerations must be carefully integrated into the project plan. First, surface facilities should be capable of handling early brine production without disrupting operations. To improve sweep efficiency and support scalability, multi-well configurations may be necessary. Enhancing drainage and recovery can be achieved by expanding perforation intervals in the production well. Pressure management is also critical: injection pressures should remain below fracturing thresholds, while the bottomhole pressure in the producer must stay above aquifer levels to prevent brine inflow. Completion asymmetry, especially limited perforation at the producer, restricts drainage and increases the risk of liquid loading. Well stimulation techniques such as fracturing and salt removal improve injectivity and flow continuity. Finally, integrating geothermal energy systems could capitalize on existing thermal gradients, offering both operational advantages and improved project economics.
When considered collectively, these design strategies reinforce the simulation results, which indicate that CO2 circulation at Aquistore is both technically sound and operationally promising. With thoughtful design and adaptive management, it offers a robust pathway for validating subsurface storage behavior, optimizing well performance, and informing the future deployment of CCS-enabled geothermal systems.

Author Contributions

A.R.S.: Conceptualization; methodology; software; validation; formal analysis; investigation; data curation; writing—original draft preparation; writing—review and editing; visualization. R.C.: Conceptualization; methodology; resources; writing—review and editing; funding acquisition. All authors have read and agreed to the published version of the manuscript.

Funding

This research was funded by the Swiss Federal Office of Energy (SFOE) in Switzerland, and the Petroleum Technology Research Centre (PTRC), Saskatchewan, Canada.

Data Availability Statement

The data used in this study were provided by the Petroleum Technology Research Centre (PTRC) and the Aquistore team under research agreement. Restrictions apply to the availability of these data, which were used with permission and are not publicly available.

Acknowledgments

The authors gratefully acknowledge the Petroleum Technology Research Centre (PTRC) in Saskatchewan who provided access to Aquistore data and the Geothermal Energy & Geofluids Group, Institute of Geophysics, ETH Zurich, Switzerland, for their valuable recommendations and insights throughout the study. The authors also thank Schlumberger for providing the Petrel software package (version 2020.1) and Computer Modelling Group Ltd. for access to the CMG simulation suite (version 2020.1), Calgary, Alberta, Canada.

Conflicts of Interest

The authors declare no conflicts of interest.

References

  1. Randolph, J.B.; Saar, M.O. Combining geothermal energy capture with geologic carbon dioxide sequestration. Geophys. Res. Lett. 2011, 38, 1–7. [Google Scholar] [CrossRef]
  2. Hau, K.P.; Brehme, M.; Shokri, A.R.; Nickel, E.; Malakooti, R.; Chalaturnyk, R.J.; Saar, M.O. CCS Coupled with CO2 Plume Geothermal Operations: Enhancing CO2 Sequestration and Reducing Risks. Geothermics 2025, 133, 103447. [Google Scholar] [CrossRef]
  3. Nielsen, C.M.; Frykmana, P.; Dalhoffb, F. Synergy benefits in combining CCS and geothermal energy production. Energy Procedia 2013, 37, 2622–2628. [Google Scholar] [CrossRef]
  4. Wu, J.; Ansari, U. From CO2 Sequestration to Hydrogen Storage: Further Utilization of Depleted Gas Reservoirs. Reserv. Sci. 2025, 1, 19–35. [Google Scholar] [CrossRef]
  5. Wang, F.; Kobina, F. The Influence of Geological Factors and Transmission Fluids on the Exploitation of Reservoir Geothermal Resources: Factor Discussion and Mechanism Analysis. Reserv. Sci. 2025, 1, 3–18. [Google Scholar] [CrossRef]
  6. Movahedzadeh, Z.; Shokri, A.R.; Chalaturnyk, R.J.; Nickel, E.; Sacuta, N. Measurement, Monitoring, Verification and Modelling at the Aquistore CO2 Storage Site. First Break 2021, 39, 69–75. [Google Scholar] [CrossRef]
  7. Coats, K.H. Geothermal Reservoir Modelling. In SPE Annual Fall Technical Conference and Exhibition; Society of Petroleum Engineers: Denver, CO, USA, 1977; p. 33. [Google Scholar] [CrossRef]
  8. Brown, D. A Hot Dry Rock geothermal energy concept utilizing supercritical CO2 instead of water. In Proceedings of the Twenty-Fifth Workshop on Geothermal Reservoir Engineering; Stanford University: Stanford, CA, USA, 2000; pp. 233–238. [Google Scholar]
  9. Schifflechner, C.; de Reus, J.; Schuster, S.; Villasana, A.C.; Brillert, D.; Saar, M.O.; Spliethoff, H. Paving the way for CO2-Plume Geothermal (CPG) systems: A perspective on the CO2 surface equipment. Energy 2024, 305, 132258. [Google Scholar] [CrossRef]
  10. Shokri, A.R.; Vaisblat, N.; Wigston, A.; Champollion, Y.; Hickson, C.; Chalaturnyk, R.J. Improving the Competitiveness of Geothermal Energy Exploitation through Integrated CO2 Storage in the Western Canadian Sedimentary Basin. GRC Trans. 2022, 46, 2098–2111. [Google Scholar]
  11. Pruess, K.; Azaroual, M. On the feasibility of using supercritical CO2 as heat transmission fluid in an Engineered Hot Dry Rock Geothermal System. In Proceedings of the Thirty-First Workshop on Geothermal Reservoir Engineering; Stanford University: Stanford, CA, USA, 2006; pp. 386–393. [Google Scholar]
  12. Xu, T.; Apps, J.A.; Pruess, K. Mineral sequestration of carbon dioxide in a sandstone-shale system. Chem. Geol. 2005, 217, 295–318. [Google Scholar] [CrossRef]
  13. Ueda, A.; Kato, K.; Ohsumi, T.; Yajima, T.; Ito, H.; Kaieda, H.; Meycalf, R.; Takase, H. Experimental studies of CO2-rock interaction at elevated temperatures under hydrothermal conditions. Geochem. J. 2005, 39, 417–425. [Google Scholar] [CrossRef]
  14. Zhang, L.; Cui, G.; Zhang, Y.; Ren, B.; Ren, S.; Wang, X. Influence of pore water on the heat mining performance of supercritical CO2 injected for geothermal development. J. CO2 Util. 2016, 16, 287–300. [Google Scholar] [CrossRef]
  15. Atrens, A.; Gurgenci, H.; Rudolph, V. Exergy analysis of a CO2 thermosiphon. In Proceedings of the Thirty-Fourth Workshop on Geothermal Reservoir Engineering, Stanford, CA, USA, 9–11 February 2009; pp. 1–6. [Google Scholar]
  16. Pruess, K. On production behavior of enhanced geothermal systems with CO2 as working fluid. Energy Convers. Manag. 2008, 49, 1446–1454. [Google Scholar] [CrossRef]
  17. Randolph, J.B.; Adams, B.; Kuehn, T.H.; Saar, M.O. Wellbore heat transfer in CO2-based geothermal systems. Geotherm Resour Counc. Trans. 2012, 36, 549–554. [Google Scholar]
  18. Hau, K.P.; Shokri, A.R.; Chalaturnyk, R.J.; Saar, M.O. On the Suitability of the Aquistore CCS-site for a CO2-Circulation Test. In Proceedings of the World Geothermal Congress, Reykjavik, Iceland, 21–26 May 2021. [Google Scholar]
  19. Garapati, N.; Randolph, J.B.; Saar, M.O. Brine displacement by CO2, energy extraction rates, and lifespan of a CO2-limited CO2-Plume Geothermal (CPG) system with a horizontal production well. Geothermics 2015, 55, 182–194. [Google Scholar] [CrossRef]
  20. Adams, B.M.; Kuehn, T.H.; Bielicki, J.M.; Randolph, J.B.; Saar, M.O. A comparison of electric power output of CO2 Plume Geothermal (CPG) and brine geothermal systems for varying reservoir conditions. Appl. Energy 2015, 140, 365–377. [Google Scholar] [CrossRef]
  21. Adams, B.M.; Kuehn, T.H.; Bielicki, J.M.; Randolph, J.B.; Saar, M.O. On the importance of the thermosiphon effect in CPG (CO2 plume geothermal) power systems. Energy 2014, 69, 409–418. [Google Scholar] [CrossRef]
  22. Randolph, J.B.; Saar, M.O. Coupling carbon dioxide sequestration with geothermal energy capture in naturally permeable, porous geologic formations: Implications for CO2 sequestration. Energy Procedia 2011, 4, 2206–2213. [Google Scholar] [CrossRef]
  23. Ezekiel, J.; Ebigbo, A.; Adams, B.M.; Saar, M.O. Combining natural gas recovery and CO2- based geothermal energy extraction for electric power generation. Appl. Energy 2020, 269, 115012. [Google Scholar] [CrossRef]
  24. Levy, E.K.; Wang, X.; Pan, C.; Romero, C.E.; Maya, C.R. Use of hot supercritical CO2 produced from a geothermal reservoir to generate electric power in a gas turbine power generation system. J. CO2 Util. 2018, 23, 20–28. [Google Scholar] [CrossRef]
  25. Delshad, M.; Kong, X.; Tavakoli, R.; Hosseini, S.A.; Wheeler, M.F. “Modeling and simulation of carbon sequestration at Cranfield incorporating new physical models. Int. J. Greenh. Gas Control 2013, 18, 463–473. [Google Scholar] [CrossRef]
  26. Hovorka, S.D.; Meckel, T.A.; Trevino, R.H. Monitoring a large-volume injection at Cranfield, Mississippi—Project design and recommendations. Int. J. Greenh. Gas Control 2013, 18, 345–360. [Google Scholar] [CrossRef]
  27. Fleming, M.R.; Adams, B.M.; Kuehn, T.H.; Bielicki, J.M.; Saar, M.O. Increased Power Generation due to Exothermic Water Exsolution in CO2 Plume Geothermal (CPG) Power Plants. Geothermics 2020, 88, 101865. [Google Scholar] [CrossRef]
  28. Pan, L.; Doughty, C.; Freifeld, B. How to sustain a CO2-thermosiphon in a partially saturated geothermal reservoir: Lessons learned from field experiment and numerical modeling. Geothermics 2018, 71, 274–293. [Google Scholar] [CrossRef]
  29. Pan, L.; Doughty, C.; Freifeld, B.; Oldenburg, C. Modeling a CO2 thermosiphon in a partially saturated reservoir using EOS7CMA. In Proceedings of the TOUGH Symposium 2015, Lawrence Berkeley National Laboratory, Berkeley, CA, USA, 28–30 September 2015. [Google Scholar]
  30. Freifeld, B.M.; Pan, L.; Doughty, C.; Zakem, S.; Hart, K.; Hostler, S. Demonstration of Geothermal Energy Production Using Carbon Dioxide as a Working Fluid at the SECARB Cranfield Site, Cranfield, Mississippi. In Proceedings of the 41st Workshop on Geothermal Reservoir Engineering, Stanford, CA, USA, 22–24 February 2016; pp. 1–14. [Google Scholar]
  31. Hau, K.P. Feasibility of a CO2 Plume Geothermal (CPG) Pilot at the Aquistore (Canada) CCS site. Master’s Thesis, ETH Zürich, Zurich, Switzerland, 2020. [Google Scholar]
  32. White, D.J.; Hawkes, C.D.; Rostron, B.J. Geological characterization of the Aquistore CO2 storage site from 3D seismic data. Int. J. Greenh. Gas Control 2016, 54, 330–344. [Google Scholar] [CrossRef]
  33. Rostron, B.; White, D.J.; Hawkes, C.D.; Chalaturnyk, R.J. Characterization of the Aquistore CO2 project storage site, Saskatchewan, Canada. Energy Procedia 2014, 63, 2977–2984. [Google Scholar] [CrossRef]
  34. Peck, W.D.; Bailey, T.P.; Liu, G.; Klenner, R.C.L.; Gorecki, C.D.; Ayash, S.C.; Steadman, E.N.; Harju, J.A. Model Development of the Aquistore CO2 Storage Project. Energy Procedia 2014, 63, 3723–3734. [Google Scholar] [CrossRef]
  35. Talman, S.; Shokri, A.R.; Zambrano, G.; Chalaturnyk, R.J.; Nickel, E. Anomalous Start-Up Pressure Signals of a Bubble-Tube System for Downhole Pressure Determination at the Aquistore CO2 Injection Site. In Proceedings of the 16th Greenhouse Gas Control Technologies Conference (GHGT-16), Lyon, France, 23–24 October 2022. [Google Scholar] [CrossRef]
  36. Shokri, A.R.; Talman, S.; Chalaturnyk, R.J.; Nickel, E. On the Temporal Evolution of Non-Isothermal Injectivity Behaviour at an Active CO2 Injection Site. In Proceedings of the 55th US Rock Mechanics Geomechanics Symposium, Houston, TX, USA, 20–23 June 2021. [Google Scholar]
  37. Shokri, A.R.; Chalaturnyk, R.J.; Nickel, E. Non-Isothermal Injectivity Considerations for Effective Geological Storage of CO2 at the Aquistore Site, Saskatchewan, Canada. In SPE 196118-MS, SPE Annual Technical Conference and Exhibition; Society of Petroleum Engineers: Richardson, TX, USA, 2019. [Google Scholar] [CrossRef]
  38. Lee, S.-Y.; Swager, L.; Pekot, L.; Piercey, M.; Will, R.; Zaluski, W. Study of operational dynamic data in Aquistore project. Int. J. Greenh. Gas Control 2018, 76, 62–77. [Google Scholar] [CrossRef]
  39. Talman, S.; Shokri, A.R.; Chalaturnyk, R.J.; Nickel, E. Salt Precipitation at an Active CO2 Injection Site. In Gas Injection into Geological Formations and Related Topics; John Wiley & Sons Inc.: Hoboken, NJ, USA, 2020; pp. 183–199. [Google Scholar] [CrossRef]
  40. Schlumberger. Aquistore 3D—Seismic AVO Inversion and Lithology Prediction Report, PTRC Internal Report from Schlumberger; PTRC: State College, PA, USA, 2018; 34p. [Google Scholar]
  41. White, D.J. Prestack AVO Inversion Footprint Removal. In Aquistore Internal Report; PTRC: State College, PA, USA, 2018; 8p. [Google Scholar]
  42. Marfurt, K.J.; Scheet, R.M.; Sharp, J.A.; Harper, M.G. Suppression of the acquisition footprint for seismic sequence attribute mapping. Geophysics 1998, 63, 1024–1035. [Google Scholar] [CrossRef]
  43. White, D.J. 3D architecture of the Aquistore reservoir: Implications for CO2 flow and storage capacity. Interna-Tional J. Greenh. Gas Control 2018, 71, 74–85. [Google Scholar] [CrossRef]
  44. Batzle, M.; Wang, Z. Seismic properties of pore fluids. Geophysics 1992, 57, 1396–1408. [Google Scholar] [CrossRef]
  45. White, D.J.; Harris, K.; Roach, L.; Robertson, M. 7 years of 4D seismic monitoring at the Aquistore CO2 storage site, Saskatchewan, Canada. In Proceedings of the SEG International Exposition and Annual Meeting, San Antonio, TX, USA, 15–20 September 2019. [Google Scholar] [CrossRef]
  46. Xu, L.; Shokri, A.R.; Chalaturnyk, R. Implications of Structural Flexure on CO2 Plume Distribution and Long-Term Reservoir Deformation in the Canadian Aquistore CCS Project. J. Rock Mech. Geotech. Eng. 2026, in press. [Google Scholar]
  47. Peng, D.Y.; Robinson, D.B. A New Two-Constant Equation of State. Ind. Eng. Chem. Fundam. 1976, 15, 59–64. [Google Scholar] [CrossRef]
  48. Zurita, R.A.A.; McCain, W.D. An efficient tuning strategy to calibrate cubic EOS for compositional simulation. In Proceedings of the SPE Annual Technical Conference and Exhibition, San Antonio, TX, USA, 29 September–2 October 2002. [Google Scholar] [CrossRef]
  49. Paterson, L. Geological storage of CO2: Mechanisms and performance assessment. In Carbon Capture and Storage: Technologies and Global Contributions; Benson, S., Gale, J., Eds.; Elsevier: Amsterdam, The Netherlands, 2017; pp. 145–168. [Google Scholar] [CrossRef]
  50. Harvey, A. Semiempirical Correlation for Henry’s Constants over Large Temperature Ranges. Am. Inst. Chem. Eng. J. 1996, 42, 1491–1494. [Google Scholar] [CrossRef]
  51. Rowe, A.M.; Chou, J.C.S. Pressure–Volume–Temperature-Concentration Relation of Aqueous NaCl Solutions. J. Chem. Eng. Data 1970, 15, 61–66. [Google Scholar] [CrossRef]
  52. Kestin, J.; Khalifa, H.E.; Correia, R.J. Tables of Dynamic and Kinematic Viscosity of Aqueous NaCl Solutions in the Temperature Range 20–150 °C and the Pressure Range 0.1–35 MPa. J. Phys. Chem. Ref. Data 1981, 10, 71–87. [Google Scholar] [CrossRef]
  53. Bachu, S.; Adams, J. Sequestration of CO2 in Geological Media in Response to Climate Change—Capacity of Deep Saline Aquifers to Sequester CO2 in Solution. Energy Convers. Manag. 2003, 44, 3151–3175. [Google Scholar] [CrossRef]
  54. Bachu, S.; Faltinson, J.; Hauck, T.; Perkins, E.; Peterson, J.; Talman, S.; Jensen, G. The Basal Aquifer in the Prairie Region of Canada—Characterization for CO2 Storage. Preliminary Report for Stage I (Phases 1 and 2); Alberta Innovates Technology Futures: Edmonton, AB, Canada, 2011.
  55. Bennion, D.B.; Bachu, S. Supercritical CO2 and H2S Brine Drainage and Imbibition Relative Permeability Relationships for Integral Sandstone and Carbonate Formations. In Proceedings of the Society of Petroleum Engineers Paper SPE 99326, SPE Europec/Eage Annual Conference and Exhibition, Vienna, Austria, 12–15 June 2006. [Google Scholar]
  56. Kurz, M.; Heebink, L.; Smith, S.; Zacher, E. Petrophysical Evaluation of Core from the Aquistore CO2 Injection Site. In Plains CO2 Reduction (PCOR) Partnership Value-Added Report for U.S. Department of Energy National Energy Technology Laboratory Cooperative Agreement No. DE-FC26-05NT42592, EERC Publication 2014-EERC-07-16; Energy & Environmental Research Center: Grand Forks, North Dakota, 2014. [Google Scholar]
  57. Jiang, T.; Pekot, L.J.; Jin, L.; Peck, W.D.; Gorecki, C.D. Geological Modeling and Simulation Report for the Aquistore Project. In The Plains CO2 Reduction (PCOR) Partnership Phase III, Task 1—Deliverable D93, Update 2; National Energy Technology Laboratory: Albany, Oregon, 2016. [Google Scholar]
  58. Roach, L.; White, D.J. Evolution of a deep CO2 plume from time-lapse seismic imaging at the Aquistore storage site, Saskatchewan, Canada. Int. J. Greenh. Gas Control 2018, 74, 79–86. [Google Scholar] [CrossRef]
  59. Ezekiel, J.; Adams, B.M.; Saar, M.O.; Ebigbo, A. Numerical analysis and optimization of the performance of CO2-Plume Geothermal (CPG) production wells and implications for electric power generation. Geothermics 2022, 98, 102270. [Google Scholar] [CrossRef]
  60. Taitel, Y.; Bornea, D.; Dukler, A.E. Modelling flow pattern transitions for steady upward gasliquid flow in vertical tubes. AIChE J. 1980, 26, 345–354. [Google Scholar] [CrossRef]
  61. Pereira, L.M.C.; Chapoy, A.; Burgass, R.; Tohidi, B. Interfacial tension of CO2 + brine systems: Experiments and predictive modelling. Adv. Water Resour. 2017, 103, 64–75. [Google Scholar] [CrossRef]
  62. Bachu, S.; Bennion, D.B. Interfacial Tension between CO2, Freshwater, and Brine in the Range of Pressure from (2 to 27) MPa, Temperature from (20 to 125) °C, and Water Salinity from (0 to 334 000) mg·L−1. J. Chem. Eng. Data 2009, 54, 765–775. [Google Scholar] [CrossRef]
  63. Pruess, K.; Garcia, J.E. Multiphase flow dynamics during CO2 injection into saline aquifers. Environ. Geol. 2002, 42, 282–295. [Google Scholar] [CrossRef]
  64. Khalaf, M.S.; Rezaei, A.; Soliman, M.Y.; Farouq Ali, S.M. Thermo-Poroelastic Analysis of Cold Fluid Injection in Geothermal Reservoirs for Heat Extraction Sustainability. In Proceedings of the 56th U.S. Rock Mechanics/Geomechanics Symposium, Santa Fe, NM, USA, 26 June 2022. [Google Scholar] [CrossRef]
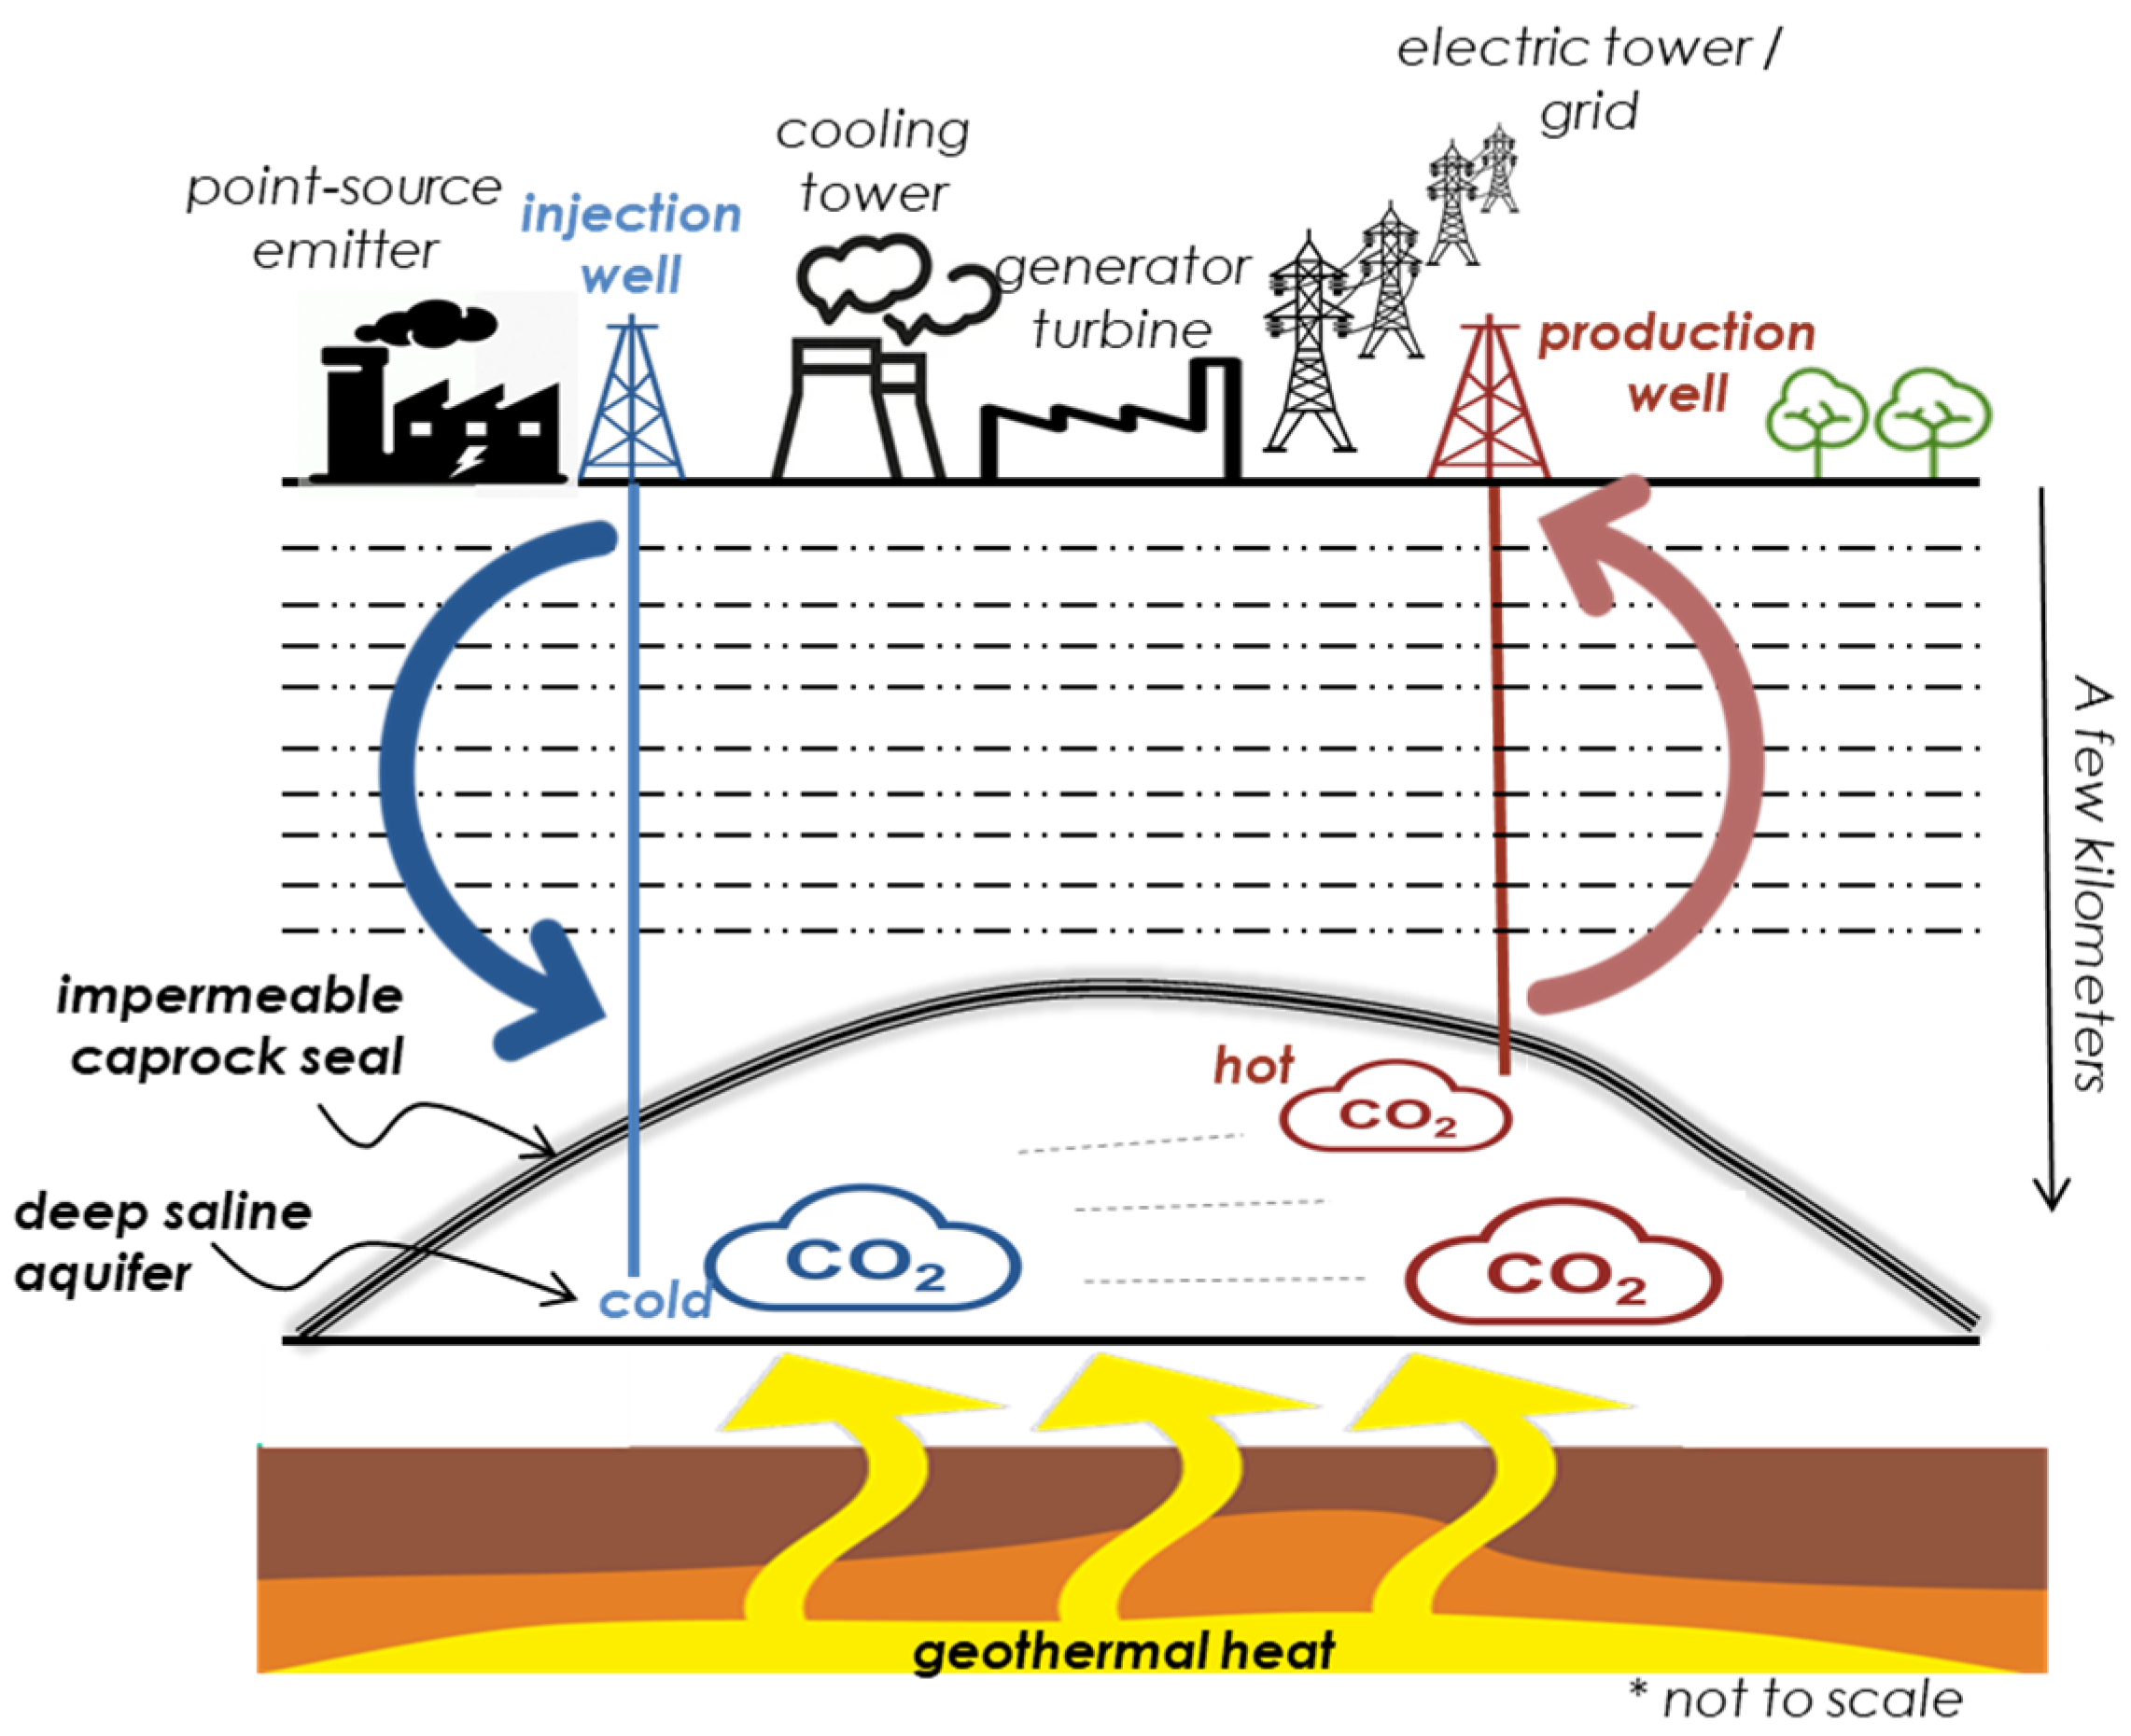
Figure 1. Schematic illustration of the CO2 circulation test as a central process supporting the development of the CCS-enabled geothermal energy system concept. The asterisk (*) denotes that visual elements are not to scale and have been adjusted for clarity and emphasis.
Energies 18 06031 g001
Figure 2. (a) Perspective view of the complete geological model; (b) perspective and (c) top view of an approximately 1.8 km × 1.8 km region surrounding the injection well, illustrating the extent of the CO2 plume; and (d) top view of the high-resolution refined model (cell size: 4 m × 4 m) within the area of interest between the injection and production wells, spaced 151 m apart. Here, INJ denotes the injection well, and OBS denotes the observation well.
Energies 18 06031 g002
Figure 3. Top view of 5 km x 5 km of the Deadwood D formation (a) P-wave acoustic impedance, (b) stochastic distribution of porosity and its relevant (f) permeability, (c) distribution of porosity from EERC’s model and its relevant (g) permeability, (d) distribution of porosity constrained to acoustic impedance and its relevant (h) permeability, and (e) cross-plot of porosity-permeability for different rock type/facies from core data and well logs of Aquistore injection well.
Energies 18 06031 g003
Figure 4. (a) CO2 plume outline interpreted from 4D seismic monitoring surveys, illustrating the influence of flexural structures on plume migration; (b) perspective view and (c) map view of the estimated elevation of the Precambrian basement top, derived from high-resolution seismic data, delineating the flexure geometry.
Energies 18 06031 g004
Figure 5. Relative permeability functions employed in the flow simulations of CO2 circulation within the plume in a deep saline aquifer, representing basal Cambrian sandstone, Wabamun carbonate, and shale formations.
Energies 18 06031 g005
Figure 6. Top-view maps of 4D seismic data at the upper Deadwood zone, showing variations corresponding to cumulative injected CO2 volumes of (a) 36 kilotonnes, (b) 102 kilotonnes, (c) 141 kilotonnes, and (d) 272 kilotonnes within a 500 m radius centered on the injection well. Here, INJ denotes the injection well, and OBS denotes the observation well. Warmer colors indicate the likelihood of CO2 plume presence, based on an arbitrary threshold applied to 4D seismic survey data to delineate the plume outline.
Energies 18 06031 g006
Figure 7. Downhole pressure of the injection well from simulations compared with observed field data for realizations assuming (a) layer-cake stratigraphy, (d) stochastic petrophysical properties, (g) stochastic properties with flexure, and (j) stochastic properties constrained by seismic acoustic impedance. In all cases, cumulative injected CO2 mass matches field observations. CO2 plume outlines from seismic monitoring are compared with simulated top-layer saturation in the Deadwood D formation for (b,e,h,k), with corresponding saturation-thickness maps shown in (c,f,i,l). Here, INJ denotes the injection well, and OBS denotes the observation well. Warmer colors indicate the likelihood of CO2 plume presence.
Energies 18 06031 g007
Figure 8. Downhole pressure at the observation well (151 m from the injector) matched against bubble-tube measurements for (a) layer-cake stratigraphy and (b) stochastic properties constrained by seismic acoustic impedance with flexure. The stochastic realization provides a closer match, demonstrating its value for MMV in verifying CO2 plume migration and improving confidence in model predictions.
Energies 18 06031 g008
Figure 9. (a) Gas-to-water ratios at reservoir conditions for the production well. The layer-cake model yields a more favorable ratio, though all realizations show a characteristic dip followed by increased CO2 recovery as the circulation test progresses. Higher gas-to-water ratios promote annular flow and help mitigate liquid loading in the production well. (b) CO2 mass rates at the injection well (dashed lines) and production well (solid lines) across different model realizations. Injection rates overlap across all cases, reflecting consistent input conditions during the CO2 circulation test, while production rates vary due to geological assumptions in each realization.
Energies 18 06031 g009
Figure 10. Top-view maps of water saturation and CO2 plume in the Deadwood D formation for (a) layer-cake assumption and (b) calibrated flow simulation to seismic survey data with flexure during a CO2 circulation test at 300 rm3/day, both showing potential brine encroachment from the regional aquifer into the production well. (c) A higher injection rate of 900 rm3/day during the CO2 circulation test reduces brine encroachment and enhances CO2 plume expansion, underscoring the importance of operational parameters in CCS-enabled geothermal systems. The white dashed line indicates a structural flexure identified in high-resolution seismic surveys and incorporated into the model as a permeability barrier.
Energies 18 06031 g010
Figure 11. (a) CO2 mass rates at the injection well (dashed lines) and production well (solid lines) for varying injection rates in the CO2 circulation test, (b) Downhole pressure difference between the injection and production wells within the CO2 plume, and the relationship between inter-well CO2 mass rate difference and pressure drop. Results indicate that the pressure drop approaches steady-state conditions across all cases, (c) with simulations showing a near-linear relationship between injector–producer pressure drop and inter--well flow rate difference, supporting stabilized circulation performance. (d) Gas-to-water ratios at reservoir conditions for the production well under varying injection rates in the CO2 circulation test. Higher injection rates yield increased gas-to-water ratios, promoting annular flow and helping to mitigate liquid loading in the production well.
Energies 18 06031 g011
Figure 12. Cumulative injected and produced CO2, total stored CO2, cumulative produced water, and subsurface CO2 retention during the CO2 circulation test under varying injection rates. These metrics serve as key performance indicators, reflecting recovery efficiency, storage potential, and reservoir connectivity, and highlighting trade-offs between CO2 circulation performance and long-term subsurface CO2 retention.
Energies 18 06031 g012
Figure 13. Spider plots illustrating the uncertainty assessment of the CO2 circulation test, showing the low and high values for each sensitive parameter and their relative influence on model outcomes. (a) injected CO2 is most influenced by injector completion, post-workover changes, and injection rate; (b) produced CO2 depends on producer completion, post-workover changes, and BHP; (c) brine production is driven by producer BHP and pressure differentials; (d) CO2 retention is sensitive to injection rate and plume expansion; (e) gas-to-brine ratio reflects both wells’ completion designs; (f) pressure drop is governed by producer BHP.
Energies 18 06031 g013aEnergies 18 06031 g013b
Figure 14. Tornado plots illustrating the uncertainty assessment of the CO2 circulation test, showing the impact of each input parameter on model outcomes. The dotted line in each plot represents the base case scenario. (af) each panel displays the ranked influence of operational parameters on key performance indicators, including CO2 injection and production volumes, brine inflow, subsurface retention, pressure drop across the plume, and cumulative gas-to-brine ratio. The plots emphasize the dominant role of injection rate, completion design, and producer BHP in shaping system behavior.
Energies 18 06031 g014
Figure 15. Flow-regime maps for simulated cases of the CO2 circulation test in the production well, showing the transition from bubble flow to annular flow, including a case representing optimum operational conditions.
Energies 18 06031 g015
Table 1. Summary of experimental variogram computation and variogram model fitting.
Experimental Variogram Computation
DirectionAzimuthDipNumber lagsLag
distance
Search radiusBand widthTolerance angleLag
tolerance
Thickness
VerticalNA90825200504550NA
Major008250200020045500.001
Minor27008250200020045500.001
Variogram Model Fitting
TypeSillMajor rangeMinor rangeVertical rangeNugget
Spherical0.9995005001000.001
Table 2. Summary of flow simulation parameters and base-case assumptions for the CO2 circulation test (adapted from [37]).
CategoryParameterValue/Assumption
ReservoirInitial reservoir pressure (kPa)34,129.05 at 3173 m MD
Pore pressure gradient (kPa/m)10.7
Initial reservoir temperature (°C)112.8 at 3173 m MD
Initial water saturation (fraction)1
Brine salinity (ppm)300,000
Porosity range (fraction)0.002–0.105
Permeability range (mD)0–55
Permeability anisotropy (kv/kh)0.1
Reservoir boundaryAnalytic infinite-acting aquifer
Injection wellMax. downhole injection pressure (MPa)42.5 (95% of fracturing pressure)
CO2 injection rate (rm3/d) *600 (5-yr avg. max. injection rate)
Downhole injection temperature (°C)70 (5-yr avg. injection temperature)
Perforated intervalsAll 4 intervals open
CO2 circulation period (months)9
Production wellMin. downhole production pressure (MPa)33
Max. CO2 production rate (rm3/d) *300 (consistent with 0.11 m ID tubing)
Perforated interval2nd interval only (highest permeability)
Additional assumptionsNo fracturing and no salt precipitation around the production well
* rm3/d: volume (m3) is reported at reservoir conditions.
Table 3. Uncertain parameters and variability ranges considered in the CO2 circulation sensitivity analysis.
Uncertain VariablesBase ValuesVariability Limits
Injection rate at injector (rm3/d) *600100 to 900
Downhole pressure at producer (MPa)3323 to 39 MPa
Production rate at producer (rm3/d) *300100 to 900
Completion configurations—injectorAll 4 perforated intervalsAll 4 vs. 2nd interval only
Completion configuration—producer2nd perforated intervalAll 4 intervals; individual interval only (1st through 4th); single layer of 2nd interval (layers 1 to 6)
Fracturing/salt precipitation at producer (S)0 (=intact)−2 (=fractured); 0 (=intact);
+2 (=slight salt); +10 (=moderate salt)
Localized permeability heterogeneityRealization 08 stochastic realizations
Post-workover injectivity gain1× (=intact formation)10–100× enhanced permeability zone
* rm3/d: volume (m3) is reported at reservoir conditions.
Disclaimer/Publisher’s Note: The statements, opinions and data contained in all publications are solely those of the individual author(s) and contributor(s) and not of MDPI and/or the editor(s). MDPI and/or the editor(s) disclaim responsibility for any injury to people or property resulting from any ideas, methods, instructions or products referred to in the content.