1. Introduction
The decarbonization of the heating sector is a major challenge for achieving the European Union’s 2050 climate targets [
1], which aim at climate neutrality by 2050 and a 55% reduction in greenhouse gas emissions by 2030 compared to 1990 levels [
2]. District Heating (DH) systems are widely recognized as a key technology to support this transition [
3], as they facilitate an efficient supply of thermal energy to multiple urban consumers by integrating renewable and waste heat sources, thereby achieving significant emission reductions compared to conventional heating systems [
4].
Over the past century, DH systems have undergone a deep technological evolution [
5]. The first generation of DH networks, developed in the late 19th century, relied on steam produced by fossil fuel plants and operated at very high temperatures (up to 200 °C [
6]), resulting in substantial heat losses and limited efficiency. The second and third generations introduced pressurized hot water systems operating at progressively lower supply temperatures (over 100 °C in the second generation, lower than 100 °C in the third generation), improving energy efficiency and enabling the use of industrial waste heat and combined heat and power (CHP) plants. Building on these advances, the Fourth Generation District Heating (4GDH) concept was developed by Lund et al. [
7] to further reduce supply temperatures (supply temperature levels around 40–60 °C), integrate renewable and excess heat sources, and increase the flexibility of the system. A Fifth Generation District Heating and Cooling (5GDHC) concept has also emerged, characterized by ultra-low-temperature (below 35 °C) and bidirectional networks operating around ambient conditions [
8,
9].
This evolution of DH networks is closely linked to the broader development of multi-energy systems, where electricity, heating, and cooling sectors are increasingly coupled to improve overall energy efficiency and system flexibility [
10,
11]. In this context, cross-sectoral integration plays a crucial role, enabling the interaction between thermal and electrical systems, e.g., through power-to-heat technologies such as heat pumps [
12,
13]. By converting surplus and otherwise curtailed renewable electricity into useful heat, these technologies contribute to balancing power grids while simultaneously decarbonizing the heating sector, paving the way for a 100% renewable energy system [
3,
14]. In this perspective, energy optimization must shift from single-sector performance to a system-level approach that exploits synergies between energy vectors, with DH networks acting as a key enabler of this integration [
9,
15].
The ongoing reduction in supply and return temperatures in DH networks further facilitates this integration [
16,
17]. Operating at lower temperature levels brings several benefits throughout the system. At the supply level, it improves the efficiency of production units such as CHP plants and heat pumps and enables the use of low-grade renewable and waste heat sources, such as industrial processes, waste-to-energy plants, data centers, supermarkets, geothermal sources, and solar thermal systems [
5,
18,
19,
20,
21]. At the distribution level, it reduces thermal losses and mechanical stress in pipelines and allows the adoption of alternative materials such as plastic pipes [
22,
23]. Overall, the progressive temperature reduction enhances both the efficiency and sustainability of DH systems, expanding the range of technologies and heat sources that can be effectively integrated [
19,
20,
21].
This technological evolution is associated with the transition from a centralized heat production system, traditionally based on a few large fossil fuel plants, to a more distributed configuration [
24,
25], which is required to integrate renewable and excess heat sources where available. In this context, end users themselves can take an active role in the supply of the heating network, becoming thermal prosumers, i.e., users capable not only of consuming heat but also of producing heat and sharing it with the DH network [
26,
27], strengthening the transition to distributed and renewable-based DH systems. This role becomes particularly relevant as traditional sources such as CHP heat are expected to decline with the decarbonization of power systems, and as recent European directives on efficient district heating require a growing share of renewable and recovered heat in the energy mix [
28].
Different studies in the literature have addressed the potential of integrating thermal prosumers in DH networks [
29]. Dattilo et al. [
30] analyzed different configurations for prosumer connection and energy-sharing strategies in smart district heating systems. Dino et al. [
31] presented a dynamic model of a bidirectional substation for a DH network, including a solar-thermal prosumer case study. Similarly, Frison et al. [
32] focused on the development of a predictive controller for bidirectional substations. Further experimental and numerical studies, such as those by Testasecca et al. [
27] and Sdringola et al. [
33], have demonstrated the feasibility of integrating thermal prosumers in heating networks in order to exploit surplus heat into the grid under favorable operating conditions. More recent works by Gianaroli et al. [
34] confirmed that such configurations can significantly improve network-level self-sufficiency and contribute to the overall decarbonization of the heating sector.
Based on the literature reviewed, it emerges that while several studies have analyzed the concept of thermal prosumers and bidirectional substations, fewer works have focused on the analysis of the thermo-fluid dynamic behavior of the heating networks. The present work aims to address this gap by developing a thermo-fluid dynamic model specifically adapted for district heating networks that include thermal prosumers. In the proposed model, the prosumer node can act alternately as a producer or consumer, depending on the operating conditions. The model allows evaluating the hydraulic and thermal behavior of the network, verifying the suitability of flow rates, pressure drops, and temperature profiles under different operating scenarios.
In parallel, a set of Key Performance Indicators (KPIs) is adopted to enable a consistent comparison among different configurations in terms of energy self-consumption, grid interaction, and self-sufficiency. Finally, the methodology is applied to a real district heating network in Italy, focusing on the integration of a thermal prosumer during the summer season, when the load is dominated by domestic hot water demand.
2. Methodology
This section presents the methodology adopted to evaluate the integration of a thermal prosumer into a DH network. The analysis is structured into three main parts:
- (i)
the definition of the investigated configurations, representing different strategies for the interaction between the prosumer and the network;
- (ii)
the development of a thermo-fluid dynamic simulation model of the DH network, used to evaluate the hydraulic and thermal behavior under prosumer operation; and
- (iii)
the identification of a set of Key Performance Indicators (KPIs) to quantify and compare the seasonal performance of the different configurations.
2.1. Investigated Configurations
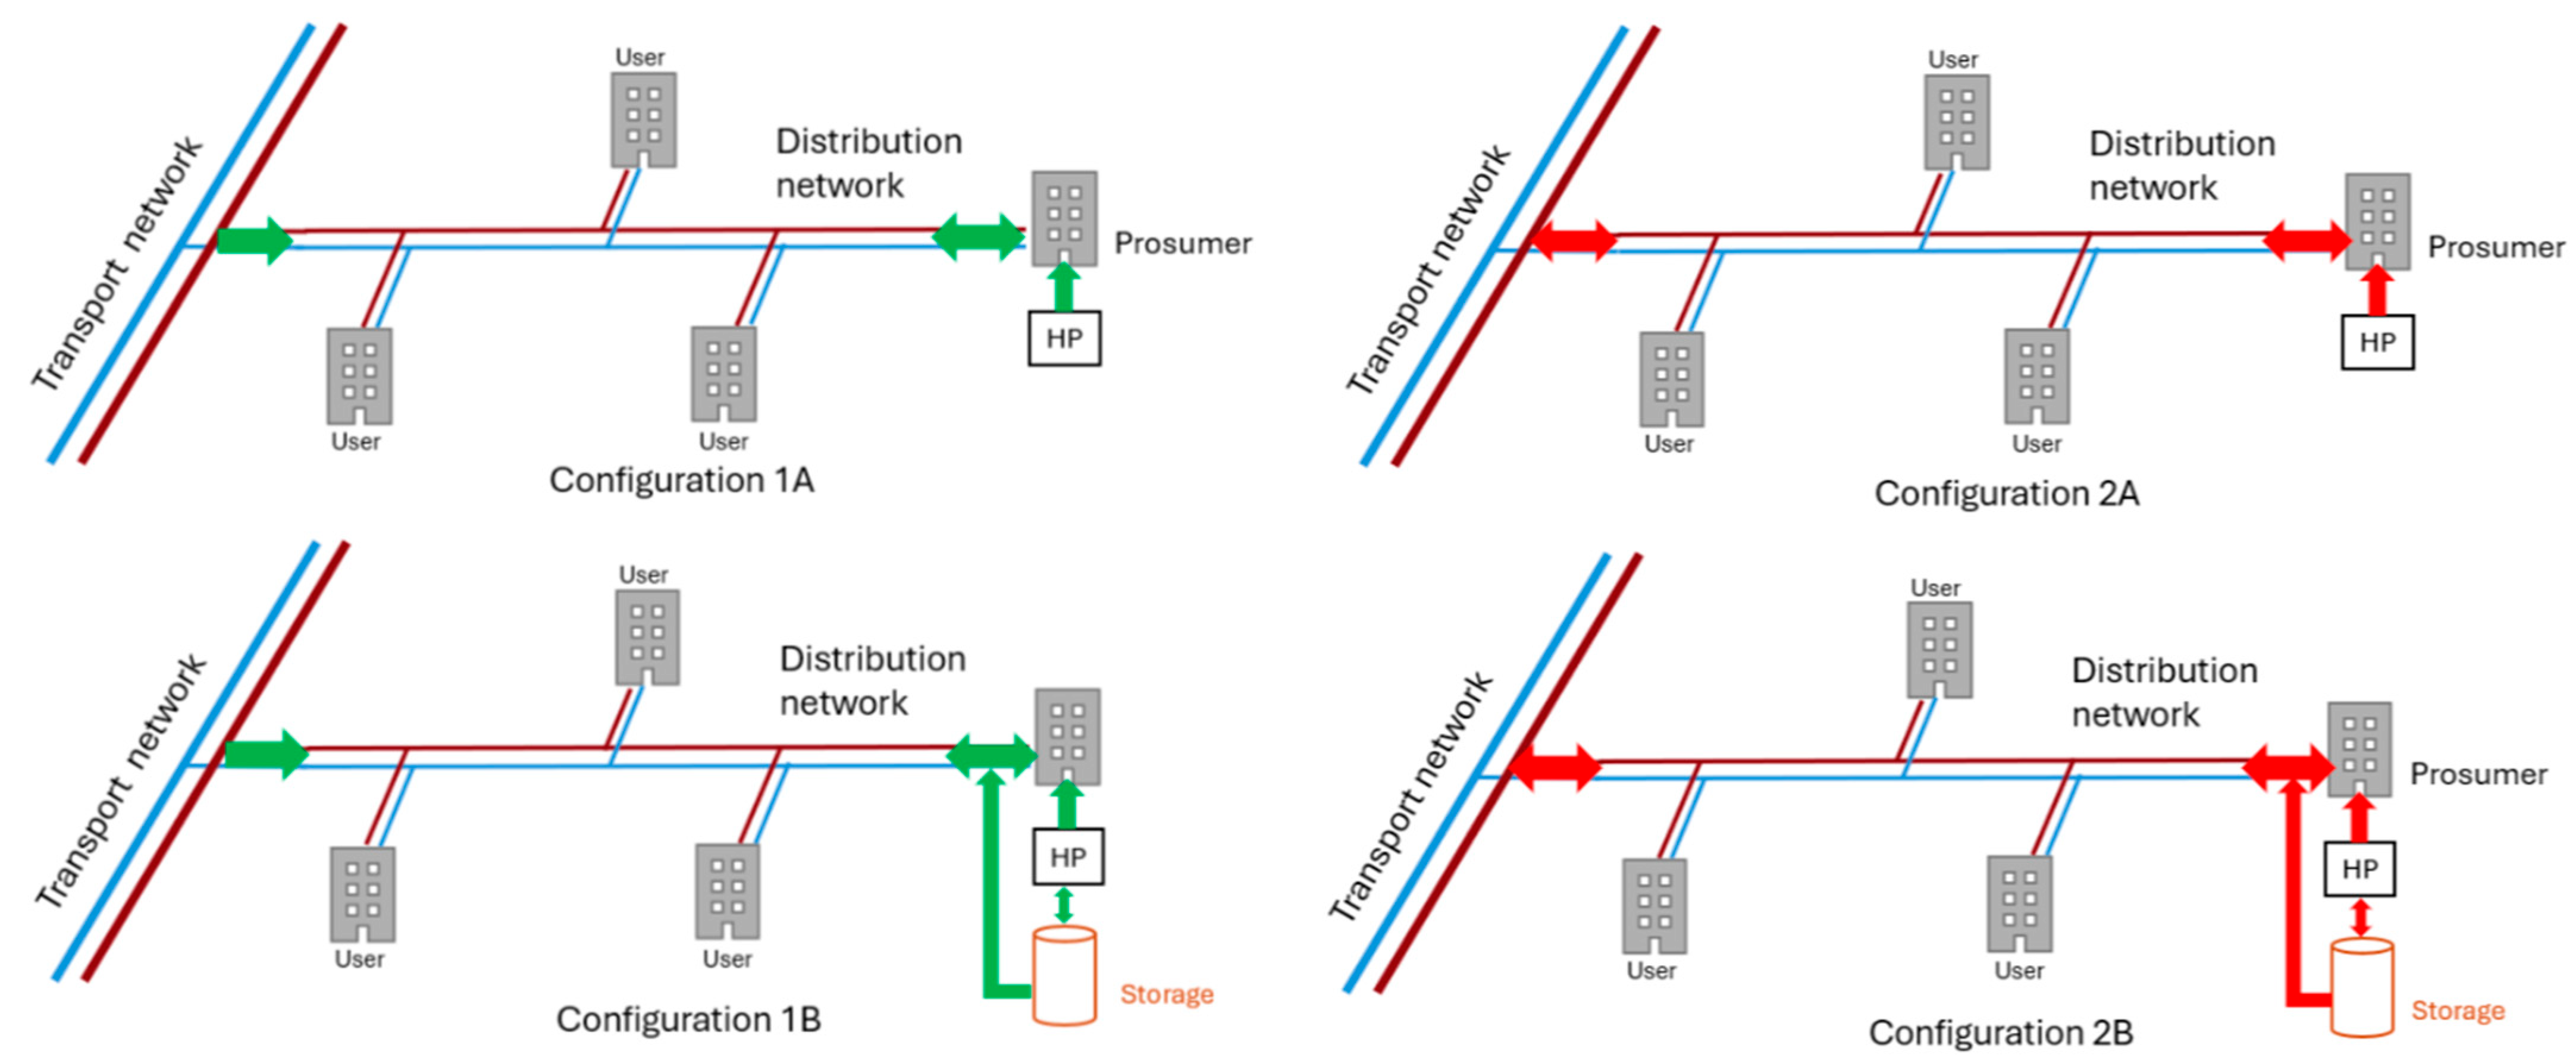
This study considers the integration of a thermal prosumer located at the user level. The prosumer is implemented through a heat pump installation, which can operate either as a consumer, extracting heat from the network, or as a producer, injecting heat into it, depending on the operating conditions. Although the analysis refers to a heat pump as the reference technology, the proposed approach can be extended to other distributed generation systems, such as solar thermal or waste-heat recovery units. This analysis does not delve into the configuration of the bidirectional substation or its operating modes. The focus is on the sizing of the heat pump and its operation and interaction with the grid: it is used both for self-consumption by the user and for the injection of the surplus energy into the grid, which occurs on the supply line (return-to-supply configuration [
30]).
The proposed methodology is tailored for application from small to large-scale DH networks. In large DH systems, the network structure can typically be divided into two hierarchical levels: a main transport network and several distribution networks. The transport network represents the main backbone of the system, connecting central production plants to different areas of the city, while the distribution networks supply heat to the final users within each area.
Two different operating configurations are considered, representing alternative strategies for the interaction between the prosumer and the DH network:
Configuration 1—Local distribution sharing: the prosumer supplies heat for self-consumption and shares the excess production with other users connected to the same distribution network.
Configuration 2—Injection into the transport network via the distribution system: in addition to local sharing, the prosumer can export surplus thermal energy to the transport network, contributing to the supply of nearby distribution areas.
For both configurations, two subcases are analyzed:
Sub-Configuration A—Without local thermal storage: the heat pump directly interacts with the network.
Sub-Configuration B—With storage: a small thermal tank is integrated at the prosumer level to partially decouple production and demand.
Furthermore, the analysis is carried out parametrically, considering different heat pump sizes for each configuration. This approach allows assessing the influence of the installed capacity on both the local energy balance and the overall network performance.
These configurations are representative of the potential operating modes in medium-to-large DH systems featuring a hierarchical structure. In smaller or more compact networks, where a distinction between transport and distribution levels does not exist, only local configurations similar to Configuration A may be applicable.
The four analyzed configurations, including the cases with and without local thermal storage, are schematically illustrated in
Figure 1. Further details on the specific assumptions and operating logic adopted for each configuration are provided in the following sections.
2.1.1. Configuration 1
The first configuration simulates the behavior of a modulated heat pump, possibly combined with a storage system (Sub-Configuration B). To avoid the heat pump operating at too low loads, a minimum operating power corresponding to 25% of the nominal power is assumed. The operating logic is as follows:
Total demand below minimum power: the heat pump operates at 25% of its nominal power. The surplus of energy, not used for either self-consumption or injection in the distribution network, is stored in the storage tank.
Total demand between minimum and nominal power: the heat pump modulates production based on total demand. In this case, all the energy produced is used for self-consumption or injection into the distribution network, without any surplus to store.
Total demand exceeds nominal power: the heat pump operates at maximum power. The uncovered portion of the demand is supplemented by the distribution network.
Modulation allows the heat pump to be used in accordance with load conditions and limits surpluses. Self-consumption by the user prevails, and as for feed-in to the grid, it does not inject into the transport network but remains limited to the distribution.
2.1.2. Configuration 2
In the second configuration, the heat pump is assumed to operate at its nominal power. The heat generated by the heat pump is used both for self-consumption and for network injection, initially considering only the injection into the distribution network. The extra amount of heat produced could be used to supply other distribution networks. The analysis was carried out by imposing increasing sizes of the prosumer to identify the maximum amount of unused energy within the distribution network and consequently determine the share of energy that can be available to power other sub-networks.
Configuration B considers the idea of setting a predefined volume storage system and evaluating the prosumer’s operation under these conditions. With this configuration, the shares of self-consumed energy and the amount injected into the distribution network increase: the surplus energy, accumulated in the storage system until it is saturated, is used when demand exceeds production. Part of the stored energy is used to cover the user’s needs; the remainder is to meet the demands of other users in the distribution network. The heat pump still operates at its nominal power, production remains unchanged, and the amount of energy not stored is fed into the distribution network, with the possibility that a portion also flows to the transport network.
2.2. Performance Evaluation
In this study different configurations of integration of thermal prosumers in the summer season in a distribution network have been defined. For each scenario, different KPIs have been defined in order to effectively evaluate the impact on the network and have an immediate comparison between the scenarios.
- 1.
Energy Self-Consumption (): It is defined as the percentage of produced energy locally consumed, considering only instantaneous self-consumption. It is calculated with Equation (1):
- 2.
User Export Fraction (): The percentage of energy produced by the prosumer injected into the distribution network. It can be calculated as in Equation (2):
- 3.
Network Export Fraction (): When the injection into the transport network is considered, the export index related to the network can be defined as the percentage of the produced energy injected into the transport network. It is defined in Equation (3):
- 4.
Storage Fraction (): The fraction of energy produced that is fed into the storage tank. It can be calculated using Equation (4):
The sum of the four contributions—self-consumption, export (user and network shares), and storage—is equal to the total energy produced by the heat pump. Expressed in fractional terms, the four contributions added up to 1 (100%).
- 5.
User Self-Sufficiency (): Percentage of demand satisfied without network contribution. In other words, it permits assessing the degree to which distributed generation can independently cover local needs. The indicator is calculated for the single user to measure the degree of local self-sufficiency with Equation (5):
- 6.
Distribution Network Self-Sufficiency (): the same indicator could be calculated at the distribution network level to estimate its capacity to become autonomous with respect to the transport network. Network self-sufficiency is calculated with Equation (6):
2.3. Thermo-Fluid Dynamic Model
The introduction of a thermal prosumer within a district heating (DH) network can substantially alter the thermo-fluid dynamic behavior of the system. When a user is able not only to withdraw but also to inject heat into the network, the mass-flow distribution across the branches changes, and flow reversals may occur in some sections. These effects modify the pressure drops and temperature profiles in the pipes, influencing the overall hydraulic balance and the operating conditions of both producers and consumers.
For these reasons, it is essential to develop a thermo-fluid dynamic model capable of reproducing the hydraulic and thermal behavior of the network under the new boundary conditions introduced by the prosumer. The model must ensure that the network can sustain the resulting variations in flow rate and direction without exceeding design limits, such as maximum allowable velocities, and that the thermal supply to all users remains within acceptable temperature ranges.
In this work, the model is used to simulate the modified operation of the distribution network, enabling a detailed evaluation of how the integration of the prosumer affects the flow regime and the temperature distribution in the main nodes.
The thermo-fluid dynamic model implemented in this study is derived from the formulation by Capone et al. [
35]. The model is appropriately adapted to facilitate the inclusion of the thermal prosumer, allowing the alternation of the prosumer node between heat injection and withdrawal modes.
The model is based on a one-dimensional representation of the network pipes, where the interconnections between the various pipes are described using graph theory. A graph is the representation of a set of connected objects: the objects are the nodes, and the connections are the branches. In the specific case of a DH network, the nodes correspond to the network junctions, while the branches correspond to the pipe sections. The connections between nodes and branches, which constitute the network topology, are represented by the incidence matrix
A. This is composed of as many rows as there are nodes,
NN, and as many columns as there are branches,
NB. Given an arbitrary orientation for each branch (from the “input” node to the “output” node), the elements
(where
n indicates a generic row, corresponding to a generic node, and
m a generic column, corresponding to a generic branch) are defined as:
This convention makes the incidence matrix
A a compact description of the network topology. Using the incidence matrix, the one-dimensional formulation of the conservation equations of mass, momentum, and energy can be rewritten in matrix form, using the finite volume method for spatial discretization [
36]. Further details on the matrix formulation of the fluid-dynamic and thermal problems are provided in
Section 2.3.1 and
Section 2.3.2.
The implemented model follows a pseudo-dynamic approach, in which the fluid-dynamic problem is solved under steady-state conditions, while the thermal problem is treated as transient. This assumption is justified by the fact that hydraulic transients in DH networks occur on a much shorter timescale than thermal perturbations. Consequently, the mass-flow distribution is recalculated at each time step based on the current operating conditions through a steady-state calculation, whereas the temporal evolution of the nodal temperatures is computed by solving the transient energy balance equations.
2.3.1. Fluid Dynamic Problem
The matrix representation of the fluid-dynamic problem is reported in Equation (7), consisting of two main sets of equations: the first describing mass conservation and the second describing momentum conservation.
In which
G is a vector of dimensions containing the mass-flow rate flowing in all the branches of the network;
P is a vector containing the pressures in all the nodes;
The matrix ( expresses the fluid-dynamic resistance matrix of the different pipes of the network and is a function of the mass flow rate itself, making the momentum equations nonlinear;
The vector ( accounts for the presence of possible repumping stations along the network;
The boundary conditions are defined by the vector of dimension NN × 1, which contains the mass-flow rates injected into () and extracted from () the network nodes from external sources or sinks.
The model is applied simultaneously to the supply and return lines of the network, where the same boundary conditions are imposed with opposite signs: in the supply line, mass extraction occurs at user nodes and injection at producer nodes, while in the return line the opposite applies. The values of the vector depend on the instantaneous thermal demand of the users, which determines the mass flow rates extracted from the network. In the specific case of networks including thermal prosumers, this term must be updated dynamically, since prosumers can act either as consumers or producers depending on the operating conditions. As a result, the sign and magnitude of the corresponding entries in vary over time, reflecting the alternating heat withdrawal or injection at the prosumer node.
In the considered configurations, the definition of also depends on the role of the main producer node, i.e., the interface node between the transport and distribution networks. In Configuration 1, this node is always treated as the main producer of the distribution network, together with the thermal prosumer, which can alternately operate as a user or producer depending on the time step and operating conditions. In Configuration 2, the interaction with the transport network is more dynamic: depending on the instantaneous balance between local demand and production, the interface node may act either as a producer, importing heat from the transport network to supply the distribution area, or as a consumer, exporting surplus heat to the transport network when the distributed generation exceeds the local demand.
Once the boundary conditions are defined, the fluid-dynamic problem can be solved directly for tree-shaped networks, where mass-flow rates and pressures are independent and the hydraulic solution can be obtained in a sequential manner. Instead, in the case of looped networks, the pressure and velocity fields are interdependent, and an iterative algorithm is required to achieve convergence of the mass and momentum equations. An interesting possibility suitable for large-scale networks is the SIMPLE algorithm [
37] as proposed by the work developed by Guelpa et al. [
38].
The results of the hydraulic solution, namely the mass-flow rates and flow directions in all branches, are then used as input for the thermal problem, which determines the temperature evolution in the network.
2.3.2. Thermal Problem
The thermal problem is formulated through the energy conservation equation, which describes the temperature evolution at each node of the network as a function of the inlet and outlet mass-flow rates and of the thermal losses along the pipes. In contrast to the steady-state formulation of the fluid-dynamic problem, the thermal analysis is carried out in transient conditions, allowing the evaluation of the time-dependent temperature distribution throughout the network. The spatial discretization of the energy equation is performed using a first-order upwind scheme, which ensures numerical stability when solving the convective term associated with the fluid flow. The Backward Euler method [
39] is adopted for time integration. At each time step
, the discretized form of the energy conservation equations for all network nodes can be expressed in the matrix formulation shown in Equation (8).
In which
K is the stiffness matrix (dimension ), evaluated taking into account the flow direction and the topology of the network. For each node n, the matrix has non-zero terms in the following position:
- -
in all columns corresponding to the nodes upstream of the node under consideration, the value of the stiffness matrix is equal to the product of the specific heat and the flow rate entering the connecting branch .
- -
in the columns corresponding to the control volume, the outgoing flow rate and all losses are considered as .
M is the mass matrix (dimension ), which is a diagonal matrix whose terms are equal to .
f is a column vector () representing the known term that accounts for the thermal losses: .
Proper boundary conditions must be specified, which involve the modification of the terms
and
in the corresponding control volumes. Dirichlet boundary conditions are imposed on the injection nodes [
40]. In the supply network, the injection node corresponds, in the case of a distribution network, to the interface node between the transport and distribution networks. In the return network, the temperature is imposed at the user nodes and depends on the difference between the supply temperature and the temperature drop associated with the heat exchange. In the case of prosumer integration, these boundary conditions must be updated dynamically according to the operating state of the prosumer. When the prosumer acts as a producer, a Dirichlet boundary condition is imposed on the supply line at the corresponding node, setting the temperature to the value of the prosumer’s supply. Conversely, when the prosumer operates as a consumer, the same node behaves as an extraction point in the supply network and as an injection point in the return network.
Once the system of equations has been assembled and the boundary conditions imposed, the thermal problem can be solved at each time step to obtain the nodal temperature field throughout the network.
Since the prosumer’s supply temperature can differ from that of the main network, the supply temperature experienced by downstream users may vary. The extent of this effect depends on the prosumer’s location within the network and on the resulting hydraulic flow pattern. If the prosumer is located close to the interface with the transport network, its influence extends to all users within the distribution network; if it is installed at the end of a branch (as shown in
Figure 1), only a subset of users is affected by the reduced supply temperature.
In this work, the impact of this temperature variation is first assessed through the fluid-dynamic simulation, which identifies the users influenced by the prosumer and the corresponding flow redistribution. Then, the required mass-flow rate of each affected user is recalculated to maintain the same thermal load under the reduced supply temperature (assuming constant return temperature), and the network model is re-solved with the updated boundary conditions. This results in an iterative procedure that can be summarized in the following steps:
- (i)
The initial boundary conditions for mass-flow rates are defined based on measured data, while the boundary conditions at the prosumer node are determined by its nominal size and by the amount of excess heat injected into the network after satisfying its own demand.
- (ii)
Based on these conditions, the hydraulic problem is solved to compute the flow distribution and to estimate the portion of the prosumer flow reaching the nearby users.
- (iii)
A subsequent thermal simulation provides the temperature field throughout the network, showing that the users located near the prosumer receive water at a lower temperature than in the base case.
- (iv)
To maintain the same thermal power, the mass-flow rates at the affected user nodes are increased, assuming a constant return temperature as in the base-case scenario.
- (v)
The updated flow rates modify the hydraulic and thermal conditions of the network, requiring a recalculation of the fluid-dynamic problem. The sequence (ii)–(v) is thus repeated until convergence of both mass-flow rates and temperature profiles is achieved. This approach ensures a consistent solution and accurately reproduces the coupled thermo-hydraulic effects induced by the integration of the prosumer.
The heat pump integrated at the prosumer node is modeled in a simplified way, assuming a constant Coefficient of Performance (COP) and a fixed supply temperature of 70 °C when operating in production mode. In this case, water is withdrawn from the network return line, heated by the heat pump, and injected into the supply line. When the prosumer operates as a consumer, the heat pump supplies heat only to the local building system, while the residual thermal demand is covered by the district heating network. In real operating conditions, the variability of COP could slightly affect the energy performance indicators, as a higher seasonal COP would increase thermal production or reduce electricity consumption, thus enhancing local self-consumption in the distribution network. By choosing a conservative value for the COP, the assumption of a constant coefficient can be regarded as conservative, providing a lower-bound estimation of energy performance. From a thermo-fluid dynamic point of view, the assumption of a constant COP still provides a reliable estimation of the variation in network operating conditions, providing an adequate representation of how the integration of a prosumer affects flow distribution and temperature profiles. Nevertheless, although a simplified representation is adopted in the present work, the proposed modeling framework is fully compatible with more detailed heat pump models, which could be integrated in future developments of the work.
3. Case Study
This study aims to evaluate the change in operating conditions when a thermal prosumer is introduced into a DH distribution network, evaluating the possible benefits of this integration. The case study refers to a real large-scale DH network located in Italy, supplying space heating and domestic hot water to over 6500 buildings. The network consists of a main transport network, which connects several thermal plants to different areas of the city, and over 200 distribution networks that link the transport system to the users in each neighborhood. Most of the users connected to the network are supplied for space heating (SH) purposes only, while a smaller share also requires domestic hot water (DHW) throughout the year. The DH system operates with different supply temperature levels depending on the season: around 120 °C during winter to cover both space heating and domestic hot water (DHW) demand, and approximately 90 °C during summer, when only DHW is supplied. The introduction of a prosumer operating at a lower supply temperature of 70 °C may therefore significantly alter the thermal and hydraulic behavior of the network.
The present analysis focuses on the summer period, during which the DH network operates exclusively to satisfy the DHW demand. This operating condition is particularly relevant for the integration of thermal prosumers, as it represents a period of low system load in which the contribution of distributed renewable generation can significantly reduce the operation of conventional thermal plants, moving towards a fully renewable network configuration.
The analysis is carried out on one of the distribution networks characterized by a high number of users with DHW demand. In this area, the installation of a thermal prosumer is investigated to assess its impact on the local energy balance and on the operating conditions of the distribution network during summer operation.
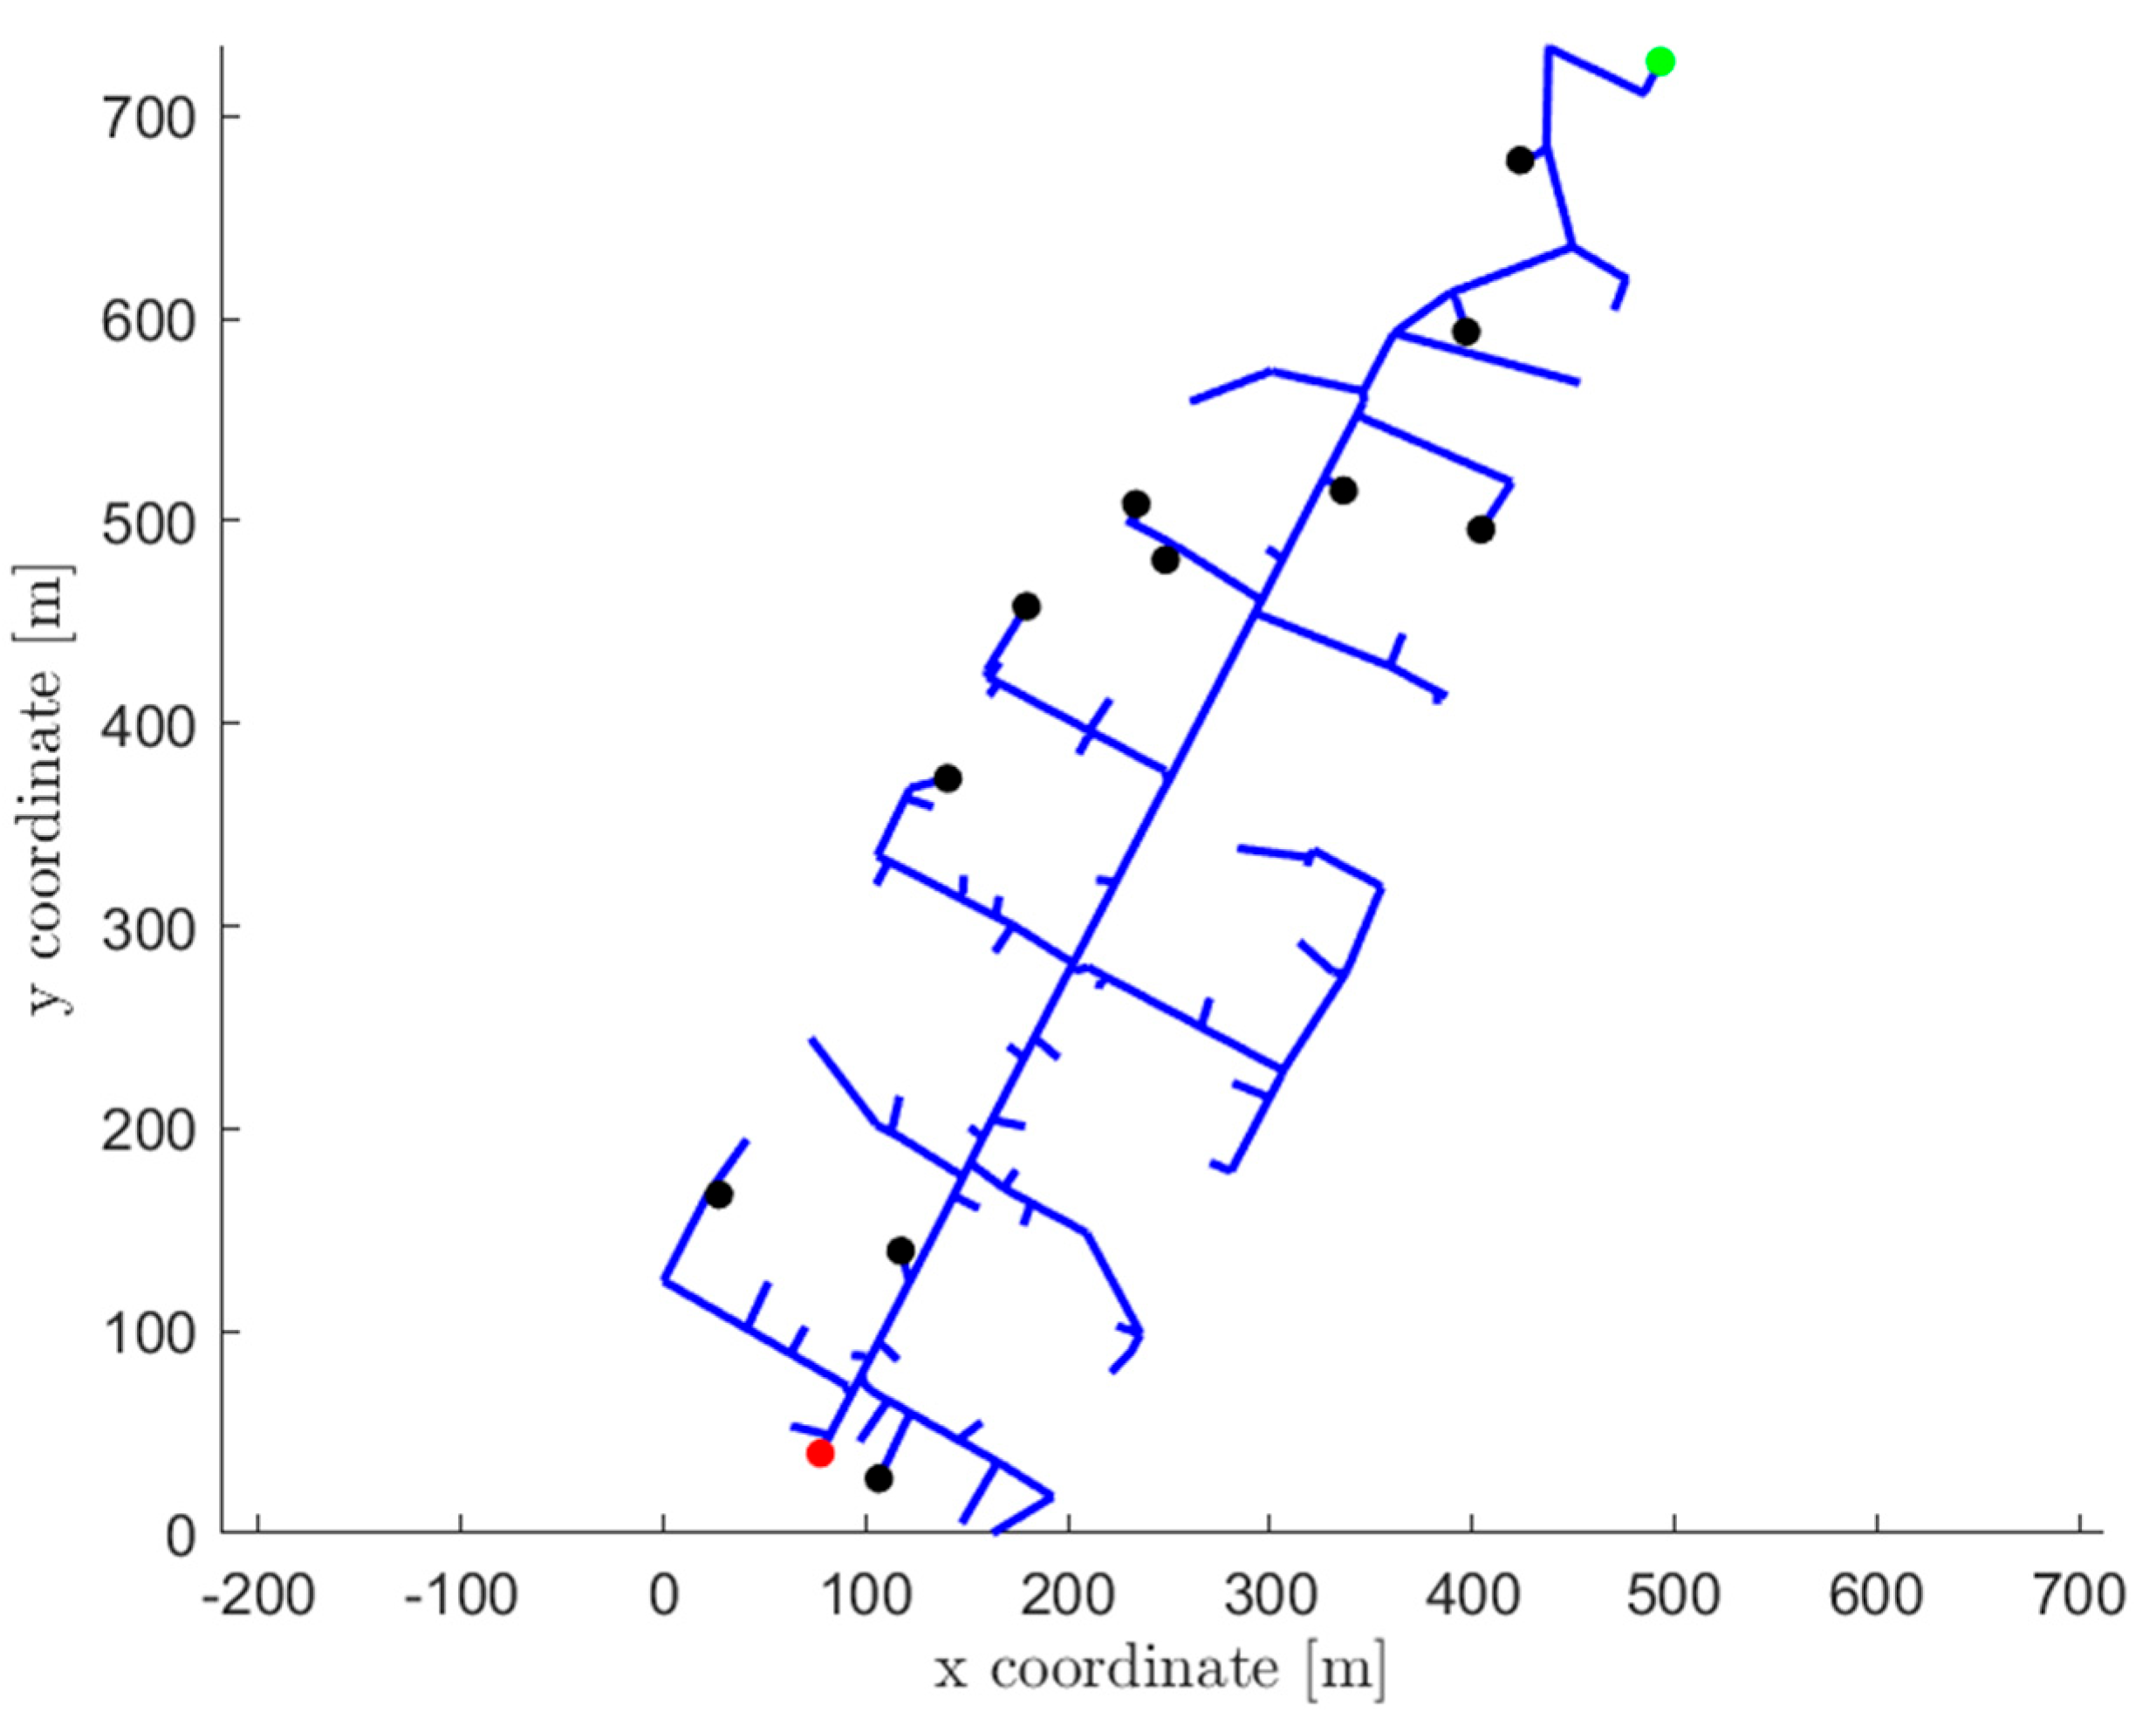
The topology of the selected distribution network is shown in
Figure 2. The users with DHW demand are shown in the figure with black dots and correspond almost to the 20% of the total users served by the barycenter (12 out of 68). The red dot indicates the interface node with the transport network.
Among the users, one of them, highlighted in green in
Figure 2, corresponds to a non-residential building particularly suitable for the installation of a thermal prosumer and characterized by a high and continuous demand for DHW. For these reasons, the installation of a thermal prosumer was hypothesized for this specific location. In addition, its position at the terminal point of the distribution branch, downstream of which no other users are supplied, facilitates the analysis of the thermo-hydraulic effects of prosumer integration on the local network.
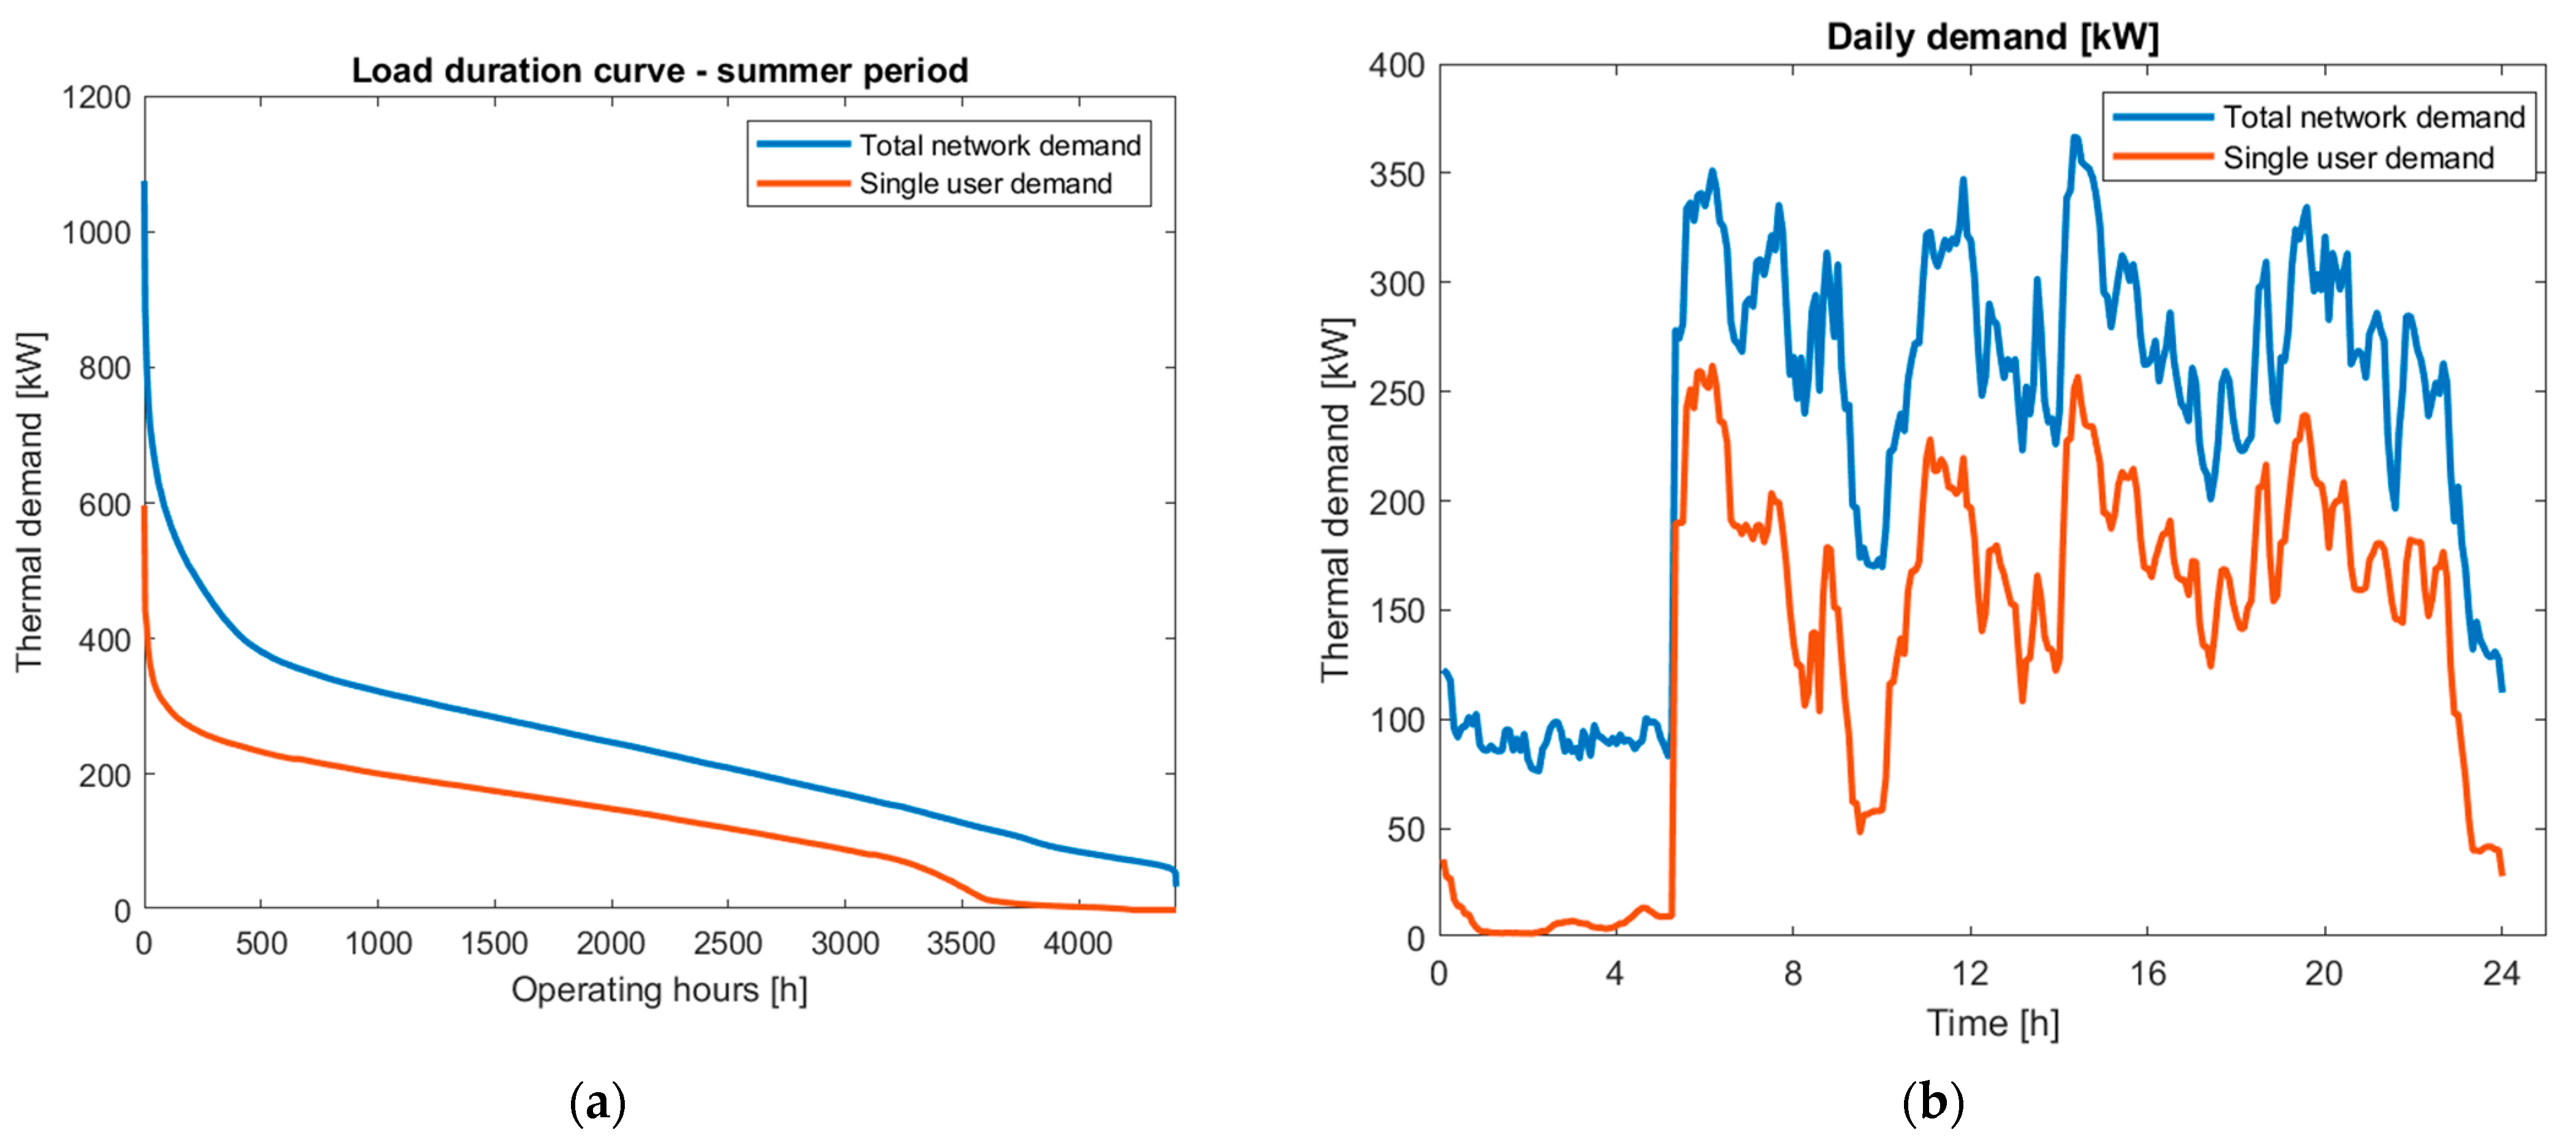
In
Figure 3a the load duration curve is shown: each value on the curve represents the amount of time the heat demand is larger than or equal to a specific value. From the load duration curve during the summer period, it can be seen that the total energy demand of the considered building represents 54% of the total energy required by the distribution network. In
Figure 3b, the thermal demand during a typical summer day is illustrated: the energy required by the network users in a day is equal to
. The user in which the prosumer is installed has a total daily demand equal to
, which is equivalent to more than 50% of the total network demand. For these reasons, this distribution network is strongly influenced by the behavior of this user, which alone has a higher demand than all the other 11 users.
The integration of the prosumer into this distribution network is analyzed through the two operating configurations described in
Section 2.1. For both configurations, two cases are considered: one without and one with a thermal storage system. In the latter, a storage tank of 5 m
3 is assumed, in accordance with the space constraints available at the user site. A parametric analysis is also carried out by considering heat pumps with thermal output capacities of 150, 200, 250, and 300 kW for each configuration in order to assess the influence of the prosumer size on the network performance.
4. Results and Discussion
In this section, the main results of the study are shown and discussed. In
Section 4.1 the main Key Performance Indicators (KPIs) for the four investigated scenarios are presented. The results are compared to assess the impact of each configuration on the overall energy performance of the network. Subsequently, a network simulation is performed with one of the previous scenarios. The main results are shown in
Section 4.2.
4.1. Discussion on Investigated Configurations
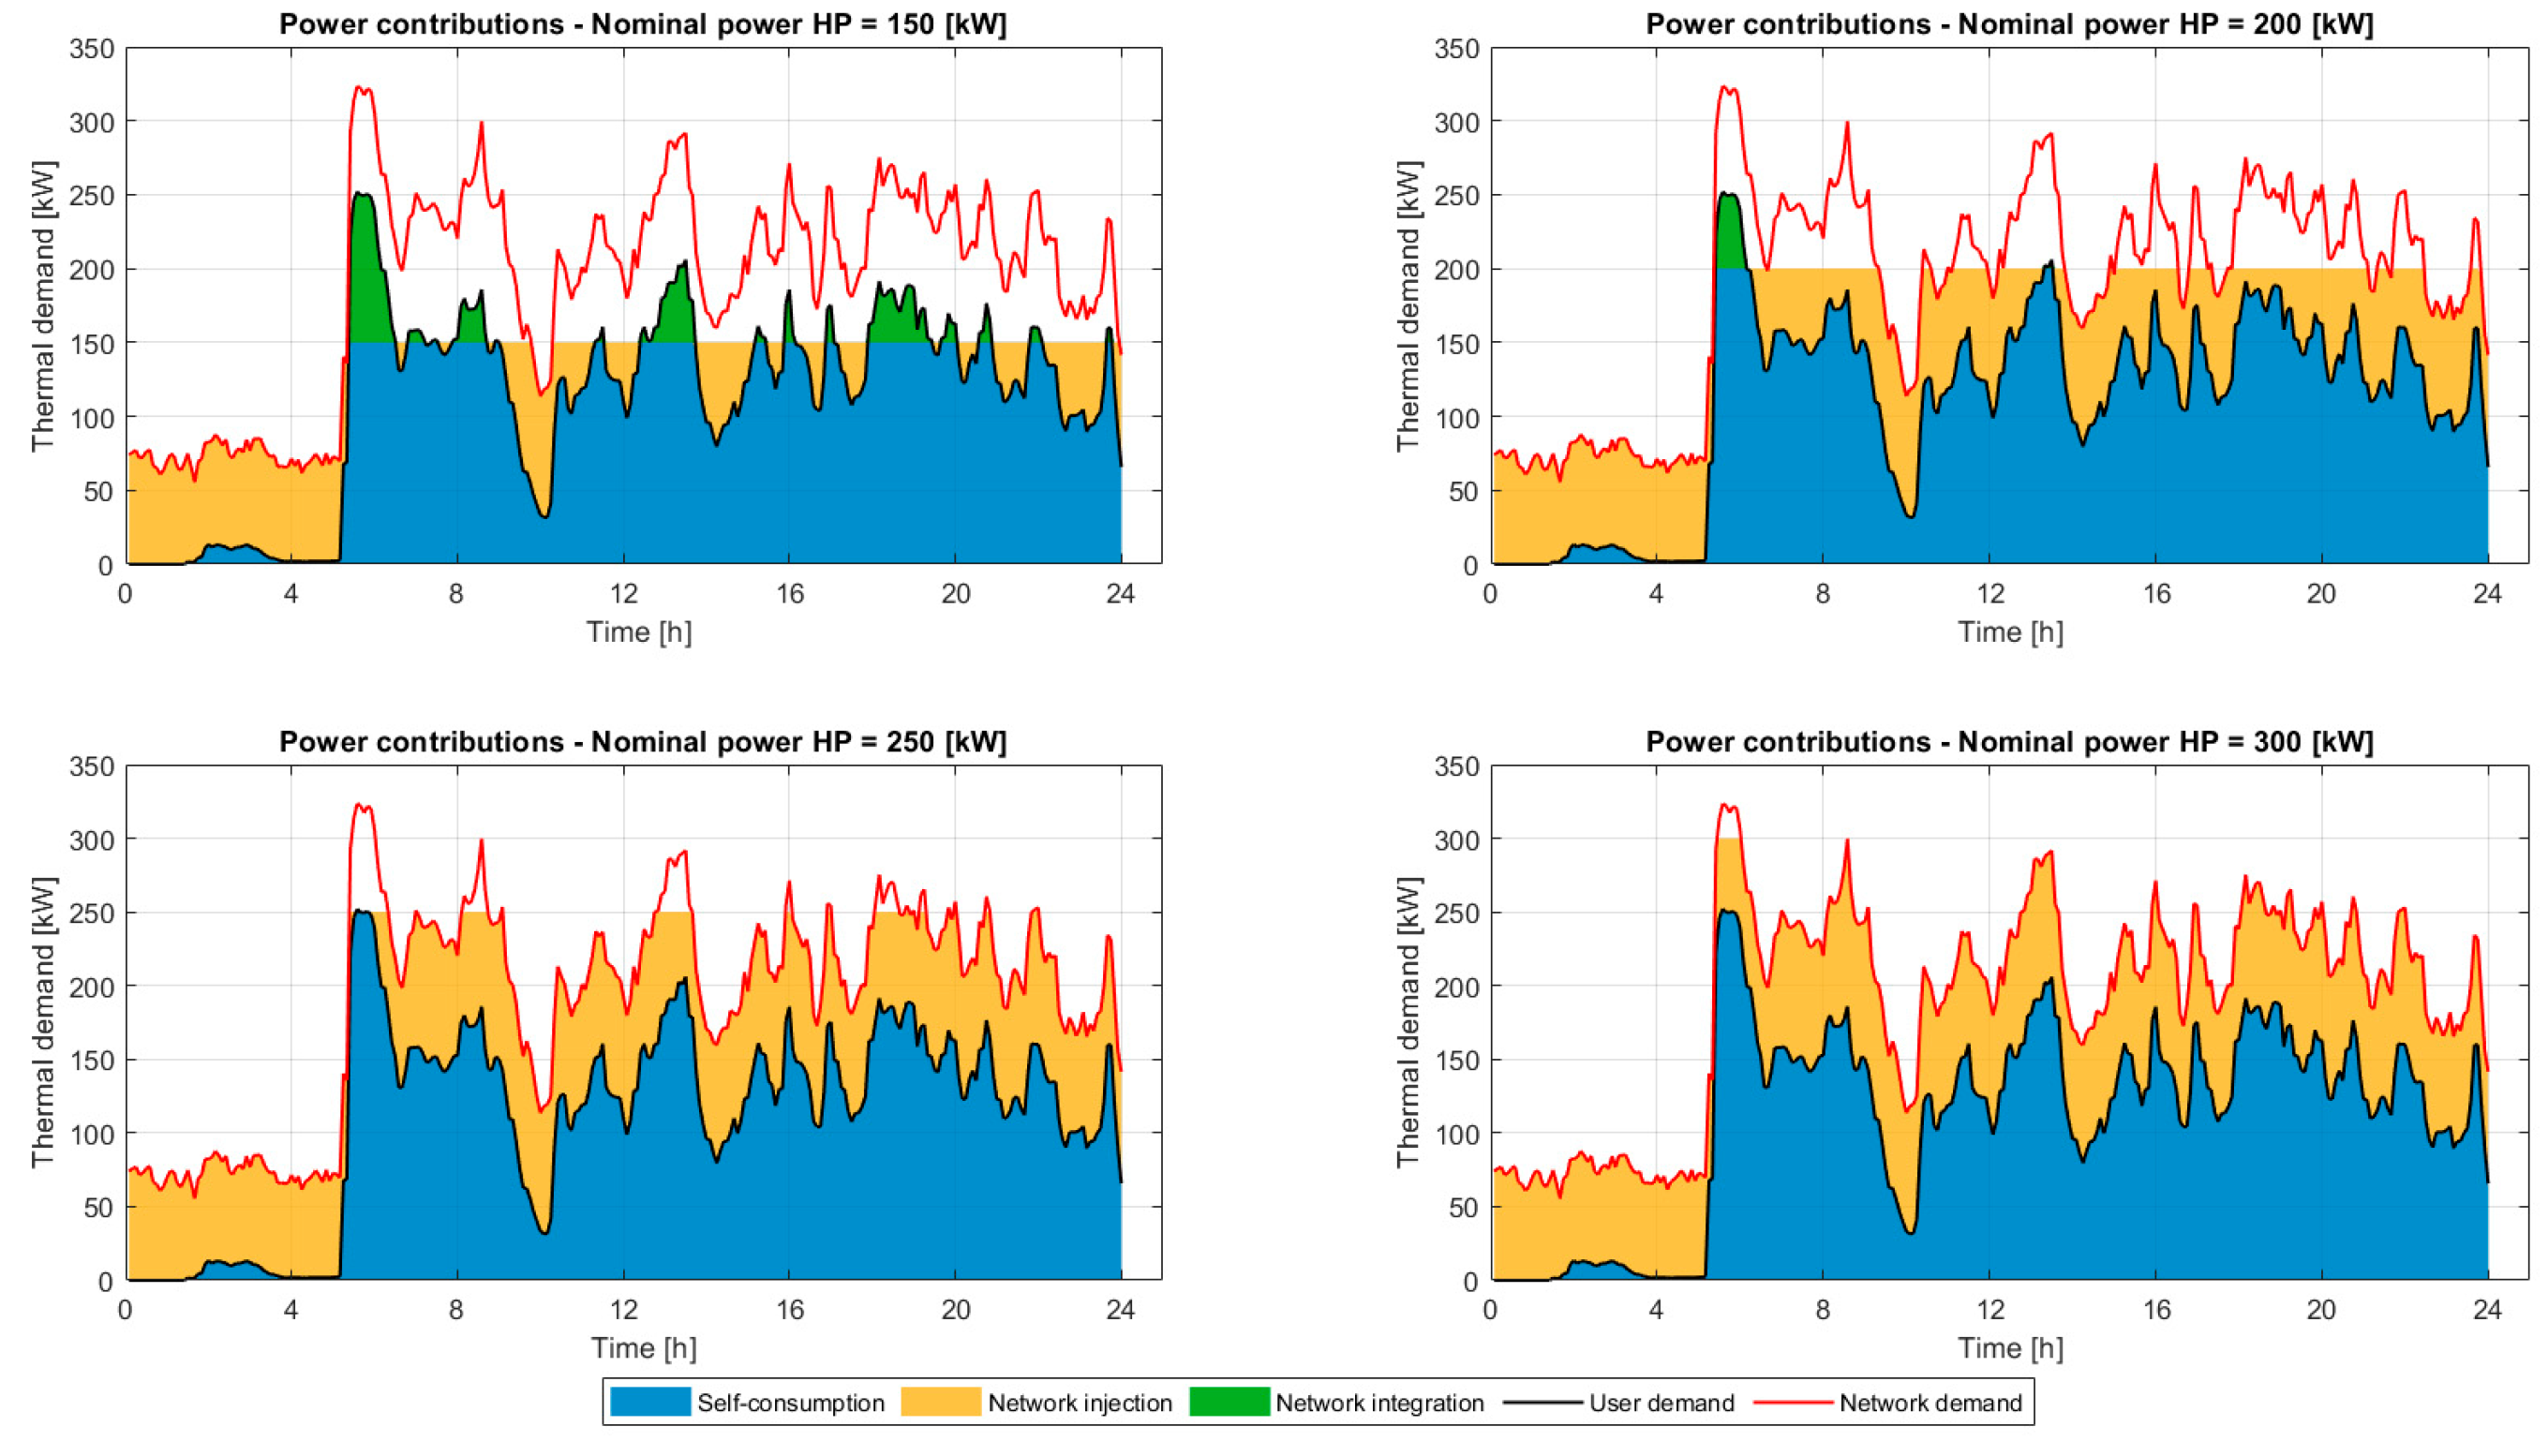
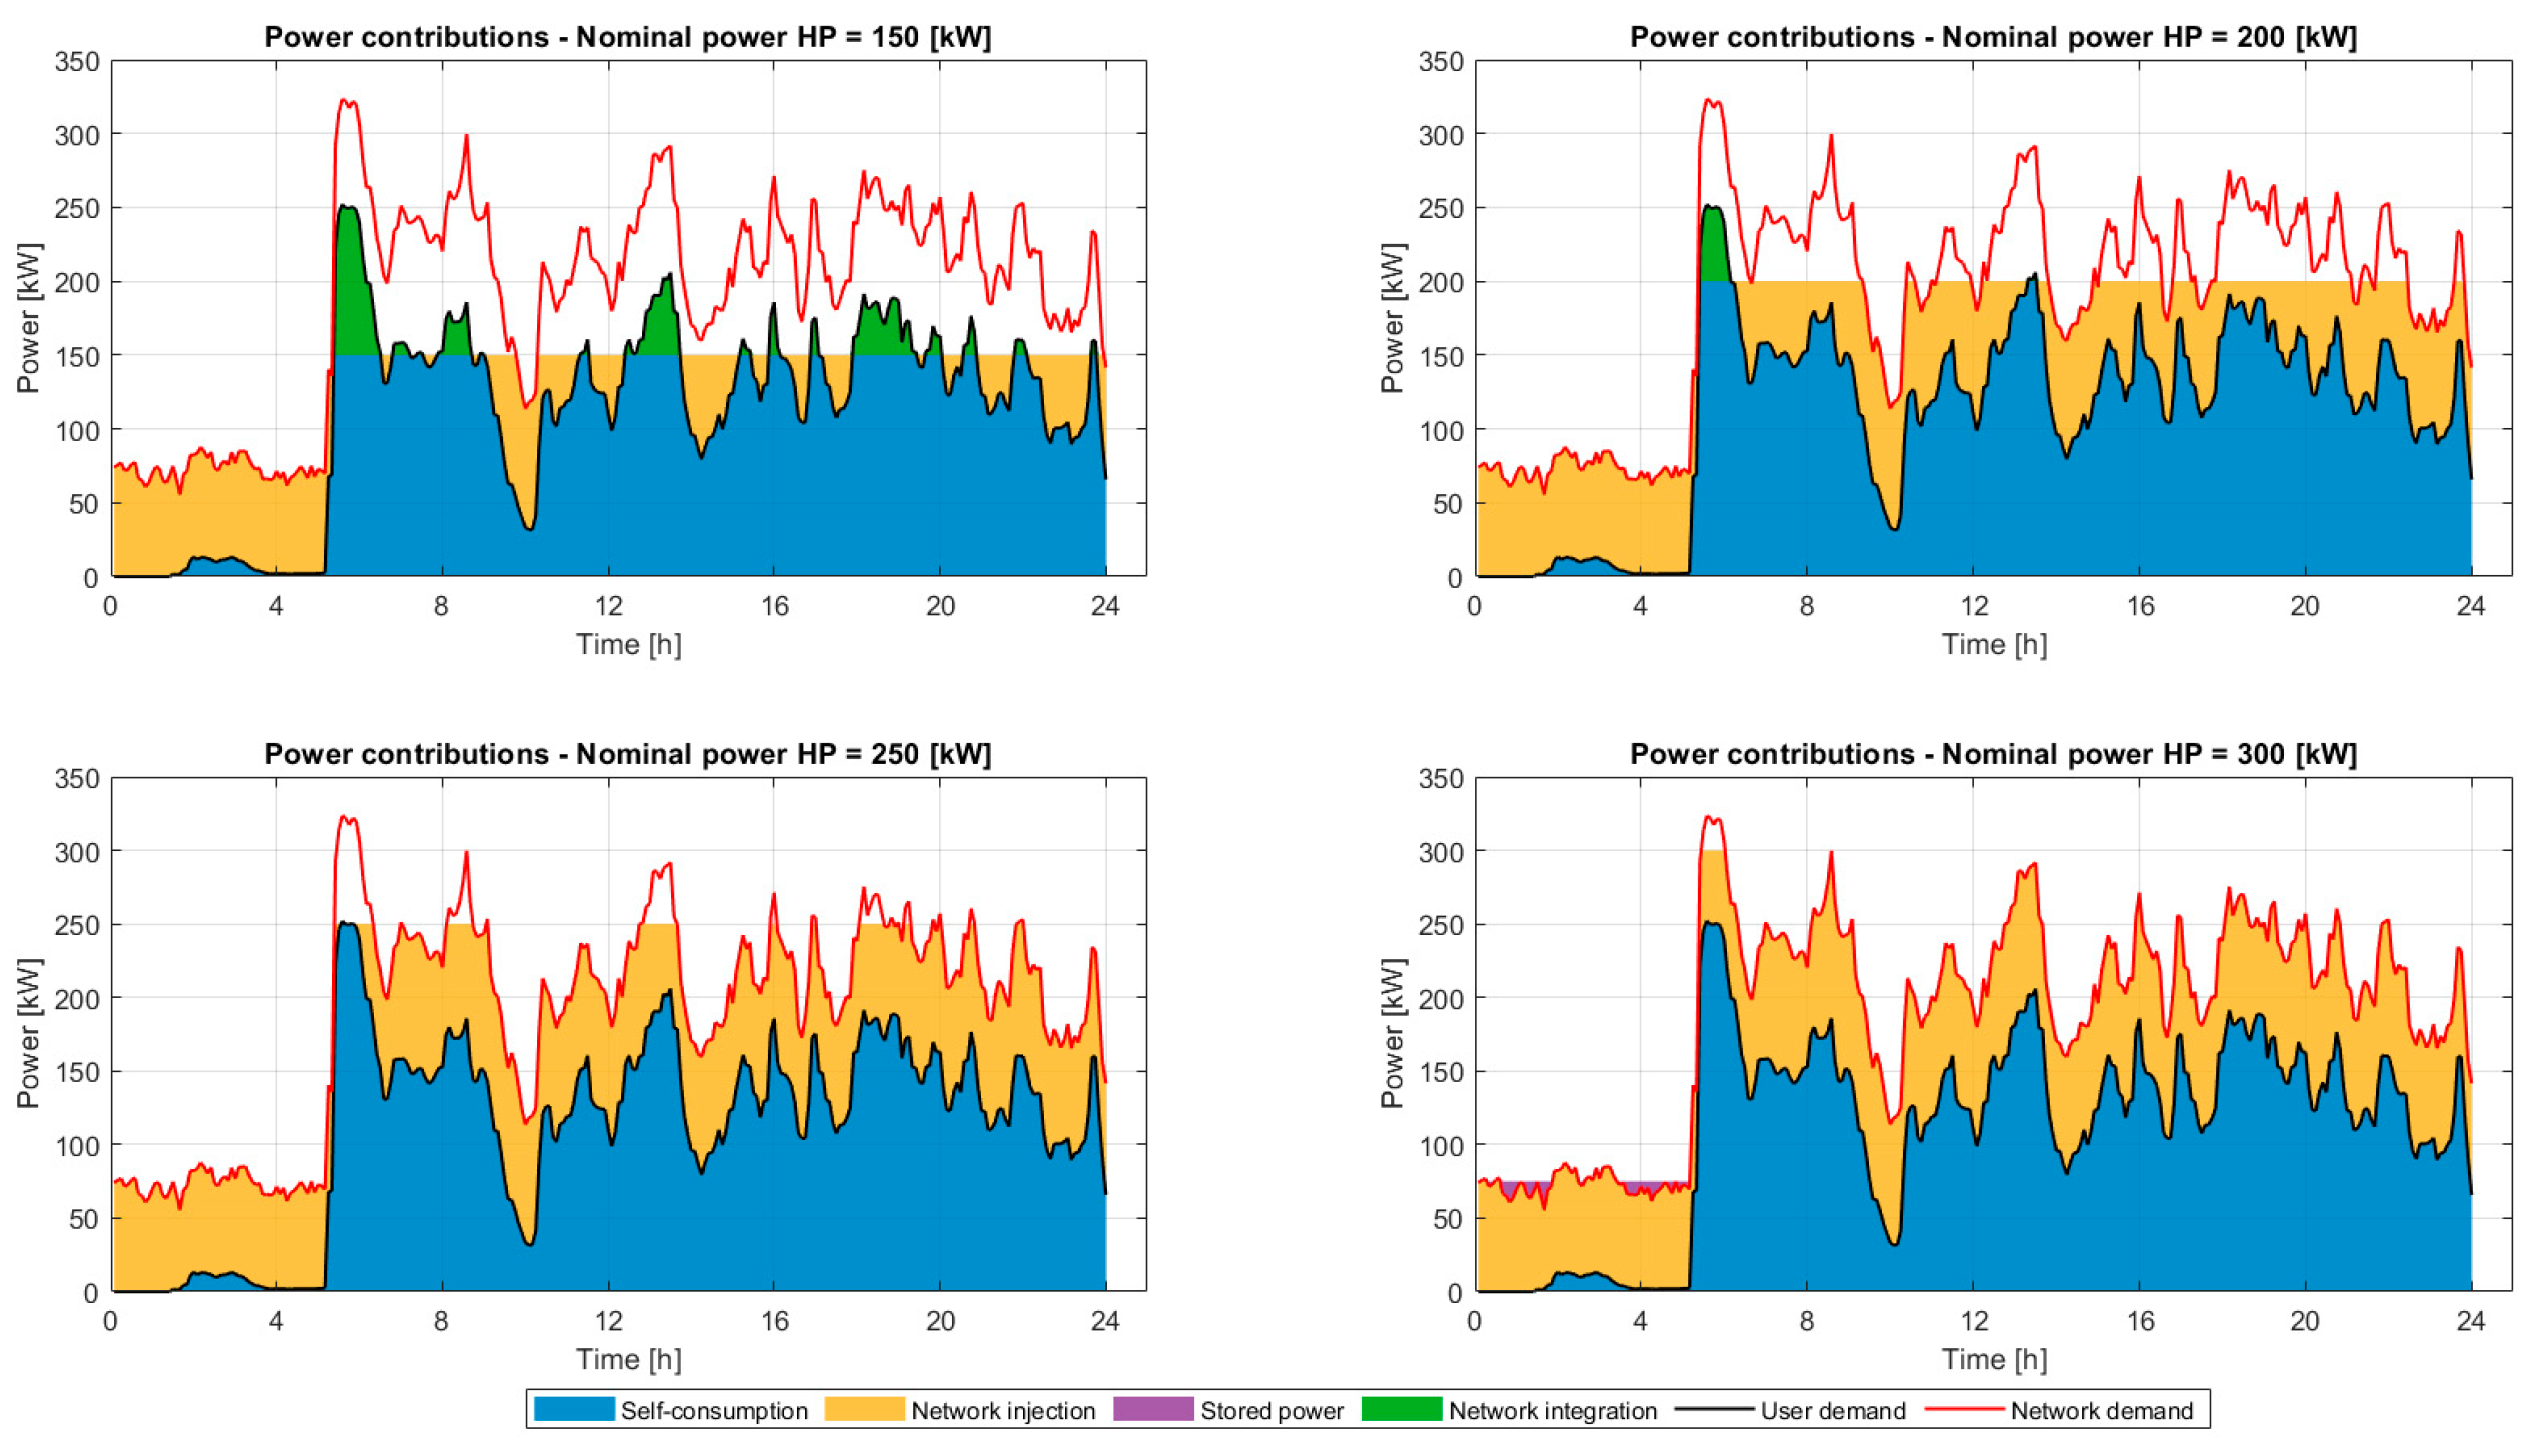
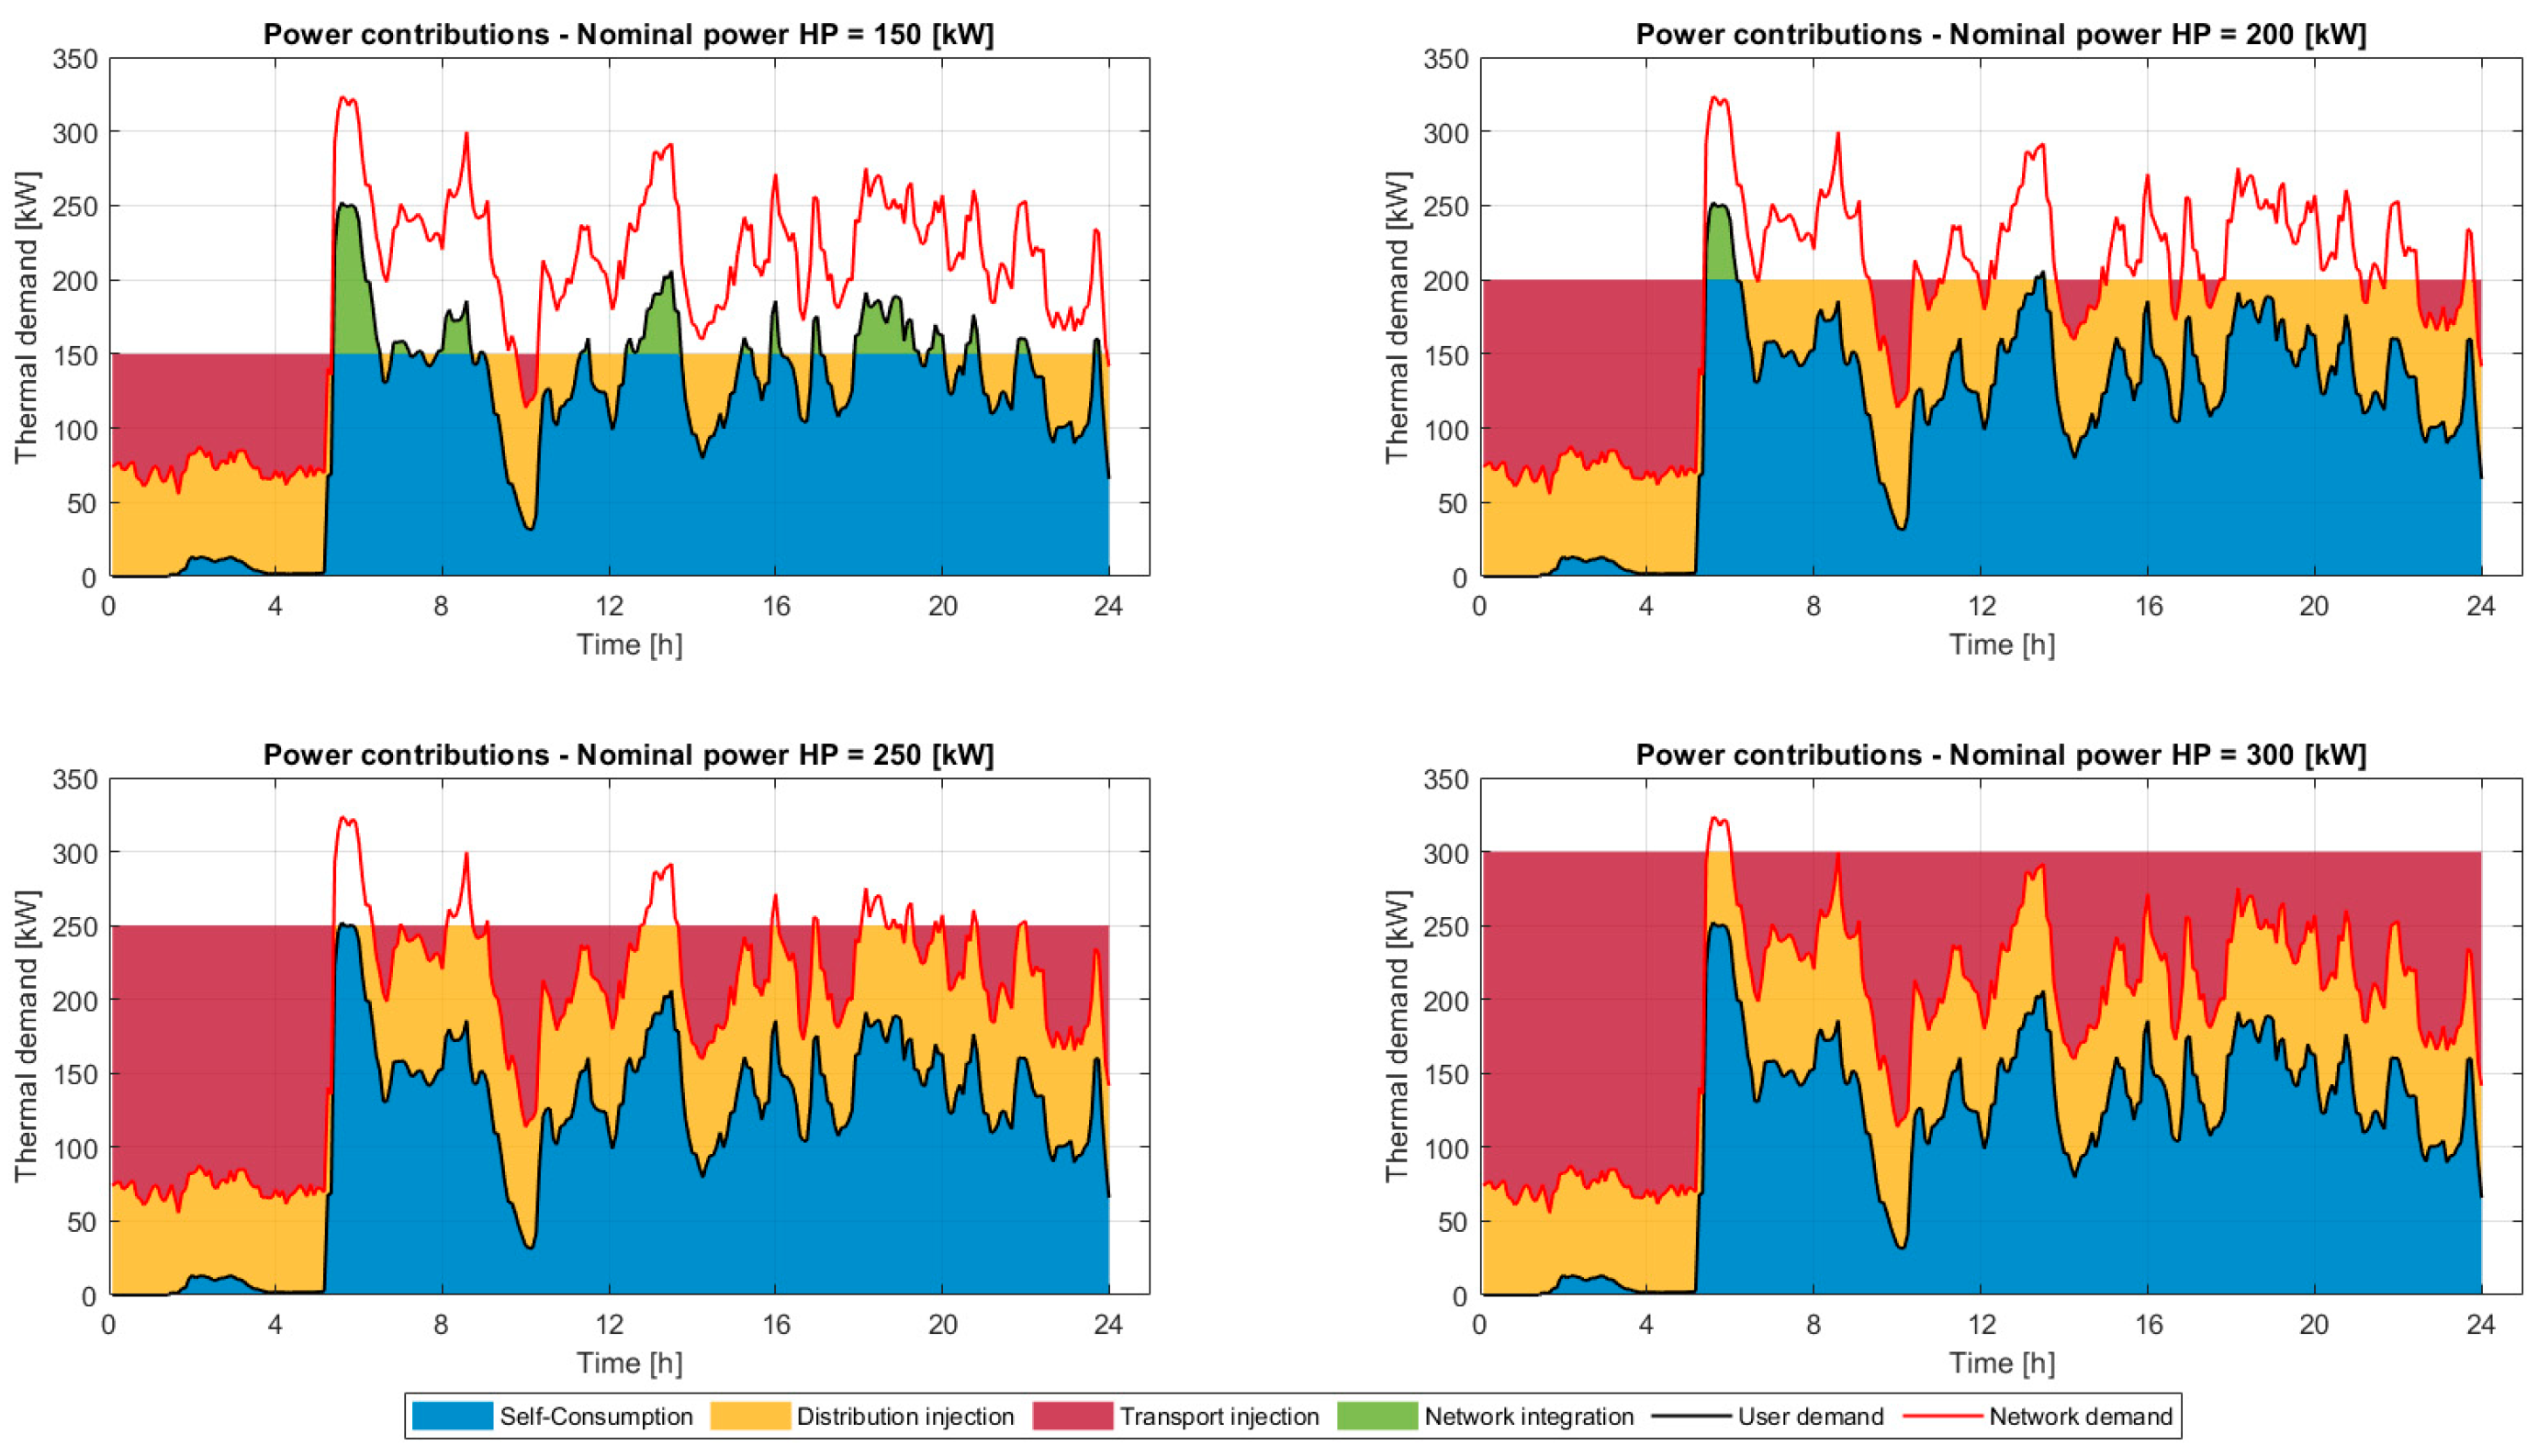
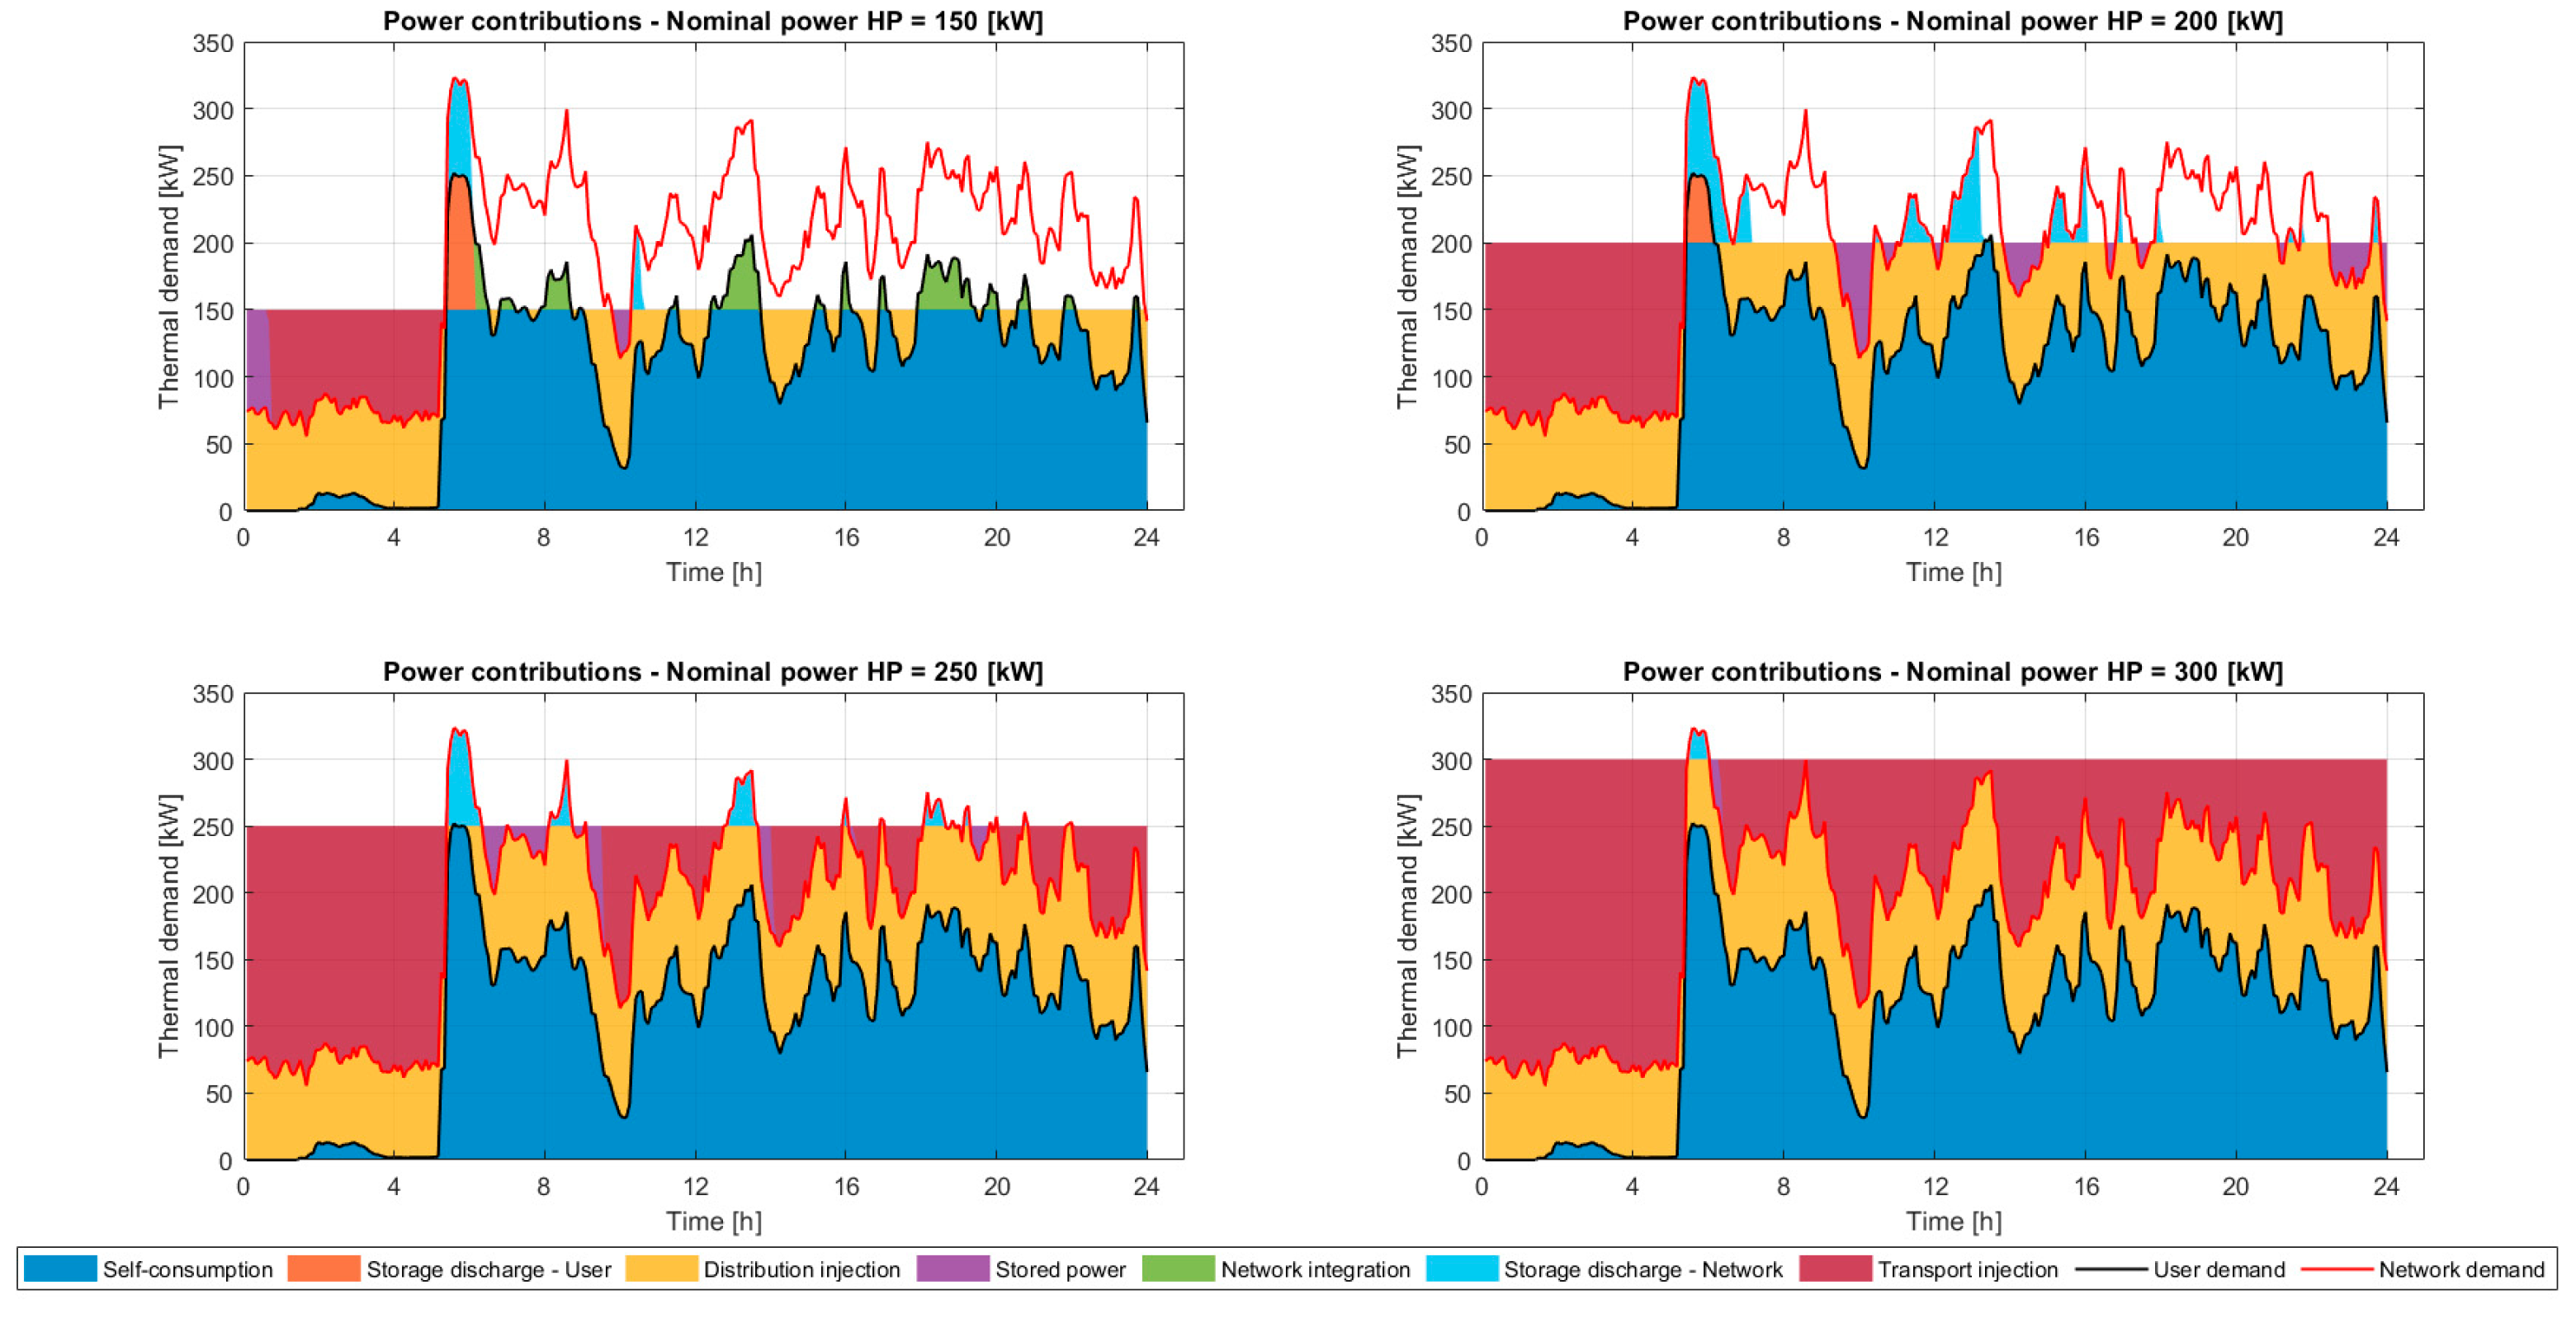
Below, for each scenario analyzed, an example is shown of what happens at the user level in terms of contributions of heat produced by the prosumer for different sizes of heat pumps. The following graphs represent the daily profile of the distribution network of a typical summer day for each configuration. In particular, the following contributions are indicated:
Solid red line: total network demand;
Solid black line: total demand of the user in which the prosumer is integrated;
Blue area: share of heat produced by the prosumer that is self-consumed by the user, defined as the minimum between the user’s demand and the HP production;
Yellow area: share of heat produced injected into the distribution network, calculated as the difference between HP production and user’ self-consumption; the injection into the grid occurs only if production exceeds demand;
Green area: part of user demand not covered by prosumer production. It is calculated as the difference between the total power required by the user and the power produced by the HP. This part of demand is provided to the user by the network;
Bordeaux area: share of heat produced that is injected into the transport network (only for Configuration 2). It is the surplus of power produced by the prosumer that is neither self-consumed nor injected into the distribution network but can be used to supply near distribution areas;
Purple area: share of heat produced that is stored (only in configurations where the storage system is introduced);
Orange area: share of stored heat that is used to cover user demand when it exceeds HP production;
Light blue area: share of stored heat that is used to cover network demand;
White area: share of heat requested by the other users supplied by the transport network.
Although the graphs show the daily behavior for the different configurations, the analysis was carried out over the entire summer period. Therefore, the indicators analyzed subsequently will illustrate the summary of the seasonal behavior.
In Configuration 1A (
Figure 4), it is observed that modulation allows for use that is more closely aligned to the load profile and limits surpluses, reducing the need for storage. Self-consumption prevails, and the injection to the grid is limited to the distribution network. In
Figure 4, the self-consumed portion is represented in blue, the one injected into the grid in yellow, and the integration of the network to satisfy the demand not covered by the prosumer is in green. If a storage system is included, a share of stored energy is introduced:
Figure 5 shows how the amount of stored energy is very small and is only observed with larger HP sizes. The storage system does not have a significant impact in this configuration; its contribution is minimal. The main reason lies in the fact that the heat pump is modulated, so the production closely follows the demand. In this configuration, storage is minimal but may be necessary at specific times when demand is very low: in this case, since a heat pump does not operate stably at very low power, an operating limit equal to 25% of the nominal power is imposed, and the extra production is accumulated.
In the second scenario, the possibility of also injecting into the transport network is introduced. For Configuration 2A,
Figure 6 shows the main power contributions for a typical day. The self-consumed portion is in blue, the one injected into the grid in yellow, the available contribution to supply other networks is in purple, and the portion requested from the network to satisfy the demand not covered by the prosumer is in green. It can be observed that as the heat pump size increases, the user’s energy consumption is almost entirely covered by self-consumption, favoring the injection of stored energy into the network. Surplus production occurs mainly during the night hours: with large HP sizes, a big amount of power could be used to supply other distribution networks.
For Configuration 2B, a tank volume of
is fixed.
Figure 7 shows, for various sizes, the power contributions with the share of injections into the transport network. The storage system’s operation is observed: available energy is charged as much as possible and then discharged at the first available moment. When the storage is saturated, the excess energy produced is injected into the transport network (Bordeaux portion).
The analyzed scenarios represent possible valid configurations of prosumer installation into a distribution network. Configuration 1A, on which the simulation was carried out, represents a realistic scenario. Production closely follows the demand: self-consumption prevails, and the surplus of energy is injected into the grid but remains within the distribution network. User and network self-sufficiency are quite high and increase with increasing size. The introduction of the storage system, in Configuration 1B, has not had an impact on the percentage of self-sufficiency: the modulation of the heat pump already allows for an optimized use of the power produced. For this reason, the accumulation is minimal and occurs only for large sizes of heat pumps. The subsequent configurations introduce the possibility to increase the produced energy and use it to power other distribution networks, injecting flow rate into the transport network. In Configuration 2A, the surplus heat produced becomes available to be injected into the transport network. Without the introduction of a storage system, production is not aligned with demand: a significant portion of the produced energy cannot be directly consumed, and it is assumed to be used to supply other distribution networks. In this scenario, the self-sufficiency level depends only on self-consumption and on the power injected into the sub-grid. In Configuration 2B, assuming the introduction of a storage system, the surplus energy is divided into two parts: (i) an accumulated portion, intended to be used to satisfy the needs of the user and possibly of the other users in the sub-grid; and (ii) a portion fed into the transport network. The integration of a storage system increases user and network self-sufficiency, as surplus energy produced during low-demand periods can be stored and subsequently used to cover a portion of the demand when it exceeds production. In this way, the percentage of demand satisfied without resorting to the transmission network increases.
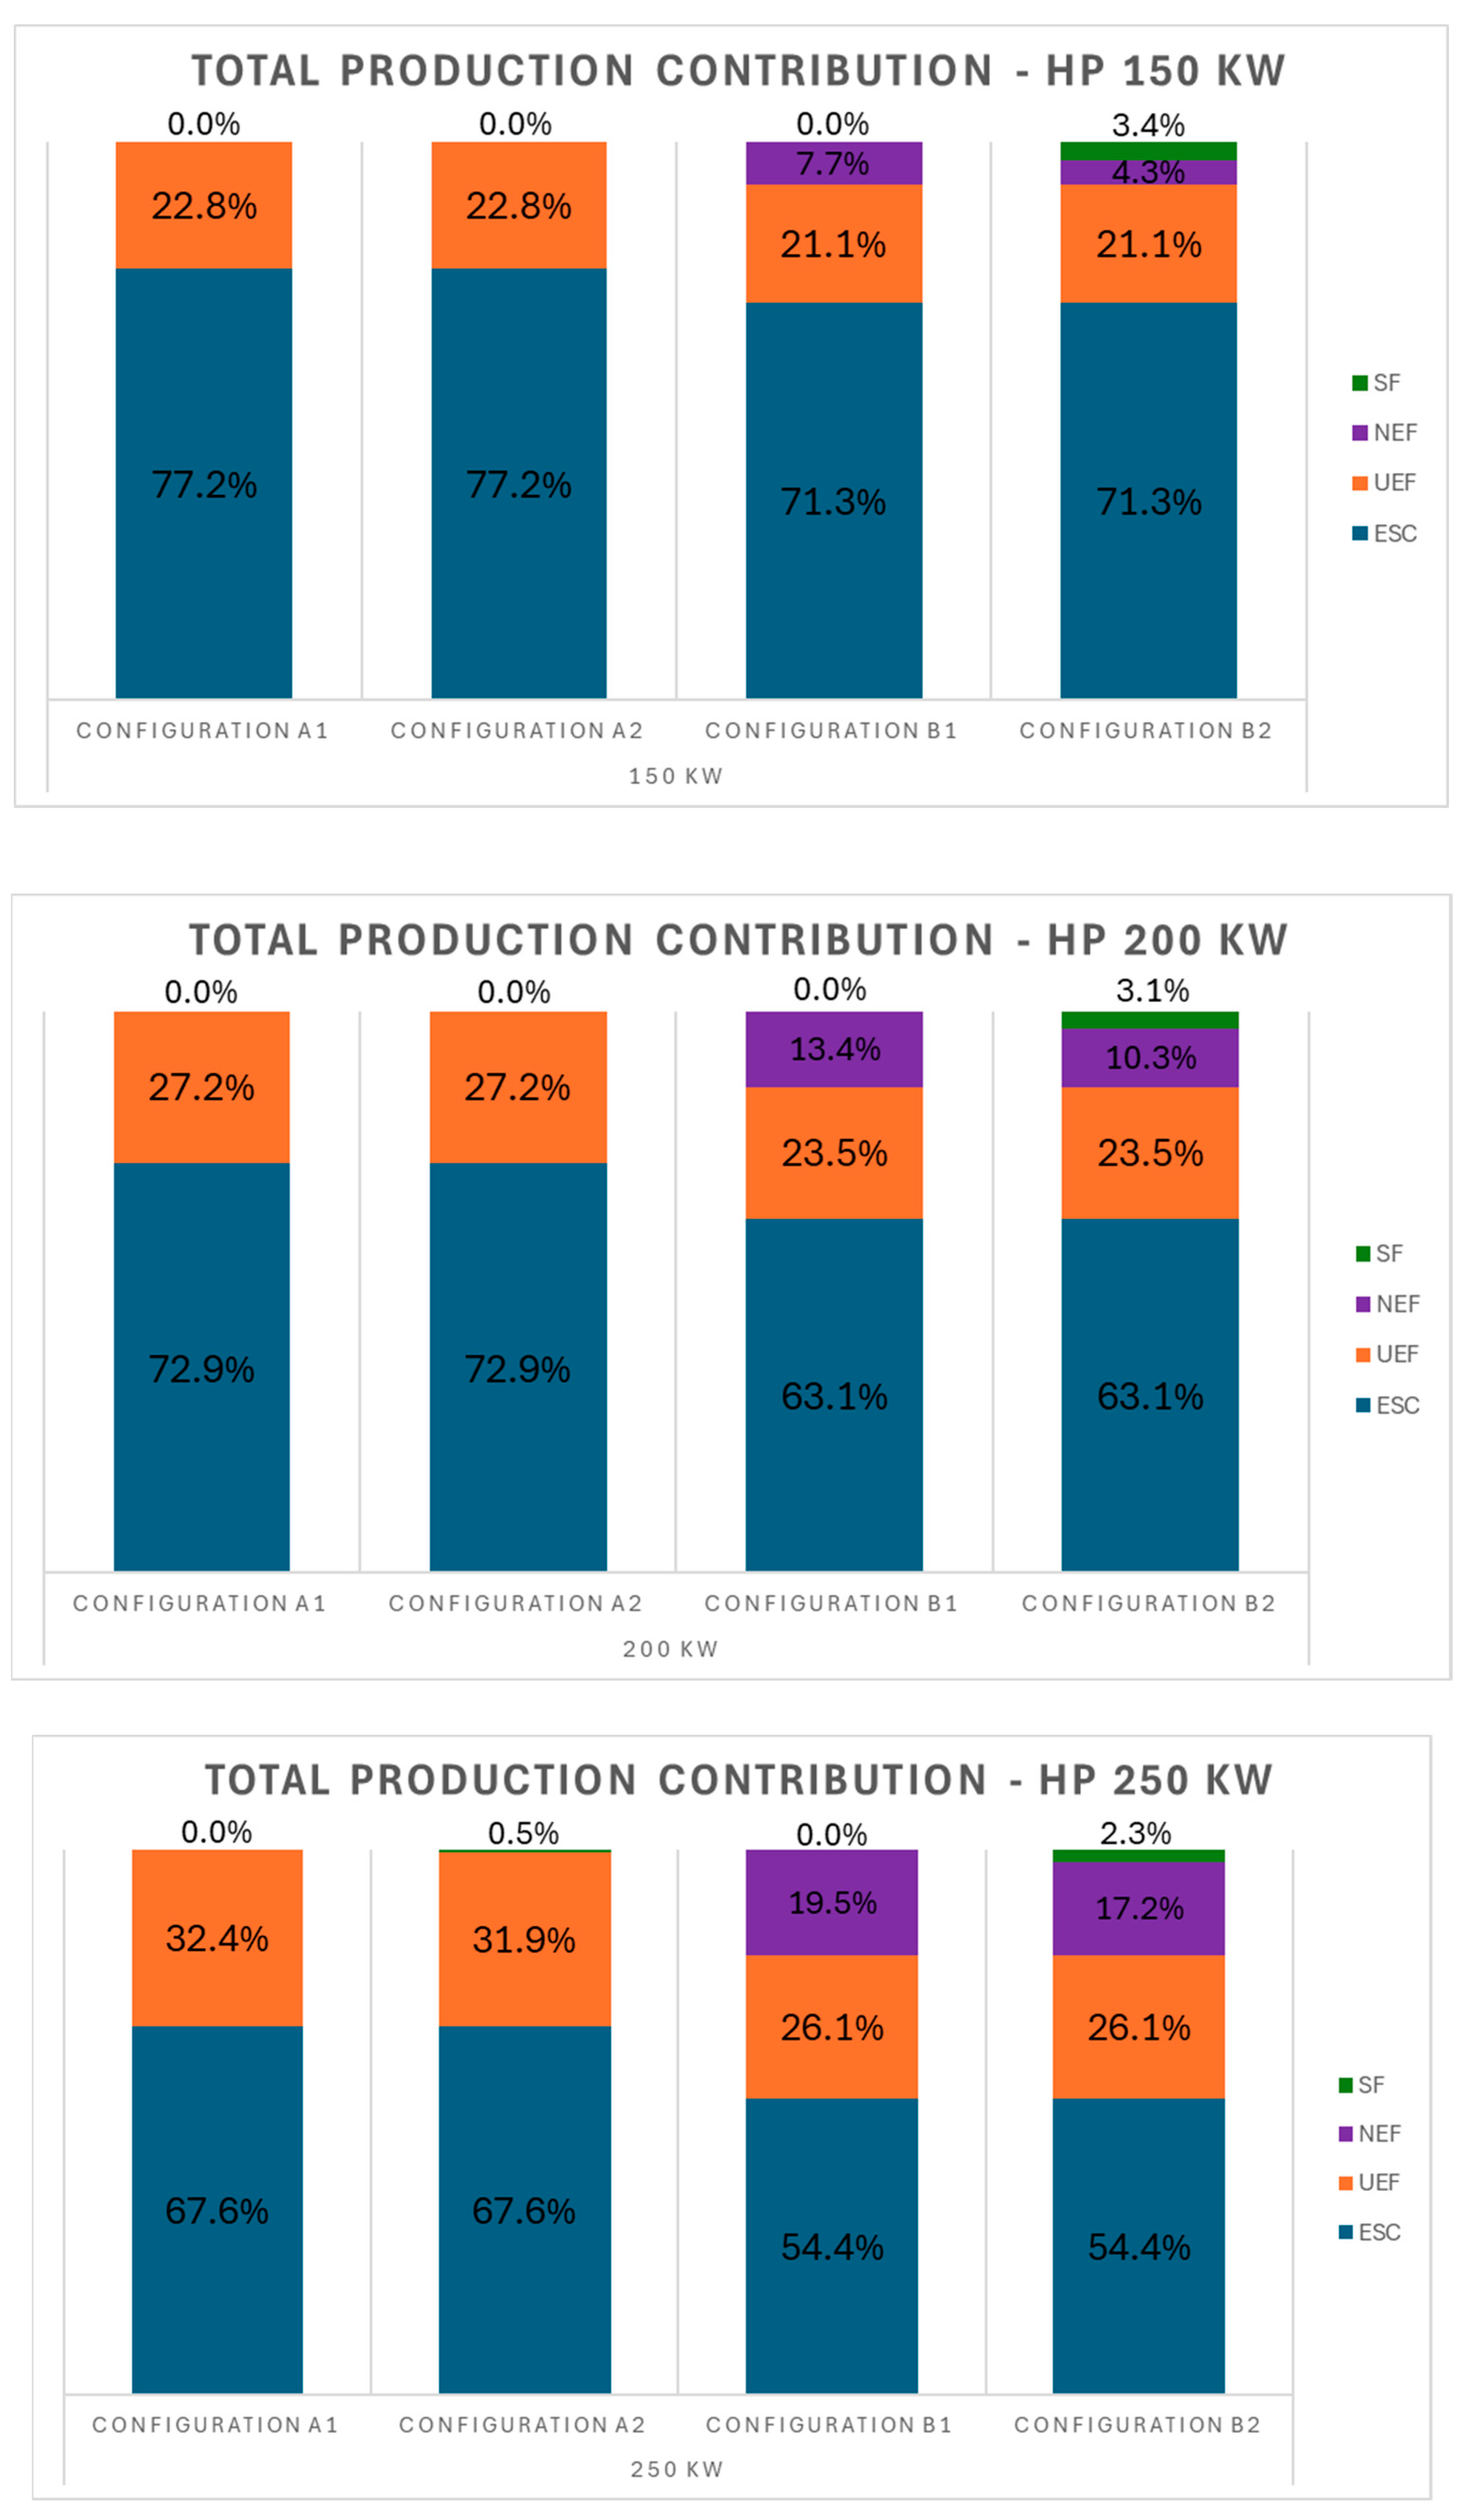
The following graphs show some comparisons to clarify the main differences between the scenarios. In
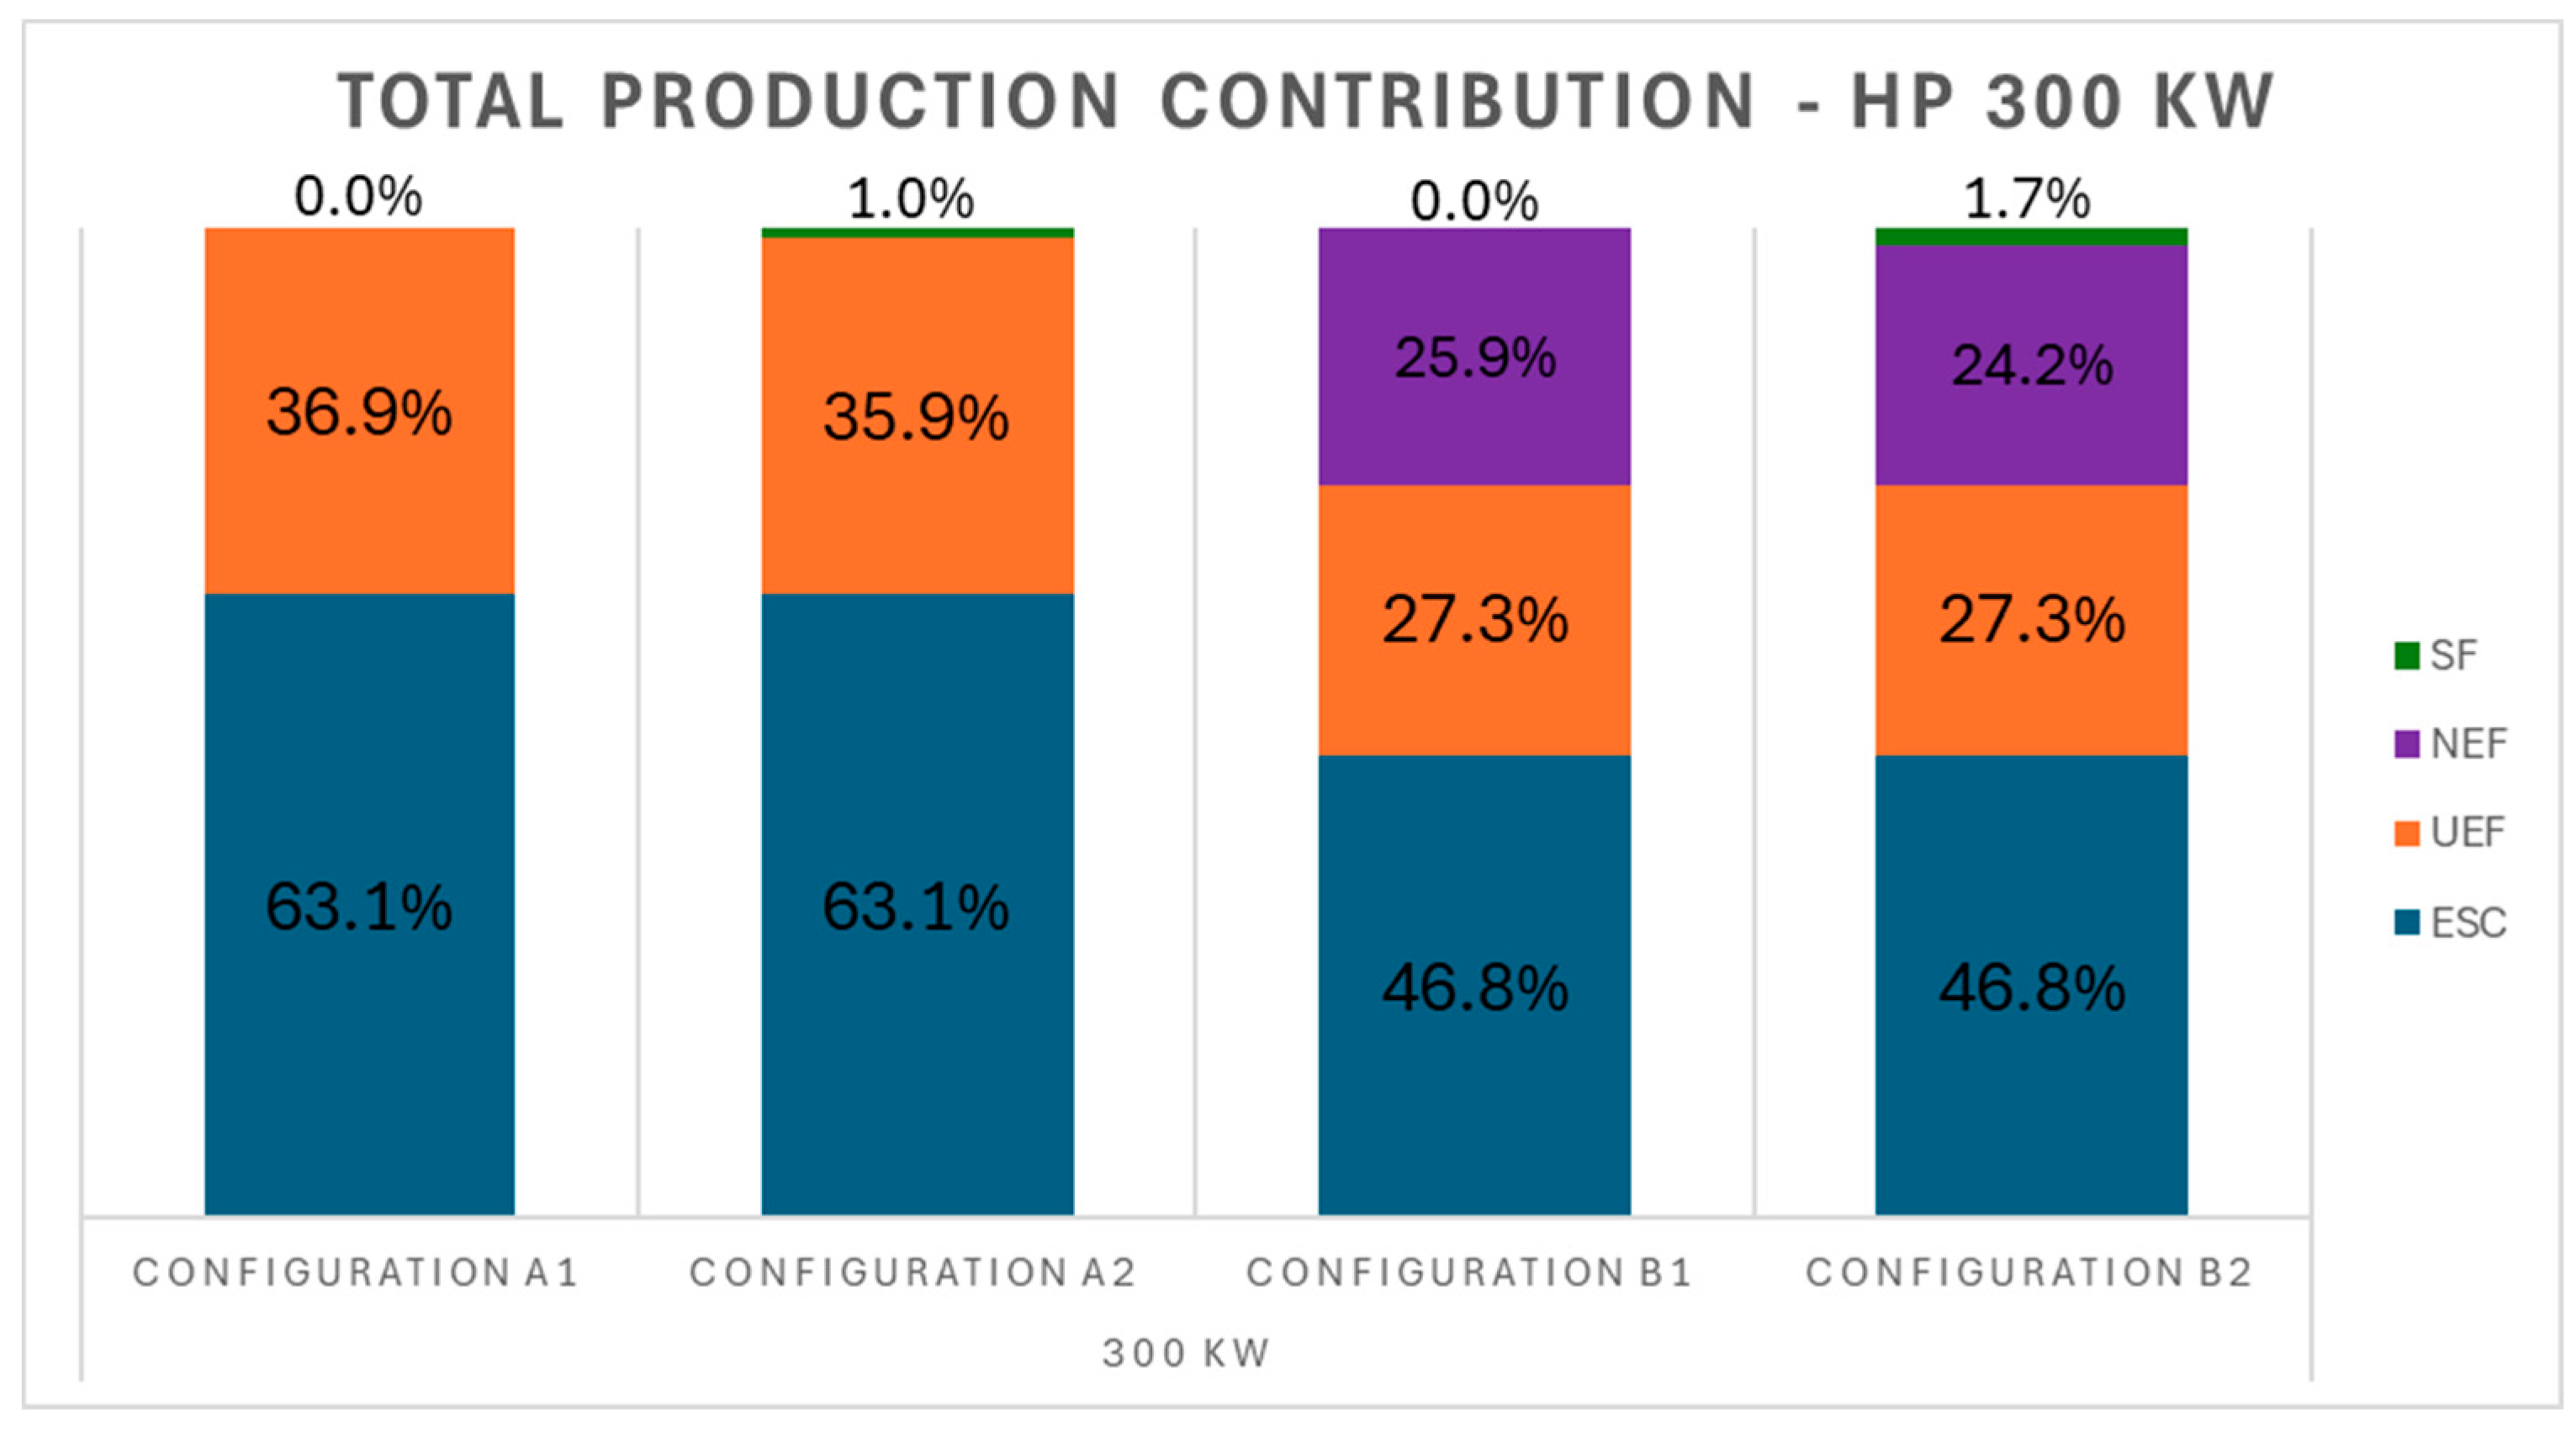
Figure 8 the contributions related to the produced energy—ESC, UEF, NEF, and SF—are presented in these stacked column charts for three different sizes of heat pump. For what concerns the first configuration, it can be noted that the difference between the scenarios with and without storage (1A and 1B) is minimal: only for larger heat pump sizes is a part of the energy accumulated, but even in this case it is minimal compared to the other contributions (it reaches a maximum of 1% for a 300 kW HP). The largest share of energy produced is used for self-consumption by the user. For what concerns the second configuration, the network export fraction is introduced. A significant portion of the power produced, which increases with the increase in size, could be used to supply other distribution networks. In Configuration 2B, the storage system allows to cover the demand even when it exceeds production. Although the percentage of stored energy is small (around 2–3%), its contribution is relevant since it increases the network self-sufficiency. In this configuration, the amount of energy available for other sub-grids slightly decreases.
In
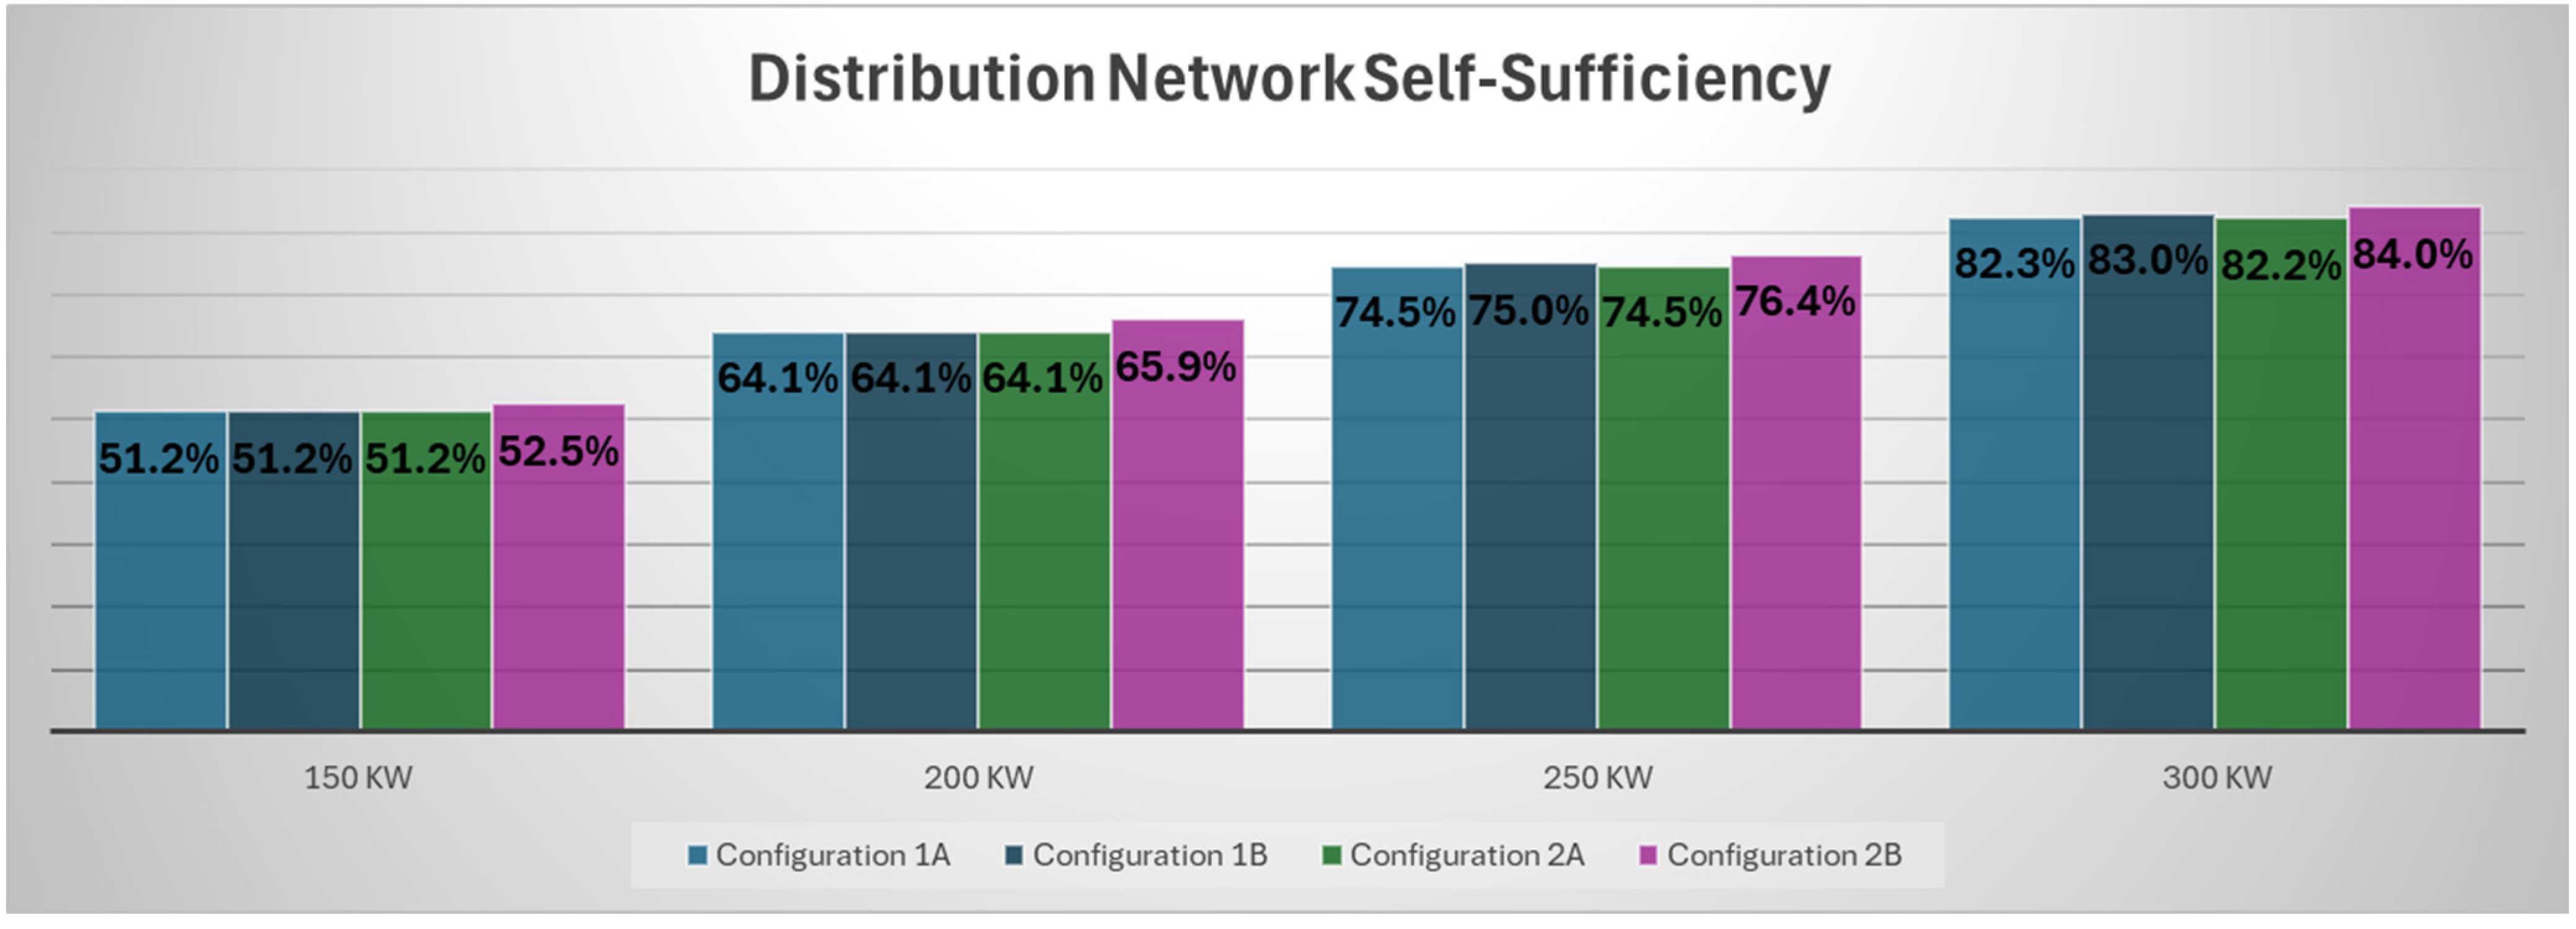
Figure 9 the percentage related to the distribution network self-sufficiency for the four configurations is reported. Self-sufficiency increases with the size of the heat pump because higher production permits to cover a higher part of the demand. For a 300 kW HP, a self-sufficiency of 84% is achieved. The differences between the configurations are limited: both with and without heat pump modulation, the percentage of the covered distribution network remains almost unchanged, as the additional power produced by the non-modulated heat pump is used to inject into the transport network, not contributing to raising the percentage of the distribution network self-sufficiency, but instead providing additional renewable energy to adjacent distribution networks. The storage, in particular for the second configuration, allows to slightly increase the percentage of self-sufficiency.
Finally, in
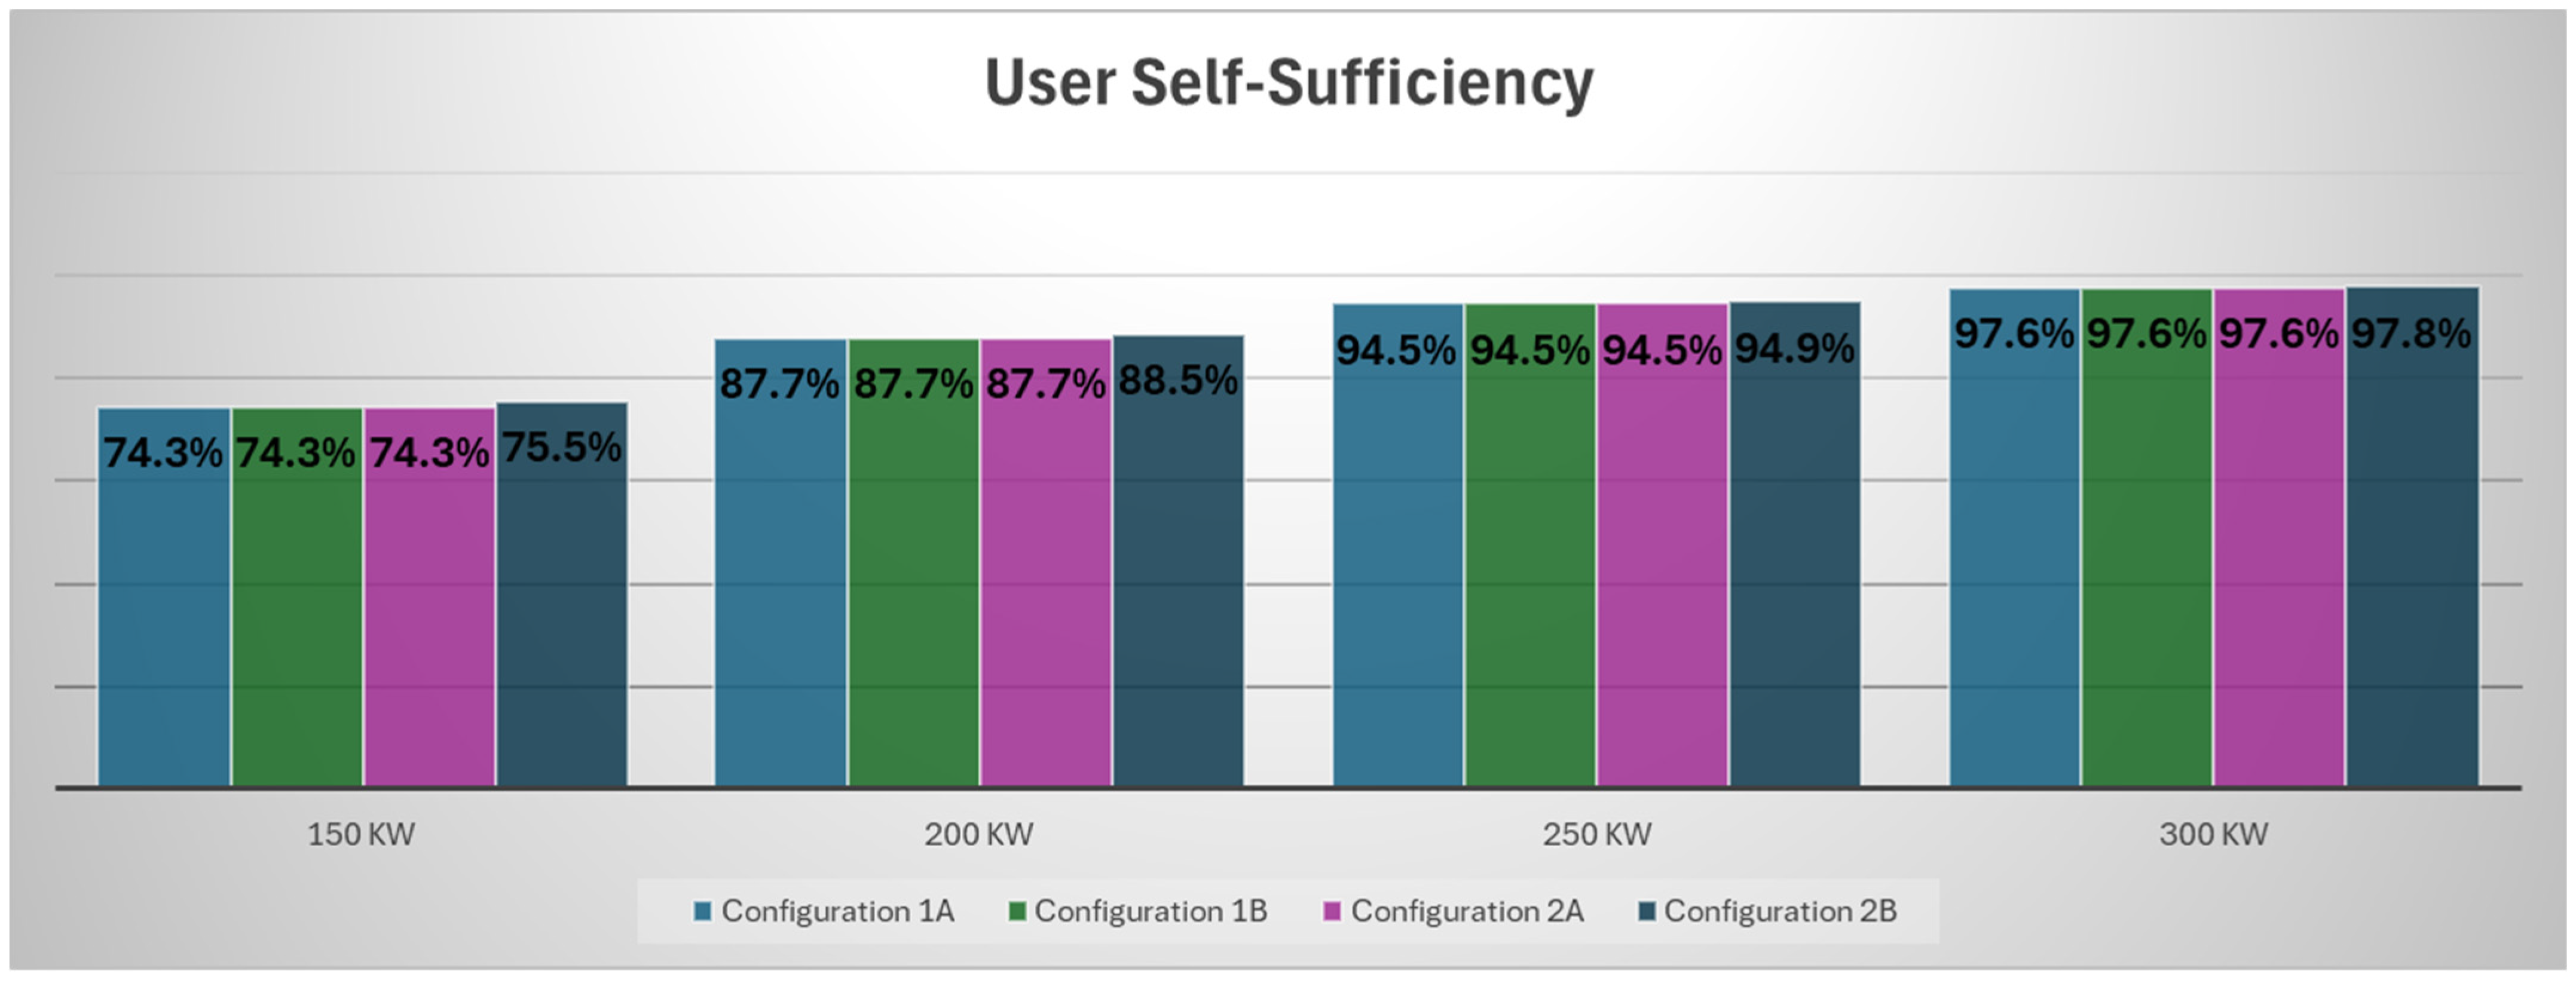
Figure 10 the user self-Sufficiency for the four configurations for different HP sizes is reported: the same comments made previously apply. The self-sufficiency increases with the HP sizes and is very similar between the different configurations. In particular, there seems to be no difference between Configuration 1A and Configuration 1B, demonstrating that storage does not provide a great advantage. The limited effect of the 5 m
3 storage in Configuration 1 is mainly due to the modulating operation of the heat pump, which already balances production and demand. As a result, only a small amount of surplus heat is available for storage. Different control strategies and larger storage capacities could increase the benefit, improving the distribution network and user self-sufficiency.
4.2. Results of the Simulation
In order to perform a simulation with a realistic case, a 200 kW heat pump with demand-based power modulation and a minimum operating threshold of 25% of nominal power is considered. In this case, a storage system is not necessary. Such a system allows 88% user self-sufficiency and 64% network self-sufficiency. These values indicate almost complete coverage on the user side and good coverage at the distribution network level, requiring the transmission network to meet only 36% of the overall demand.
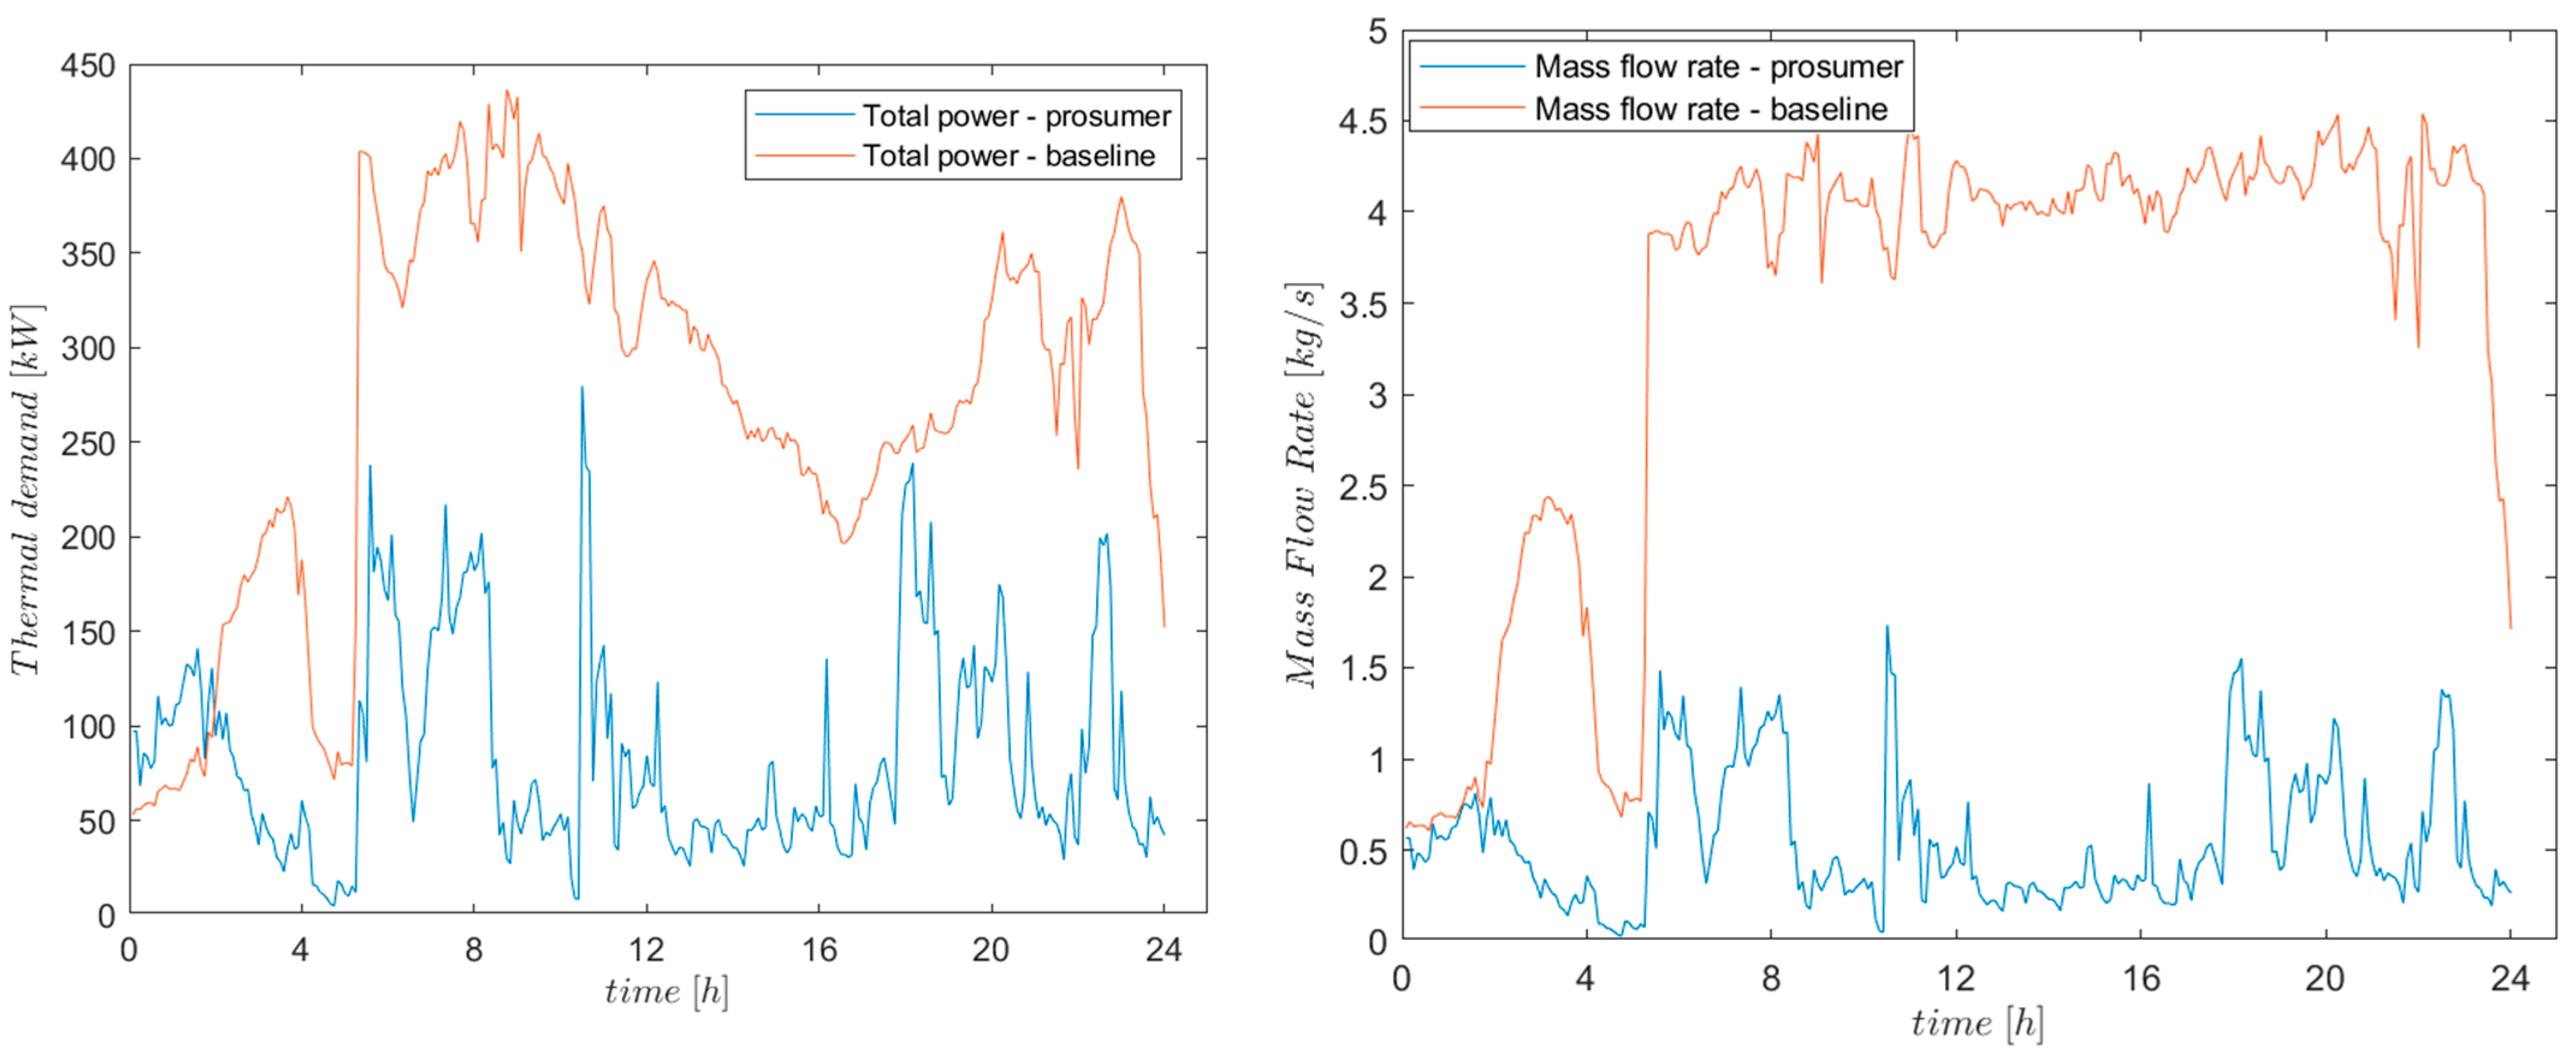
With the integration of a prosumer into the distribution network, both the heat and the mass flow rate required from the transmission network are reduced: their evolution during a typical day is reported in
Figure 10. In this case, the average daily flow rate reduction is around 86%, calculated as the average over time of the relative variation between the prosumer scenario and the base case, as from Equation (9).
Although the flow rate to the users increases (to maintain the same heat demand despite the lower supply temperature from the prosumer), the net effect is a decrease in the flow rate required to the transport network. Such a marked reduction in circulating flow rate is due to the drop in demand from the user where the prosumer is located, since it covers a large portion of its own needs. In
Figure 11 the comparison of the evolution of the heat demand and mass flow rate in the current case and with the integration of the thermal prosumer is shown.
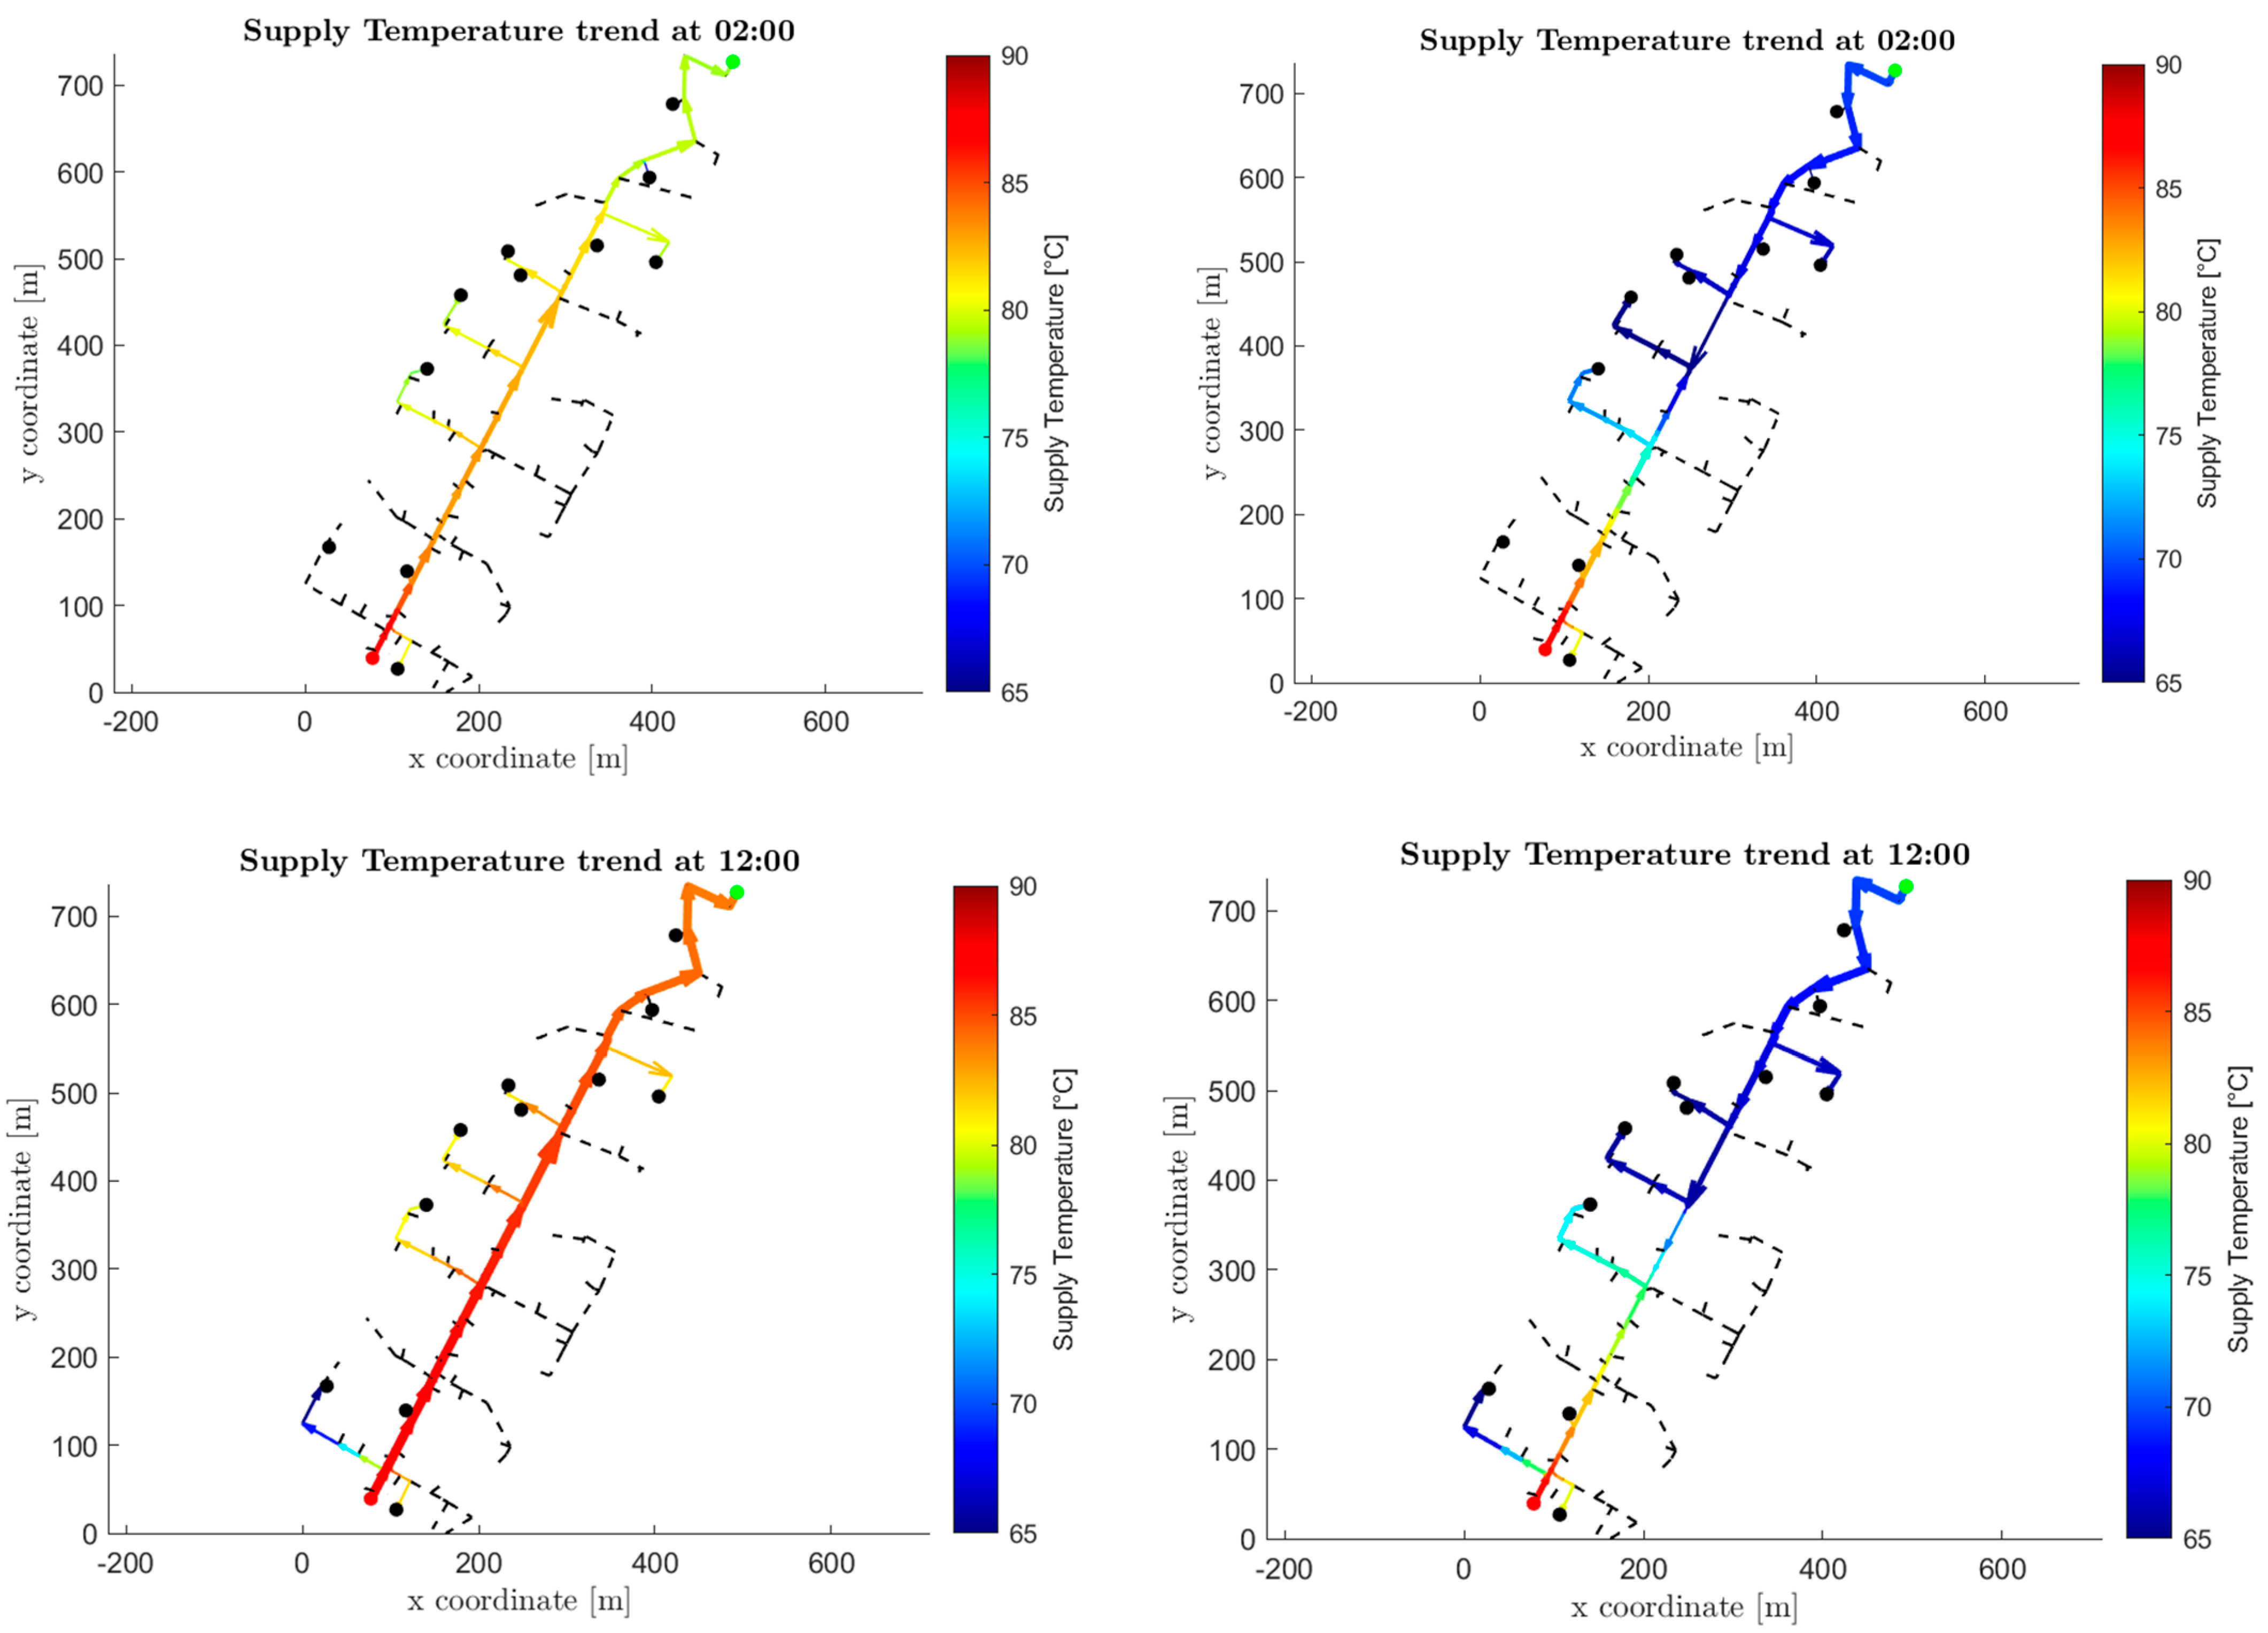
As for what concerns the supply temperature, it depends mainly on the user location and, consequently, which of the two producers is supplied. It is therefore interesting to observe which users are supplied by the prosumer and which by the transport network. In
Figure 12 a graph of the oriented network topology for two different moments of the day is shown: on the left the current case is represented, while on the right the temperature distribution in the case of prosumer integration is shown. The dashed lines are sections of the network where the flow rate does not circulate, since there are no active users in those branches during summer. The thickness of the lines is correlated with the flow rate circulating in the branches. Given the particular location of the prosumer, placed opposite to the connection point with the transport network, the distribution network is effectively divided into two sections. The upper section is supplied by the prosumer, while the lower section is fed by the transport network. Some users located in the central part of the network can receive heat either directly from the transport network or from a mixture of flows coming from both sources, depending on the operating conditions at each time step. As a result, some users are supplied at lower temperatures compared to the base case, specifically those directly supplied by the prosumer and those affected by mixed flow conditions. In the analyzed configuration, the prosumer injects heat at 70 °C, while the transport network operates at around 90 °C. Despite the local temperature reduction with respect to the base case, it has been verified that the temperature reaching the users remains above the secondary-side supply temperature measured in the existing configuration. Therefore, the required temperature for DHW preparation can be achieved without additional boosting, provided that the substations can compensate for the lower inlet temperature by increasing the mass flow rate. This assumption implies that the heat exchangers should be slightly oversized, allowing them to maintain the same thermal power delivery under reduced supply temperatures.
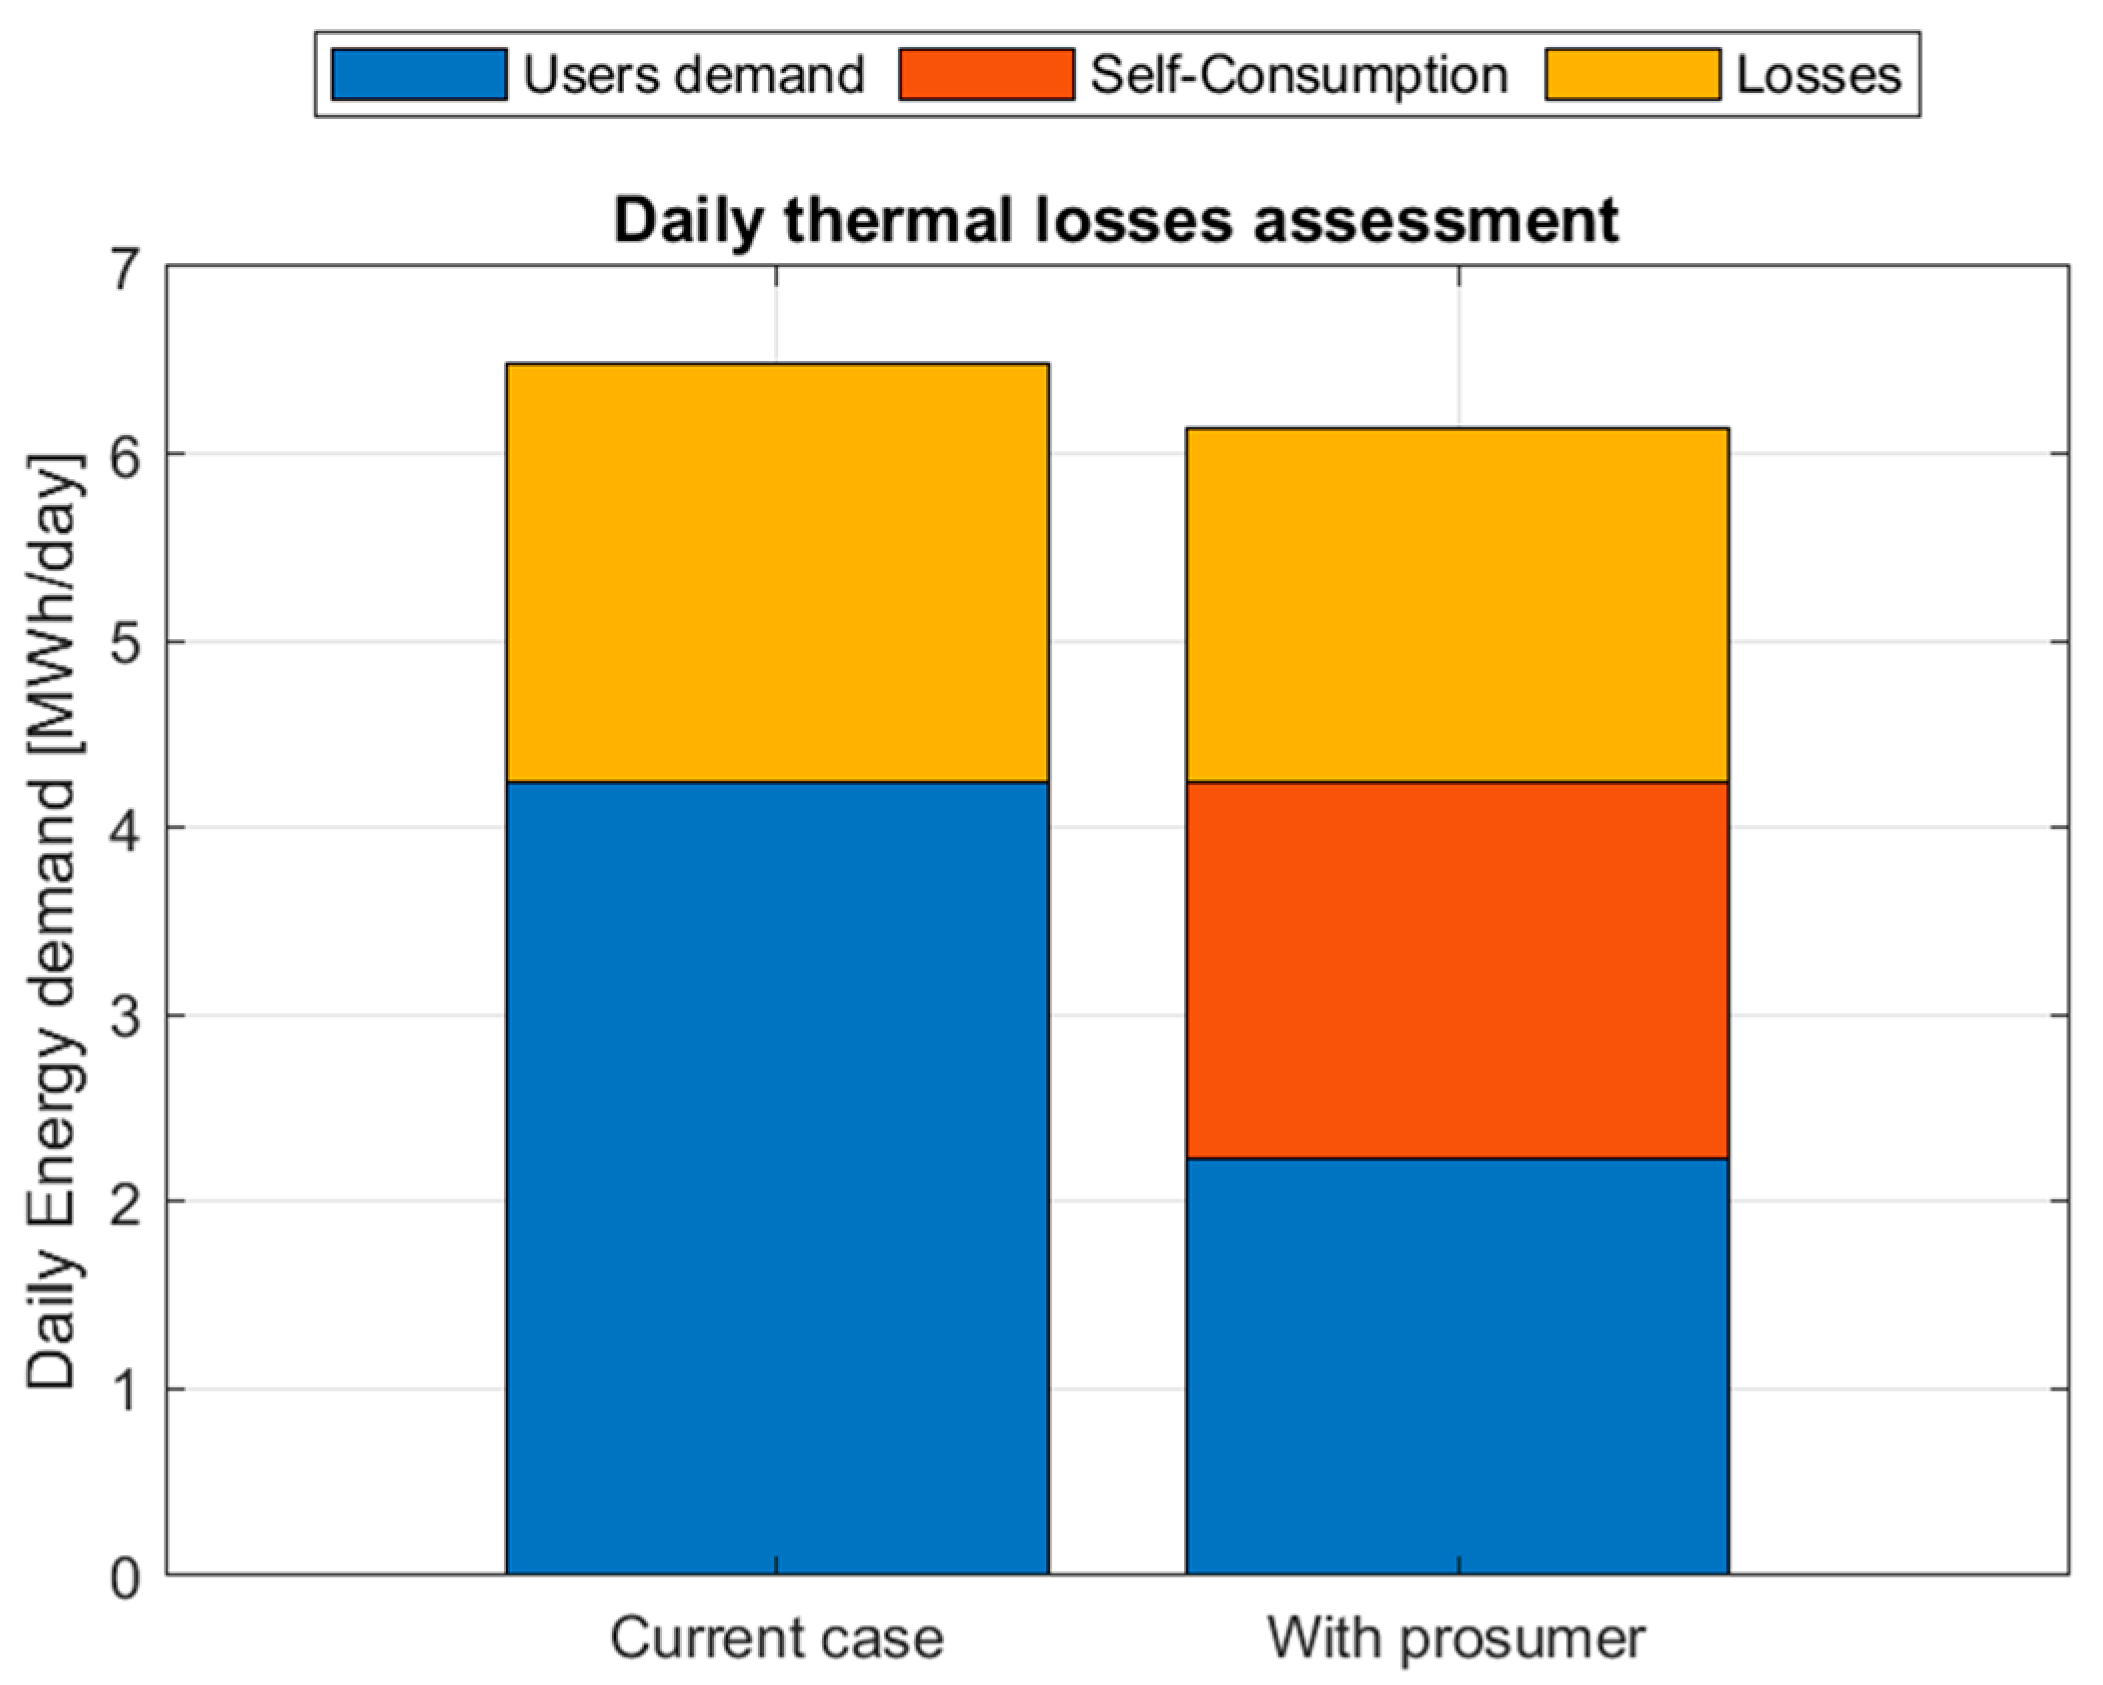
Further assessments have been made regarding the thermal losses on the distribution network, calculated with respect to the total energy supplied.
Figure 13 shows the comparison between the losses calculated on the simulated day in the current case and the losses that would be obtained with the installation of a thermal prosumer, which allows a reduction in the heat losses. In the left column the current case is represented: thermal losses in the distribution network account for 36% of the total energy supplied. With the integration of the prosumer, thermal losses are reduced and account for 30% of the total energy, which includes the energy supplied by the transport network, the energy supplied by the prosumer, and the self-consumption by the user.
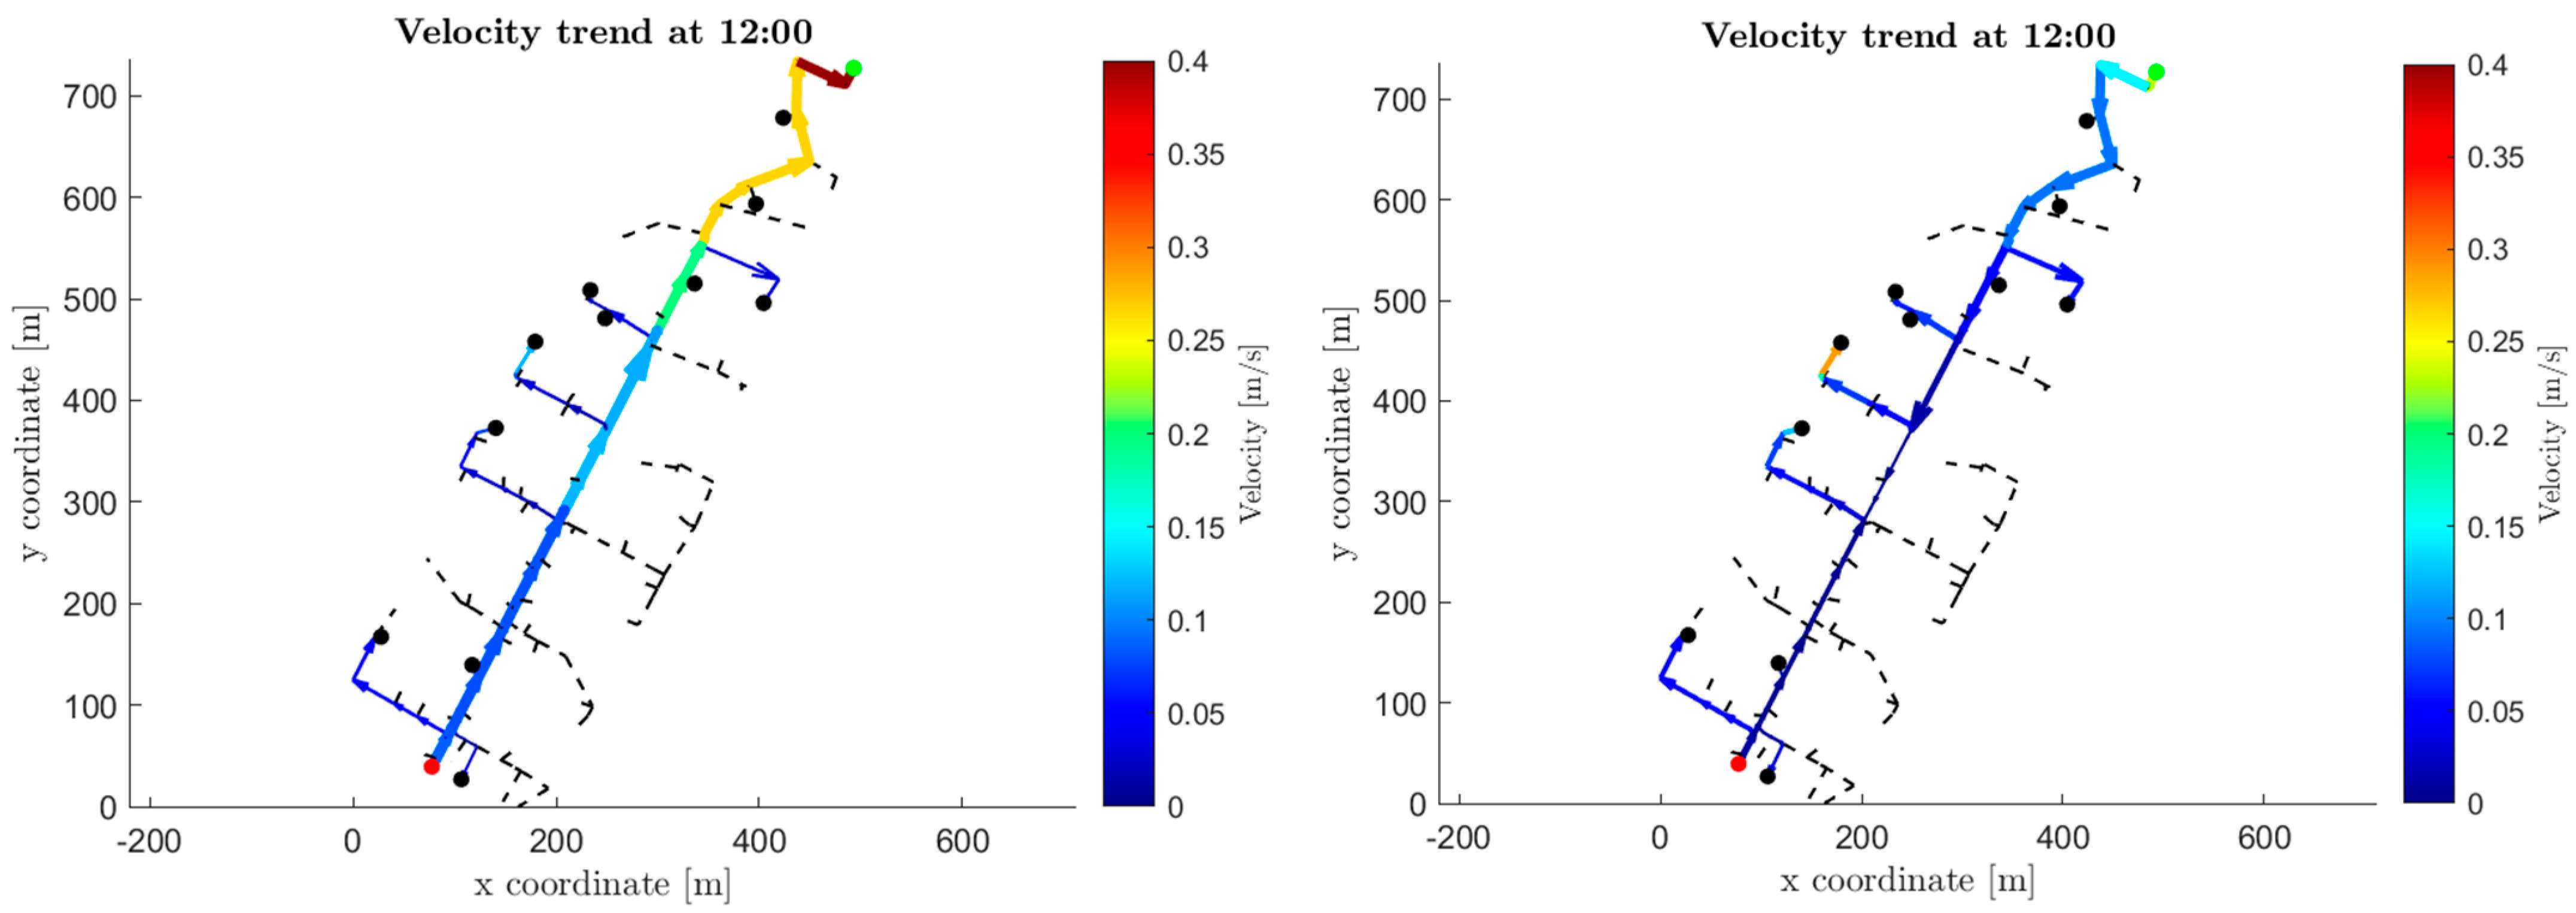
It is also interesting to evaluate the fluid velocity within the network, comparing the cases with and without prosumers. In
Figure 14 the comparison between the two cases is highlighted: with the insertion of the prosumer, the flow velocity along the network decreases with respect to the current configuration, due to the lower flow rate circulating through the network. In the current case, the velocity increases moving away from the transport network due to the progressive decrease in the diameter of the pipeline. With the integration of the prosumer, the flow rate circulating through the network is lower, contributing to a reduction in the flow velocity.
Although the present analysis focuses on summer operation, the proposed methodology can be extended to the winter season, when the district heating network operates at higher supply temperatures (around 120 °C) to meet both SH and DHW demands. Under these conditions, the prosumer would inject heat at a much lower temperature compared to the main network, resulting in a more pronounced difference between the two supply sources. Consequently, the increase in mass flow rate required to deliver the same thermal power would likely be greater than in the summer case. In addition, because of the higher overall demand, the user and network self-sufficiency levels are expected to decrease, as a larger share of the load must be covered by central production from the transport network. Seasonal operation also exhibits greater temporal variability during winter, with many users reducing or interrupting SH demand during night hours; therefore, the role of thermal storage and heat pump modulation becomes even more relevant to ensure stable operation and efficient energy use. These aspects will be further investigated in future work to assess the impact of prosumer integration throughout the entire yearly operation.
5. Conclusions
This work presented a thermo-fluid dynamic modeling framework for the analysis of the introduction of thermal prosumers in DH networks. The model was applied to a real large-scale DH system in Italy, focusing on the summer operating period. The methodology combines a thermo-fluid dynamic simulation of the DH network with a performance assessment through a set of Key Performance Indicators (KPIs) for evaluating energy self-consumption, export, and self-sufficiency at both user and network levels.
Two operating configurations were investigated: local sharing within the distribution network and export of surplus heat to the transport network, each analyzed with and without a small local thermal storage. A parametric study was also performed by varying the heat pump capacity, allowing an evaluation of the influence of the prosumer size on network behavior. The results show that the introduction of a thermal prosumer can substantially modify the thermo-hydraulic conditions of the distribution network, reducing the heat and mass flow required from the transport system and enhancing the level of energy autonomy of the users. Although the considered storage volume (5 m3) had a limited impact on overall summer seasonal performance, the analysis highlights that distributed generation operating at lower supply temperatures can effectively support the decarbonization and flexibility of existing DH systems.
The case study demonstrates the feasibility of integrating heat pump-based prosumers into conventional high-temperature networks and provides useful insights for future planning and operation of low-temperature, renewable-based DH infrastructures in urban contexts. Building on these results, future work will extend the analysis to different operating conditions, including winter periods, and investigate the possibility of achieving a partial independence of the distribution network from the transport system. Furthermore, the interplay between heat pump sizing, modulation strategy, and storage capacity can be explored to identify optimal configurations that enhance network flexibility and performance.
