Article

A Cluster-Based Filtering Approach to SCADA Data Preprocessing for Wind Turbine Condition Monitoring and Fault Detection

AGH University of Krakow, Faculty of Mechanical Engineering and Robotics, Department of Robotics and Mechatronics, al. Mickiewicza 30, 30-059 Krakow, Poland
*
Author to whom correspondence should be addressed.
Energies 2025, 18(22), 5954; https://doi.org/10.3390/en18225954 (registering DOI)
Submission received: 27 August 2025 / Revised: 7 November 2025 / Accepted: 8 November 2025 / Published: 12 November 2025
(This article belongs to the Special Issue Machine Learning in Renewable Energy Resource Assessment)

Abstract

The high cost of wind turbine maintenance has intensified the need for reliable fault detection and condition monitoring methods. While Supervisory Control and Data Acquisition (SCADA) systems provide valuable operational data, the raw signals often contain noise, outliers, and missing or redundant entries, which can compromise analysis accuracy. This study presents a novel cluster-based outlier removal approach for SCADA data preprocessing, featuring a unique flexibility to include or exclude negative power values—a factor rarely investigated but potentially critical for fault detection performance. The method applies the K-Means++ unsupervised clustering algorithm to group data points along the wind speed–power curve. The number of clusters is determined heuristically using the elbow method, while outliers are identified through Mahalanobis distance with thresholds derived from Chebyshev’s inequality theorem. The approach was validated using SCADA data from a wind farm in Portugal and further assessed with a CUSUM test-based structural change detection method to study how preprocessing choices—outlier thresholds (5% vs. 1%) and inclusion/exclusion of negative power values—affect early fault identification. Results demonstrate reliable fault detection up to 14 days before failure, retaining over 99% of the original dataset. This work provides key insights into preprocessing impacts on model reliability and offers an open-source Python implementation for reproducibility.

1. Introduction

In 2024, global wind power capacity continued to grow, with 117 GW of new installations—an 11% year-over-year increase—bringing the total capacity to 1136 GW [1]. Of this growth, 109 GW came from onshore wind projects, while offshore installations accounted for the remaining 8 GW. China is the world’s leader commissioner of wind power making almost 70% of the overall 2024 wind power growth. However, the growth of wind power installations slowed in 2024 due to macroeconomic pressures, including rising raw material and component costs as well as supply chain disruptions, which increased maintenance expenses and delayed turbine production [2]. Therefore, it is important to mitigate the unexpected downtimes of wind turbines to avoid unexpected costs and properly plan for maintenance [1]. Renewable energy sources account for more than 40% of global electricity production in 2024. While hydropower plants and nuclear power plants contributed 23.3% of the total generated electric power, wind and solar power plants produced 15% with wind power contribution at 8.1%. Other renewable energy sources like bioenergy and geothermal energy delivered 2.6% of global electricity in 2024. Solar and wind energy contributions to electricity generation are steadily increasing, while the shares from nuclear and hydropower are gradually declining. This trend reflects growing interest and investment in wind- and solar-based renewable energy sources [1].
According to a recent study [3], about one-fifth of the wind energy generation cost comes from operation and maintenance efforts over the turbine’s lifetime. Equipment failures lead to turbine downtime, directly impacting both revenue and electricity prices. To mitigate these effects, condition monitoring and early fault detection systems have been developed, aiming to identify issues proactively and reduce unplanned outages, as reported in the literature [4,5,6]. Generator, gearbox, and blade pitch systems are among the most failure-prone components in wind turbines, often causing unplanned downtime and expensive repairs [7]. Due to their high replacement costs, significant research efforts have been directed toward developing early failure detection methods specifically for these critical modules [8,9]. Condition monitoring and fault detection systems methodologies are divided into sensor-based, model-based, and SCADA-based data-driven approaches [10,11,12]. Sensor-based methods rely on signals from sensors that acquire operational data from a wind turbine and then process the data into meaningful information about equipment maintenance status. These methods encompass a wide range of techniques, including vibration analysis, acoustics, strain and torque measurements, oil property monitoring, image recognition, and electrical signal analysis [13]. However, implementing these approaches often incurs additional costs due to the need for installing auxiliary sensors. Additional equipment will increase operating costs due to the maintenance of sensor infrastructure and associated software. This is why SCADA-based approaches are widely preferred [14]. A Supervisory Control and Data Acquisition (SCADA) system collects and aggregates sensor and actuator data from wind turbines, enabling operators to make informed, data-driven decisions. SCADA allows for fault detection using fixed thresholds or by analyzing signal trends over time. Most wind turbines come equipped with proprietary SCADA systems, eliminating the need for additional sensors or wiring. Data is typically recorded at fixed intervals, often at a 1 Hz frequency, providing high-resolution monitoring and sensitivity to signal changes.
Condition monitoring and fault diagnosis techniques typically rely on classical statistical methods, machine learning approaches, or a combination of both [11,12]. Classical statistical techniques often use control charts and statistical process control to detect system failures or anomalies. The study in [15] introduced a statistical method for monitoring wind turbine generators by analyzing the deviation of an individual turbine’s behavior from the average performance of other turbines on the same wind farm. Four key operational parameters were assessed: electrical energy output, tower vibration, nacelle yaw, and gearbox temperature. Control charts were then employed to identify abnormal behavior in the monitored turbine. Approaches based on the autoregressive models are also widely used for wind turbine data analysis and forecasting. Multi-class autoregressive moving average models were employed to address the seasonality issue of wind turbine operating conditions and proved to achieve better model parameters estimation [16]. In recent years, many advanced statistical methods have been explored for wind turbine condition monitoring. Examples include probabilistic power curve estimation [17], multivariate statistical hypothesis testing [18], change-point detection techniques [19,20,21], cumulative sum (CUSUM)-based methods [22,23], Wilcoxon rank sum test-based method [24], and cointegration-based approaches [25,26,27,28,29]. These techniques offer efficient and cost-effective solutions for reliable monitoring, enabling timely fault detection and reducing turbine downtime. A recently proposed stationarity-based approach, introduced in [30] and based on the Augmented Dickey-Fuller (ADF) test [31], enables fault detection by identifying abrupt changes in the stationarity of SCADA signals over time, eliminating the need for predefined normal behavior models of the turbine. This method employed a sliding data window scheme, where anomaly detection is achieved through the successive accumulation of variations in signal stationarity within the moving window.
A hybrid approach of the seasonal autoregressive integrated moving average and deep-learning Long-Short Term Memory (LSTM) networks was examined to improve predictive accuracy of the model [32]. Classical models are restricted to linear and stationary problems. Therefore, non-linear models like gated recurrent unit neural networks were employed to capture non-linear phenomena of wind turbine data. Scholars are experimenting with hybrid models and combine methods and techniques from different fields of study to improve the overall performance of fault detection models. In [33], the authors proposed machine learning with statistical process control approach to study fault diagnosis in wind turbine data. In the study, check lists, Pareto charts, control charts, and other techniques were combined with machine learning algorithms, mainly decision tree and random forest classifiers, to predict failures in the machines. The results of this hybrid approach showed more than 90% accuracy in damage diagnosis [33]. Another hybrid approach aimed at improving the accuracy and predictability of wind turbine faults was presented in [34]. In this method, the authors employed extreme gradient boosting (XGBoost) and LSTM neural networks to model the characteristic behavior of critical wind turbine components. To assess anomalies, statistical process control techniques were applied. Validated using SCADA data from the ENGIE La Haute Borne wind farm, the method demonstrated the capability to predict critical failures up to two weeks in advance [34]. Recently, a hybrid approach combining machine learning techniques with cointegration analysis has been proposed for wind turbine condition monitoring and fault detection [35].
Recent research on early wear and failure detection in wind turbine gearboxes has shown that traditional methods may be insufficient for accurately identifying wear under real operating conditions. To address this, an unsupervised machine learning approach using an autoencoder architecture was employed to filter noise from image data [36]. The autoencoder, consisting of encoder and decoder modules, compresses input data and then reconstructs it, enabling clearer signal extraction. The processed data was then input into various deep learning models for evaluation and comparison [36]. For time-series forecasting, transformer models were used due to their strong performance; however, their high memory and computational demands, resulting from their quadratic complexity, posed challenges. To overcome this, the periodic-enhanced informer model was introduced, leveraging the inherent periodicity in wind turbine operational data to reduce algorithmic complexity and improve viability [37].
It is clear that the effectiveness of each method depends heavily on the quality of the data used. Typically, SCADA data is collected from various wind turbines in an unprocessed form, and applying models directly to raw data can lead to inaccurate or misleading results. Therefore, data preprocessing is a critical step in any data flow. Raw datasets often present several challenges beyond limited volume, including missing values, skewed distributions, unknown or mislabeled data, sampling errors, and non-stationarity. Addressing these issues through in-depth preprocessing is essential to ensure the reliability and accuracy of analytical models. One of the most impactful data issues affecting model performance is the presence of outliers [38]. Outliers are data points that significantly deviate from the majority of the dataset due to sensor malfunctions, calculation errors, or software defects. Although they are part of the raw data, their statistical properties differ emphatically from normal observations, which can distort analysis and reduce the accuracy of predictive models.
To ensure high model performance, outliers are typically identified and removed from the dataset [39]. However, the decision to exclude outliers depends on the specific application. For example, forecasting models generally require clean data, free from anomalies, to produce accurate predictions. In contrast, for condition monitoring and fault detection, retaining certain outlier samples might be valuable. A typical example involves negative power values in wind turbine operational data. While removing these values can enhance power forecasting accuracy, their role in fault detection remains less clear and has not been thoroughly investigated in the literature. Negative power may indicate turbine downtime due to faults, or simply reflect periods when the turbine draws power from the grid during low wind conditions without any malfunction. This brings forward the critical question of whether including or excluding negative power values impacts the reliability, accuracy, and overall effectiveness of models or methods developed for detecting abnormal turbine behavior.
Current state-of-the-art outlier processing methods generally fall into two main categories: statistical techniques and image-based approaches. Statistical methods evaluate data based on characteristics such as mean, variance, standard deviation, Z-scores, and K-sigma rules. One of the most commonly used techniques is the Interquartile Range (IQR) method, which identifies a sample as an outlier if the sum of the third quartile and the interquartile range of the data multiplied by the factor of 1.5 is smaller than the point where the sample is defined [40]. This approach effectively filters out data points that deviate significantly from the majority, helping to improve data quality for further analysis. Another method for outlier detection is based on Chebyshev’s inequality theorem, which states that at least 88.89% of data samples lie within three standard deviations from the mean, regardless of the data distribution [41]. Therefore, any sample falling outside this range can be classified as an outlier. Unsupervised learning methods, particularly data clustering techniques, are commonly used to identify and filter out outliers. These methods include division-based clustering, density-based clustering, model-based approaches, and others [42]. Additionally, image processing techniques have been applied for outlier removal, utilizing methods such as morphological transformations, edge detection, and pixel value thresholding [43,44,45]. Advanced data processing techniques have been developed to enhance outlier detection by integrating statistical and image processing methods. In [46], the authors proposed a three-stage outlier removal approach that combines physical rule-based filtering, the random sample consensus algorithm, and IQR thresholding. The final refinement was achieved using mathematical morphological image transformations. This hybrid method demonstrated high accuracy in detecting outliers across multiple wind turbine datasets.
The method proposed in this paper uses a cluster-based outlier detection approach. It employs the K-Means++ unsupervised machine learning algorithm to group data points along the wind speed–power curve of a wind turbine. The number of clusters, a required parameter for the algorithm, was determined heuristically using the elbow method. Outliers were then identified by applying a threshold derived from Chebyshev’s inequality theorem. Data points falling outside the acceptable range, based on their Mahalanobis distance from cluster centers, were removed from the dataset. The proposed approach introduces a distinctive flexibility that allows users to include or exclude negative power values—an aspect rarely explored but potentially crucial for improving fault detection performance. The method was validated using real SCADA data from a Portuguese wind farm and evaluated through a CUSUM test-based structural change detection technique. The results offer new insights into how negative power values influence model reliability and the accuracy of early fault detection.
The remainder of this paper is organized as follows. Section 2 introduces a novel cluster-based filtering approach for SCADA data preprocessing, aimed at enhancing condition monitoring and fault detection in wind turbines. Section 3 presents the Energias de Portugal wind farm, and the publicly available SCADA dataset used to validate the proposed filtering method. The cleaned dataset, which includes a real generator fault event, is then used to demonstrate the effectiveness of a CUSUM-based fault detection technique, further validating the applicability of the preprocessing approach. The results are presented and discussed in Section 4. Finally, the conclusions are given in Section 5.

2. A Cluster-Based Filtering Approach to SCADA Data Preprocessing

The K-Means algorithm is an unsupervised machine learning method that partitions data points into clusters based on their similarity, measured using the Euclidean distance. For each data point, the distance to a cluster’s centroid is calculated, and points are assigned to the nearest centroid. The algorithm optimizes clustering by minimizing the sum of squared distances within each cluster. It operates iteratively, starting with randomly initialized centroids and updating their positions until convergence is reached. The algorithm requires the number of clusters to be specified in advance. Initialization of centroids can be done randomly or through more efficient sampling strategies, such as K-Means++. The method is widely applied because of its simplicity, scalability, and fast execution, achieving near O(log N) complexity. K-Means++ improves the initialization phase, leading to faster convergence and often better clustering results, while keeping the complexity close to that of standard K-Means. These features make it particularly suitable for processing SCADA data, which is collected at short time intervals. In this study, the method is applied to wind turbine SCADA data to address the challenge of outlier detection, thereby enhancing overall data quality. The number of clusters is typically determined heuristically using methods such as the elbow method [47,48] or silhouette analysis [49]. In this study, the elbow method was applied. This approach evaluates a scatter plot of the within-cluster sum of squares against the number of clusters. Since the algorithm always converges and the plot decreases monotonically, a point can usually be observed where the slope begins to flatten. These “elbow” points are used for determining the appropriate number of clusters. Choosing more clusters can improve accuracy, but it also increases computational cost.
Figure 1 presents the flowchart of the cluster-based outlier removal method used to preprocess wind turbine SCADA data. The algorithm is applied separately to the dataset of each turbine in the wind farm. A key feature of the proposed approach is its flexibility in either including or excluding negative power values, enabling an in-depth investigation of how such values affect the reliability, accuracy, and effectiveness of different methods for detecting abnormal turbine behavior.
  • The workflow starts by identifying negative power samples in the generated power parameter of the dataset. These identified rows are stored separately for later use and removed from the main table to allow focused processing of variables relevant to outlier detection. The preserved negative samples retain their original indices, ensuring they can be seamlessly reintegrated with the processed dataset later without requiring reindexing.
  • The data containing only nonnegative generated power samples is then grouped into clusters using the K-Means++ algorithm. The optimal number of clusters is determined using the “Elbow method,” where the within-cluster sum of squares is plotted against the number of clusters. This plot enables a heuristic decision, balancing cluster compactness with computational efficiency. The cutoff point at which the metric is achieving steady state is typically selected as the desired number of clusters. Each cluster is represented by its centroid, which corresponds to the mean value of all data points within that cluster.
  • To detect outliers, a criterion is established to determine whether a data sample deviates abnormally from others in the same cluster. The measure used is the distance between the cluster’s centroid and the sample under examination. In this approach, the Mahalanobis distance is employed, as it accounts for potential skewness in the data distribution. A sample is classified as an outlier if its distance exceeds a predefined threshold.
  • In this study, the outlier detection threshold is set to three standard deviations (three sigma). Any sample with a distance exceeding this threshold is classified as an outlier and subsequently removed from the dataset. To evaluate the impact of outliers on the fault detection process, this study applies two threshold settings: a 95% confidence interval, which excludes 5% of samples per cluster, and a 99% confidence interval, which excludes 1% of samples per cluster.
  • Finally, for this study, the negative power samples are either merged back into the filtered dataset or excluded entirely. This process produces two distinct cleaned datasets—one including negative power values and one without—both free from outliers.

3. Case Study: Energias de Portugal Wind Farm

3.1. A Short Description of the Wind Farm

The wind farm SCADA data [50] under study consists of four identical wind turbines (T01, T06, T07, and T11), each rated at 2 MW and equipped with planetary gearboxes and asynchronous generators. These turbines operate within a wind speed range of 4 m/s (cut-in) to 25 m/s (cut-out). SCADA data were collected over a two-year period, spanning from 1 January 2016, to 31 December 2017, with measurements taken every 10 min. Some timestamps are without data, likely due to operational downtimes or events such as generator replacements. The dataset comprises 417,093 data samples across 84 variables, including turbine identifiers, timestamps, and a wide range of operational and environmental indicators, such as rotor and generator speeds, bearing and gearbox temperatures, power output, wind characteristics, ambient temperature, and so on. It also includes operational status, alarm codes, and failure logs. The failure records specify the turbine involved, the date and time of the incident, the affected components, and additional remarks. Over the two years, 27 failures were recorded, with a higher frequency occurring in the second half of each year.

3.2. Data Preprocessing Results for Wind Turbines

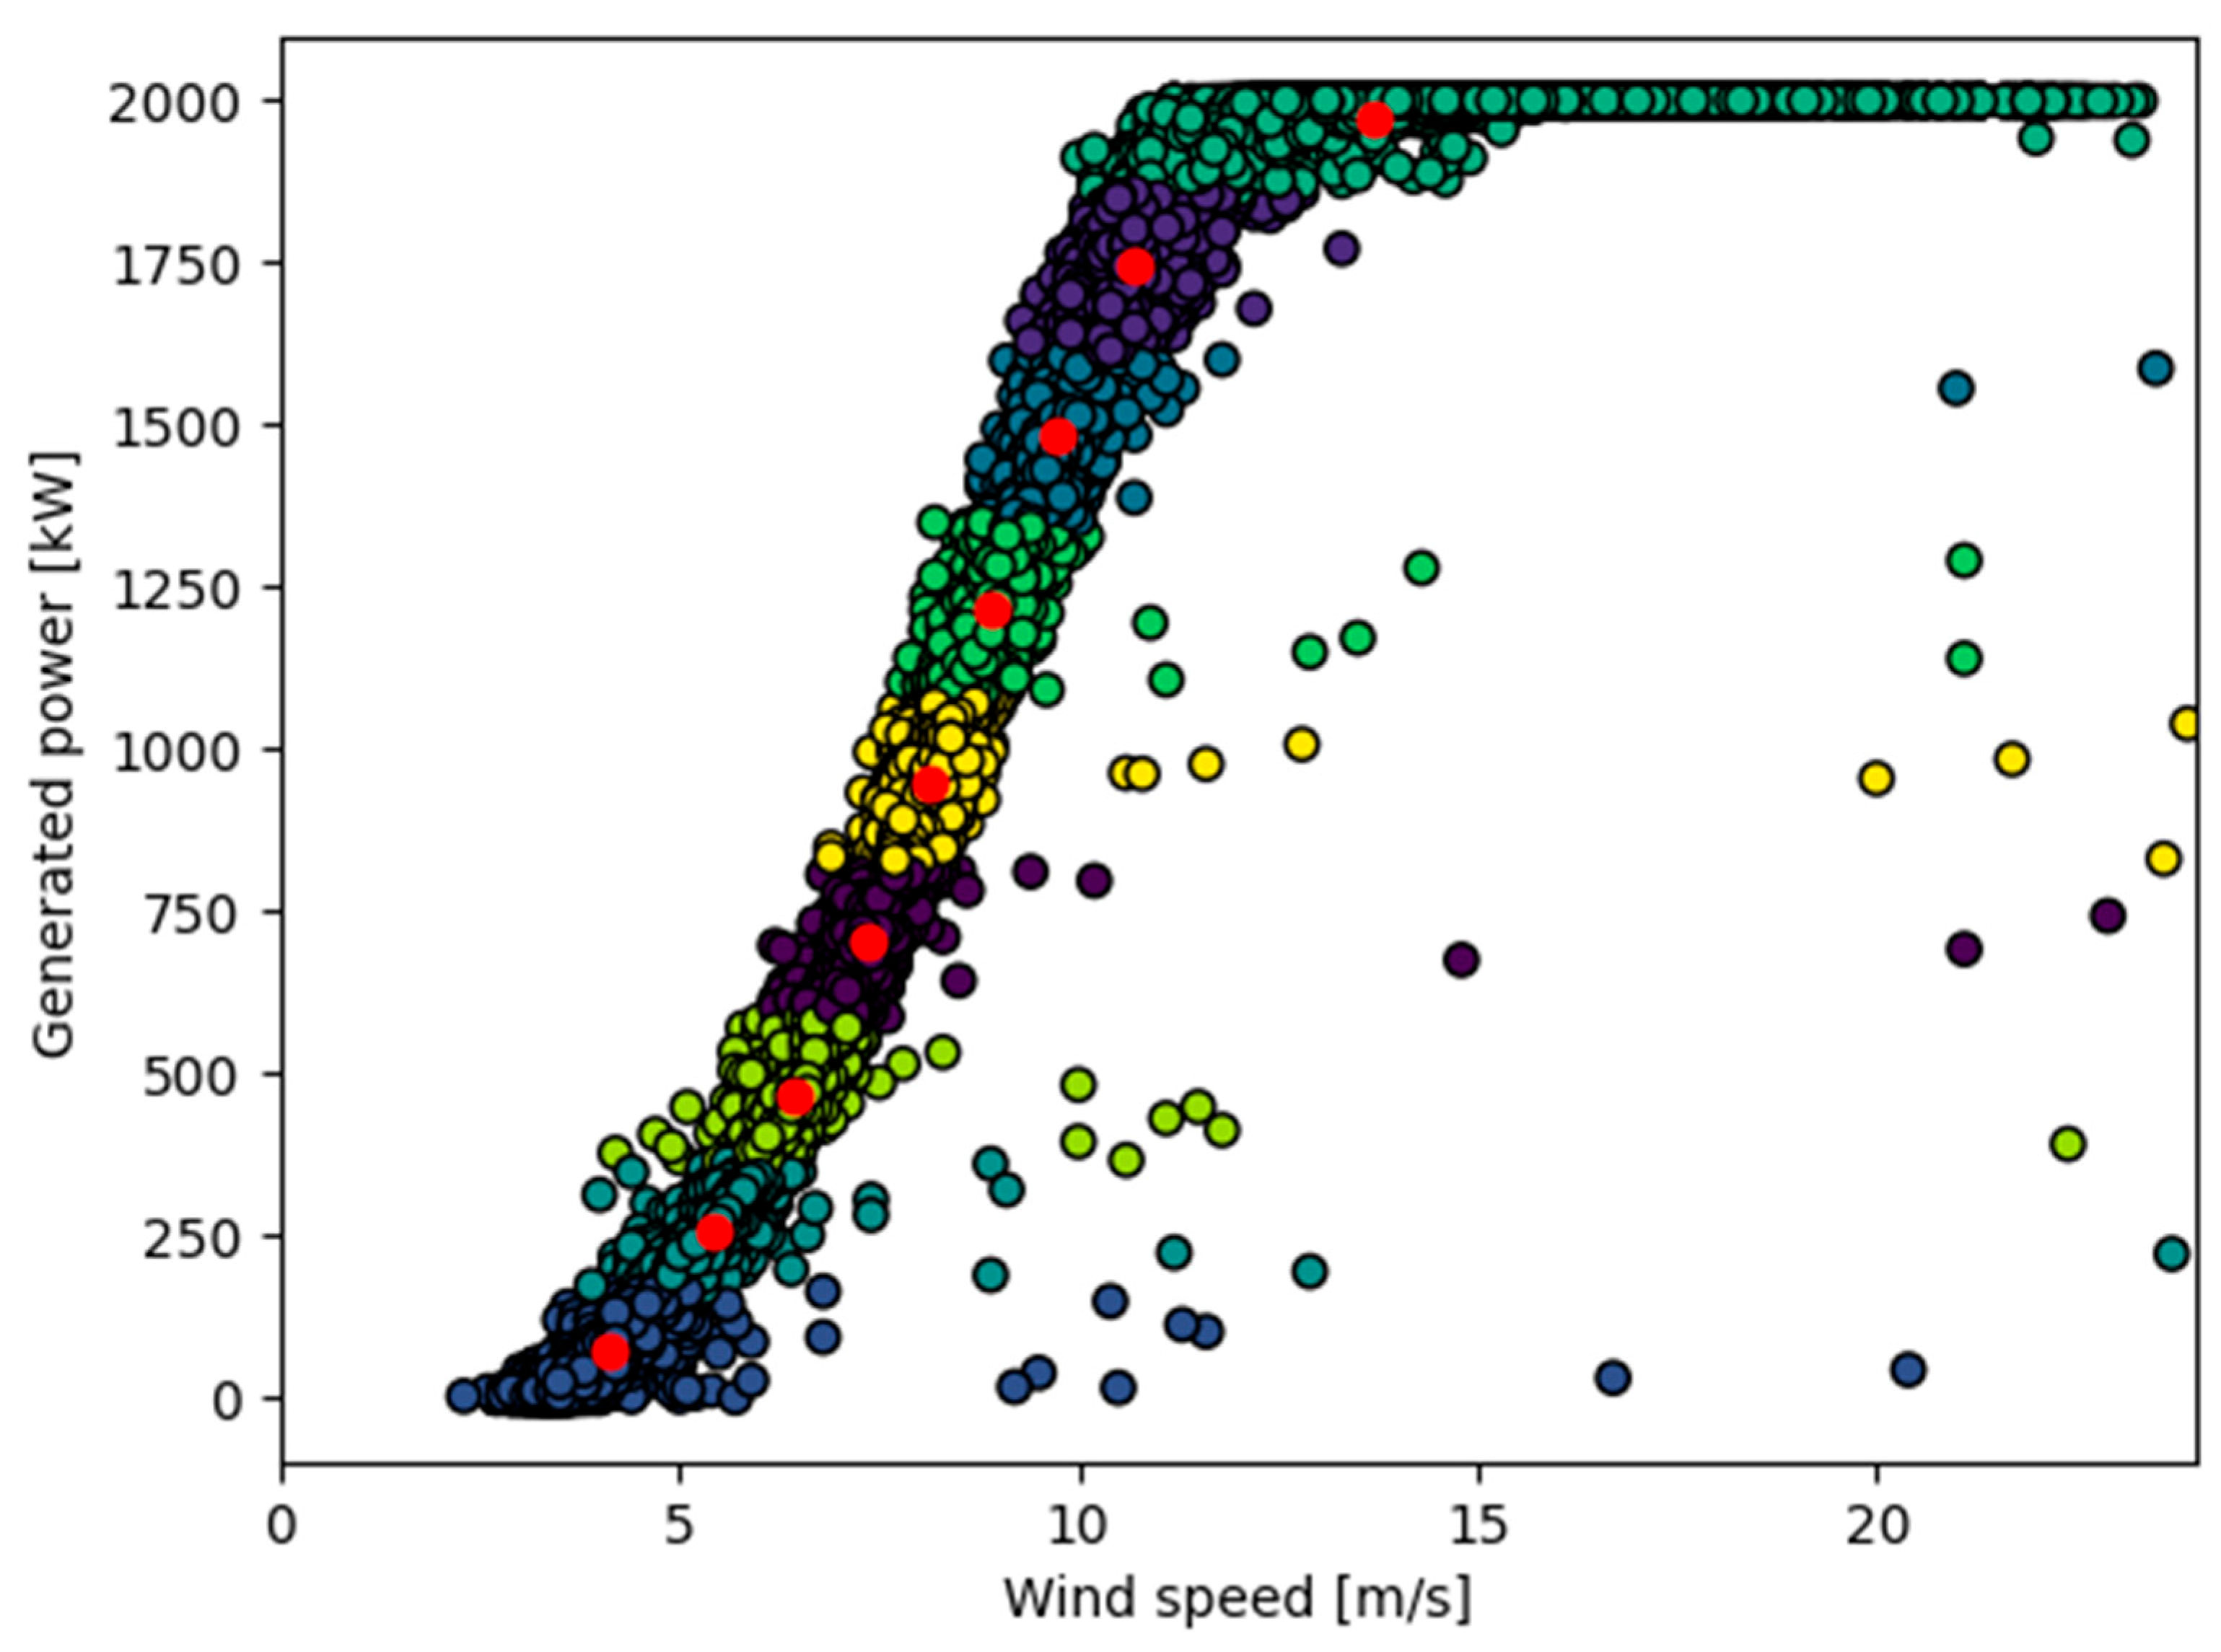
The cluster-based filtering procedure described in Section 2 was applied to the wind farm SCADA dataset. Figure 2 presents representative results obtained for wind turbine T07 based on its 2017 operational data. This turbine experienced a real generator fault, which is described in Section 4 and used as a case study to validate the proposed method. In this study, the number of clusters was determined heuristically using the elbow method, resulting in the selection of nine clusters, as demonstrated in Figure 2.
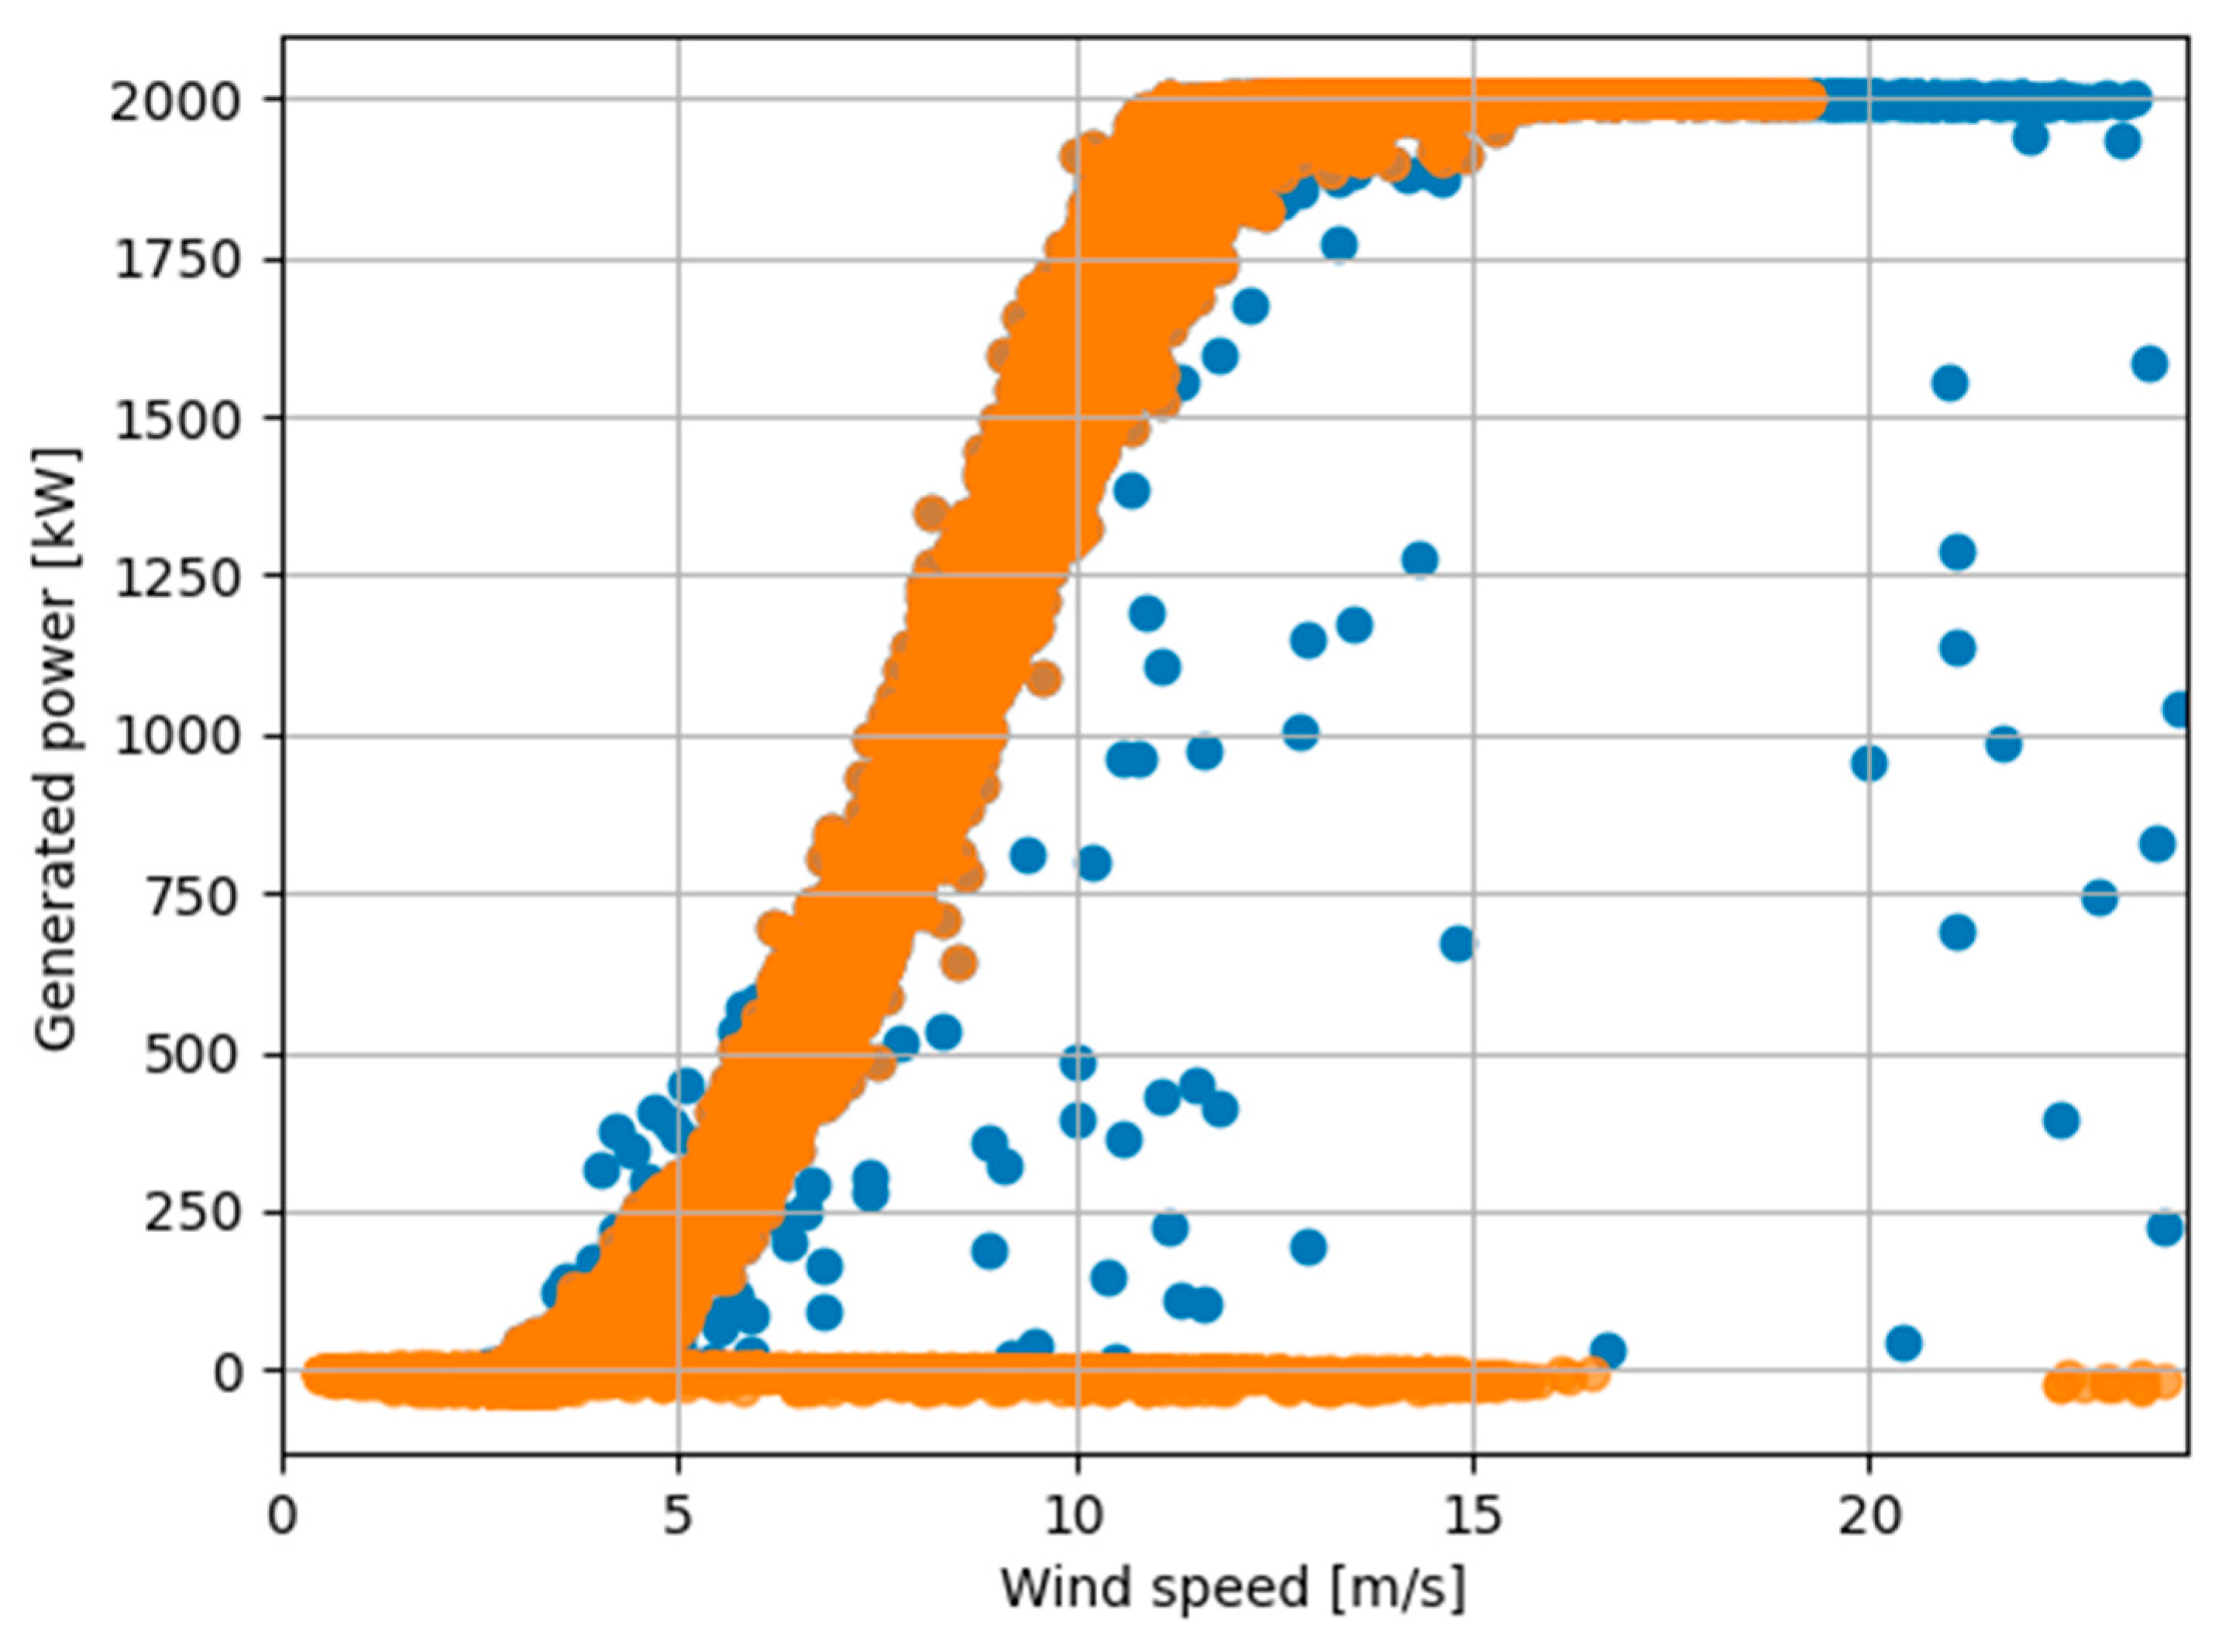
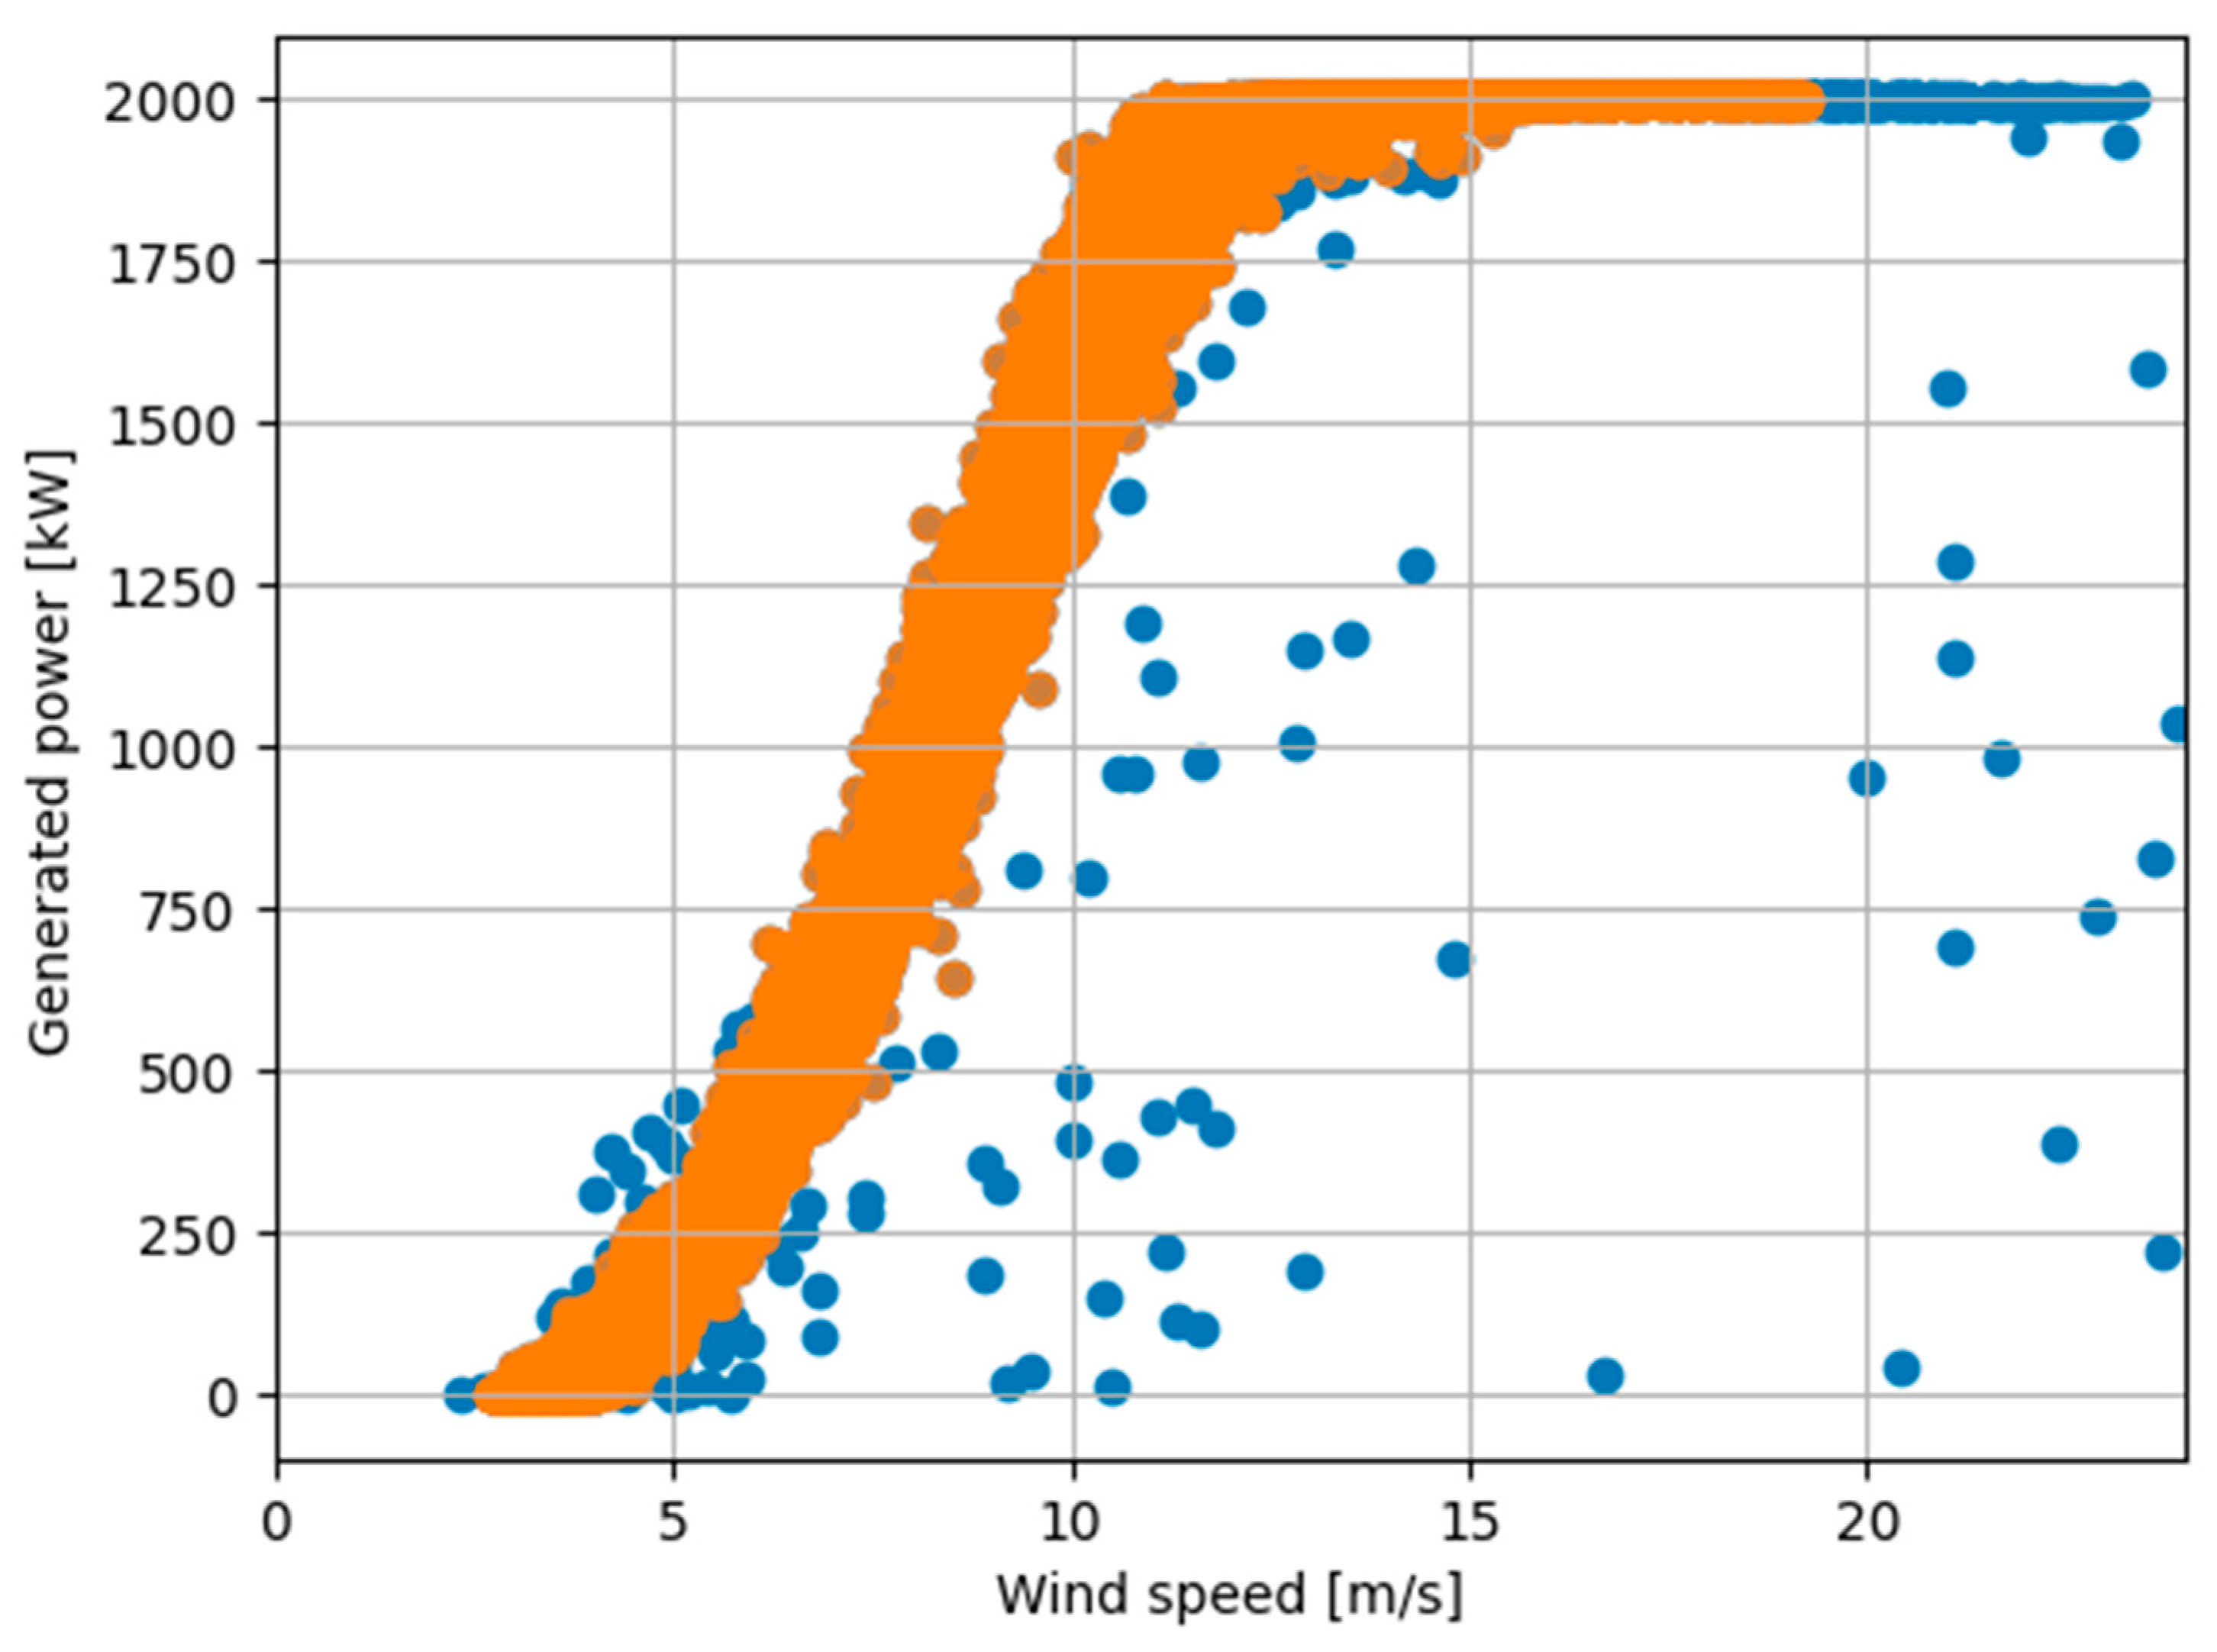
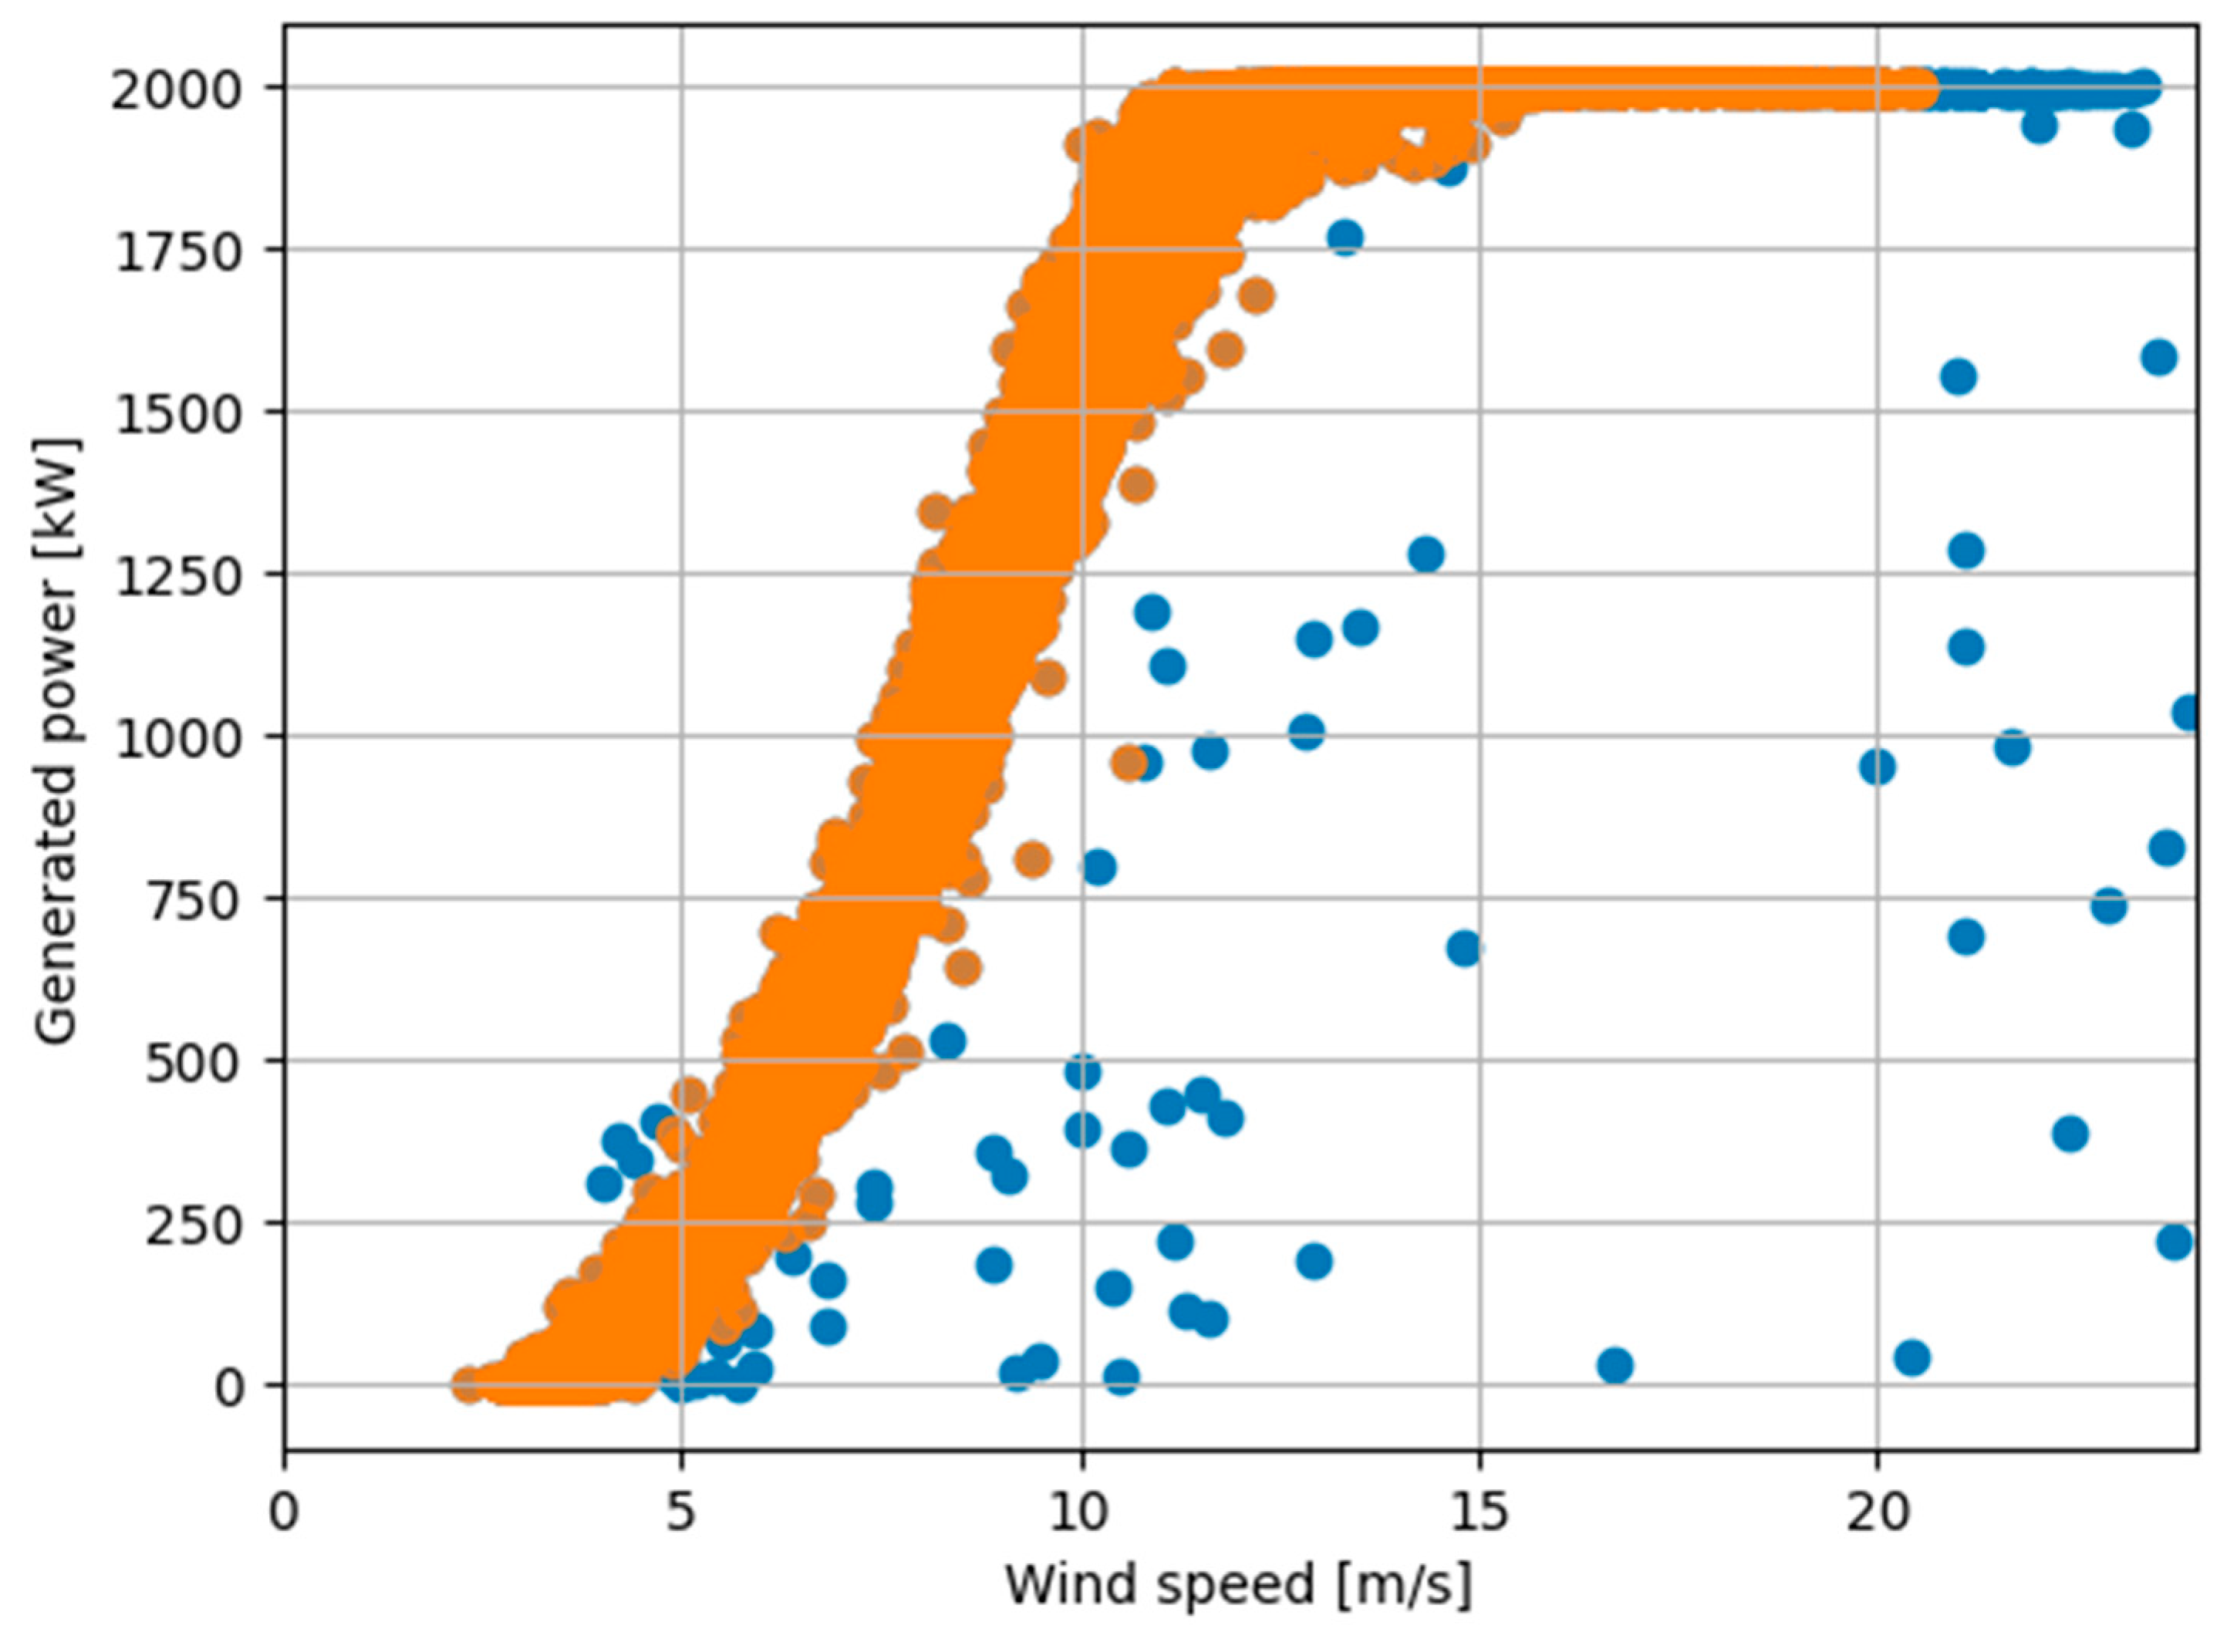
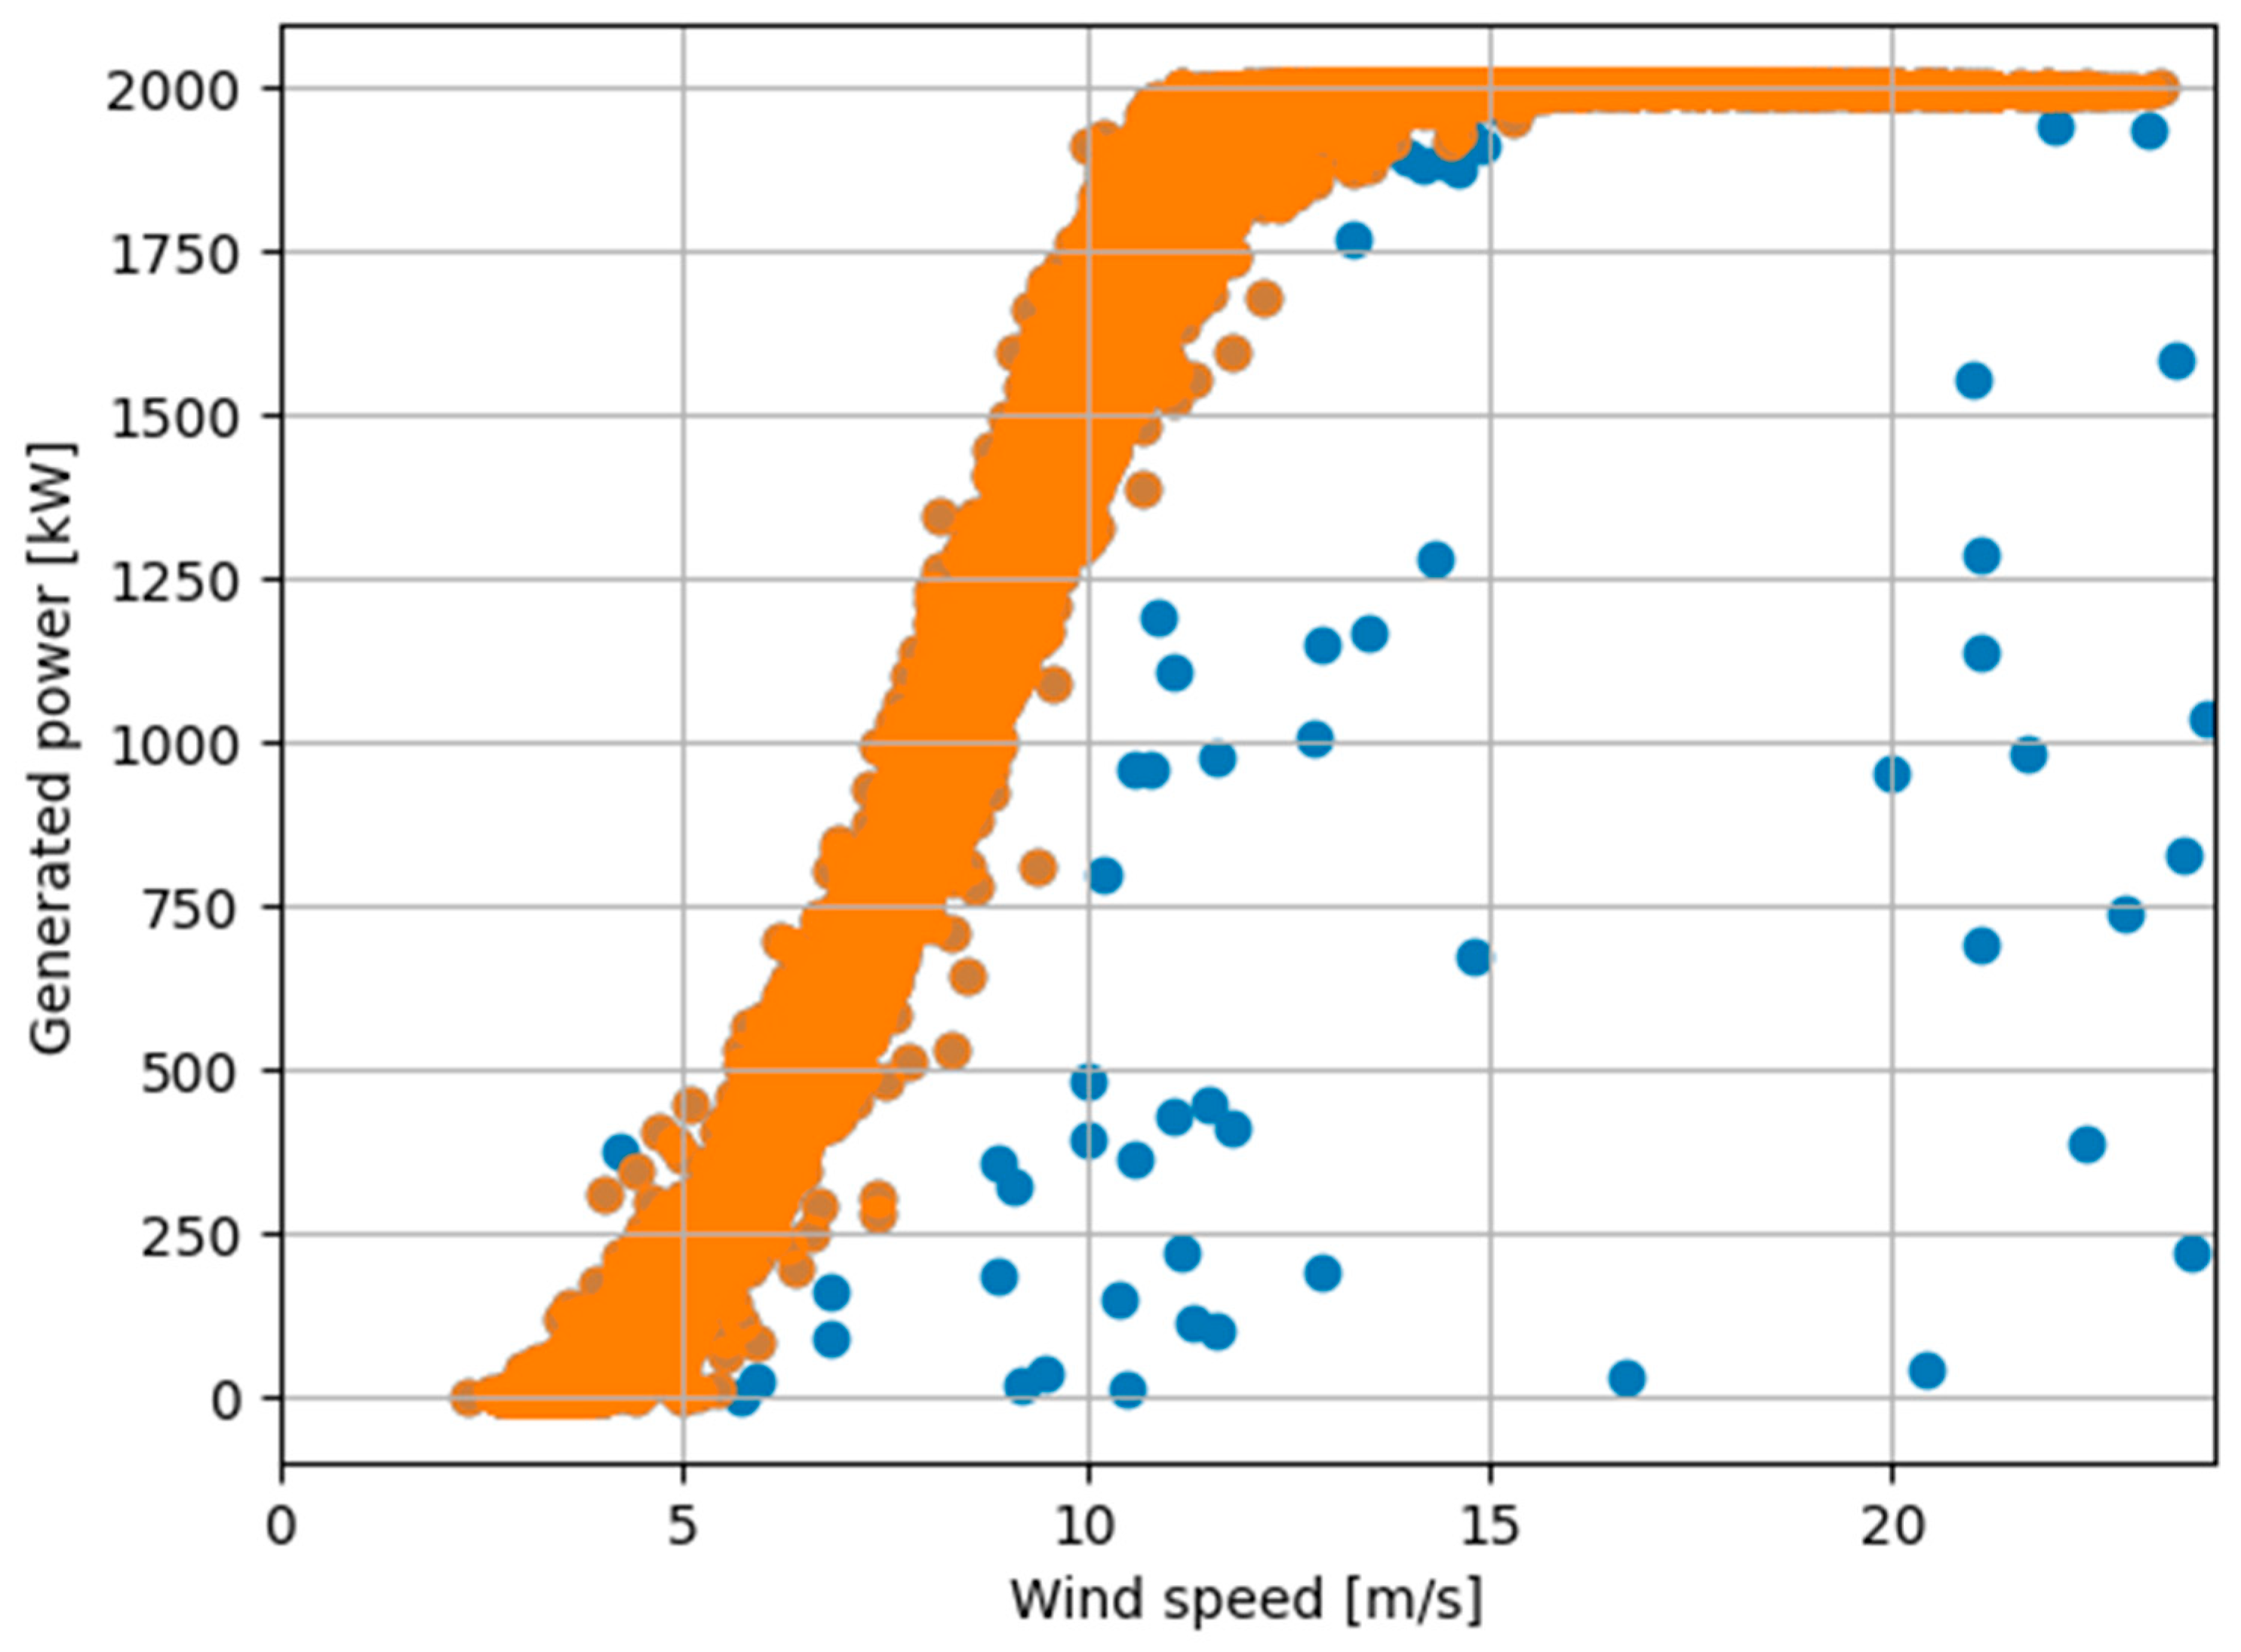
As discussed in the introduction, a key objective of this study is to investigate how including or excluding negative power values affects the reliability, accuracy, and effectiveness of methods (or models) for detecting abnormal turbine behavior. To address this, several combinations of confidence intervals were tested under two scenarios: with negative power values included and with them removed. Figure 3 and Figure 4 display the filtered power curves for T07 including negative power values, using 95% and 99% confidence intervals, respectively. Figure 5 and Figure 6 show the corresponding results when negative power values are excluded.

4. Validation Using a Real Generator Fault

This section validates the proposed cluster-based filtering approach using a real generator fault from wind turbine T07. The CUSUM test-based method for detecting structural changes in SCADA data, originally developed in [22], is applied to assess how the inclusion or exclusion of negative power values, together with different outlier removal levels (i.e., excluding 5% or 1% of samples per cluster), influence the method’s reliability, accuracy, and ability to detect the T07 generator fault at an early stage.

4.1. Description of a Real Generator Fault in Wind Turbine T07

This case study examines two consecutive generator faults that occurred in wind turbine T07. The fault data were extracted from historical SCADA failure logs supplied by the wind farm operator, which include detailed timestamps of reported failures along with the corresponding turbine identifiers and affected components. The first issue (a generator bearing failure) was recorded on 20 August 2017, at 06:08 (sample 32,730). Roughly 32 h later, a second and more critical generator fault was logged on 21 August 2017, at 14:47 (sample 32,920). Figure 7 illustrates the turbine’s power output for August 2017, with clear markers indicating the failure events and the recovery point. A detailed overview of both faults, including their designated fault IDs, is shown in Table 1. Notably, the recovery of the turbine is estimated to have occurred on 28 August 2017, at 20:30 (sample 33,930), which is about 8 days and 14 h after the initial fault (F1).

4.2. CUSUM Test-Based Method for Detecting Structural Changes in SCADA Data

The CUSUM test is a widely used technique in statistics and econometrics for detecting changes or structural breaks in the coefficients of a multiple linear regression (MLR) model. The general form of the MLR model is expressed as:
y t = β 0 + β 1 t x 1 t + β 2 t x 2 t + + β p t x p t + ε t , t = 1 , , T ,
This can be rewritten more compactly as:
y t = x t β t + ε t , t = 1 , , T ,
where y t is the dependent variable, x t = 1 , x 1 t , , x p t is a vector of predictor variables, β t = β 0 , β 1 t , , β p t T represents the time-varying regression coefficients, ε t denotes the error term, assumed to follow a normal distribution with zero mean and constant variance σ 2 . The intercept β 0 reflects the expected value of the output when all predictors are zero, while the slope coefficients β 1 t , , β p t indicate the effect of each predictor on the response variable.
The CUSUM test detects coefficient instability by examining the cumulative sum of recursive residuals, which are calculated from sequential regressions on growing subsets of the data. These recursive residuals are defined as follows [51]:
w r = y r x r β ^ r 1 1 + x r X r 1 X r 1 1 x r ,   r = k + 1 , , T ,
where k is the number of regression coefficients, X r = x 1 , x 2 , , x r , and β ^ r = X r X r 1 X r y r represents the Ordinary Least Squares (OLS) estimate of the regression parameters based on the first r observations.
The CUSUM test statistic is the cumulative sum of standardized recursive residuals [51]:
W r = t = k + 1 r w t σ ^ ,   r = k + 1 , , T ,
where σ ^ is the estimated standard deviation of residuals, computed by:
σ ^ = t = 1 T y t x t β ^ r 2 T k
The hypothesis test is defined as:
  • Null hypothesis ( H 0 ): The regression coefficients remain constant throughout the sample.
  • Alternative hypothesis ( H 1 ): The coefficients vary over time, implying structural instability.
The CUSUM test decision rule is:
  • If the CUSUM statistic W r crosses the critical boundaries, reject H 0 (indicating instability of regression coefficients).
  • Otherwise, do not reject H 0 (i.e., regression coefficients are stable).
The critical bounds are linear lines connecting the points k , ± a T k and T , ± 3 a T k , where T is the total number of observations, k is the number of coefficients, a is a constant determined by the desired significance level (e.g., a = 0.948 for 5%, a = 1.143 for 1%). The sequence of CUSUM test statistics is utilized as a fault-sensitive indicator and displayed on a control chart. This visualization aids in interpreting the outcomes of hypothesis testing and supports effective real-time monitoring and fault detection. The chart is defined by upper and lower threshold boundaries that form a critical region—if the CUSUM statistic crosses these boundaries, it indicates the occurrence of a potential fault in the wind turbine system.
It is worth noting that the CUSUM test was originally introduced in the statistics and econometrics literature by Brown et al. in 1975 [52], although research on structural break or change-point detection dates back to the seminal work of Chow in 1960 [53]. More recently, the study in [54] has shown that combining change-point detection techniques with trend monitoring can improve diagnostic performance for wind turbines. This integration leverages the complementary strengths of both approaches while helping to overcome their individual limitations.
In this case study, SCADA data capturing power curve dynamics and critical subsystem temperatures were utilized for condition monitoring and fault detection in wind turbines. A multiple linear regression model was developed specifically for use with the CUSUM-based method. The model includes eight independent variables: generated power ( x 1 t ), wind speed ( x 2 t ), generator phase 1 temperature ( x 3 t ), hydraulic oil temperature ( x 4 t ), temperatures of generator bearings 1 and 2 ( x 5 t and x 6 t ), gearbox oil temperature ( x 7 t ), and gearbox bearing temperature ( x 8 t ). Generator speed was selected as the dependent variable ( y t ) to reflect the system’s operational response. The MLR model has the form:
y t = β 0 + β 1 t x 1 t + β 2 t x 2 t + β 3 t x 3 t + β 4 t x 4 t + β 5 t x 5 t + β 6 t x 6 t + β 7 t x 7 t + β 8 t x 8 t + ε t

4.3. Fault Detection Results

To assess the effectiveness of the CUSUM test-based method in identifying early fault indications, SCADA data collected before the fault events were analysed. Specifically, samples in the range from T1 = 30,292 (3 August 2017, at 00:00) to T2 = 31,977 (14 August 2017, at 23:50)—covering the period from about 18.5 to 6.5 days prior to the occurrence of fault F2—were analysed by the method.
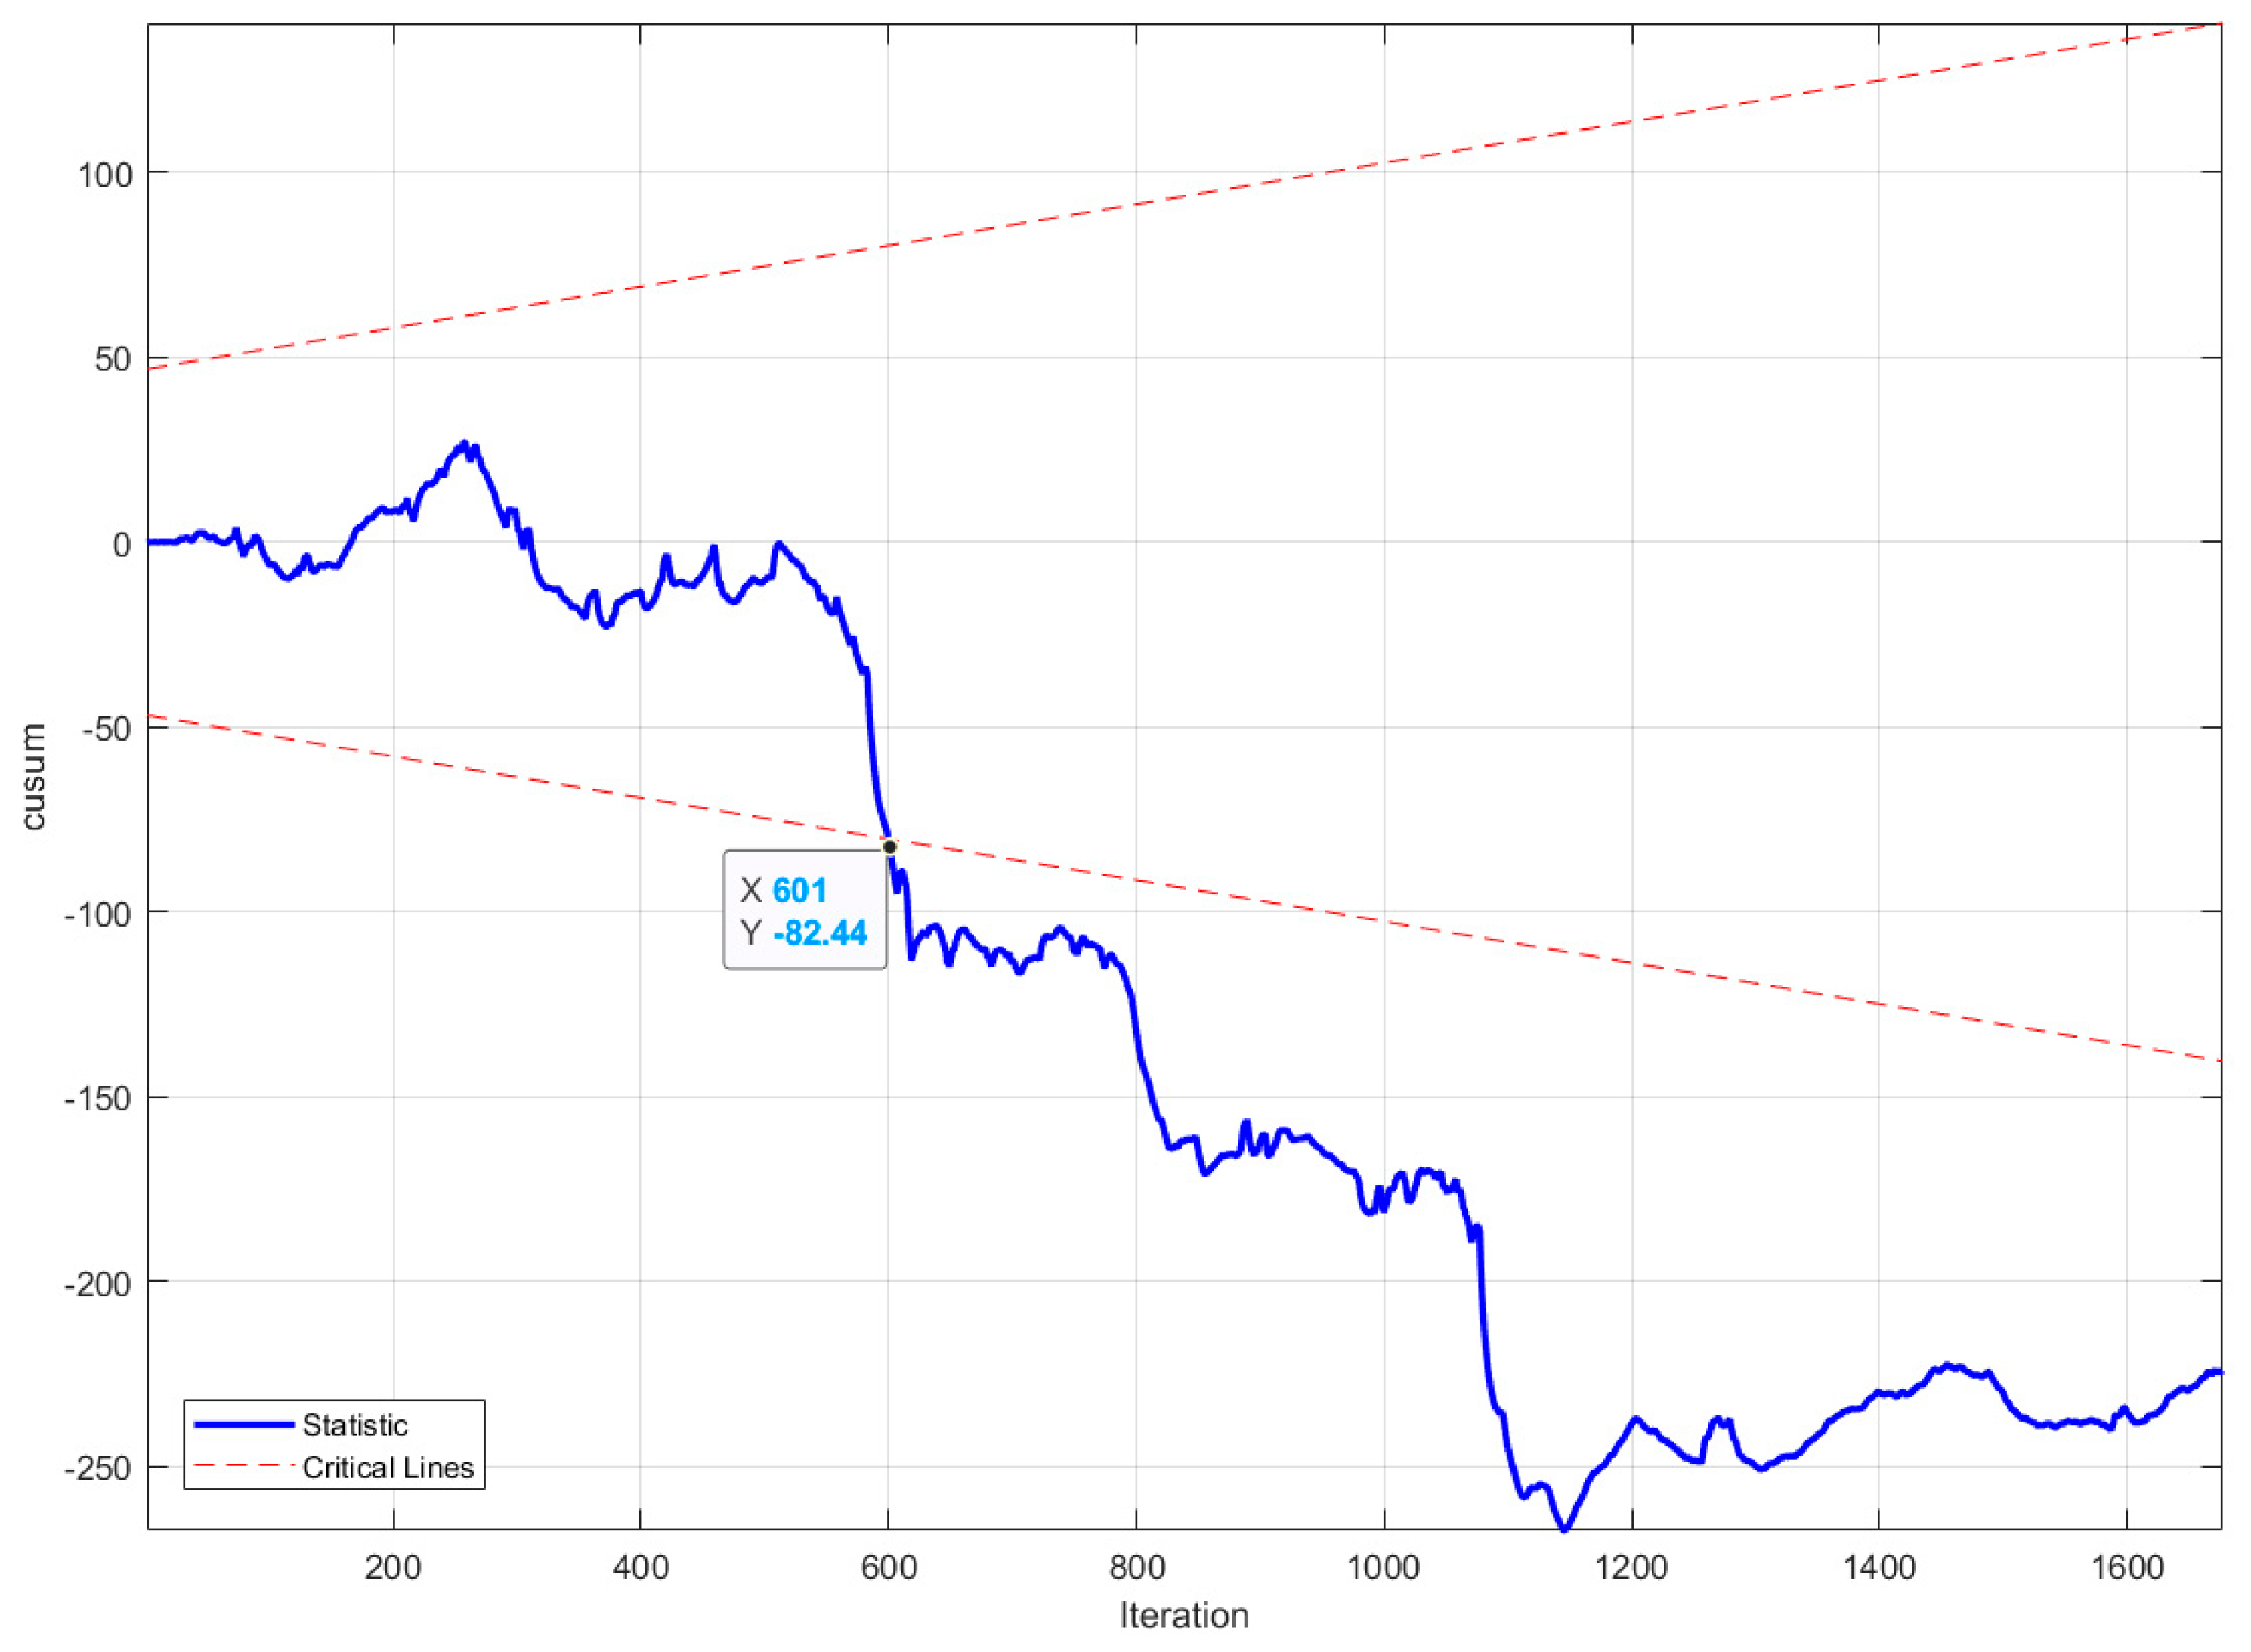
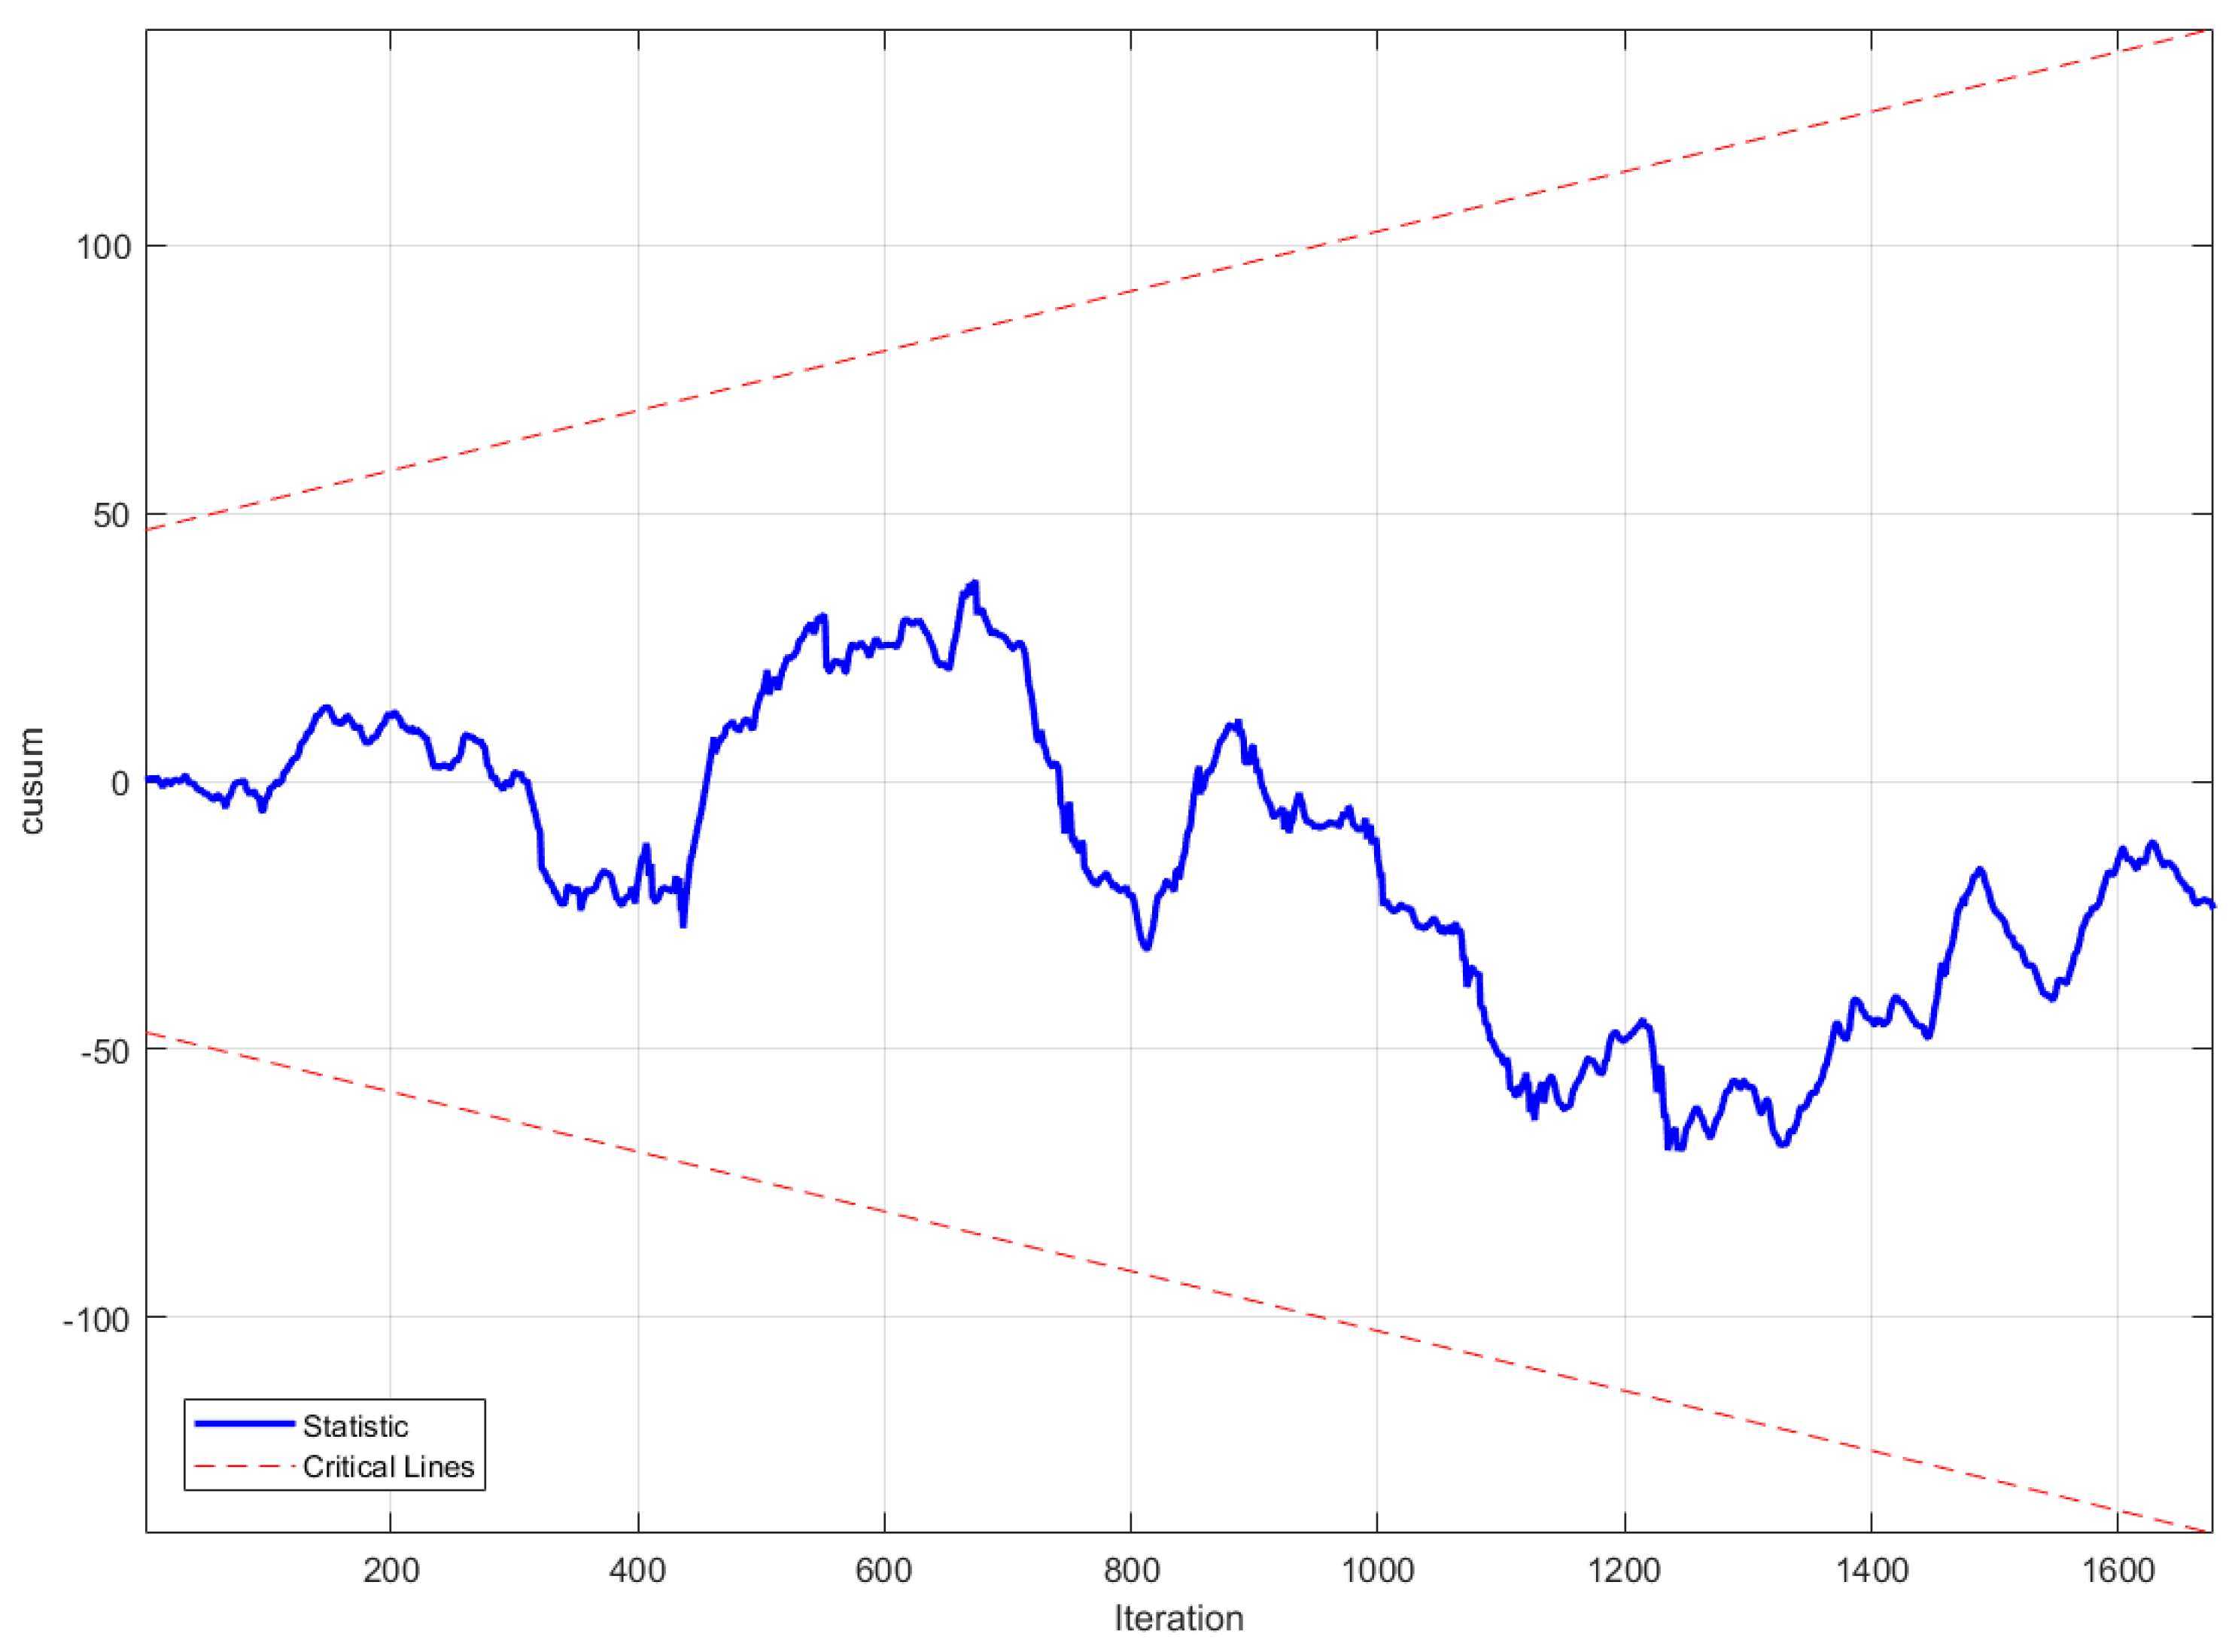
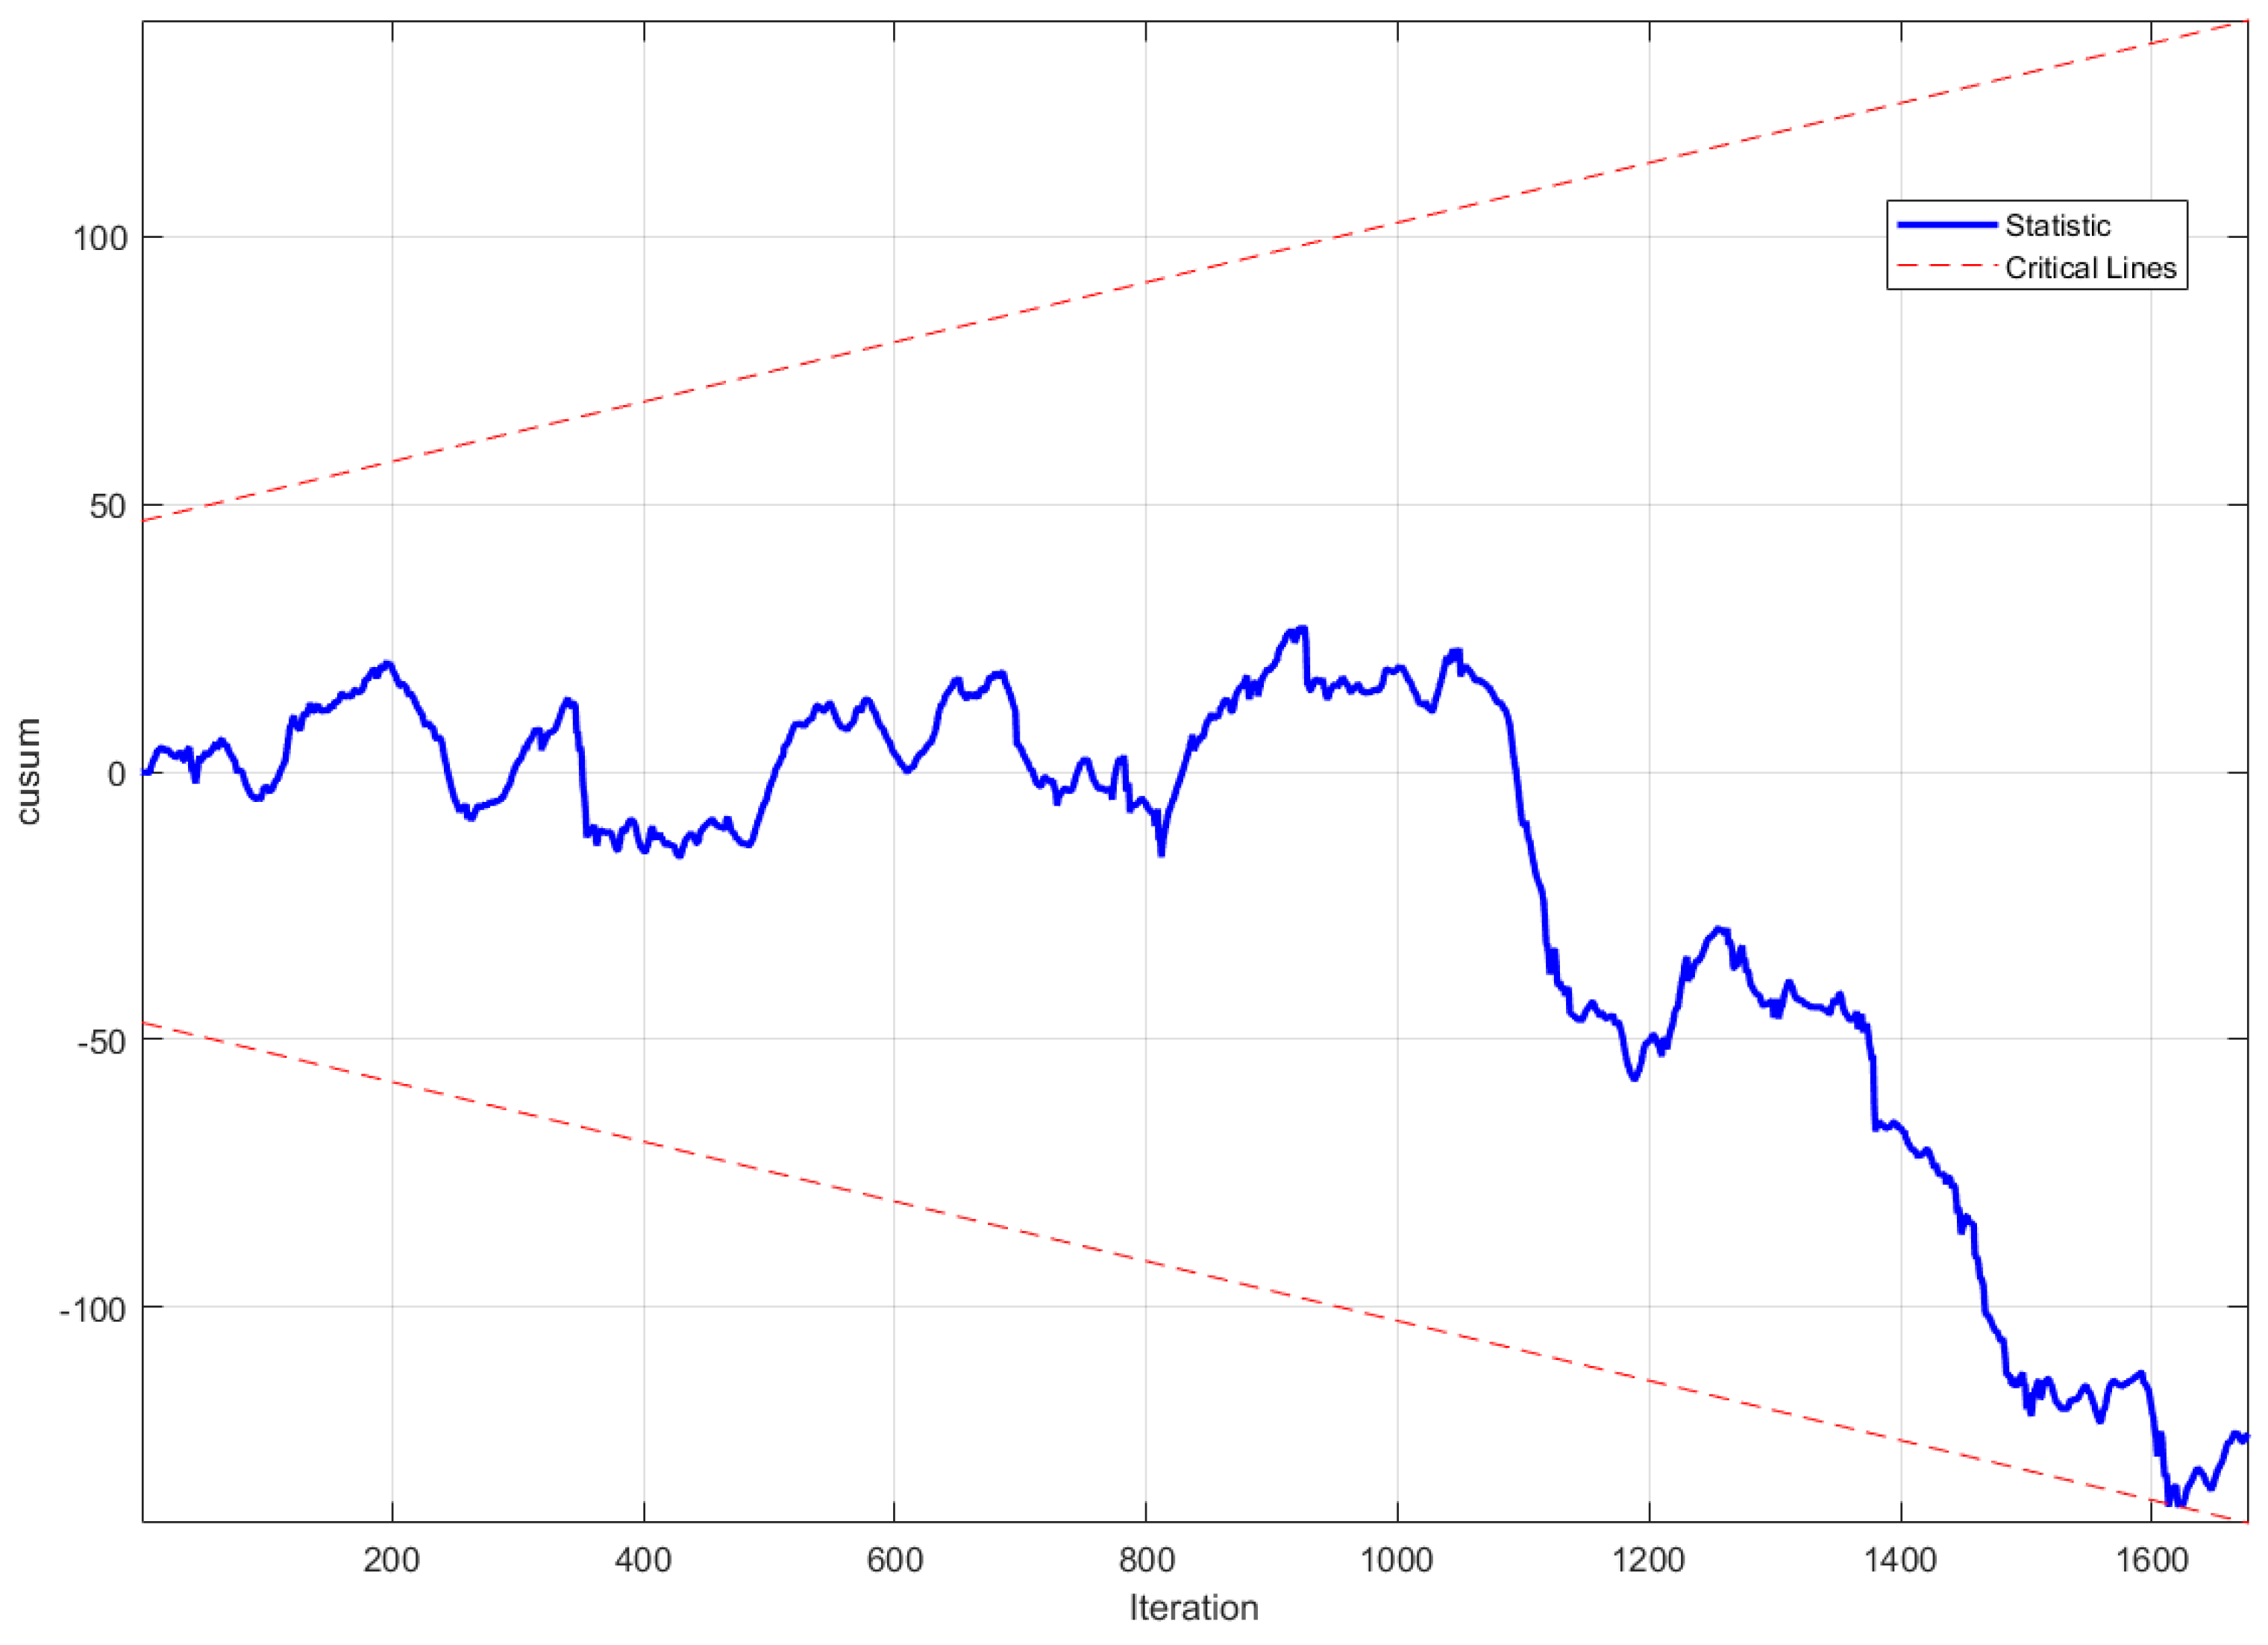
First, the results for the case including negative power values are presented in Figure 8 and Figure 9. The computation of the CUSUM test statistic (shown as the blue solid line) and the critical bounds (represented by the red dashed lines) is described in Section 4.2. As shown in Figure 8, when the outlier detection threshold was set to the 95% confidence interval (with the corresponding filtered power curve in Figure 3), the CUSUM test-based method identified the generator fault at sample 30,893. This point, calculated as T1 + 601 (i.e., 30,292 + 601), corresponds to an early detection occurring 338 h (approximately 14 days) before fault F2. However, when the outlier detection threshold was set to the 99% confidence interval (with the corresponding filtered power curve in Figure 4), the results in Figure 9 indicate that the CUSUM statistic crosses the critical region at the point 1309. This implies that the generator fault was detected at sample 31,601, calculated as T1 + 1309 (i.e., 30,292 + 1309), indicating that detection occurred 220 h (or 9 days) before fault F2. Recall that outliers were identified using 95% and 99% confidence intervals, corresponding to the removal of 5% and 1% of samples per cluster, respectively. The results show that the extent of outlier removal influences early fault detection: when only 1% of samples per cluster is excluded, the method performs worse in detecting the generator fault early compared to the case where 5% of samples are removed.
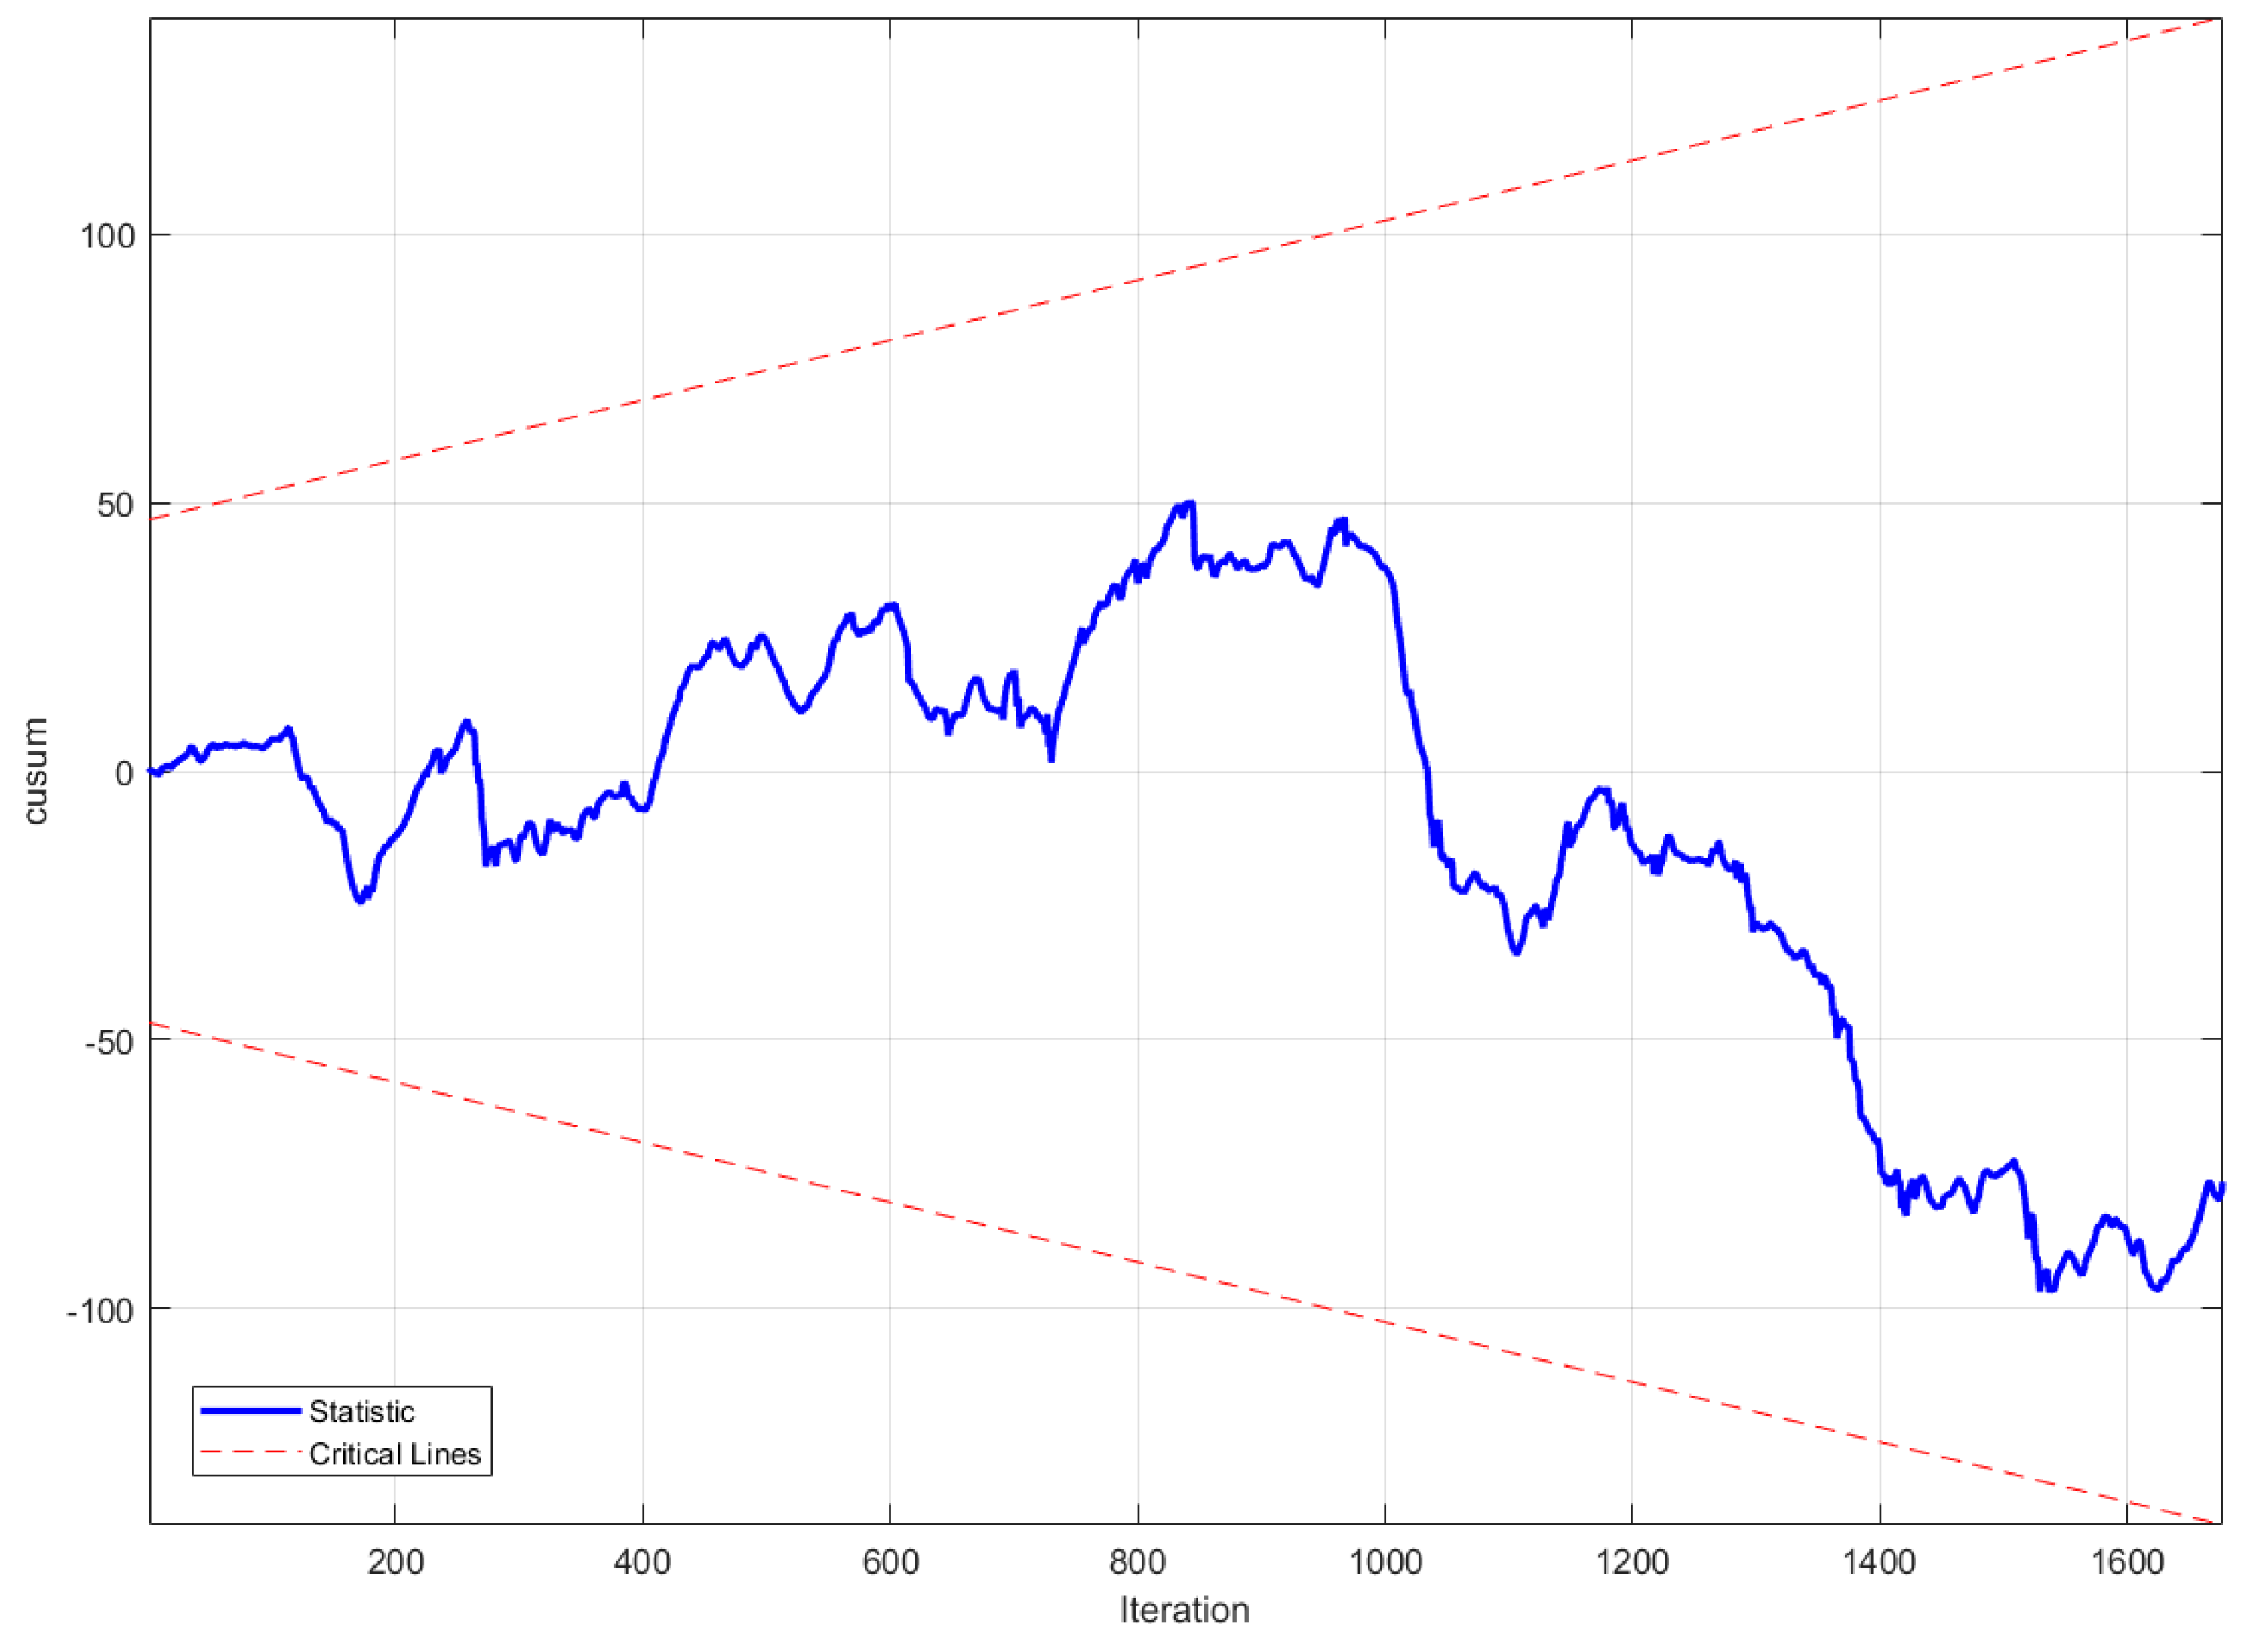
The results for the case without negative power values are shown in Figure 10 and Figure 11. Notably, under this condition, the CUSUM test-based method failed to detect the fault. This suggests that eliminating negative power observations may also discard important fault-related information.

4.4. Comparison and Discussion

This section compares the proposed cluster-based outlier removal approach for SCADA data preprocessing with the Density-Based Spatial Clustering of Applications with Noise (DBSCAN) method [55,56]. DBSCAN, introduced by Ester et al. (1996) [55], is a widely used density-based, non-parametric clustering algorithm. It identifies clusters by grouping points that are densely packed together, while points located in low-density regions are classified as outliers. Due to its ability to automatically detect arbitrarily shaped clusters and isolate sparse data regions, DBSCAN has become one of the most commonly applied clustering algorithms in data analysis and anomaly detection.
Figure 12 shows the filtered power curve of wind turbine T07 based on the 2017 SCADA dataset processed using the DBSCAN method. In this case, DBSCAN identified and removed the negative power values by classifying them as outliers. Overall, 29.01% of the data points were eliminated, which is a comparable removal rate to that achieved by the proposed cluster-based outlier filtering approach when negative power values are excluded (as illustrated in Figure 5 and Figure 6).
The SCADA data filtered using the DBSCAN method were then evaluated using the CUSUM-based fault detection approach to identify the generator fault. The same dataset used previously in Section 4.3 was applied to ensure a consistent comparison. As shown in Figure 13, the resulting CUSUM statistic approaches the critical threshold but does not exceed it, indicating that the fault is at the borderline of detectability.
These results further demonstrate that removing negative power measurements can inadvertently eliminate valuable fault-related indicators. Consequently, such data filtering may degrade the reliability and accuracy of early fault detection.

5. Conclusions

This paper presented a cluster-based filtering approach for preprocessing wind turbine SCADA data, aimed at enhancing condition monitoring and fault detection. By integrating the K-Means++ clustering algorithm with Mahalanobis distance and Chebyshev-based thresholds, the method effectively identifies and removes outliers while allowing flexibility in handling negative power values.
The experimental validation, carried out using SCADA data from a Portuguese wind farm, highlighted two key findings. First, the extent of outlier removal directly influences early fault detection performance: excluding 5% of samples per cluster enabled earlier fault detection compared to removing only 1%. Second, excluding negative power values was shown to compromise the reliability of detection, as the CUSUM test-based method failed to identify the generator fault in this case. These results suggest that negative power observations, although often treated as erroneous, may carry fault-related information critical for accurate condition monitoring. A comparative analysis was conducted, and the results show that the DBSCAN method and the proposed cluster-based outlier filtering approach (when negative power values are excluded) exhibit a similar data removal rate, both eliminating approximately 29% of the SCADA observations.
Overall, the study demonstrates that preprocessing strategies—particularly decisions regarding outlier removal thresholds and treatment of negative power values—play a decisive role in the reliability, accuracy, and timeliness of wind turbine fault detection models. The findings provide practical guidance for SCADA data preprocessing in real-world applications and contribute to ongoing efforts in improving predictive maintenance strategies for wind turbines enabling accurate predictions while retaining majority of data. It is particularly useful for data sets containing large amounts of negative power samples which may come from geographical or meteorological factors. To facilitate further research, reproducibility, and industrial adoption, the Python implementation of the proposed cluster-based outlier removal method has been made publicly available at: https://github.com/kkijano/wtcbfdp (accessed on 15 October 2025).
While this study focused on detecting generator faults, future work will be extended to identify failures in other subsystems such as the gearbox, blades, or pitch control system. To strengthen its robustness and scalability, future research should validate the cluster-based outlier removal approach using SCADA data from diverse turbine models and wind farm environments, including offshore installations. Moreover, upcoming work will explore hybrid strategies that combine domain knowledge with data-driven preprocessing to further improve fault detection accuracy and interpretability.

Supplementary Materials

The supporting Python code (v3.10.18) implementing the method can be downloaded at: https://github.com/kkijano/wtcbfdp (accessed on 15 October 2025).

Author Contributions

Conceptualization, K.K., T.B. and P.B.D.; Data curation, K.K.; Formal analysis, K.K. and P.B.D.; Funding acquisition, P.B.D.; Investigation, K.K., T.B. and P.B.D.; Methodology, K.K., T.B. and P.B.D.; Resources, T.B. and P.B.D.; Software, K.K. and P.B.D.; Supervision, T.B. and P.B.D.; Validation, K.K. and P.B.D.; Writing—original draft, K.K. and P.B.D.; Writing—review & editing, K.K., T.B. and P.B.D. All authors have read and agreed to the published version of the manuscript.

Funding

The work presented in this paper was performed within the scope of the research grant No. UMO-2023/51/B/ST8/01253 financed by the National Science Centre, Poland.

Data Availability Statement

Data is contained within the article or Supplementary Materials: The original contributions presented in this study are included in the article/Supplementary Materials. Further inquiries can be directed to the corresponding author.

Acknowledgments

The SCADA data used in this study come from the EDP onshore wind farm in Portugal. The authors would like to thank the EDP S.A. company for sharing the wind farm datasets for public use.

Conflicts of Interest

The authors declare no conflict of interest.

Abbreviations

SCADASupervisory Control and Data Acquisition
CUSUMCumulative Sum
ADFAugmented Dickey-Fuller
LSTMLong-Short Term Memory
XGBoostExtreme Gradient Boosting
IQRInterquartile Range
MLRMultiple Linear Regression
OLSOrdinary Least Squares

References

  1. Global Wind Report 2025; Global Wind Energy Council: Brussels, Belgium, 2025; published on 23 April 2025; Available online: https://www.gwec.net/reports/globalwindreport (accessed on 15 August 2025).
  2. WWEA Annual Report 2024: A Challenging Year for Windpower; World Wind Energy Association: Bonn, Germany, 2025; Available online: https://wwindea.org/AnnualReport2024 (accessed on 15 August 2025).
  3. Chatterjee, J.; Dethlefs, N. Scientometric Review of Artificial Intelligence for Operations & Maintenance of Wind Turbines: The Past, Present and Future. Renew. Sustain. Energy Rev. 2021, 144, 111051. [Google Scholar] [CrossRef]
  4. Zhao, H.; Liu, H.; Hu, W.; Yan, X. Anomaly Detection and Fault Analysis of Wind Turbine Components Based on Deep Learning Network. Renew. Energy 2018, 127, 825–834. [Google Scholar] [CrossRef]
  5. Meyer, A. Multi-Target Normal Behaviour Models for Wind Farm Condition Monitoring. Appl. Energy 2021, 300, 117342. [Google Scholar] [CrossRef]
  6. Castellani, F.; Natili, F.; Astolfi, D.; Vidal, Y. Wind Turbine Gearbox Condition Monitoring through the Sequential Analysis of Industrial SCADA and Vibration Data. Energy Rep. 2024, 12, 750–761. [Google Scholar] [CrossRef]
  7. Olabi, A.G.; Wilberforce, T.; Elsaid, K.; Sayed, E.T.; Salameh, T.; Abdelkareem, M.A.; Baroutaji, A. A Review on Failure Modes of Wind Turbine Components. Energies 2021, 14, 5241. [Google Scholar] [CrossRef]
  8. Salameh, J.P.; Cauet, S.; Etien, E.; Sakout, A.; Rambault, L. Gearbox Condition Monitoring in Wind Turbines: A Review. Mech. Syst. Signal Process. 2018, 111, 251–264. [Google Scholar] [CrossRef]
  9. Qiao, L.; Zhang, Y.; Wang, Q. Fault Detection in Wind Turbine Generators Using a Meta-Learning-Based Convolutional Neural Network. Mech. Syst. Signal Process. 2023, 200, 110528. [Google Scholar] [CrossRef]
  10. Khan, P.W.; Byun, Y.-C. A Review of Machine Learning Techniques for Wind Turbine’s Fault Detection, Diagnosis, and Prognosis. Int. J. Green Energy 2024, 21, 771–786. [Google Scholar] [CrossRef]
  11. Liu, Z.; Zheng, J.; Zhang, Q.; Xu, R. Advances and Trends in Intelligent Maintenance for Wind Turbine Systems. Sustain. Energy Technol. Assess. 2025, 80, 104398. [Google Scholar] [CrossRef]
  12. Yan, M.; Hui, S.C.; Jiang, N.; Li, N. A Review on Data-Driven Prognostics and Health Management for Wind Turbine Systems. Eng. Appl. Artif. Intell. 2025, 159, 111484. [Google Scholar] [CrossRef]
  13. Hussain, M.; Hussain Mirjat, N.; Shaikh, F.; Luxmi Dhirani, L.; Kumar, L.; Sleiti, A.K. Condition Monitoring and Fault Diagnosis of Wind Turbine: A Systematic Literature Review. IEEE Access 2024, 12, 190220–190239. [Google Scholar] [CrossRef]
  14. Murgia, A.; Verbeke, R.; Tsiporkova, E.; Terzi, L.; Astolfi, D. Discussion on the Suitability of SCADA-Based Condition Monitoring for Wind Turbine Fault Diagnosis through Temperature Data Analysis. Energies 2023, 16, 620. [Google Scholar] [CrossRef]
  15. Cambron, P.; Masson, C.; Tahan, A.; Pelletier, F. Control Chart Monitoring of Wind Turbine Generators Using the Statistical Inertia of a Wind Farm Average. Renew. Energy 2018, 116, 88–98. [Google Scholar] [CrossRef]
  16. Dong, Y.; Ma, S.; Zhang, H.; Yang, G. Wind Power Prediction Based on Multi-Class Autoregressive Moving Average Model with Logistic Function. J. Mod. Power Syst. Clean Energy 2022, 10, 1184–1193. [Google Scholar] [CrossRef]
  17. Wang, P.; Li, Y.; Zhang, G. Probabilistic Power Curve Estimation Based on Meteorological Factors and Density LSTM. Energy 2023, 269, 126768. [Google Scholar] [CrossRef]
  18. Pozo, F.; Vidal, Y.; Salgado, Ó. Wind Turbine Condition Monitoring Strategy through Multiway PCA and Multivariate Inference. Energies 2018, 11, 749. [Google Scholar] [CrossRef]
  19. Letzgus, S. Change-Point Detection in Wind Turbine SCADA Data for Robust Condition Monitoring with Normal Behaviour Models. Wind Energy Sci. 2020, 5, 1375–1397. [Google Scholar] [CrossRef]
  20. Dao, P.B. Condition Monitoring and Fault Diagnosis of Wind Turbines Based on Structural Break Detection in SCADA Data. Renew. Energy 2022, 185, 641–654. [Google Scholar] [CrossRef]
  21. Bilendo, F.; Lu, N.; Badihi, H.; Meyer, A.; Cali, Ü.; Cambron, P. Multitarget Normal Behavior Model Based on Heterogeneous Stacked Regressions and Change-Point Detection for Wind Turbine Condition Monitoring. IEEE Trans. Ind. Inform. 2024, 20, 5171–5181. [Google Scholar] [CrossRef]
  22. Dao, P.B. A CUSUM-Based Approach for Condition Monitoring and Fault Diagnosis of Wind Turbines. Energies 2021, 14, 3236. [Google Scholar] [CrossRef]
  23. Latiffianti, E.; Sheng, S.; Ding, Y. Wind Turbine Gearbox Failure Detection Through Cumulative Sum of Multivariate Time Series Data. Front. Energy Res. 2022, 10, 904622. [Google Scholar] [CrossRef]
  24. Dao, P.B. On Wilcoxon Rank Sum Test for Condition Monitoring and Fault Detection of Wind Turbines. Appl. Energy 2022, 318, 119209. [Google Scholar] [CrossRef]
  25. Dao, P. Condition Monitoring of Wind Turbines Based on Cointegration Analysis of Gearbox and Generator Temperature Data. Diagnostyka 2018, 19, 63–71. [Google Scholar] [CrossRef]
  26. Sun, X.; Xue, D.; Li, R.; Li, X.; Cui, L.; Zhang, X.; Wu, W. Research on Condition Monitoring of Key Components in Wind Turbine Based on Cointegration Analysis. IOP Conf. Ser. Mater. Sci. Eng. 2019, 575, 012015. [Google Scholar] [CrossRef]
  27. Qadri, B.A.; Ulriksen, M.D.; Damkilde, L.; Tcherniak, D. Cointegration for Detecting Structural Blade Damage in an Operating Wind Turbine: An Experimental Study. In Dynamics of Civil Structures, Volume 2; Pakzad, S., Ed.; Conference Proceedings of the Society for Experimental Mechanics Series; Springer International Publishing: Cham, Switzerland, 2020; pp. 173–180. ISBN 978-3-030-12114-3. [Google Scholar]
  28. Xu, M.; Li, J.; Wang, S.; Yang, N.; Hao, H. Damage Detection of Wind Turbine Blades by Bayesian Multivariate Cointegration. Ocean Eng. 2022, 258, 111603. [Google Scholar] [CrossRef]
  29. Dao, P.B. On Cointegration Analysis for Condition Monitoring and Fault Detection of Wind Turbines Using SCADA Data. Energies 2023, 16, 2352. [Google Scholar] [CrossRef]
  30. Dao, P.B.; Barszcz, T.; Staszewski, W.J. Anomaly Detection of Wind Turbines Based on Stationarity Analysis of SCADA Data. Renew. Energy 2024, 232, 121076. [Google Scholar] [CrossRef]
  31. Dickey, D.A.; Fuller, W.A. Likelihood Ratio Statistics for Autoregressive Time Series with a Unit Root. Econometrica 1981, 49, 1057. [Google Scholar] [CrossRef]
  32. Zhang, W.; Lin, Z.; Liu, X. Short-Term Offshore Wind Power Forecasting—A Hybrid Model Based on Discrete Wavelet Transform (DWT), Seasonal Autoregressive Integrated Moving Average (SARIMA), and Deep-Learning-Based Long Short-Term Memory (LSTM). Renew. Energy 2022, 185, 611–628. [Google Scholar] [CrossRef]
  33. Hsu, J.-Y.; Wang, Y.-F.; Lin, K.-C.; Chen, M.-Y.; Hsu, J.H.-Y. Wind Turbine Fault Diagnosis and Predictive Maintenance Through Statistical Process Control and Machine Learning. IEEE Access 2020, 8, 23427–23439. [Google Scholar] [CrossRef]
  34. Udo, W.; Muhammad, Y. Data-Driven Predictive Maintenance of Wind Turbine Based on SCADA Data. IEEE Access 2021, 9, 162370–162388. [Google Scholar] [CrossRef]
  35. Knes, P.; Dao, P.B. Machine Learning and Cointegration for Wind Turbine Monitoring and Fault Detection: From a Comparative Study to a Combined Approach. Energies 2024, 17, 5055. [Google Scholar] [CrossRef]
  36. Kiczek, B.; Batsch, M. Exploration of Unsupervised Deep Learning-Based Gear Fault Detection for Wind Turbine Gearboxes. Energies 2025, 18, 3630. [Google Scholar] [CrossRef]
  37. Liu, Z.-H.; Li, L.-W.; Wei, H.-L.; Li, M.; Lv, M.-Y.; Zhang, Y. Periodic-Enhanced Informer Model for Short-Term Wind Power Forecasting Using SCADA Data. IEEE Trans. Sustain. Energy 2025, 16, 2573–2585. [Google Scholar] [CrossRef]
  38. Ansari, S.; Nassif, A.B.; Mahmoud, S.; Majzoub, S.; Almajali, E.; Jarndal, A.; Bonny, T.; Alnajjar, K.A.; Hussain, A. Impact of Outliers on Regression and Classification Models: An Empirical Analysis. In Proceedings of the 2024 17th International Conference on Development in eSystem Engineering (DeSE), Khorfakkan, United Arab Emirates, 6 November 2024; IEEE: New York, NY, USA, 2024; pp. 211–218. [Google Scholar]
  39. Vamsikrishna, B.; Manikanta, K.R.N.; Sai Kiran, D.V.N.K.; Reddy Pothireddy, K.M.; Vuddanti, S. Outliers Detection and Imputation in Wind Speed Data and Forecasting Using LSTM. In Proceedings of the 2024 IEEE 4th International Conference on Sustainable Energy and Future Electric Transportation (SEFET), Hyderabad, India, 31 July 2024; IEEE: New York, NY, USA, 2024; pp. 1–5. [Google Scholar]
  40. Khan, Z.; Naeem, M.; Khalil, U.; Khan, D.M.; Aldahmani, S.; Hamraz, M. Feature Selection for Binary Classification Within Functional Genomics Experiments via Interquartile Range and Clustering. IEEE Access 2019, 7, 78159–78169. [Google Scholar] [CrossRef]
  41. Komadina, A.; Martinić, M.; Groš, S.; Mihajlović, Ž. Comparing Threshold Selection Methods for Network Anomaly Detection. IEEE Access 2024, 12, 124943–124973. [Google Scholar] [CrossRef]
  42. Liu, X.; Zhang, Y.; Zhang, Y.; Deng, C. Analysis of SCADA Data Preprocessing Methods for Wind Power Farms. In Proceedings of the 2023 IEEE 7th Conference on Energy Internet and Energy System Integration (EI2), Hangzhou, China, 15 December 2023; IEEE: New York, NY, USA, 2023; pp. 3578–3583. [Google Scholar]
  43. Long, H.; Sang, L.; Wu, Z.; Gu, W. Image-Based Abnormal Data Detection and Cleaning Algorithm via Wind Power Curve. IEEE Trans. Sustain. Energy 2020, 11, 938–946. [Google Scholar] [CrossRef]
  44. Wang, Z.; Wang, L.; Huang, C. A Fast Abnormal Data Cleaning Algorithm for Performance Evaluation of Wind Turbine. IEEE Trans. Instrum. Meas. 2020, 70, 1–12. [Google Scholar] [CrossRef]
  45. Su, Y.; Chen, F.; Liang, G.; Wu, X.; Gan, Y. Wind Power Curve Data Cleaning Algorithm via Image Thresholding. In Proceedings of the 2019 IEEE International Conference on Robotics and Biomimetics (ROBIO), Dali, China, 6–8 December 2019; IEEE: New York, NY, USA, 2019; pp. 1198–1203. [Google Scholar]
  46. Zheng, L.; Zhu, L.; Wen, W.; Li, J.; Zhang, C. Three-Stage Composite Outlier Identification of Wind Power Data: Integrating Physical Rules with Regression Learning and Mathematical Morphology. IEEE Trans. Instrum. Meas. 2025, 74, 1–13. [Google Scholar] [CrossRef]
  47. Thorndike, R.L. Who Belongs in the Family? Psychometrika 1953, 18, 267–276. [Google Scholar] [CrossRef]
  48. Ketchen, D.J., Jr.; Shook, C.L. The Application of Cluster Analysis in Strategic Management Research: An Analysis and Critique. Strateg. Manag. J. 1996, 17, 441–458. [Google Scholar] [CrossRef]
  49. Rousseeuw, P.J. Silhouettes: A Graphical Aid to the Interpretation and Validation of Cluster Analysis. J. Comput. Appl. Math. 1987, 20, 53–65. [Google Scholar] [CrossRef]
  50. Energias De Portugal (EDP) Wind Farm SCADA Datasets. Available online: https://www.edp.com/en/innovation/open-data/data (accessed on 17 July 2025).
  51. Turner, P. Power Properties of the CUSUM and CUSUMSQ Tests for Parameter Instability. Appl. Econ. Lett. 2010, 17, 1049–1053. [Google Scholar] [CrossRef]
  52. Brown, R.L.; Durbin, J.; Evans, J.M. Techniques for Testing the Constancy of Regression Relationships Over Time. J. R. Stat. Soc. Ser. B 1975, 37, 149–192. [Google Scholar] [CrossRef]
  53. Chow, G.C. Tests of Equality between Sets of Coefficients in Two Linear Regressions. Econometrica 1960, 28, 591–605. [Google Scholar] [CrossRef]
  54. Al Hassan, A.; Dao, P.B. Bridging Data and Diagnostics: A Systematic Review and Case Study on Integrating Trend Monitoring and Change Point Detection for Wind Turbines. Energies 2025, 18, 5166. [Google Scholar] [CrossRef]
  55. Ester, M.; Kriegel, H.P.; Sander, J.; Xu, X. A Density-Based Algorithm for Discovering Clusters in Large Spatial Databases with Noise. In Proceedings of the Second International Conference on Knowledge Discovery and Data Mining (KDD-96), Portland, OR, USA, 2–4 August 1996; Simoudis, E., Han, J., Fayyad, U.M., Eds.; AAAI Press: Washington, DC, USA, 1996; pp. 226–231. [Google Scholar]
  56. Schubert, E.; Sander, J.; Ester, M.; Kriegel, H.P.; Xu, X. DBSCAN Revisited, Revisited: Why and How You Should (Still) Use DBSCAN. ACM Trans. Database Syst. 2017, 42, 19. [Google Scholar] [CrossRef]
Figure 1. Cluster-based outlier removal approach for wind turbine SCADA data preprocessing.
Energies 18 05954 g001
Figure 2. Power curve of wind turbine T07 based on SCADA data from 2017, grouped into nine clusters using the cluster-based filtering approach. Red markers indicate the centroids of each cluster.
Energies 18 05954 g002
Figure 3. Filtered power curve for wind turbine T07 (2017 data) with negative power values included using a 95% confidence threshold: raw data (blue); preprocessed data (orange). 0.89% of data were removed from the data set.
Energies 18 05954 g003
Figure 4. Filtered power curve for wind turbine T07 (2017 data) with negative power values included using a 99% confidence threshold: raw data (blue); preprocessed data (orange). 0.28% of data were removed from the data set.
Energies 18 05954 g004
Figure 5. Filtered power curve for wind turbine T07 (2017 data) with negative power values removed using a 95% confidence threshold: raw data (blue); preprocessed data (orange). 29.79% of data were removed from the data set.
Energies 18 05954 g005
Figure 6. Filtered power curve for wind turbine T07 (2017 data) with negative power values removed using a 99% confidence threshold: raw data (blue); preprocessed data (orange). 29.18% of data were removed from the data set.
Energies 18 05954 g006
Figure 7. Generated power of wind turbine T07 in August 2017 with indications of the generator failure events and recovery moment.
Energies 18 05954 g007
Figure 8. Fault detection results using the CUSUM test-based method for the case where outliers were removed with a 95% confidence interval and negative power values were included. The CUSUM test statistic is shown as the blue solid line, while the critical bounds are indicated by the red dashed lines.
Energies 18 05954 g008
Figure 9. Fault detection results using the CUSUM test-based method for the case where outliers were removed with a 99% confidence interval and negative power values were included. The CUSUM test statistic is shown as the blue solid line, while the critical bounds are indicated by the red dashed lines.
Energies 18 05954 g009
Figure 10. Fault detection results using the CUSUM test-based method after removing outliers at the 95% confidence level and excluding negative power values. The CUSUM test statistic is represented by the solid blue line, while the critical bounds are depicted by the red dashed lines.
Energies 18 05954 g010
Figure 11. Fault detection results using the CUSUM test-based method after removing outliers at the 99% confidence level and excluding negative power values. The CUSUM test statistic is represented by the solid blue line, while the critical bounds are depicted by the red dashed lines.
Energies 18 05954 g011
Figure 12. Filtered power curve for wind turbine T07 (2017 data) using the DBSCAN method with a 95% confidence threshold. Raw data are shown in blue, and the preprocessed data in orange. A total of 29.01% of the data points were removed.
Energies 18 05954 g012
Figure 13. Fault detection results for wind turbine T07 using the CUSUM test-based method after SCADA data preprocessing and outlier removal with the DBSCAN approach. The CUSUM test statistic is shown as a solid blue line, and the critical thresholds are indicated by red dashed lines.
Energies 18 05954 g013
Table 1. Consecutive generator failures in wind turbine T07 during August 2017.
Fault IDFault TypeOccurrence TimeSample Index
F1Generator bearing damage20 August 2017, at 06:0832,730
F2Generator damage21 August 2017, at 14:4732,920
Disclaimer/Publisher’s Note: The statements, opinions and data contained in all publications are solely those of the individual author(s) and contributor(s) and not of MDPI and/or the editor(s). MDPI and/or the editor(s) disclaim responsibility for any injury to people or property resulting from any ideas, methods, instructions or products referred to in the content.