Article

Ammonia—A Fuel of the Future? Economies of Production and Control of NOx Emissions via Oscillating NH3 Combustion for Process Heat Generation

by
Krasimir Aleksandrov
1,*,
Hans-Joachim Gehrmann
1,*,
Janine Wiebe
2 and
Dieter Stapf
1
1
Institute for Technical Chemistry, Karlsruhe Institute of Technology, Hermann-von-Helmholtz-Platz 1, 76344 Eggenstein-Leopoldshafen, Germany
2
REMONDIS Industrie Service GmbH & Co. KG, Salmengrundstr. 4, 77866 Rheinau, Germany
*
Authors to whom correspondence should be addressed.
Energies 2025, 18(22), 5948; https://doi.org/10.3390/en18225948 (registering DOI)
Submission received: 29 July 2025 / Revised: 29 September 2025 / Accepted: 3 October 2025 / Published: 12 November 2025
(This article belongs to the Special Issue Optimization of Efficient Clean Combustion Technology: 2nd Edition)

Abstract

This study investigates the viability of using Ammonia as a carbon-free fuel for heat generation in terms of both reactive Nitrogen and Carbon emissions and production cost. As a carbon-free, environmentally friendly energy carrier, Ammonia has the potential to play a significant role in the sustainable, clean energy supply of the future. However, a major drawback of the steady combustion of ammonia for process heat generation is the extremely high levels of NOx emissions it produces. In this pilot-scale study, the experimental results show that, through the oscillating combustion of NH3, NOx emissions can be reduced by as much as 80%. Production costs were compared to evaluate the economic feasibility of Ammonia-based heat; the results reveal the economic challenges associated with using Ammonia compared to natural gas, even when accounting for the development of CO2 pricing. Only in terms of Carbon Capture and Storage requirements is Ammonia-based heat economically advantageous. This study also scrutinizes the economies of the production of gray and green Ammonia. Considering CO2 certificate costs, the cost of green ammonia would be competitive in the near future.

1. Introduction

Our modern, industrialized society relies heavily on fossil fuels, with such fuels forming the backbone of industries like chemical, steel and non-ferrous metal manufacturing and downstream processing. In addition to electrical power, various industrial processes demand huge amounts of process heat, and its generation consumes a significant portion of the fossil fuels mined today, resulting in massive amounts of anthropogenic CO2, a well-known greenhouse gas, being released into the atmosphere. Comprising approx. 80% of all greenhouse gas emissions [1], CO2 is by far the main contributor to the progressive warming of the planet. In order to reduce human-made greenhouse gas emissions, as required by the Kyoto Protocol, adopted in 1997 [2], and keep the Earth’s warming, if possible, to 1.5 °C, well below the 2 °C stipulated in the 2015 Paris Agreement [3], humankind must turn to alternative energy sources. Among carbon-free fuels, Hydrogen (H2) and Ammonia (NH3) are perhaps the primary candidates of interest [4,5,6,7,8,9]. Ammonia liquefies readily at −33 °C and has a volumetric energy density of 14 MJ/m3. Hydrogen, in contrast, has a lower volumetric energy of 11 MJ/m3, and its liquefaction takes places at an extremely low temperature of −253 °C [10,11,12,13]. These features mean that NH3 currently has the advantage over H2, particularly in transportation and storage, as NH3 can be stored at room temperature and a pressure of 0.99 MPa, or at −33 °C and atmospheric pressure, alternatively, while the storage of Hydrogen at room temperature requires a pressure of 70 MPa [8,10]. Transportation of Ammonia is generally possible in ships designed for propane, since propane’s boiling and condensation temperatures are almost the same as those of NH3 [10,14]. However, it should be noted that research into alternative methods for the storage and transportation of H2—in the form of Ammonia Borane (NH3BH3)—is also underway [15,16,17,18,19,20].
The first attempts to use Ammonia as a fuel date back to the 1940s when, during World War II, a coal gas mixed with NH3 was used to drive an omnibus in Belgium [14,21]. Later, NASA’s X15 airplane, developed in the 1960s, was powered by a fuel comprising mixed liquid Ammonia and Oxygen [22], while the US Army tried, unsuccessfully, to develop an NH3-powered gas turbine [23,24,25].
Efforts to address global warming in the 1990s revived the interest in Ammonia as an energy source, and comprehensive scientific programs have since been launched worldwide, with Japan leading the way. In Japan, the most significant contribution was the launch of the government-supported Strategic Innovation Promotion Program (SIP) for energy carriers in 2014 [26]. In a combined effort within the framework of the program, AIST and FREA succeeded in creating an NH3-fueled micro gas turbine [10]. In order to enhance the flame stability and combustion efficiency, it featured an NH3 vaporizer and a gas compressor, along with a heat regeneration cycle. For NOx emissions control, an SCR system was installed downstream of the turbine, which resulted in a reduction in the NOx concentrations in the exhaust gas from approx. 1000 ppm to less than 10 ppm. When fueled by 100% Ammonia, roughly 42 kW of power generation and a combustion efficiency of about 95% were achieved, and the residual NH3 was used as an additive for the SCR unit. This prototype demonstrated that emissions and combustion efficiency are mostly affected by the combustor inlet temperature [27].
Also in Japan, the Central Research Institute of Electric Power Industry (CRIEPI) developed a furnace co-fired with NH3 and pulverized coal. It was established that, if Ammonia is injected about 1m downstream of the burner, the NOx emissions are comparable to those of pulverized coal combustion without co-firing. The added NH3 made up as much as 20% of the total Lower Heating Value (LHV) of the fuel [10].
A group from Osaka University, in cooperation with Tayo Nipon Sanso, modified a 10 kW furnace to operate with a mixture of ammonia and natural gas using oxygen-enriched air (max. 30% O2). By altering the location of the secondary air injection port, the NOx emissions were kept below 150 ppm. The most important outcome was the demonstration of the capability of NH3 as a fuel for heat generation [10].
The IHI Corporation managed to develop a 2 MW gas turbine in which four parts methane were co-fired with one part NH3 (Ammonia mixing ratio of 20% LHV). Tailor-made combustor and NH3 injection nozzles were designed as a way to keep the NOx emissions below 300 ppm, and NOx was further reduced to about 6 ppm by means of the SCR unit following the combustion chamber. The project demonstrated the potential of NH3 co-firing within the field of CO2 emissions reduction. However, more work, particularly relating to further NOx reduction, as well as optimization of initial and operating costs, is necessary [13,28].
Outside Japan, a number of other countries, most prominently, the USA [13,29,30,31], Australia [13,32,33], the UK [13,34,35,36], the Netherlands [13,37], the UAE [38] and Canada [39,40], also adopted national strategies targeting industry decarbonization based on Ammonia as a fuel or H2 storage. In addition, different research groups investigated the application of NH3 as a fuel for SI (spark ignition) and CI (compression ignition) engines [41,42,43,44,45,46,47,48,49,50,51,52,53] and the performance of NH3-powered gas turbines [54,55,56] and NH3-fed fuel cells [4,57,58,59,60,61,62,63,64,65,66].
However, regardless of its high potential, using Ammonia as an energy carrier has its shortcomings. The heat combustion and the laminar burning velocity of NH3 are approx. 40% and 20% lower, respectively, compared to those of fossil fuels [10,67,68,69,70,71,72,73,74], and Ammonia also features a higher ignition temperature and low flammability [10,75,76,77,78,79]. The chemistry of Ammonia burning has been extensively studied since 1960s, and, although different chemical mechanisms of NH3 oxidation have been proposed over the years [51,52,73,80,81,82,83,84,85,86,87,88,89,90,91,92,93,94,95,96], a deeper understanding is needed before NH3 can be fully exploited as a fuel. Challenges include the control of NH3 slip due to unreacted ammonia [97,98,99] and, perhaps most significantly, the extremely high levels of NOx emissions produced by Ammonia combustion.
NOx is a common term for the gaseous oxides of Nitrogen—NO, NO2, NO3, N2O, N2O3, N2O4, which form during most combustion processes NOx is of concern for decades, resulting in comprehensive studies of the reaction mechanisms of its formation through the years [80,84,88,100,101,102,103,104,105]. It is harmful to humans and environment. N2O is another greenhouse gas with a 265 times higher warming potential than CO2 [106,107,108]. In the aspect of air quality, however, only the two most important, NO and NO2 are considered as NOx.
Much effort was committed to develop strategies for NOx reduction. Broadly, the measures for NOx—emissions control can be divided in two groups—combustion modification or primary measures and post-combustion or secondary measures [109,110,111,112]. The secondary measures focus on the NOx removal from the flue gas. They encompass Selective Catalytic Reduction (SCR), Selective Non-catalytic Reduction (SNCR), wet scrubbing, electron beam, adsorption, electrochemical reduction, as well as non-thermal plasma [85,112,113,114,115]. By the means of these processes close to 100% NOx abatement is achieved, but demand high investment costs and bulky equipment, which makes upgrading of existing plants not always viable [112]. Some are still in the development stage, as in the case of electrochemical reduction [112,116,117,118,119,120,121].
In contrast, the primary measures focus on avoiding the formation of NOx during combustion and include fuel and air staging [79,108,120,121,122], low excess air [108], flue gas recirculation [108,120,122], low-NOx burners [108] and re-burning [108,123,124], as well as Linde’s LoTox [125] and MARTIN’s VLN [126] processes. They are low-cost and particularly suitable for the retrofitting of existing facilities. All primary measures should be utilized before secondary measures are considered.
Most relevant to this study is oscillating combustion [127,128,129], which can be principally seen as air and fuel staging carried out over time, i.e., it is a primary NOx reduction approach.
The aim of our study was to establish the optimal operating parameters for the low-emission combustion of NH3 with air relating to NOx while simultaneously keeping NH3 slip and N2O emissions low. The experiments were set up to simulate boiler firing for process heat generation and the experimental results demonstrate how far the application of this primary measure, i.e., an oscillating mode of combustion involving interrupting the NH3 supply, enables a reduction of NOx concentration in the exhaust gas.
The theoretical part of our study scrutinized the economies of the production of gray and green Ammonia via the Haber–Bosch process [8,10,13,130]. Gray Ammonia production depends on Hydrogen produced conventionally by the steam reforming of natural gas [8,13,130]. It is estimated that 1.8% to 3% of all global energy is consumed by the fabrication of NH3. At present, most of this energy still comes from fossil fuels, meaning NH3 manufacturing is one of the largest CO2 emitters [131]. In contrast, the foundation of green Ammonia production is H2 obtained via water electrolysis [8,132,133,134,135,136] realized using electrical power from renewable energy sources [137]. Norway has been examined as a green NH3 fabrication site due to its high abundance of renewable energy, particularly from affordable hydropower, which accounts for 44% of the total energy supply in the country [138,139,140]. The economic analysis was conducted with and without considering CO2 pricing.
An assessment of the entire Ammonia process chain was also carried out. The process chain comprises NH3 production in Norway from regeneratively produced H2 and N2 from air separation, transportation to Germany, storage in Germany and, finally, energy recovery through combustion with air and conversion of the enthalpy into steam or process heat.

2. Materials and Methods

All experimental investigations were carried out at the Gas- und Wärme-Institut (GWI) in Essen, Germany.

2.1. Gaseous Fuels

During the experimental studies, the combustion of pure NH3, as well as different gas mixtures consisting of natural gas and ammonia, was investigated. NH3 with a purity of at least 99.98% was supplied in barrels, and natural gas corresponding to gas quality “H” was delivered to the location of the experiments via a pipeline [141]. The quality of the natural gas was additionally continuously monitored with a Type PGC 9303 gas chromatograph from RMG as knowledge of the exact chemical composition is crucial for the proper adjustment of its volume flow and the volume flow of the combustion air. For the furnace tests, the volume flows of the natural gas and the combustion air were adjusted with the help of a sophisticated gas mixing system based on various thermal Mass Flow Controllers (MFCs). The volume flow regulation of NH3 was realized using a separate system with a similar design.

2.2. Burner

A tailor-made swirl burner developed by an industrial partner exclusively for the combustion of alternative gases was used for the experimental trials. It features a central gas lance which can also be moved axially and offers a rated output of 250 kW. The combustion air, divided into primary air (PA) and secondary air (SA), can be supplied to the combustion chamber via separate annular gaps in a swirling mode. By changing the distribution of the combustion air and adjusting the position of the gas lance, the burner can be adapted to the specific application.
In order to stabilize the Ammonia flame, a flame tube was attached to the inner side of the burner’s port on the furnace wall. The flame tube was of simple design, made of a piece of heat-resistant steel tube welded onto a mounting flange.
To further support the flame stability, the burner was pulled 15 cm back relative to the initial position (Figure 1).

2.3. Oscillator

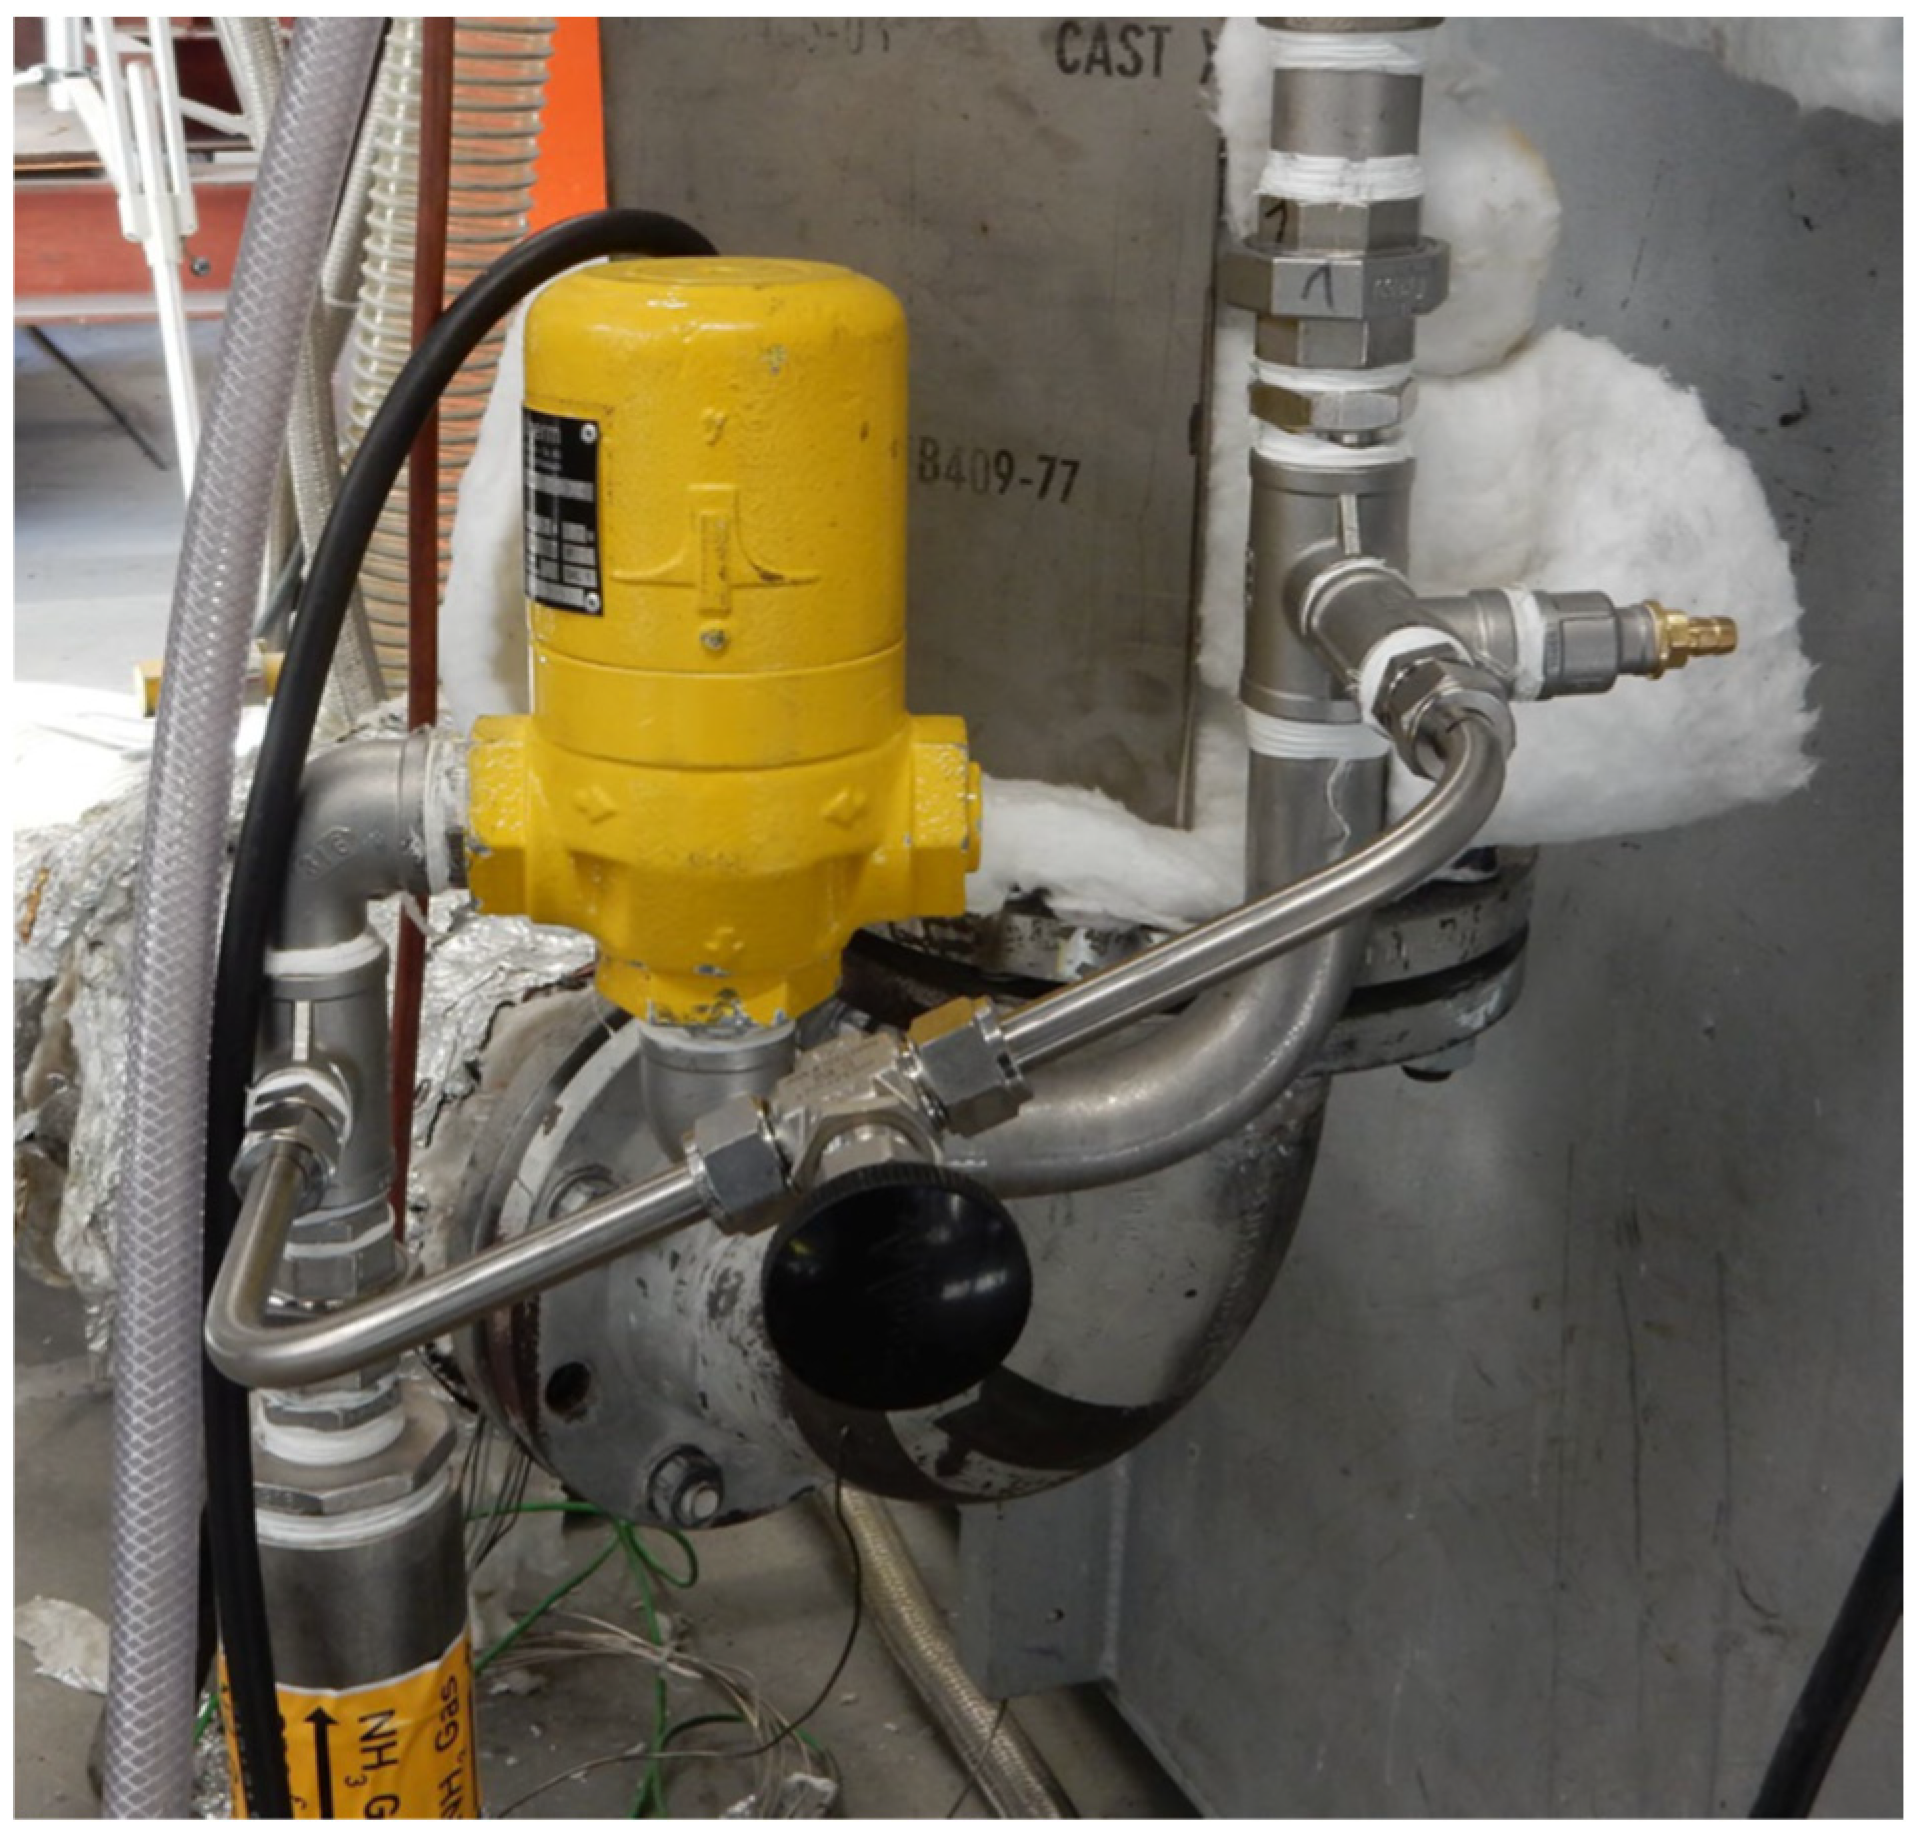
In order to achieve oscillating combustion of the Ammonia fuel, a controllable oscillator was assembled. The core of the oscillator was a gas solenoid valve (Figure 2), enabling a sufficiently high number of switching cycles over a broad range of frequencies. This valve was controlled with the help of a 24 VDC power supply in combination with an adjustable cycle valve. Additionally, a bypass was set up in order to provide a pilot flame with the fuel gas (Figure 2), serving to secure stable re-ignition in the event of an interruption in the gas flow (as in the case of oscillation).

2.4. Test Furnace Systems

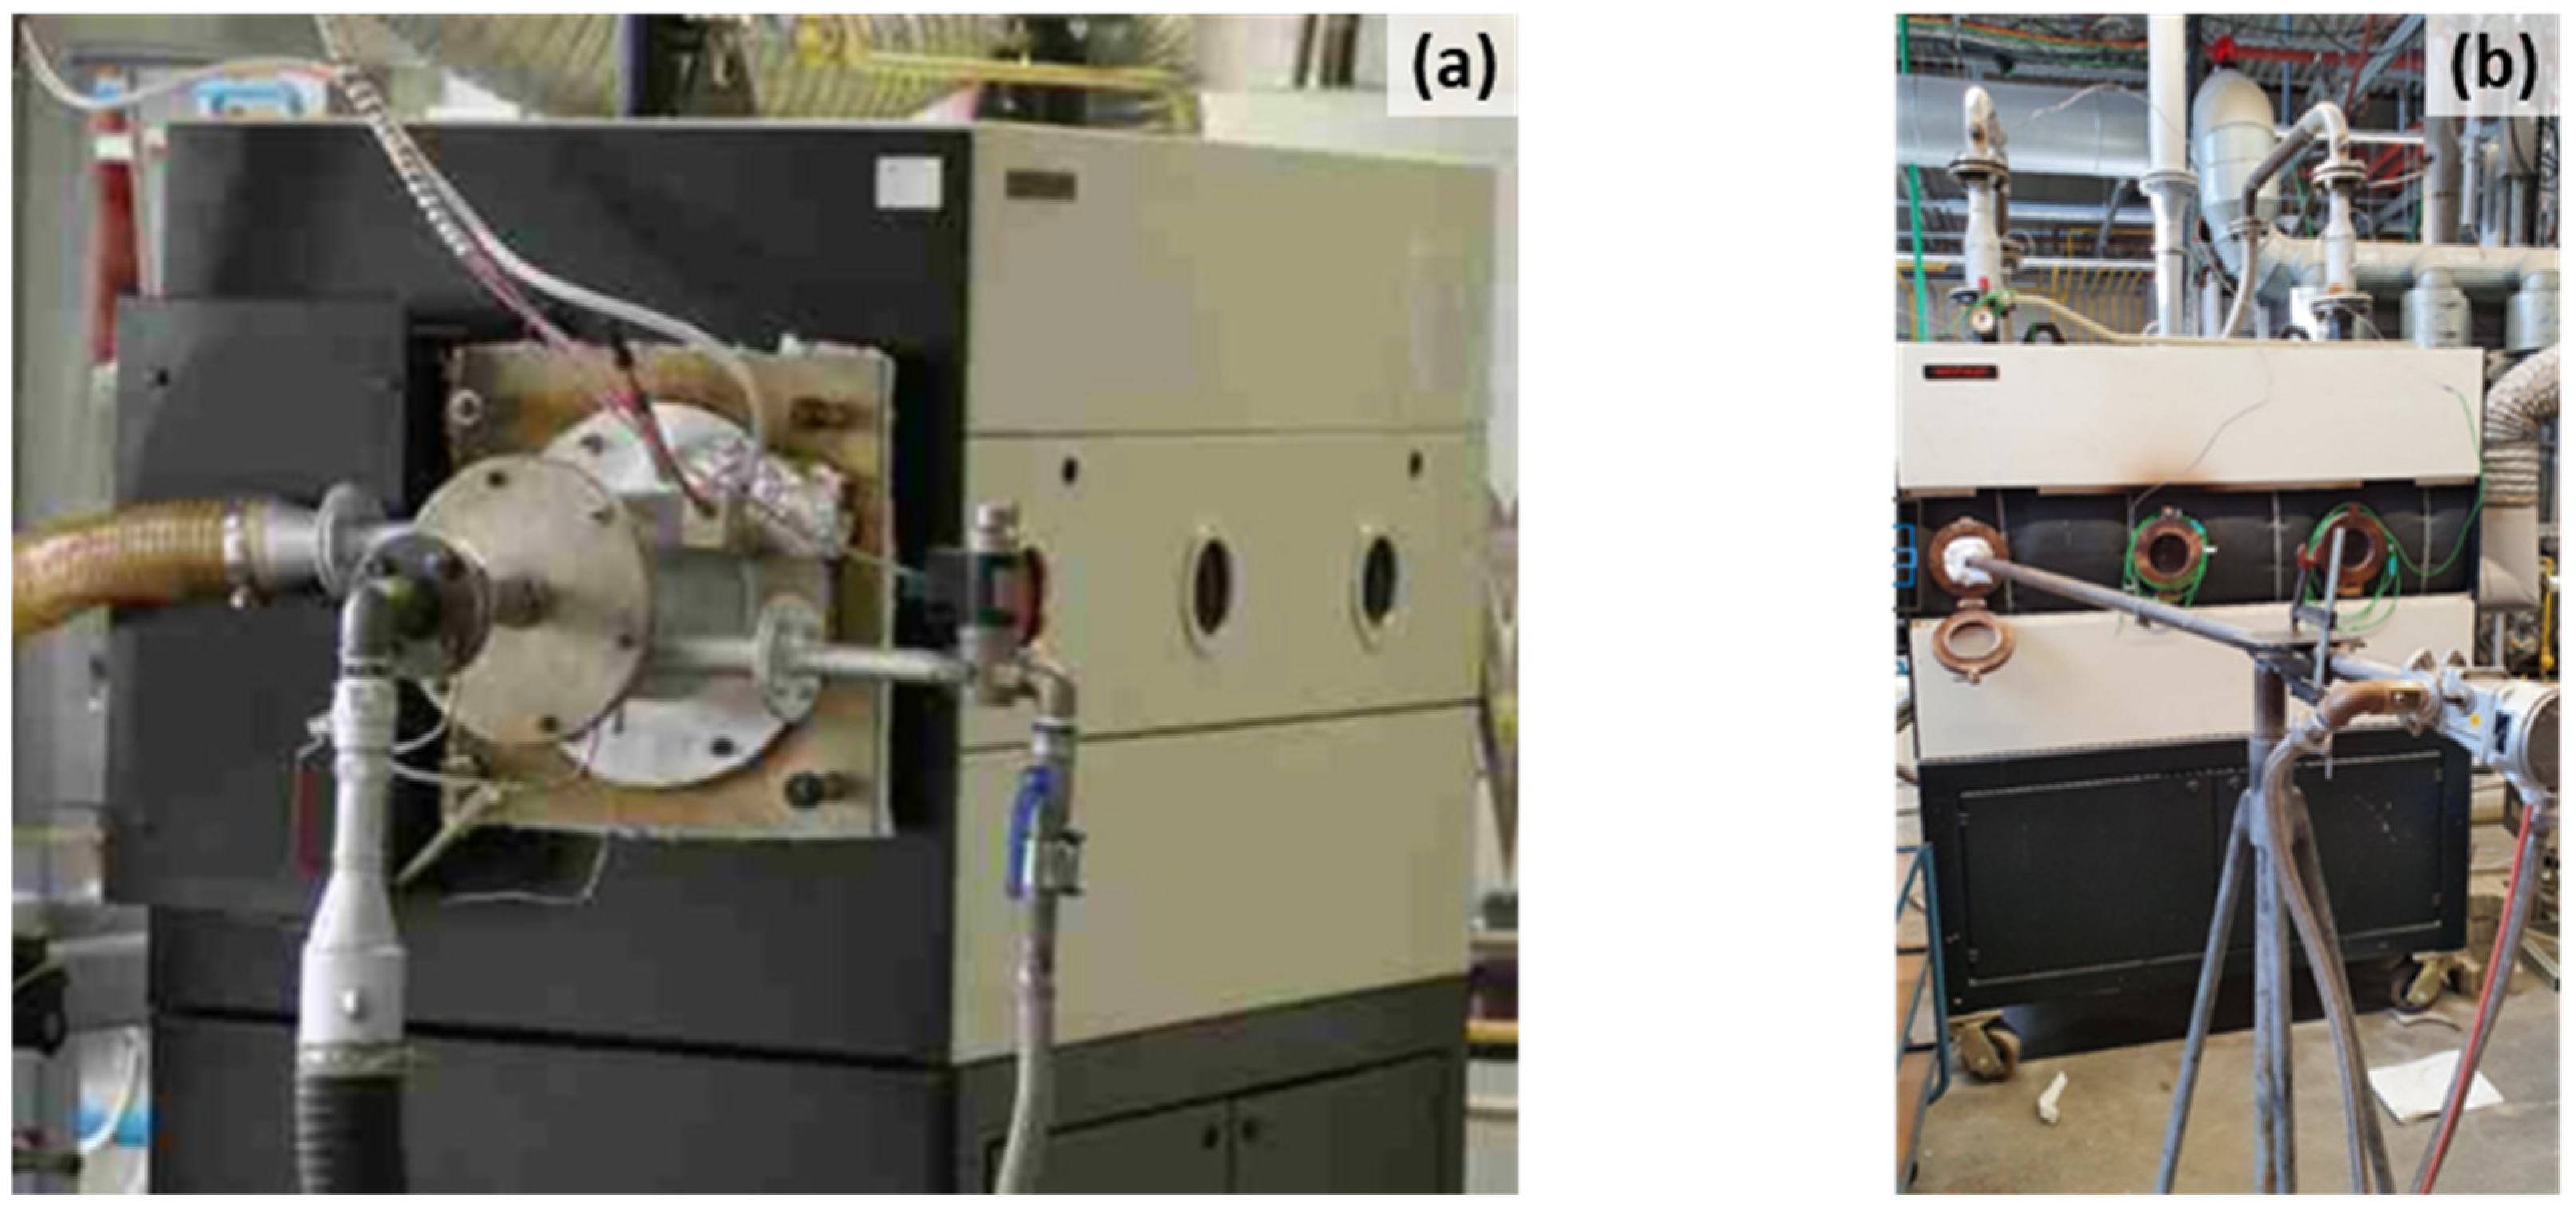
To resemble a boiler firing system, the ammonia burner was integrated into a water-cooled combustion chamber with the following dimensions: length—1.5 m, width—0.8 m, height—1 m (Figure 3a). It simulated the conditions in a boiler firing system and comprised a cylindrical steel tube confined in a liquid-tight housing. The hollow space formed between the steel tube and the housing was filled with water through an inlet connected to a freshwater pipe. The exhaust water was discharged afterwards through an outlet connection in the drainage. The inlet and outlet water temperatures were monitored continuously by two thermocouples, and the volume flow of the water was supervised by means of a flow meter. This water-cooling system configuration allowed, depending on the burner load, for an exhaust gas temperature between 108 °C and 115 °C. The burner was mounted at the front edge of the chamber and accordingly connected to the supply lines for combustion air and fuel gas (gas mixing device) (Figure 3a). The initial ignition of the burner was supported by a start-up flame lance attached sideways to the combustion chamber, perpendicular to the burner (Figure 3b).
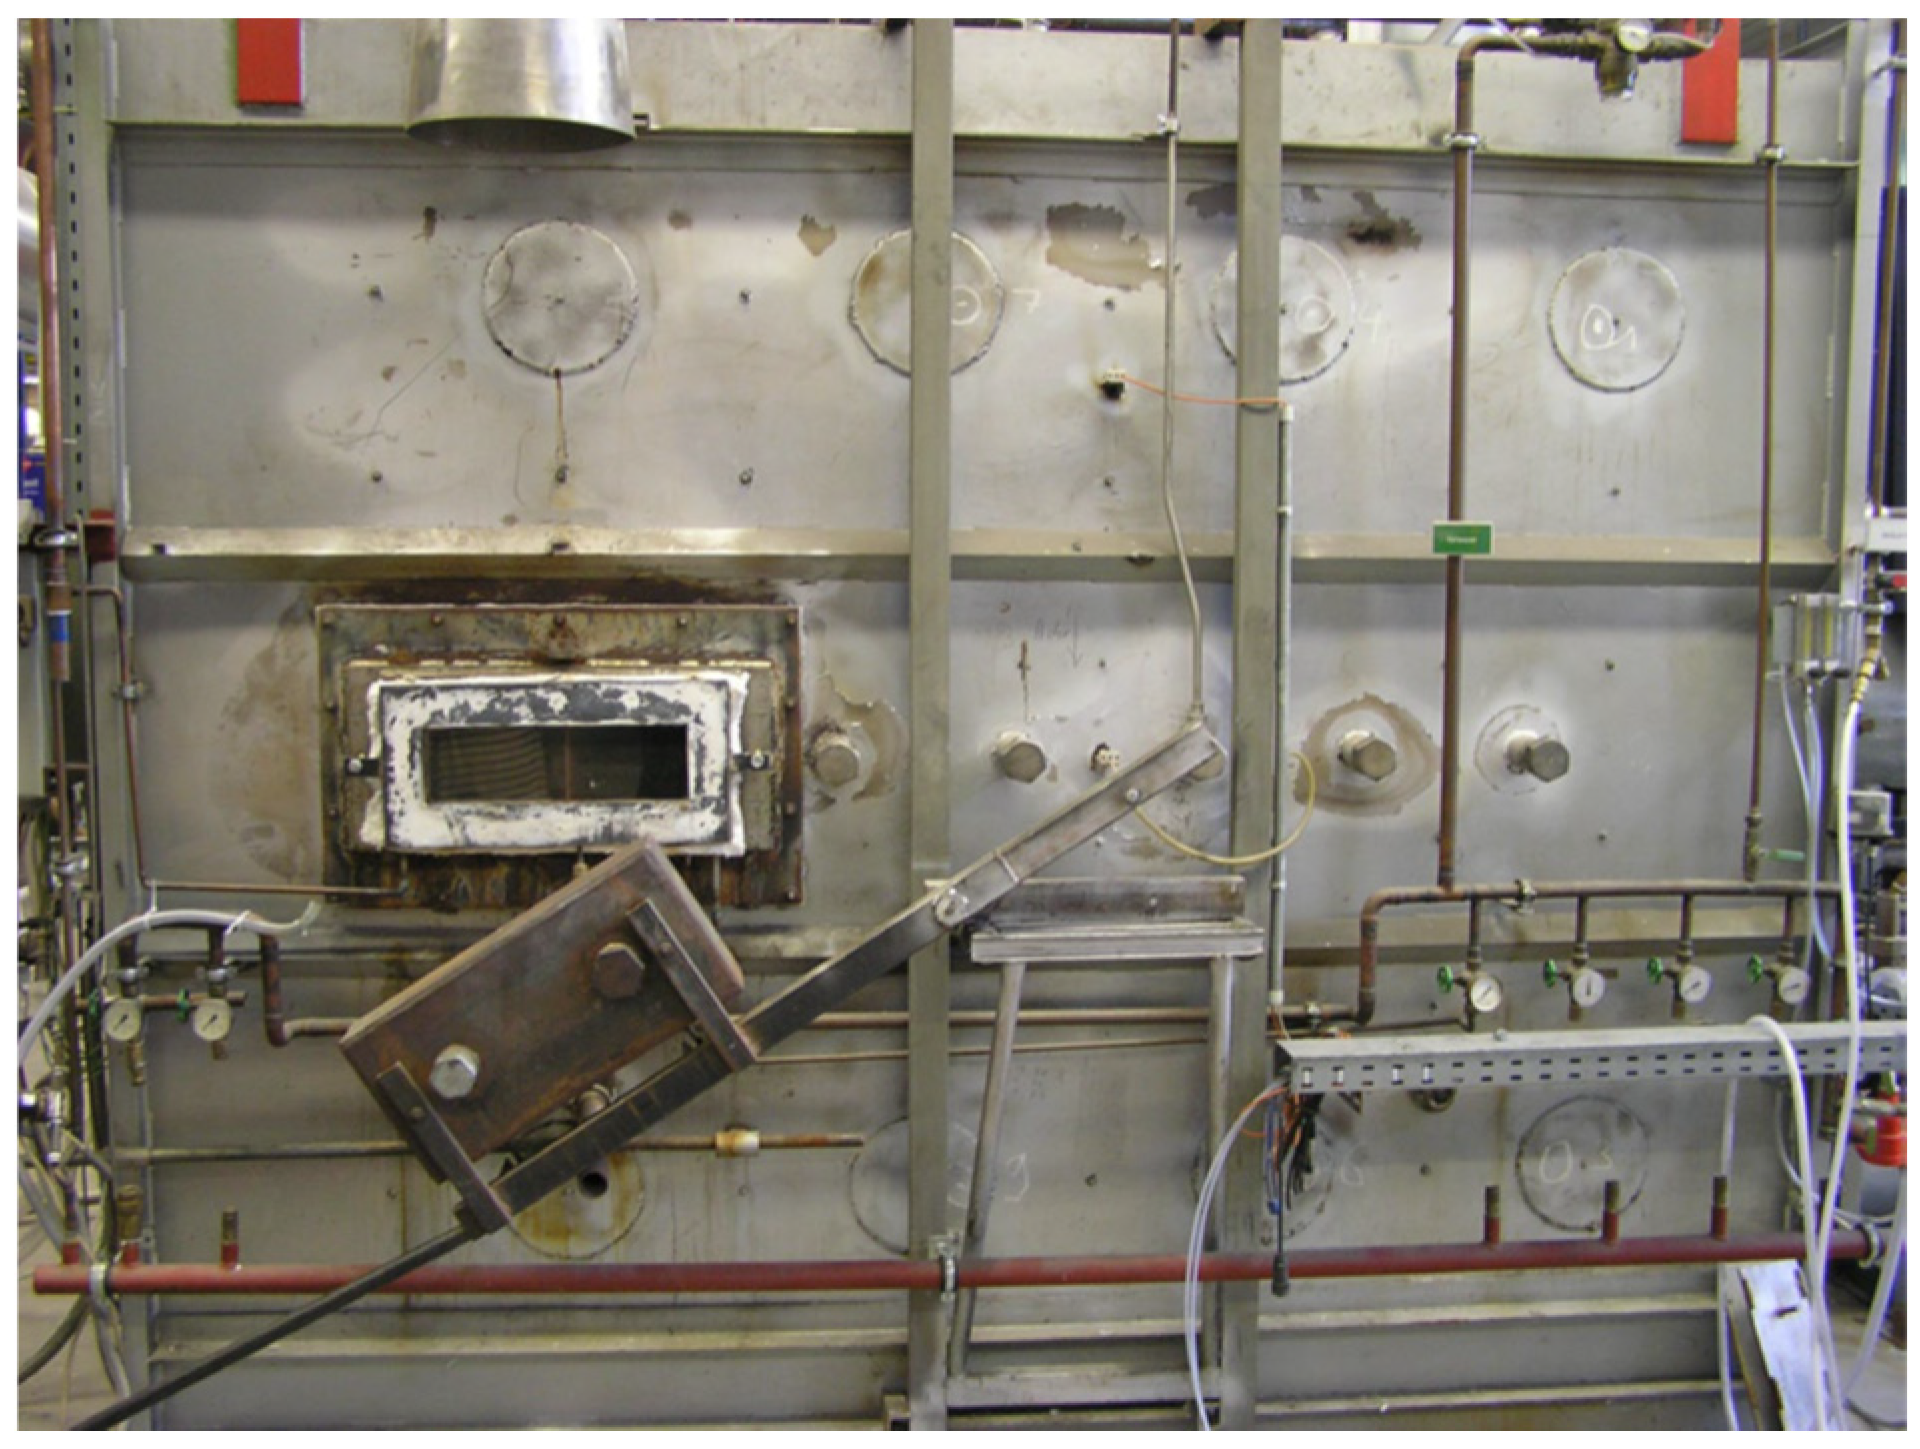
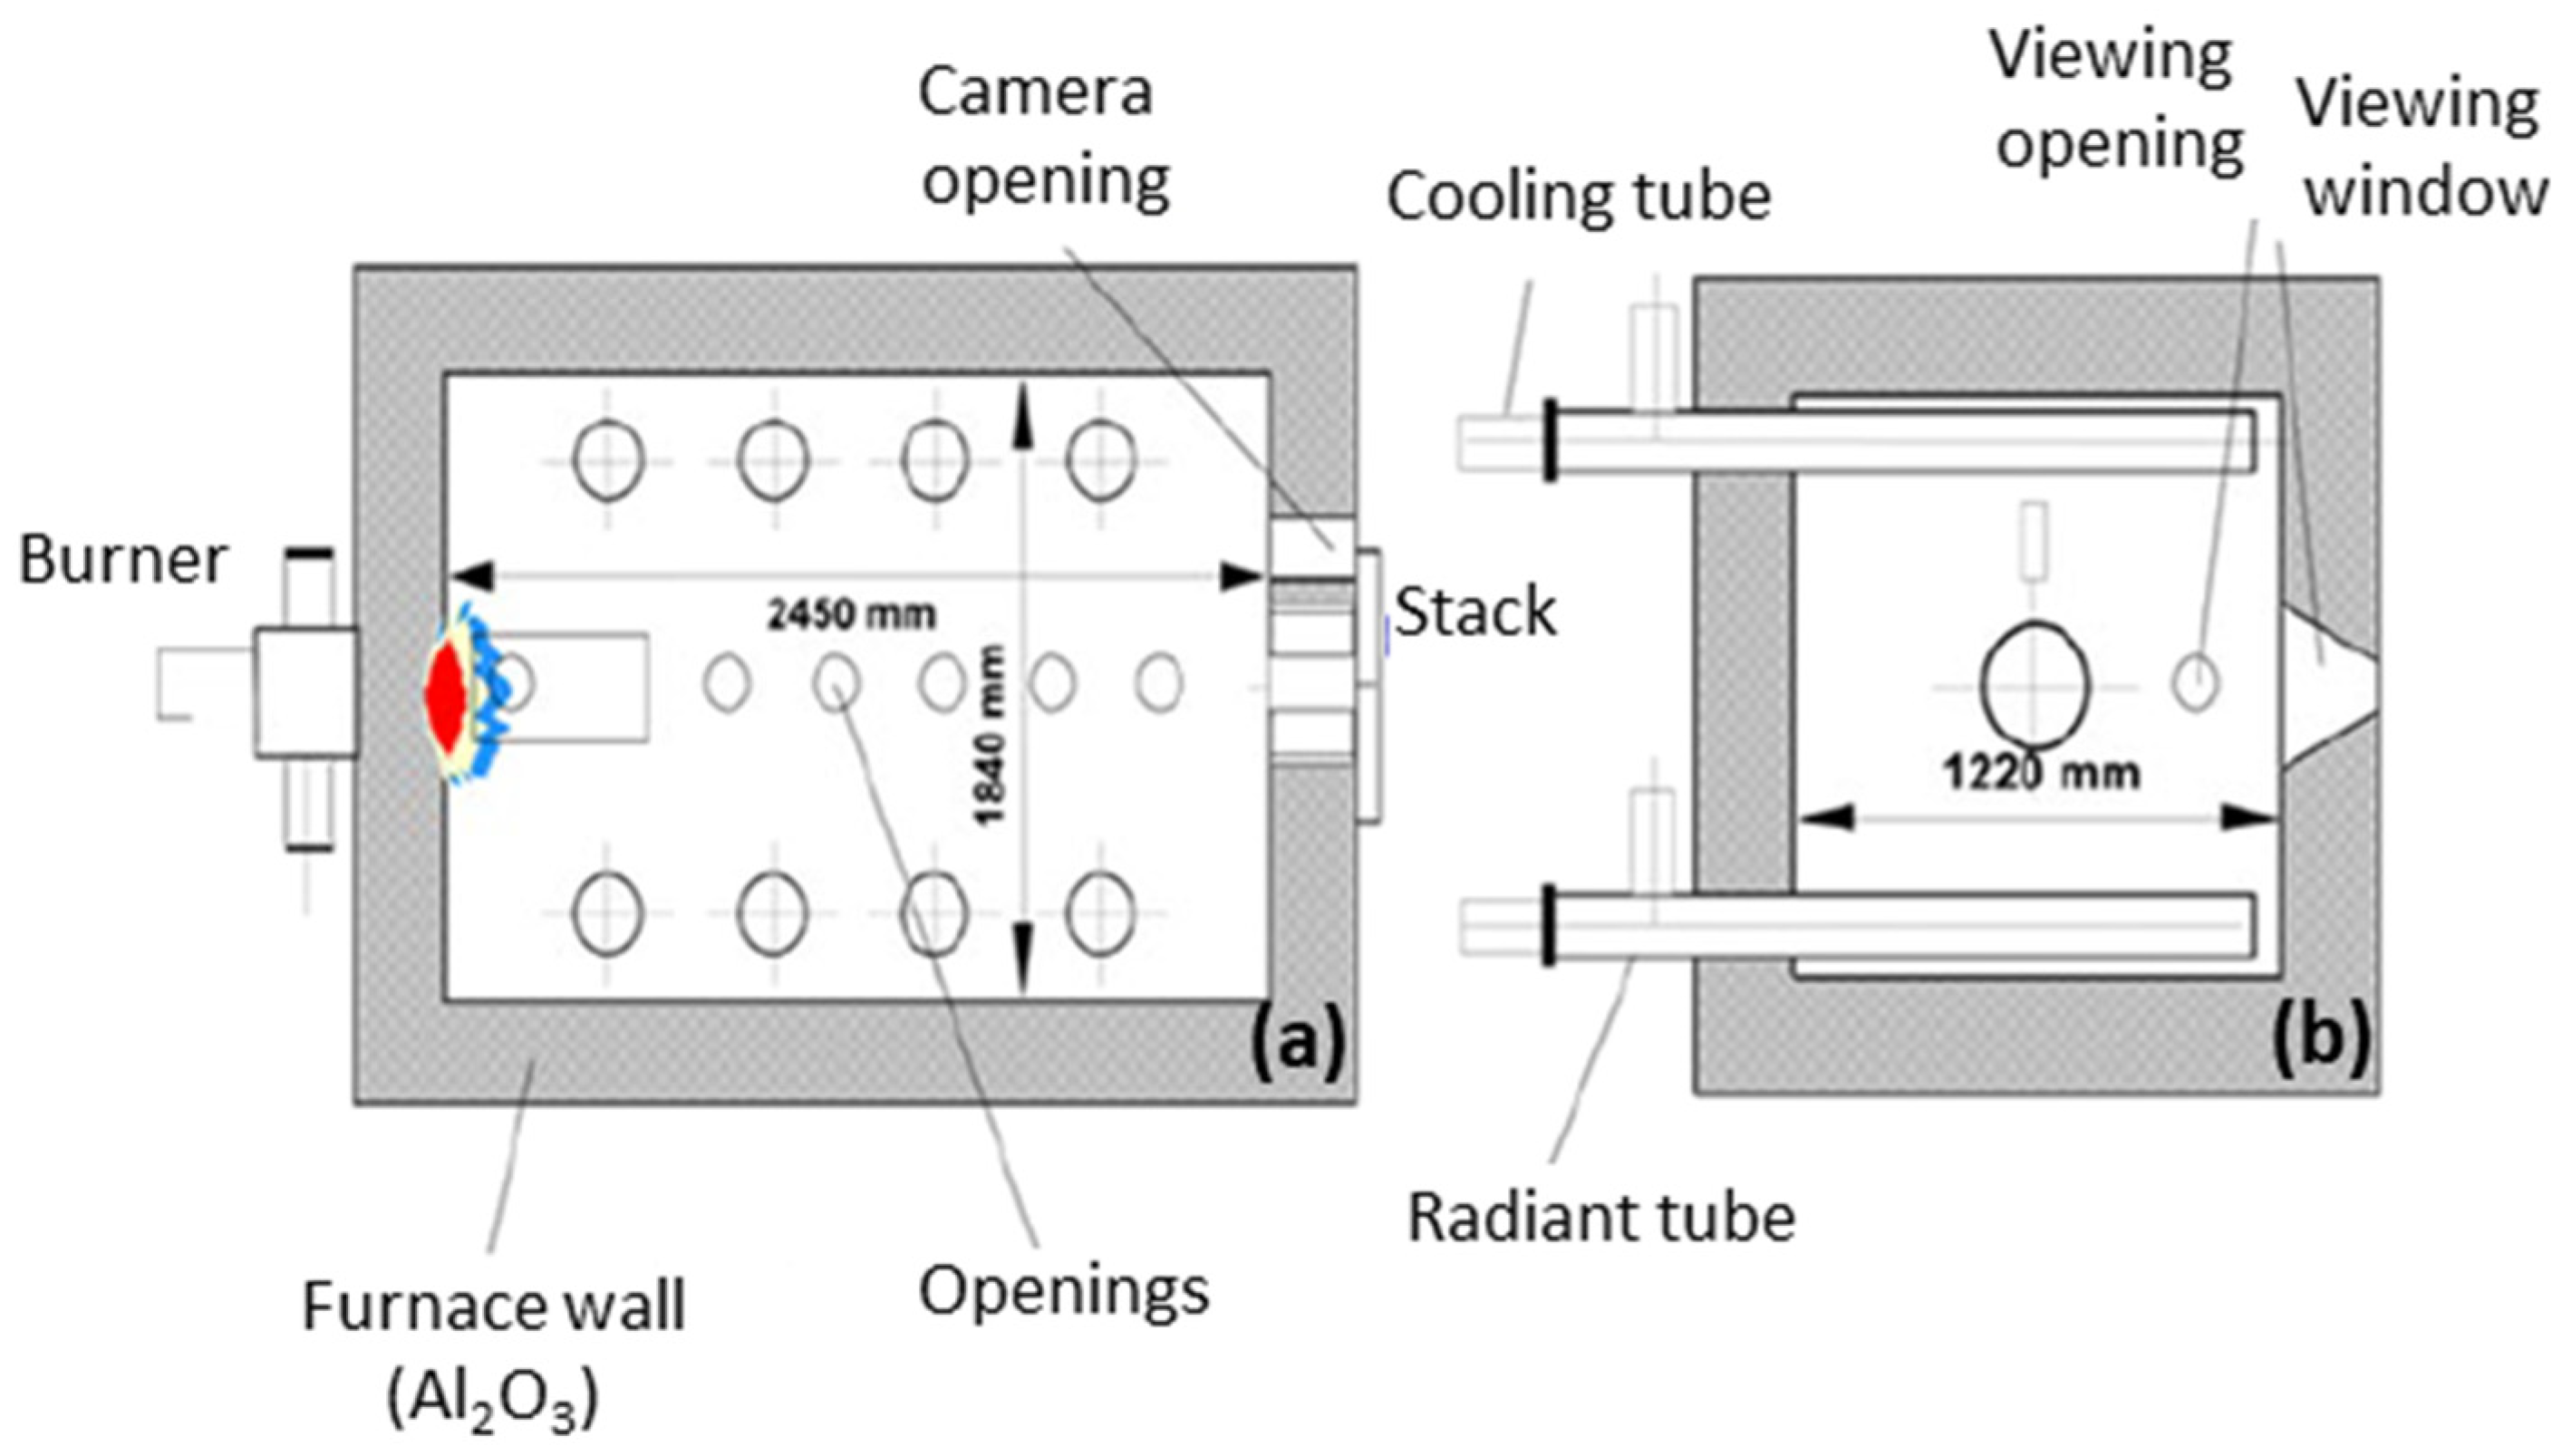
The potential for NOx reduction via oscillating Ammonia combustion was investigated in another series of experiments executed in an isothermal combustion chamber. The basic layout of the system is pictured in Figure 4 and Figure 5. The combustion chamber had a length of approx. 2.5 m, a width of 1.2 m and a height of 1.85 m. The interior was lined with a refractory material (Al2O3) and four additional radiant tubes at the bottom of the chamber served to control the temperature inside it. Another four air-operated cooling tubes permitted a load to be mimicked through heat dissipation. Seven closable openings integrated along the side of the furnace (approx. central plane) allowed direct access to the combustion chamber during operation, and a larger viewing window located in the front furnace section could be opened, if necessary, for visualization and measurement of burner flames through optical methods.

2.5. Flue Gas Analytics

The concentrations of NH3 (Ammonia slip), N2O, NO, NO2 NOx H2O, CO and CO2 in the flue gas were measured continuously with a portable Fourier-Transform Infrared (FT-IR) DX 4000 spectrometer from Gasmet® (Mestarintie 6, FI-01730 Vantaa, Finland) [142]. The spectrometer operates in the wave number range from 900 cm−1 to 4 200 cm−1 and is characterized by a multi-reflection unit and a heated measuring cell with a fixed path length of 5 m, a spectral resolution of 8 cm−1 and a scanning frequency of 10 scans/s. After reaching the operating temperature of the measuring cell (180 °C), prior to each measurement, a new zero (background) spectrum was recorded, to ensure the reliability of the measurement results. The recorded infrared spectra were analyzed by means of the software package Calcmet® 12.16 [143] utilizing a modified Classical Least-Squares (CLS) method [144]. The unit was calibrated for the flue gas species listed in Table 1.
The parameters of the experimental investigations, which were carried out in two separate series of trial runs, are listed in Table 2.

2.6. Economic Analysis

The economies of the production of gray and green Ammonia were comprehensively analyzed with the help of the Palisade @Risk 8 software system, [145], which is particularly suitable for the reliable evaluation of the OpEx [146], CapEx [147] and profitability of green and gray NH3 production. While CapEx include investment costs for the facility only, OpEx comprise the expenditures for materials, supplies, utilities, capital, maintenance and depreciation costs, as well as taxes and insurance. An amortization period of 20 years was assumed and the cost of capital was calculated with an interest rate of 10%; the annual increase for the maintenance costs was considered to be between 1% and 3% of the investment costs; and tax and insurance costs of 1% to 2% of the investment costs were taken into account [148].
The economic feasibility study evaluated the whole system comprising the process chain for the manufacturing in Norway, the subsequent maritime transportation to Germany, storage in Germany, the combustion of the ammonia in a boiler firing plant and the NOx reduction in the flue gas achieved via SNCR or SCR. Both the unreduced NOx concentrations and the values lowered by the oscillating mode of combustion were also considered.

3. Results

3.1. NH3 Combustion in a Water-Cooled Combustion Chamber

Before investigating the NOx reduction achieved through the oscillating combustion of Ammonia, the challenge of generating a constant burning/stable NH3 flame had to be tackled. The burner was mounted on the water-cooled combustion chamber and started with natural gas. While the fuel and the total combustion air volume flows were kept constant throughout, NH3 was gradually mixed with the natural gas while the natural gas fraction in the fuel mixture was simultaneously reduced by the same proportion. The Ammonia fraction in the fuel mixture, x N H 3 , was calculated according to Equation (1):
x N H 3 = V ˙ N H 3 V ˙ N H 3 + V ˙ C H 4
The temperature and chemical composition of the exhaust gas, as well as its volume flow, were monitored and recorded continuously.
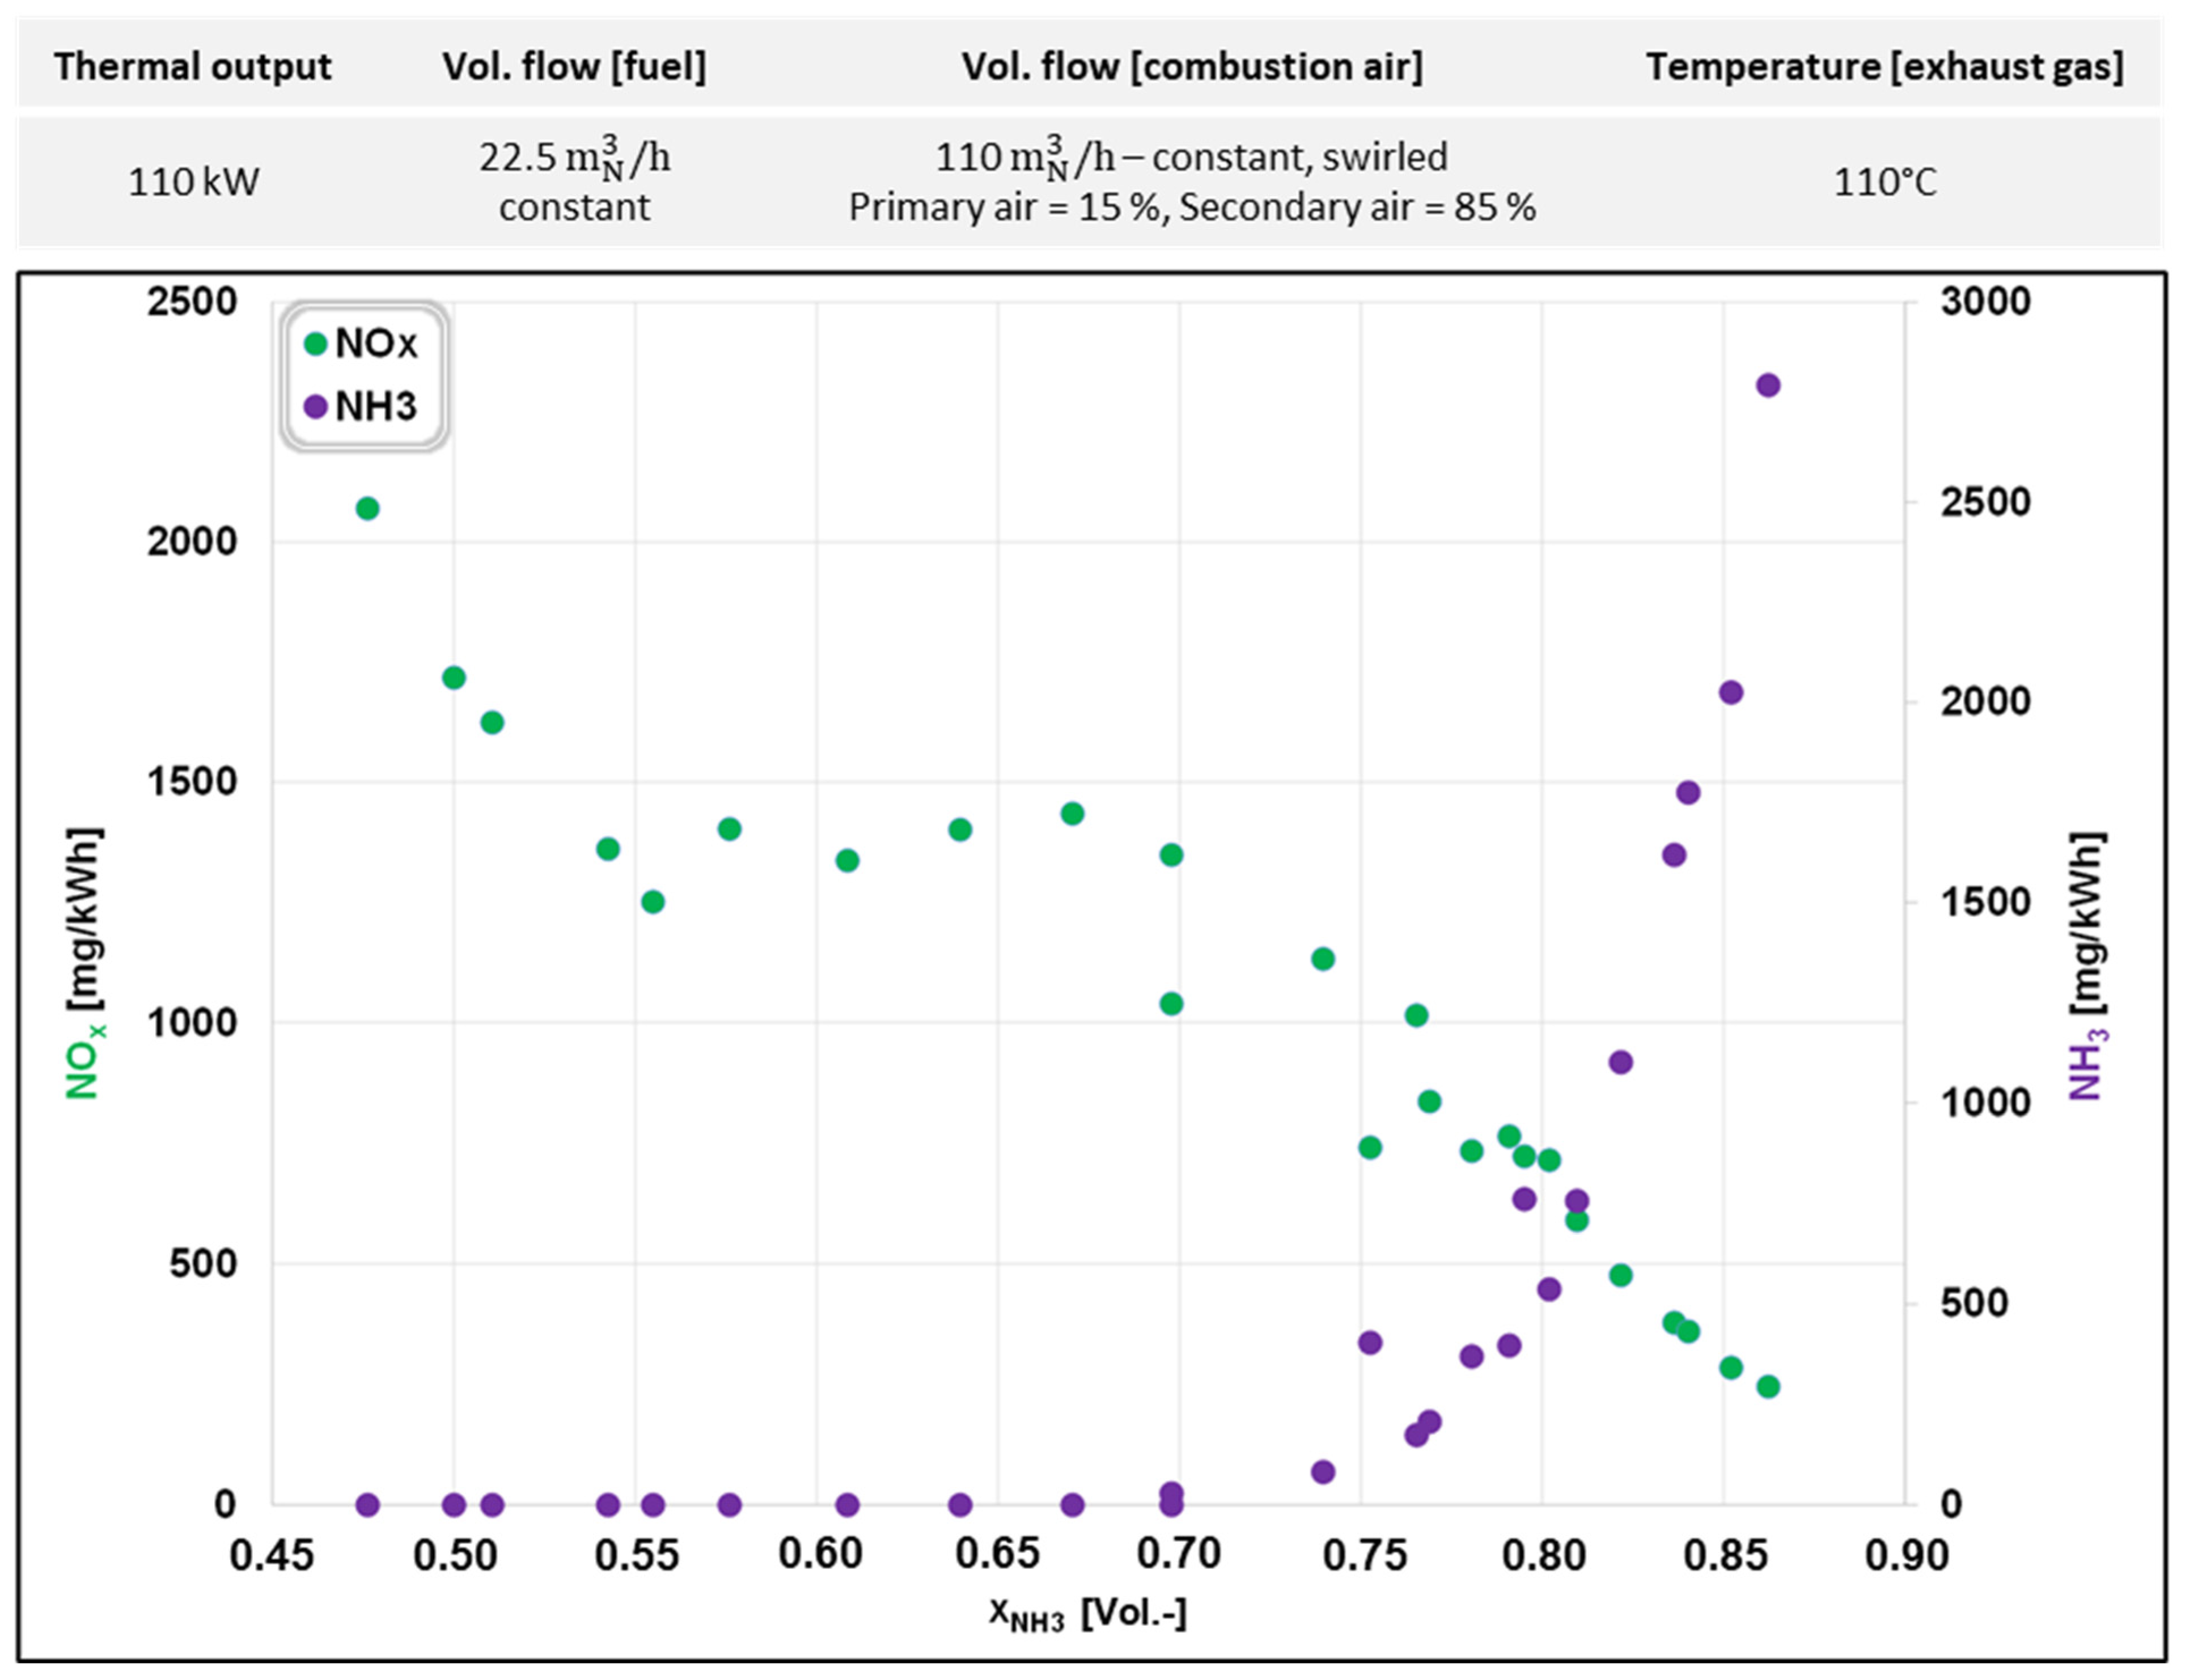
Figure 6 shows the NOx and NH3 concentrations in the flue gas as a function of the NH3 portion in the fuel mixture achieved by the 110 kW thermal output of the water-cooled combustion chamber. In a swirl mode, 110 m N 3 / h combustion air was supplied, 15% as primary air and the rest as secondary air.
To compensate for the difference between the heating values of NH3 (18.6 MJ/kg) and natural gas (34–52 MJ/m3, depending on location of origin), NOx and NH3 concentrations are plotted in energy units, mg/kWh, rather than mg/ m N 3 , as usual. Due to technical issues, the acquisition of the Ammonia volume flow data was interrupted occasionally. In these instances, the NH3 portion in the fuel mixture was partly calculated from the measured flue gas concentrations of the H2O vapor, O2 and CO2. The calculated values deviated by 10% to 15% from the experimentally measured ones.
The Ammonia slip in the exhaust gas hit a maximum of 2800 mg/kWh at NH3 fuel fraction x N H 3 = 0.86. The rapid increase in NH3 concentrations in the flue gas with the increasing NH3 portion (from x N H 3 = 0.70 onwards) in the fuel mixture suggests a significant amount of unburned ammonia. This is highly undesirable due to various possible negative impacts, including the following: (1) In the atmosphere, Ammonia can react with SO2 and/or NOx to form fine particles of Ammonium sulfate ((NH4)2SO4) and/or Ammonium nitrate (NH4NO3). These particles can significantly reduce the air quality or contribute to the formation of haze, which poses a serious risk to human health and the environment [13,42,110,149]. (2) NH3 is toxic and irritates the eyes and the respiratory system. (3) Ammonia is corrosive and thus can damage equipment, which results in higher maintenance costs [11,13,149]. (4) Unutilized Ammonia is simply wasted, and will eventually inflate the operational expenditures.
A reaction between the nitrogen oxides in the flue gas and the unburnt Ammonia resulted in a decrease in the NOx concentration from 2100 mg/kWh to approx. 250 mg/kWh.
Although the combustion air was supplied at maximum swirl all the time, with ammonia fractions in the fuel mixture larger than 0.86, the flame could not be sustained and, consequently, the burner continuously went out. For that reason, further investigations of ignition and flame stability improvements were carried out in the isothermal combustion chamber.

3.2. NH3 Combustion in an Isothermal Combustion Chamber

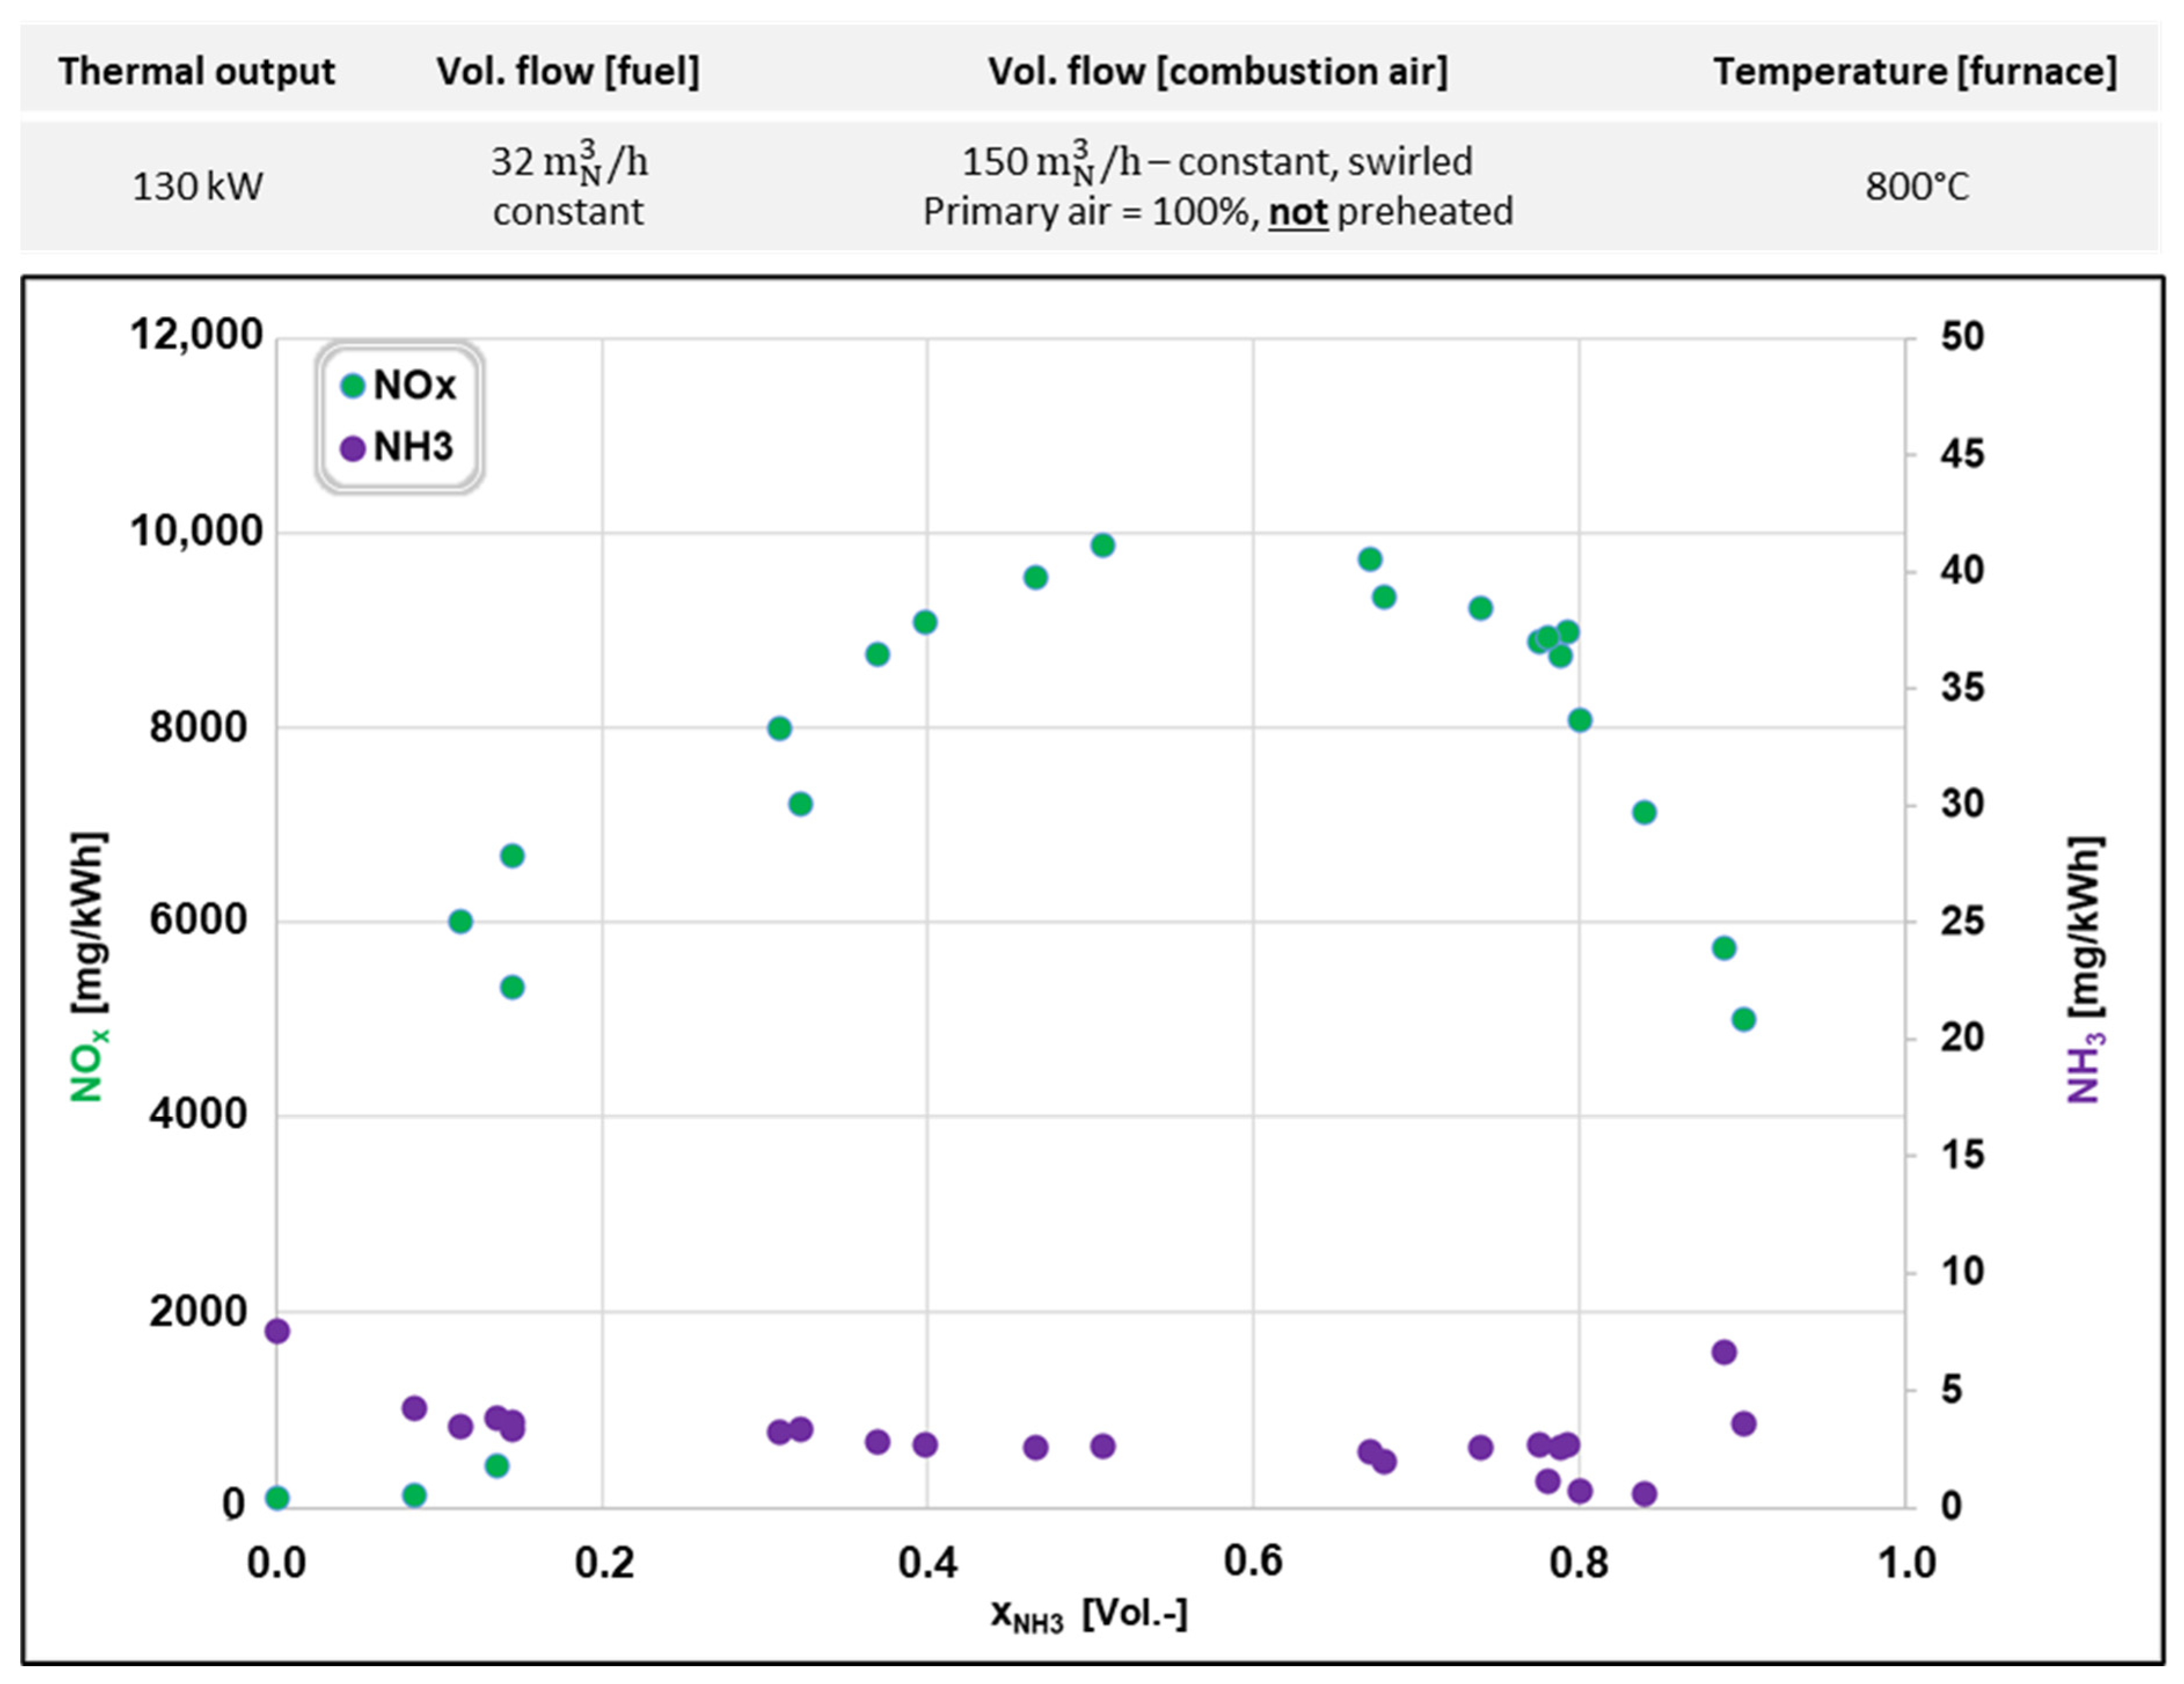
Prior to the Ammonia combustion experiments, the isothermal combustion chamber was preheated to 800 °C by means of the radiant tubes and a natural gas flame. All of the combustion air was added as primary air and was not preheated. Similarly to in the trial runs in the water-cooled combustion chamber, a mixture of natural gas and Ammonia with a gradually decreasing natural gas fraction and increasing NH3 fraction, respectively, was burned, and the flame kept burning until an Ammonia content of 90% was reached. It was not possible to secure operation of the burner with 100% NH3 under these experimental conditions.
As shown in Figure 7, the NOx concentration reached 5015 mg/kWh. It increased with the increasing Ammonia fraction in the fuel, x N H 3 , until the latter equaled 0.6, after which further increasing the Ammonia content resulted in a decreasing NOx concentration. For almost the entire duration, the concentration of the NH3 slip remained low at approximately 3.6 mg/kWh, though a minimal increase was observed at x N H 3 ≈ 0.9.
The CO concentration ranged from 0.15 m g / m N 3 (dry) (0.12 ppm) to 0.20 m g / m N 3 (dry) (0.16 ppm), indicating very good burnout. The corresponding CO2 concentration varied between 80 m g / m N 3 (dry) (4.07 vol.%) and 213 m g / m N 3 (dry) (10.84 vol.%).
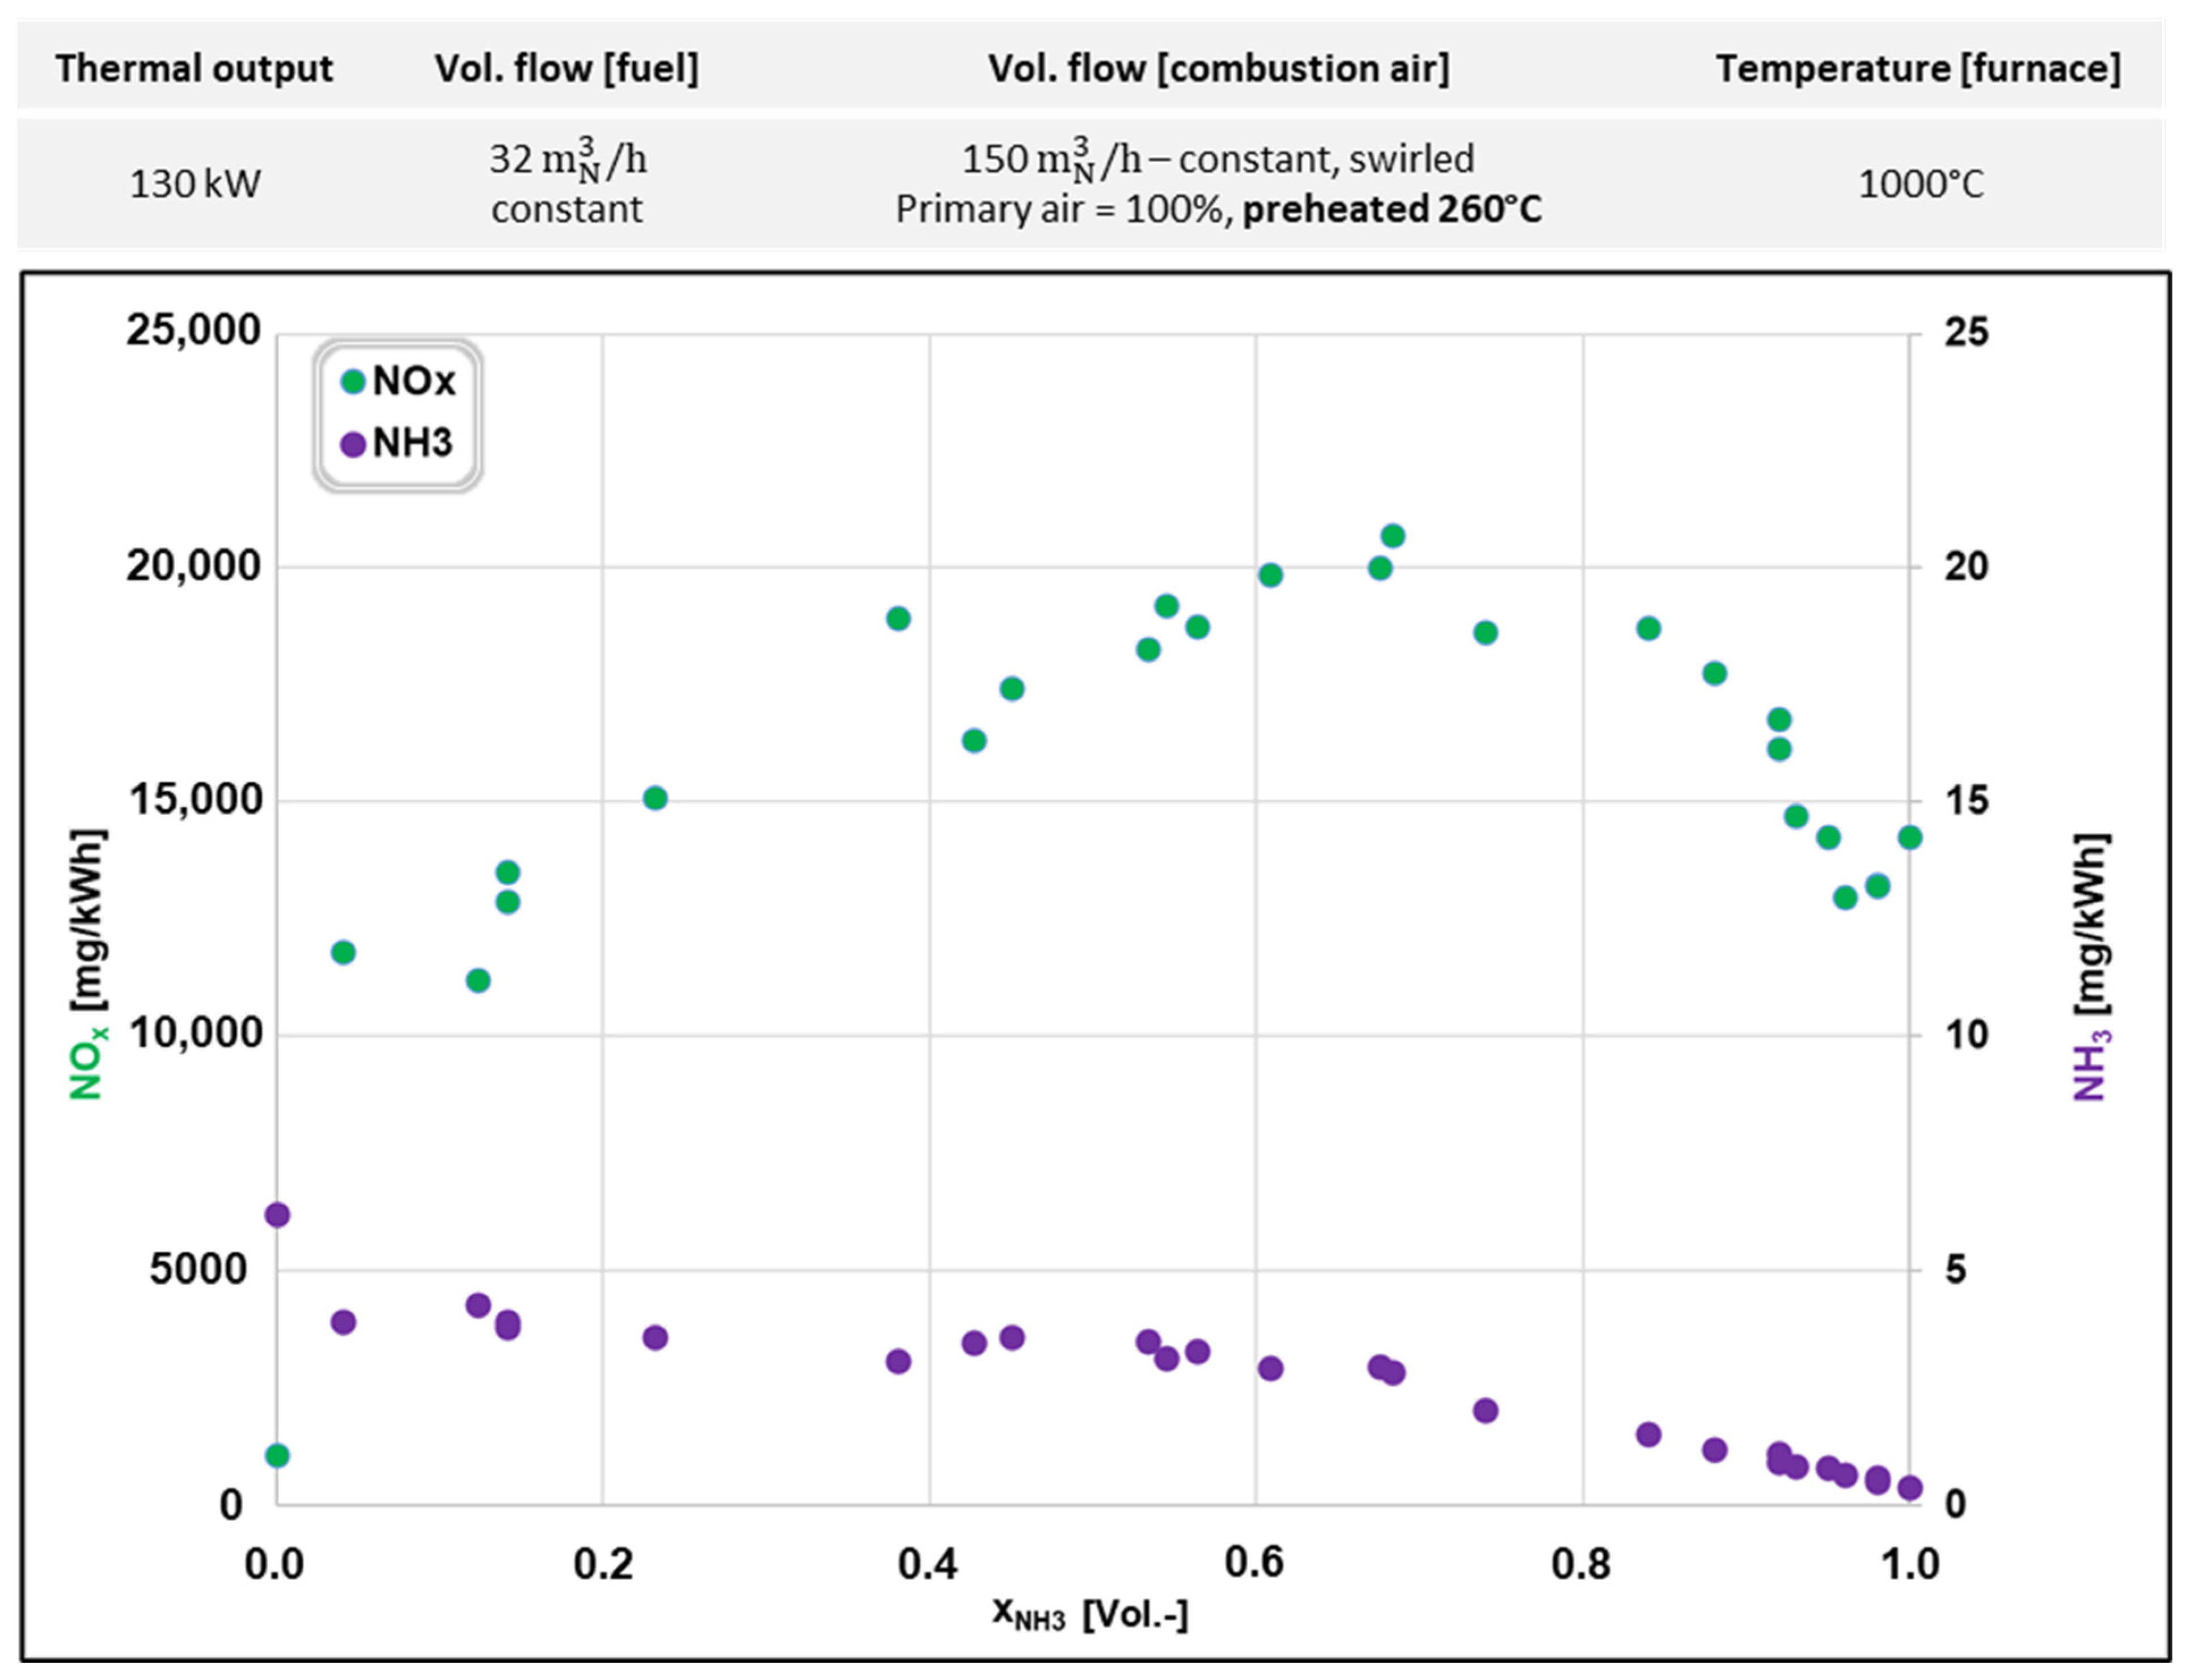
In order to secure stable NH3 ignition, the combustion chamber temperature was increased to 1000 °C with the aid of the radiant tubes, and, to further support the ignition, the combustion air was preheated to 260 °C. The whole volume was supplied again as primary air only in a swirl mode, and the absence of secondary air prevented convective cooling. Consequently, the radiant energy of the red-hot flame tube mounted on the combustion chamber wall (inside, at the burner’s entrance port) could be transferred to the premixed flame as a portion of the ignition energy. In this way, by combining an increased furnace temperature, preheated combustion air and the installation of a flame tube, stable ignition/burning of a pure (100%) Ammonia flame was achieved. The resulting nitrogen oxide concentration was as high as 13,900 mg/kWh (approx. 14,900 mg/ m N 3 ) (Figure 8), while the concentration of the Ammonia slip was as low as 0.4 mg/kWh (approx. 0.42 mg/ m N 3 ) , which indicates a very good burnout.
The NOx concentration reached a maximum of 20,700 mg/kWh (approx. 23,600 mg/ m N 3 ) with an NH3 fraction in the fuel mixture of 68%.
The NH3 slip concentration was below the value of 30 mg/ m N 3 considered the legal limit in Germany [150], but the NOx concentrations in the exhaust gas very significantly exceeded the legal limit value of 150 mg/ m N 3 [150].
Before reaching a 100% Ammonia fraction, the CO concentration decreased from approximately 15 mg/ m N 3   ( d r y ) (0.12 ppm) to 0 mg/ m N 3   ( d r y ) , indicating a highly efficient combustion process. During the same period, the CO2 concentration dropped significantly from about 227 mg/ m N 3   ( d r y ) ( 11.57 vol. %) to just 12 mg/ m N 3   ( d r y ) (0.59 vol. %).

3.3. NOx Reduction Through Oscillating Combustion of Ammonia in an Isothermal Combustion Chamber

Generally, oscillating combustion is part of air and fuel staging, implemented not on a local scale but in stages over time. In other words, the oxidant or the fuel flow is interrupted in time [127].
In our study, the Ammonia fuel flow rate was periodically interrupted, resulting in alternating periods with different stoichiometric ratios following one after another.
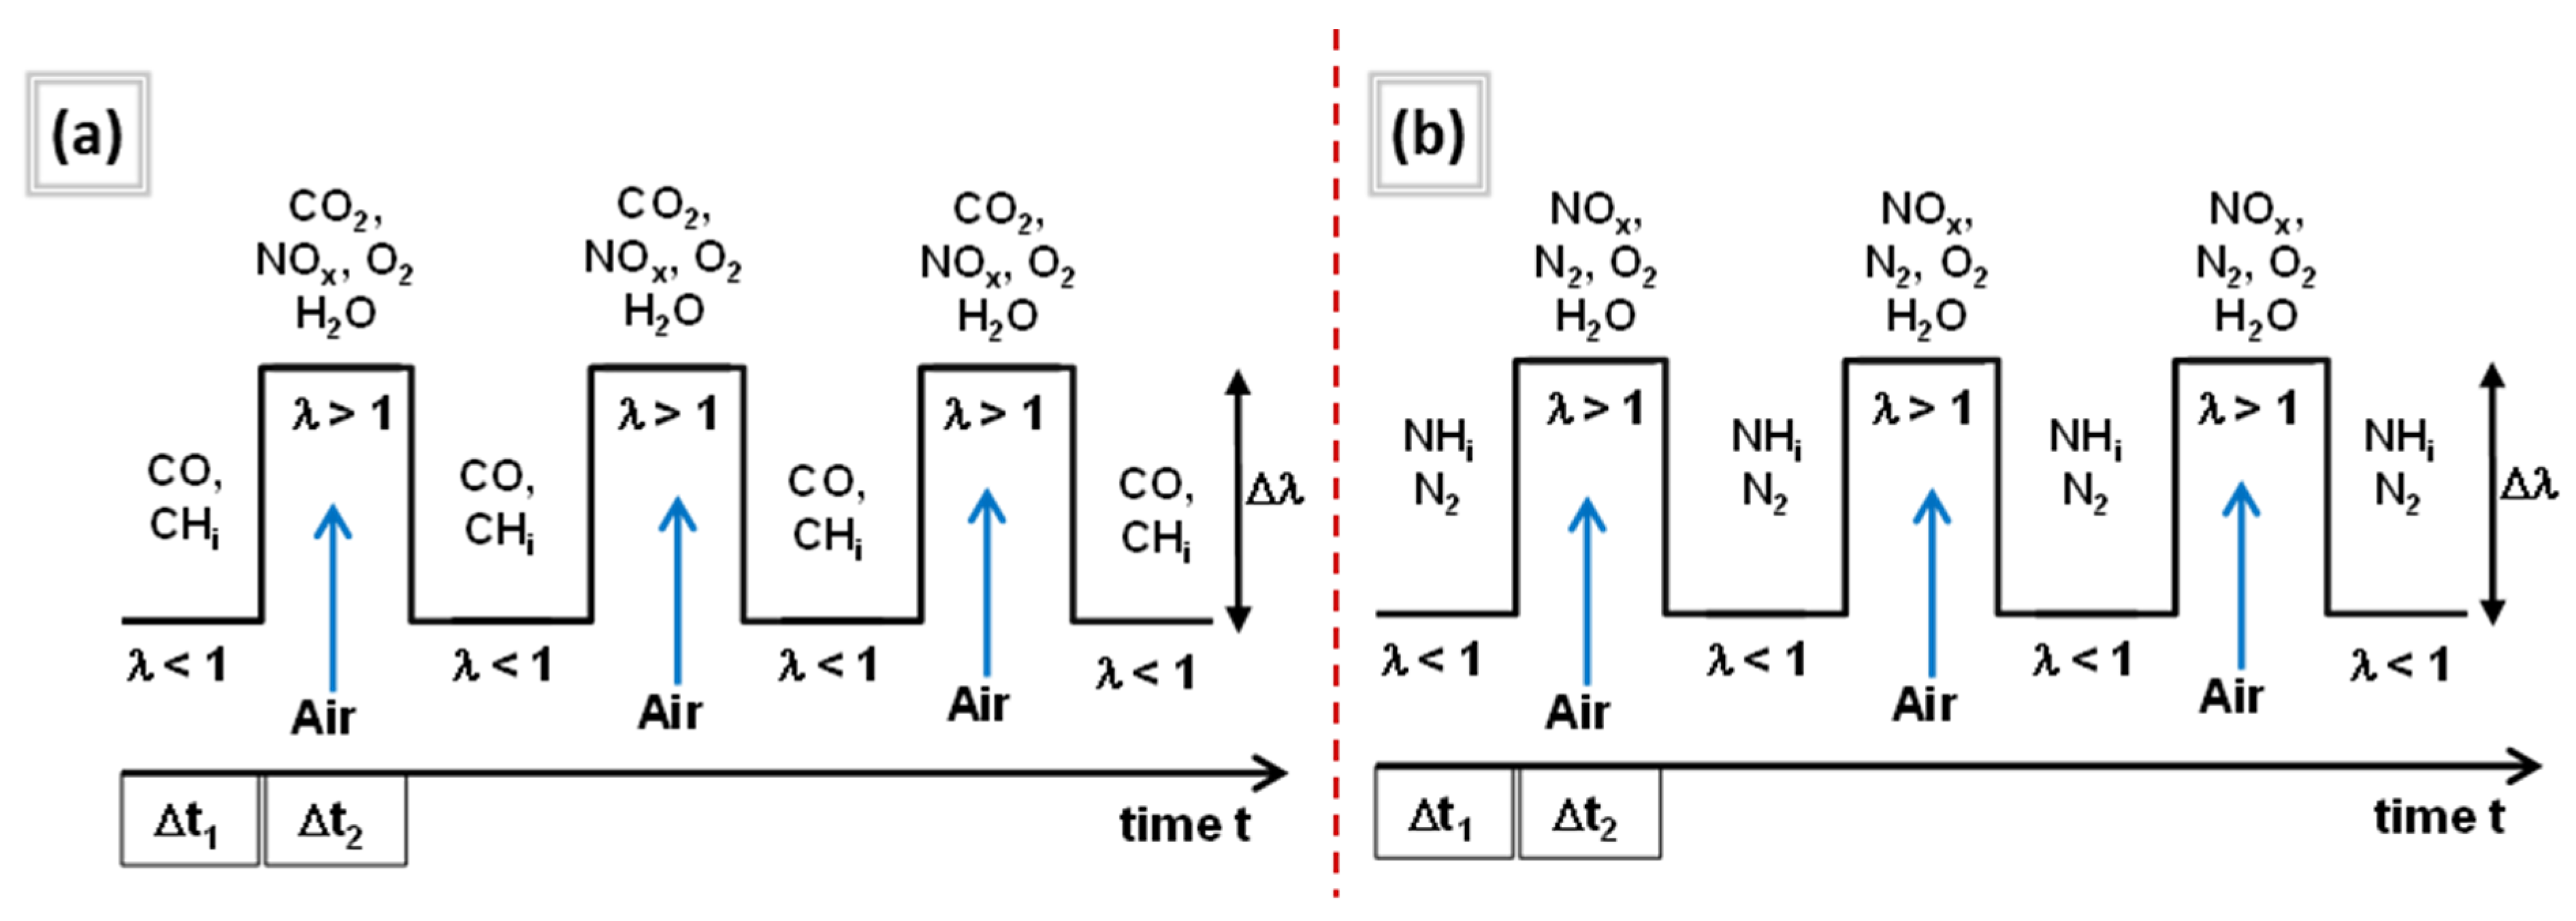
The basic principle of NOx reduction by oscillation with the amplitude ∆ is shown in Figure 9. In the fuel-rich periods (∆t1), through CH4 combustion (a), significant amounts of CO, H2 and possibly residual hydrocarbons (CHi) are generated, while, in the fuel-poor periods (∆t2) (with increased air addition), combustion leads to the formation of CO2, H2O and NOx.
Similarly, in the case of NH3 combustion (b), during the fuel-rich time periods (∆t1), the combustion products are predominantly N2, H2 and H2O. In these periods, the air ratio drops below 1, which leads to a lower flame temperature, and results in reduced NOx formation [128,151]. Conversely, in the fuel-deficient time intervals (∆t2), the increased air supply (air ratio > 1) leads to a higher flame temperature (high-temperature reaction zone), which results in the formation of NOx too [128]. When projected over the time scale, the average NOx concentration is reduced, and the efficiency of NOx reduction by the oscillating combustion is influenced by the oscillating frequency and oscillating amplitude [128].
The results from the oscillating combustion of pure Ammonia are shown in Figure 10. Prior to the oscillating mode of operation, the ammonia flame was initiated and run stably for approx. 30 min. In this period, the NOx emissions remained around 14,200 mg/kWh (corresponding to about 14,500 m g / m N 3 dry), and the Ammonia slip ran in the range of 0.4 mg/kWh. These values are roughly of the same magnitude as those shown in Figure 8.
Afterwards, the NH3 supply was realized in an oscillating manner. Starting at 2 Hz, the oscillating frequency was gradually lowered to 1 Hz. The highest NOx reduction of about 80% was recorded at 2 Hz, where its concentration decreased to approx. 2500 mg/kWh (~2590 mg/ m N 3 ) ; however, the Ammonia slip increased to around 33 mg/kWh (~33.4 mg/ m N 3 ) . At an oscillating frequency of 1 Hz, the nitrogen oxide concentration decreased to 7240 mg/kWh (~7540 mg/ m N 3 ) , which is not as high the reduction of 48% but is still significant. Due to technical limitations, the effect of oscillating frequencies higher than 2 Hz was not investigated.

3.4. Economic Analysis

3.4.1. Cost Analysis of Ammonia Production in Norway Without CO2 Pricing

At first, the operating costs (OpEx) of gray and green ammonia production in Norway were calculated without taking into account the price of CO2 certificates. OpEx include materials, supplies, utilities, capital, maintenance and amortization costs, as well as taxes and insurance. The amortization period was set at 20 years and the capital costs were taken into account at an interest rate of 10%, based on capital expenditures (CapEx).
For gray ammonia production, the literature data for a plant with the best available technology (BAT) are used. Accordingly, the required thermal energy is 7.8 M W t h / t N H 3 [152], distributed as follows: 5 M W t h / t N H 3 for the supply of raw materials, 2.18 M W t h / t N H 3 for fuels, 0.39 M W t h / t N H 3 for electricity and 0.23 M W t h / t N H 3 for steam.
The operating costs of green ammonia production are based on an energy balance with an electrical energy power demand of 11.8 M W h e l / t N H 3 . Since the H2 for the green Ammonia synthesis is projected to be supplied by water electrolysis, the costs for water are included in the material costs too. A demand of 9 l H 2 O / k g H 2 is assumed, which corresponds to 1.6 t H 2 O / t N H 3 [153]. Table 3 summarizes the data required for the calculation of the operating costs.
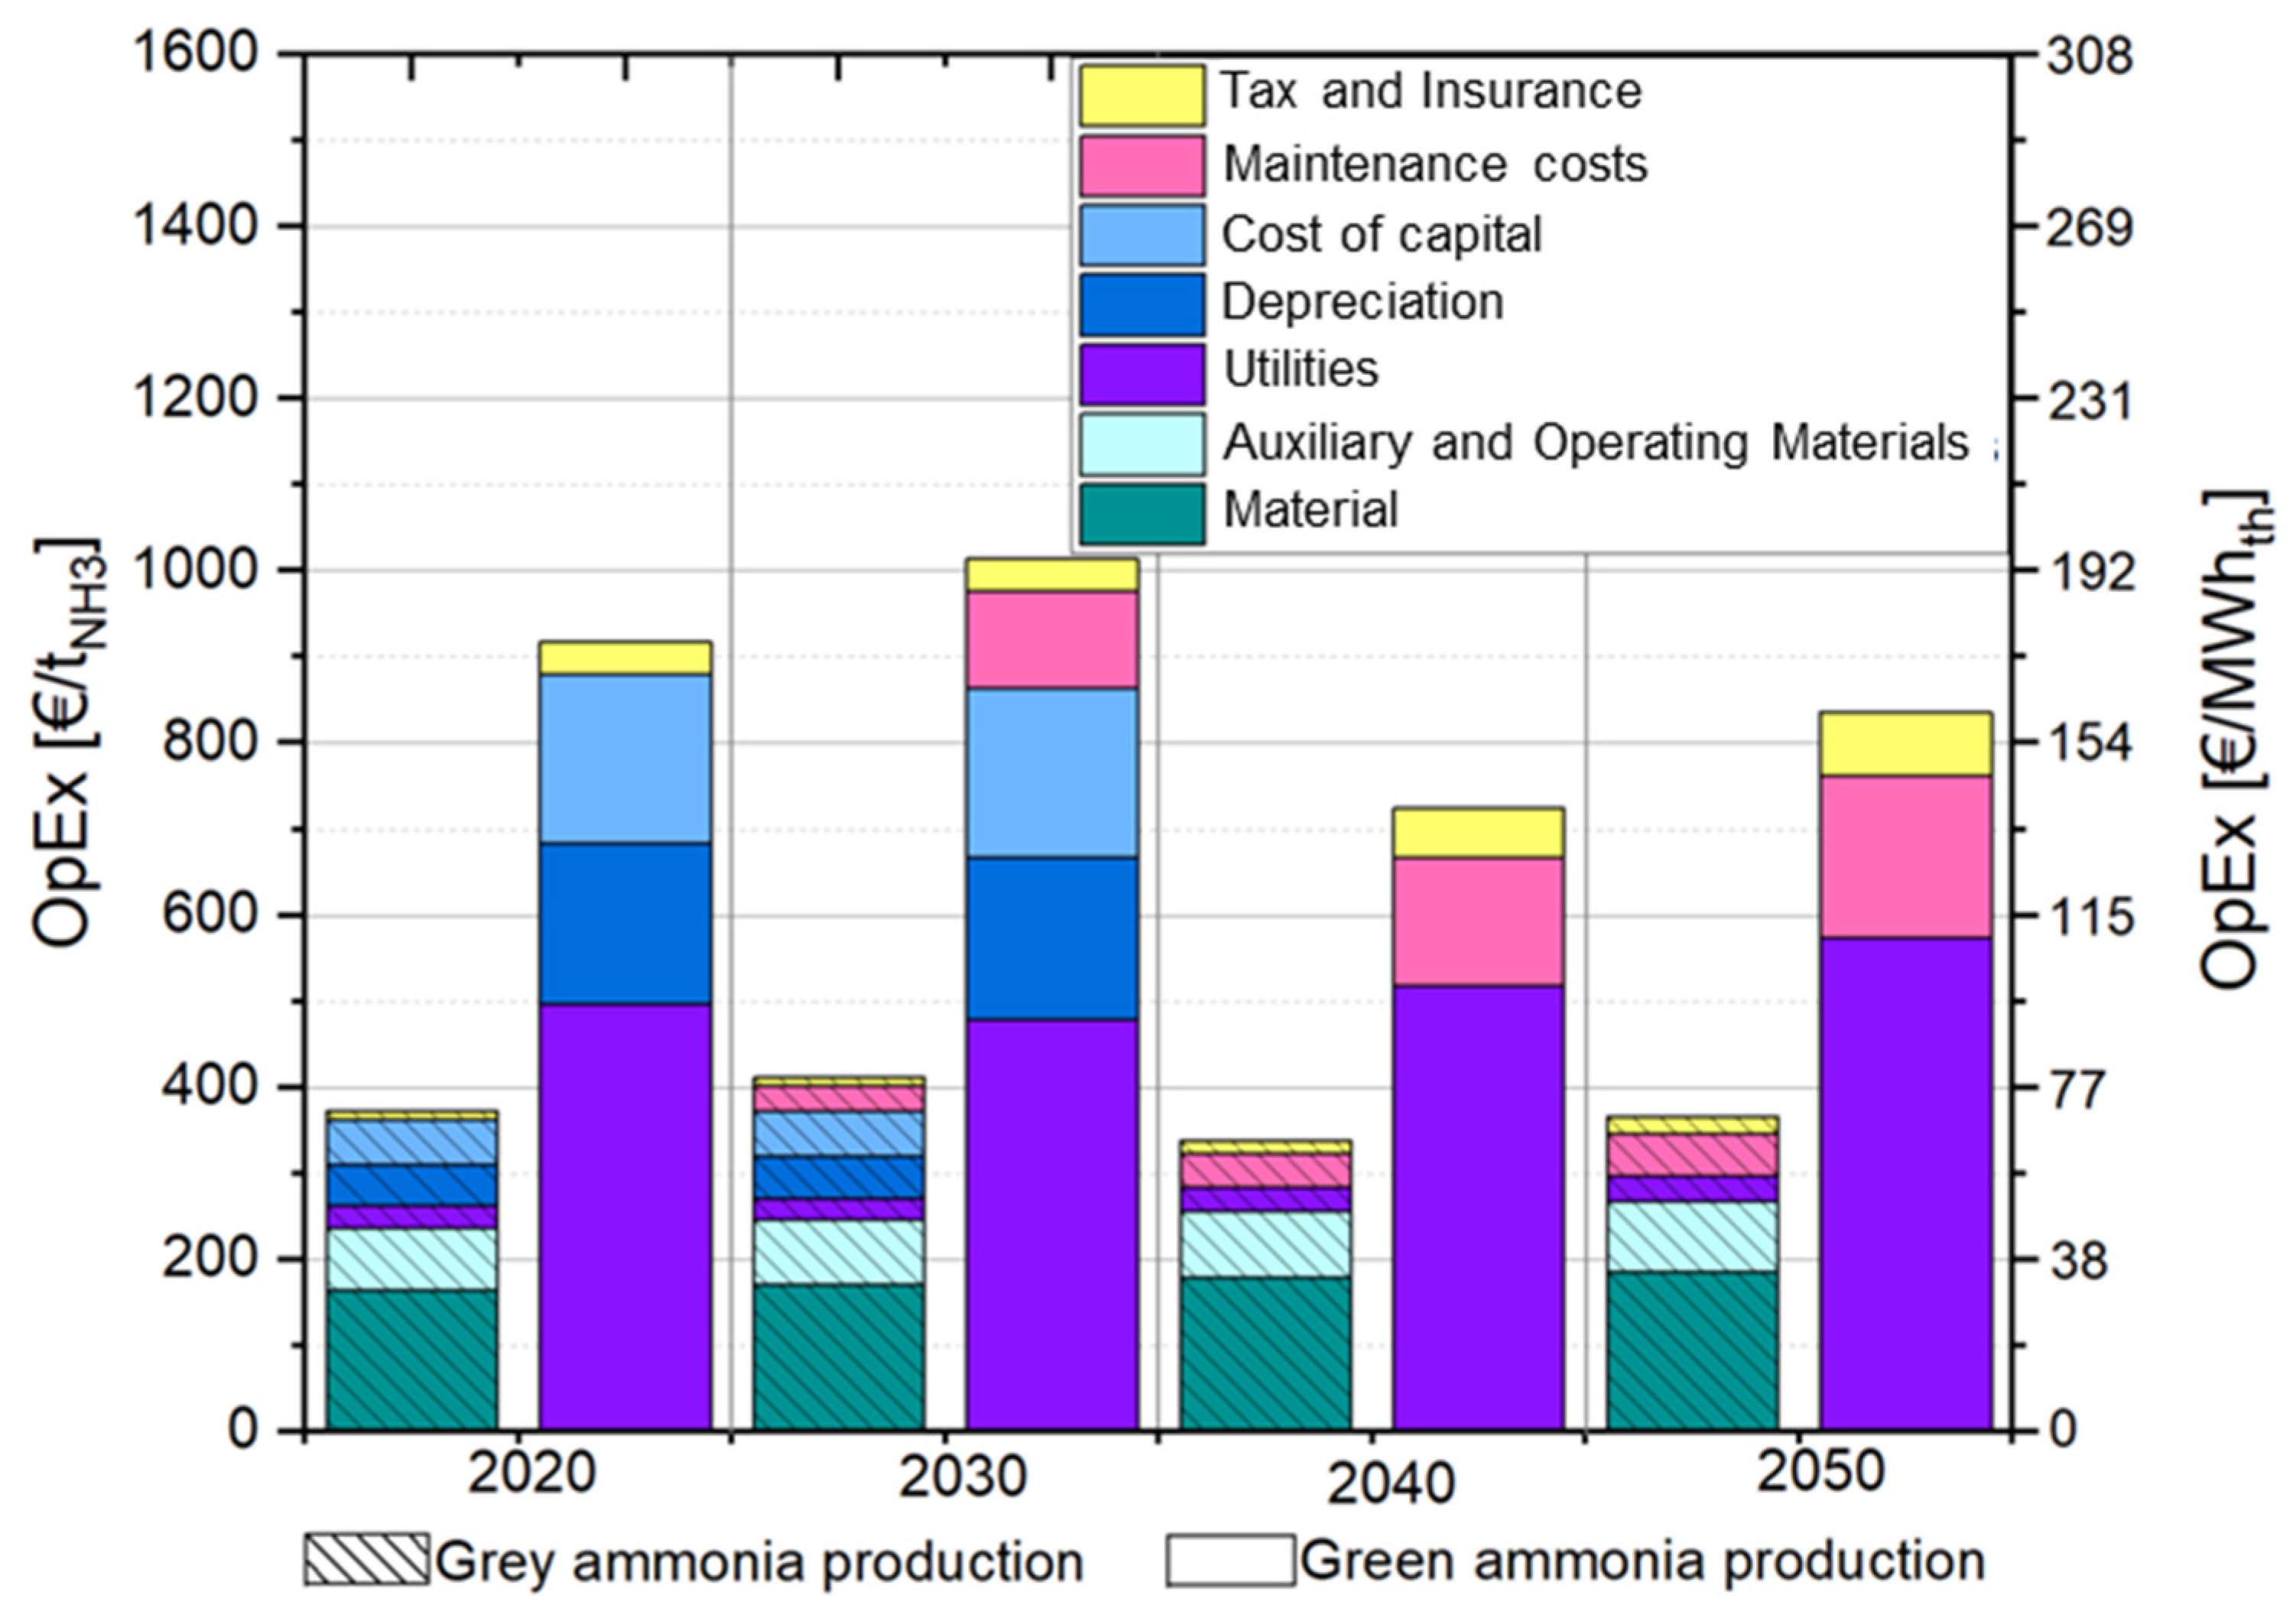
The calculated operating costs for gray and green ammonia production in Norway from 2020 to 2050 without considering CO2 pricing are shown in Figure 11.

3.4.2. Cost Analysis of Ammonia Production in Norway with CO2 Pricing

As early as 2003, the European Parliament and Council prepared a directive to establish a trading scheme for certificates for greenhouse gas emissions, hoping to stimulate industry to reduce them [158]. Although Norway is not a member of the EU, it is closely linked to the it through the EEA Agreement and the European Economic Community (EEC); thus, under the EEA Agreement, EU environmental and climate legislation also applies in Norway. Norway has also participated in the EU Emissions Trading System (EU ETS) since 2008. Therefore, the prices for CO2 emissions must be taken into account. Table 4 shows an estimate of CO2 certificate costs in the EU from 2020 to 2050.
The CO2 emissions of gray ammonia synthesis can vary depending on the age of the plant. In this case, a CO2 emission of 2 t C O 2 / t N H 3 , that of a state-of-the-art plant, was used [152]. Green ammonia synthesis has a CO2 emission of 0.17 t C O 2 / t N H 3 , which is related to the transport of gases within the production plant [152].
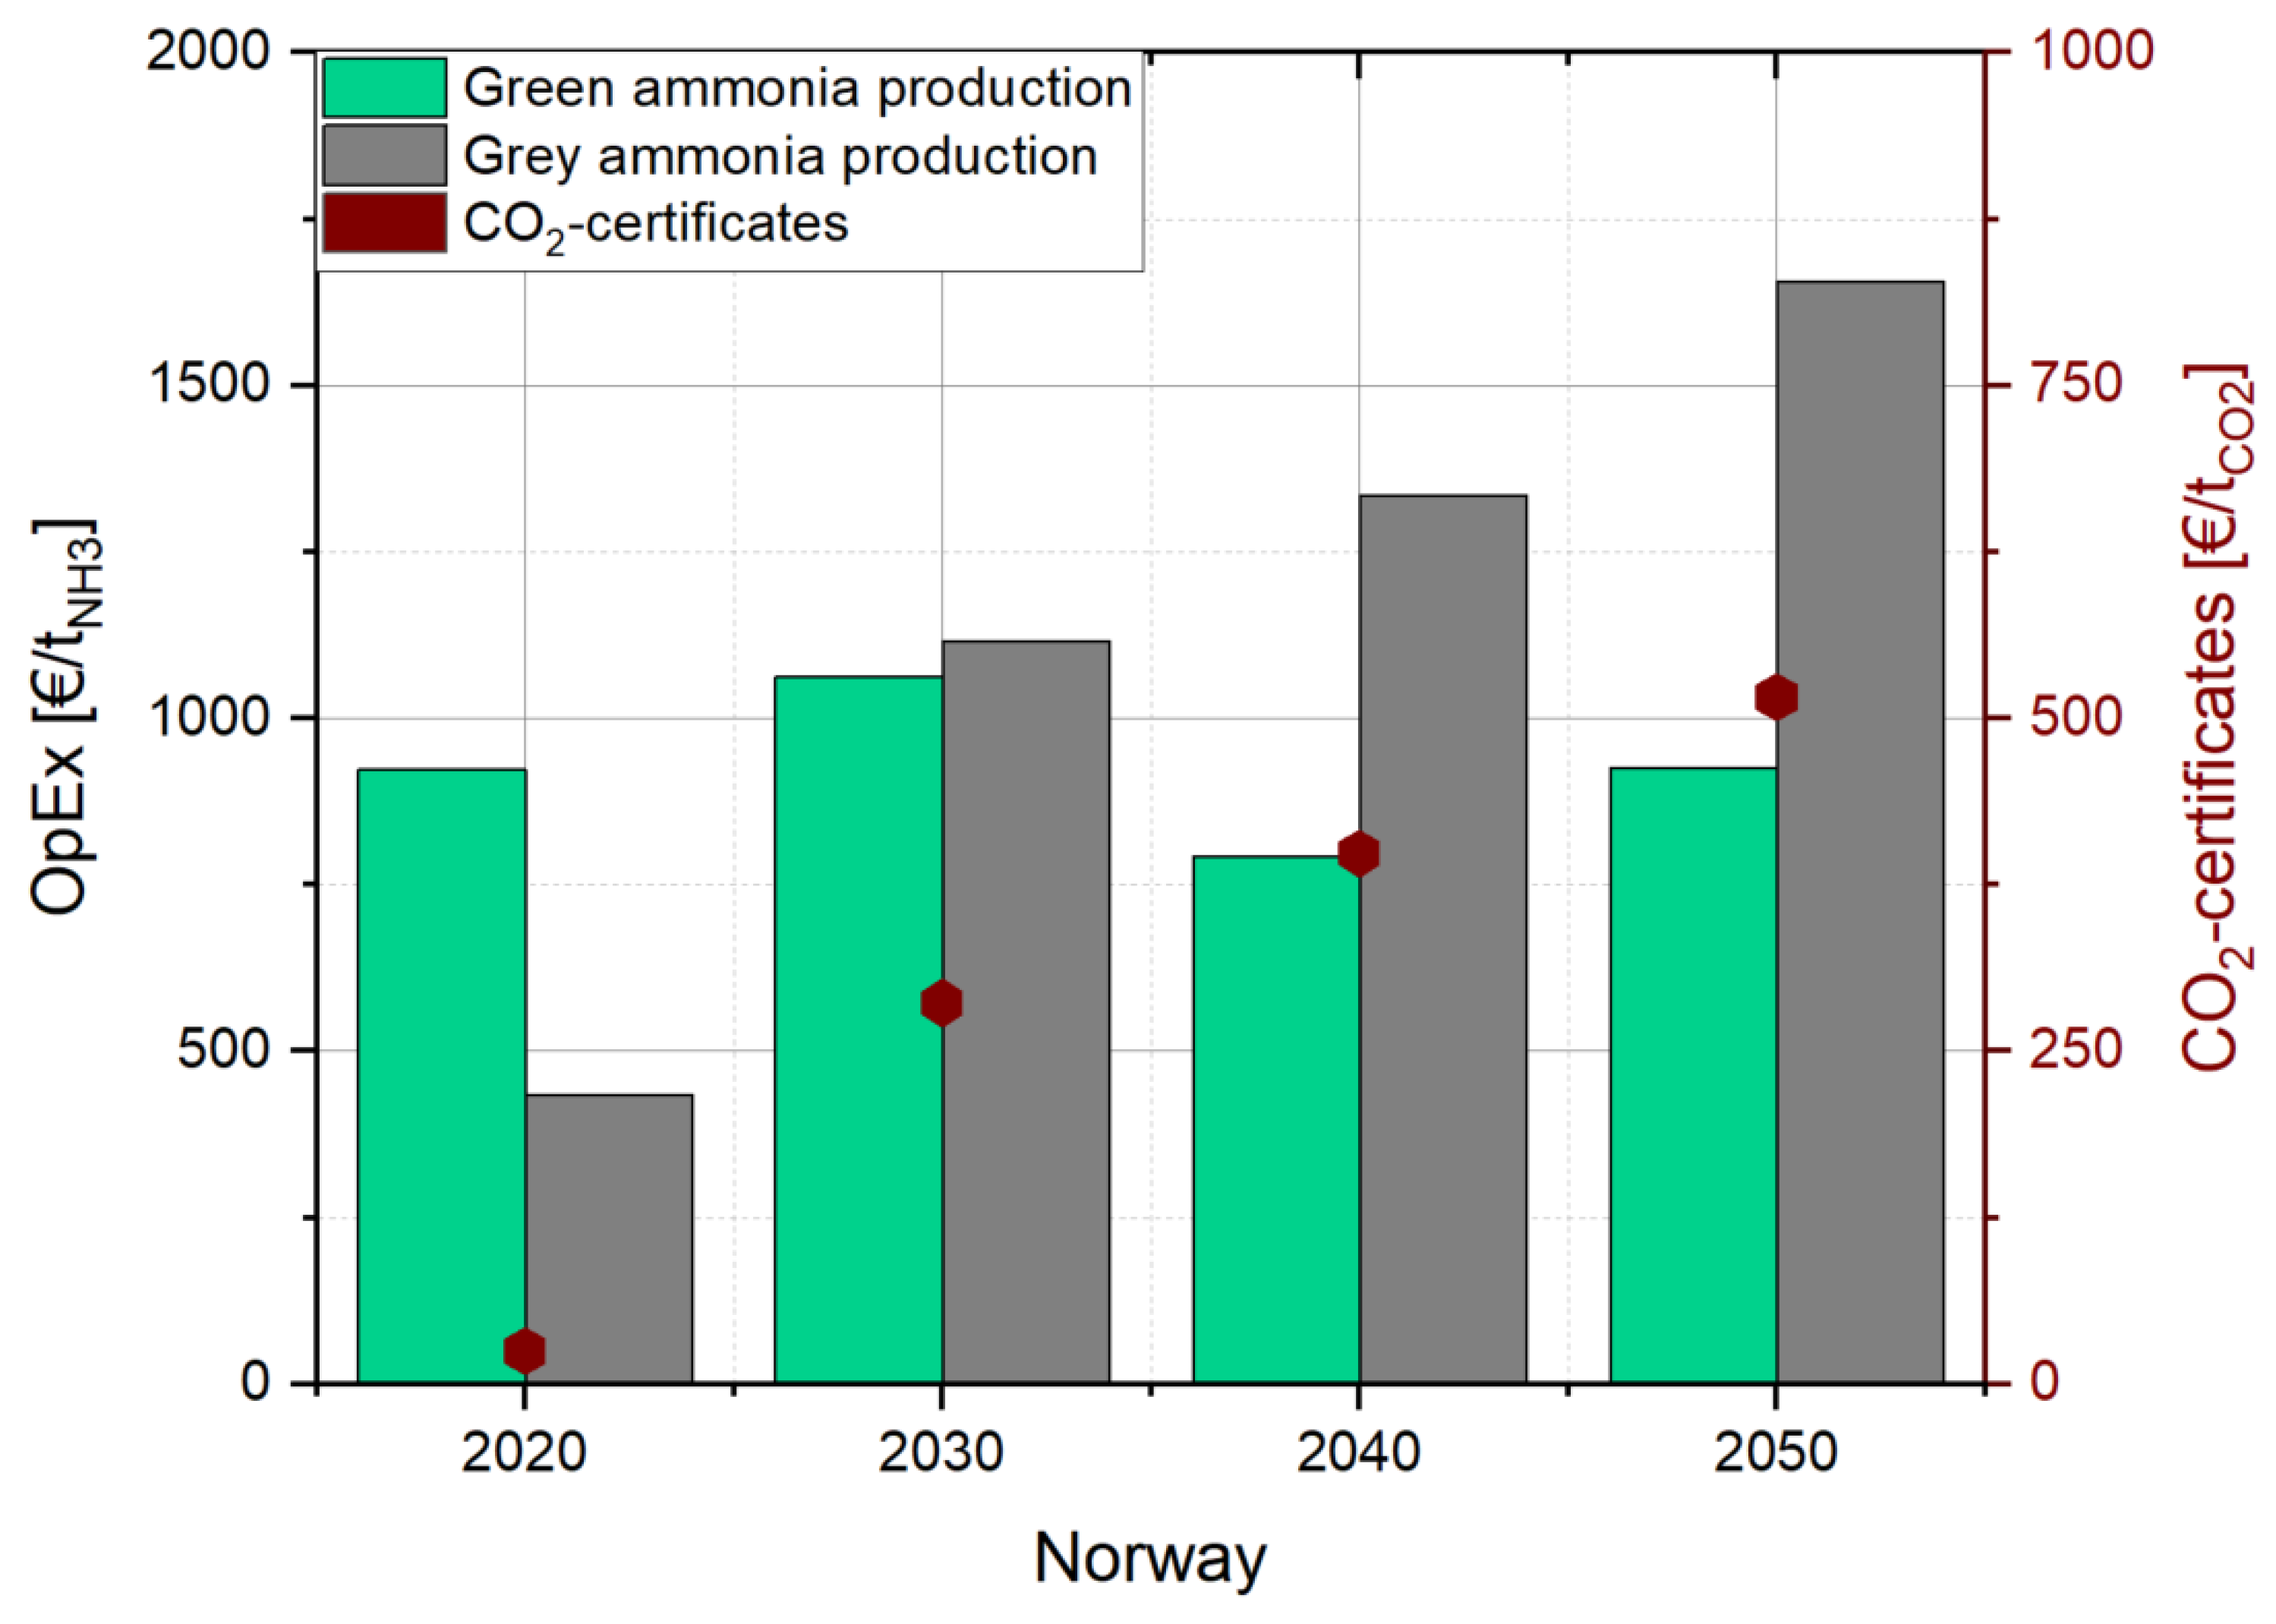
The price of CO2 certificates in 2020 was around 25 / t C O 2 (Table 4) and is estimated to increase to 515 / t C O 2 by 2050 [157,159] (Figure 12).

3.4.3. Cost Analysis of the Entire Ammonia Process Chain

The process chain comprises the production of ammonia in Norway, its subsequent transportation to Germany, storage in Germany, combustion in a boiler combustion plant and, finally, exhaust gas cleaning (Figure 13). The costs are listed in Table 5.
A distance of 608 km is assumed for the transportation of ammonia from Norway to Germany. According to [161], sea transportation is more cost-effective than pipeline transportation for distances over 300 km. Therefore, the transportation of Ammonia by ship is considered here, and freight rate, capacity, transport speed and port charges are taken into account. Ammonia storage requires special infrastructure and safety precautions, so construction and operating costs for NH3 storage facilities are included, as well as maintenance costs. For boiler combustion of ammonia for heat generation, the investment and operating costs are calculated for a 100 MW plant.
The aggregated process chain costs of green and gray NH3 production are visualized in Figure 14. The largest share of costs for both relates to the production itself; for the green and gray ammonia process chains, respectively, approx. 93% and 89% of the total costs result from Ammonia synthesis. The transport, storage, boiler firing and flue gas cleaning have a smaller impact.
From the experimental investigations, an NOx concentration of 2920 mg/kWh in the exhaust gas was determined for oscillating combustion at 2 Hz. Since the NOx concentration in the exhaust gas is not permitted to exceed 100 m g / m N 3 dry (at 3 vol. % O2 content) [158], which corresponds to 99.73 mg/kWh, post-combustion treatment of the exhaust gas must take place. For this purpose, a combination of SNCR and SCR was selected.
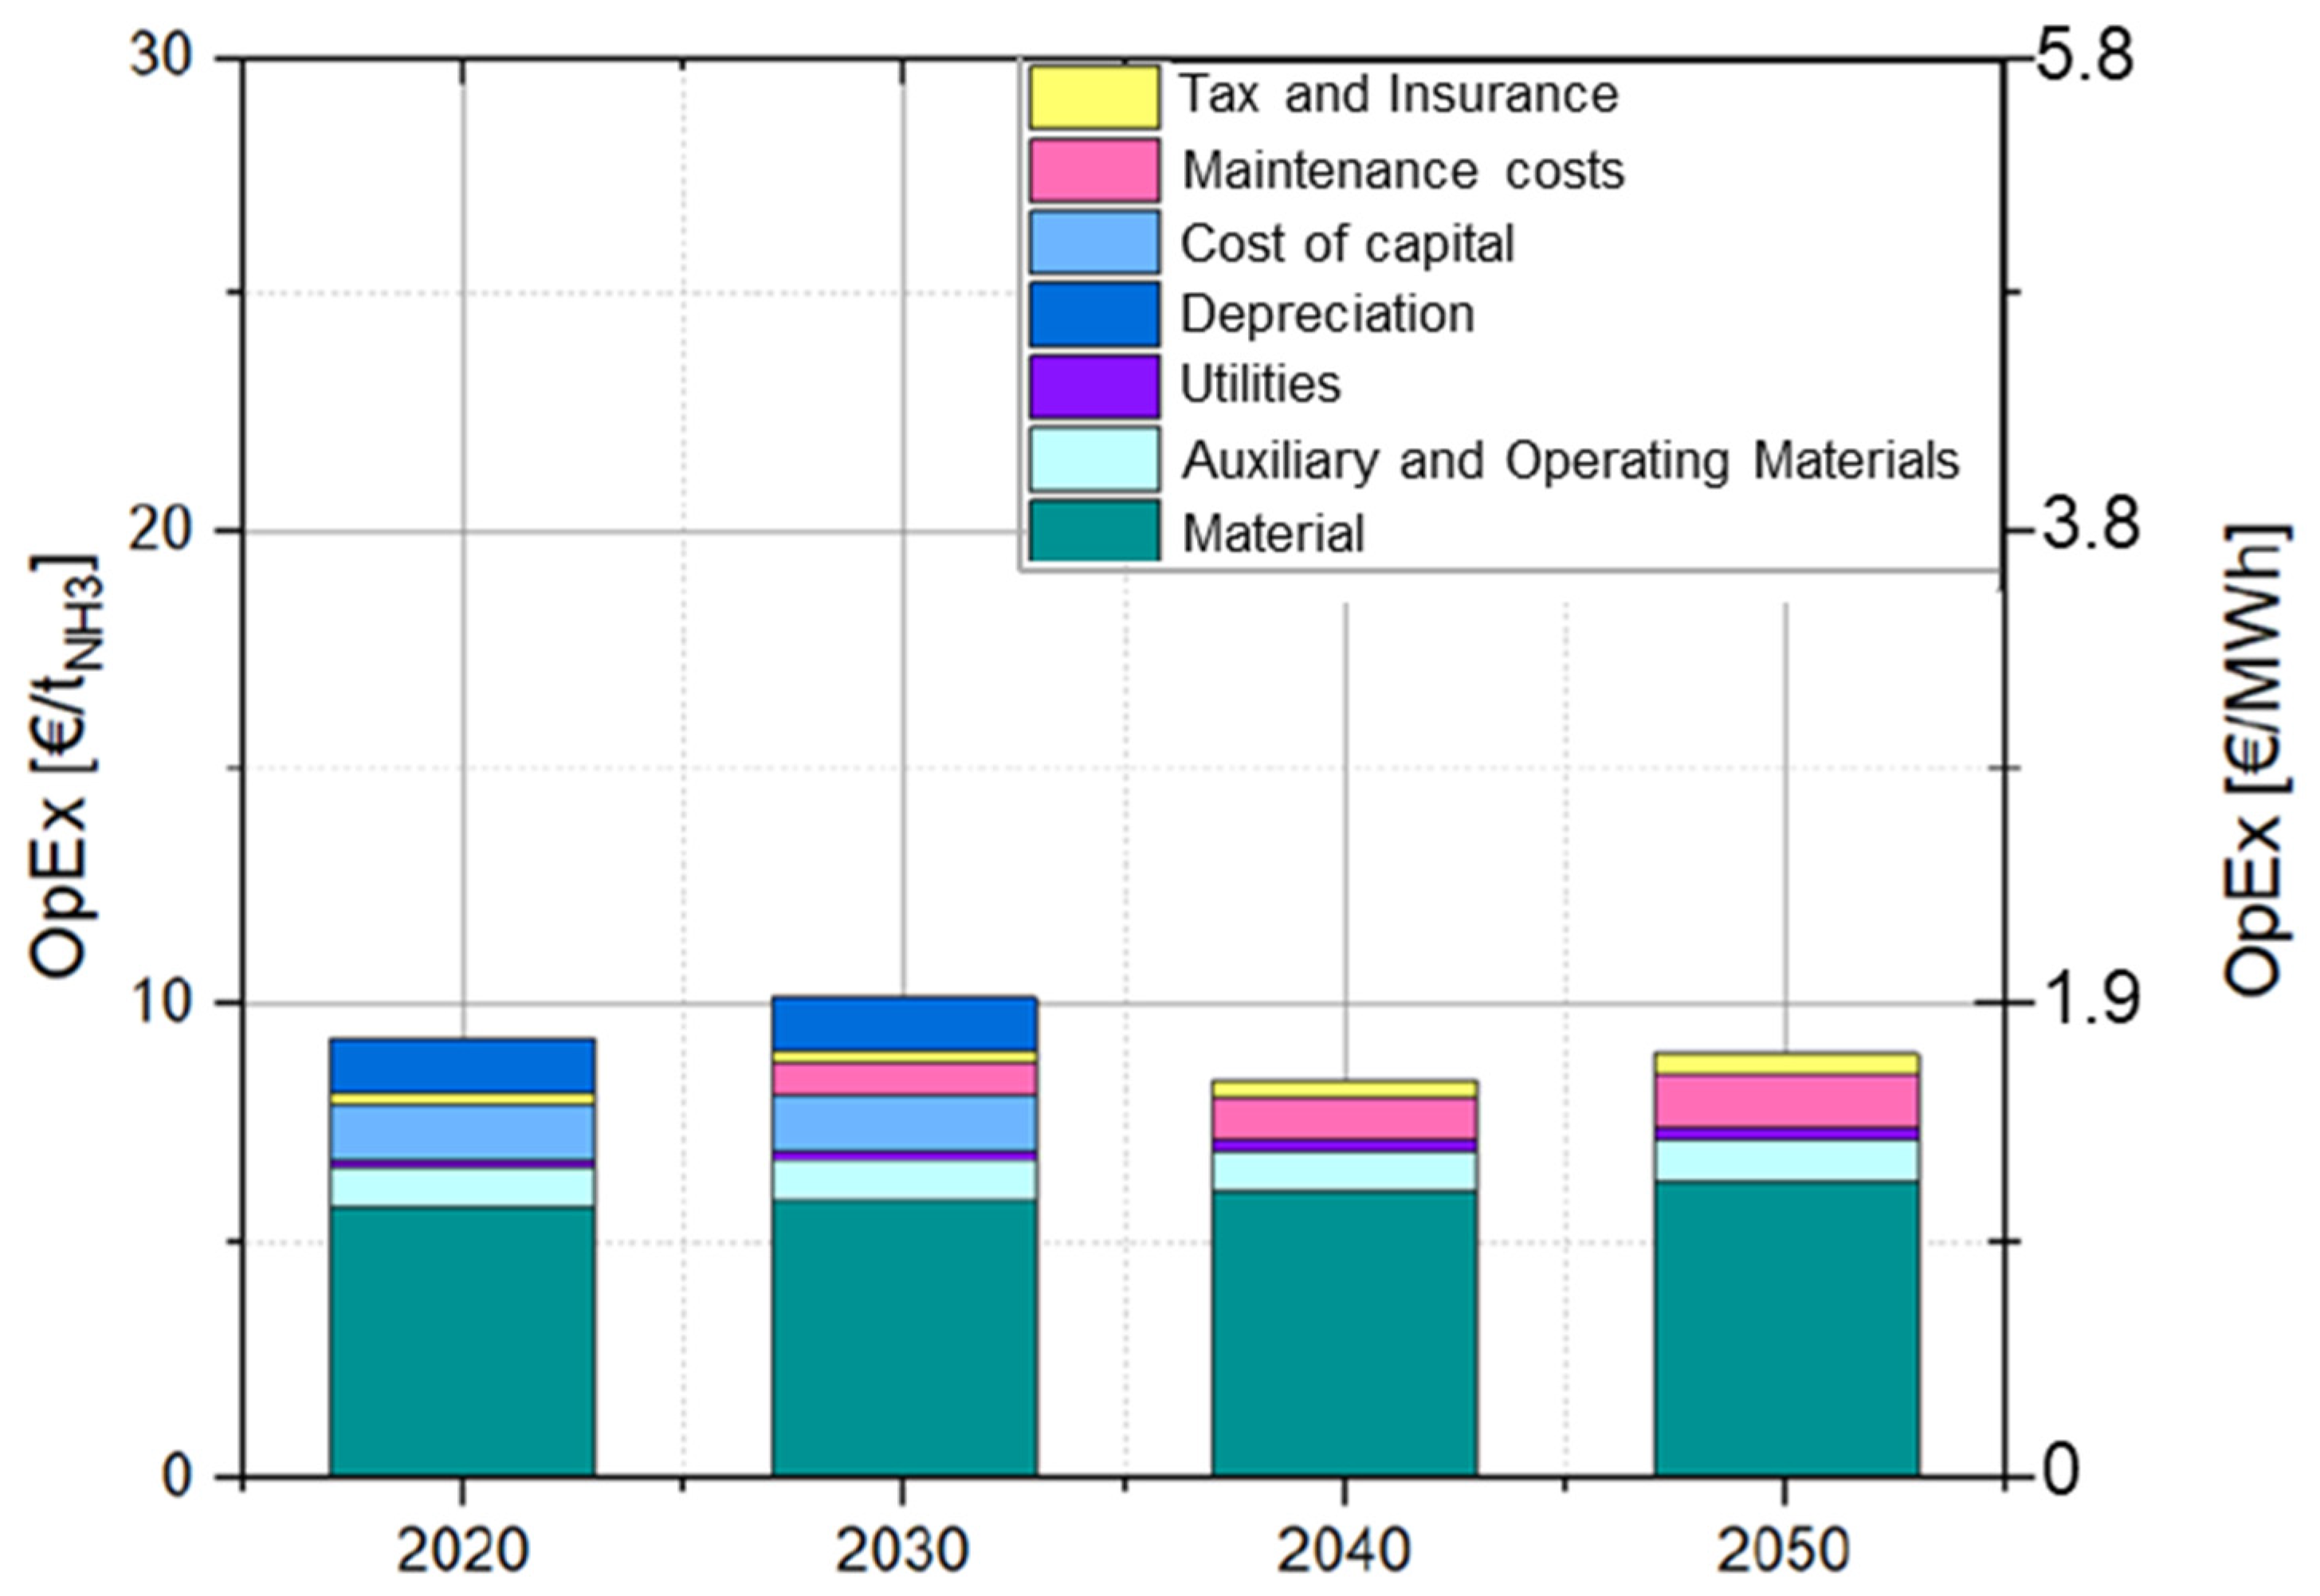
The total cost estimate is about EUR 3.5 million, without consideration of the expenses for various peripheral systems such as Ammonia storage, dosing and control. Due to the higher exhaust gas concentrations, the combined SNCR and SCR process requires more raw materials, considered in the OpEx as material and auxiliary expenditures. The material costs amount to about 6 / t N H 3 and thus account for the largest share of the total costs (Figure 15).
Based on the experimentally obtained NOx emissions data from the combustion of NH3, Table 6 shows the investment and operating costs for operation with and without oscillation.
The reduction rates are adapted to the input concentrations. A simplified assumption is made of a comparably high investment volume for both scenarios, as a catalyst is always needed for the secondary NOx reduction (SCR or SNCR). Due to the differently distributed reduction rates, the consumption of operating resources is not reduced linearly with the NOx concentrations, but is halved under the assumptions made here. The corresponding operating costs for exhaust gas cleaning are listed in Table 7.
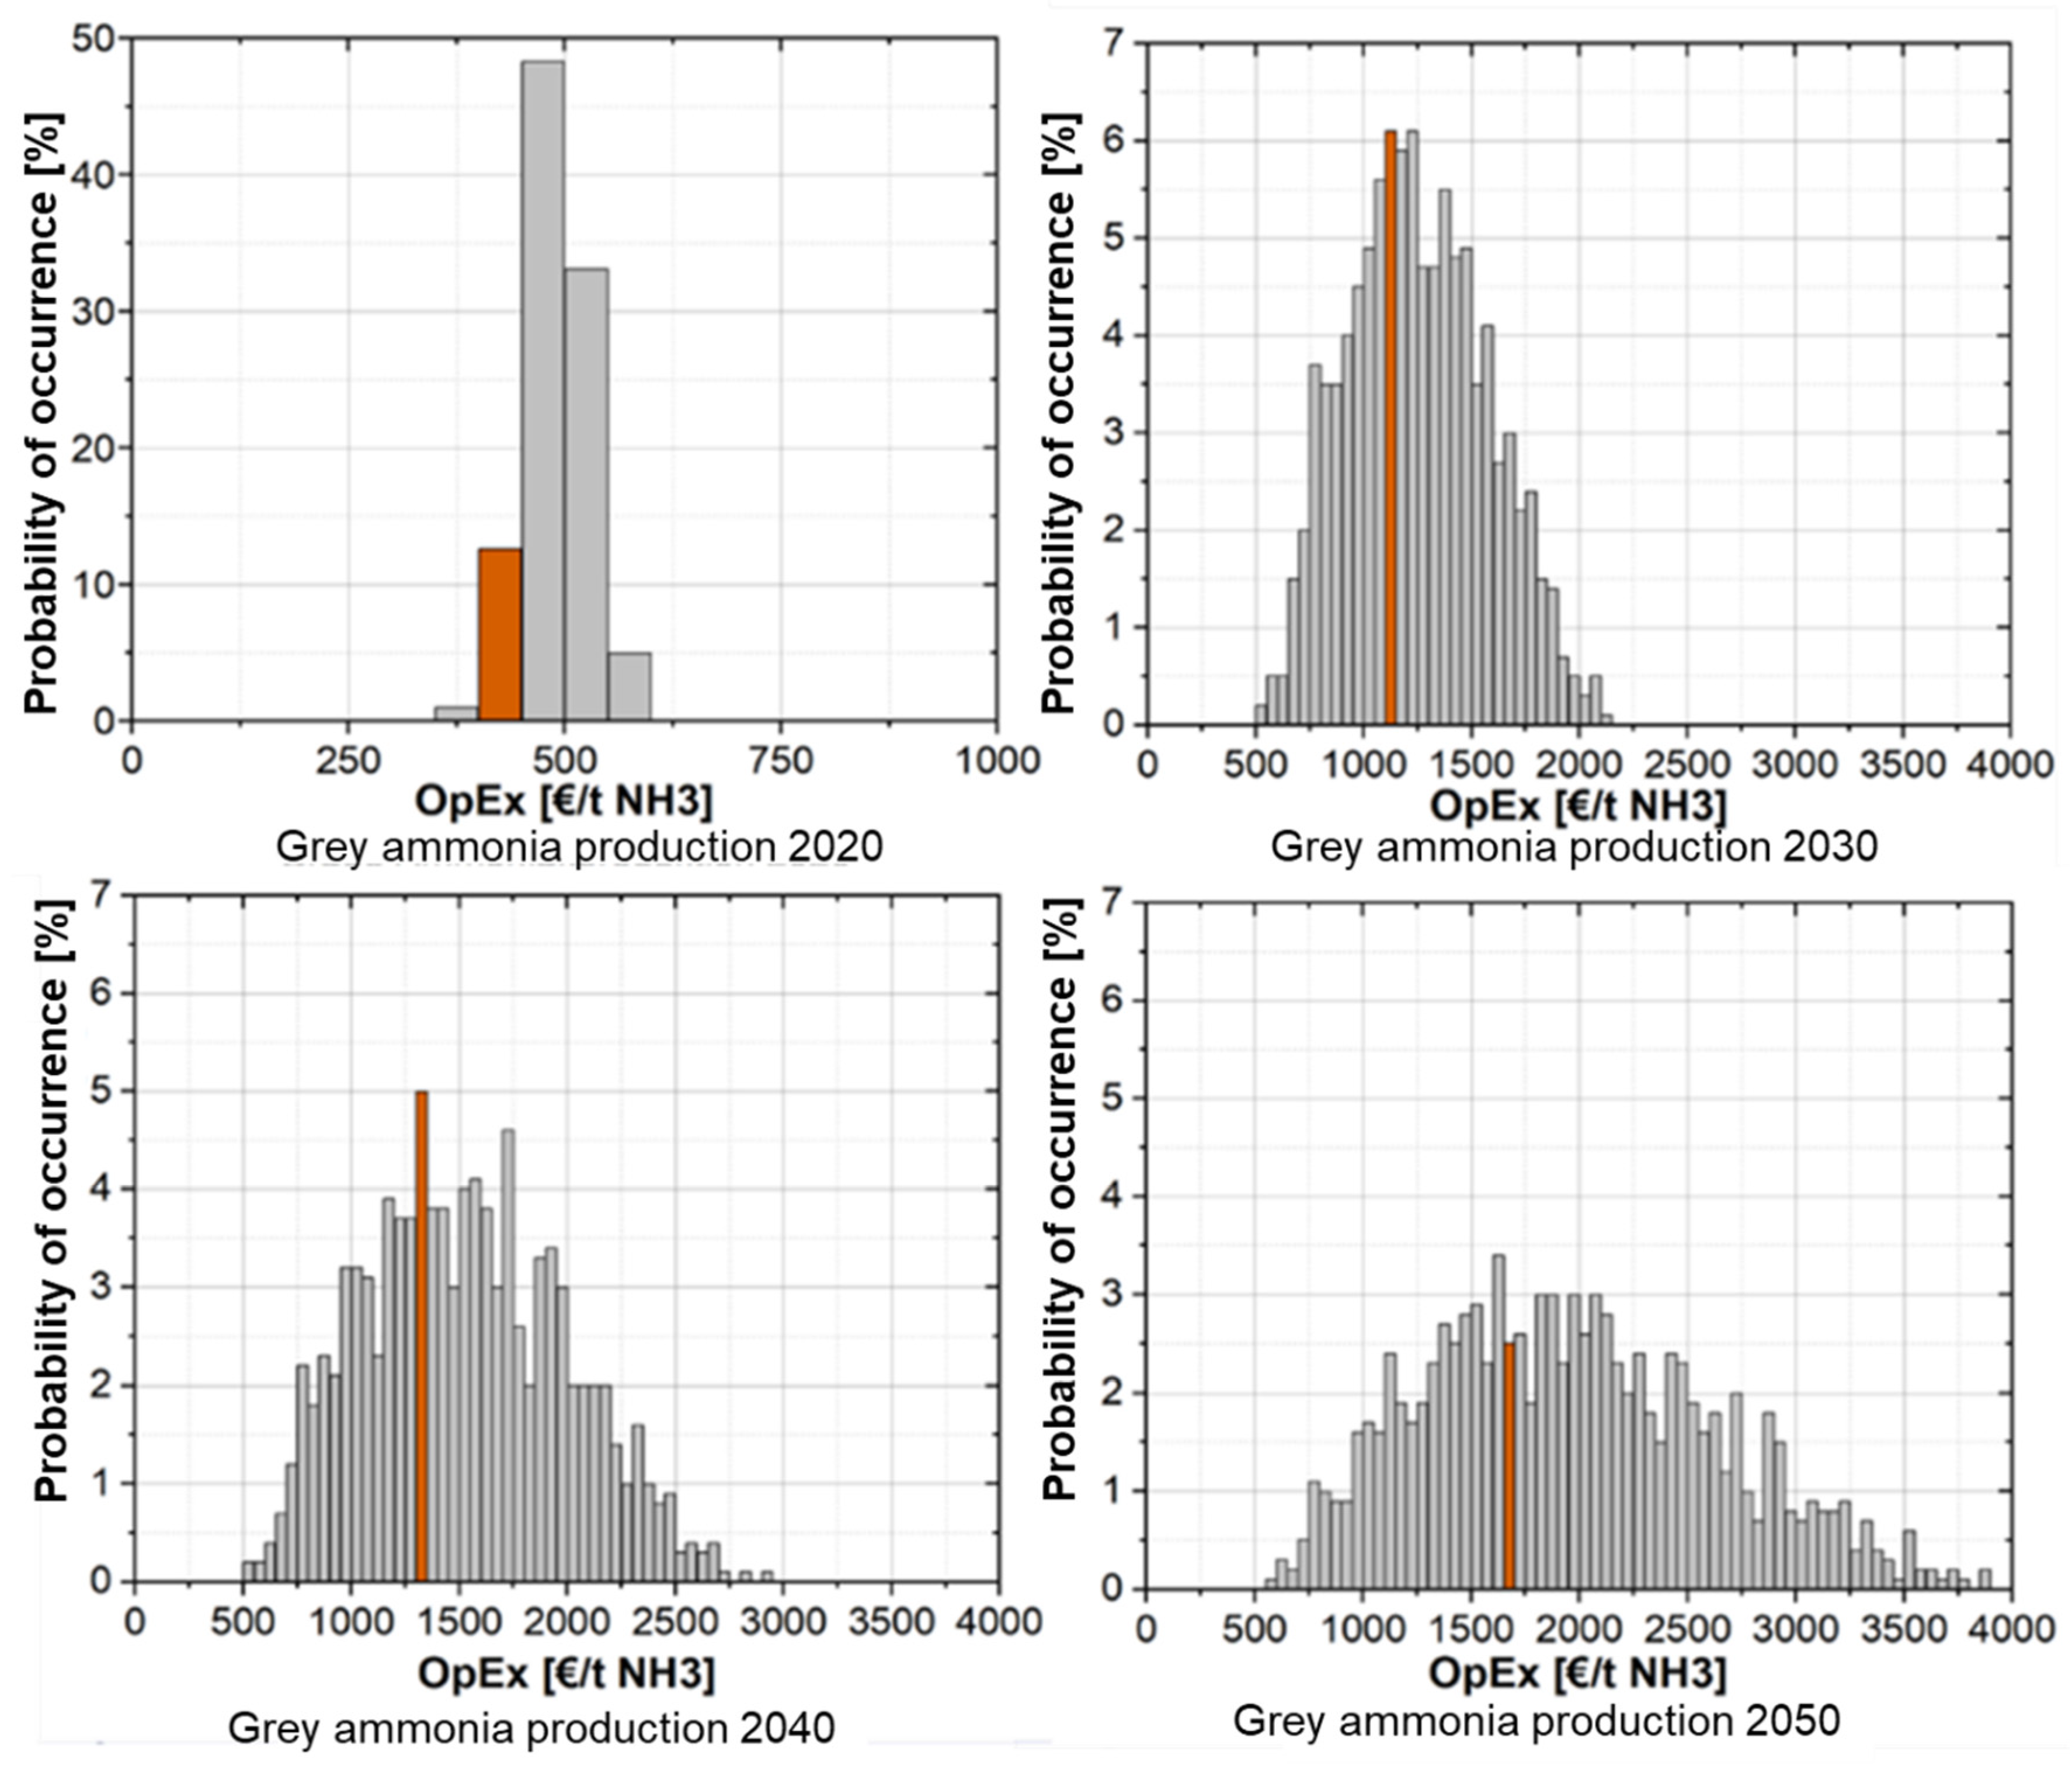
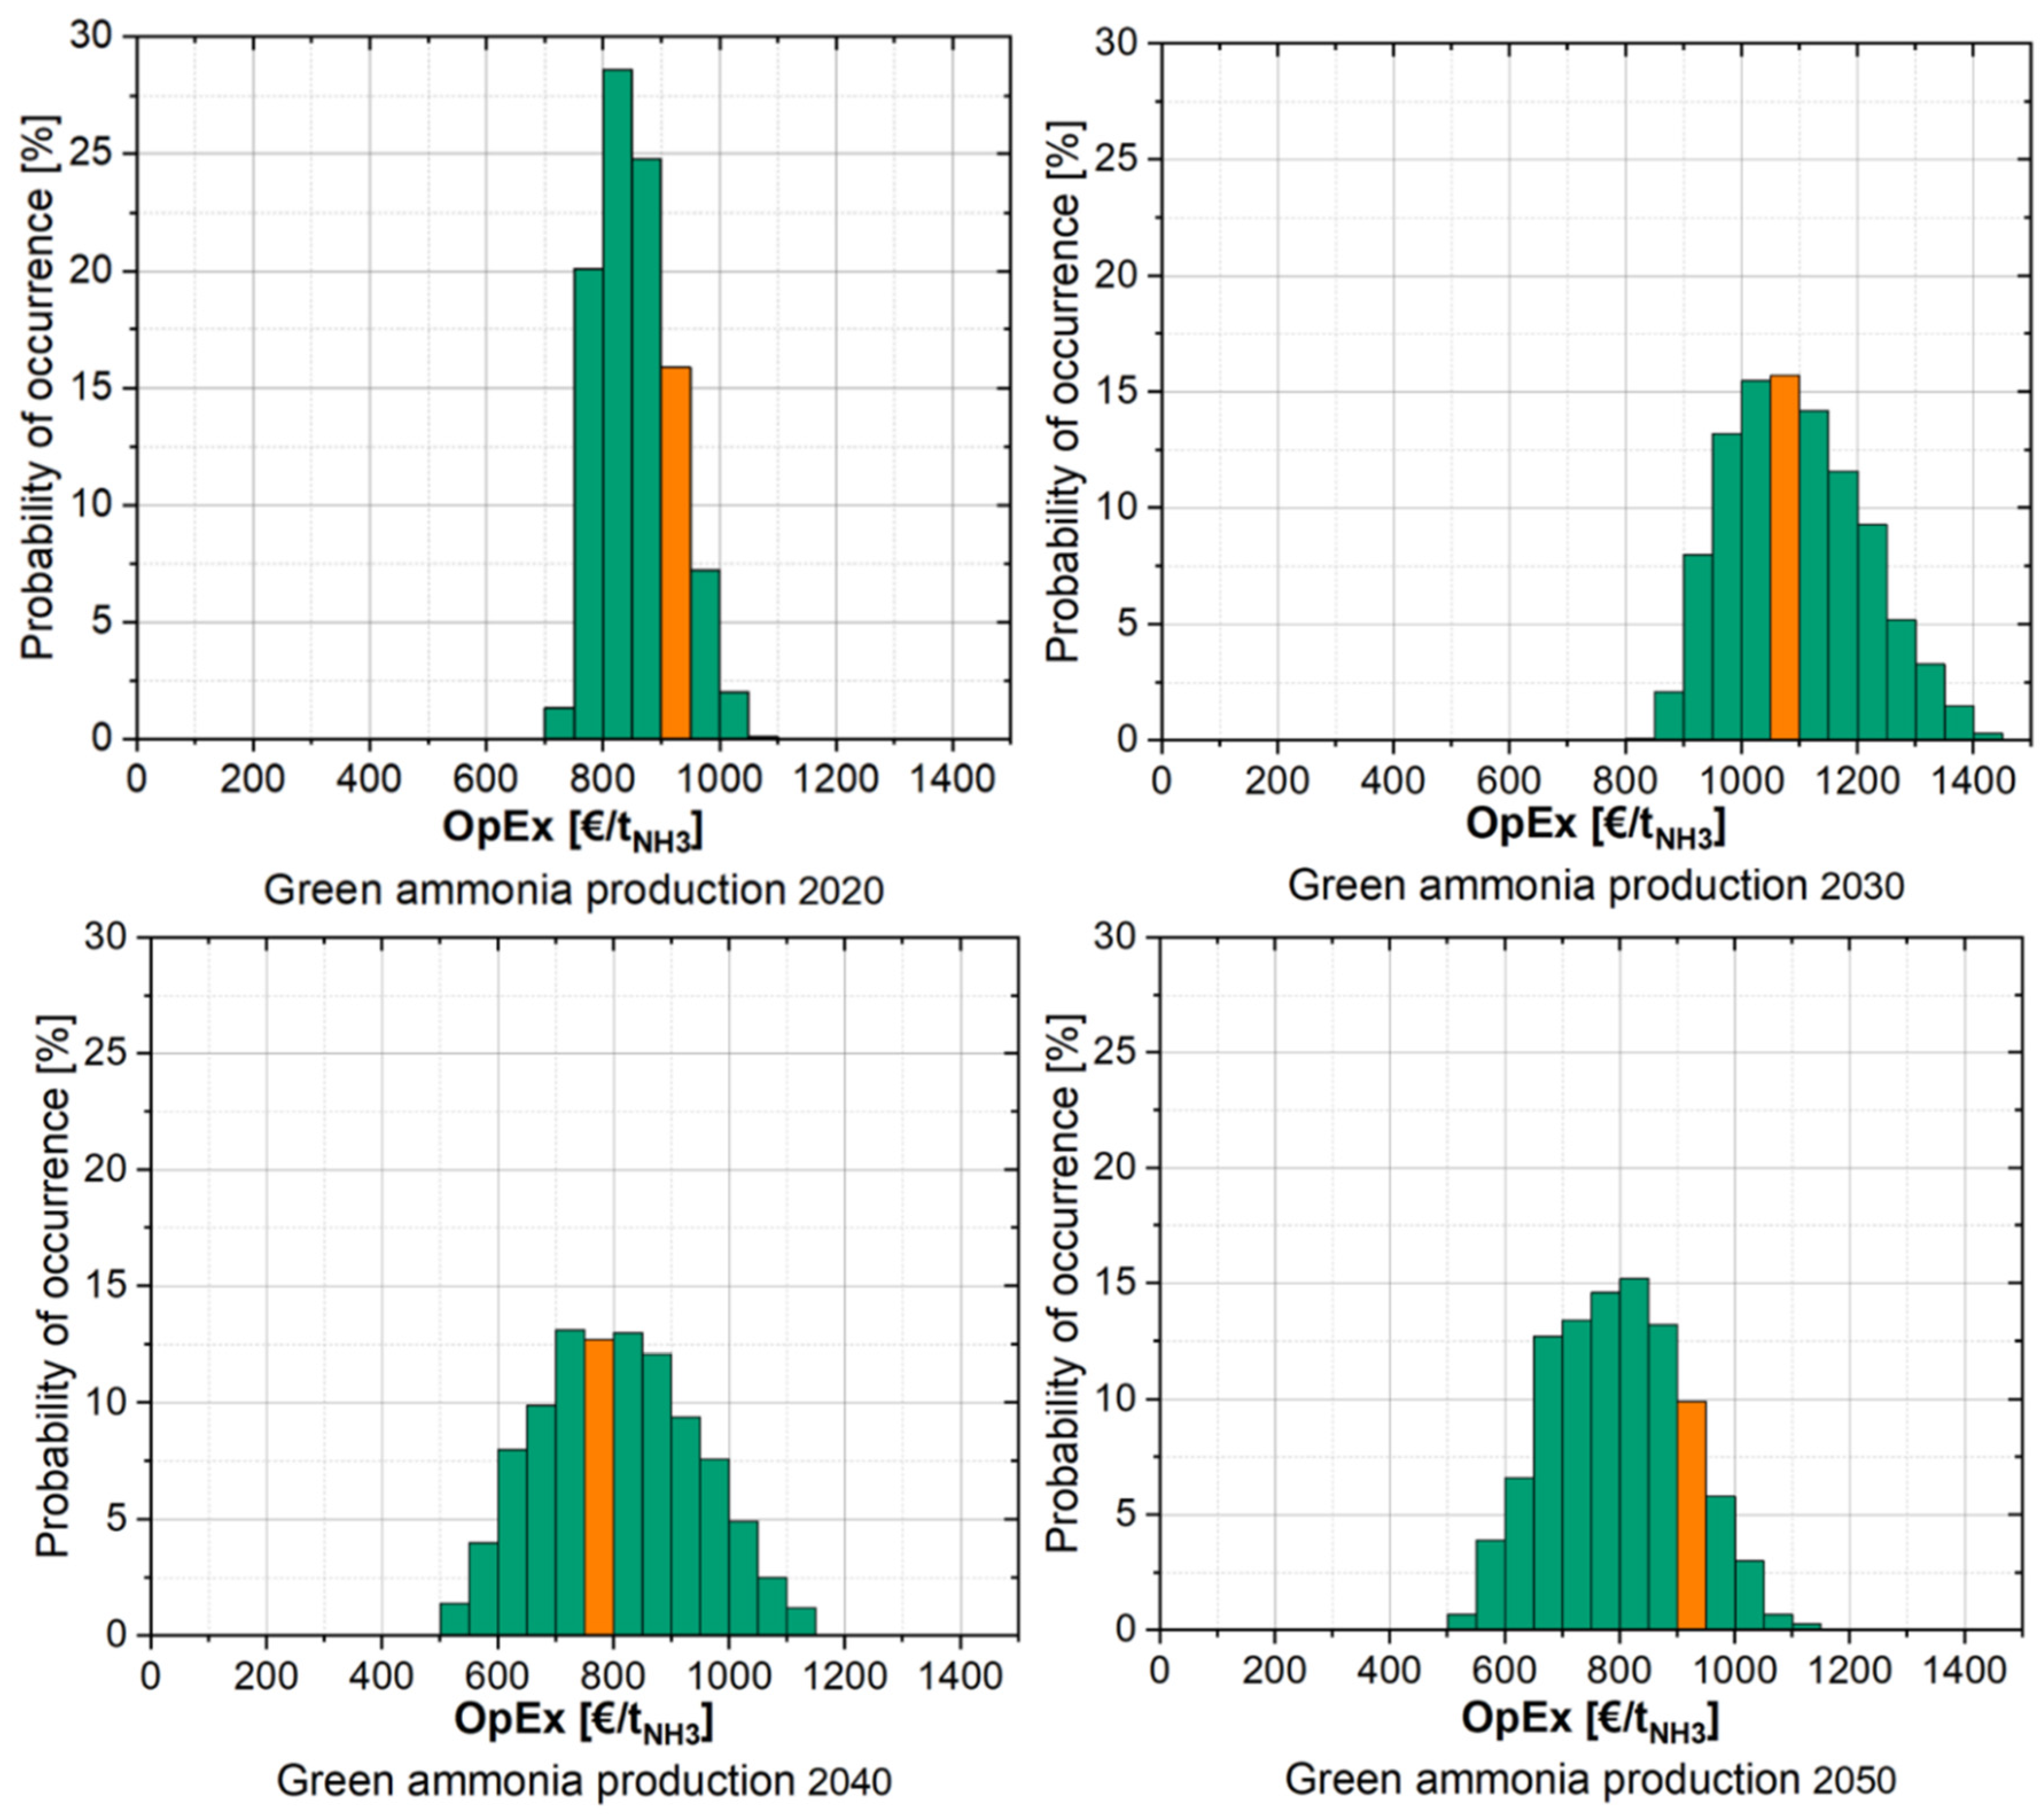
To evaluate the influence of the Ammonia synthesis on the total costs, a sensitivity analysis was carried out. The results showed that the total operating costs of gray Ammonia production in 2020 are slightly higher than those calculated in the profitability analysis (Figure 16).
Costs between 350 / t N H 3 and 600 / t N H 3 were calculated, meaning the value from the profitability calculation (434 / t N H 3 ) is in the lower calculation quantile. The cost estimate for the year 2030 is in the range between 500 / t N H 3 and 2150 / t N H 3 , but the value of 1115 / t N H 3 determined from the profitability calculation has a high probability of occurrence. Likewise, for 2040, operating costs of up to 2750 / t N H 3 are possible, while the calculated value of 1334 / t N H 3 has a high probability of occurrence. The results for 2050 show that costs vary between 550 / t N H 3 and 3900 / t N H 3 , with the calculated value of 1655 / t N H 3 in the medium range of the probability of occurrence.
As shown in Figure 17, the total costs of green ammonia production from 2020 to 2050 are likely to be lower than those calculated in the economic analysis, mainly due to the price ranges shown, particularly in the supply sector.
Costs between 750 / t N H 3 and 1100 / t N H 3 were calculated for 2020 and costs in the range of 550 / t N H 3 to 1150 / t N H 3 for 2050. The values from the profitability calculation were 902 / t N H 3 for 2020 and 924 / t N H 3 for 2050, respectively. The OpEx determined from the profitability calculation, 1062 / t N H 3 for 2030 and 792 / t N H 3 for 2040, are correspondingly close to the OpEx determined with the highest probability of occurrence. The sensitivity analysis confirmed the assumptions made in the economic analysis and thus the credibility of the results.

3.4.4. Cost Analysis of Heat Generation by Boiler Firing with Natural Gas and Ammonia

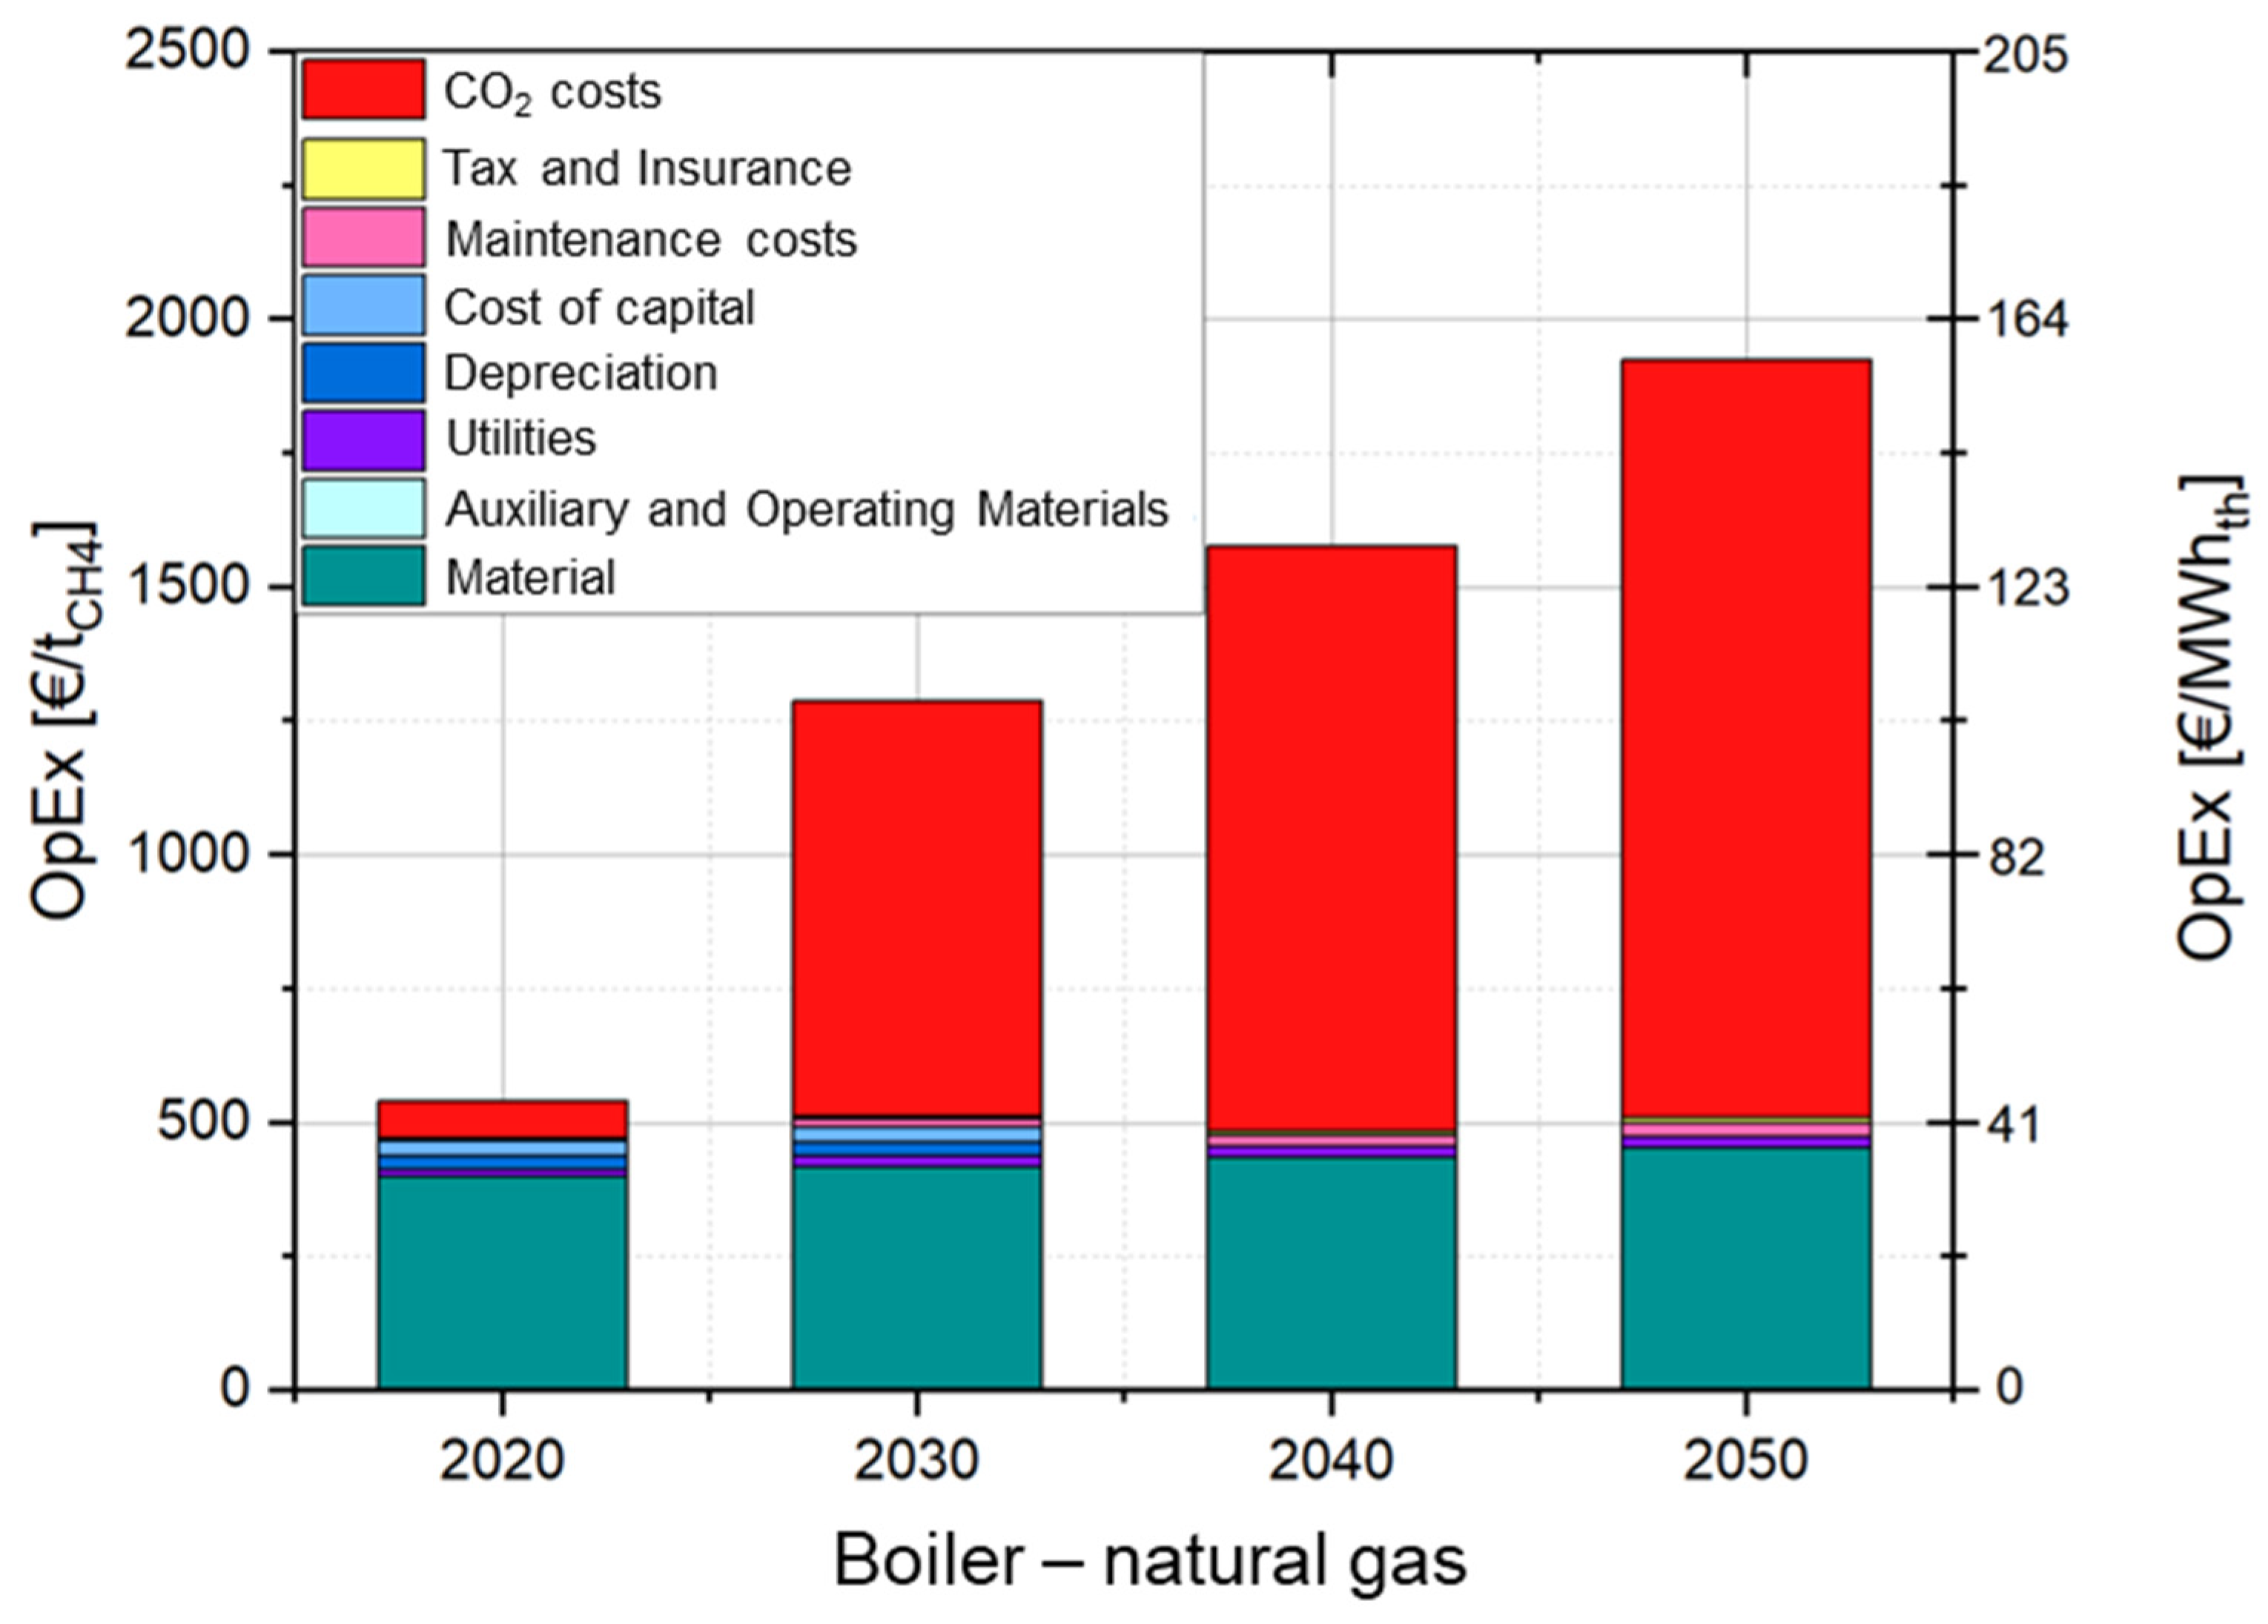
The combustion of ammonia for heat generation has not yet been established. Therefore, the combustion of Ammonia for heat generation in a boiler firing system was compared with that of natural gas as a reference fuel. Because of the well-developed natural gas pipeline network in Germany, transportation and storage were omitted from the analysis. For a direct comparison of the combustion of natural gas and ammonia, the investment costs for the boiler firing system for both fuels were assumed to be the same, and thus, accordingly, the capital costs for the combustion of ammonia and methane were equally high. Flue gas cleaning costs were not regarded in this approach. The stoichiometric combustion of one ton of methane results in 2.73 t C O 2 , and so this value is considered in the economic analysis in the pricing of CO2 certificates. To generate 100 MW of thermal output, natural gas is burned in the boiler firing system at a rate of 7.2 t C H 4 / h , and the corresponding carbon dioxide emissions equal 19.8 t C O 2 / h . The operating costs for the procurement of natural gas (material costs), auxiliary and operating materials (demineralized water) and operating resources (electricity for the blower and feeding water pump), as well as the CO2 costs, are represented graphically in Figure 18.
Figure 19 shows the direct cost comparison of the combustion of green ammonia and the combustion of natural gas.
Considering the estimated CO2 costs and natural gas prices, the combustion of natural gas is more cost-effective than the combustion of ammonia between 2020 and 2050. Due to CO2 pricing and the costs for the procurement of natural gas, the overall costs for boiler firing with natural gas are projected to increase by a factor of three and a half over the period under consideration.

4. Discussion

4.1. NH3 Flame Stabilization and Combustion Under Oscillating Conditions

Although promising, the utilization of NH3 as a fuel has so far been limited mainly to research applications and demonstration plants. One of the most challenging tasks is the stabilization of Ammonia flames due to NH3’s combustion properties [162]. As our results also show, even with the application of a burner particularly designed for NH3 combustion, achieving a pure (100%) Ammonia flame without specific measures targeting flame stabilization is very challenging. The change from the water-cooled to the isothermal combustion chamber contributed minimally to the flame stability. It proved too, that reducing the methane amount and simultaneously increasing the NH3 fraction in the fuel is not enough (Figure 6 and Figure 7). A pure NH3 flame was not realized before installing the flame tube, increasing the combustion chamber temperature from 800 °C to 1000 °C and preheating the combustion air to 260 °C (Figure 8).
Due to the air preheating and the associated stronger swirl, higher nitrogen oxide concentrations were observed compared to those obtained without combustion air preheating (Figure 7). In both cases, the nitrogen oxide concentrations behaved similarly (max. NOx concentration at an NH3 portion of 68%); a further increase in the ammonia content in the gas fuel mixture was accompanied by decreasing NOx concentrations, while NH3 slip remained continuously low. This NOx concentration reduction was due to in situ reduction with excess NH3 from the gas fuel within the flame, as described elsewhere [163].
The results from the oscillating combustion of Ammonia indicate that the NOx concentration increased with decreasing oscillating frequency (Figure 10), presumably due to deteriorating mixing conditions in the combustion chamber. Unfortunately, technical limitations prohibited an oscillation frequency of more than 2 Hz; therefore, at present, it is not possible to fully confirm this dependence.

4.2. Production Cost of Ammonia and Heat

The economic analysis showed that, even without taking into account costs for CO2 certificates, the production of green ammonia in Norway is two and a half times more expensive than the production of gray ammonia in 2020. By 2050, it will still be twice as expensive as gray NH3 due to higher capital costs and amortization. The synthesis of green ammonia requires considerable amounts of electricity, which accounts for around 54% of the total costs, and electrical power costs are estimated to rise from EUR 40/MWh in 2020 to EUR 48/MWh in 2050. In the case of gray ammonia, the biggest cost driver is the expenses for natural gas, which accounts for around 50% of all material costs.
To understand the importance of the CO2 expenditures for the production of gray and green NH3, it is important to look at the CO2 amounts emitted by the two processes. The production of gray ammonia releases approx. 2 t C O 2 / t N H 3 into the atmosphere [154], and, correspondingly, the production costs should increase from 434 / t N H 3 in 2020 to about 1655 / t N H 3 by 2050. In contrast, only 0.17 t C O 2 / t N H 3 is emitted by the production of green ammonia. Thus, the prices for CO2 certificates have only a minor influence on the operating costs of green ammonia synthesis, and green ammonia production could be more profitable than gray ammonia production as early as 2029. Considering the production of green ammonia in Germany, it is obvious that production costs in the future will be roughly twice as high as production costs in Norway. This significant difference can be attributed to various factors, in particular energy costs and raw material prices.
The examination of the entire Ammonia process chain (Table 5) shows the structure of the OpEx in more detail. As precise cost forecasting for trade by sea is extremely complex and volatile, it is assumed that transportation costs stay constant at 2.6 / t N H 3 , without including the cost of CO2 emissions. Currently, research is focused on the development of ship engines using Ammonia as a fuel. Generally, there is potential to eliminate the CO2 emissions resulting from maritime transport and to reduce the cost of transporting Ammonia, since the transported raw material can also be used as fuel for the ship’s propulsion system. Starting in 2040, the costs decrease due to the elimination of depreciation costs for the facilities after 20 years. The operating costs for Ammonia storage result from the need for electrical power for liquid storage in tanks, for which an energy expense of 2% energy loss was determined.
The operating costs for boiler firing contain the electricity required for the supply of combustion air, the induced draught and the feeding water pump. The pump circulates a water volume of 113 t/h, which is then used for the boiler. The operating costs of the utilities are thus 4.7 / t N H 3 in 2020 and 7.2 / t N H 3 in 2050. Costs for ammonia as a fuel are not included in the material costs. The considerable costs of the flue gas cleaning processes SCR and SNCR are mainly due to depreciation and capital costs of about 2 / t N H 3 . Maintenance costs amount to about 1 / t N H 3 . The consumption of ammonia water and utilities is comparatively low and accounts for a share of about 1 / t N H 3 .
We assumed that, for heat generation by the combustion of natural gas and Ammonia, the investment costs for the boiler firing plant would be the same. Consequently, the capital, depreciation, maintenance and insurance costs, as well as the taxes incurred, add up to the same value for the combustion of NH3 and methane. By far, the main cost driver for methane combustion is the price of CO2 emissions (Figure 18). Due to their high levels from 2030 onwards, the costs increase significantly, and the outcome will be a three-and-a-half-fold OpEx increase for natural gas boiler combustion in the period from 2020 to 2050. In contrast, the firing of the carbon-free fuel NH3 does not generate any CO2, so there are no CO2 costs. At present, operation with natural gas remains economically more attractive than operation with ammonia. However, the cost calculation does not consider any expenses for Carbon Capture and Storage (CCS) technology, which would add further financial load to natural gas combustion. The inclusion of these costs could maybe turn the tide towards boiler firing with Ammonia between 2040 and 2050.

5. Conclusions

Continuous, stable combustion of pure Ammonia, without adding hydrogen or natural gas, was demonstrated in a pilot-scale isothermal furnace. This was achieved with a combustion chamber temperature of 1000 °C and the utilization of a supercritical swirl and combustion air preheated to 260 °C. Under these conditions, NOx concentrations amounted to around 14,500 m g / m N 3 at the stack, and, with fuel (NH3) oscillation of 2 Hz, they could be reduced by around 80% to approx. 2650 m g / m N 3 . The NH3 slip reached an average of 34 m g / m N 3 (all concentrations normalized on 3 vol.% O2 in the exhaust gas). Considering increasing CO2 certificate costs, the production of green ammonia would be more economical than the production of gray ammonia as early as 2029. A sensitivity analysis supports this result.
Based on the experimental findings on NOx reduction by the primary measure, the costs of heat production using oscillating ammonia combustion were compared to those of natural gas-based heat generation, considering the use of both SCR and SNCR to maintain NOx emission limit values. Assuming similar capital investment for all options, heat generation from natural gas combustion will remain cheaper than that from Ammonia firing up to 2050. However, by making conservative economical calculation assumptions and considering expenses for Carbon Capture and Storage, the switch to Ammonia as a fuel could actually pay off by the early 2050s.

Outlook

This study demonstrated that NOx reduction through oscillating combustion of pure ammonia is generally possible. However, due to technical limitations, the effects of oscillation frequencies higher than 2 Hz could not be investigated. Future research should explore the influence of higher frequencies and identify additional factors, beyond oscillation frequency, that contribute to NOx reduction. In the present work, flame stabilization was achieved using empirical/qualitative methods only. Subsequent studies should focus on quantitative flame diagnostics, including measurements of ignition delay, flame temperature and chemiluminescence imaging, to gain a deeper understanding of the combustion behavior. The initial economic modeling of green ammonia production primarily considered electricity prices, as they represent the main expenses. Nevertheless, further, more detailed sensitivity analysis is needed to develop the comprehensive economics of ammonia as a fuel for heat supply.

Author Contributions

Conceptualization, K.A. and H.-J.G.; Data Curation, K.A., H.-J.G. and J.W.; Formal Analysis, K.A., H.-J.G. and J.W.; Funding acquisition, H.-J.G.; Investigation, K.A., H.-J.G. and J.W.; Project administration, J.W.; Validation, K.A., H.-J.G. and J.W.; Visualization, K.A. and H.-J.G.; Supervision, H.-J.G.; Resources, D.S.; Writing-original draft, K.A.; Writing-review & editing, H.-J.G., D.S. and J.W. All authors have read and agreed to the published version of the manuscript.

Funding

This research was funded by Industrial Collective Research (IGF) program of the German Federal Ministry for Economic Affairs and Energy (BMWE), IGF—grant no. 21858N.

Data Availability Statement

The raw data supporting the conclusions of this article will be made available by the authors on request.

Acknowledgments

The authors would like to thank the project partners from the Gas- und Wärme-Institut (GWI) in Essen, Germany, for providing the pilot-scale experimental facilities and their valuable collaboration and support throughout the whole project. This work would not have been possible without the vital contribution of the company SAACKE, which developed and delivered the Ammonia burner used in the experimental part of this study. We gratefully acknowledge the support provided by the Industrial Collective Research (IGF) program, funded by the German Federal Ministry for Economic Affairs and Energy (BMWi), for this research.

Conflicts of Interest

Author Janine Wiebe was employed by the company REMONDIS Industrie Service GmbH & Co. KG. The remaining authors declare that the research was conducted in the absence of any commercial or financial relationships that could be construed as a potential conflict of interest.

References

  1. US EPA. Overview of Greenhouse Gases|Greenhouse Gas (GHG) Emissions|US EPA. Available online: https://www.epa.gov/ghgemissions/overview-greenhouse-gases (accessed on 29 April 2025).
  2. UNFCCC. What is the Kyoto Protocol? Available online: https://unfccc.int/kyoto_protocol (accessed on 29 April 2025).
  3. UNFCCC. The Paris Agreement. Available online: http://unfccc.int/files/essential_background/convention/application/pdf/english_paris_agreement.pdf (accessed on 30 July 2025).
  4. Kojima, Y.; Yamaguchi, M. Ammonia as a hydrogen energy carrier. Int. J. Hydrogen Energy 2022, 47, 22832–22839. [Google Scholar] [CrossRef]
  5. MacFarlane, D.R.; Cherepanov, P.V.; Choi, J.; Suryanto, B.H.; Hodgetts, R.Y.; Bakker, J.M.; Vallana, F.M.F.; Simonov, A.N. A Roadmap to the Ammonia Economy. Joule 2020, 4, 1186–1205. [Google Scholar] [CrossRef]
  6. Yapicioglu, A.; Dincer, I. A review on clean ammonia as a potential fuel for power generators. Renew. Sustain. Energy Rev. 2019, 103, 96–108. [Google Scholar] [CrossRef]
  7. Patonia, A.; Poudineh, R. Ammonia as a Storage Solution for Future Decarbonized Energy Systems; OIES Paper EL No. 42; The Oxford Institute for Energy Studies: Oxford, UK, 2020. [Google Scholar]
  8. Cheng, Q.; Muhammad, A.; Kaario, O.; Ahmad, Z.; Martti, L. Ammonia as a sustainable fuel: Review and novel strategies. Renew. Sustain. Energy Rev. 2024, 207, 114995. [Google Scholar] [CrossRef]
  9. Kumar, L.; Sleiti, A.K. Systematic review on ammonia as a sustainable fuel for combustion. Renew. Sustain. Energy Rev. 2024, 202, 114699. [Google Scholar] [CrossRef]
  10. Kobayashi, H.; Hayakawa, A.; Somarathne, K.K.A.; Okafor, E.C. Science and technology of ammonia combustion. Proc. Combust. Inst. 2019, 37, 109–133. [Google Scholar] [CrossRef]
  11. Herbinet, O.; Bartocci, P.; Dana, A.G. On the use of ammonia as a fuel—A perspective. Fuel Commun. 2022, 11, 100064. [Google Scholar] [CrossRef]
  12. Elbaz, A.M.; Wang, S.; Guiberti, T.F.; Roberts, W.L. Review on the recent advances on ammonia combustion from the fundamentals to the applications. Fuel Commun. 2022, 10, 100053. [Google Scholar] [CrossRef]
  13. Valera-Medina, A.; Xiao, H.; Owen-Jones, M.; David, W.; Bowen, P. Ammonia for power. Prog. Energy Combust. Sci. 2018, 69, 63–102. [Google Scholar] [CrossRef]
  14. NIST Thermo-Physical Properties of Fluid Systems. 2017. Available online: http://webbook.nist.gov/chemistry/fluid/ (accessed on 29 April 2025).
  15. Heldebrant, D.J.; Karkamkar, A.; Linehan, J.C.; Autrey, T. Synthesis of ammonia borane for hydrogen storage applications. Energy Environ. Sci. 2008, 1, 156. [Google Scholar] [CrossRef]
  16. Moradi, R.; Groth, K.M. Hydrogen storage and delivery: Review of the state of the art technologies and risk and reliability analysis. Int. J. Hydrogen Energy 2019, 44, 12254–12269. [Google Scholar] [CrossRef]
  17. Li, H.; Yang, Q.; Chen, X.; Shore, S.G. Ammonia borane, past as prolog. J. Organomet. Chem. 2014, 751, 60–66. [Google Scholar] [CrossRef]
  18. Petit, J.-F.; Miele, P.; Demirci, U.B. Ammonia borane H 3 N BH 3 for solid-state chemical hydrogen storage: Different samples with different thermal behaviors. Int. J. Hydrogen Energy 2016, 41, 15462–15470. [Google Scholar] [CrossRef]
  19. Rassat, S.D.; Aardahl, C.L.; Autrey, T.; Smith, R.S. Thermal Stability of Ammonia Borane: A Case Study for Exothermic Hydrogen Storage Materials. Energy Fuels 2010, 24, 2596–2606. [Google Scholar] [CrossRef]
  20. Gao, L.; Fang, H.; Li, Z.; Yu, X.; Fan, K. Liquefaction of Solid-State BH3NH3 by Gaseous NH3. Inorg. Chem. 2011, 50, 4301–4306. [Google Scholar] [CrossRef] [PubMed]
  21. Giddey, S.; Badwal, S.P.S.; Munnings, C.; Dolan, M. Ammonia as a Renewable Energy Transportation Media. ACS Sustain. Chem. Eng. 2017, 5, 10231–10239. [Google Scholar] [CrossRef]
  22. NASA. X-15 Hypersonic Research Program; Dryden Flight Research Center: Edwards, CA, USA, 2002. Available online: https://www.nasa.gov/wp-content/uploads/2021/09/120306main_FS-052-DFRC.pdf?emrc=9ae601 (accessed on 14 July 2025).
  23. Verkamp, F.J.; Hardin, M.C.; Williams, J.R. Ammonia combustion properties and performance in gas-turbine burners. Symp. Combust. 1967, 11, 985–992. [Google Scholar] [CrossRef]
  24. Bull, M.G. Development of an Ammonia-Burning Gas Turbine Engine; DA-44-009-AMC-824(T); Solar Turbines International: San Diego, CA, USA, 1968. [Google Scholar]
  25. Pratt, D.T. Performance of Ammonia-Fired Gas-Turbine Combustors; US Deptartment of the Army: Fort Belvoir, VA, USA, 1967. [Google Scholar] [CrossRef]
  26. SIP Energy Carriers. Available online: https://www.jst.go.jp/sip/pdf/SIP_energycarriers2016_en.pdf (accessed on 25 April 2025).
  27. Kurata, O.; Iki, N.; Matsunuma, T.; Inoue, T.; Tsujimura, T.; Furutani, H.; Kobayashi, H.; Hayakawa, A. Performances and emission characteristics of NH3–air and NH3CH4–air combustion gas-turbine power generations. Proc. Combust. Inst. 2017, 36, 3351–3359. [Google Scholar] [CrossRef]
  28. Ito, S.; Uchida, M.; Suda, T.; Fujimori, T. Development of Ammonia Gas Turbine Co-Generation Technology. IHI Eng. Rev. 2020, 53, 6. [Google Scholar]
  29. Ammonia Energy Association. REFUEL Is Back on Track. Available online: https://ammoniaenergy.org/articles/refuel-is-back-on-track/ (accessed on 29 April 2025).
  30. ARPA-E Homepage. Available online: https://arpa-e.energy.gov/?q=arpa-e-programs/refuel (accessed on 29 April 2025).
  31. West Central Research and Outreach Center. Renewable Energy Ammonia Production Research Continues at the WCROC. Available online: https://wcroc.cfans.umn.edu/news/arpa-e-ammonia-project (accessed on 29 April 2025).
  32. Ammonia Energy Association. NH3 Fuel Association Chapter Launching in Australia. Available online: https://ammoniaenergy.org/articles/nh3-fuel-association-chapter-launching-in-australia/ (accessed on 29 April 2025).
  33. Ammonia Industry. Yara: Solar Ammonia Pilot Plant, for Start-Up in 2019. Available online: https://ammoniaenergy.org/articles/yara-solar-ammonia-pilot-plant-for-start-up-in-2019/ (accessed on 29 April 2025).
  34. Siemens Energy. Power-to-X: A Closer Look at e-Ammonia, 2021. Available online: https://p3.aprimocdn.net/siemensenergy/4e089afc-eac1-45eb-ab45-b08400b001ba/20211012-WP-eAmmonia-pdf_Original%20file.pdf (accessed on 14 July 2025).
  35. Bañares-Alcántara, R.; Dericks, G., III; Fiaschetti, M.; Grünewald, P.; Lopez, J.M.; Tsang, E.; Yang, A.; Ye, L.; Zhao, S. Analysis of Islanded Ammonia-Based Energy Storage Systems; University of Oxford: Oxford, UK, 2015. [Google Scholar]
  36. Howell, D. Revolutionary Disruption Coming to the Energy Sector. The Japan Times. Available online: https://www.japantimes.co.jp/opinion/2017/03/10/commentary/world-commentary/revolutionary-disruption-coming-energy-sector/ (accessed on 14 July 2025).
  37. Afman, M.; Hers, S.; Scholten, T.; ISPT. Power to Ammonia; ISPT: Amersfoort, The Nethertlands, 2017; Available online: https://ispt.eu/media/DR-20-09-Power-to-Ammonia-2017-publication.pdf (accessed on 30 April 2025).
  38. DOE. The Future of Ammonia-Based Fuel and Ammonia for Energy Storage & Delivery; Abu Dhabi Department of Energy (DOE): Abu Dhabi, United Arab Emirates, 2024. Available online: https://www.doe.gov.ae/-/media/Project/DOE/Department-Of-Energy/Media-Center-Publications/English-Files/DOE-Future-Foresight-Reports---AmoniaENG.pdf (accessed on 30 April 2025).
  39. National Research Council Canada. Ammonia Shows Promise as Fuel for Hard-to-Decarbonize Sectors. Available online: https://nrc.canada.ca/en/stories/ammonia-shows-promise-fuel-hard-decarbonize-sectors (accessed on 30 April 2025).
  40. Natural Resources Canada. Hydrogen Strategy for Canada: Seizing the Opportunities for Hydrogen: A Call to Action; Natural Resources Canada: Ottawa, ON, Canada, 2020. [Google Scholar]
  41. Frigo, S.; Gentili, R. Analysis of the behaviour of a 4-stroke Si engine fuelled with ammonia and hydrogen. Int. J. Hydrogen Energy 2013, 38, 1607–1615. [Google Scholar] [CrossRef]
  42. Zamfirescu, C.; Dincer, I. Using ammonia as a sustainable fuel. J. Power Sources 2008, 185, 459–465. [Google Scholar] [CrossRef]
  43. Reiter, A.J.; Kong, S.-C. Demonstration of Compression-Ignition Engine Combustion Using Ammonia in Reducing Greenhouse Gas Emissions. Energy Fuels 2008, 22, 2963–2971. [Google Scholar] [CrossRef]
  44. Grannell, S.M.; Assanis, D.N.; Gillespie, D.E.; Bohac, S.V. Exhaust Emissions from a Stoichiometric, Ammonia and Gasoline Dual Fueled Spark Ignition Engine. In Proceedings of the ASME 2009 Internal Combustion Engine Division Spring Technical Conference, Milwaukee, WI, USA, 3–6 May 2009; pp. 135–141. [Google Scholar] [CrossRef]
  45. Zamfirescu, C.; Dincer, I. Ammonia as a green fuel and hydrogen source for vehicular applications. Fuel Process. Technol. 2009, 90, 729–737. [Google Scholar] [CrossRef]
  46. Reiter, A.J.; Kong, S.-C. Combustion and emissions characteristics of compression-ignition engine using dual ammonia-diesel fuel. Fuel 2011, 90, 87–97. [Google Scholar] [CrossRef]
  47. Mørch, C.; Bjerre, A.; Gøttrup, M.; Sorenson, S.; Schramm, J. Ammonia/hydrogen mixtures in an SI-engine: Engine performance and analysis of a proposed fuel system. Fuel 2011, 90, 854–864. [Google Scholar] [CrossRef]
  48. Gill, S.S.; Chatha, G.S.; Tsolakis, A.; Golunski, S.E.; York, A.P.E. Assessing the effects of partially decarbonising a diesel engine by co-fuelling with dissociated ammonia. Int. J. Hydrogen Energy 2012, 37, 6074–6083. [Google Scholar] [CrossRef]
  49. Ciccarelli, G.; Jackson, D.; Verreault, J. Flammability limits of NH3–H2–N2–air mixtures at elevated initial temperatures. Combust. Flame 2006, 144, 53–63. [Google Scholar] [CrossRef]
  50. Kim, J.-H.; Kim, J.-H.; Kim, H.-S.; Kim, H.-J.; Kang, S.-H.; Ryu, J.-H.; Shim, S.-S. Reduction of NOx Emission from the Cement Industry in South Korea: A Review. Atmosphere 2022, 13, 121. [Google Scholar] [CrossRef]
  51. Duynslaegher, C.; Jeanmart, H.; Vandooren, J. Ammonia combustion at elevated pressure and temperature conditions. Fuel 2010, 89, 3540–3545. [Google Scholar] [CrossRef]
  52. Lee, J.; Lee, S.; Kwon, O. Effects of ammonia substitution on hydrogen/air flame propagation and emissions. Int. J. Hydrogen Energy 2010, 35, 11332–11341. [Google Scholar] [CrossRef]
  53. Cardoso, J.S.; Silva, V.; Rocha, R.C.; Hall, M.J.; Costa, M.; Eusébio, D. Ammonia as an energy vector: Current and future prospects for low-carbon fuel applications in internal combustion engines. J. Clean. Prod. 2021, 296, 126562. [Google Scholar] [CrossRef]
  54. Evans, B. Using Local Green Energy and Ammonia to Power Gas Turbine Generators. In Proceedings of the 10th NH3 Fuel Conference, Sacramento, CA, USA, 23–24 September 2013; Available online: https://ammoniaenergy.org/wp-content/uploads/2019/12/nh3fcx-brian-evans.pdf (accessed on 30 April 2025).
  55. Valera-Medina, A.; Marsh, R.; Runyon, J.; Pugh, D.; Beasley, P.; Hughes, T.; Bowen, P. Ammonia–methane combustion in tangential swirl burners for gas turbine power generation. Appl. Energy 2017, 185, 1362–1371. [Google Scholar] [CrossRef]
  56. Valera-Medina, A.; Pugh, D.; Marsh, P.; Bulat, G.; Bowen, P. Preliminary study on lean premixed combustion of ammonia-hydrogen for swirling gas turbine combustors. Int. J. Hydrogen Energy 2017, 42, 24495–24503. [Google Scholar] [CrossRef]
  57. Afif, A.; Radenahmad, N.; Cheok, Q.; Shams, S.; Kim, J.H.; Azad, A.K. Ammonia-fed fuel cells: A comprehensive review. Renew. Sustain. Energy Rev. 2016, 60, 822–835. [Google Scholar] [CrossRef]
  58. Cairns, E.J.; Simons, E.L.; Tevebaugh, A.D. Ammonia–Oxygen Fuel Cell. Nature 1968, 217, 780–781. [Google Scholar] [CrossRef]
  59. Ganley, J.C. An intermediate-temperature direct ammonia fuel cell with a molten alkaline hydroxide electrolyte. J. Power Sources 2008, 178, 44–47. [Google Scholar] [CrossRef]
  60. Hejze, T.; Besenhard, J.; Kordesch, K.; Cifrain, M.; Aronsson, R. Current status of combined systems using alkaline fuel cells and ammonia as a hydrogen carrier. J. Power Sources 2008, 176, 490–493. [Google Scholar] [CrossRef]
  61. Yang, J.; Muroyama, H.; Matsui, T.; Eguchi, K. Development of a direct ammonia-fueled molten hydroxide fuel cell. J. Power Sources 2014, 245, 277–282. [Google Scholar] [CrossRef]
  62. Lan, R.; Tao, S. Direct Ammonia Alkaline Anion-Exchange Membrane Fuel Cells. Electrochem. Solid-State Lett. 2010, 13, B83. [Google Scholar] [CrossRef]
  63. Maffei, N.; Pelletier, L.; Charland, J.P.; McFarlan, A. A Direct Ammonia Fuel Cell Using Barium Cerate Proton Conducting Electrolyte Doped with Gadolinium and Praseodymium. Fuel Cells 2007, 7, 323–328. [Google Scholar] [CrossRef]
  64. Ni, M. Thermo-electrochemical modeling of ammonia-fueled solid oxide fuel cells considering ammonia thermal decomposition in the anode. Int. J. Hydrogen Energy 2011, 36, 3153–3166. [Google Scholar] [CrossRef]
  65. Minh, N.Q. Ceramic Fuel-Cells. J. Am. Ceram. Soc. 1993, 76, 563–588. [Google Scholar] [CrossRef]
  66. Ni, M.; Leung, D.Y.; Leung, M.K. Electrochemical modeling of ammonia-fed solid oxide fuel cells based on proton conducting electrolyte. J. Power Sources 2008, 183, 687–692. [Google Scholar] [CrossRef]
  67. Kojima, Y.; Miyaoka, H.; Ichikawa, T. Ammonia-Based Hydrogen Storage Materials. In Advanced Materials for Clean Energy; CRC Press: Boca Raton, FL, USA, 2015; pp. 497–526. [Google Scholar] [CrossRef]
  68. Zakaznov, V.F.; Kursheva, L.A.; Fedina, Z.I. Determination of normal flame velocity and critical diameter of flame extinction in ammonia-air mixture. Combust. Explos. Shock Waves 1978, 14, 710–713. [Google Scholar] [CrossRef]
  69. Takizawa, K.; Takahashi, A.; Tokuhashi, K.; Kondo, S.; Sekiya, A. Burning velocity measurements of nitrogen-containing compounds. J. Hazard. Mater. 2008, 155, 144–152. [Google Scholar] [CrossRef] [PubMed]
  70. Hu, E.; Huang, Z.; He, J.; Miao, H. Experimental and numerical study on laminar burning velocities and flame instabilities of hydrogen–air mixtures at elevated pressures and temperatures. Int. J. Hydrogen Energy 2009, 34, 8741–8755. [Google Scholar] [CrossRef]
  71. Varea, E.; Modica, V.; Vandel, A.; Renou, B. Measurement of laminar burning velocity and Markstein length relative to fresh gases using a new postprocessing procedure: Application to laminar spherical flames for methane, ethanol and isooctane/air mixtures. Combust. Flame 2012, 159, 577–590. [Google Scholar] [CrossRef]
  72. Ichikawa, A.; Hayakawa, A.; Kitagawa, Y.; Somarathne, K.K.A.; Kudo, T.; Kobayashi, H. Laminar burning velocity and Markstein length of ammonia/hydrogen/air premixed flames at elevated pressures. Int. J. Hydrogen Energy 2015, 40, 9570–9578. [Google Scholar] [CrossRef]
  73. Hayakawa, A.; Goto, T.; Mimoto, R.; Arakawa, Y.; Kudo, T.; Kobayashi, H. Laminar burning velocity and Markstein length of ammonia/air premixed flames at various pressures. Fuel 2015, 159, 98–106. [Google Scholar] [CrossRef]
  74. Li, J.; Huang, H.; Kobayashi, N.; He, Z.; Osaka, Y.; Zeng, T. Numerical study on effect of oxygen content in combustion air on ammonia combustion. Energy 2015, 93, 2053–2068. [Google Scholar] [CrossRef]
  75. Zietz, U.; Baumgärtel, G. The laminar flame speeds of propane-ammonia-air mixtures. Combust. Flame 1969, 13, 329–330. [Google Scholar] [CrossRef]
  76. Bockhorn, H.; Fetting, F.; Mende, J. The laminar flame velocities of propane/ammonia mixtures. Combust. Flame 1972, 18, 471–473. [Google Scholar] [CrossRef]
  77. Pfahl, U.; Ross, M.; Shepherd, J.; Pasamehmetoglu, K.; Unal, C. Flammability limits, ignition energy, and flame speeds in H2–CH4–NH3–N2O–O2–N2 mixtures. Combust. Flame 2000, 123, 140–158. [Google Scholar] [CrossRef]
  78. Lee, J.; Kim, J.; Park, J.; Kwon, O. Studies on properties of laminar premixed hydrogen-added ammonia/air flames for hydrogen production. Int. J. Hydrogen Energy 2010, 35, 1054–1064. [Google Scholar] [CrossRef]
  79. Zhang, M.; Wei, X.; An, Z.; Okafor, E.C.; Guiberti, T.F.; Wang, J.; Huang, Z. Flame stabilization and emission characteristics of ammonia combustion in lab-scale gas turbine combustors: Recent progress and prospects. Prog. Energy Combust. Sci. 2024, 106, 101193. [Google Scholar] [CrossRef]
  80. Zeldovich, Y.B. The oxidation of nitrogen in combustion and explosions. Acta Physicochim. URSS 1946, 21, 577–628. [Google Scholar]
  81. Fisher, C.J. A study of rich ammonia/oxygen/nitrogen flames. Combust. Flame 1977, 30, 143–149. [Google Scholar] [CrossRef]
  82. Dasch, C.J.; Blint, R. A Mechanistic and Experimental Study of Ammonia Flames. Combust. Sci. Technol. 1984, 41, 223–244. [Google Scholar] [CrossRef]
  83. Vandooren, J.; Bian, J.; Van Tiggelen, P. Comparison of experimental and calculated structures of an ammonia-nitric oxide flame. Importance of the NH2 + NO reaction. Combust. Flame 1994, 98, 402–410. [Google Scholar] [CrossRef]
  84. Miller, J.A.; Bowman, C.T. Mechanism and modeling of nitrogen chemistry in combustion. Prog. Energy Combust. Sci. 1989, 15, 287–338. [Google Scholar] [CrossRef]
  85. Skreiberg, Ø.; Kilpinen, P.; Glarborg, P. Ammonia chemistry below 1400 K under fuel-rich conditions in a flow reactor. Combust. Flame 2004, 136, 501–518. [Google Scholar] [CrossRef]
  86. Lindstedt, R.P.; Lockwood, F.C.; Selim, M.A. Detailed Kinetic Modelling of Chemistry and Temperature Effects on Ammonia Oxidation. Combust. Sci. Technol. 1994, 99, 253–276. [Google Scholar] [CrossRef]
  87. Konnov, A.A. Implementation of the NCN pathway of prompt-NO formation in the detailed reaction mechanism. Combust. Flame 2009, 156, 2093–2105. [Google Scholar] [CrossRef]
  88. Duynslaegher, C.; Jeanmart, H.; Vandooren, J. Kinetics in Ammonia-Containing Premixed Flames and a Preliminary Investigation of Their Use as Fuel in Spark Ignition Engines. Combust. Sci. Technol. 2009, 181, 1092–1106. [Google Scholar] [CrossRef]
  89. Kumar, P.; Meyer, T.R. Experimental and modeling study of chemical-kinetics mechanisms for H2–NH3–air mixtures in laminar premixed jet flames. Fuel 2013, 108, 166–176. [Google Scholar] [CrossRef]
  90. Duynslaegher; Jeanmart, H.; Vandooren, J. Use of ammonia as a fuel for SI engine. In Proceedings of the European Combustion Meeting, Vienna, Austria, 14–17 April 2009; pp. 1–6. [Google Scholar]
  91. Shmakov, A.; Korobeinichev, O.; Rybitskaya, I.; Chernov, A.; Knyazkov, D.; Bolshova, T.; Konnov, A. Formation and consumption of NO in H2 + O2 + N2 flames doped with NO or NH3 at atmospheric pressure. Combust. Flame 2010, 157, 556–565. [Google Scholar] [CrossRef]
  92. Mansha, M.; Hassan, J.S.; Saleemi, A.R.; Ghauri, B.M. Detailed Kinetic Mechanism of CNG Combustion in an IC Engine. Adv. Chem. Eng. Sci. 2011, 1, 102–117. [Google Scholar] [CrossRef]
  93. Nozari, H.; Karabeyoğlu, A. Numerical study of combustion characteristics of ammonia as a renewable fuel and establishment of reduced reaction mechanisms. Fuel 2015, 159, 223–233. [Google Scholar] [CrossRef]
  94. Xiao, H.; Valera-Medina, A. Chemical Kinetic Mechanism Study on Premixed Combustion of Ammonia/Hydrogen Fuels for Gas Turbine Use. J. Eng. Gas Turbines Power 2017, 139, 081504. [Google Scholar] [CrossRef]
  95. Wu, M.; Cova-Bonillo, A.; Gabana, P.; Brinklow, G.; Khedkar, N.; Herreros, J.; Rezaei, S.Z.; Tsolakis, A.; Millington, P.; Clave, S.A.; et al. Addressing the challenge of ammonia slip and nitrous oxide emissions from zero-carbon fuelled engines through catalytic aftertreatment solutions. Int. J. Hydrogen Energy 2024, 94, 848–861. [Google Scholar] [CrossRef]
  96. Cai, T.; Zhao, D.; Gutmark, E. Overview of fundamental kinetic mechanisms and emission mitigation in ammonia combustion. Chem. Eng. J. 2023, 458, 141391. [Google Scholar] [CrossRef]
  97. Liu, L.; Wu, Y.; Wang, Y. Numerical investigation on the combustion and emission characteristics of ammonia in a low-speed two-stroke marine engine. Fuel 2022, 314, 122727. [Google Scholar] [CrossRef]
  98. Fenimore, C.P.; Jones, G.W. Oxidation of Ammonia in Flames. J. Phys. Chem. 1961, 65, 298–303. [Google Scholar] [CrossRef]
  99. Setchell, R.E.; Miller, J.A. Raman scattering measurements of nitric oxide in ammonia/oxygen flames. Combust. Flame 1978, 33, 23–32. [Google Scholar] [CrossRef]
  100. Mathieu, O.; Petersen, E.L. Experimental and modeling study on the high-temperature oxidation of Ammonia and related NOx chemistry. Combust. Flame 2015, 162, 554–570. [Google Scholar] [CrossRef]
  101. Song, Y.; Hashemi, H.; Christensen, J.M.; Zou, C.; Marshall, P.; Glarborg, P. Ammonia oxidation at high pressure and intermediate temperatures. Fuel 2016, 181, 358–365. [Google Scholar] [CrossRef]
  102. Glarborg, P.; Miller, J.A.; Ruscic, B.; Klippenstein, S.J. Modeling nitrogen chemistry in combustion. Prog. Energy Combust. Sci. 2018, 67, 31–68. [Google Scholar] [CrossRef]
  103. Jójka, J.; Ślefarski, R. Dimensionally reduced modeling of nitric oxide formation for premixed methane-air flames with ammonia content. Fuel 2018, 217, 98–105. [Google Scholar] [CrossRef]
  104. US EPA. Nitrous Oxide Emissions. Available online: https://www.epa.gov/ghgemissions/nitrous-oxide-emissions (accessed on 16 May 2025).
  105. Stocker, T.; Qin, D.; Plattner, G.K.; Tignor, M.; Allen, S.; Boschung, J.; Nauels, A.; Xia, Y.; Bex, V.; Midgley, P. Climate Change 2013: The Physical Science Basis; Contribution of Working Group I to the Fifth Assessment Report of the Intergovernmental Panel on Climate Change; Cambridge University Press: Cambridge, UK, 2013. [Google Scholar]
  106. US EPA. Basic Information About NO2. Available online: https://www.epa.gov/no2-pollution/basic-information-about-no2 (accessed on 16 May 2025).
  107. Evans, M. Control Techniques for Nitrogen Oxides Emissions from Stationary Sources; Environmental Protection Agency: Research Triangle Park, NC, USA, 1978. [Google Scholar]
  108. Liu, B.; Bao, B.; Wang, Y.; Xu, H. Numerical simulation of flow, combustion and NO emission of a fuel-staged industrial gas burner. J. Energy Inst. 2017, 90, 441–451. [Google Scholar] [CrossRef]
  109. Hanraths, N.; Tolkmitt, F.; Berndt, P.; Djordjevic, N. Numerical Study on NOx Reduction in Pulse Detonation Combustion by Using Steam Injection Decoupled from Detonation Development. J. Eng. Gas Turbines Power 2018, 140, 121008. [Google Scholar] [CrossRef]
  110. Gholami, F.; Tomas, M.; Gholami, Z.; Vakili, M. Technologies for the nitrogen oxides reduction from flue gas: A review. Sci. Total. Environ. 2020, 714, 136712. [Google Scholar] [CrossRef]
  111. Miller, J.; Branch, M.; Kee, R. A chemical kinetic model for the selective reduction of nitric oxide by ammonia. Combust. Flame 1981, 43, 81–98. [Google Scholar] [CrossRef]
  112. Lindstedt, R.P.; Selim, M.A. Reduced Reaction Mechanisms for Ammonia Oxidation in Premixed Laminar Flames. Combust. Sci. Technol. 1994, 99, 277–298. [Google Scholar] [CrossRef]
  113. Radojevic, M. Reduction of nitrogen oxides in flue gases. Environ. Pollut. 1998, 102, 685–689. [Google Scholar] [CrossRef]
  114. Chung, S.J.; Pillai, K.C.; Moon, I.S. A sustainable environmentally friendly NOx removal process using Ag(II)/Ag(I)-mediated electrochemical oxidation. Sep. Purif. Technol. 2009, 65, 156–163. [Google Scholar] [CrossRef]
  115. Shao, J.; Hansen, K.K. NOx reduction on Ag electrochemical cells with a K-Pt-Al2O3 adsorption layer. J. Electrochem. Soc. 2013, 160, H294. [Google Scholar] [CrossRef]
  116. Shao, J.; Hansen, K.K. Characterization of LSM/CGO Symmetric Cells Modified by NOx Adsorbents for Electrochemical NOx Removal with Impedance Spectroscopy. J. Electrochem. Soc. 2013, 160, H494–H501. [Google Scholar] [CrossRef]
  117. Hamamoto, K.; Suzuki, T.; Fujishiro, Y.; Awano, M. Tubular Solid Oxide Electrolysis Cell for NOx Decomposition. J. Electrochem. Soc. 2011, 158, B1050–B1053. [Google Scholar] [CrossRef]
  118. Hansen, K.K. Activation/Deactivation Phenomena in the Electrochemical Reduction of Nitric oxide and Oxygen on LSM perovskites. Int. J. Electrochem. Sci. 2018, 13, 4782–4791. [Google Scholar] [CrossRef]
  119. Friedberg, A.Z.; Hansen, K.K. NOx and propene conversion on La0.85Sr0.15MnO3+d/Ce0.9Gd0.1O1.95 symmetrical cells. J. Electrochem. Sci. Eng. 2017, 7, 153–166. [Google Scholar] [CrossRef]
  120. Zabetta, E.C.; Hupa, M.; Saviharju, K. Reducing NOx Emissions Using Fuel Staging, Air Staging, and Selective Noncatalytic Reduction in Synergy. Ind. Eng. Chem. Res. 2005, 44, 4552–4561. [Google Scholar] [CrossRef]
  121. Chen, S.; Cole, J.; Heap, M.; Kramlich, J.; Mccarthy, J.; Pershing, D. Advanced NOx reduction processes using-NH and -CN compounds in conjunction with staged air addition. Symp. Int. Combust. 1989, 22, 1135–1145. [Google Scholar] [CrossRef]
  122. Wendt, J.; Sternling, C.; Matovich, M. Reduction of sulfur trioxide and nitrogen oxides by secondary fuel injection. Symp. Int. Combust. 1973, 14, 897–904. [Google Scholar] [CrossRef]
  123. Smoot, L.; Hill, S.; Xu, H. NOx control through reburning. Prog. Energy Combust. Sci. 1998, 24, 385–408. [Google Scholar] [CrossRef]
  124. Su, S.; Xiang, J.; Sun, L.; Hu, S.; Zhang, Z.; Zhu, J. Application of gaseous fuel reburning for controlling nitric oxide emissions in boilers. Fuel Process. Technol. 2009, 90, 396–402. [Google Scholar] [CrossRef]
  125. What’s the Best Way to Remove NOx? Available online: https://www.linde-gas.com/industries/refining/emission-abatement-and-control/nox-removal (accessed on 11 June 2025).
  126. MARTIN GmbH. NOx_Reduktion18; MARTIN GmbH: Munchen, Germany, 2013; Available online: https://www.martingmbh.de/media/files/Technologie/NOx_Reduktion18.pdf (accessed on 11 June 2025).
  127. Gehrmann, H.-J.; Jaeger, B.; Wirtz, S.; Scherer, V.; Aleksandrov, K.; Hauser, M.; Stapf, D.; Pollmeier, G.; Danz, P. Oscillating Combustion—Primary Measure to Reduce Nitrogen Oxide in a Grate Furnace–Experiments and Simulations. Processes 2021, 9, 2210. [Google Scholar] [CrossRef]
  128. Cho, H.-C.; Cho, K.-W.; Kim, H.-J. NOX Emission Characteristics in Radiant Tube Burner with Oscillating Combustion Technology. Trans. Korean Soc. Mech. Eng. B 2008, 32, 100–106. [Google Scholar] [CrossRef]
  129. Wagner, J.C. Nox Emission Reduction by Oscillating Combustion; Gas Technology Institute: Des Plaines, IL, USA, 2004. [Google Scholar]
  130. Pattabathula, V.; Richardson, J. Introduction to ammonia production. Back Basics. 2016. Available online: https://www.aiche.org/sites/default/files/cep/20160969.pdf (accessed on 2 October 2025).
  131. European Commission. Best Available Techniques for the Manufacture of Large Volume Inorganic Chemicals-Ammonia, Acids and Fertilisers; European Comission: Brussels, Belgium, 2007. [Google Scholar]
  132. Chehade, G.; Dincer, I. Progress in green ammonia production as potential carbon-free fuel. Fuel 2021, 299, 120845. [Google Scholar] [CrossRef]
  133. Kurien, C.; Mittal, M. Review on the production and utilization of green ammonia as an alternate fuel in dual-fuel compression ignition engines. Energy Convers. Manag. 2022, 251, 114990. [Google Scholar] [CrossRef]
  134. Lasocki, J. Ammonia and conventional engine fuels: Comparative environmental impact assessment. In Proceedings of the 10th Conference on Interdisciplinary Problems in Environmental Protection and Engineering EKO-DOK, Polanica-Zdroj, Poland, 16–18 April 2018. [Google Scholar] [CrossRef]
  135. Frattini, D.; Cinti, G.; Bidini, G.; Desideri, U.; Cioffi, R.; Jannelli, E. A system approach in energy evaluation of different renewable energies sources integration in ammonia production plants. Renew. Energy 2016, 99, 472–482. [Google Scholar] [CrossRef]
  136. Bora, N.; Singh, A.K.; Pal, P.; Sahoo, U.K.; Seth, D.; Rathore, D.; Bhadra, S.; Sevda, S.; Venkatramanan, V.; Prasad, S.; et al. Green ammonia production: Process technologies and challenges. Fuel 2024, 369, 131808. [Google Scholar] [CrossRef]
  137. Spillias, S.; Kareiva, P.; Ruckelshaus, M.; McDonald-Madden, E. Renewable energy targets may undermine their sustainability. Nat. Clim. Change 2020, 10, 974–976. [Google Scholar] [CrossRef]
  138. Enerdata. Renewables in Electricity Production|Statistics Map by Region. Available online: https://yearbook.enerdata.net/renewables/renewable-in-electricity-production-share.html (accessed on 3 July 2025).
  139. IEA. Norway 2022 Energy Policy Review; IEA: Paris, France, 2022; Available online: https://iea.blob.core.windows.net/assets/de28c6a6-8240-41d9-9082-a5dd65d9f3eb/NORWAY2022.pdf (accessed on 3 July 2025).
  140. Stromerzeugung nach Energieträgern in Norwegen 2024. Statista. Available online: https://de.statista.com/statistik/daten/studie/1292636/umfrage/struktur-der-stromerzeugung-in-norwegen/ (accessed on 15 July 2025).
  141. Glossary Beginning with L. Clean Energy Wire. Available online: https://www.cleanenergywire.org/glossary/letter_l (accessed on 15 July 2025).
  142. DX4000 FTIR Gas Analyzer Helps Study Flue Gases at Savonia University. Gasmet.de. Available online: https://www.gasmet.com/de/cases/dx4000-ftir-gas-analyzer-helps-study-flue-gases-at-savonia-university/ (accessed on 15 July 2025).
  143. Calcmet Software: Analyzing Multiple Gases with the New FTIR Analyzer. Gasmet.de. Available online: https://www.gasmet.com/de/blog/calcmet-software-analyzing-multiple-gases-with-the-new-ftir-analyzer/ (accessed on 15 July 2025).
  144. Saarinen, P.; Kauppinen, J. Multicomponent Analysis of FT-IR Spectra. Appl. Spectrosc. 1991, 45, 953–963. [Google Scholar] [CrossRef]
  145. About @RISK. Available online: https://help.palisade.com/v8_8/en/@RISK/About/About/About-RISK.htm (accessed on 3 July 2025).
  146. Operating Expense Definition and How It Compares to Capital Expenses. Investopedia. Available online: https://www.investopedia.com/terms/o/operating_expense.asp (accessed on 3 July 2025).
  147. Fernanado, J.; James, M. Capital Expenditure (CapEx) Definition, Formula, and Examples. Investopedia. Available online: https://www.investopedia.com/terms/c/capitalexpenditure.asp (accessed on 3 July 2025).
  148. Kunysz, D.O. Kostenschätzung im Chemischen Anlagenbau; Springer Nature: Dordrecht, The Netherlands, 2020. [Google Scholar] [CrossRef]
  149. Zero Instrument. Understanding Ammonia Slip: Causes, Impacts, and Mitigation Strategies. Just Measure It. Available online: https://zeroinstrument.com/understanding-ammonia-slip-causes-impacts-and-mitigation-strategies/ (accessed on 2 September 2025).
  150. Bundesministerium der Justiz. 44. BimSchV—Vierundvierzigste Verordnung zur Durchführung des Bundes-Immissionsschutzgesetzes; Bundesministerium der Justiz: Berlin, Germany, 2019; Available online: https://www.gesetze-im-internet.de/bimschv_44/BJNR080410019.html (accessed on 3 September 2025).
  151. Carvalho, M.d.G.; Fiveland, W.A.; Lockwood, F.C.; Papadopoulos, C. Combustion Technologies for a Clean Environment; Taylor & Francis: London, UK, 2022. [Google Scholar]
  152. 17_10_26_MA_Power_to_Ammoniak_Michael_Heberl.pdf. Available online: https://opus4.kobv.de/opus4-oth-regensburg/frontdoor/deliver/index/docId/2216/file/17_10_26_MA_Power_to_Ammoniak_Michael_Heberl.pdf (accessed on 3 July 2025).
  153. Hydrogen Center Bavaria|Zentrum Wasserstoff.Bayern (H2.B). Available online: https://h2.bayern/en/ (accessed on 3 July 2025).
  154. Heat Roadmap Europe. EU28 Fuel Prices for 2015, 2030 and 2025; Heat Roadmap Europe: Aalborg, Denmark, 2017; Available online: https://heatroadmap.eu/wp-content/uploads/2020/01/HRE4_D6.1-Future-fuel-price-review.pdf (accessed on 15 July 2025).
  155. Moritz, M.; Schönfisch, M.; Schulte, S. Estimating global production and supply costs for green hydrogen and hydrogen-based green energy commodities. Int. J. Hydrogen Energy 2022, 48, 9139–9154. [Google Scholar] [CrossRef]
  156. Demineralized Water Cost. Intratec.us. Available online: https://www.intratec.us/solutions/industry-economics-worldwide/utility/demineralized-water-cost (accessed on 15 July 2025).
  157. Commodity Price Index. HWWI. Available online: https://www.hwwi.org/en/data-offers/commodity-price-index/ (accessed on 3 July 2025).
  158. European Union. Consolidated Text: Directive 2003/87/EC of the European Parliament and of the Council of 13 October 2003 Establishing a System for Greenhouse Gas Emission Allowance Trading Within the Union and Amending Council Directive 96/61/EC (Text with EEA Relevance); European Commission: Brussels, Belgium, 2024; Available online: https://eur-lex.europa.eu/eli/dir/2003/87/2024-03-01/eng (accessed on 3 July 2025).
  159. Örtl, E. Klimaschutzbeitrag Verschiedener CO2-Preispfade in den BEHG-Sektoren Verkehr, Gebäude und Industrie; Umweltbundesamt: Dessau-Roßlau, Germany, 2022; Available online: https://www.umweltbundesamt.de/publikationen/klimaschutzbeitrag-verschiedener-co2-preispfade-in (accessed on 3 July 2025).
  160. Kreidelmeyer, S. Strompreisprognose. 2023. Available online: https://www.prognos.com/de/projekt/strompreisprognose-2023 (accessed on 2 October 2025).
  161. Feenstra, M.; Monteiro, J.; Akker, J.T.v.D.; Abu-Zahra, M.R.; Gilling, E.; Goetheer, E. Ship-based carbon capture onboard of diesel or LNG-fuelled ships. Int. J. Greenh. Gas Control. 2019, 85, 1–10. [Google Scholar] [CrossRef]
  162. Li, J.; Huang, H.; Kobayashi, N.; He, Z.; Nagai, Y. Study on using hydrogen and ammonia as fuels: Combustion characteristics and NOx formation. Int. J. Energy Res. 2014, 38, 1214–1223. [Google Scholar] [CrossRef]
  163. Mashruk, S.; Okafor, E.; Kovaleva, M.; Alnasif, A.; Pugh, D.; Hayakawa, A.; Valera-Medina, A. Evolution of N2O production at lean combustion condition in NH3/H2/air premixed swirling flames. Combust. Flame 2022, 244, 112299. [Google Scholar] [CrossRef]
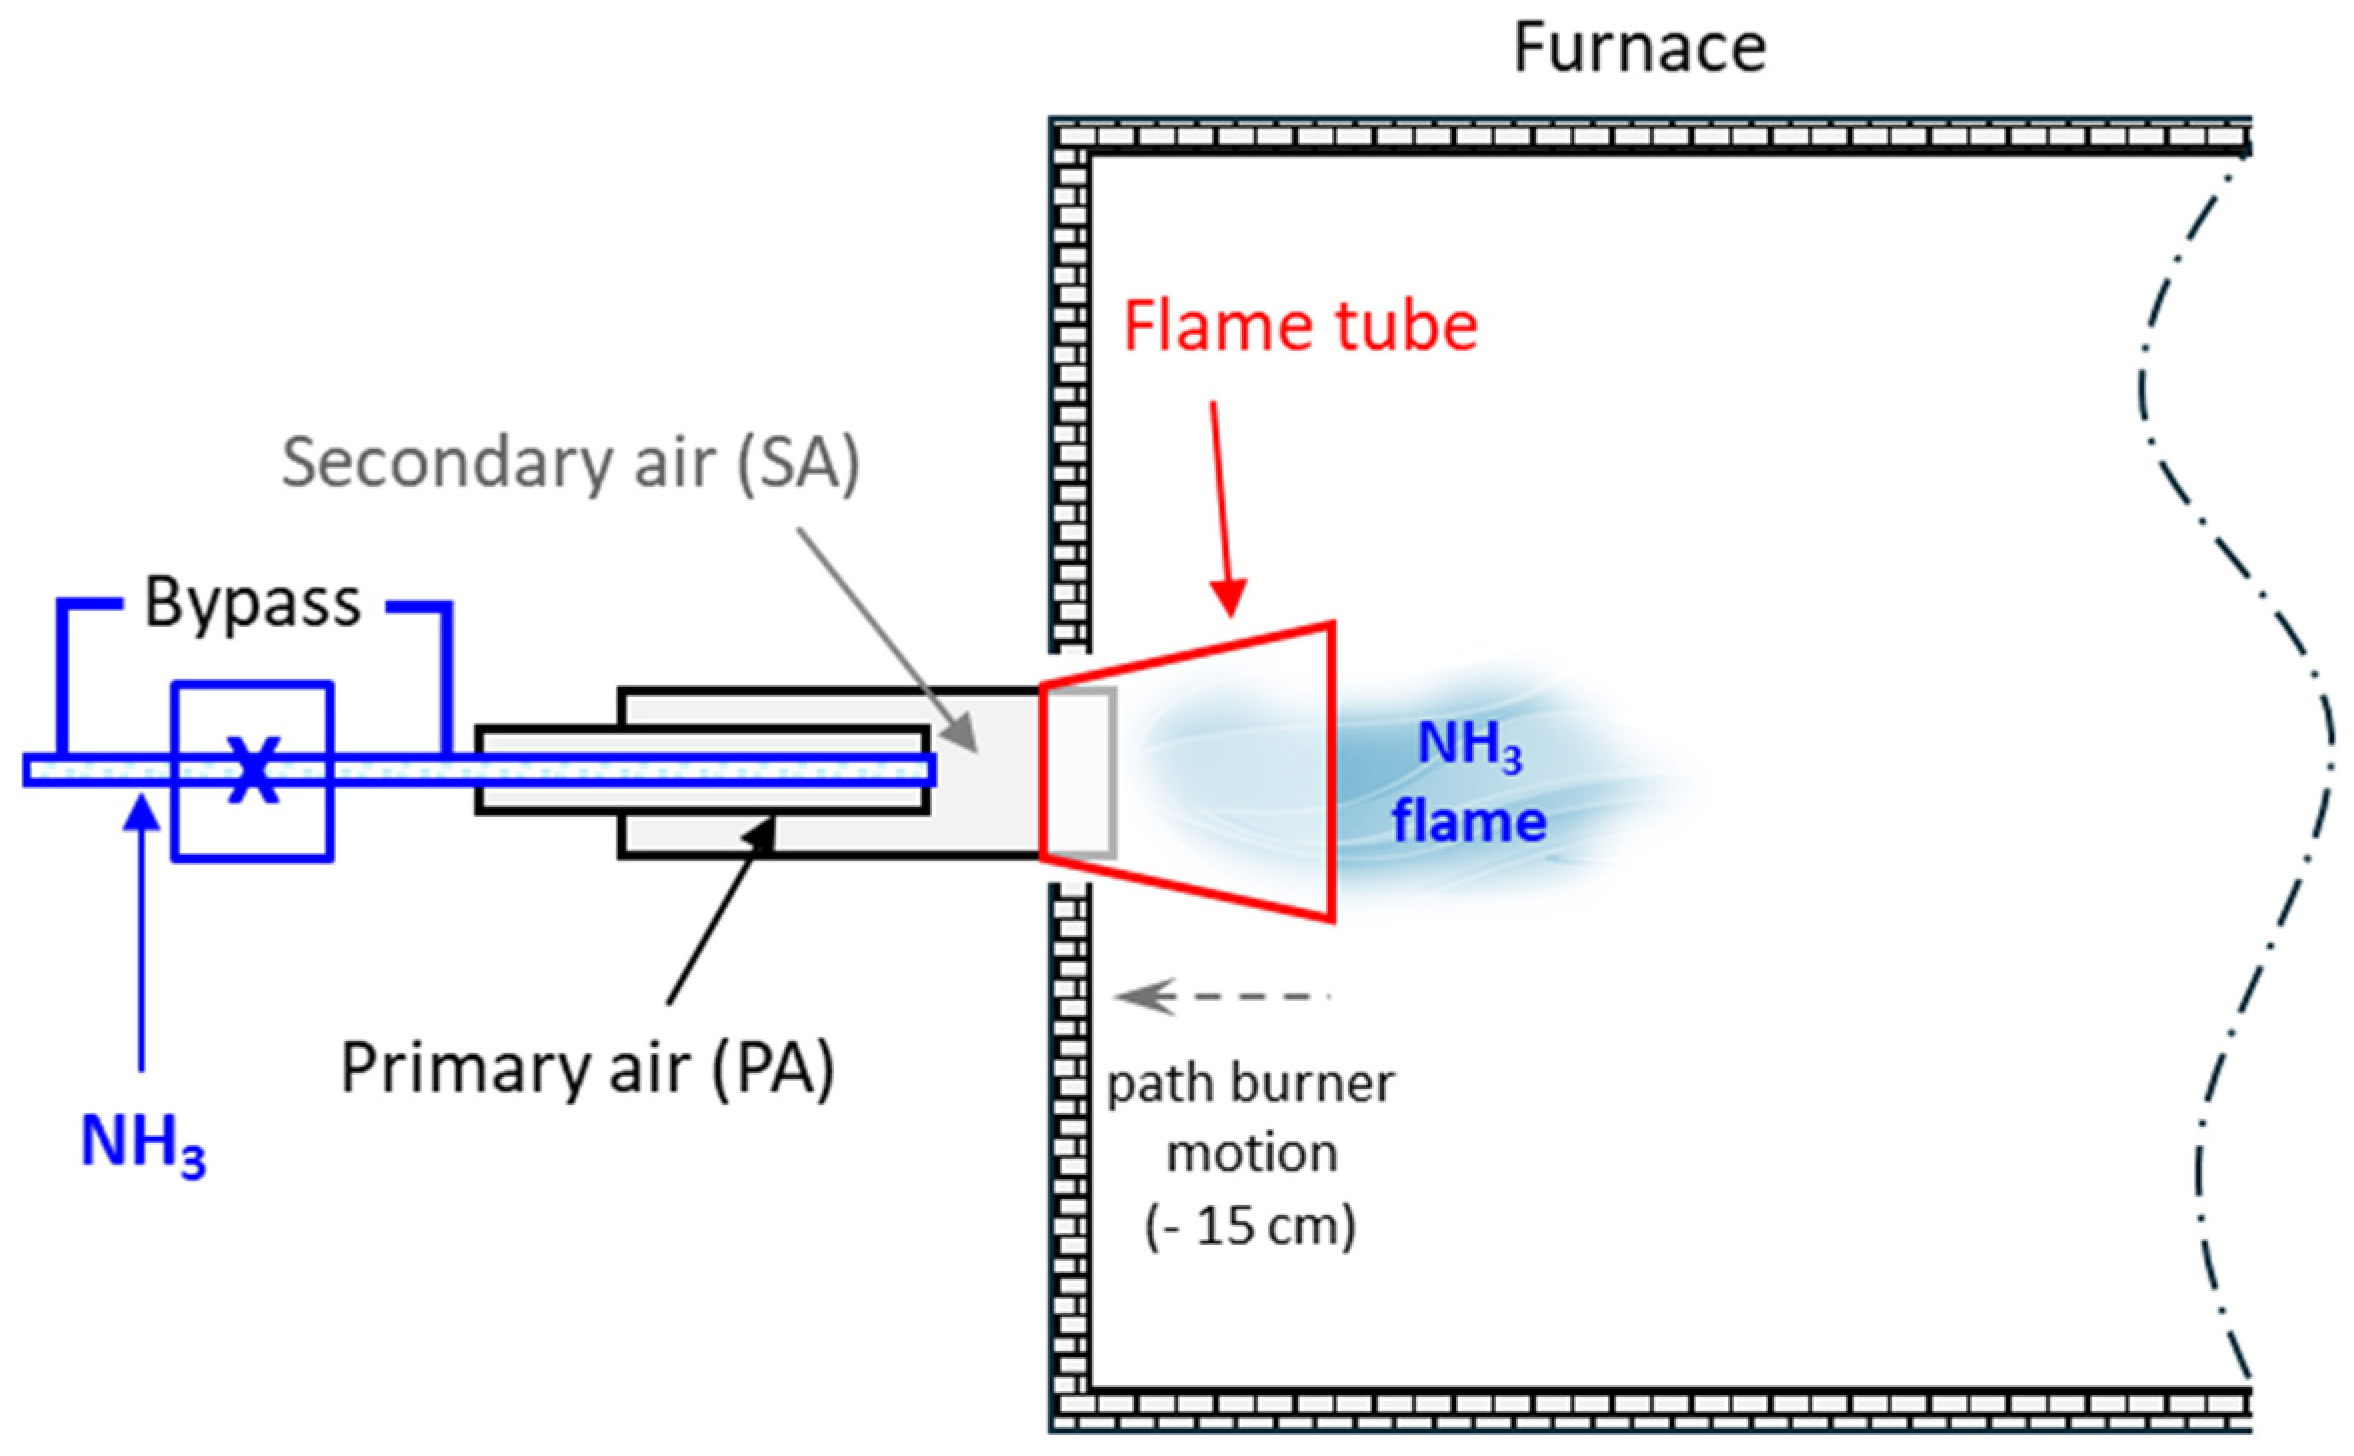
Figure 1. Setup of burner, flame tube and furnace.
Energies 18 05948 g001
Figure 2. Ammonia fuel supply line equipped with a gas solenoid valve and a bypass, courtesy of the GWI.
Energies 18 05948 g002
Figure 3. Water-cooled combustion chamber with integrated Ammonia burner (a), start-up flame lance location (b), courtesy of the GWI.
Energies 18 05948 g003
Figure 4. Right-side view of the isothermal combustion chamber, courtesy of the GWI.
Energies 18 05948 g004
Figure 5. Schematical layout of the isothermal combustion chamber. Right-side view (a), front edge view (b), courtesy of the GWI.
Energies 18 05948 g005
Figure 6. Flue gas NOx and NH3 concentrations as a function of NH3 portion in the fuel mixture in a water-cooled combustion chamber.
Energies 18 05948 g006
Figure 7. Flue gas NOx and NH3 concentrations as a function of NH3 portion in the fuel mixture in an isothermal combustion chamber with no combustion air preheating.
Energies 18 05948 g007
Figure 8. Flue gas NOx and NH3 concentrations as a function of NH3 portion in the fuel mixture in an isothermal combustion chamber with combustion air preheated to 260 °C.
Energies 18 05948 g008
Figure 9. Principle of NOx reduction by the oscillating combustion of methane (a) and Ammonia (b).
Energies 18 05948 g009
Figure 10. NOx and NH3 concentrations as a function of the oscillation frequency in an isothermal combustion chamber.
Energies 18 05948 g010
Figure 11. Operating costs of gray and green ammonia production in Norway from 2020 to 2050 without considering CO2 pricing.
Energies 18 05948 g011
Figure 12. Operating costs of gray and green ammonia production in Norway from 2020 to 2050 considering CO2 certificate prices.
Energies 18 05948 g012
Figure 13. Structure of the Ammonia process chain for the cost analysis.
Energies 18 05948 g013
Figure 14. Calculated operating costs of the process chains for the production of gray and green ammonia, including further use, from 2020 to 2050.
Energies 18 05948 g014
Figure 15. Calculated cost for the operation of a combined SCR and SNCR exhaust gas treatment facility from 2020 to 2050.
Energies 18 05948 g015
Figure 16. Sensitivity analysis of the total cost of ownership of gray ammonia production (the red bars represent the calculated value from the profitability calculation).
Energies 18 05948 g016
Figure 17. Sensitivity analysis of the total operating costs of green ammonia production (the red bars represent the calculated value from the profitability calculation).
Energies 18 05948 g017
Figure 18. Operating cost of boiler firing with natural gas from 2020 to 2050.
Energies 18 05948 g018
Figure 19. Operating cost of boiler firing with natural gas and ammonia for heat production from 2020 to 2050.
Energies 18 05948 g019
Table 1. DX 400 flue gas species and concentration ranges.
Component Flue GasConcentration RangeConcentration RangeConcentration Range
[mg/m3][Vol. %][ppm]
NH30 to 5000
H2O 0 to 30
CO 0 to 2
CO2 0 to 20
N2O0 to 180
NO 0 to 1100
NO2 dry 0 to 250
NOx dry 0 to 1300
Table 2. Experimental parameters for NH3 combustion.
Parameter First Experimental SeriesSecond Experimental Series
Volume flow (NH3)[m3N/h]10.7–19.40–32.5
Volume flow (natural gas)[m3N/h]11.8–3.112–0
Total volume flow fuel (NH3 + natural gas)[m3N/h]22.532.5
NH3 fraction[%]48–860–100
Natural gas fraction[%]52–14100–0
Volume flow (combustion air)[m3N/h]110150
Primary air/secondary air[%]15/85100/0
Air ratio, λ[-]1.24–1.061.06–1.97
Swirl[-]YesYes
Temperature (combustion air)[°C]2525/260
Oscillation frequency[Hz]00–2
Furnace type Water-cooledIsothermal
Furnace interior temperature[°C]800800/1000
Thermal output furnace[kW]110130
Table 3. Material expenditures considered for the operating costs calculation for green Ammonia production.
Projection Costs2020203020402050LocationReference
Natural gas [€/MWh] 33343637EU[154]
Electricity [€/MWh] 42414449NOR[155]
Demineralized water [ / t H 2 O ]0.440.450.450.45NOR[156,157]
Table 4. Cost estimate for CO2 certificates in Europe through 2050.
Cost Estimate2020203020402050LocationReference
CO2 certificate [ / t C O 2 ]25282398515EU[159,160]
Table 5. CapEx and OpEx for transportation of Ammonia from Norway to Germany, storage and boiler firing and subsequent flue gas treatment.
CapEx [Millions of EUR]OpEx
[ / t N H 3 ]
2020203020402050
Maritime transport-2.62.62.62.6
Storage16.416.62313.314.6
Boiler firing3026.535.618.220.8
Flue gas treatment3.59.510.48.59.1
Table 6. Investment and operating costs for the reduction of NOx concentrations.
Operation ModeInvestment SNCR and SCRReduction Rate [%]20202030
SNCRSCR [ / t N H 3 ]
Without oscillation
(14,000 mg/kWh)
EUR 3.5 million869521.823.2
With oscillation
(3000 mg/kWh)
70909.510.4
Table 7. Price forecasts for operating resources in flue gas cleaning.
2020203020402050Reference
Ammonia water
[€/t]
103106109113[157]
Compressed air [ / m N 3 ]0.030.030.030.03[158]
Electricity
[€/MWh]
45767259[160]
Disclaimer/Publisher’s Note: The statements, opinions and data contained in all publications are solely those of the individual author(s) and contributor(s) and not of MDPI and/or the editor(s). MDPI and/or the editor(s) disclaim responsibility for any injury to people or property resulting from any ideas, methods, instructions or products referred to in the content.