Abstract
The method of effectiveness-number of heat transfer units (ε-NTU) is adopted to establish a design indicator prediction model for plate fin precooler (PFP), and experimental verification is conducted. The average error between the experimental heat transfer capacity and the calculated heat transfer capacity is 4.65%, and the predicted mass matches the mass computed via the commercial software SolidWorks 2020. This outcome confirms the model’s reliability. An investigation is conducted into the influences of parametric factors, including hot stream flow length, cold stream flow length, hot side number of layers, and hot side fin pitch on the heat transfer capacity and mass of the PFP. To realize the maximization of heat transfer capacity and the minimization of mass, optimization is performed on the four sensitive configuration parameters by leveraging the multi-objective grey wolf optimizer (MOGWO). This optimization can significantly reduce the mass while ensuring the stability of the heat transfer capacity. Three classes of optimal configurations were derived from Pareto optimal points. Compared to the original structure, the selected schemes exhibit an average 2.95% rise in heat transfer capacity and a 10.7% reduction in mass. These findings show that the optimization method proposed in this study is effective and provides valuable guidance for precooler design.
1. Introduction
As science and technology undergo ongoing development, space exploration and utilization are attracting increasing focus. Consequently, the demand for aircraft has grown rapidly. During high-Mach-number flight of an aircraft, excessive stagnation temperature at the engine inlet severely degrades engine performance; thus, it is necessary to install a precooler in the engine inlet duct. Incorporating a precooler into the duct serves as an effective measure to increase the thrust-to-weight ratio and enhance the engine’s overall performance.
The plate fin precooler (PFP) is essentially a type of heat exchanger. It boasts advantages such as simple structure, compact footprint, excellent heat transfer efficiency, minimal heat dissipation, easy disassembly and maintenance, and a wide variety of plate types, thus being widely used in the aerospace field. For PFP, the selection of optimal configuration parameters is crucial, as it not only directly enhances their heat transfer efficiency but also optimizes their overall quality. Owing to the critical role of parameter optimization in improving precooler performance, scholars in this field have conducted extensive research on this topic [1,2].
1.1. Influences on Performance Prediction
The performance prediction of a heat exchanger essentially involves a thermodynamic performance calculation. Specifically, a mathematical model for the heat transfer performance of the heat exchanger is established, the influence mechanism of the variations in thermophysical parameters on heat transfer performance is analyzed, and prediction criteria for the synergistic optimization of calculation accuracy and efficiency are formulated and verified through experiments. Accordingly, researchers have conducted extensive studies on the optimization of its structural design from various perspectives.
Liang et al. [2] proposed a quasi-two-dimensional calculation method for the design of high-efficiency and low-resistance plate-fin precoolers and compared the heat transfer performance between cold and hot fluids. They found that the heat transfer coefficient of the cold fluid is higher than that of the hot fluid by an order of magnitude, ranging from 10 to 102. Liang et al. [3] utilized the commercial CFD solver Fluent 16.0 to evaluate the overall performance of the plate-fin precooler under high-temperature and negative-pressure conditions and further investigated the characteristics of the internal thermal-fluid flow field of the precooler with and without fins. It was found that when the fluid was in a low-density and high-speed flow state, the comprehensive performance of the precooler did not increase with an increase in the number of fins. Liang et al. [4] evaluated the performance of the precooler and identified key influencing factors via experimental methods. Experimental results indicate that the inlet temperature of the hot fluid in the precooler exceeds 1100 K, and the static pressure drops to below 30 kPa. Taler et al. [5] put forward a new method for the thermal calculation of cross-flow tube heat exchangers. The heat exchanger is divided into finite volumes, and the advantage of the developed method is that the temperature within the finite volumes can be determined at any point. Yang et al. [6] established a mathematical model to quantitatively evaluate the influence of flow maldistribution in multi-channel heat exchangers. Results show that the good synergy of flow rates between cold and hot fluids in adjacent sub-exchangers can effectively reduce effectiveness deterioration. Liu et al. [7] constructed distributed parameter models for flow and cross-flow plate fin heat exchangers (PFHXs) and investigated their thermodynamic performance. Studies indicate that the longitudinal heat conduction effect transmits the influence of boundary conditions at both ends of the separating plates to the internal region of the flow and cross-flow PFHX. Aiming to improve the heat transfer efficiency of air-cooled high-voltage motor heat exchangers, Liu et al. [8] established a mathematical model based on heat transfer theory and clarified the temperature distribution and fluid flow characteristics inside the heat exchanger. They also found that the optimal distance between the linear deflector and the outlet of the internal air path is 160 mm. Hu et al. [9] found that the heat transfer properties of the hot-wall heat exchanger (HWHE) can be obtained more quickly by establishing a mathematical model for it. The results showed that the thermal resistance caused by the panel with heat convection and conduction accounts for 96.54% of the HWHE’s thermal resistance.
Among the aforementioned literature, although studies on heat exchanger performance prediction have been conducted, the conclusions drawn are mostly qualitative descriptions, which exhibit weak guidance for practical engineering applications. Furthermore, studies specifically focusing on PFPs are relatively scarce, failing to provide specific selection criteria for the actual design of PFPs.
1.2. Structural Design Optimization
The structural design optimization of a heat exchanger aims to enhance specific performance as a clear objective. It achieves better performing structures by proposing new structures and selecting optimal parameters, rather than adjusting a single parameter. Analyzing the influencing laws of parameters on its heat transfer efficiency can, in turn, directly alter the comprehensive performance of the equipment. Accordingly, researchers have conducted extensive studies on the impacts of these parameters on heat exchanger performance from various perspectives.
Anibal et al. [10] noted that drag-minimized designs typically feature fins elongated in either height or width. Within the drag-reduction design space, they further identified two local minima, each corresponding to one of these two stretching directions. Gupta et al. [11] demonstrated that a 44.5% mass reduction can be achieved by selecting suitable fin geometries. Their study aimed to obtain design configurations, thereby enabling the heat exchangers to achieve minimum mass and volume. Ye et al. [12] conducted a study on PFHX optimization for a cascade refrigeration system (CRS), with a focus on how fin geometry and axial length affect system performance. Their work provides a quantification of the individual contributions of these factors to the COP. The results show that the type of fin barely influences the performance of the CRS, while the element axial length has the greatest impact, followed by fin height, porosity, and fin thickness in sequence. To quantify the heat transfer factor “j” and friction “f” for various fin configurations, Kedam et al. [13] developed a specific model that incorporates key geometric parameters, such as plate spacing, fin pitch, hydraulic diameter, wave amplitude, and fin length. It was found that within a broad range of Reynolds number flow conditions, the performance of the proposed heat transfer factor “j” and friction “f” factor models is superior to that of existing models. Nagarajan et al. [14] proposed a novel fin configuration for high-temperature ceramic PFHXs and, to this end, evaluated its performance by comparing key indicators, such as the Nusselt number, friction factor, and j factor across various designs. It was found that the heat transfer enhancement factor of the selected design reaches 2.3211, with an average Nusselt number of 4.215. An experimental study by Song et al. [15] on curved delta winglet vortex generators revealed that their size-dependent performance is contingent on the flow regime. Their tests on 15 samples with different fin pitches, tube pitches, and base lengths showed that compact generators excel near tubes in low-Re flows, while larger generators are superior for high-Re conditions. A numerical analysis was performed by Yicong et al. [16] to investigate the heat transfer and flow dynamics in welded plate heat exchangers with chevron sinusoidal corrugations. Subsequently, they leveraged artificial neural networks (ANNs) and multi-objective genetic algorithms (MOGAs) for the multi-objective optimization of the structural parameters. Numerical results indicated that the plate with β = 45° exhibited superior comprehensive performance, with p = 30 mm and H = 9 mm also performing well. Buyruk et al. [17] adopted a conjugated heat transfer approach to evaluate the thermal-hydraulic performance of PFHXs with Type B and Type C rectangular fins through numerical simulation. Results indicated that under counter-flow conditions, heat transfer at the channel exit with Type B fins was approximately 9% higher than that in a finless channel.
Although structural design optimization has been conducted in the aforementioned literature, the published studies primarily focus on PFHX, with few studies on plate-fin precoolers. Differences in their application scenarios may lead to variations in performance.
1.3. Multi-Objective Optimization
Multi-objective optimization is proposed as a better solution to address the limitations of single-objective optimization. It obtains optimal solutions via optimization algorithms, ultimately providing diversified options that balance performance, cost, and reliability for engineering design. Accordingly, researchers have conducted extensive studies on this topic.
Jirandeh et al. [18] developed a novel and practical methodology for designing optimal PFHX networks, aiming to minimize the total annual cost. Results demonstrated that compared with the cross-flow heat exchanger network, the total annual cost of the counter-flow heat exchanger network was reduced by 12.5%, and its total heat transfer area decreased by 23.27%. Zarea et al. [19] developed a novel search algorithm named BAHPSO, and selected key parameters to investigate their impact on each objective function, which takes maximizing heat exchanger effectiveness and minimizing total annual cost (TAC) as two conflicting optimization orientations. Mohapatra et al. [20] proposed an optimal design methodology for PFHXs with the goal of minimizing total weight, entropy generation units, and annual cost, employing a novel opposition-based orthogonal learning Kho–Kho algorithm for both single- and multi-objective optimization. By integrating a kriging response surface with a multi-objective genetic algorithm (MOGA), Wen et al. [21] developed an improved algorithm to optimize fin design parameters for PFHX performance. This approach yielded a design with an annual cost roughly 10% lower than previous solutions and achieved faster convergence. Hajabdollahi [22] developed a model for a constructal PFHX, taking thermal effectiveness and total annual cost into consideration as dual objectives, and performed multi-objective optimization employing the particle swarm optimization algorithm. Constructal PFHXs are thermo-economically optimal when effectiveness exceeds 0.747, whereas conventional ones are optimal below this threshold. To optimize the performance of a PFHX used in an extended-range hybrid vehicle engine, Li et al. [23] carried out a multi-objective optimization using the non-dominated sorting genetic algorithm. Results indicated the heat exchanger delivered optimal overall performance with a fin angle of 63.01. A comparative analysis by Li, K et al. [24] revealed significant performance improvements in the optimized structures. Compared to the baseline, Structures 1, 2, and 3 exhibited increases in the JF factor (heat transfer and flow comprehensive performance factor) of 8.8%, 4.4%, and 9.6%, respectively, accompanied by reductions in maximum stress of 29.6%, 42.3%, and 21.1%. The MOGA incorporating the response surface methodology (RSM) delivers theoretical support for PFHX design optimization. Guan et al. [25] applied a multi-objective genetic algorithm (MOGA) coupled with numerical simulation to analyze the thermodynamics of a serrated PFHX. Their results demonstrated that the optimized structure achieved a 3.7% higher j factor, along with a 7.8% reduction in the f factor and a 31% decrease in entropy generation compared to the original design. As shown in Table 1, the relevant information of classical algorithms is presented.

Table 1.
Relevant classical algorithm information.
Among the aforementioned literature, while multi-objective optimization designs for heat exchangers have been conducted, targeted optimization studies for PFP are insufficient. More critically, even the few relevant studies are difficult to translate into practical engineering applications, either due to over-simplified models that ignore real-world constraints or complex algorithms that lack operability in actual design processes.
The optimal design of PFP has long been a key bottleneck in industry. In practical production, “final qualification” is often the sole indicator, with repeated parameter adjustments and tests conducted if unqualified. This “trial-and-error” mode not only restricts product performance release but also tends to result in suboptimal PFPs, such as low heat transfer efficiency and excessive mass, which fail to meet high-efficiency and low-consumption engineering demands. Existing studies on heat exchangers cover performance prediction and structural optimization, yet studies targeting PFPs mostly focus on basic performance analysis and still fall short in addressing the core engineering demands. The effectiveness of multi-objective optimization in such studies remains limited. To address this, this study intends to develop a PFP performance prediction model based on iterative calculation. It will focus on engineering-critical parameters, hot stream flow length, cold stream flow length, hot side number of layers, and hot side fin pitch, and analyze their effects on heat transfer capacity and mass. Further, the study will optimize parameter configurations via MOGWO. It aims to ultimately achieve the synergistic goals of reducing PFP mass and enhancing heat transfer capacity, while providing optimal configuration references for engineering designers.
2. Performance Calculation Modeling
2.1. PFP Configuration
The role of the PFP in aero-engines is that of an air-to-air heat exchanger, and its operation is based on the thermal energy exchange between the hot and cold air streams. Relative to most heat exchangers employed in other industrial sectors, it features a smaller size, lighter weight, and a more compact structure. The primary components of the PFP include the core, inlet and outlet covers with their respective nozzles on the hot side, and inlet and outlet flanges on the cold side. As illustrated in Figure 1, the operational principle involves distinct flow paths: hot air enters through the hot side inlet, traverses the hot side fins, and exits through the corresponding outlet. Conversely, cold air follows a parallel path, entering and flowing through the cold side fins before being discharged from its outlet.

Figure 1.
PFP structure.
The PFP is fabricated from superalloys. To enhance the structural strength of the precooler, an integrated design is adopted for the covers and mounting brackets. The covers are joined to the core, and the flanges are connected to the core, both via electron beam welding. The 3D printing was employed for the fabrication of the PFP’s covers. Table 2 details the key geometric specifications, while Table 3 outlines the standard operating conditions.
Table 2.
Structural parameters of PFP.
Table 3.
PFP normal working conditions.
2.2. Performance Prediction Model
2.2.1. Performance Calculation Equations
Within this study, the ε-NTU method was employed to perform a heat transfer calculation for the PFP. At the core of this methodology is the determination of critical thermal parameters, primarily the number of transfer units, which signifies the size of the heat exchanger relative to its flow rate, and heat transfer effectiveness, which represents the ratio of the actual heat transfer to the maximum thermodynamically possible, which collectively provide the quantitative foundation for predicting and analyzing precooler performance. In the context of engineering design, heat transfer capacity and mass represent two key considerations: it is necessary to ensure a relatively high heat transfer capacity to meet the heat exchange demand, while reducing the mass as much as possible to optimize the overall performance. Specifically, the overall performance is defined as the comprehensive expression of the system in multiple dimensions, such as thermodynamics, structural mechanics, and engineering applications. The coordination of these two factors is crucial for improving the comprehensive efficiency of the precooler. Based on the aforementioned ε-NTU method, the specific calculation formulas for heat transfer capacity and mass are listed in Table 4 [27,28,29].
Table 4.
PFP heat transfer capacity and mass of computation equations.
2.2.2. Model Calculation Procedures
Accurate assessment of heat transfer capacity is a critical goal in PFP design. However, temperature fluctuations caused by fluid flow during the heat exchange process can alter the fluid properties, significantly increasing the complexity of calculating the heat transfer capacity. In response to this issue, an iterative correction-based method for heat transfer calculation is proposed in this study. The method works as follows: first, an initial assumption for heat transfer capacity is made; then, the fluid outlet temperature is calculated, and the average fluid temperature is derived by combining the outlet and inlet temperatures. Finally, the assumed value of the heat transfer capacity is repeatedly corrected through an iterative approach, which enables accurate prediction of the heat transfer capacity.
The established calculation model is divided into four stages, namely Problem Identification, Pre-Processing, Solve, and Post-Processing. In the Problem Identification stage, initial values are set to provide a data foundation for subsequent modeling. During the Pre-Processing stage, the heat transfer capacity is assumed, and a preliminary model is built based on the set initial values to establish the basic framework of the model. In the Solve stage, process parameters such as mass flow rate, Reynolds number, and friction coefficient are calculated by setting specific conditions. For the Post-Processing stage, the heat transfer capacity results are assessed against the convergence criterion, which requires the deviation between the calculated and initially assumed values to fall within a specified tolerance. If the deviation is unsatisfactory, the calculated heat transfer capacity value is used as the new assumed value of the heat transfer capacity in the Pre-Processing stage for iterative recalculation, until a heat transfer capacity calculation result within the acceptable deviation range is obtained. This approach reduces the impact of changes in internal fluid properties on calculation accuracy and ensures the effectiveness of the model. The detailed workflow of the calculation model is illustrated in Figure 2.

Figure 2.
Flowchart of the PFP configuration optimization method.
To establish the performance calculation model for the precooler, and considering the deviations between the calculation model and real-world conditions, the following assumptions are made for the calculation process:
- (1)
- The flow in the channels exhibits a uniformly distributed mass velocity because PFP typically features regular, symmetric channel structures with fins that promote flow homogenization. In well-designed precoolers, flow maldistribution is minimal under nominal operating conditions, and this simplification of the computational domain does not significantly compromise accuracy, as local velocity variations have a negligible impact on the overall heat transfer trend being predicted.
- (2)
- The fluid at the precooler outlet achieves a well-mixed condition, as fluids converge in the outlet header after passing through the finned channels, where turbulent mixing naturally occurs to create uniform temperature and composition. It simplifies the outlet boundary condition in the model, ensuring clear and stable closure for thermodynamic calculations.
- (3)
- The fluid’s axial heat transfer is omitted. Since the medium of the precooler is air–air, the main heat transfer mechanism is the convective heat transfer between air and solid fins and solid walls. Axial conduction in the fluid is negligible compared to convective heat transfer, especially under typical high-flow-rate operating conditions, and this simplification reduces the complexity of the energy equation without distorting the key heat exchange characteristics.
- (4)
- The precooler’s internal heat conduction is omitted. This omission is justified, especially given that the precooler uses air–air as the working fluid. For air–air systems, the solid heat conduction within the precooler structure has a far smaller impact than this primary fluid–solid convective heat transfer; therefore, neglecting solid heat conduction simplifies the model while still retaining the critical physical processes governing the precooler’s heat transfer performance.
2.3. Model Validation
To validate the PFP performance prediction model, a bench test was performed using the operational parameters specified in Table 3 and the setup depicted in Figure 3a.

Figure 3.
Performance experimental system.
Within this study, performance experiments on the PFP were conducted. A comparison between the model’s predictions and the experimental results was then performed to verify the computational model’s accuracy. The experimental system, as illustrated in Figure 3b, consists of a cold side experimental section and a hot side experimental section, both of which include electric control valves, flow meters, heaters, manual control valves, pressure sensors, and temperature sensors, with the main function of monitoring fluids that meet the operating condition requirements. The temperature sensors are employed to measure the temperatures of the cold side and hot side fluids, having a measurement range of 73.15 K–1123.15 K and a measurement error of ±0.2 K; the pressure sensors are used for measuring the pressures of the cold side and hot side fluids, with a measurement range of 0–1 MPa and a fundamental error of ±0.25%. The flow meters serve to measure the hot and cold fluid flow rates, with a measurement range of 500 to 7500 kg/h, operating within an error range of ±1.5%. The core error of the electric control valve is a deviation in control accuracy of ±0.5% FS, which has an extremely small impact on the actual flow control results. The manual control valve is kept fully open during normal test procedures and barely participates in precise flow control. The heater has a temperature control deviation of ±1 K, which is far smaller than the allowable range of inlet temperature fluctuation for the test bench; thus, its error can be basically neglected. All pipes are wrapped with thermal insulation layers to minimize heat loss.
The experimental system was linked to the PFP using pipelines. All experiments were conducted in accordance with the parameters provided in Table 5; once the system parameters stabilized, the heat transfer at each test point was measured and recorded. Each Qex value was calculated from the measured To′ data using Equation (13), and the final Qex results were averaged across three independent sets of experimental data.
Table 5.
Experimental working conditions.
As shown in Figure 3b, 1, 10, and 18 are Electric Control Valves; 3 and 12 are Heaters; 4, 9, and 13 are Manual Control Valves; 6, 8, 15, and 17 are Temperature Sensors; 5, 7, 14, and 16 are Pressure Sensors; 2 and 11 are Flow Meters.
The comparison between the calculated heat transfer capacity Qpr of the PFP performance prediction model and experimental heat transfer capacity Qex is shown in Figure 4. According to Equation (14), the percentage error for the data in the figure was computed, where daca and daex represent the calculated data and experimental data, respectively.

Figure 4.
Comparison of experimental heat transfer capacity versus calculated heat transfer capacity.
As shown in Figure 4, the Qpr exhibits a slight increase as the inlet temperature rises. However, the Qex shows a decreasing trend with the increase in inlet temperature. Nevertheless, the error between them falls within a reasonable range, with the maximum error being 11.69%, the minimum error being 0.76%, and an average error of 4.65%. This error mainly stems from manufacturing tolerances, instrument measurement deviations, and unavoidable experimental errors. In practical engineering applications, an error within 15% is considered acceptable, so this error level is reasonable. In addition, the mass of the PFP was measured using the weighing module of SolidWorks software [30], and the actual mass was 41.9 kg, which is consistent with the calculated result. Therefore, the established precooler performance prediction model can be considered feasible and reliable and can be used for subsequent studies on performance impacts and their degrees.
3. Configuration Parameter Effect Analysis
The configuration parameter effect analysis is intended to systematically guide the multi-objective optimal design of heat exchangers. Firstly, its core purpose is to clarify the influencing laws of parameters on heat transfer performance and equipment lightweighting, thereby providing a basis for achieving the economic trade-off between these two objectives. On this basis, it further aims to reveal the intrinsic heat transfer mechanism: specifically, by analyzing the evolution laws of key parameters such as total heat transfer area and mass velocity, it elucidates the regulation mechanism of geometric parameters on heat transfer performance. Ultimately, this analysis lays a solid theoretical foundation for subsequent experimental design.
Drawing on the PFP’s performance prediction model, this study adopts the control variable method to investigate four key structural parameters sensitive to performance: hot stream flow length (L1), cold stream flow length (L2), hot side number of layers (N1), and hot side fin pitch (Sfh). Specifically, by continuously adjusting a single structural parameter while keeping the remaining parameters constant, the variation trends of Qpr and mass (Mz) with this parameter are observed, so as to further analyze the influence laws of each structural parameter on the Qpr and Mz of the PFP.
3.1. Effects of L1
As illustrated in Figure 5a, a positive correlation is observed between L1 and Qpr: an increase in L1 from 0.421 m to 0.621 m is accompanied by a growth in Qpr from 527.01 kW to 563.98 kW; meanwhile, the Mz of the PFP increases from 37.09 kg to 46.73 kg. The increases in both Qpr and Mz are influenced by the following factors: (1) The increase in L1 brings about a rise in the contact area for heat exchange between cold and hot fluids per unit time, thus causing a growth in heat transfer surface area. (2) The enhancement of Qpr is driven by the increased practical contribution of the effective heat transfer area, a consequence of the reduced temperature gradient within the fins as L1 increases. (3) The increase in L1 causes an increase in the consumption of hot side fins and separators, which corresponds to an increase in material consumption and thus an increase in the PFP’s Mz.
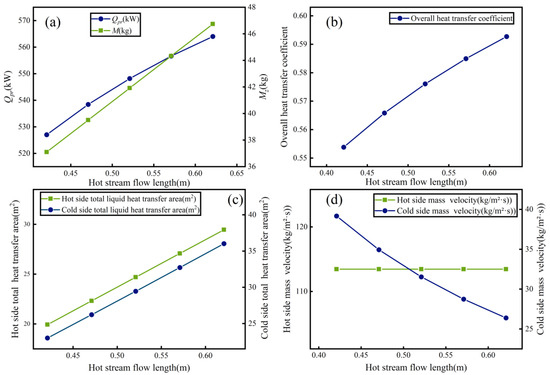
Figure 5.
Influence of L1 on performance: (a) Effect of L1 on Qpr and Mz; (b) Effect of L1 on the overall heat transfer coefficient; (c) Effect of L1 on the total heat transfer area; (d) Effect of L1 on mass velocity.
According to Figure 5b, the overall heat transfer coefficient rises from 0.55 to 0.59 over the range of L1 from 0.421 m to 0.621 m. This trend is attributed to improved flow development, resulting in a higher convective heat transfer coefficient.
Figure 5c illustrates that increases in L1 from 0.421 m to 0.621 m are correlated with a considerable expansion of the total heat transfer area, which rises from 19.94 m2 to 29.46 m2 on the hot side and from 23 m2 to 36.02 m2 on the cold side. This trend occurs owing to the extended flow length and its direct structural relation with the heat transfer area, causing both the hot and cold side areas to increase.
Figure 5d illustrates that, as L1 increases from 0.421 m to 0.621 m, the hot side mass velocity remains stable at 113.45 kg/m2·s. In contrast, the cold side mass velocity declines from 39.17 kg/m2·s to 26.38 kg/m2·s. This difference is attributed to the constant flow cross-sectional area on the hot side against an increased one on the cold side, while the mass flow rates remain unchanged for both streams.
3.2. Effects of L2
According to Figure 6a, increasing L2 from 0.188 m to 0.268 m drives an increase in both Qpr from 521.65 kW to 568.30 kW and Mz from 35.27 kg to 48.55 kg. The increases in both Qpr and Mz are influenced by the following factors: (1) The positive correlation between L2 and Qpr is attributed to an increase in the cold side effective heat transfer area resulting from the addition of fins and separators. (2) The cold and hot fluids achieve sufficient heat exchange, with their increased contact time further boosting Qpr. (3) The overall mass Mz of the PFP increases with L2 due to the additional material required for the cold side fins and separators.
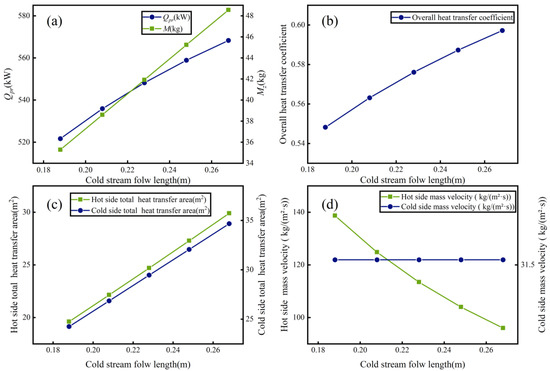
Figure 6.
Influence of L2 on performance: (a) Effect of L2 on Qpr and Mz; (b) Effect of L2 on the overall heat transfer coefficient; (c) Effect of L2 on the total heat transfer area; (d) Effect of L2 on mass velocity.
As illustrated in Figure 6b, increasing L2 from 0.188 m to 0.268 m drives the overall heat transfer coefficient higher, from an initial value of 0.55 to 0.6. This enhancement is attributed to an optimized flow regime on the cold side, which significantly increases the convective heat transfer coefficient.
According to Figure 6c, the total heat transfer area increases on both the hot side from 19.60 m2 to 29.89 m2 and the cold side from 24.25 m2 to 34.66 m2 as L2 rises from 0.188 m to 0.268 m. This is because the effective heat transfer length on the cold side expands with L2, while the hot side area is concurrently adjusted to maintain thermal balance across the exchanger.
As L2 increases from 0.188 m to 0.268 m in Figure 6d, the hot side mass velocity exhibits a downward trend from 138.66 kg/m2·s to 95.99 kg/m2·s, while the cold side mass velocity remains constant at 31.53 kg/m2·s. This behavior results from the expansion of the hot side flow cross-section, whereas the cold side cross-sectional area remains constant, under constant mass flow rate conditions for both sides.
3.3. Effects of N1
As shown in Figure 7a, when N1 increases from 27 layers to 31 layers, Qpr increases from 543.08 kW to 552.80 kW, and Mz increases from 39.12 kg to 44.7 kg. The factors influencing Qpr and Mz are as follows: (1) The increase in N1 directly determines the number of effective heat exchange units, and more layers translate to an increase in the hot side heat transfer area. (2) The increase in N1 enhances the distribution efficiency of hot fluid on the hot side, minimizing heat exchange waste arising from insufficient flow in local flow channels. (3) The limitation of the total heat transfer area by the hot side is overcome by enhancing N1. The enhancement significantly increases the hot side area, which in turn brings the hot side Qpr into alignment with the cold-side value. (4) The increase in N1 results in more hot side fins and separators, which in turn raises the Mz of the PFP.

Figure 7.
Influence of N1 on performance: (a) Effect of N1 on Qpr and Mz; (b) Effect of N1 on the overall heat transfer coefficient; (c) Effect of N1 on the total heat transfer area; (d) Effect of N1 on mass velocity.
As evidenced by Figure 7b, an elevation of N1 from 27 to 31 layers was accompanied by an enhancement in the overall heat transfer coefficient, which increased from 0.57 to 0.58. This enhancement is attributed to the increased effective heat transfer area and the intensified flow disturbance, which collectively elevate the convective heat transfer coefficient.
As presented in Figure 7c, when N1 goes up from 27 layers to 31 layers, the hot side total heat transfer area rises from 22.75 m2 to 26.66 m2, and the cold side total heat transfer area goes up from 27.22 m2 to 31.71 m2. The increase in the number of layers directly results in a corresponding increase in the total heat transfer area for both fluid sides.
An increase in N1 from 27 to 31 layers results in a reduction of the hot side mass velocity from 121.85 to 106.13 kg/m2·s. A concurrent decrease is observed on the cold side, falling from 33.78 to 29.56 kg/m2·s, in Figure 7d. As the N1 increases, the flow cross-sectional area expands on both the hot and cold sides, leading to reduced mass velocities under constant mass flow rates.
3.4. Effects of Sfh
As shown in Figure 8a, when the Sfh increases from 0.001 m to 0.005 m, the Qpr decreases from 581.08 kW to 524.32 kW, and the Mz decreases from 53.25 kg to 39.64 kg. Moreover, when the Sfh increases from 0.001 m to 0.002 m, the Mz decreases significantly. The factors influencing the Qpr and Mz are as follows: (1) The effective heat transfer area is reduced because a larger Sfh decreases the proportion of fin surface area to the total area. (2) The overall heat transfer coefficient drops due to the diminished fluid disturbance effect associated with an increase in Sfh. (3) The total mass Mz of the PFP decreases as less fin material is consumed with a higher Sfh.

Figure 8.
Influence of Sfh on performance: (a) Effect of Sfh on Qpr and Mz; (b) Effect of Sfh on the overall heat transfer coefficient; (c) Effect of Sfh on the total heat transfer area; (d) Effect of Sfh on mass velocity.
The overall heat transfer coefficient exhibits an inverse dependence on Sfh, declining from 0.61 to 0.55 as the latter parameter increases from 0.001 m to 0.005 m, according to Figure 8b. The reduction is attributed to the decreased effective heat transfer area and the concomitant weakening of convective heat transfer.
Figure 8c highlights a substantial contraction of the hot side total heat transfer area from 48.25 m2 to 18.58 m2 with increasing Sfh. The period of the steepest reduction is between Sfh is 0.001 m and 0.002 m. Concurrently, the cold side area maintains a constant value of 29.46 m2. The contraction is attributed to the reduced effective area on the hot side as Sfh increases; conversely, the constant cold side fin pitch leaves its total area unaffected.
An increase in Sfh from 0.001 m to 0.005 m corresponds to a drop in the hot side mass velocity from 163.47 to 107.14 kg/m2·s, as seen in Figure 8d. Specifically, the initial increment in Sfh to 0.002 m causes the most significant decrease. The cold side mass velocity, however, remains stable at 31.53 kg/m2·s. The hot side mass velocity decreases due to the increased flow cross-sectional area under a constant mass flow rate; in contrast, the cold side mass velocity remains constant because its flow area is unchanged.
4. Configuration Optimization
4.1. MOGWO Optimization Method
As can be seen from the aforementioned parameter study, L1, L2, N1, and Sfh exert significant impacts on the Qpr and Mz. The four configuration parameters are adjusted to simultaneously maximize heat transfer capacity Qpr and minimize Mz. As shown in Formula (15), it is the value range of four parameters. Accordingly, the optimization problem addressed here can be defined as multi-objective in nature.
The MOGWO was selected for this study due to its distinct advantages in addressing multi-objective optimization problems of the plate fin precooler. Compared to conventional algorithms such as MOGA, NSGA-II, and MOPSO listed in Table 1, MOGWO achieves a better balance between global exploration and local exploitation by simulating the social hierarchy and hunting behavior of grey wolves, thereby effectively avoiding convergence to local optima. Moreover, MOGWO exhibits lower sensitivity to parameter settings, stronger robustness, and faster convergence speed. It efficiently obtains a well-distributed Pareto-optimal solution set under limited computational resources, thereby providing high-quality configuration schemes for precooler design.
A Pareto optimal front of non-dominated solutions was obtained by conducting a multi-objective optimization on the PFP’s Qpr and Mz using the MOGWO algorithm. This front provides a rich selection space of optimization schemes for engineering decision-makers, who can screen out satisfactory structural parameter configuration schemes from it according to the priority requirements for Qpr and Mz in practical application scenarios [31,32]. The algorithm is implemented via Matlab programming, and the multi-objective optimization methodology is implemented by applying the MOGWO algorithm according to the following steps.
- 1.
- Select the highly influential design parameters L1, L2, N1, and Sfh as decision variables.
- 2.
- Set the parameters of the MOGWO algorithm.
- 3.
- The specific steps to use the MOGWO are as follows:
- (i)
- Initialize the grey wolf population and algorithm operating parameters;
- (ii)
- Perform non-dominated sorting on the initial grey wolf population and establish the Archive population;
- (iii)
- Update the algorithm parameters a, A, and C;
- (iv)
- Select the leading wolves α, β, and γ from the Archive population;
- (v)
- All grey wolves’ positions in the population are updated based on the GWO algorithm’s position update formula;
- (vi)
- Calculate the fitness of each updated grey wolf individual, perform non-dominated sorting again, and update the Archive population;
- (vii)
- Determine if the algorithm has reached the maximum number of cycles.
- 4.
- Output the solution set of the Pareto frontier.
Figure 9 shows the flow chart of MOGWO.
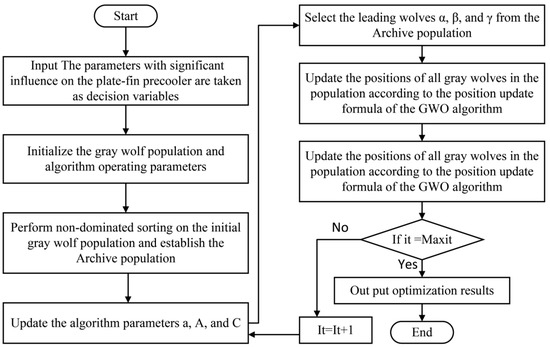
Figure 9.
The flowchart of MOGWO.
4.2. Optimization Results
Given that the output results of multi-objective optimization algorithms tend to exhibit variability across different iterations, the MOGWO was executed repeatedly in this study until a stable Pareto front was obtained. It is worth noting that a Pareto front refers to a solution set where all non-dominated solutions are distributed. To guarantee the effectiveness and stability of the optimization process, the key parameters for MOGWO were configured as follows: both the maximum number of iterations and the population size were set to 100. After the iterative optimization runs under this parameter setting were completed, a set of Pareto optimal solutions was finally acquired, and the distribution of these optimal points was visually presented in Figure 10.

Figure 10.
Pareto optimal points.
When the Qpr increases, the Mz decreases; when the Qpr decreases, the Mz increases. To select the optimal point, the values of −Qpr and Mz should be lower than those of the original point, which means better overall performance can be achieved. Furthermore, three Pareto optimal solutions have been determined, which are provided in Table 6 and Figure 10. The selection of the optimal solution is grounded on the following criteria:
Table 6.
Performance comparison of optimized PFP.
- At Point A, a marked reduction in −Qpr contrasts with a modest decrease in Mz relative to the original point.
- At Point C, −Qpr is slightly smaller than that of the original point, whereas Mz is significantly smaller than that of the original point.
- Point B is selected between Point A and Point C, and it is a relatively intermediate point.
In Table 6, it can be concluded that, compared with the Qpr value at the original point, the Qpr values at Points A, B, and C have increased by 5.5%, 2.85%, and 0.5%, respectively, while their Mz values have decreased by 1.26%, 11.62%, and 19.21%, respectively. Obviously, for the optimal configuration schemes, Qpr has increased by an average of 2.95%, and Mz has decreased by an average of 10.7%. Thus, this demonstrates that the MOGWO-based optimization method is feasible and effective and can offer valid solutions to enhance the comprehensive performance of PFPs.
As shown in Table 7, the structural parameters of the original point are specified as follows: L1 of 0.521 m, L2 of 0.228 m, N1 of 29, and Sfh of 0.003 m. For Point A, the structural parameters are an L1 of 0.621 m, an L2 of 0.241 m, an N1 of 27, and an Sfh of 0.001 m.
Table 7.
Comparison of original structure and optimal structure.
Compared with the original point, Point A achieves an increased heat transfer capacity alongside a slight reduction in mass. This phenomenon is attributed to the following mechanisms: on one hand, the increases in L1 and L2, coupled with the decrease in Sfh, bring about enhancements in both the effective heat transfer area and the overall heat transfer coefficient. These positive effects are sufficient to offset the adverse impact caused by the reduction in N1, thereby resulting in a higher heat transfer capacity. On the other hand, the reduction in N1, which reduces the material consumption associated with hot-side layers, counteracts the increased material usage induced by the elongations of L1 and L2, as well as the densification of hot-side fins. As a result, only a slight mass reduction is observed for Point A.
The structural parameters of Point B are an L1 of 0.559 m, an L2 of 0.228 m, an N1 of 27, and an Sfh of 0.001 m. Compared with the original point, Point B exhibits a minor increase in heat transfer capacity and a slight reduction in mass. This is because only the increase in L1 and the decrease in Sfh contribute to heat transfer enhancement, while L2 remains unchanged. Consequently, the increases in both effective heat transfer area and overall heat transfer coefficient are weaker than those at Point A, failing to achieve a significant improvement in heat transfer. For mass variation, the mass reduction caused by the decrease in N1 is offset by the mass increase induced by the elongation of L1. Thus, only a slight reduction in mass is realized for Point B.
The structural parameters of Point C are specified as follows: an L1 of 0.544 m, an L2 of 0.210 m, an N1 of 27, and an Sfh of 0.001 m. Compared with the original point, Point C shows a minor increase in heat transfer capacity while achieving a significant reduction in mass. This phenomenon can be explained by two key mechanisms: regarding heat transfer, the decrease in L2 not only reduces the cold-side heat transfer area but also impairs the cold-side heat transfer efficiency. These combined effects restrict the enhancement of overall heat transfer performance, resulting in a limited increase in heat transfer capacity. For mass variation, the decrease in L2 directly reduces the material consumption associated with the cold side, and the concurrent decrease in N1 further contributes to material saving. Together, these two factors lead to a significant overall reduction in mass for Point C.
4.3. Algorithm Comparison
As shown in Figure 11, when the population sizes of MOGWO and NSGA-II are both set to 20 and the number of iterations is set to 50, almost all Pareto points obtained by MOGWO are superior to those obtained by NSGA-II. Thus, the Pareto points generated by MOGWO are superior to those of NSGA-II in both convergence and distribution, which indicates that MOGWO has better overall optimization performance.

Figure 11.
Pareto optimal points obtained by NSGA II and MOGWO.
5. Conclusion and Prospect
5.1. Conclusion
This study takes the PFP as the research object. Using the ε-NTU method, a prediction model for the PFP is developed, and the reliability of this model is validated. By conducting parameter analysis with the prediction model, the parameters L1, L2, N1, and Sfh that exhibit relative sensitivity to heat transfer capacity and mass are identified, and the effects they exert on heat transfer capacity and mass are examined. Furthermore, these parameters are optimized based on the MOGWO algorithm to reduce mass while ensuring improved heat transfer capacity. On the basis of the above analysis, the key conclusions are as follows:
- (1)
- Validation of the PFP model confirms its accuracy. The error in Qpr predictions is low, with a maximum of 11.69%, a minimum of 0.76%, and a mean of 4.65% compared to Qex. The Mz weighing result is 41.9 kg, which is consistent with the predicted result, proving the model’s reliability.
- (2)
- The parameter influence analysis results indicate that Qpr and Mz exhibit distinct correlative trends with the variation of key parameters. Specifically, as L1 increases from 0.421 m to 0.621 m, Qpr rises from 527.01 kW to 563.98 kW, while Mz simultaneously increases from 37.09 kg to 46.73 kg. When L2 is elevated from 0.188 m to 0.268 m, Qpr correspondingly increases from 521.65 kW to 568.30 kW, and Mz shows a significant increase from 35.27 kg to 48.55 kg. As for N1, with an increase from 27 layers to 31 layers, Qpr presents a slight upward trend, rising from 543.08 kW to 552.80 kW, and Mz also increases accordingly from 39.12 kg to 44.7 kg. In contrast, when Sfh increases from 0.001 m to 0.005 m, both Qpr and Mz exhibit a decreasing trend, declining from 581.08 kW to 524.32 kW and from 53.25 kg to 39.64 kg, respectively. In summary, the increase in L1, L2, and N1 can promote the elevation of Qpr and Mz, whereas the increase in Sfh exerts an inhibitory effect on both parameters.
- (3)
- The optimal configurations obtained via the MOGWO algorithm achieve a significant performance improvement: compared to the original design, Qpr increases by an average of 2.95%, while Mz decreases by an average of 10.7%. This validates the reasonableness of the configuration optimization and provides a solid basis for the design of PFP systems.
5.2. Prospect
This study focuses on the optimal design of the plate fin precooler with respect to its mass and heat transfer capacity, achieving a synergistic balance between mass reduction and efficient improvement of heat transfer capacity. Future work can further explore its application potential in typical engineering scenarios such as industrial waste heat recovery and thermal management systems of new energy vehicles, so as to further expand the application boundaries of the plate fin precooler and enhance its engineering practical value in the field of thermal management.
Author Contributions
Conceptualization, C.Z.; methodology, Z.X. and X.N.; software, C.Z. and P.J.; validation, C.Z. and X.N.; formal analysis, C.Z.; investigation, C.Z.; resources, Z.X.; data curation, C.Z.; Writing—original draft, C.Z.; Writing—review & editing, Z.X., X.N. and M.W.; visualization, C.Z.; supervision, Z.X., X.N. and M.W.; project administration, Z.X. and X.N.; funding acquisition, Z.X. All authors have read and agreed to the published version of the manuscript.
Funding
This work was supported by the Scientific and Technological Project of Henan Province [grant number 232102220037]; the Natural Science Foundation of Henan [grant number 242300420325]; and Key Research Project of Higher Education Institutions in Henan Province [grant number 26B460011].
Data Availability Statement
The original contributions presented in this study are included in the article. Further inquiries can be directed to the corresponding authors.
Acknowledgments
The authors acknowledge the support provided by Henan Institute of Science and Technology, Chongqing University of Posts and Telecommunications, and the Key Laboratory of “High-performance Design and Reliability Evaluation for Mechanical Systems” in Xinxiang City.
Conflicts of Interest
The authors declare that there are no conflicts of interest.
Nomenclature
| ε | effectiveness | A2 | PFP surface area of hot side (m2) |
| C * | ratio between Cmin and Cmax | AHT | PFP surface area (m2) |
| Cmax | maximum of Ch and Cc (W/K) | m | mass flow rate (kg/(m2·s)) |
| Cmin | minimum of Ch and Cc (W/K) | T | temperature (K) |
| NTU | number of transfer units | Q | heat duty (kW) |
| Atot | free flow area (m2) | Mz | total mass (kg) |
| U | overall heat transfer coefficient (W/m2·K) | Mg | plate total mass (kg) |
| h | convection heat transfer coefficient (W/m2·K) | Mf | seal strip total mass (kg) |
| j | Colburn factor | Mc | fin total mass (kg) |
| Gm | mass flux (kg/m2·s) | Mq | other total mass (kg) |
| Cp | specific heat capacity (J/(kg·K)) | To | inlet temperature of hot side air (K) |
| Pr | Prandtl number | To′ | outlet temperature of hot side air (K) |
| Sf | fin pitch (m) | ρ | density (kg/m3) |
| L1 | hot stream flow length (m) | qo | flow rate of hot side air (kg/(m2·s)) |
| L2 | cold stream flow length (m) | daca | calculation data |
| L3 | height of the PFP (m) | daex | experimental data |
| Aff | free flow area (m2) | Qex | experimental heat exchange capacity (kW) |
| H | height of fin (m) | Qpr | predicted heat exchange capacity (kW) |
| N | fin layers | Subscripts | |
| n | fin frequency | c | cold |
| A1 | PFP surface area of cold side (m2) | h | hot |
References
- Liang, T.; Ye, W.; Song, J.; Zhang, D.; Xu, W. Numerical investigation on the heat transfer and pressure loss characteristics of precooler under negative pressure. Appl. Therm. Eng. 2025, 259, 124894. [Google Scholar] [CrossRef]
- Liang, T.; Xu, W.; Ye, W.; Li, Z.; Zhang, Z.; Zhang, S. Study on the heat transfer characteristics of a plate-fin-typed precooler considering cooling fluid phase change. Case Stud. Therm. Eng. 2023, 47, 103073. [Google Scholar] [CrossRef]
- Liang, T.; Xu, W.; Ye, W.; Zhang, Z.; Li, Z. Numerical investigation of heat transfer and pressure drop characteristics on the hot fluid side of the plate-fin precooler under negative pressure conditions. Int. Commun. Heat Mass Transf. 2023, 148, 107005. [Google Scholar] [CrossRef]
- Liang, T.; Wang, Y.; Xu, W.; Li, Z.; Zhang, S.; Ye, W.; Zhang, D. Performance of an additive-manufactured precooler under high-temperature and negative pressure environment. Int. J. Heat Fluid Flow 2024, 109, 109553. [Google Scholar] [CrossRef]
- Taler, D.; Taler, J.; Wrona, K. New analytical-numerical method for modelling of tube cross-flow heat exchangers with complex flow systems. Energy 2021, 228, 13. [Google Scholar] [CrossRef]
- Yang, H.Z.; Wen, J.; Gu, X.; Liu, Y.C.; Wang, S.M.; Cai, W.J.; Li, Y.Z. A mathematical model for flow maldistribution study in a parallel plate-fin heat exchanger. Appl. Therm. Eng. 2017, 121, 462–472. [Google Scholar] [CrossRef]
- Liu, Y.C.; Li, K.; Wen, J.; Wang, S.M. Thermodynamic characteristics of counter flow and cross flow plate fin heat exchanger based on distributed parameter model. Appl. Therm. Eng. 2023, 219, 119542. [Google Scholar] [CrossRef]
- Liu, J.; Ai, M. Structural optimization design and heat transfer characteristics of air-to-air cooled high voltage motor heat exchanger. Case Stud. Therm. Eng. 2022, 40, 102532. [Google Scholar] [CrossRef]
- Hu, W.; Jia, P.; Nie, J.; Gao, Y.; Zhang, Q. A Fast Prediction Model for Heat Transfer of Hot-Wall Heat Exchanger Based on Analytical Solution. Appl. Sci. 2018, 9, 72. [Google Scholar] [CrossRef]
- Anibal, J.L.; Martins, J.R.R.A. Adjoint-based shape optimization of a plate-fin heat exchanger using CFD. Appl. Therm. Eng. 2024, 252, 123570. [Google Scholar] [CrossRef]
- Gupta, P.K.; Sharma, R.K.; Raghavendra, S. Design optimization study of cryogenic counter-flow plate fin heat exchangers. Cryogenics 2025, 148, 104063. [Google Scholar] [CrossRef]
- Ye, W.; Yan, Y.; Liu, Y.; Ye, W.; Liu, Y. Effect of plate-fin heat exchanger structural parameters on the performance of a cascade refrigeration system. Case Stud. Therm. Eng. 2024, 61, 104998. [Google Scholar] [CrossRef]
- Kedam, N.; Dmitry, A.U.; Evgeniy, V.B.; Alexey, A.G. Heat transfer factor j and friction factor f correlations for offset strip fin and wavy fin of compact plate-fin heat-exchangers. Case Stud. Therm. Eng. 2021, 28, 101552. [Google Scholar] [CrossRef]
- Nagarajan, V.; Chen, Y.; Wang, Q.; Ma, T. Hydraulic and thermal performances of a novel configuration of high temperature ceramic plate-fin heat exchanger. Appl. Energy 2014, 113, 589–602. [Google Scholar] [CrossRef]
- Song, K.; Xi, Z.; Su, M.; Wang, L.; Wu, X.; Wang, L. Effect of geometric size of curved delta winglet vortex generators and tube pitch on heat transfer characteristics of fin-tube heat exchanger. Exp. Therm. Fluid Sci. 2017, 82, 8–18. [Google Scholar] [CrossRef]
- Yicong, L.; Chunyu, S.; Wei, L.; Zhichun, L. Structural parameter design of welded plate heat exchanger based on multi-objective optimization algorithm. Int. Commun. Heat Mass Transf. 2023, 146, 106900. [Google Scholar] [CrossRef]
- Buyruk, E.; Karabulut, K. Research of Heat Transfer Augmentation in Plate Fin Heat. Exchangers Having Different Fin Types. J. Eng. Thermophys. 2020, 29, 316–330. [Google Scholar] [CrossRef]
- Jirandeh, R.R.; Ghazi, M.; Sotoodeh, A.F.; Nikian, M. Plate-fin heat exchanger network modeling, design and optimization—A novel and comprehensive algorithm. J. Eng. Des. Technol. 2021, 19, 1017–1043. [Google Scholar]
- Zarea, H.; Kashkooli, F.M.; Soltani, M.; Rezaeian, M. A novel single and multi-objective optimization approach based on Bees Algorithm Hybrid with Particle Swarm Optimization (BAHPSO): Application to thermal-economic design of plate fin heat exchangers. Int. J. Therm. Sci. 2018, 129, 552–564. [Google Scholar] [CrossRef]
- Mohapatra, S.; Das, D.K.; Singh, A.K. An optimal plate-fin heat exchanger design using opposition-based Orthogonal Learning Kho-Kho Optimization algorithm. Prog. Nucl. Energy 2024, 177, 105416. [Google Scholar] [CrossRef]
- Wen, J.; Yang, H.; Tong, X.; Li, K.; Wang, S.; Li, Y. Configuration parameters design and optimization for plate-fin heat exchangers with serrated fin by multi-objective genetic algorithm. Energy Conv. Manag. 2016, 117, 482–489. [Google Scholar] [CrossRef]
- Hajabdollahi, H. Multi-objective optimization of plate fin heat exchanger using constructal theory. Int. Commun. Heat Mass Transf. 2019, 108, 104283. [Google Scholar] [CrossRef]
- Li, S.C.; Deng, Z.X.; Liu, J.; Liu, D.F. Multi-Objective Optimization of Plate-Fin Heat Exchangers via Non-Dominated Sequencing Genetic Algorithm (NSGA-II). Appl. Sci. 2022, 12, 11719. [Google Scholar] [CrossRef]
- Li, K.; Wen, J.; Wang, S.; Li, Y. Multi-parameter optimization of serrated fins in plate-fin heat exchanger based on fluid-structure interaction. Appl. Therm. Eng. 2020, 176, 115357. [Google Scholar] [CrossRef]
- Guan, Y.; Wang, L.; Cui, H. Optimization Analysis of Thermodynamic Characteristics of Serrated Plate-Fin Heat Exchanger. Sensors 2023, 23, 4158. [Google Scholar] [CrossRef] [PubMed]
- Wang, T.; Song, K.; Ma, L.; Zhu, H.; Zhang, Z.; Gu, B.; Zhang, Q.; Wu, X. Multi-objective performance optimization of pillow plate heat exchanger by response surface methodology and NSGA-Ⅱ genetic algorithm. Case Stud. Therm. Eng. 2025, 74, 106765. [Google Scholar] [CrossRef]
- Sanaye, S.; Hajabdollahi, H. Thermal-economic multi-objective optimization of plate fin heat exchanger using genetic algorithm. Appl. Energy 2010, 87, 1893–1902. [Google Scholar] [CrossRef]
- Wang, Z.; Li, Y.Z. Irreversibility analysis for optimization design of plate fin heat exchangers using a multi-objective cuckoo search algorithm. Energy Conv. Manag. 2015, 101, 126–135. [Google Scholar] [CrossRef]
- Khan, T.A.; Li, W. Optimal design of plate-fin heat exchanger by combining multi-objective algorithms. Int. J. Heat Mass Transf. 2017, 108, 1560–1572. [Google Scholar] [CrossRef]
- Arora, A.; Pathak, A.; Juneja, A.; Shakkarwal, P.; Kumar, R.J.M.T.P. Design & analysis of progressive die using SOLIDWORKS. Mater. Today Proc. 2022, 51, 956–960. [Google Scholar]
- Makhadmeh, S.N.; Alomari, O.A.; Mirjalili, S.; Al-Betar, M.A.; Elnagar, A. Recent advances in multi-objective grey wolf optimizer, its versions and applications. Neural Comput. Appl. 2022, 34, 19723–19749. [Google Scholar] [CrossRef]
- Mirjalili, S.; Saremi, S.; Mirjalili, S.M.; Coelho, L.D. Multi-objective grey wolf optimizer: A novel algorithm for multi-criterion optimization. Expert Syst. Appl. 2016, 47, 106–119. [Google Scholar] [CrossRef]
Disclaimer/Publisher’s Note: The statements, opinions and data contained in all publications are solely those of the individual author(s) and contributor(s) and not of MDPI and/or the editor(s). MDPI and/or the editor(s) disclaim responsibility for any injury to people or property resulting from any ideas, methods, instructions or products referred to in the content. |
© 2025 by the authors. Licensee MDPI, Basel, Switzerland. This article is an open access article distributed under the terms and conditions of the Creative Commons Attribution (CC BY) license (https://creativecommons.org/licenses/by/4.0/).