A Prediction Method for the Surface Arc Inception Voltage of Epoxy Resin Based on an Electric Field Feature Set and GS-SVR
Abstract
1. Introduction
2. Methods
2.1. Definition of the Electric Field Feature Set
2.1.1. Electric Field Intensity Group
2.1.2. Electric Field Non-Uniformity Group
2.1.3. Electric Field Intensity Integral Group
2.1.4. Path Length Group
2.2. Sample Division Method Based on the Coefficient of Electric Field Non-Uniformity
- (1)
- The electric field non-uniformity coefficient is calculated for all electric field sample data along the shortest path. Based on the results, several intervals of the coefficient are defined. All samples are categorized into their respective intervals, and the number of samples in each interval is counted.
- (2)
- Based on the sample count in each interval, training samples are randomly selected in a proportional manner. During the selection process, samples are drawn as evenly as possible from each interval.
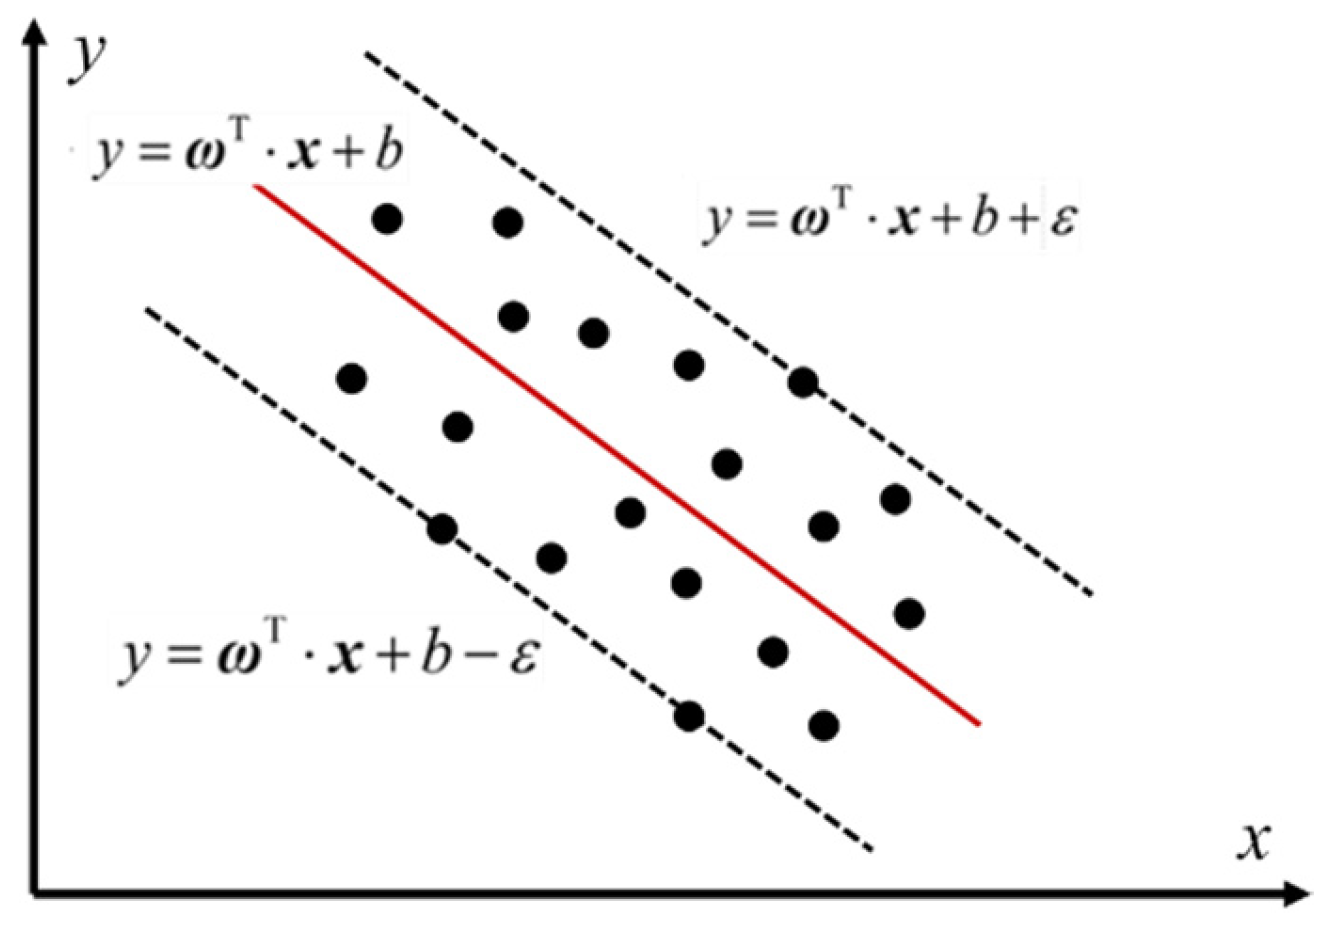
2.3. SVR Algorithm Based on GS Optimization
2.4. Error Analysis Method
- (1)
- RMSE: The influence of large errors is amplified through the squared term, making RMSE highly sensitive to outliers or significant deviations in the prediction results. This metric is particularly responsive to the distribution of prediction errors and is commonly employed to evaluate both the overall prediction accuracy and the stability of the model. The expression is given as follows:
- (2)
- MAPE: Prediction deviation is expressed in the form of relative error, which eliminates the influence of data dimension and facilitates comparison across datasets with different scales or magnitudes. It is particularly suitable for evaluating the average prediction accuracy of the model at an overall level. The expression is given as follows:
- (3)
- MSPE: A square operation is introduced based on MAPE, thereby assigning greater penalty weights to larger relative errors. This metric can effectively identify extreme relative errors in the model and is suitable for evaluating the uniformity and reliability of the prediction result distribution. The expression is given as follows:
2.5. Arc Inception Voltage Prediction Process
- (1)
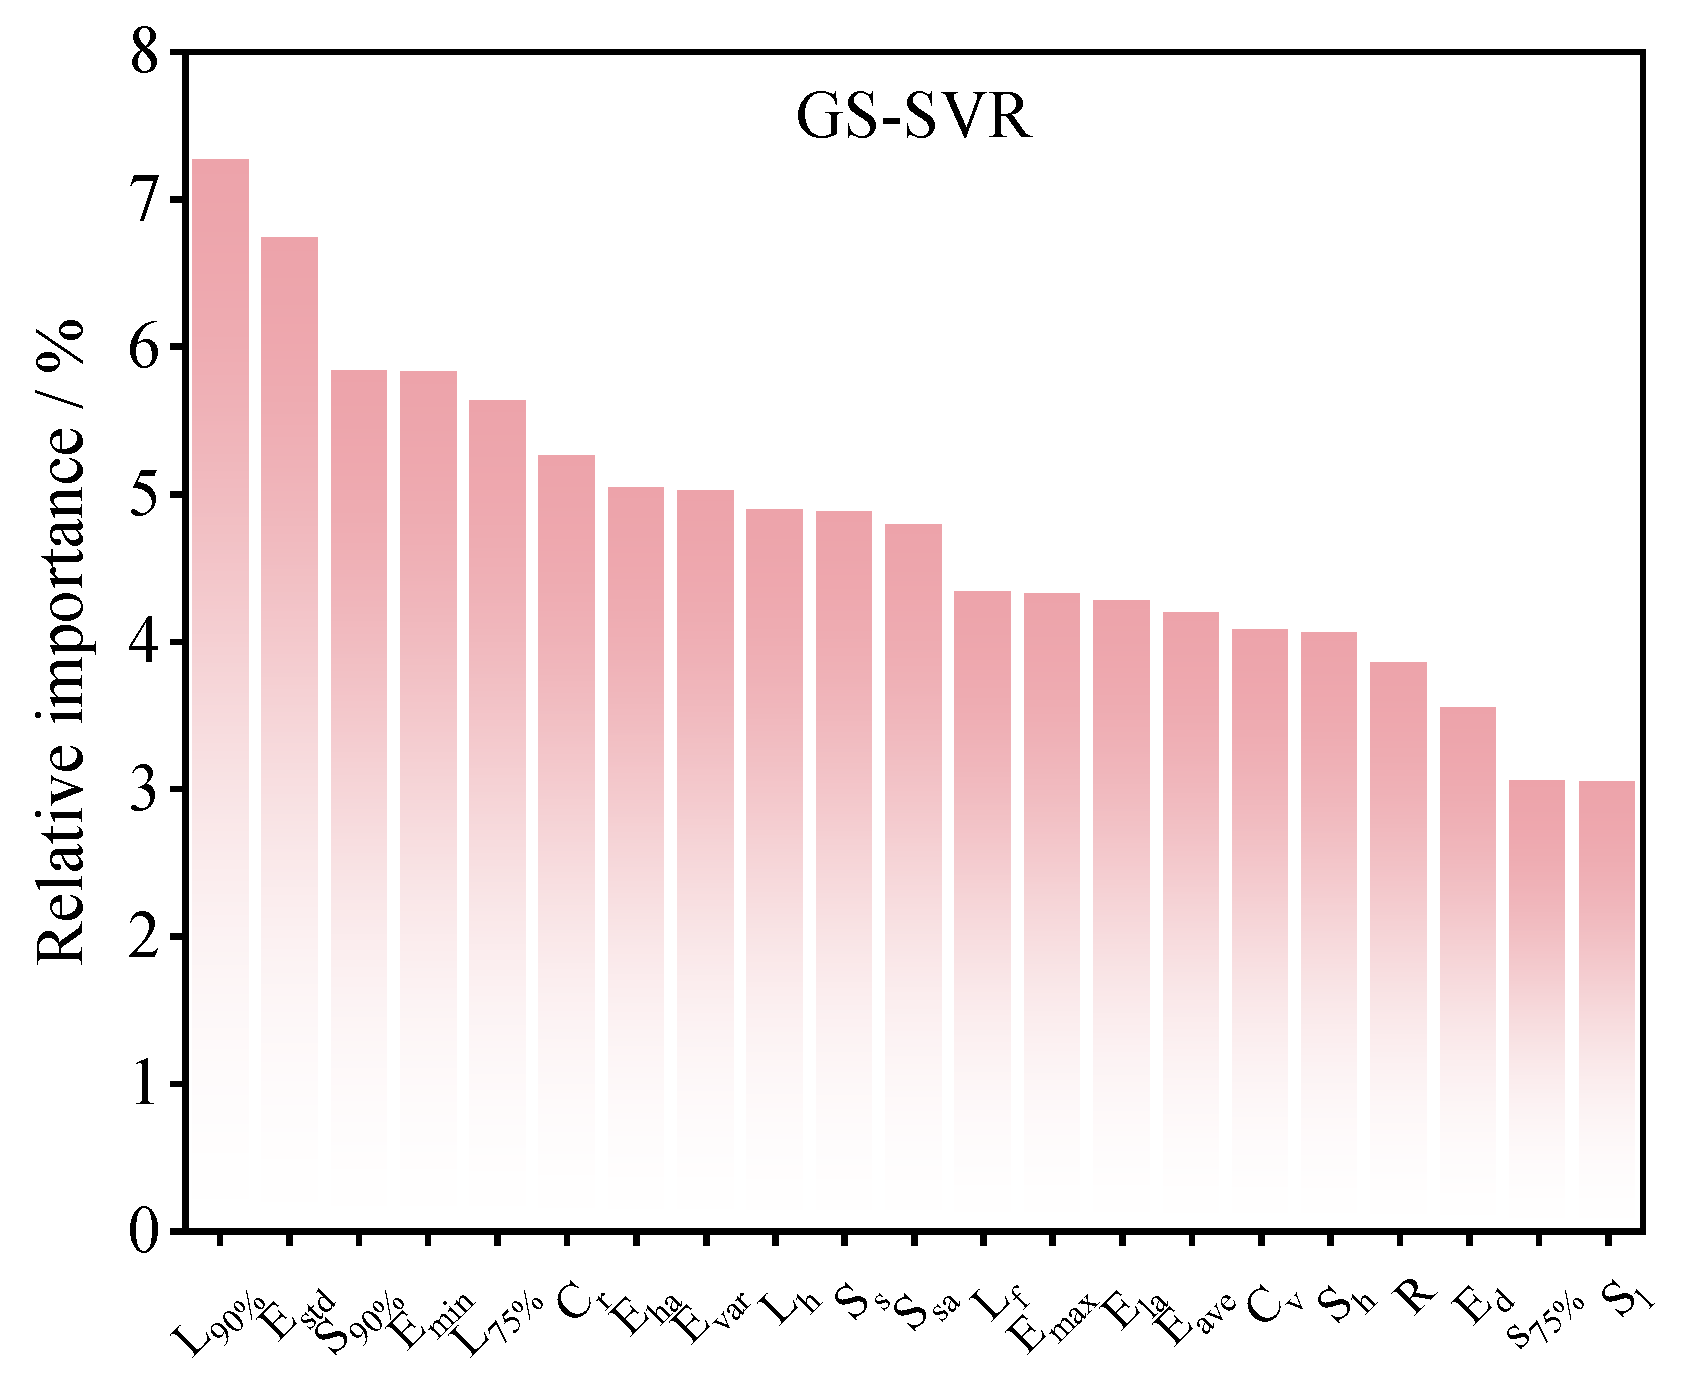
- Tests were conducted to measure original surface arc inception voltage samples under different environmental conditions. A simulation model of the electric field distribution for surface arc initiation was established based on experimental parameters. The electric field distribution data along the shortest path were obtained, and a 21-dimensional electric field feature set was defined and extracted to form the original feature dataset.
- (2)
- The original electric field feature set was max–min normalized. The dataset was then divided into training and testing sets using both random partitioning and the non-uniformity coefficient method.
- (3)
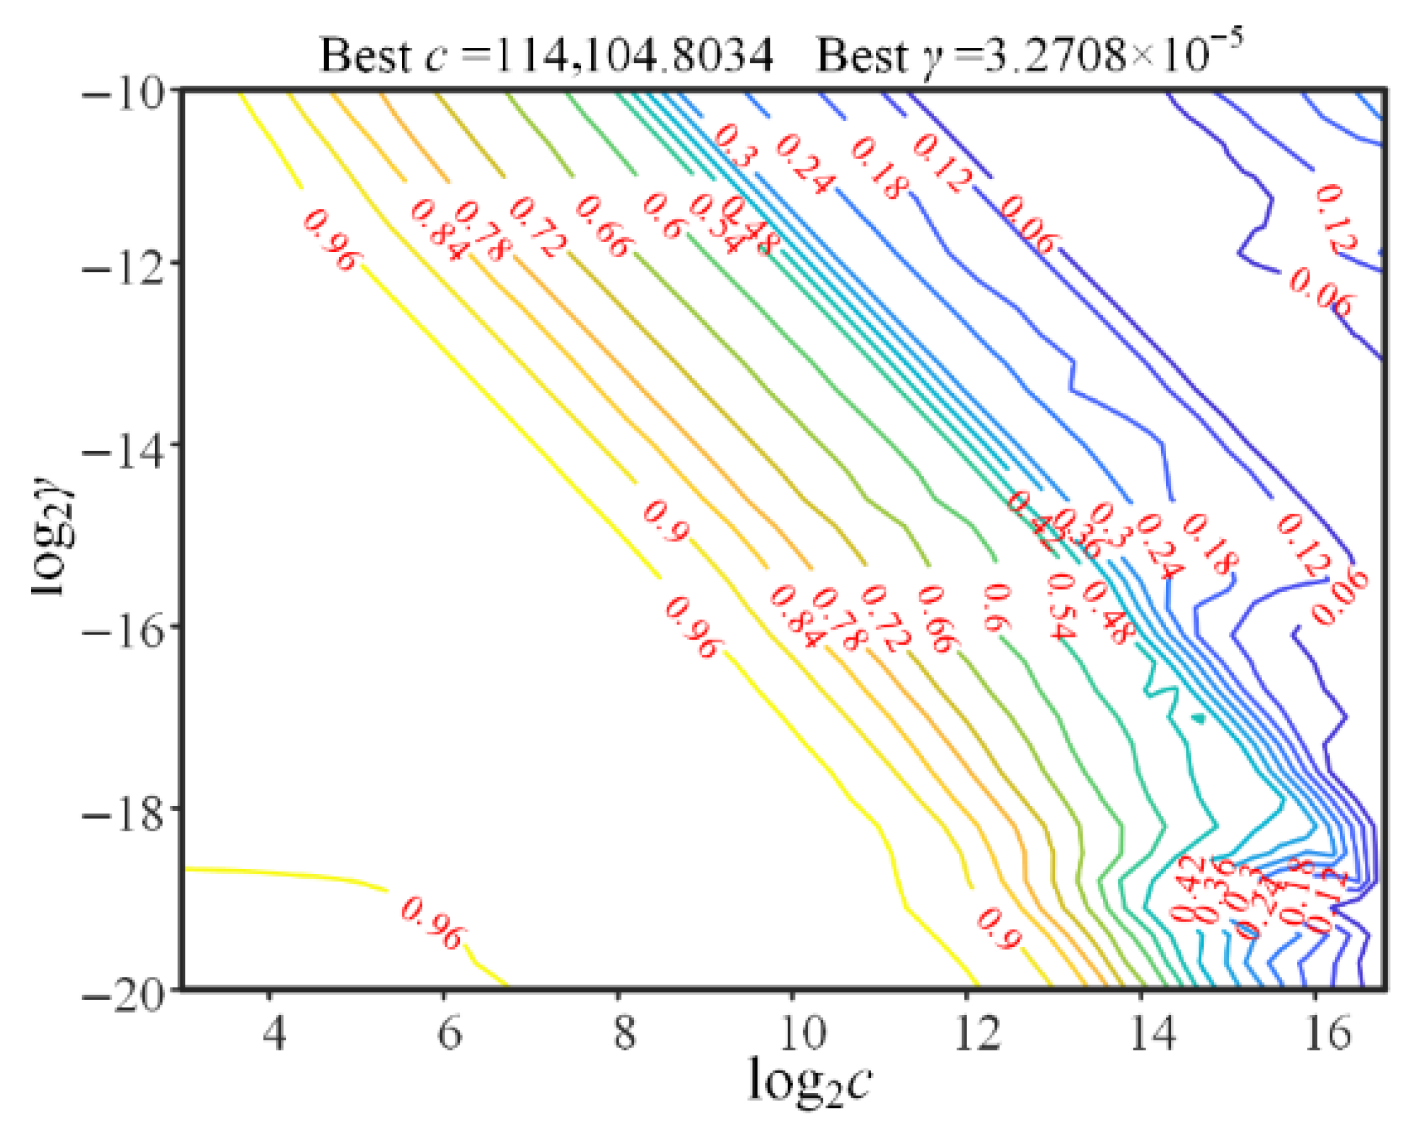
- Before model training, the grid search (GS) algorithm was applied to optimize the key hyperparameters (c,γ). The optimal hyperparameter combination was subsequently used in the GS-SVR prediction model for surface arc inception voltage.
- (4)
- The GS-SVR model was used to predict the arc inception voltage of the test samples. The predicted values were compared with experimental results, and error metrics were analyzed to evaluate prediction performance.
3. Experimental Verification
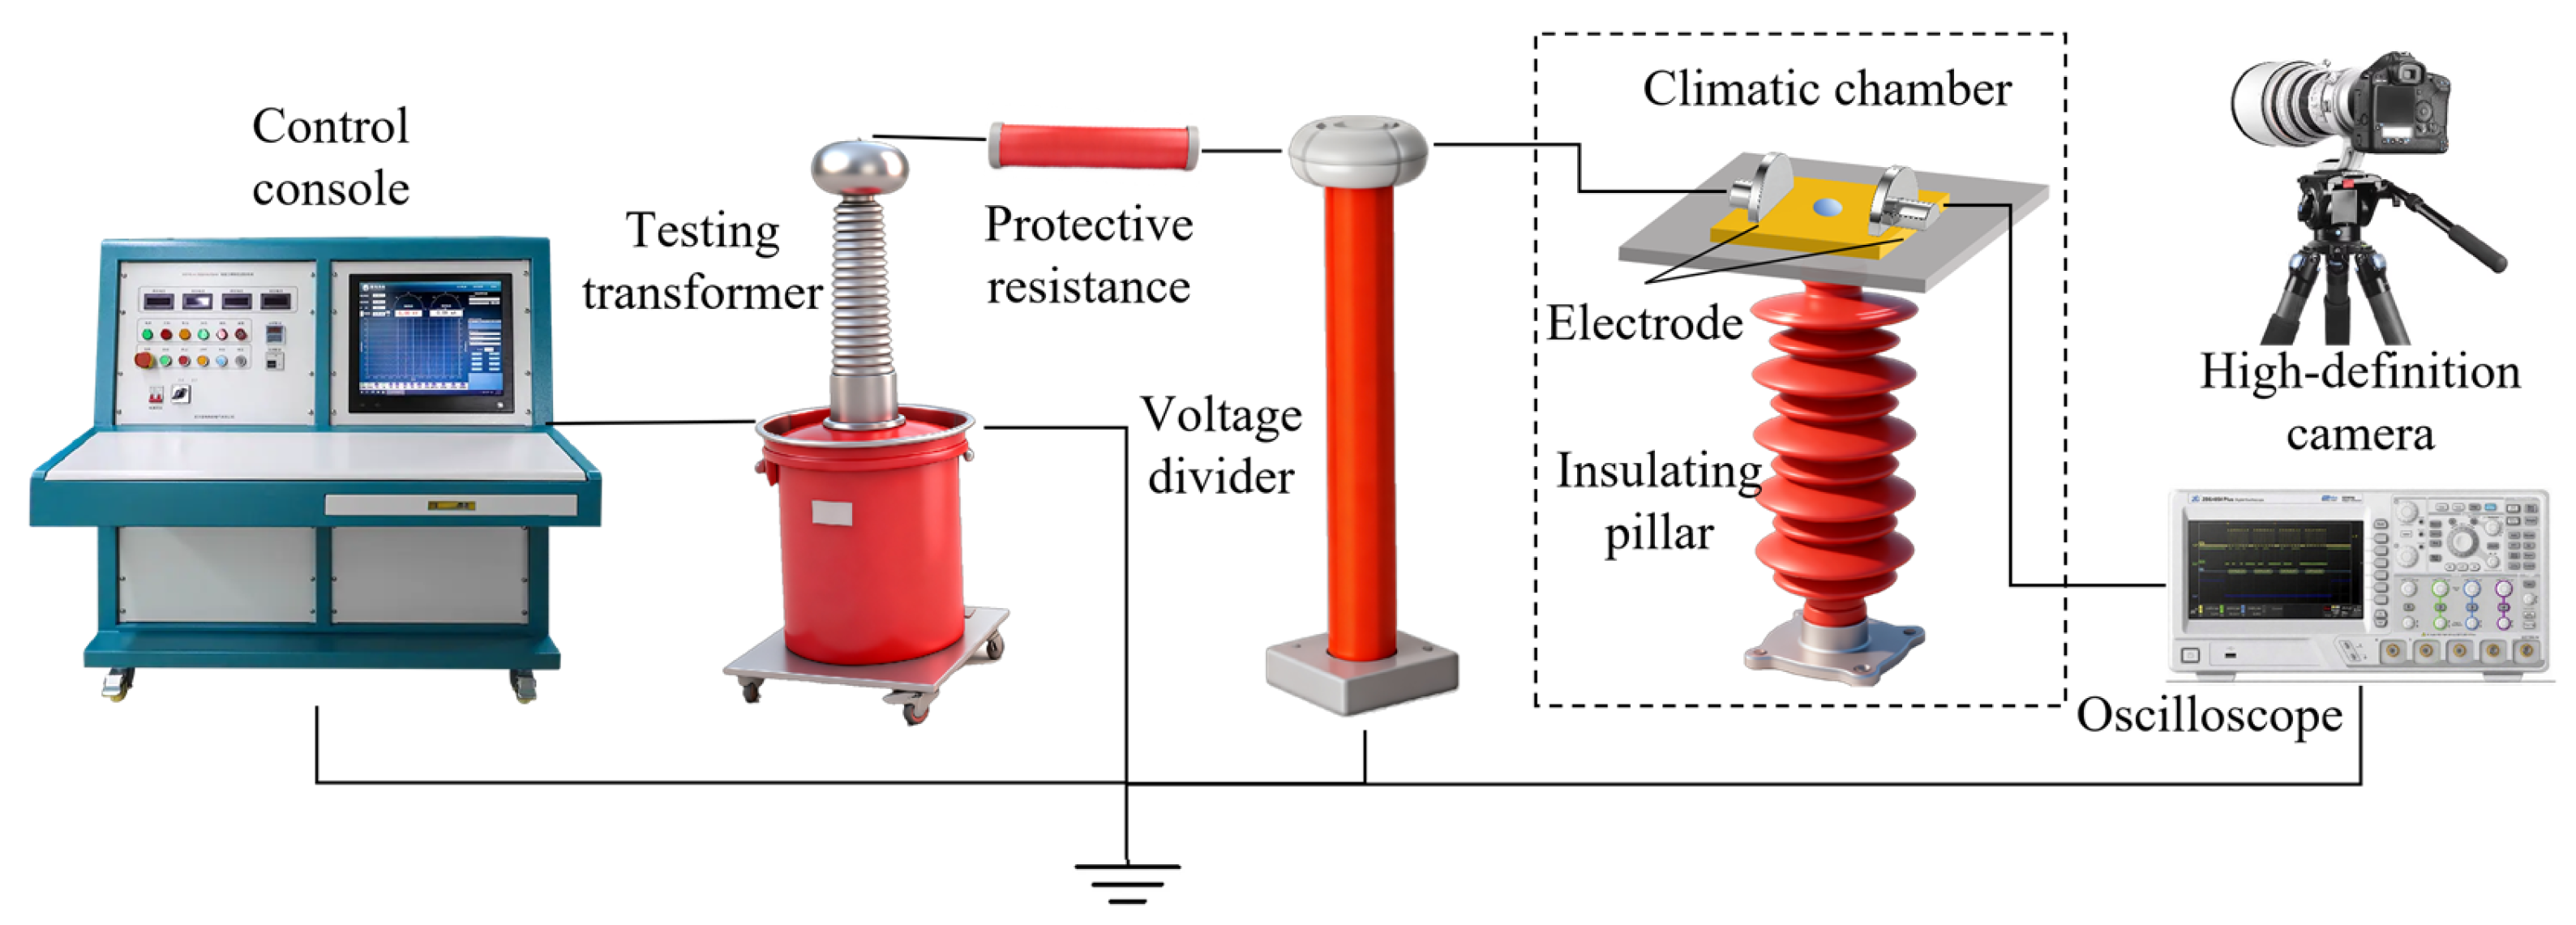
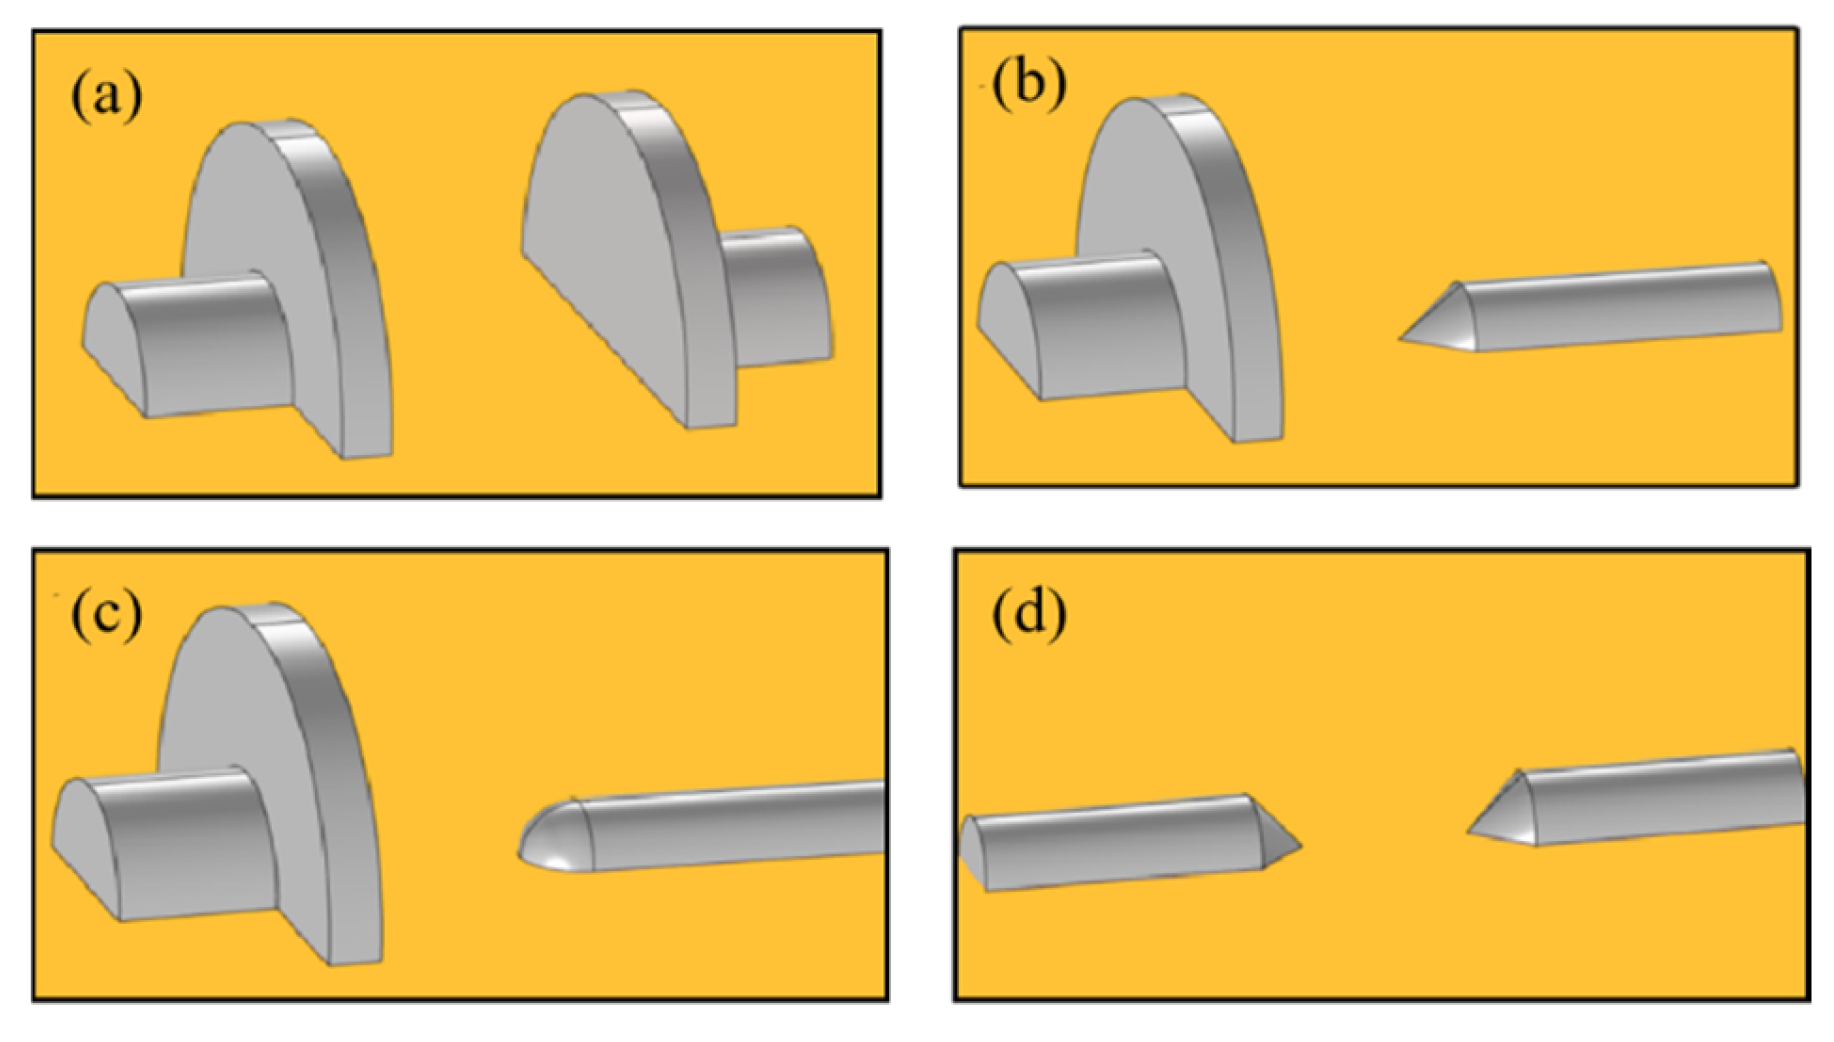
3.1. Discharge Test Setup
3.2. Experimental Results
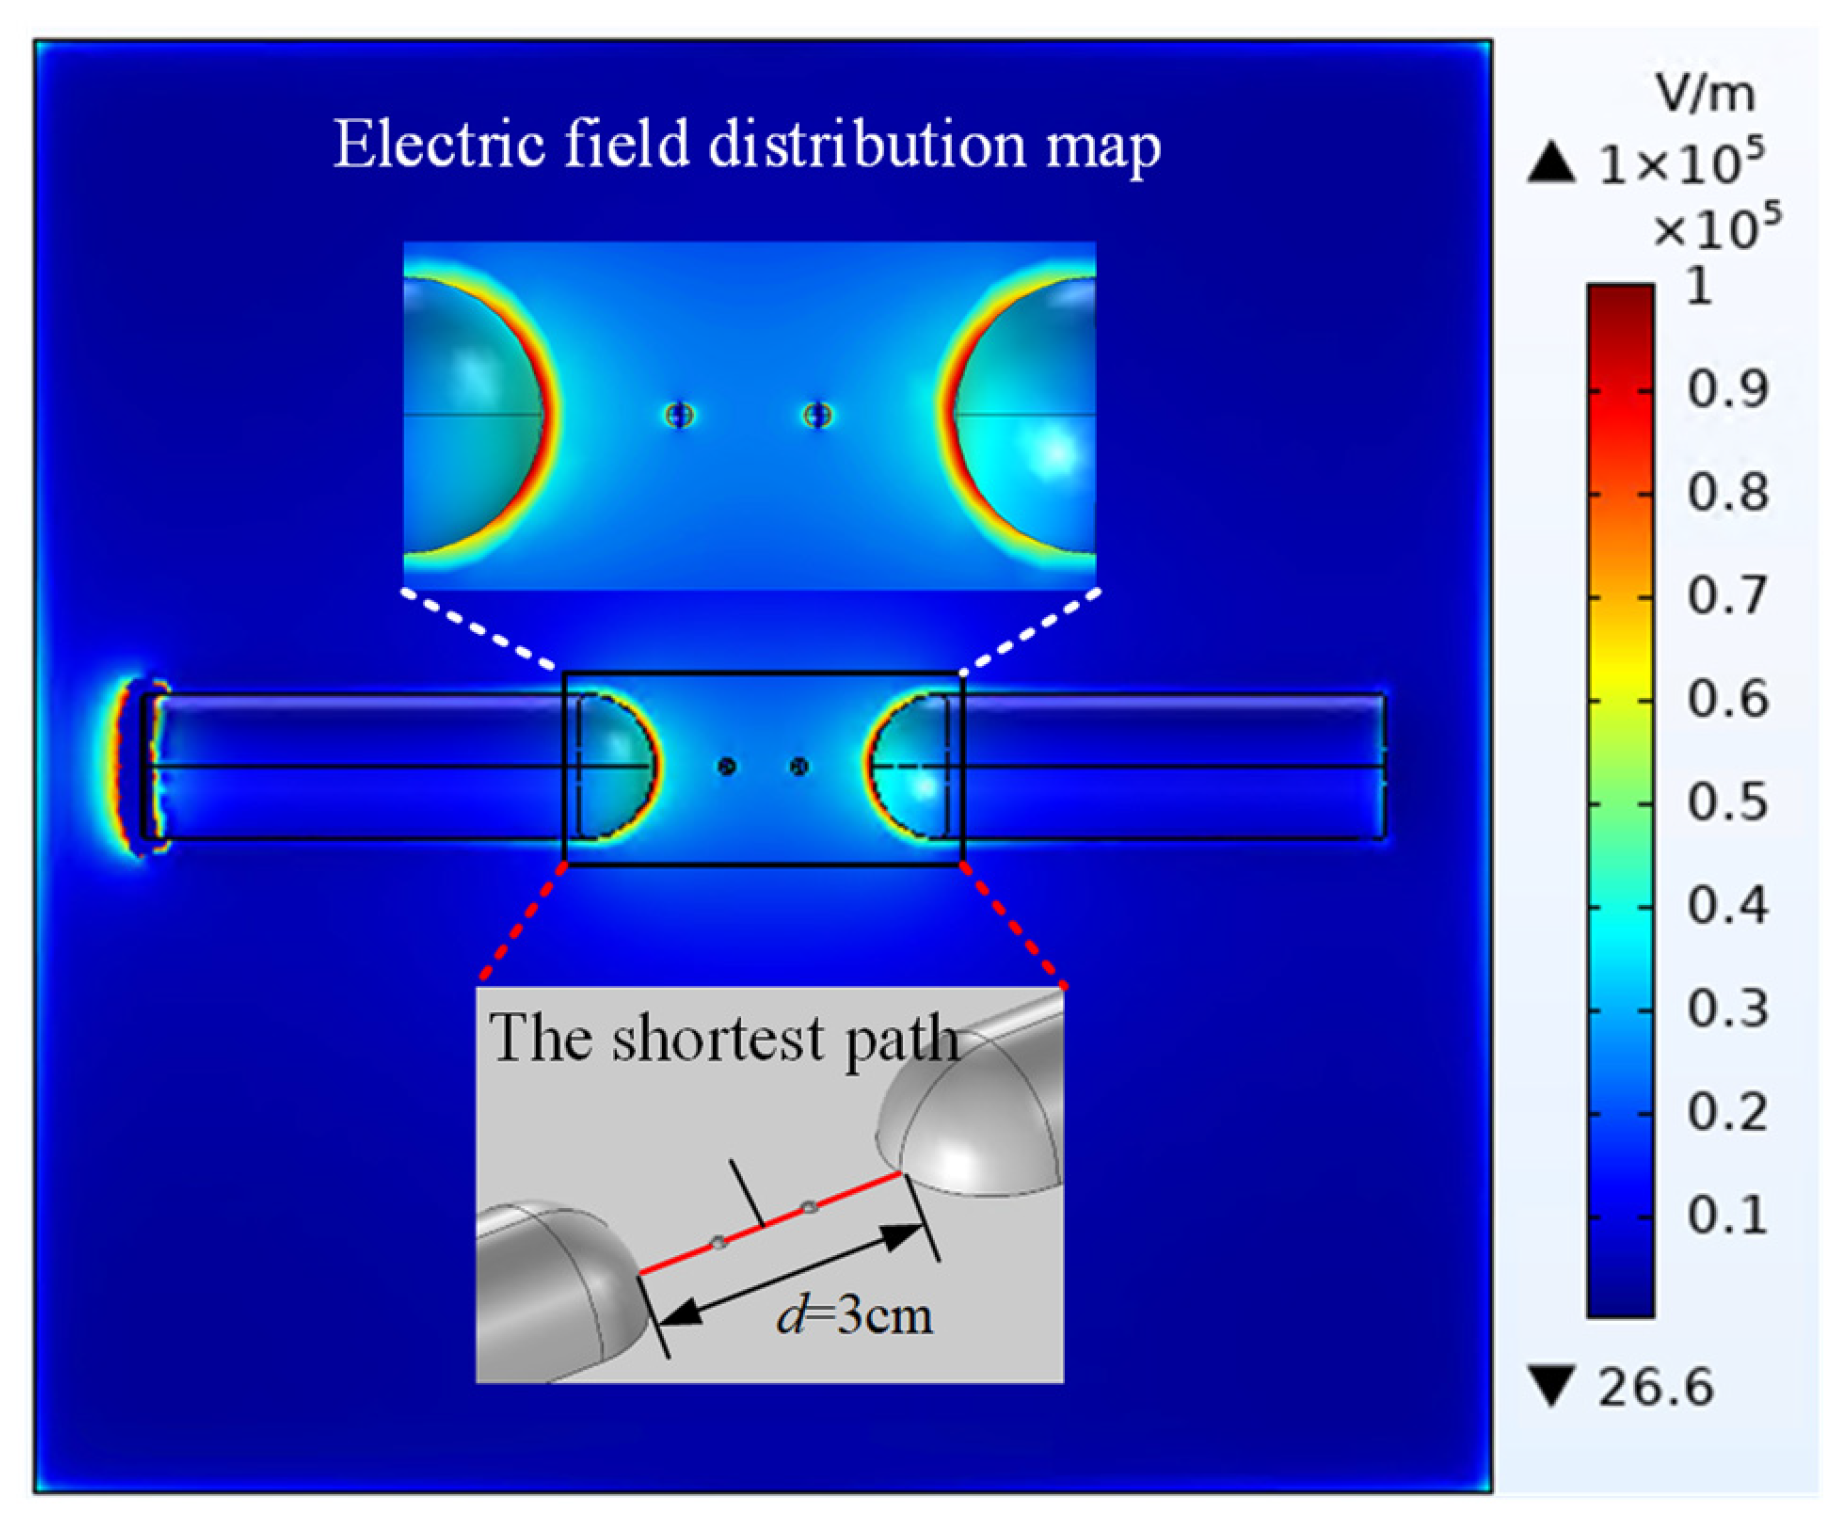
3.3. Electric Field Feature Set Extraction and Sample Division
3.4. Sample Division
3.5. Predicting Results
4. Conclusions
- (1)
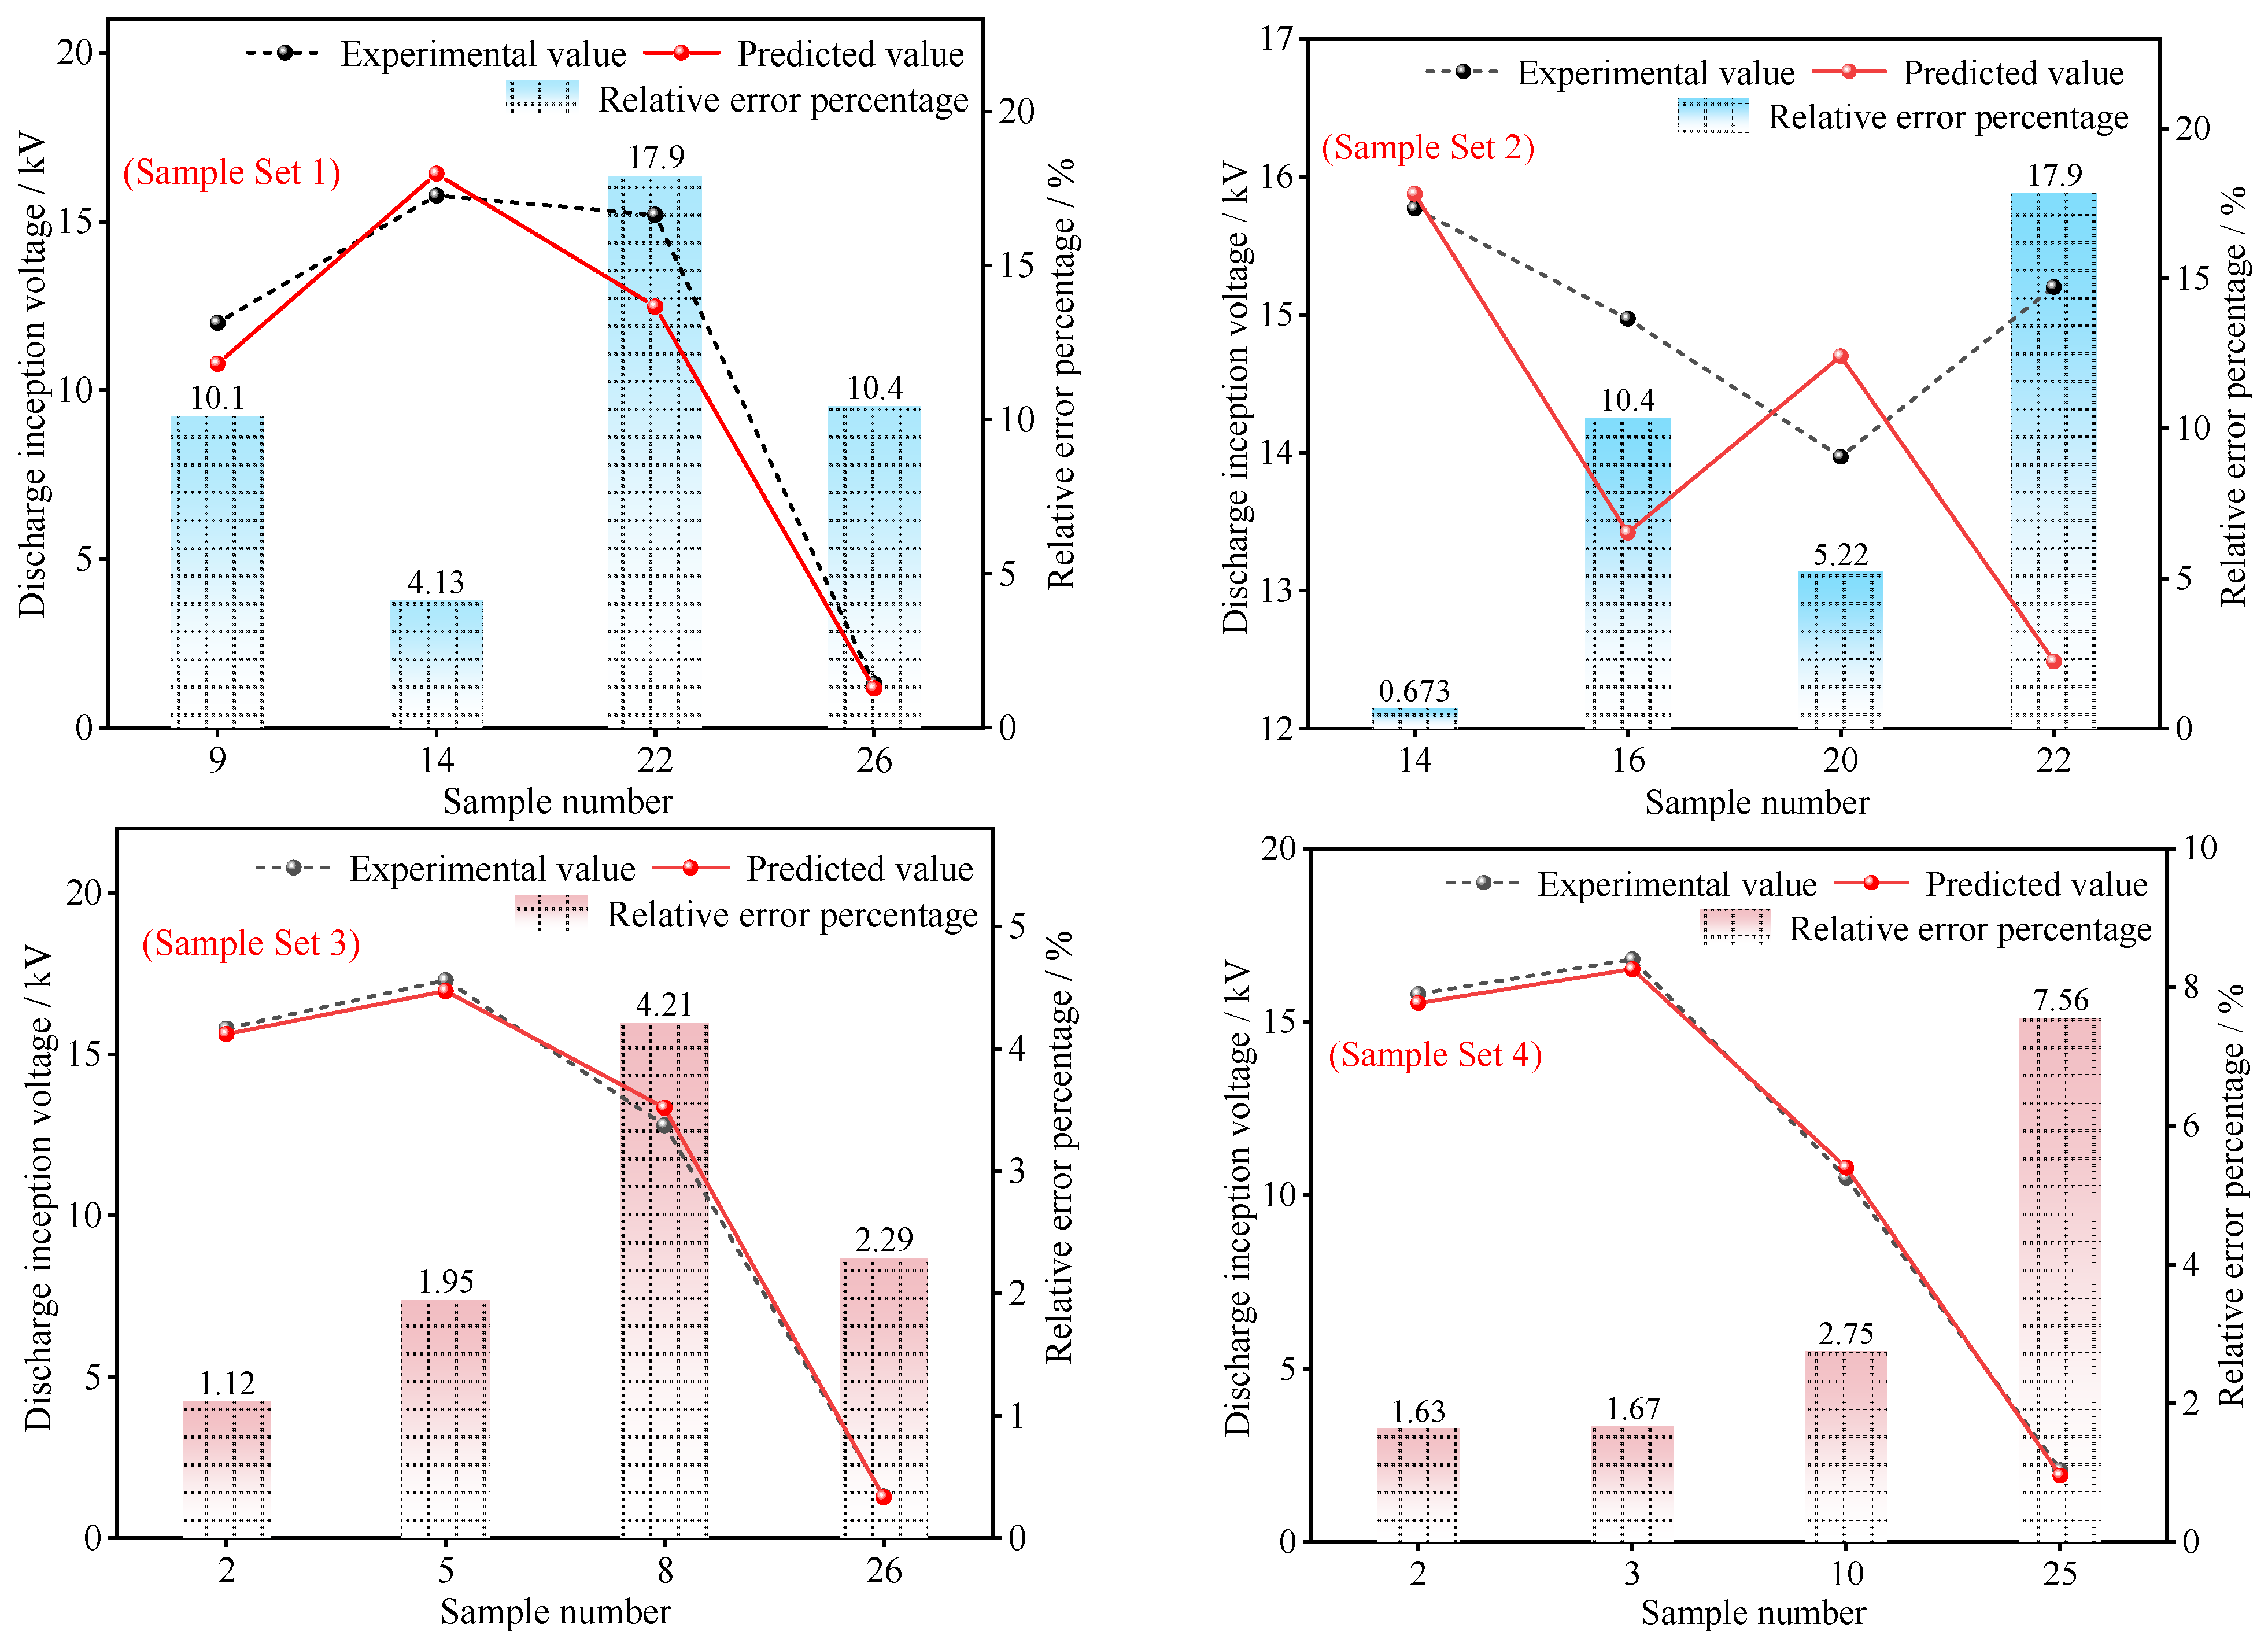
- A 21-dimensional electric field feature set was constructed. Using this set as input for the prediction model resulted in high agreement between predicted and experimental values. Among them, Sample Set 3 achieved the best prediction performance, with RMSE, MAPE, and MSPE values of 0.3320, 0.0239, and 0.0132, respectively.
- (2)
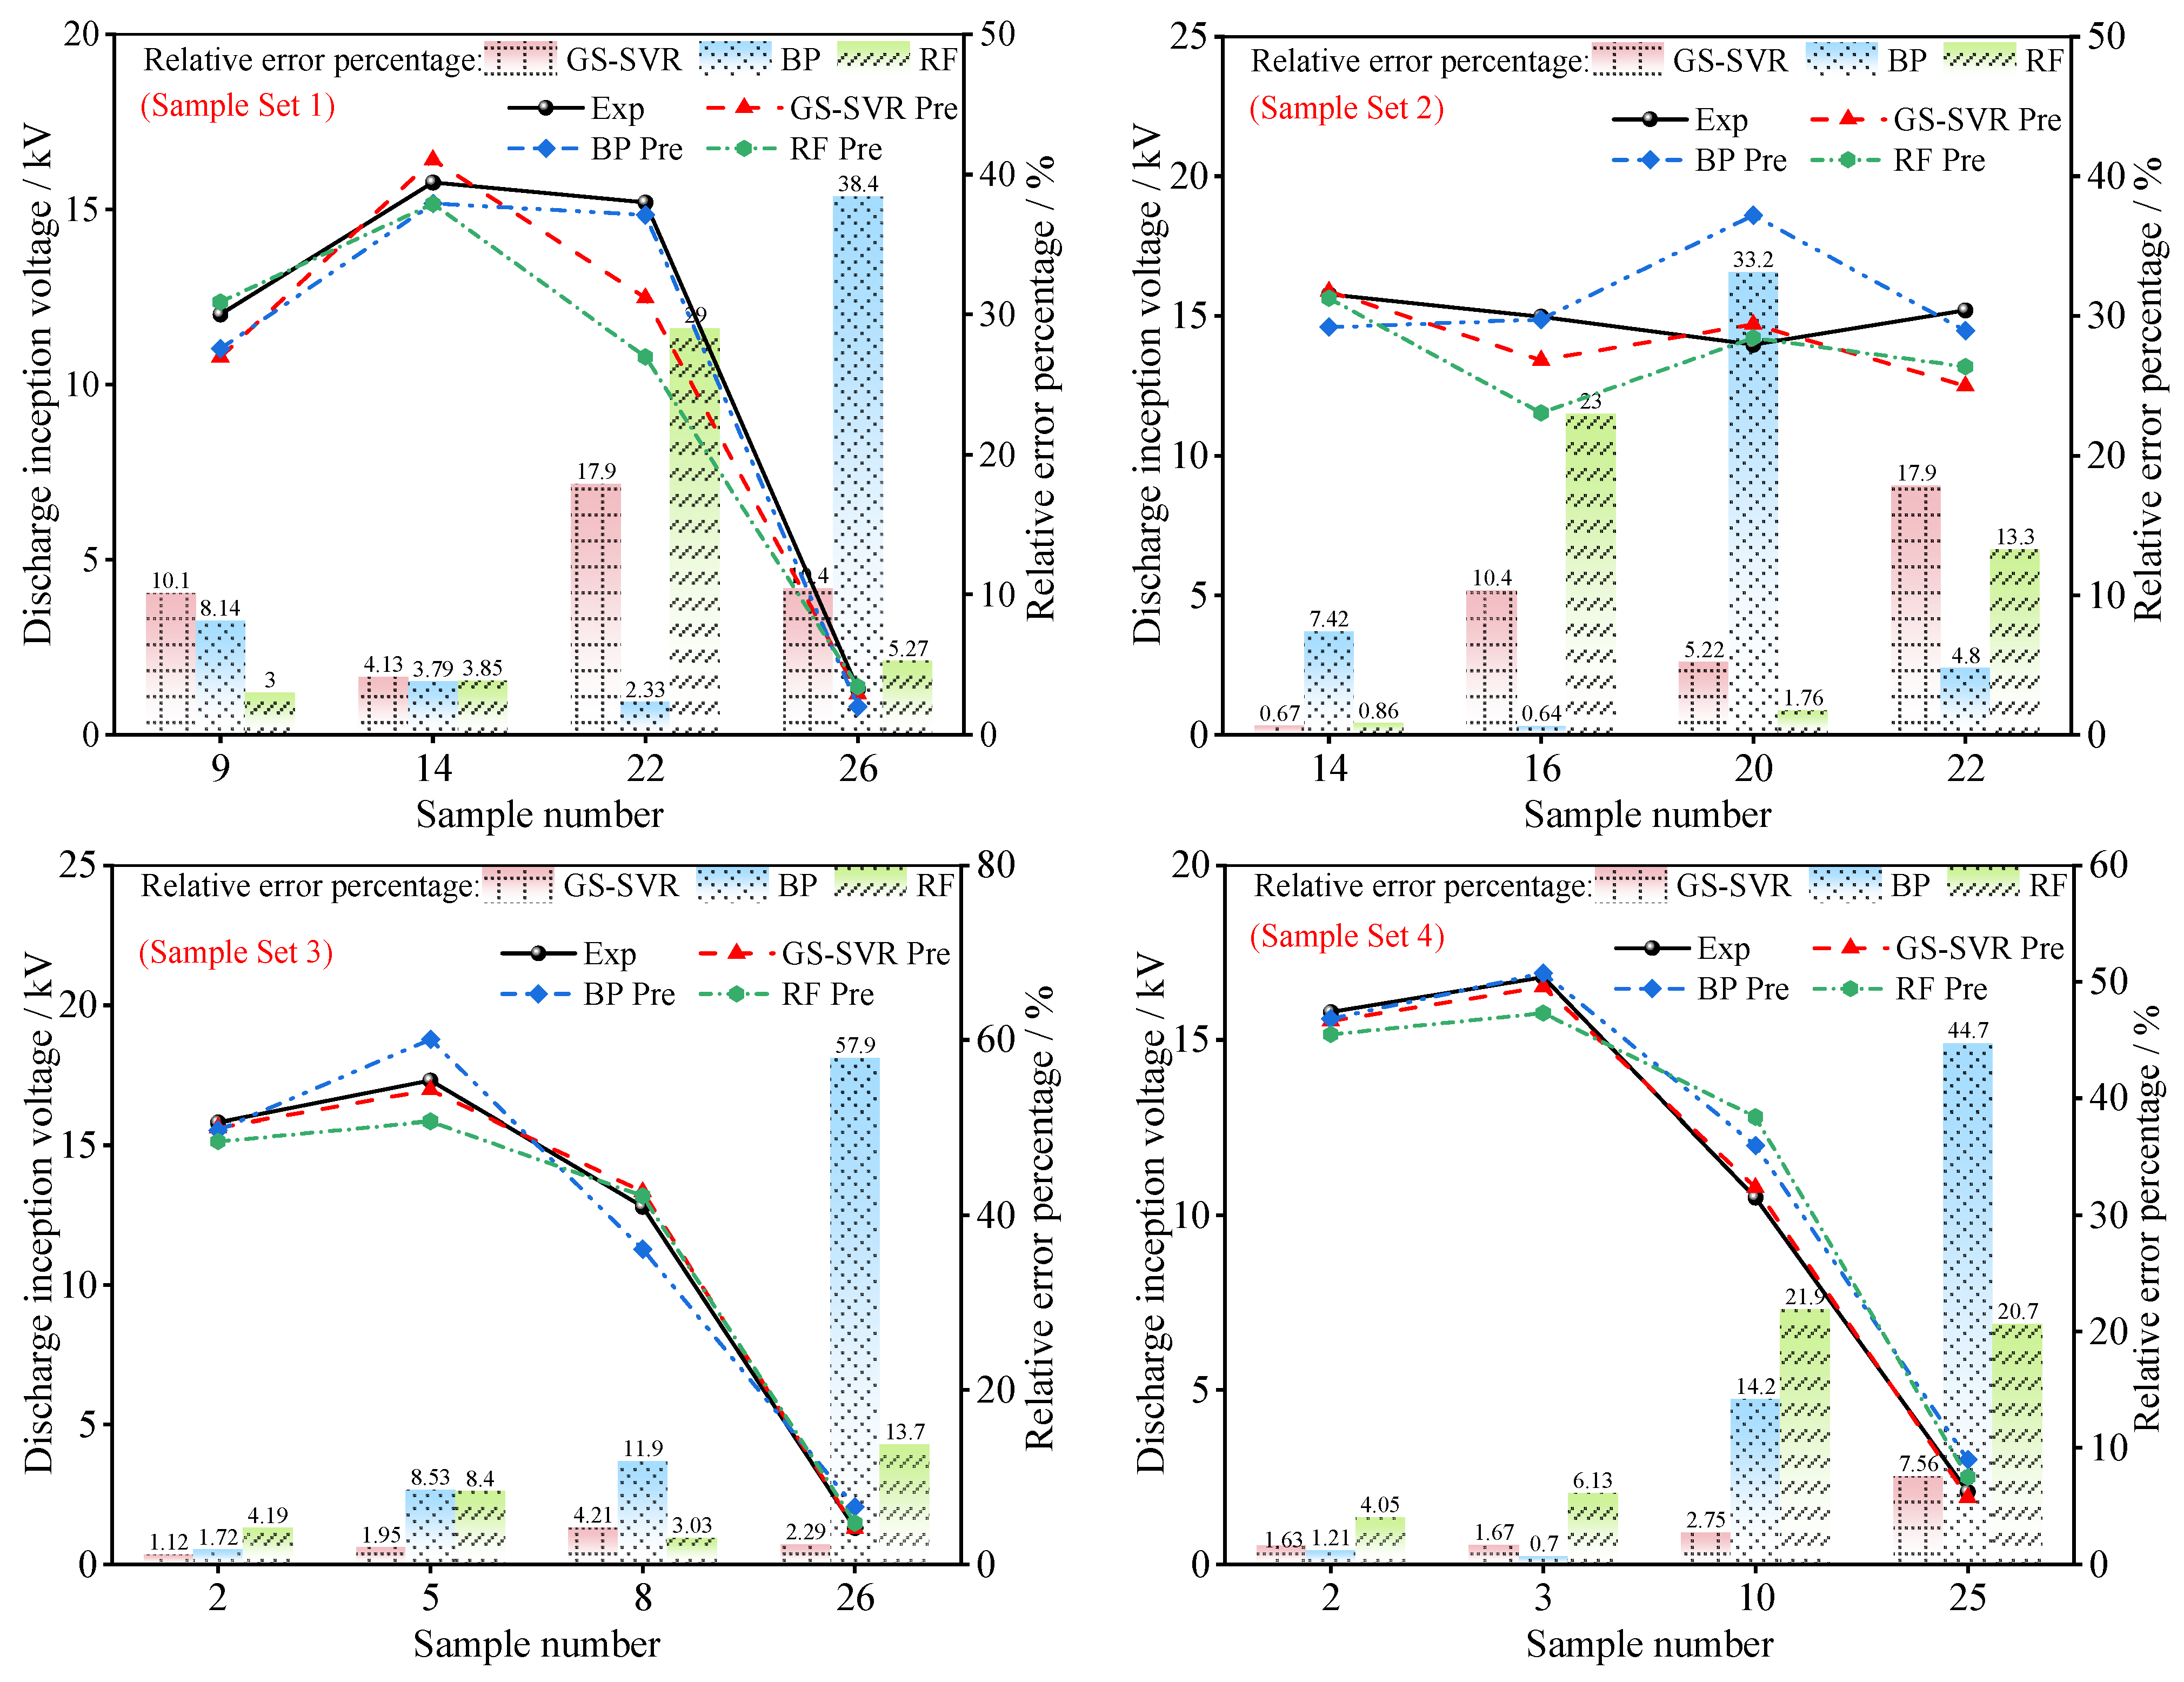
- The total sample set was partitioned using both random partitioning and non-uniformity coefficient-based partitioning methods. Compared with random partitioning, the prediction model based on non-uniformity coefficient partitioning demonstrated higher accuracy, with the average MAPE of Sample Sets 3 and 4 reduced by 6.695% compared to that of Sample Sets 1 and 2.
- (3)
- A surface arc inception voltage prediction model was developed using grid search optimization and support vector regression, achieving accurate prediction with a limited number of original samples. The average MAPE across all four sample sets was 6.243%. Sample Set 1 had the highest MAPE value of 10.65%; in comparison, Sample Set 3 had the lowest MAPE value of only 2.39%.
- (4)
- The arc inception voltage prediction model for epoxy resin under complex environmental conditions established in this study provides theoretical support for improving the insulation performance of electrical equipment under condensation conditions.
Author Contributions
Funding
Data Availability Statement
Conflicts of Interest
References
- Yao, L.; Wang, Y.; Xiao, X. Concentrated Solar Power Plant Modeling for Power System Studies. IEEE Trans. Power Syst. 2024, 39, 4252–4263. [Google Scholar] [CrossRef]
- Kumar, S.; Saket, R.K.; Dheer, D.K.; Holm-Nielsen, J.B.; Sanjeevikumar, P. Reliability enhancement of electrical power system including impacts of renewable energy sources: A comprehensive review. IET Gener. Transm. Distrib. 2020, 14, 1799–1815. [Google Scholar] [CrossRef]
- Ji, J.; Chi, Y.; Yin, X. The blue treasure of hydrogen energy: A research of offshore wind power industry policy in China. Int. J. Hydrogen Energy 2024, 62, 99–108. [Google Scholar] [CrossRef]
- Su, X.; Wang, X.; Xu, W.; Yuan, L.; Xiong, C.; Chen, J. Offshore Wind Power: Progress of the Edge Tool, Which Can Promote Sustainable Energy Development. Sustainability 2024, 16, 7810. [Google Scholar] [CrossRef]
- Zhang, X.; Yang, H.; Zhou, G.; Zhao, Y.; Guo, D. Steady-state voltage stability assessment of new energy power systems with multi-quadrant power modes. Energy Rep. 2023, 9, 3851–3860. [Google Scholar] [CrossRef]
- Shu, S.; Zhan, Z.; Xu, J.; Huang, Y.; Huang, W.; Lin, Y. Three-dimensional numerical simulation and experiment of moisture condensation mechanism inside high voltage switchgear. Electr. Power Energy Syst. 2023, 151, 109–129. [Google Scholar] [CrossRef]
- Li, Z.; Liu, J.; Ohki, Y.; Chen, G.; Gao, H.; Li, S. Surface flashover in 50years: Theoretical models and competing mechanisms. High Volt. 2023, 8, 853–877. [Google Scholar] [CrossRef]
- Qi, B.; Gao, C.; Li, C.; Zhao, L.; Sun, X. The influence of surface charge accumulation on flashover voltage of GIS/GIL basin insulator under various voltage stresses. Int. J. Electr. Power Energy Syst. 2019, 105, 514–520. [Google Scholar] [CrossRef]
- Qiao, X.; Zhang, Z.; Jiang, Z.; Jiang, X.; Pang, G. Lightning Impulse Pollution Flashover Characteristics and Model of 10 kV Composite Arrester Combined Insulator. Trans. China Electrotech. Soc. 2024, 39, 6932–6940. (In Chinese) [Google Scholar]
- Zhang, D.; Xu, H.; Huang, X.; Zhang, Z.; Jiang, X. Space Electric Field Characteristics of Silicone Rubber Insulator Pollution Flashover and Its Application in Flashover Prewarning. IEEE Trans. Dielectr. Electr. Insul. 2023, 30, 439–448. [Google Scholar] [CrossRef]
- Wang, H.; Hu, Q.; Lin, H.; Xu, H.; Shu, L.; Yin, P.; Jiang, X. Effect of icing on the AC flashover voltage of 220 kV composite insulators. Electr. Power Syst. Res. 2025, 238, 111117. [Google Scholar] [CrossRef]
- Wang, M.; Yuan, Y.; Jiang, X.; Li, T.; Chen, Q.; Zhou, F. Switching Impulse Flashover Performance of Nonuniform Pollution Insulators in Natural Environment. IEEE Trans. Dielectr. Electr. Insul. 2023, 30, 844–851. [Google Scholar] [CrossRef]
- Peck, F.W. Dielectric Phenomena in High Voltage Engineering; Mc-Graw-Hill: New York, NY, USA, 1929. [Google Scholar]
- Anderson, R.A.; Brainard, J.P. Mechanism of pulsed surface flashover involving electron-stimulated desorption. J. Appl. Phys. 1980, 51, 1414–1421. [Google Scholar] [CrossRef]
- Sun, G.; Guo, B.; Li, W.; Zhang, S.; Zhou, R.; Song, B.; Mu, H.; Zhang, G. Estimation of surface flashover threshold in a vacuum II: Flashover phase transition. J. Phys. D Appl. Phys. 2020, 53, 075201. [Google Scholar] [CrossRef]
- Li, Z.; Li, S.; Xu, H.; Qu, G.; Niu, H.; Huang, Y.; Aslam, F. The mechanism of gas pressure and temperature dependent surface flashover in compressed gas involving gas adsorption. Appl. Surf. Sci. 2021, 539, 148107. [Google Scholar] [CrossRef]
- Niu, H.; Qu, G.; Li, M.; Li, Z.; Feng, Y.; Li, S. Improved surface flashover voltage of epoxy following polythiourea-assisted coating with high gas adsorption ability. Appl. Surf. Sci. 2023, 618, 156546. [Google Scholar] [CrossRef]
- Qiu, Z.; Ruan, J.; Lu, W.; Wang, X.; Jin, Q. Feature extraction of electric field distribution and its application in discharge voltage prediction of large sphere-plane air gaps. IEEE Trans. Dielectr. Electr. Insul. 2018, 25, 1030–1038. [Google Scholar] [CrossRef]
- Mokhnache, L.; Boubakeur, A. Prediction of the breakdown voltage in a point-barrier-plane air gap using neural networks. In Proceedings of the 2001 Annual Report Conference on Electrical Insulation and Dielectric Phenomena, Kitchener, ON, Canada, 14–17 October 2001; pp. 369–372. [Google Scholar]
- Akram, S.; Wang, P.; Zhu, X.; Huang, J.; Liu, F.; Fang, Z. Prediction of Partial Discharge Inception Voltage for Electric Vehicle Motor Insulation Using Deep Learning. IEEE Trans. Instrum. Meas. 2023, 72, 1–10. [Google Scholar] [CrossRef]
- Qiu, Z.; Ruan, J.; Jin, Q.; Wang, X.; Huang, D.; Shu, S. Switching impulse discharge voltage prediction of EHV and UHV transmission lines–tower air gaps by a support vector classifier. IET Gener. Transm. Distrib. 2018, 12, 3711–3717. [Google Scholar] [CrossRef]
- Dai, H.; Mo, S.; Wang, H.; Yin, N.; Fan, S.; Li, B. Pre-insertion resistors temperature prediction based on improved WOA-SVR. IET Sci. Meas. Technol. 2024, 18, 182–192. [Google Scholar] [CrossRef]
- Kim, J.; Kim, Y. Prediction of Positive Lightning Impulse Breakdown Voltage Under Sphere-to-Barrier-to-Plane Air Gaps Using Machine Learning. IEEE Access 2024, 12, 120429–120439. [Google Scholar] [CrossRef]
- Qiu, Z.; Wang, X.; Ruan, J. Application of a SVR model to predict lightning impulse flashover voltages of parallel gaps for insulator strings. IEEJ Trans. Electr. Electron. Eng. 2019, 14, 1455–1462. [Google Scholar] [CrossRef]
- Ding, C.; Zhou, Y.; Ding, Q.; Wang, Z. Loss Prediction of Ultrahigh Voltage Transmission Lines Based on EEMD–LSTM–SVR Algorithm. Front. Energy Res. 2022, 10, 811745. [Google Scholar] [CrossRef]
- GB/T 4585-2024; Artificial Pollution Tests on High-Voltage Ceramic and Glass Insulators to be Used on a.c. Systems. China Standards Press: Beijing, China, 2024.


| Category | Electric Field Characteristic Quantity | Amount |
|---|---|---|
| Electric field intensity | Maximum value Emax, Minimum value Emin, Average value Eave | 3 |
| Electric field non-uniformity | Variance Evar, Standard deviation Estd, Field strength distortion rate Ed, Range R, Range coefficient Cr, Standard deviation Cv, Maximum value/Average value Eha, Minimum value/Average value Ela | 8 |
| Electric field intensity integral | The integral of the square of the electric field strength Ss, Value of expectation Ssa, Integration of the voltage electrode from its maximum value to its minimum value Sh, Integration of the voltage electrode from the minimum value Sl, The integral of the field strength exceeding 75% of Emax region S75%, The integral of the field strength exceeding 90% of Emax region S90% | 6 |
| Path length | The path length in the region where the field strength exceeds 75% of Emax L75%, The path length in the region where the field strength exceeds 90% of Emax L90%, The path from the high-voltage electrode to the point of minimum electric field intensity Lh, Full width at half maximum Lf | 4 |
| NO. | T (°C) | ΔT (°C) | RH (%) | S (m/s) | Electrode Shape | Number of Droplets | Contaminant (mg/cm2) | |
|---|---|---|---|---|---|---|---|---|
| ESDD | NSDD | |||||||
| 1 | 25 | 10 | 75 | 0 | Plate–plate | 0 | 0.05 | 0.5 |
| 2 | 20 | 5 | 65 | 1 | Rod–plate | 2 | 0.10 | 1.0 |
| 3 | 30 | 15 | 85 | 2 | Needle–plate | 4 | 0.20 | 1.5 |
| 4 | 35 | 20 | 95 | 3 | Needle–needle | 6 | 0.30 | 2.5 |
| No. | Variate | Parameter | Arc Inception Voltage (kV) |
|---|---|---|---|
| 1 | Temperature (°C) | 20 | 13.4 |
| 2 | 25 | 15.8 | |
| 3 | 30 | 16.8 | |
| 4 | 35 | 16.5 | |
| 5 | Temperature difference (°C) | 5 | 17.3 |
| - | 10 | - | |
| 6 | 15 | 14.0 | |
| 7 | 20 | 12.2 | |
| - | Air velocity (m/s) | 0 | - |
| 8 | 1 | 12.8 | |
| 9 | 2 | 12.0 | |
| 10 | 3 | 10.5 | |
| 11 | Relative humidity (%) | 65 | 17.4 |
| - | 75 | - | |
| 12 | 85 | 16.0 | |
| 13 | 95 | 13.2 | |
| 14 | Electrode shape | Plate–plate | 15.8 |
| 15 | Plate–rod | 15.1 | |
| 16 | Plate–needle | 15.0 | |
| 17 | Needle–needle | 14.1 | |
| 18 | Number of droplets | 0 | 16.2 |
| - | 2 | - | |
| 19 | 4 | 14.7 | |
| 20 | 6 | 14.0 | |
| 21 | Dry contamination (mg/mL) | 5 | 15.5 |
| 22 | 10 | 15.2 | |
| 23 | 15 | 13.8 | |
| 24 | 20 | 12.8 | |
| 25 | Wet contamination (mg/mL) | 5 | 2.07 |
| 26 | 10 | 1.30 | |
| 27 | 15 | 0.86 | |
| 28 | 20 | 0.41 |
| Unevenness Coefficient Range | Sample Number | Total Sample Quantity |
|---|---|---|
| 1.0~3.0 | 21, 22, 23, 24, 25, 26, 27, 28 | 8 |
| 3.0~6.0 | 3, 4, 5, 11, 18 | 5 |
| 6.0~9.0 | 2, 6, 12, 14, 15, 16, 19, 20 | 8 |
| >9.0 | 1, 7, 8, 9, 10, 13, 17 | 7 |
| Sample Set Number | Training Sample Number | Test Sample Number |
|---|---|---|
| 1 | 1, 2, 3, 4, 5, 6, 7, 8, 10, 11, 12, 13, 15, 16, 17, 18, 19, 20, 21, 23, 24, 25, 27, 28 | 9, 14, 22, 26 |
| 2 | 1, 2, 3, 4, 5, 6, 7, 8, 9, 10, 11, 12, 13, 15, 17, 18, 19, 21, 23, 24, 25, 26, 27, 28 | 14, 16, 20, 22 |
| 3 | 1, 3, 4, 6, 7, 9, 10, 11, 12, 13, 14, 15, 16, 17, 18, 19, 20, 21, 22, 23, 24, 25, 27, 28 | 2, 5, 8, 26 |
| 4 | 1, 4, 5, 6, 7, 8, 9, 11, 12, 13, 14, 15, 16, 17, 18, 19, 20, 21, 22, 23, 24, 26, 27, 28 | 2, 3, 10, 25 |
| Sample Set Number | 1 | 2 | 3 | 4 |
|---|---|---|---|---|
| C | 75,281.1 | 114,104.8 | 114,104.8 | 2702.4 |
| Γ | 3.271 × 10⁻⁵ | 2.158 × 10⁻⁵ | 3.271 × 10⁻⁵ | 4.883 × 10⁻⁴ |
| RMSE | 1.5272 | 1.6055 | 0.3302 | 0.2515 |
| MAPE | 0.1065 | 0.0853 | 0.0239 | 0.0340 |
| MSPE | 0.0586 | 0.0533 | 0.0132 | 0.0209 |
| Set 1 | GS-SVR | BP | RF | Set 2 | GS-SVR | BP | RF |
| RMSE | 1.5272 | 0.6492 | 2.2347 | RMSE | 1.6055 | 2.4166 | 2 |
| MAPE | 0.1065 | 0.1317 | 0.1029 | MAPE | 0.0853 | 0.115 | 0.0972 |
| MSPE | 0.0586 | 0.0988 | 0.0748 | MSPE | 0.0533 | 0.0858 | 0.0666 |
| Set 3 | GS-SVR | BP | RF | Set 4 | GS-SVR | BP | RF |
| RMSE | 0.3302 | 1.1315 | 0.8264 | RMSE | 0.2515 | 0.8855 | 1.3183 |
| MAPE | 0.0239 | 0.2 | 0.0734 | MAPE | 0.034 | 0.1521 | 0.1319 |
| MSPE | 0.0132 | 0.1493 | 0.0423 | MSPE | 0.0209 | 0.1173 | 0.0775 |
Disclaimer/Publisher’s Note: The statements, opinions and data contained in all publications are solely those of the individual author(s) and contributor(s) and not of MDPI and/or the editor(s). MDPI and/or the editor(s) disclaim responsibility for any injury to people or property resulting from any ideas, methods, instructions or products referred to in the content. |
© 2025 by the authors. Licensee MDPI, Basel, Switzerland. This article is an open access article distributed under the terms and conditions of the Creative Commons Attribution (CC BY) license (https://creativecommons.org/licenses/by/4.0/).
Share and Cite
Lin, Y.; Wei, D.; Zhang, Z.; Ye, Z.; Huang, W.; Shu, S. A Prediction Method for the Surface Arc Inception Voltage of Epoxy Resin Based on an Electric Field Feature Set and GS-SVR. Energies 2025, 18, 5936. https://doi.org/10.3390/en18225936
Lin Y, Wei D, Zhang Z, Ye Z, Huang W, Shu S. A Prediction Method for the Surface Arc Inception Voltage of Epoxy Resin Based on an Electric Field Feature Set and GS-SVR. Energies. 2025; 18(22):5936. https://doi.org/10.3390/en18225936
Chicago/Turabian StyleLin, Yihong, Dengfeng Wei, Zhiwen Zhang, Zhaoping Ye, Wenhua Huang, and Shengwen Shu. 2025. "A Prediction Method for the Surface Arc Inception Voltage of Epoxy Resin Based on an Electric Field Feature Set and GS-SVR" Energies 18, no. 22: 5936. https://doi.org/10.3390/en18225936
APA StyleLin, Y., Wei, D., Zhang, Z., Ye, Z., Huang, W., & Shu, S. (2025). A Prediction Method for the Surface Arc Inception Voltage of Epoxy Resin Based on an Electric Field Feature Set and GS-SVR. Energies, 18(22), 5936. https://doi.org/10.3390/en18225936


