Maximizing Return on Investment in Cryptocurrency Mining Through Energy Optimization
Abstract
1. Introduction
1.1. Background
1.2. Problem Statement
1.3. Contributions
- Novel Hybrid Energy Model: The study proposes a hybrid energy system that integrates PV panels, wind turbines, and diesel generators to meet the continuous and high-energy demands of cryptocurrency mining operations.
- Economic Analysis of ROI: It provides a detailed economic analysis, evaluating the ROI for mining farms, and highlights how renewable energy can reduce operational costs and reliance on fossil fuels.
- Optimization of Hybrid Systems: The research addresses a gap in existing literature by optimizing the configuration of hybrid energy systems, balancing technical efficiency and economic performance specifically for cryptocurrency mining.
- Large-Scale Renewable Energy Adoption: The article demonstrates the feasibility and potential of adopting renewable energy on a large scale in cryptocurrency mining, achieving reduced carbon emissions while maintaining profitability.
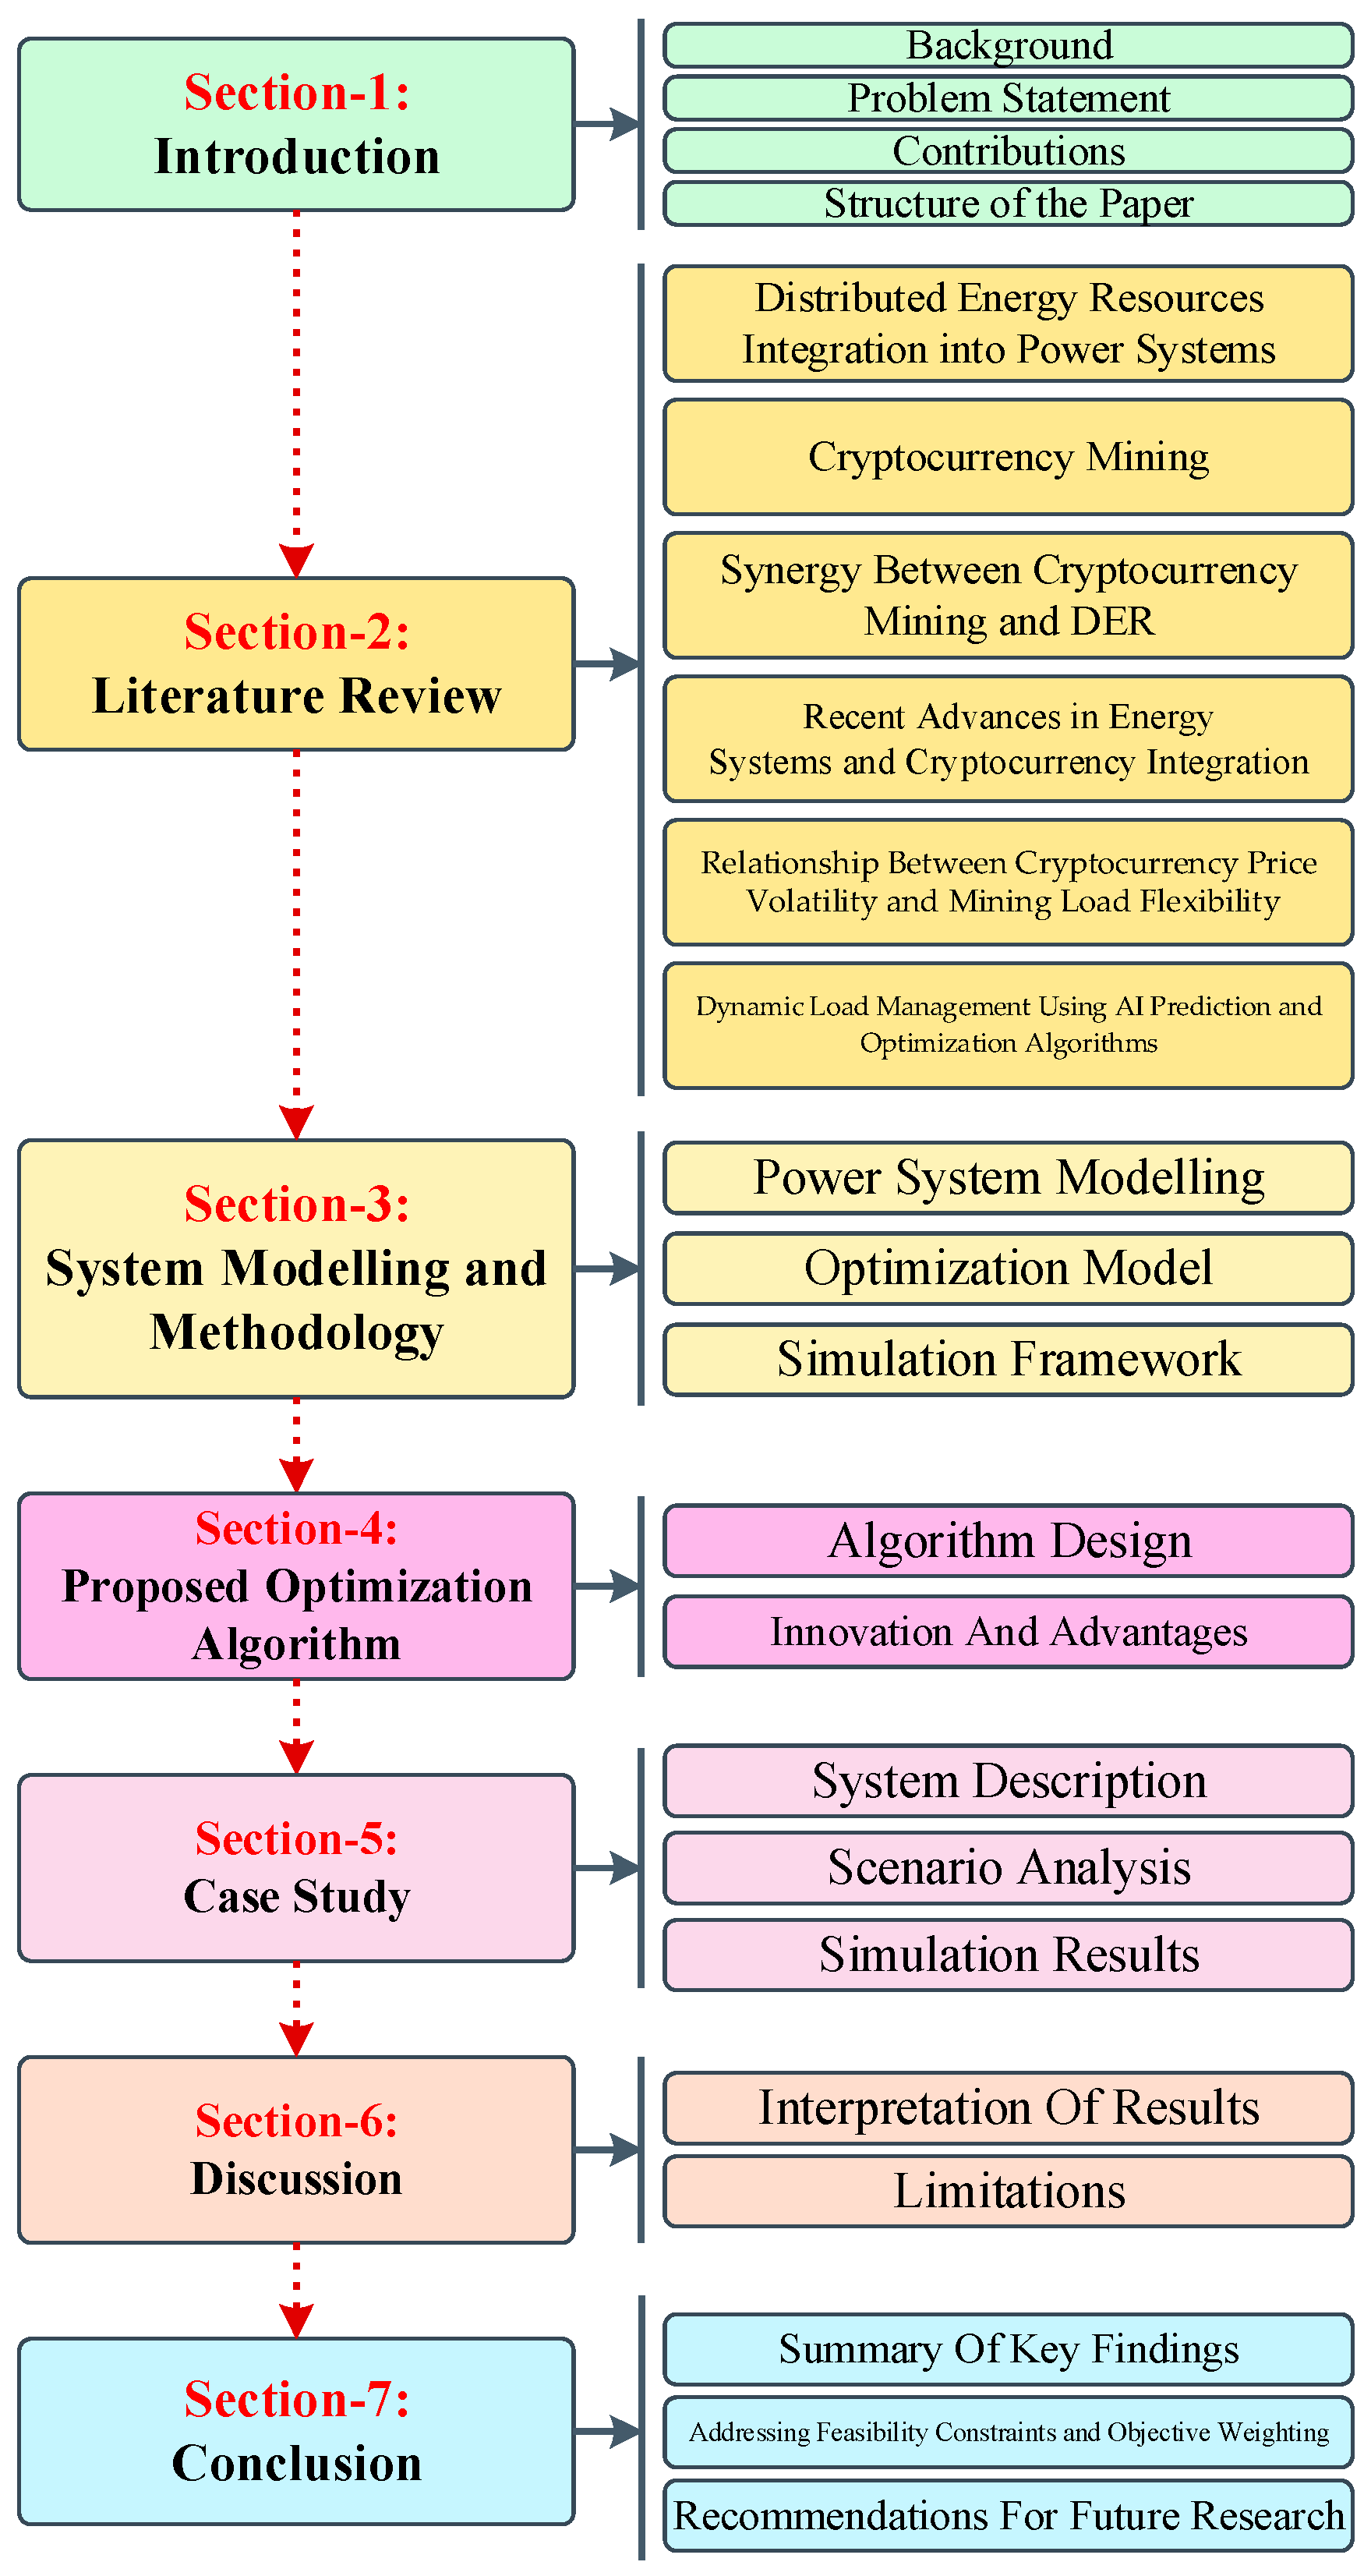
1.4. Structure of the Paper
2. Literature Review
2.1. Distributed Energy Resources Integration into Power Systems
2.2. Cryptocurrency Mining
2.3. Synergy Between Cryptocurrency Mining and DER
2.3.1. Opportunities
- Renewable Energy Usage: Integrating renewable energy sources like PV panels and wind for cryptocurrency mining has the potential to reduce environmental footprints. Research shows that using distributed renewable energy for mining operations increases ROI and reduces emissions [32]. Additionally, innovative strategies aimed at reducing the environmental impact of cryptocurrency mining include the adoption of energy-efficient consensus mechanisms and the utilization of surplus renewable energy that would otherwise be curtailed due to grid limitations. Laimon and Almadadha [23] advocate for the use of the Stellar Consensus Protocol in combination with system dynamics modeling to enhance the efficiency of renewable energy integration in crypto mining operations. Their approach outlines sustainable pathways to reduce carbon emissions and improve the overall environmental sustainability of blockchain systems.
- Combined Heat and Power (CHP) Systems: Mining operations can utilize CHP systems, which generate electricity while capturing heat for other uses, thus improving overall energy efficiency. This approach can reduce the energy required for cooling mining rigs and enhance the performance of cryptocurrency mining farms [35].
- Demand Flexibility: Cryptocurrency mining facilities can offer demand-side flexibility to balance electricity grids. By adjusting mining loads in response to grid needs, these operations can help absorb excess renewable energy during off-peak times or reduce consumption during peak demand [36].
2.3.2. Challenges
- Energy Consumption: A significant challenge is the sheer amount of energy required for mining. PoW cryptocurrencies like Bitcoin are particularly demanding, contributing to high electricity consumption and carbon emissions. This raises concerns about grid stability, especially in regions with less robust infrastructure [37].
- Regulatory and Pricing Issues: Pricing strategies, such as time-of-use (TOU) or increased electricity rates during peak hours, may help limit the profitability of home-based miners. These measures could manage demand surges caused by residential mining, though implementation remains a challenge in some regions [38].
- Grid Stability and Management: The integration of DERs with cryptocurrency mining can lead to voltage imbalances, overloads, and reverse power flows in the system. To mitigate this, innovative energy management systems and demand response strategies are needed [39].
2.4. Recent Advances in Energy Systems and Cryptocurrency Integration (2022–2025)
2.4.1. Cryptocurrency Mining and Environmental Impact
2.4.2. Renewable Energy Integration in Mining
2.4.3. Evolution of Consensus Mechanisms
2.4.4. Blockchain and IoT in Energy Systems
2.5. Relationship Between Cryptocurrency Price Volatility and Mining Load Flexibility
2.6. Dynamic Load Management Using AI Prediction and Optimization Algorithms
3. System Modeling and Methodology
3.1. Power System Modeling
3.1.1. PV System
3.1.2. Wind Turbine System
3.1.3. Diesel Generator Backup
3.1.4. Storage System
3.1.5. Power Converter System
3.1.6. Cryptocurrency Mining Load
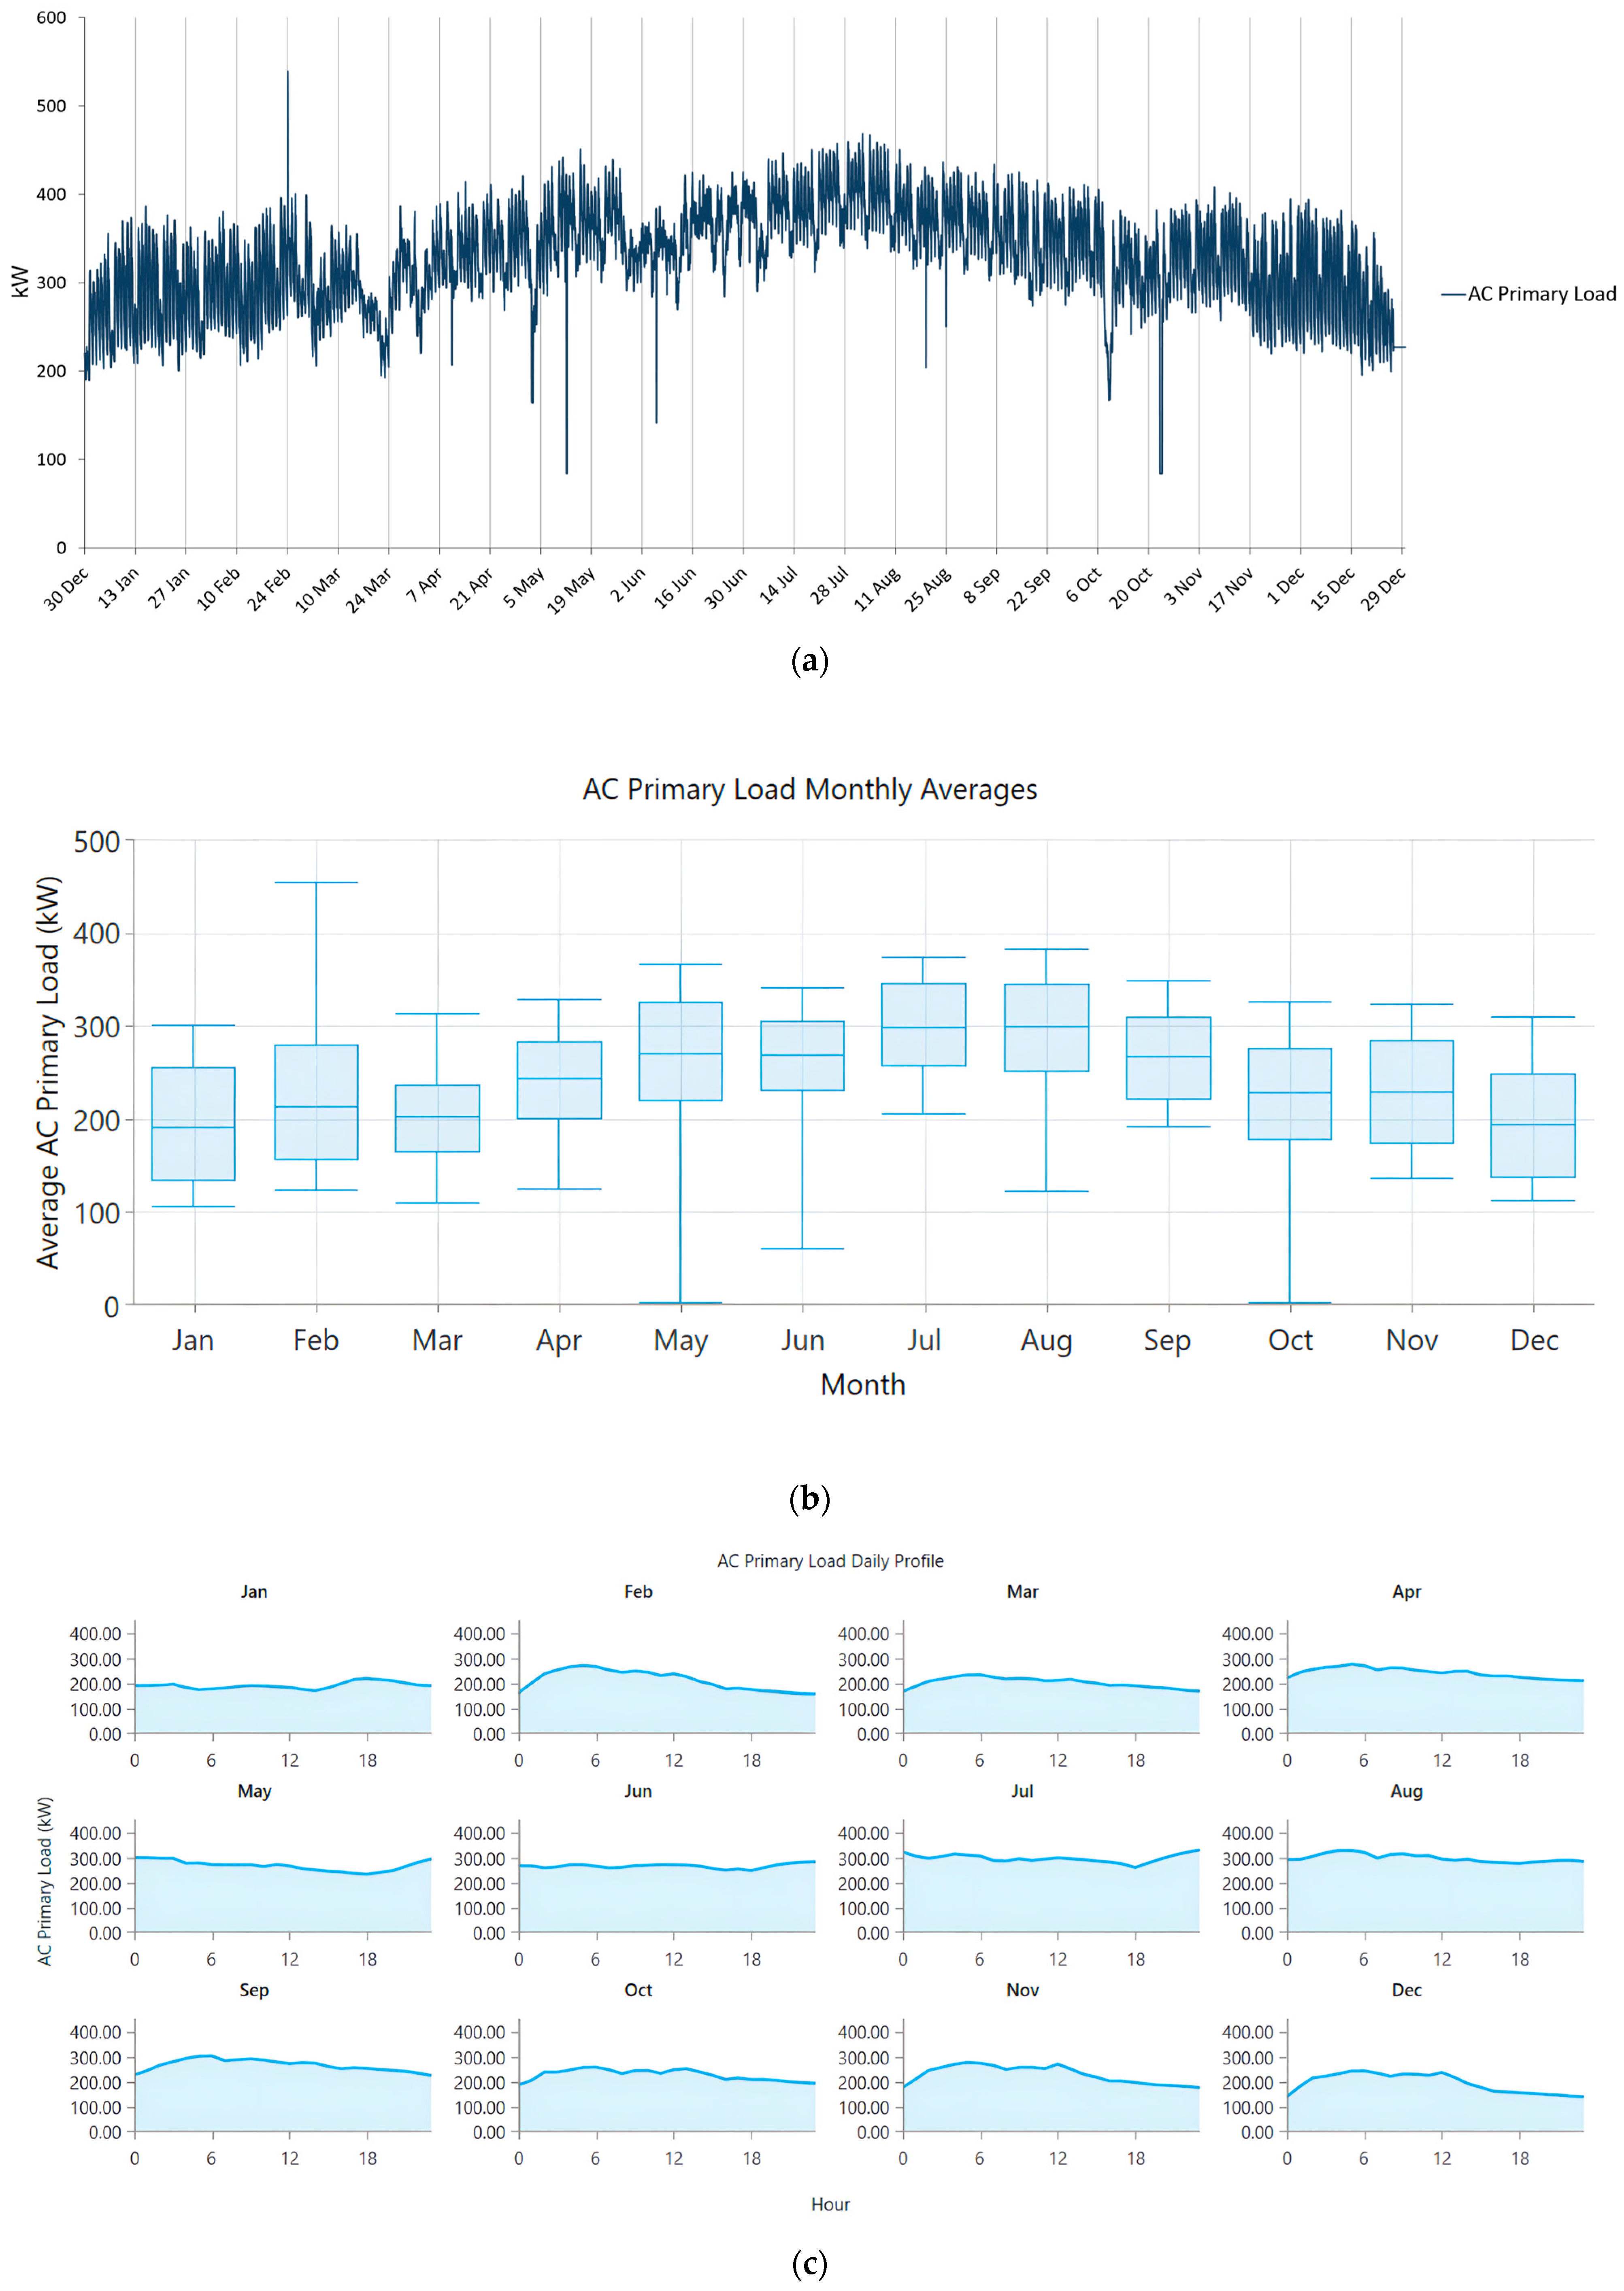
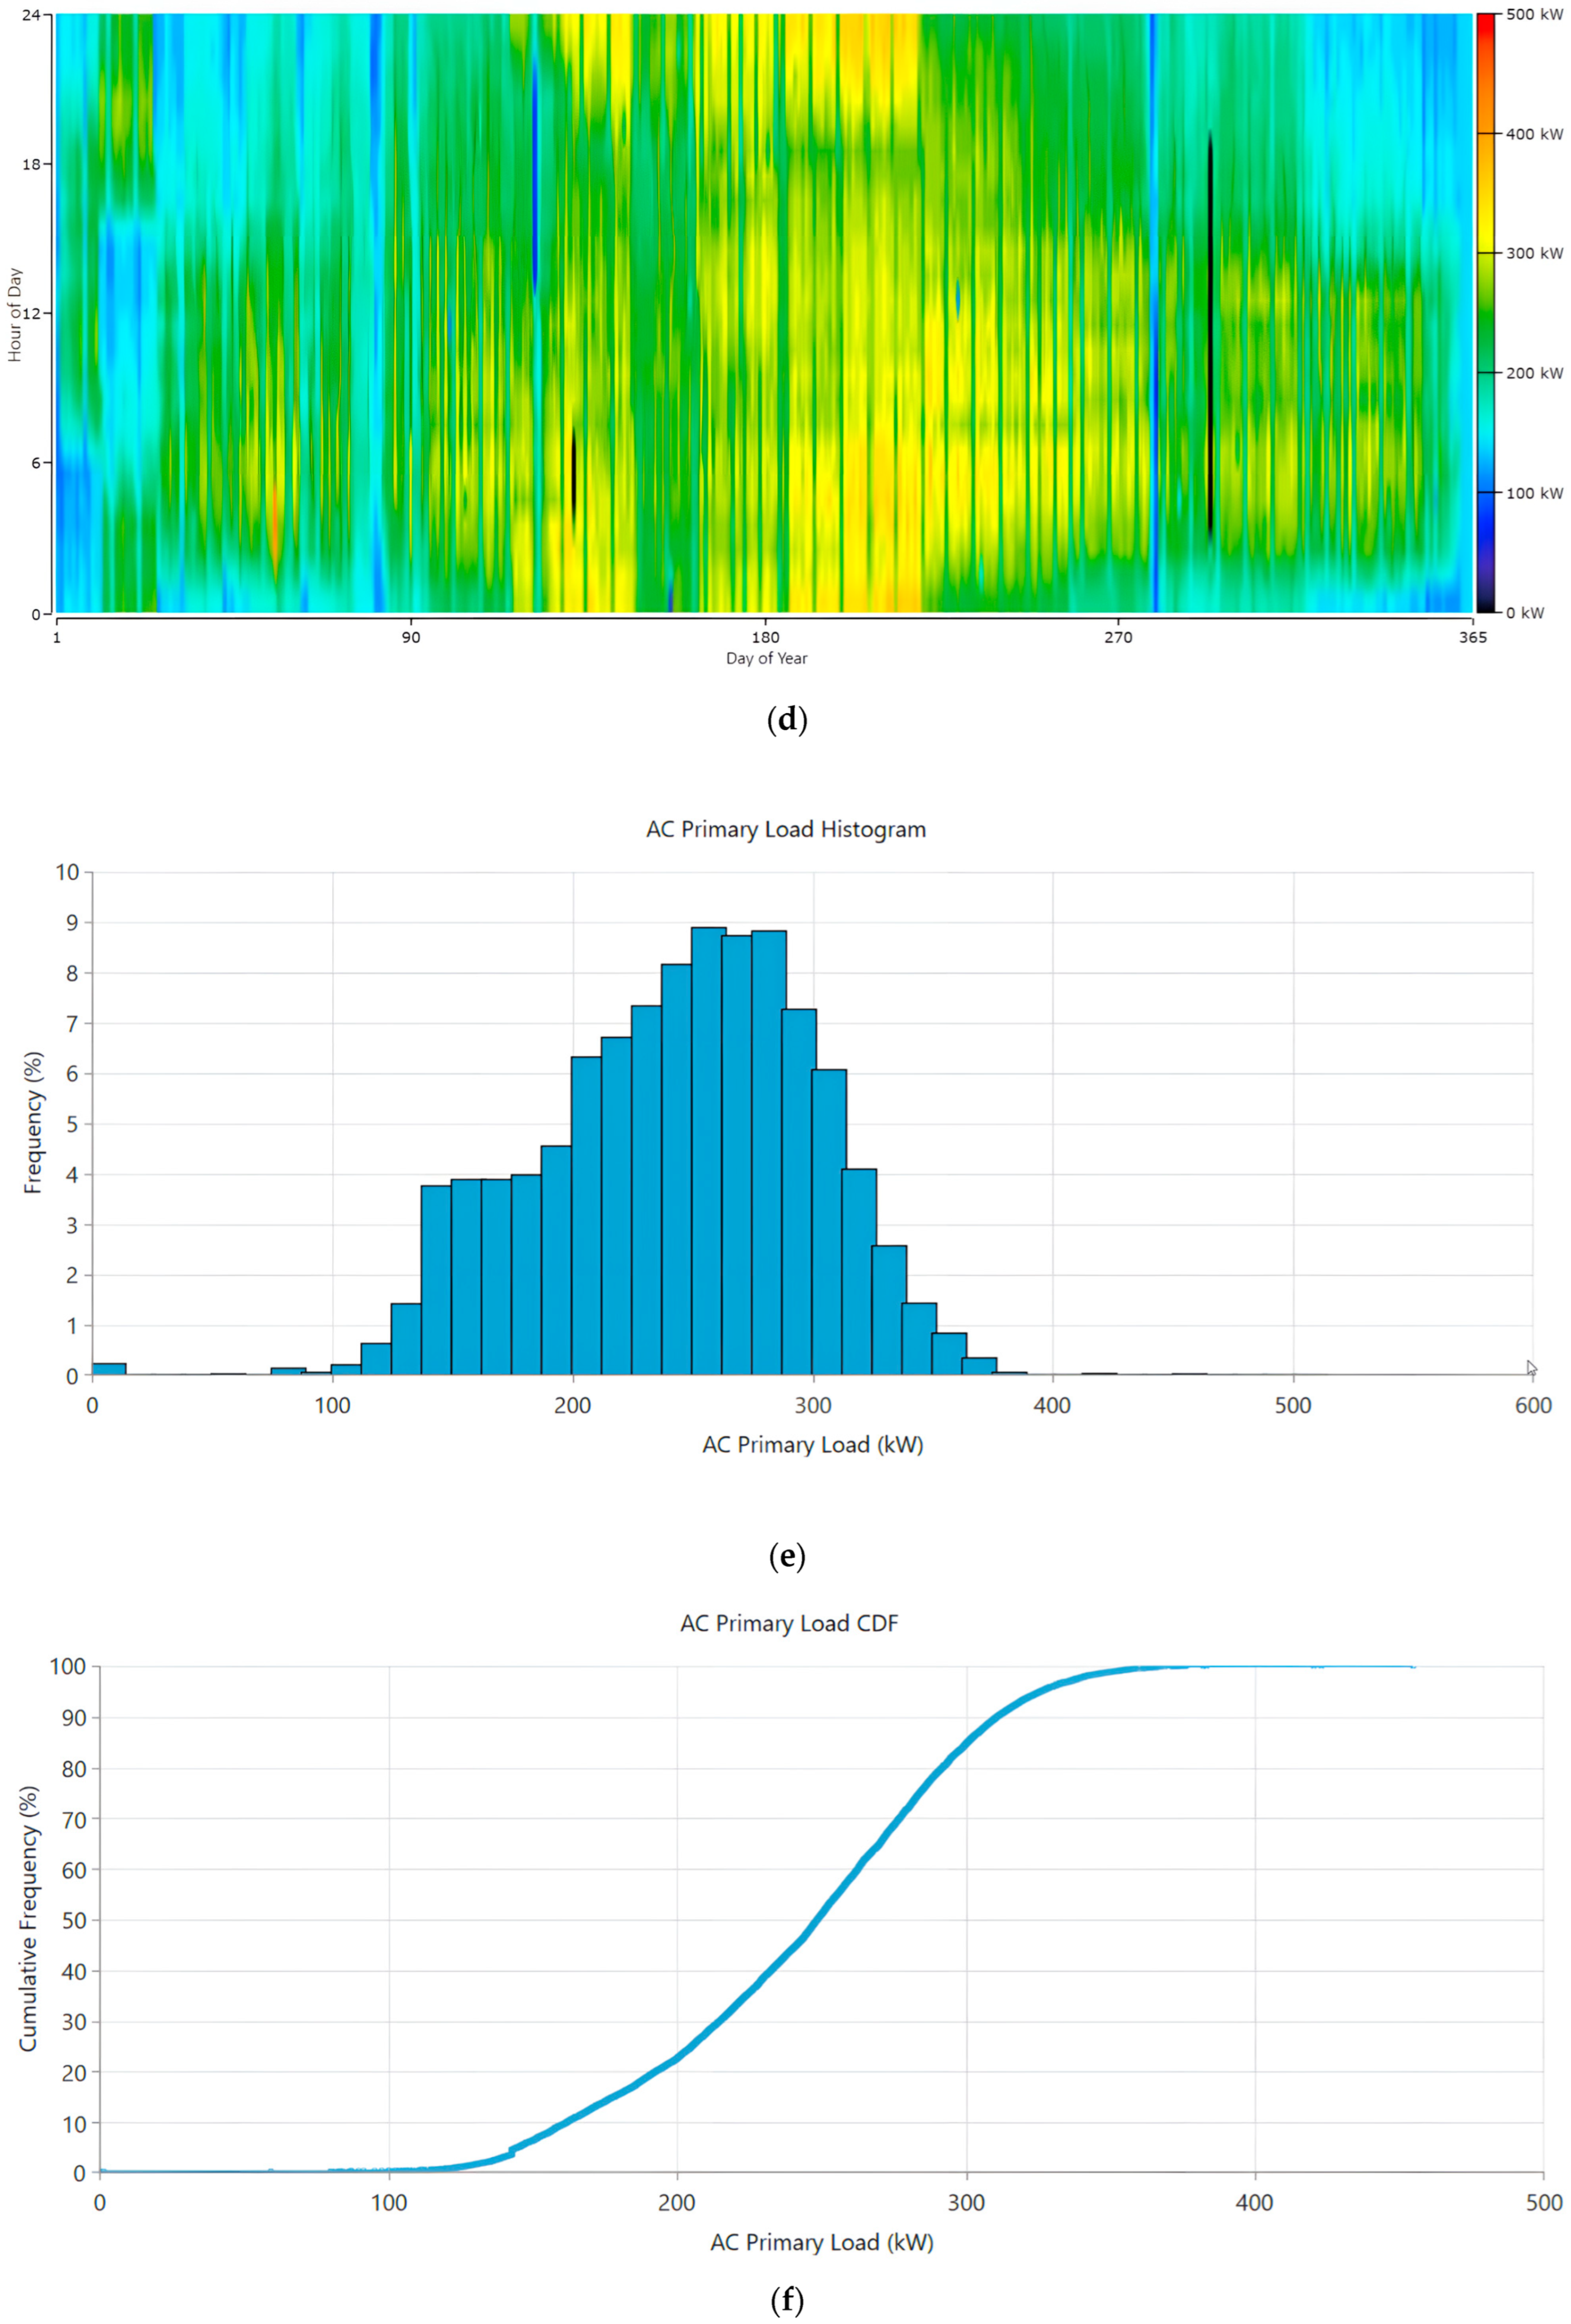
3.1.7. Temporal Variability in Urban and Rural Electricity Loads
3.2. Optimization Model
3.2.1. Problem Formulation
- The size and number of PV panels and wind turbines.
- The capacity of the diesel generator and energy storage (if applicable).
- The dispatch strategy for operating the diesel generator.
- The operational profile of the cryptocurrency mining farms.
- is the total capital cost of the renewable energy components, diesel generator, cryptocurrency miners, rental, human resources, and internet consumption.
- is the operational and maintenance cost, which includes servicing, repairs, and other recurring expenses.
- represents the cost of replacing components like batteries or inverters over the system’s lifecycle.
- is the fuel cost incurred by the operation of the diesel generator, which depends on fuel consumption and price.
3.2.2. Constraints
- Power Balance Constraint: The total power generated by the PV panels, wind turbines, and diesel generator must meet the total load demand (urban load + cryptocurrency mining load, based on scenarios) at all times:
- Renewable Energy Generation Constraint: The power generated by renewable energy sources is limited by their respective maximum generation capacities, which depend on real-time solar irradiance and wind speed:
- Diesel Generator Operation Constraint: The diesel generator is only utilized when the renewable energy generation is insufficient. Its operation is constrained by fuel availability and the generator’s capacity:
- Battery Storage Constraints (if applicable): If energy storage systems are incorporated, additional constraints govern the charging and discharging of the batteries, ensuring that they operate within their rated capacities:
- Cryptocurrency Mining Load Constraint: Cryptocurrency mining farms demand continuous and stable power. This load must always be met without interruptions and is calculated as (13) [72]:where is the power (in megawatts), is the network hash rate (in mega hashes per second), and is the hardware efficiency (energy consumed by hardware per terahash).
- Cooling Power for Miners: Cryptocurrency mining rigs generate significant heat due to their high computational demands. This heat must be effectively managed to prevent hardware damage and maintain optimal performance. Therefore, the cooling system must provide sufficient power to cool the mining devices continuously. The required cooling power depends on the total heat load generated by the miners, which is a function of the number of devices, their power consumption, and their efficiency. The optimization model ensures that the energy allocated for cooling is sufficient to maintain safe operating temperatures without compromising the energy available for other loads, such as cryptocurrency mining or urban energy demands.
- To calculate the cooling power required for cryptocurrency miners, you can use the following formula based on the heat generated by the mining devices [73,74,75]:where is the cooling power required (in kilowatts, kW), is the total power consumption of the mining equipment (in kW), and is the efficiency of the mining devices (fractional value between 0 and 1; for instance, 0.9 for 90% efficient devices), is the Coefficient of Performance of the cooling system (typically 3 to 5 for efficient cooling systems).Explanation:
- The power consumed by the miners () is mostly converted to heat. The efficiency of the mining devices reduces the amount of power that needs to be removed as heat.
- The Coefficient of Performance () represents how effectively the cooling system converts power input into cooling power. A higher means more efficient cooling.
- This formula allows you to estimate the cooling power required based on the power consumption of the miners, their efficiency, and the cooling system’s performance.
- Optimization Techniques:
3.2.3. Sensitivity Analysis
3.3. Simulation Framework
3.3.1. Tools
- Energy production modeling for renewable sources such as solar panels and wind turbines.
- Dispatch strategy optimization to control the operation of the diesel generator and manage energy storage (if applicable).
- Economic analysis that evaluates the total COE, NPC, and ROI.
- Sensitivity analysis to assess how variations in key parameters affect the system’s performance and cost.
3.3.2. Data Inputs
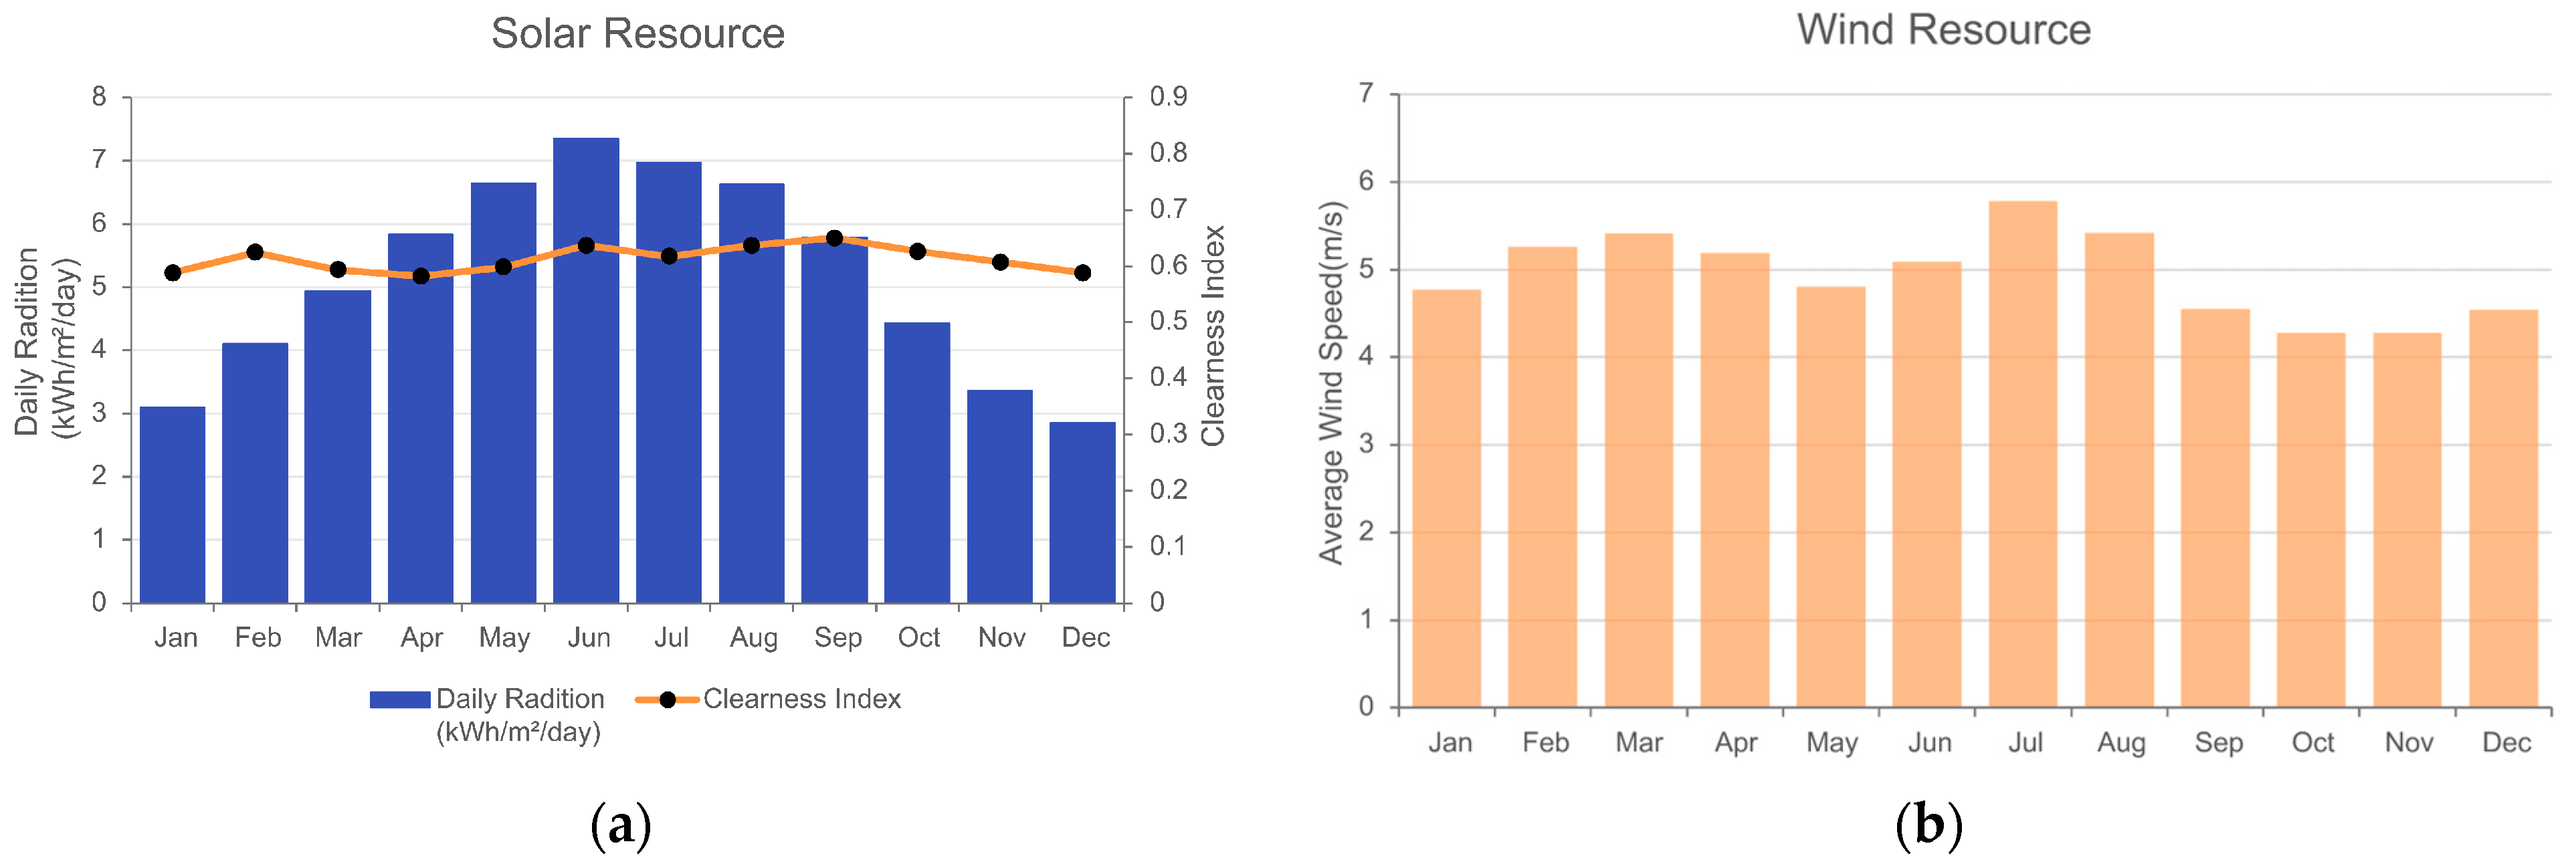
- Solar and Wind Data: Real-time solar irradiance and wind speed data for the geographic location where the system is deployed are critical inputs. These datasets are typically gathered from local meteorological stations or publicly available databases such as NASA’s Surface Meteorology and Solar Energy dataset. The data is used to estimate the energy output of the PV panels and wind turbines throughout the year.
- Load Profiles: Two distinct load profiles are considered in the simulation:
- Urban Load: This reflects the typical electricity consumption of urban residential and commercial users in the system’s service area. The load profile varies over the course of the day, with peak loads typically occurring during the day and early evening.
- Cryptocurrency Mining and Cooling Loads: Cryptocurrency mining farms operate continuously and demand a stable, high-power input. The load is modeled as a constant demand throughout the simulation period to reflect the energy-intensive nature of cryptocurrency mining operations.
- System Components Data: Specifications for all system components, including PV panels, wind turbines, and the diesel generator, are input into HOMER Pro. This includes technical parameters such as rated capacity, efficiency, lifetime, and operational costs. Fuel consumption rates and fuel prices are also key inputs for the diesel generator.
- Economic Data: Capital costs, O&M costs, and replacement costs for all components are input into the model. Additionally, the discount rate and inflation rate are specified to calculate the system’s NPC over its operational lifetime. HOMER Pro takes into account both local and U.S. diesel fuel prices to accurately represent real-time operational costs.
3.3.3. Assumptions
- Constant Cryptocurrency Mining Load: It is assumed that the cryptocurrency mining load remains constant throughout the simulation period. This assumption reflects the continuous operation of mining devices, which require a stable and uninterrupted power supply.
- Solar and Wind Intermittency: Solar and wind energy generation is subject to natural fluctuations based on weather patterns. It is assumed that the solar and wind data provided represent typical annual conditions and that extreme variations (e.g., prolonged cloudy or windless periods) are rare.
- Backup Diesel Generator Operation: The diesel generator is assumed to operate only during periods when renewable generation (solar and wind) is insufficient to meet the system’s load. It is dispatched based on an optimized strategy that minimizes fuel consumption and operational costs.
- Component Lifetimes and Replacement Cycles: The lifetimes of the PV panels, wind turbines, and diesel generators are assumed based on manufacturer specifications. The model incorporates replacement cycles for components that are expected to fail or degrade over time, such as batteries or inverters (if used).
- No Grid Connection: The system is assumed to operate as an off-grid, stand-alone hybrid system. No electricity is imported from or exported to a central utility grid, making the system fully independent in its energy generation and consumption. It should be noted that the “No Grid Connection” assumption applies to the baseline system design and all standard scenarios in this study. However, in Scenario 3 (Section 5.2.3), a special case is introduced where limited electricity sales to the national grid are modeled. This exception is included only for comparative and economic evaluation during peak summer months and does not change the fundamental off-grid nature of the system in other scenarios.
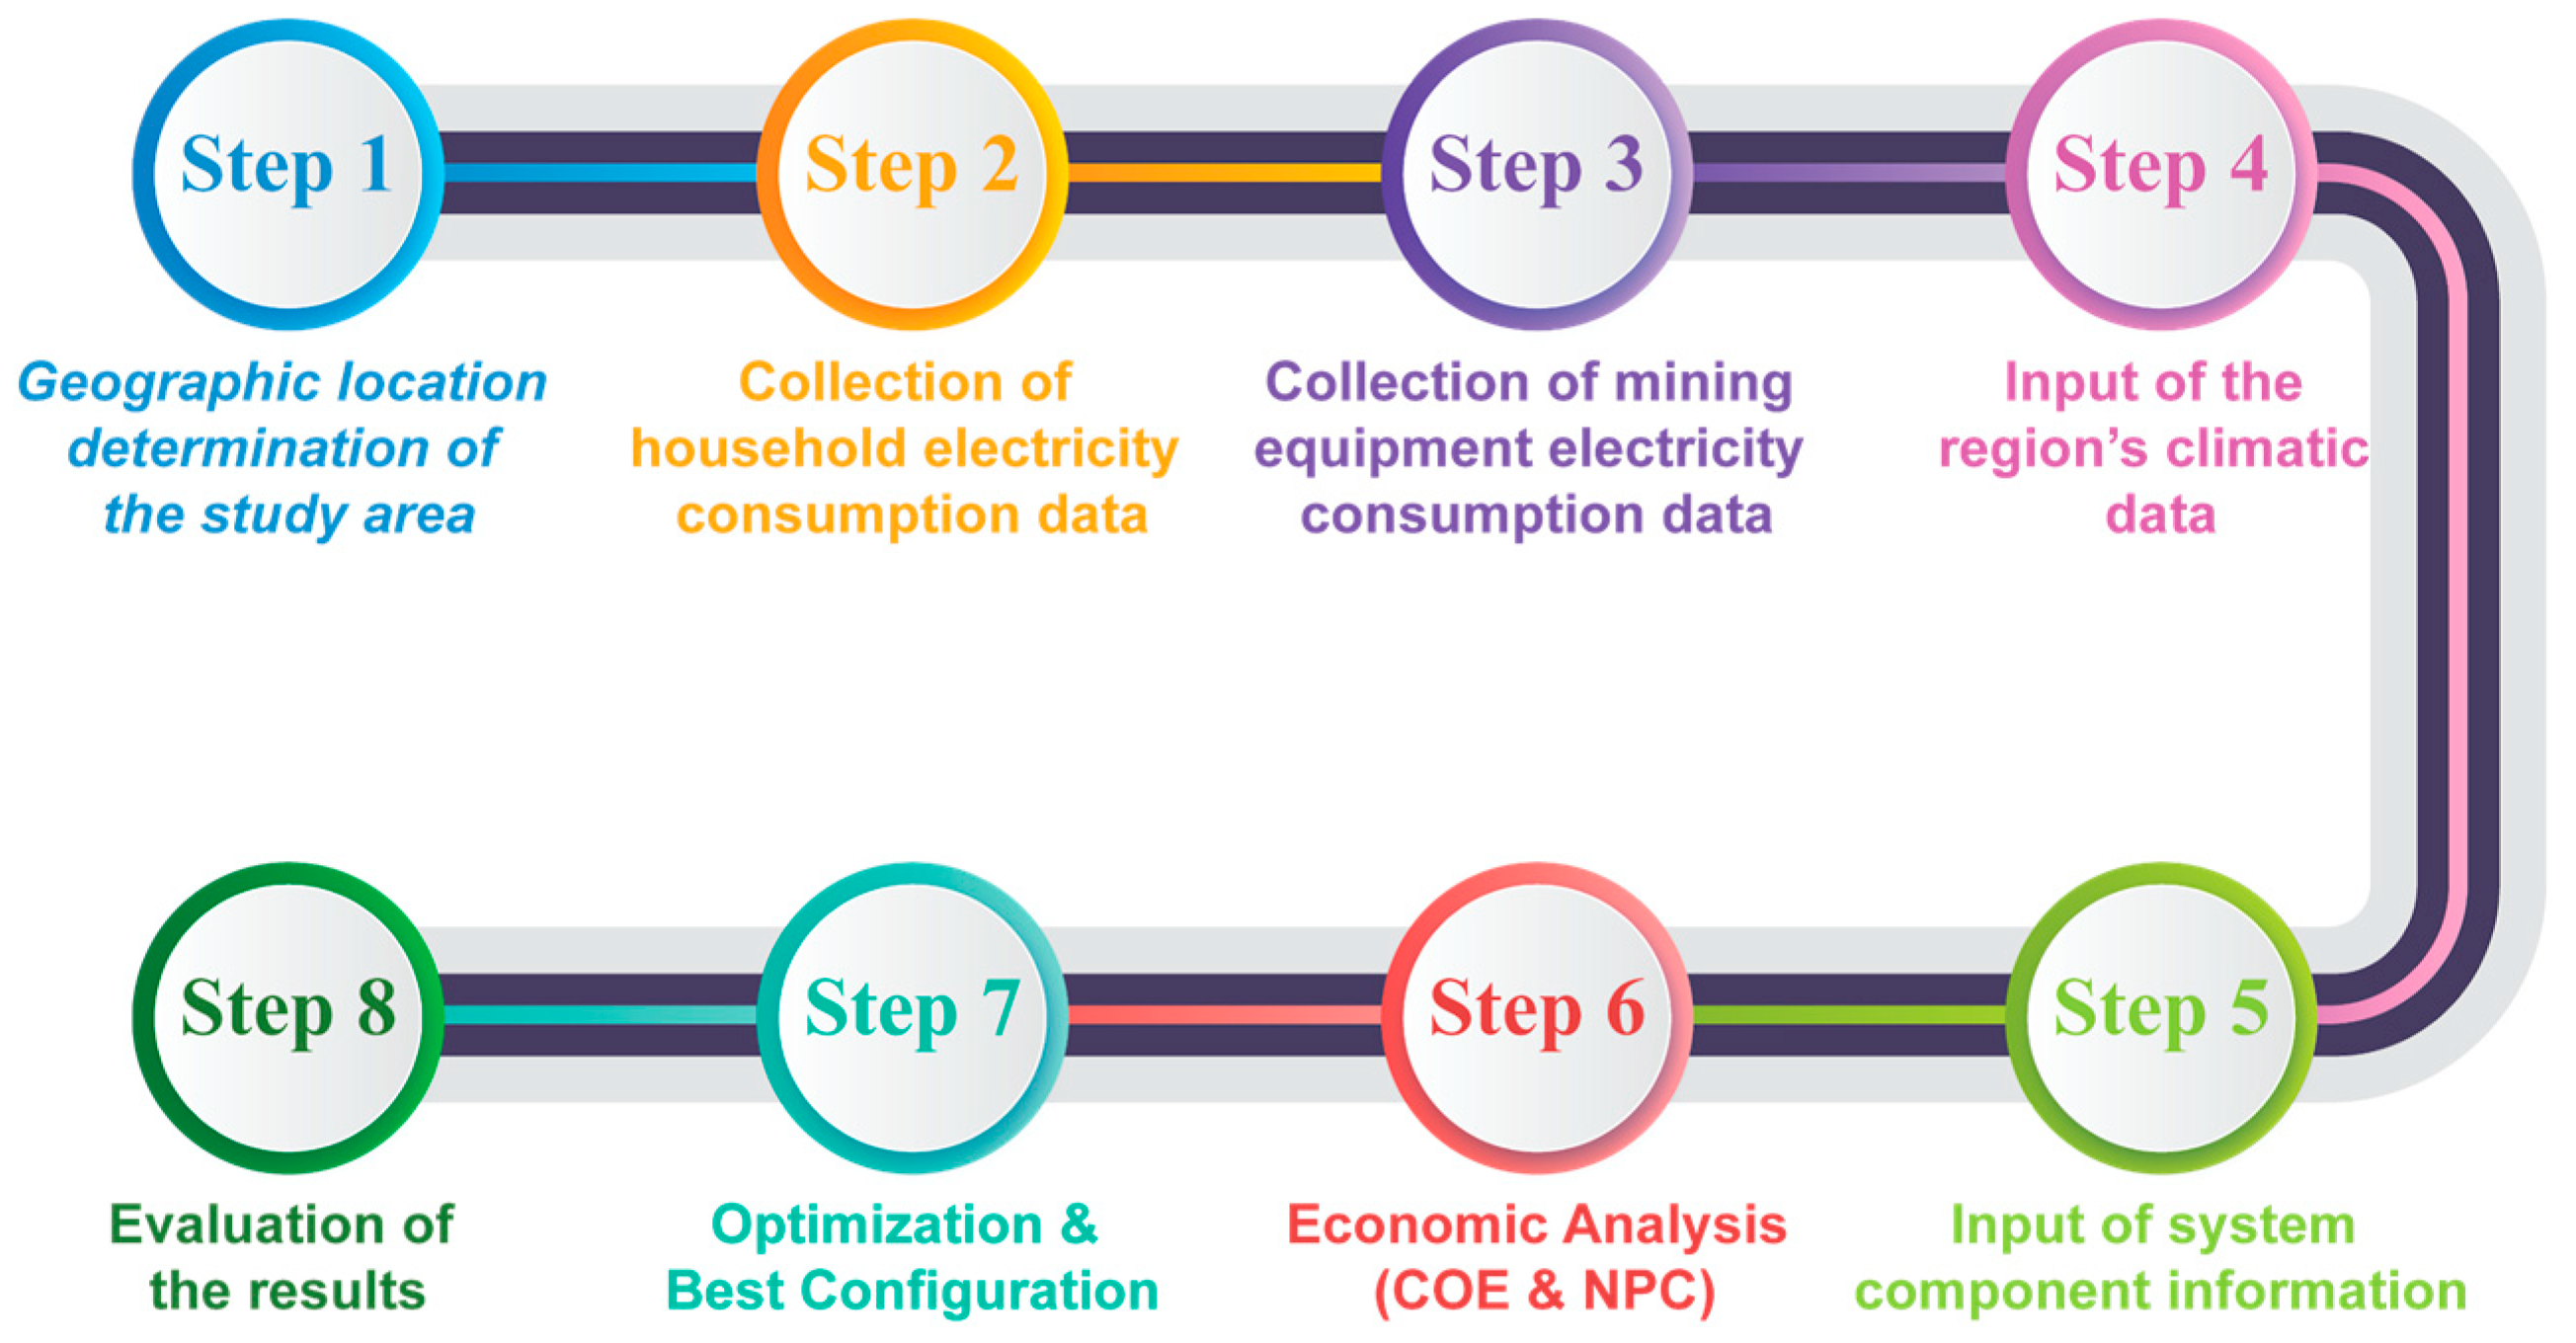
3.3.4. Simulation Process
4. Proposed Optimization Algorithm
4.1. Algorithm Design
4.1.1. Algorithm Structure
- Step 1: Input Data Initialization
- Renewable energy data (solar irradiance and wind speed).
- System load profiles (urban and cryptocurrency mining load).
- Technical specifications and costs for PV panels, wind turbines, diesel generator, storage system, and power converter system.
- Minimum operating reserve (percent/solar output power)
- Energy system project lifetime (years)
- Economic data such as capital cost, operational cost, fuel prices, nominal discount rate (percent) and inflation rate (percent).
- Step 2: Renewable Energy Generation Calculation
- Step 3: Non-Renewable Energy Generation Calculation
- Step 4: Load Demand Assessment
- Step 5: Energy Balance and Diesel Generator Dispatch
- If , then no diesel generation is required.
- If , then the diesel generator is activated to supply the deficit .
- Step 6: Economic Analysis
- Step 7: Optimization and Selection of Best Configuration
4.1.2. Flowchart of the Algorithm
4.2. Innovation and Advantages
4.2.1. Integration of Cryptocurrency Mining with Renewable Energy Systems
4.2.2. Dynamic Energy Management Based on Real-Time Data
4.2.3. Advanced Economic Considerations: Maximizing ROI
4.2.4. Comparison with Existing Algorithms
- Comprehensive Load Management: Traditional algorithms often focus on either renewable energy integration or general energy cost minimization. In contrast, our approach specifically addresses the complexities of high-energy-consumption operations like cryptocurrency mining, which are often ignored in conventional algorithms.
- Dual Optimization Focus: Many existing algorithms prioritize either technical performance (such as system efficiency) or financial metrics (such as cost minimization). Our algorithm offers a dual focus, optimizing both technical performance (ensuring maximum use of renewable resources) and economic benefits (through cost-effective energy distribution and increased cryptocurrency mining profitability).
- Scalability: The proposed method is highly scalable, allowing it to be adapted for various energy systems and mining setups, ranging from small-scale hybrid systems to large-scale industrial applications.
4.2.5. Benefits of the Proposed Algorithm
- Improved Energy Utilization: By dynamically managing the energy supply in response to real-time renewable energy generation and cryptocurrency mining demand, the proposed algorithm ensures more efficient energy use, reducing unnecessary energy storage or fossil fuel consumption.
- Cost Savings and Reduced Emissions: Increased reliance on renewable energy resources not only results in significant cost savings for mining operations but also contributes to lower greenhouse gas emissions by reducing dependence on diesel generators or other fossil-fuel-based energy sources.
- Enhanced Flexibility: The flexibility of the proposed algorithm, which can adapt to market changes in energy prices and cryptocurrency values, ensures that the system remains profitable even under variable conditions, providing an additional layer of robustness compared to traditional models.
5. Case Study
5.1. System Description
5.1.1. Location and Climate Data
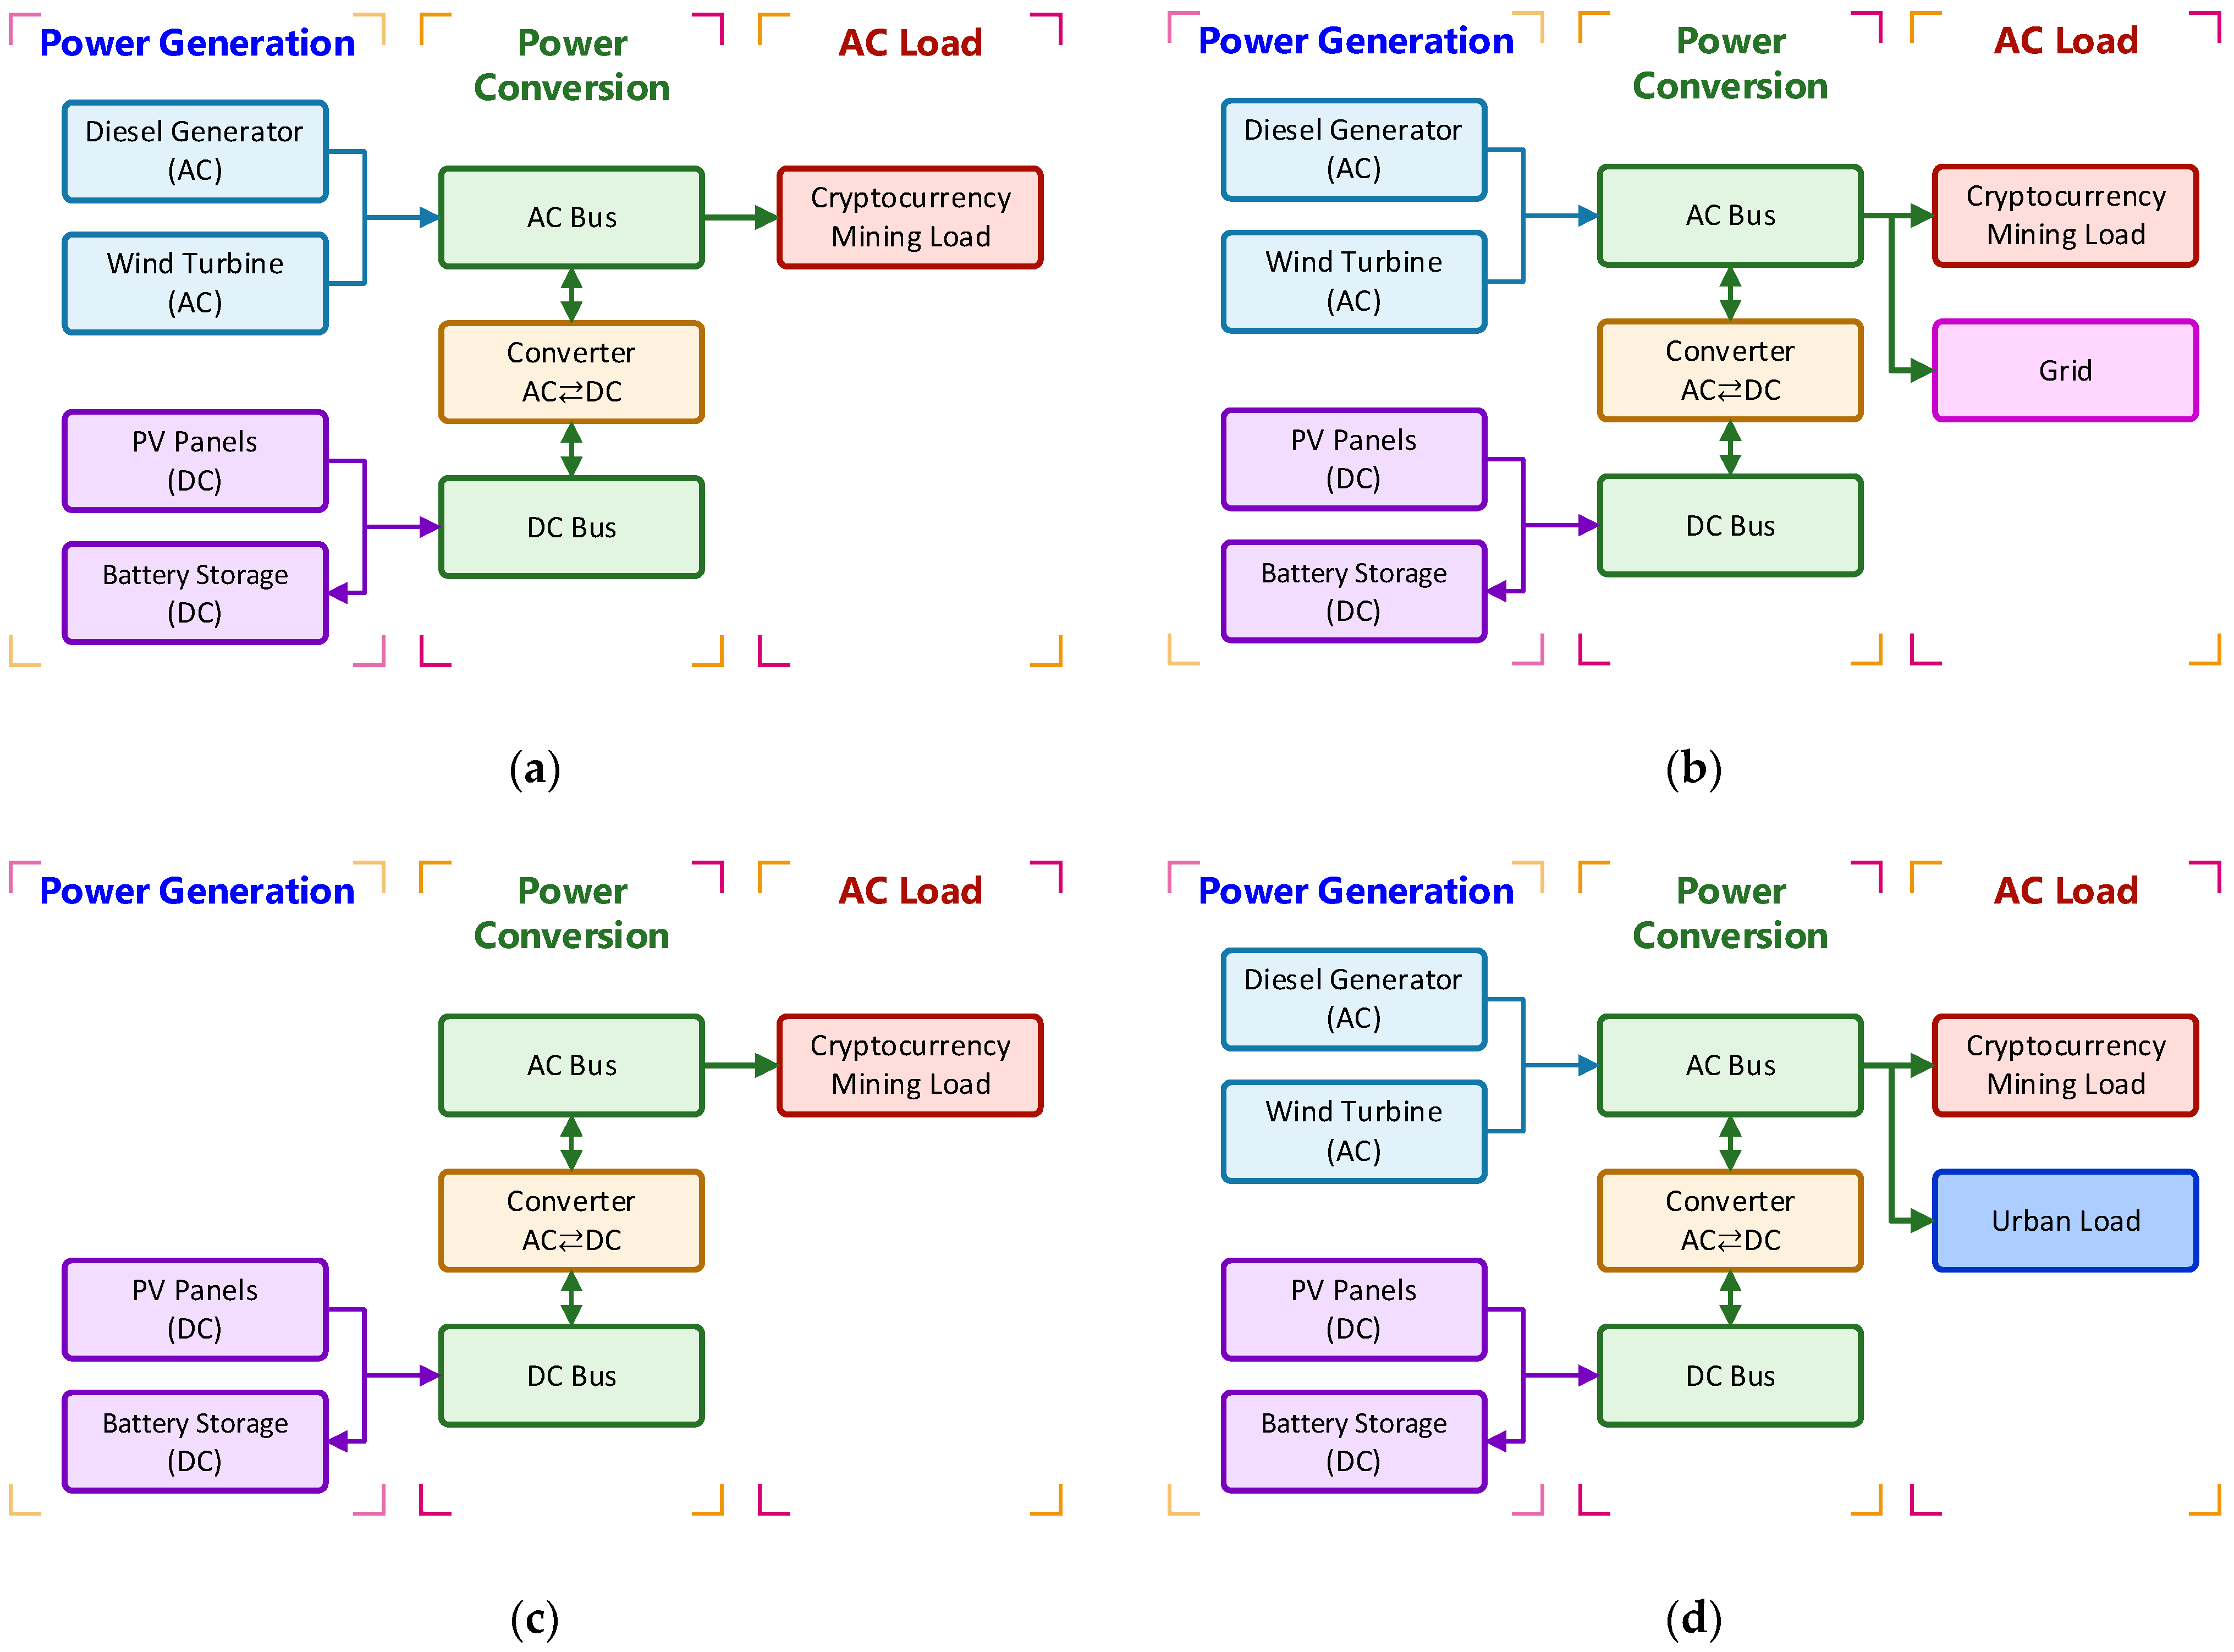
5.1.2. Components of the Hybrid Energy System
- PV Panels: The system employs high-efficiency solar panels as the primary source of renewable energy. These panels are positioned to maximize solar exposure throughout the day and contribute significantly to the overall energy mix, especially during daylight hours.
- Wind Turbines: To complement the solar energy system, wind turbines are integrated into the system to harness the region’s wind energy, particularly during nighttime and low solar irradiance periods. The combination of solar and wind energy ensures a more balanced and continuous renewable energy supply.
- Diesel Generator: A diesel generator serves as a backup power source, ensuring energy availability during periods of low renewable energy generation (e.g., during prolonged cloudy or windless days). The generator is configured to operate only when necessary, minimizing fuel consumption and operational costs.
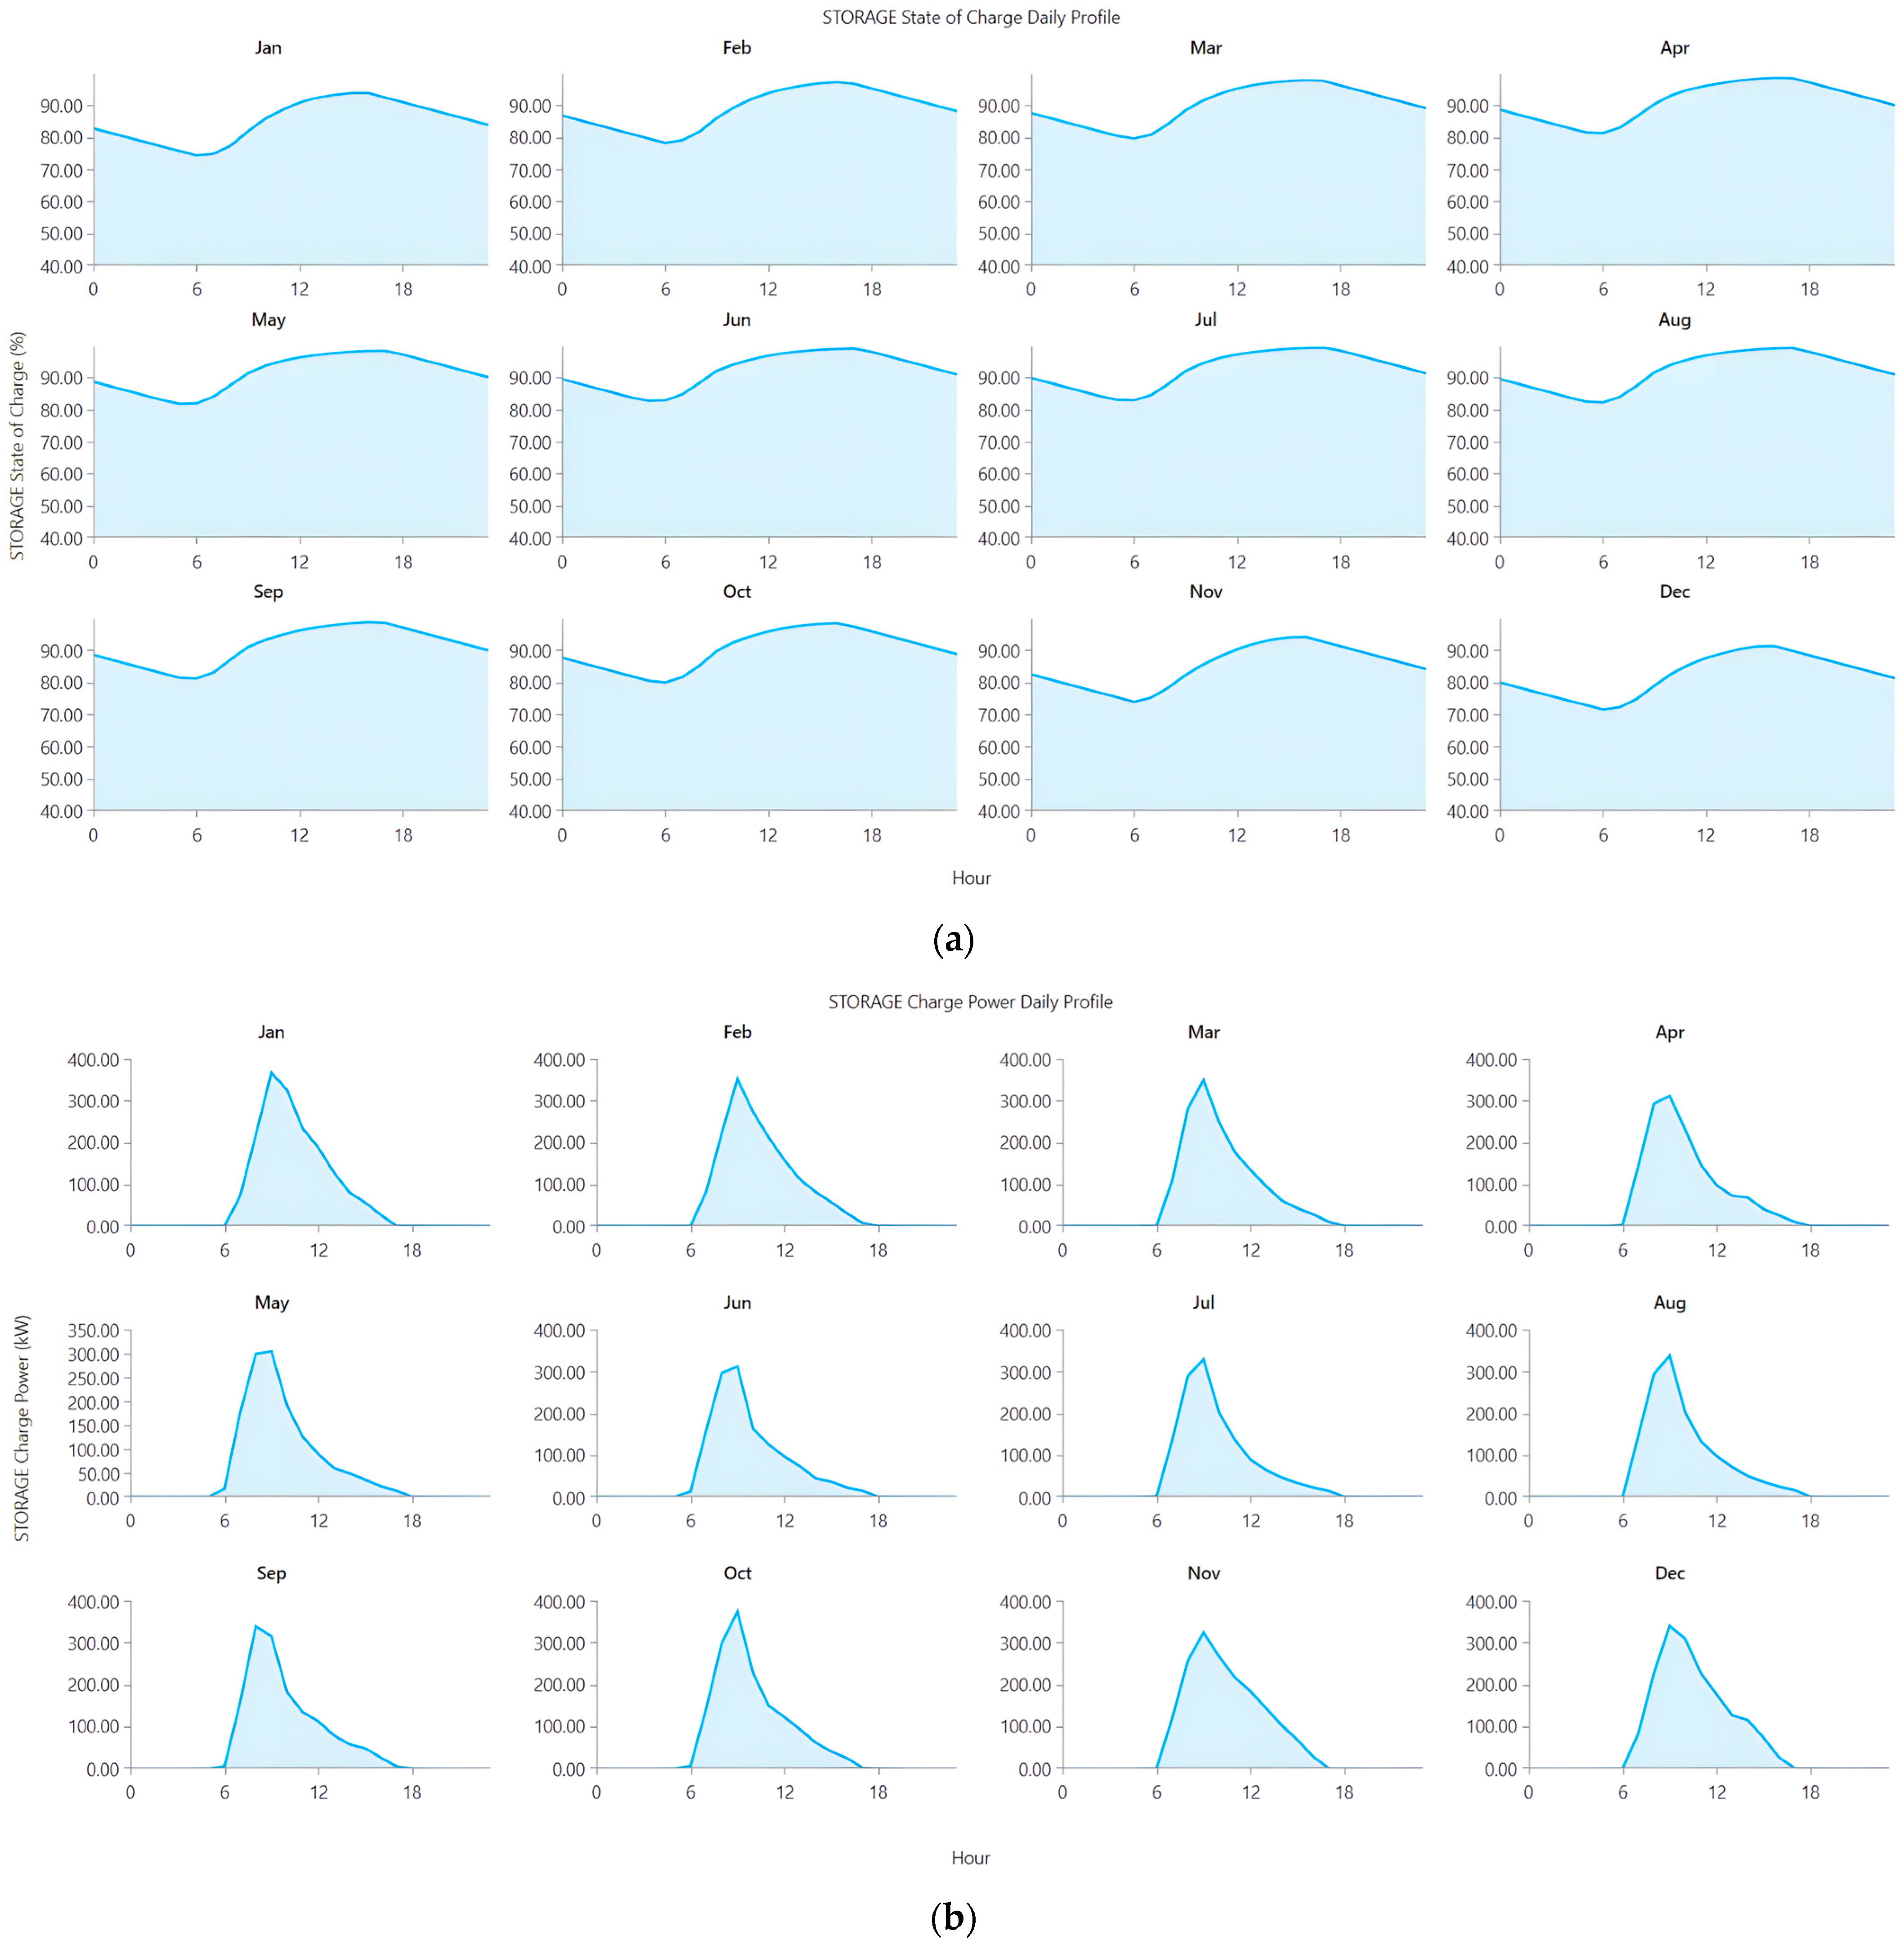
- Battery Storage System: A battery energy storage system is installed to store excess energy generated during peak renewable energy production periods. This stored energy is used to power the mining operation and the local grid during times of low renewable generation or high demand, optimizing system efficiency and reliability.
- Power Converter: The system includes a power converter to manage the alternating current (AC) and direct current (DC) flows between the various components, ensuring seamless integration between renewable sources, the diesel generator, and the local loads.
5.1.3. Load Profile
- Urban Load: The urban load primarily consists of residential and commercial energy demands, which are relatively stable throughout the day but experience peaks in the morning and evening. This load requires a continuous and reliable energy supply.
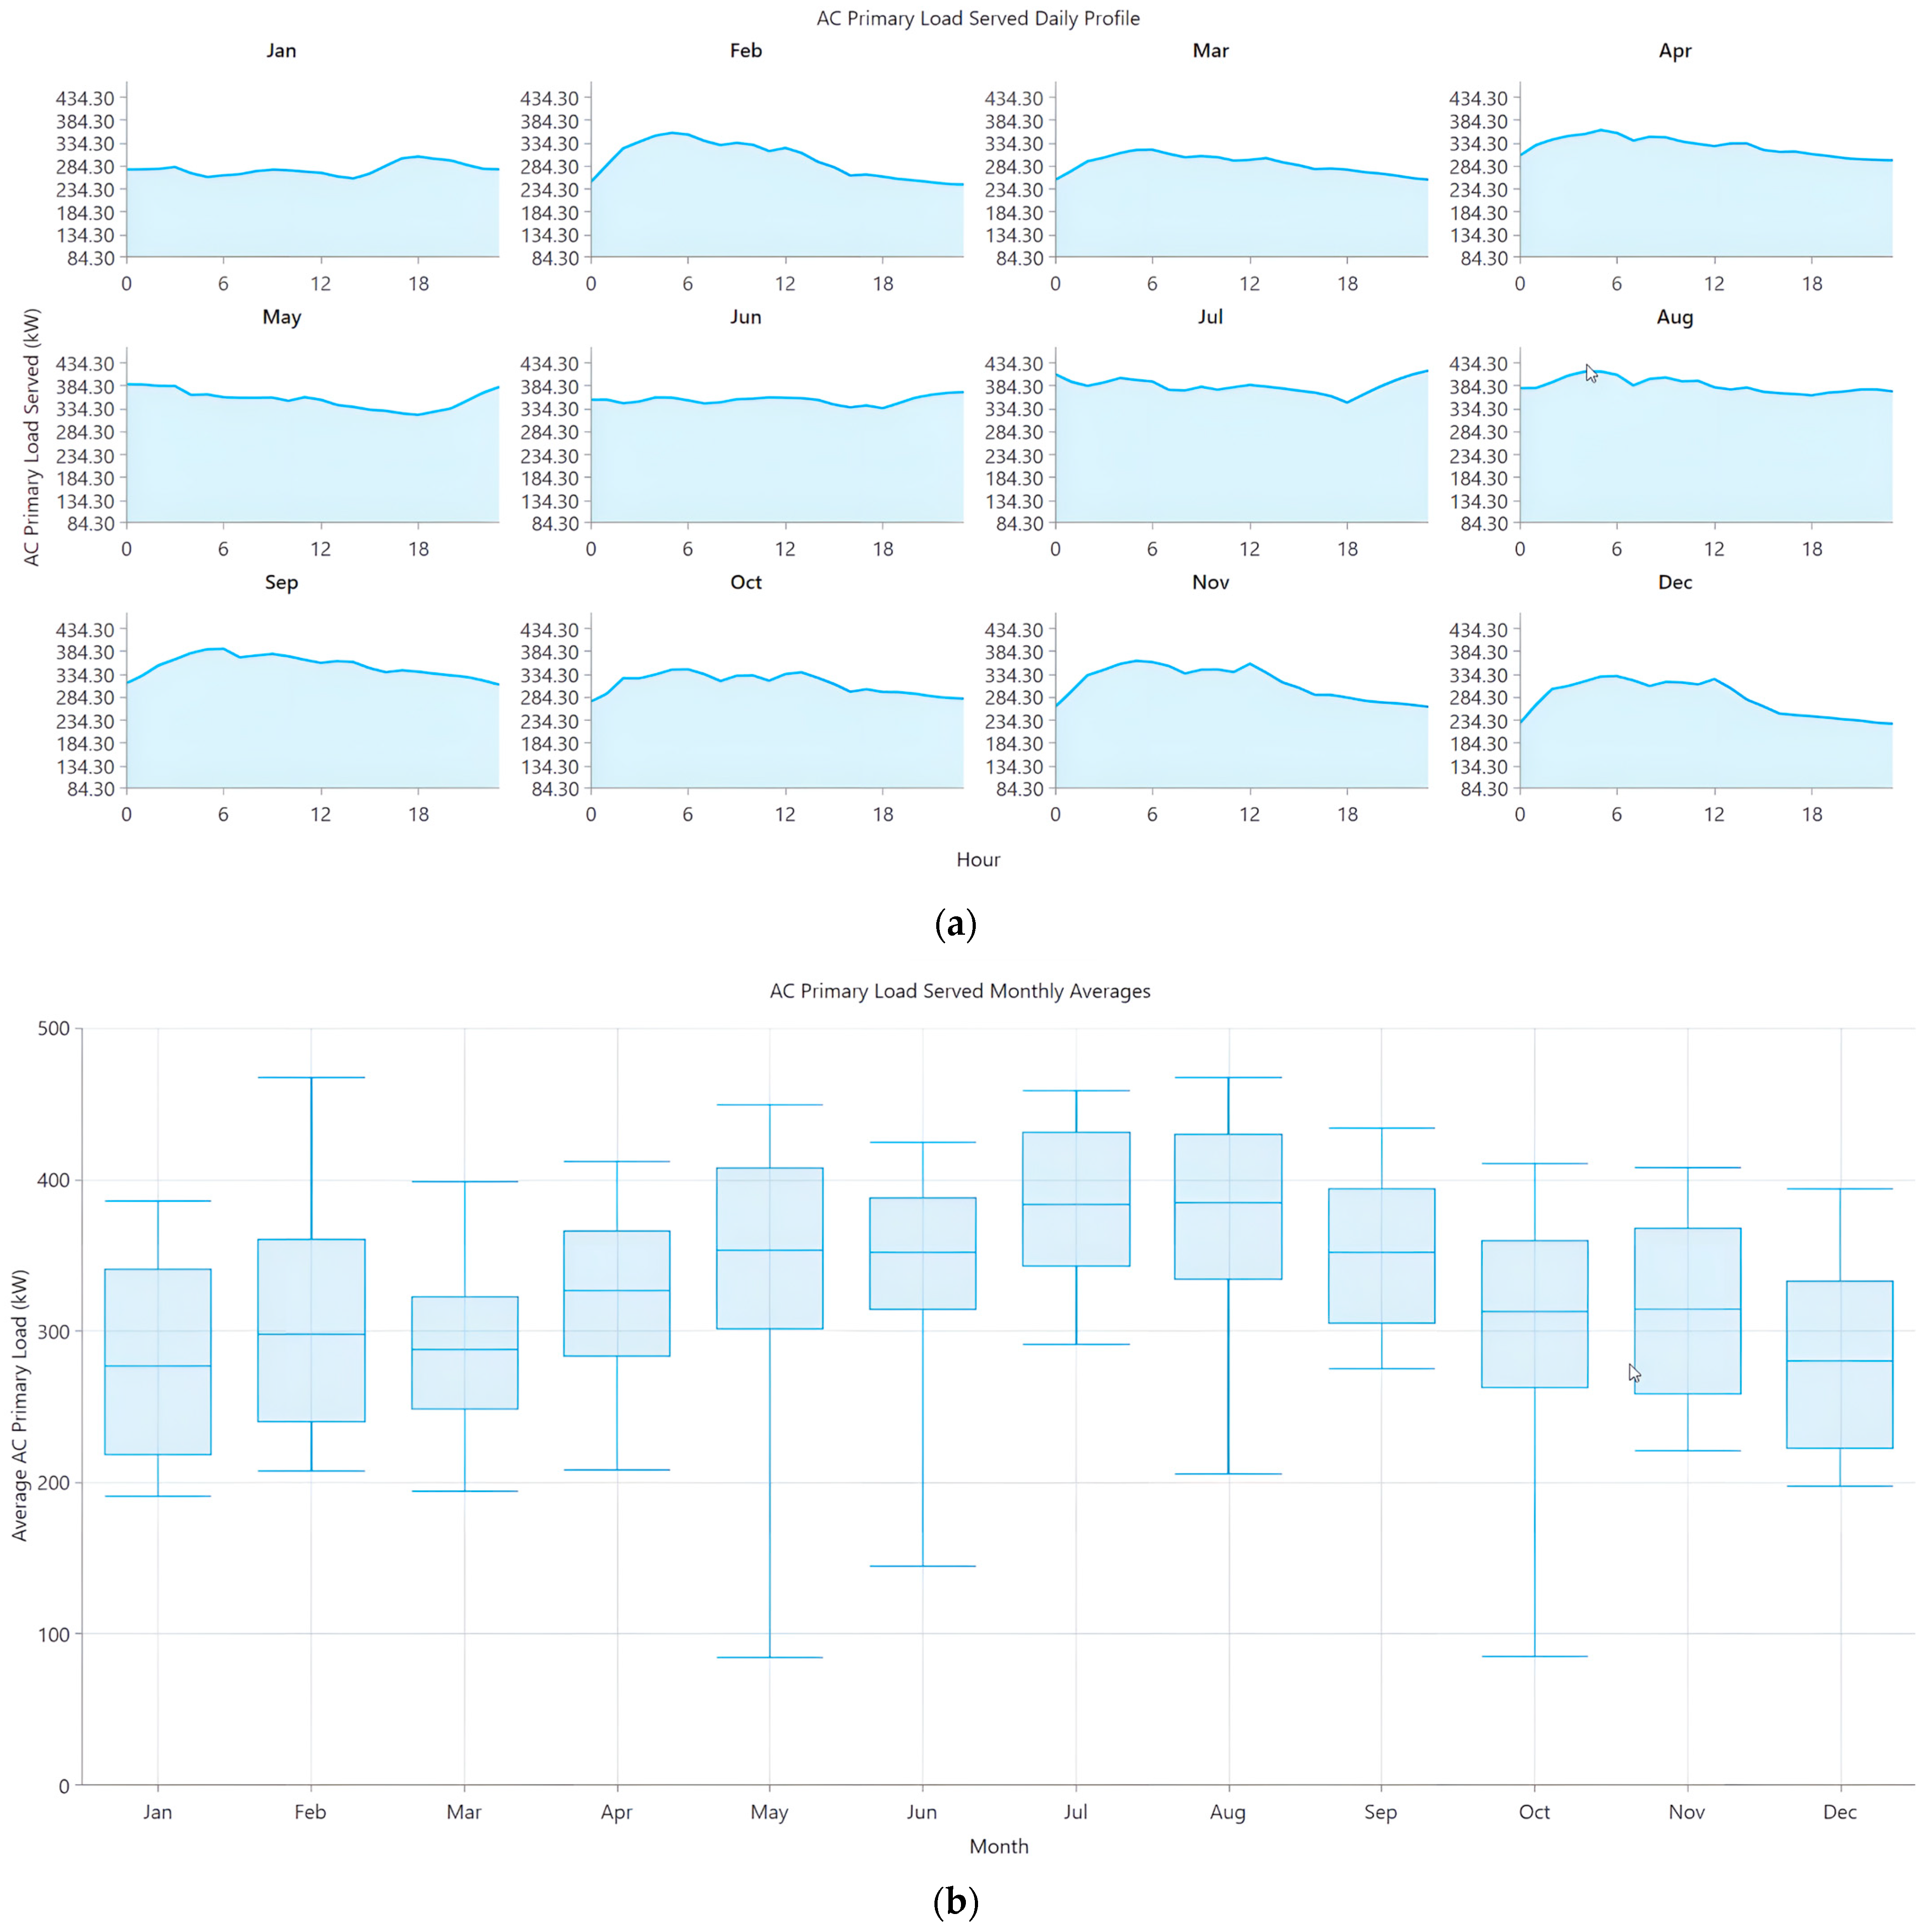
- Cryptocurrency Mining Cooling Loads: The cryptocurrency mining farm, which runs equipment for digital coin mining, creates a high, continuous, and energy-demanding load. The mining hardware, along with its cooling systems, operates 24/7, requiring a stable power supply to ensure profitability. While energy consumption levels can vary depending on the specific system configurations and operational approaches, they remain consistently substantial, making up a significant portion of the total system’s energy demand.
5.1.4. System Configuration and Optimization Objectives
- Maximization of Renewable Energy Utilization: The system aims to utilize as much energy from renewable sources as possible to minimize the dependence on the diesel generator, thus reducing fuel costs and carbon emissions.
- Minimization of Operating Costs: By prioritizing renewable energy and optimizing the operational schedule of the diesel generator and battery system, the system reduces operational and maintenance costs, especially in the context of cryptocurrency mining, which benefits from lower energy costs.
- Reliability and Stability: The system is configured to ensure a reliable power supply, particularly to the mining farm, where even short disruptions in power can lead to significant financial losses.
5.2. Scenario Analysis
5.2.1. Scenario 1: Base Case—Optimized System with Local Fuel Prices
- The use of locally subsidized diesel fuel prices.
- Renewable energy generation based on historical solar irradiance and wind speed data for Kashan.
- Continuous operation of the cryptocurrency mining farm with a steady load.
- Non-renewable energy sources (diesel generators) supply a significant portion of the total energy demand.
- The system achieves a balance between cost-effectiveness and energy reliability, with a favorable ROI for mining loads.
5.2.2. Scenario 2: High Fuel Prices—Optimized System with Global Diesel Price
- The increase in fuel prices significantly impacts the operating costs of the system, particularly during periods of low renewable energy production.
- The optimization algorithm shifts to prioritize renewable energy sources even further, reducing the diesel generator’s runtime to mitigate high fuel costs.
- Battery storage becomes even more critical in ensuring the system’s cost-efficiency, as it helps reduce dependency on expensive diesel power.
- The overall system costs increase, and the profitability of cryptocurrency mining decreases.
5.2.3. Scenario 3: High Mining Energy Sales to the National Grid During Peak Summer Months
5.2.4. Scenario 4: PV—Only Microgrid with Battery Storage
- The system operates without fossil fuels, resulting in zero emissions, but its performance is dependent on consistent sunlight, with limited energy storage for cloudy days.
5.2.5. Scenario 5: Hybrid Load—Combined Urban and Mining Load Optimization
- The hybrid load scenario demonstrates the system’s flexibility in meeting both urban and mining energy needs through dynamic resource allocation.
- The optimization algorithm effectively balances the intermittent supply of energy with the fluctuating urban load while stabilizing the constant energy demand of the mining farm.
5.2.6. Scenario 6: Model Validation and Parametric Adjustments for Diverse Climates
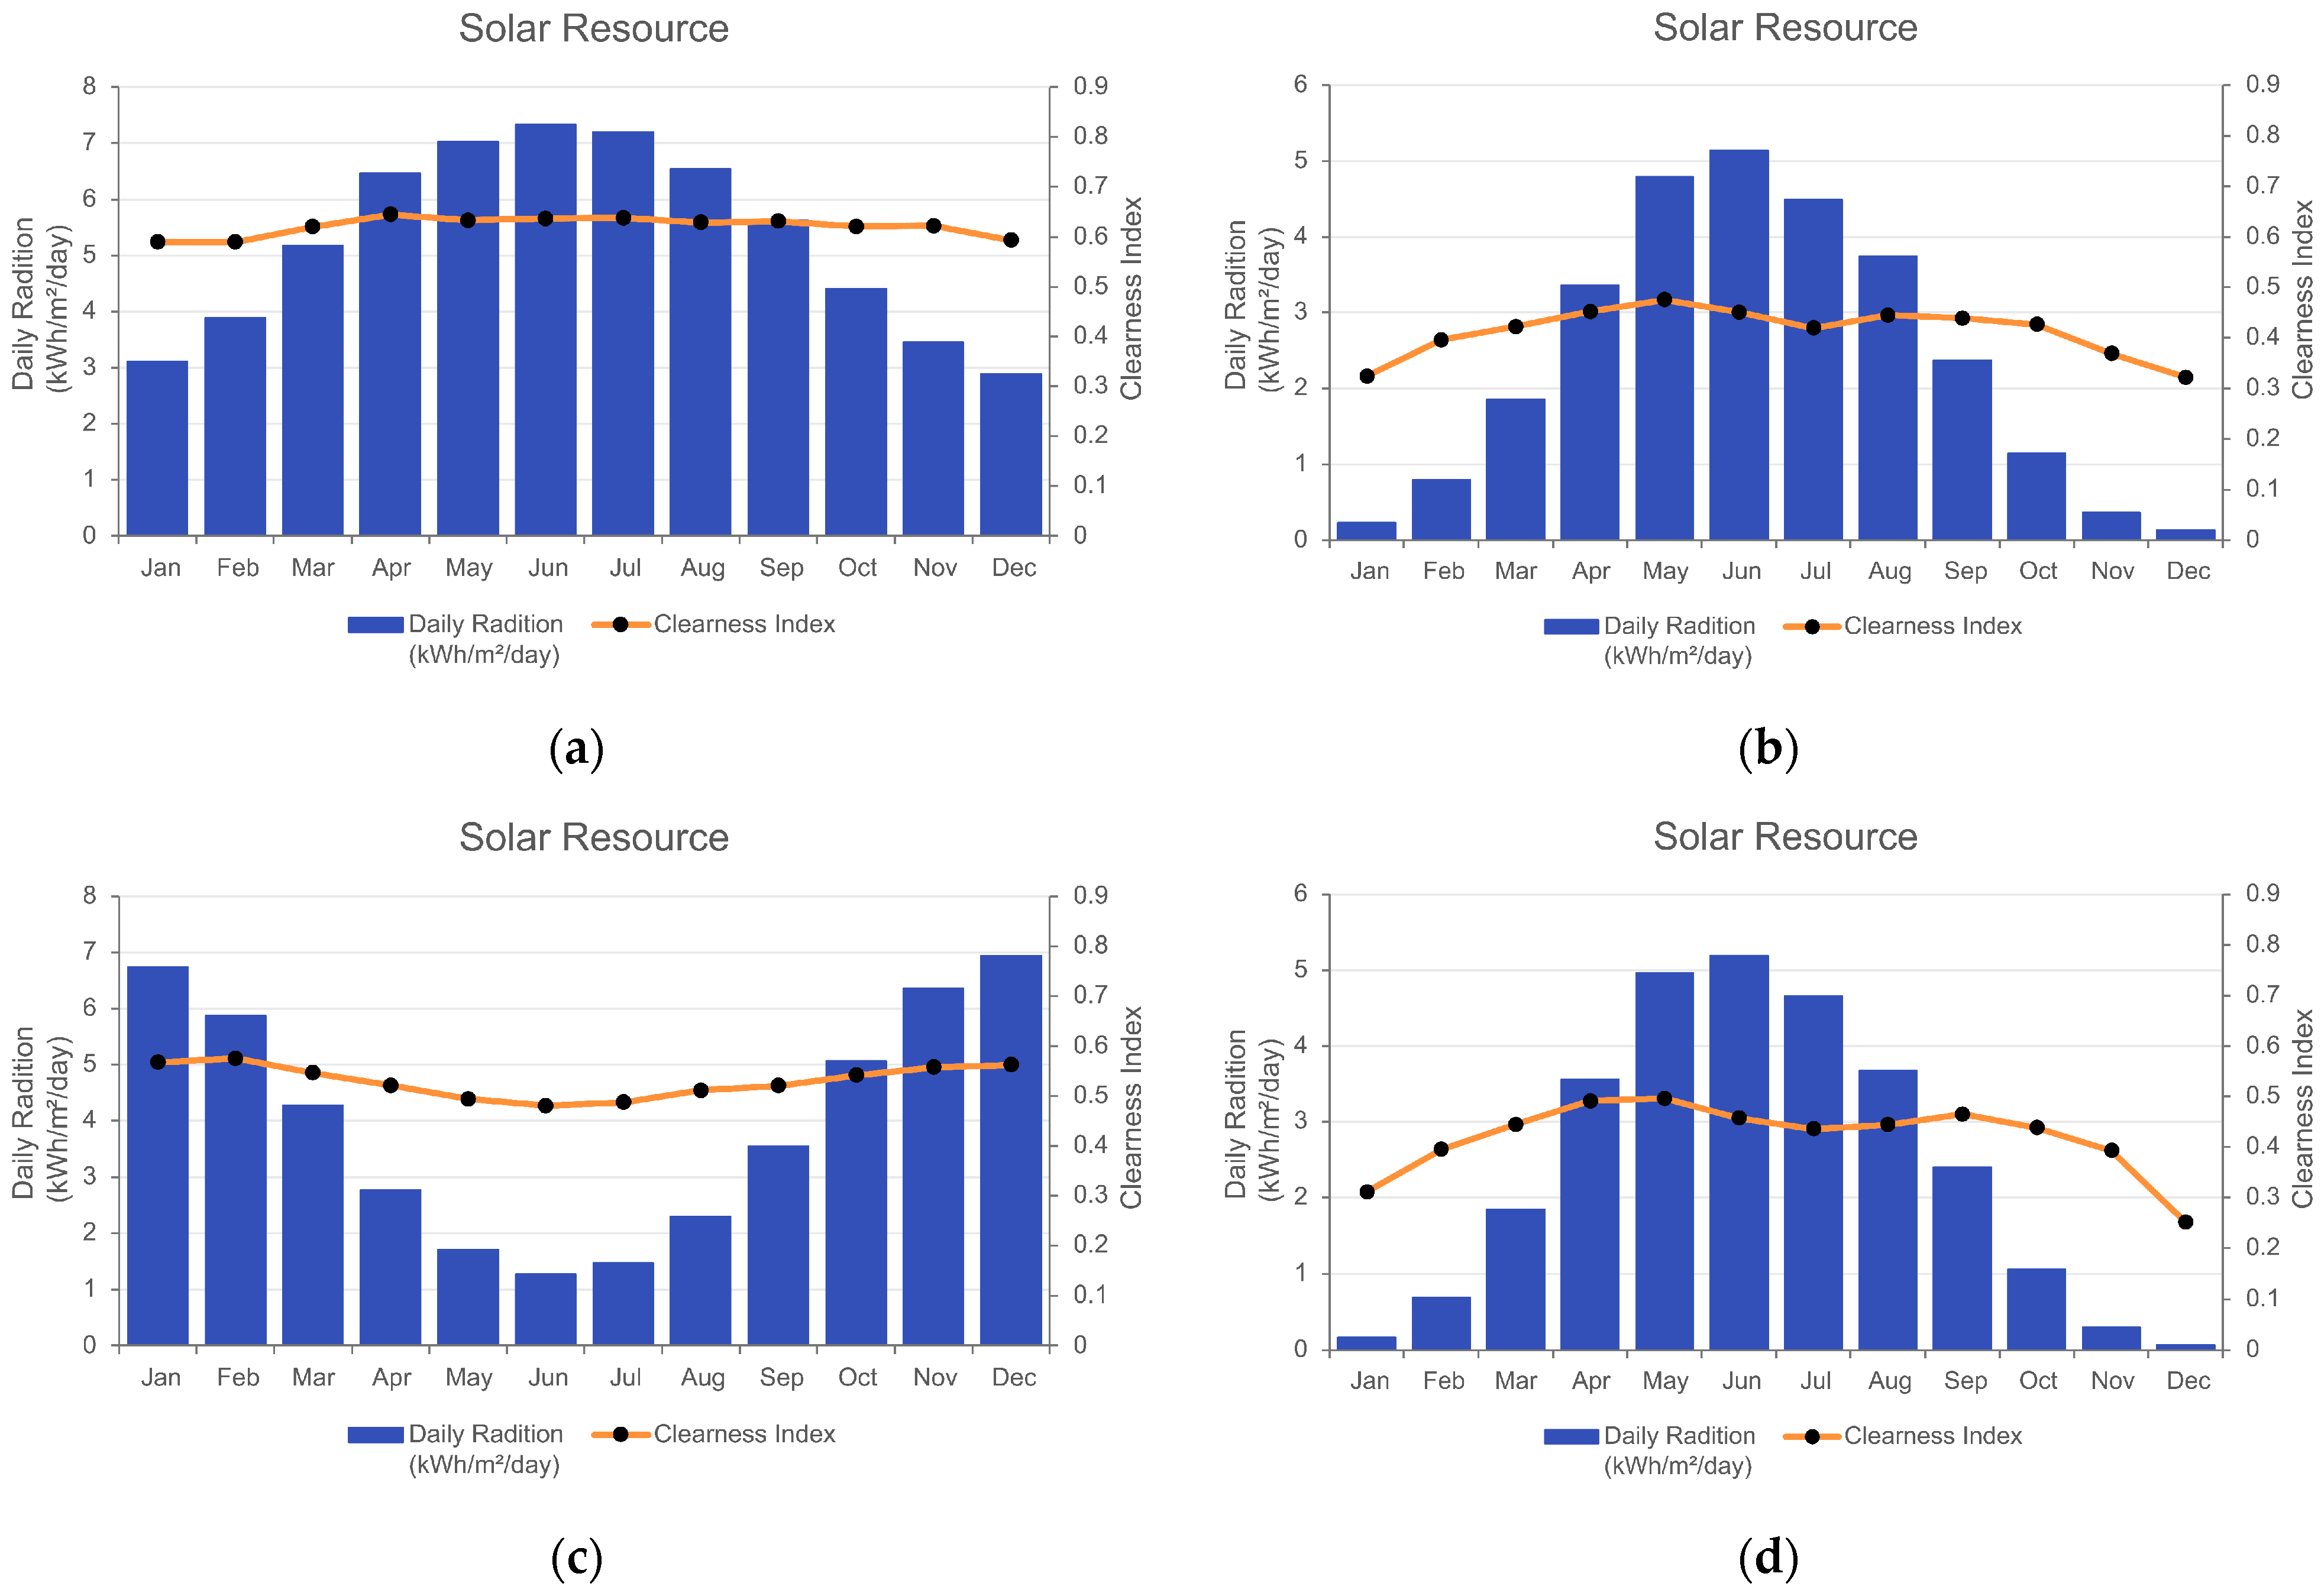
- Adjustments to PV capacity factors were made to reflect differences in solar irradiance between high-latitude and low-latitude regions.
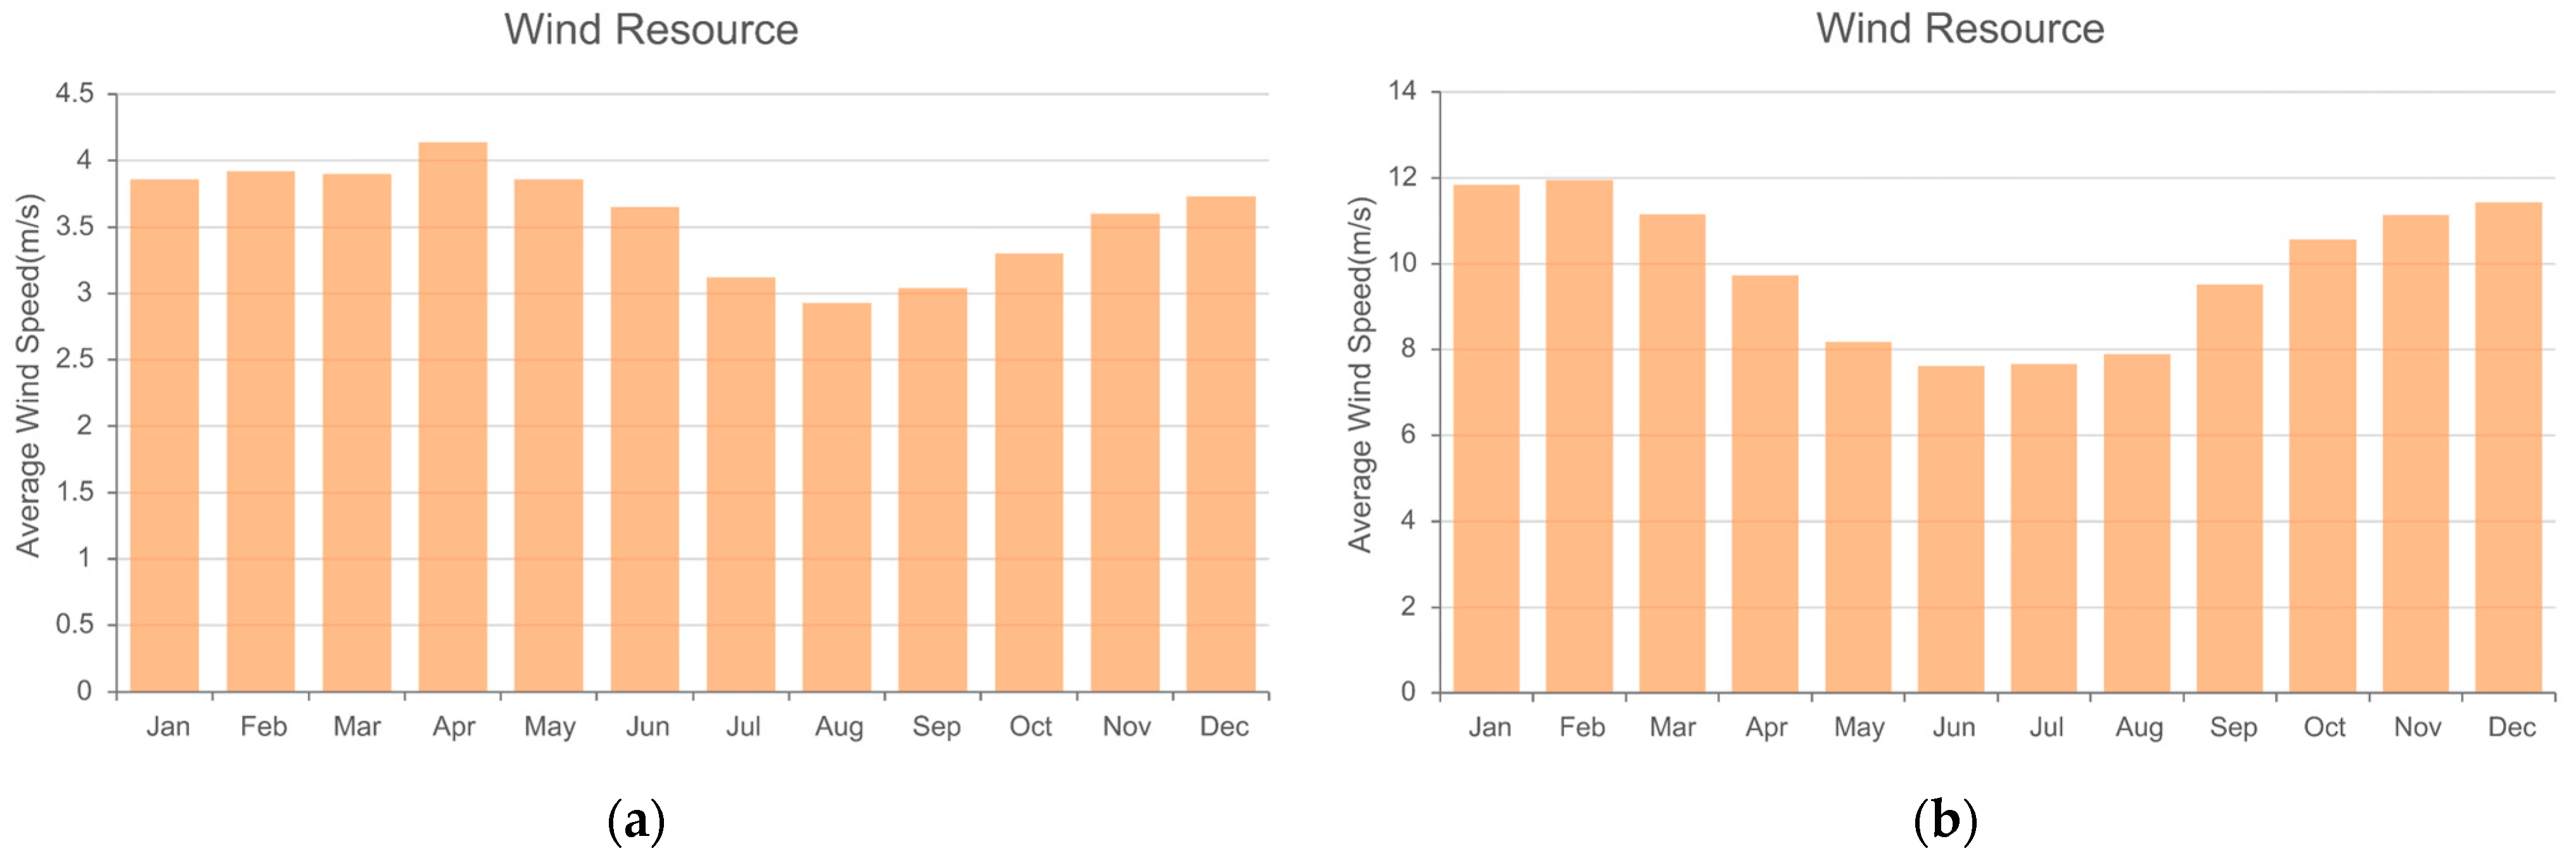
- Wind turbine output estimations incorporated local wind speed variations using standard power curves to assess impacts on diesel fuel consumption.
- These parametric adjustments enable the model to better represent diverse environmental conditions, enhancing its generalizability.
5.2.7. Scenario 7: Flexible Crypto Mining and System Resilience Under Renewable and Fuel Price Uncertainty
5.2.8. Scenario 8: Seasonal Energy Configuration for Enhanced Mining and System Performance
- Utilizing generator capacity more strategically through CD logic to charge storage when beneficial;
- Responding dynamically to seasonal shifts in mining load;
- Leveraging internal cost minimization routines to favor renewable dispatch when economically and technically feasible.
5.3. Simulation Results
5.3.1. Scenario 1: Base Case—Optimized System with Local Fuel Prices
- Total Energy Production: The system produced 805 MWh/year, with renewable energy sources contributing 0% of the total demand.
- Renewable Energy Utilization: The system achieved a high utilization of non-renewable energy.
- Fuel Consumption: The diesel generator consumed 322,291 L of fuel per year.
- Cost and ROI: The total annual operational cost, including fuel and maintenance for the energy system, amounted to $14,920. The ROI was favorable, with a payback period of approximately 1 year due to the local fuel prices.
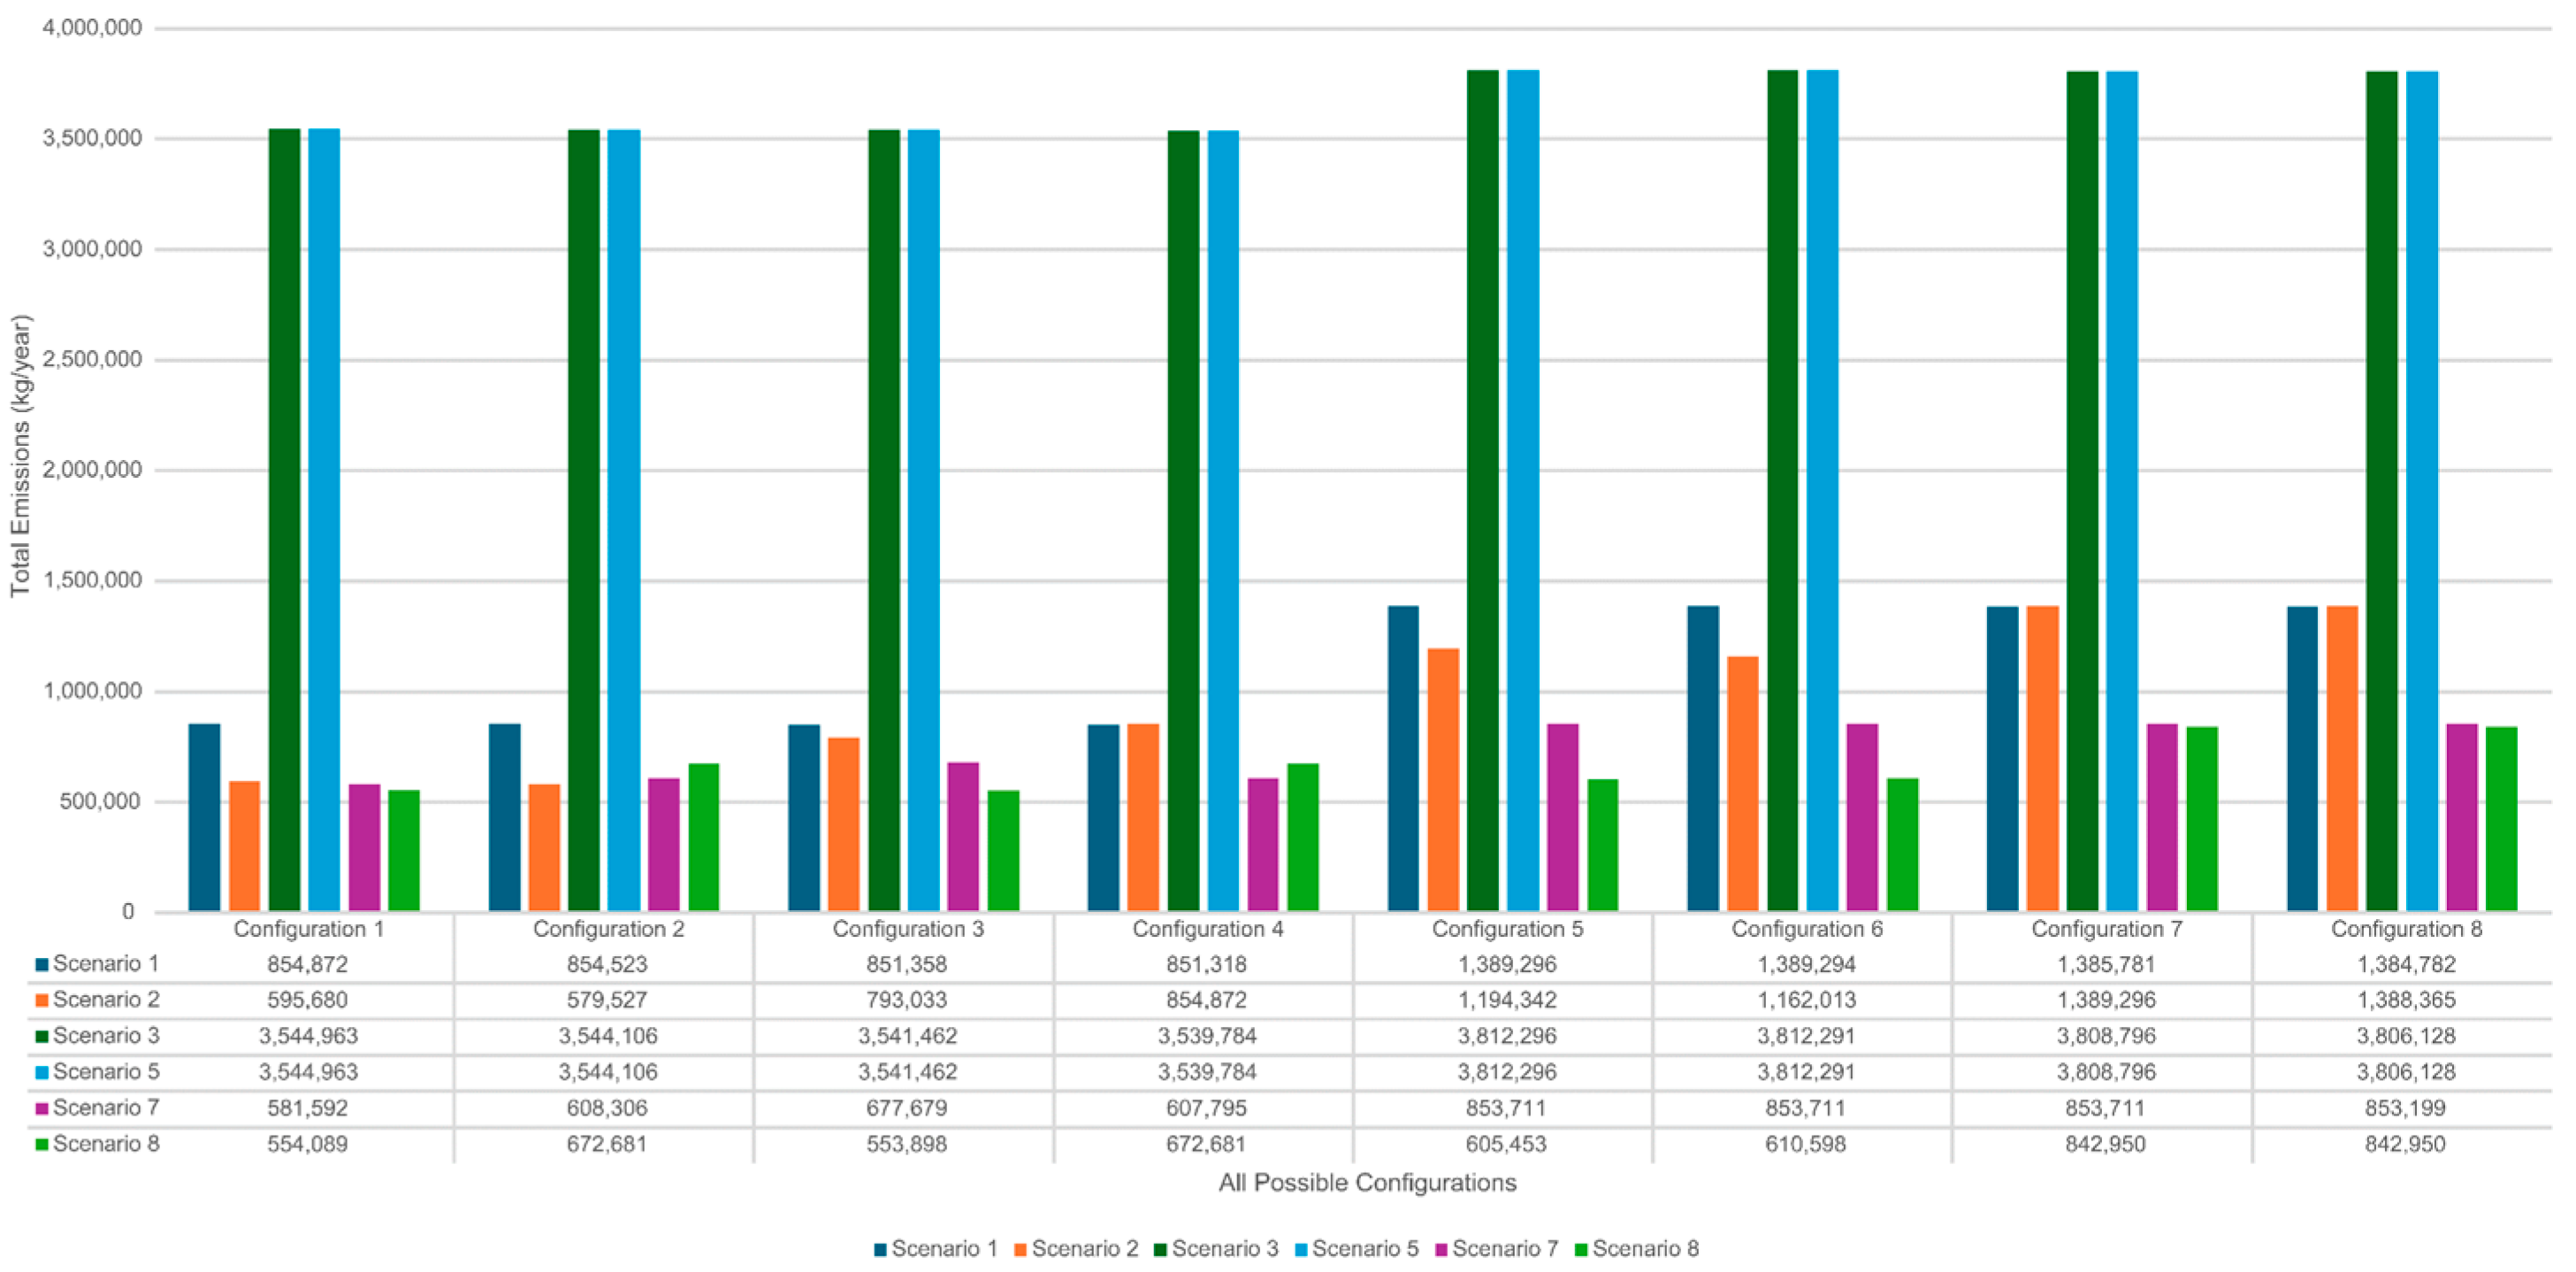
- Emissions: The system’s extensive use of diesel systems results in substantial greenhouse gas emissions of approximately 854,872 kg per year, causing significant environmental damage.
5.3.2. Scenario 2: High Fuel Prices—Optimized System with Global Diesel Price
- Total Energy Production: The total energy output remained consistent at 914 MWh/year, but the cost implications of diesel price increases were more pronounced.
- Renewable Energy Utilization: The optimization algorithm was adjusted to maximize renewable energy usage, resulting in a higher renewable energy contribution of 37.7%, as the system aimed to reduce fuel consumption.
- Fuel Consumption: Diesel consumption decreased to 224,574 L per year as the system minimized generator use to mitigate the impact of higher fuel prices.
- Cost and ROI: Despite reducing fuel consumption, the annual operational costs increased to $68,670 due to the higher fuel prices. The ROI remained positive, though the payback period was extended to 20 years due to the additional fuel expenses.
- Emissions: The system reduced carbon emissions by 49% compared to a fully diesel-powered system, contributing significantly to environmental sustainability.
5.3.3. Scenario 3: High Mining Energy Sales to the National Grid During Peak Summer Months
- Total Energy Production: The system produced 805 MWh/year, with approximately 1.1% of the energy generated by renewable sources (solar and wind) and the remaining 98.9% provided by the diesel generator.
- Renewable Energy Utilization: The system achieved a high utilization of non-renewable energy, with PV panels contributing 0.012% and wind turbines contributing 1.1% of the total energy demand. The remaining energy came from the diesel generator.
- Fuel Consumption: The diesel generator consumed 320,000 L of fuel per year.
- Cost and ROI: The total annual operational cost, including fuel and maintenance, amounted to $15,877. The ROI was favorable, with a payback period of more than 1 year.
- Emissions: The system’s extensive use of diesel systems results in substantial greenhouse gas emissions of approximately 854,872 kg per year, causing significant environmental damage.
5.3.4. Scenario 4: PV—Only Microgrid with Battery Storage
- Total Energy Production: The system produced 1800 MWh/year, with a total of 100% of the energy generated by the PV.
- Renewable Energy Utilization: Renewable energy generation increased to 100%.
- Fuel Consumption: Diesel fuel consumption dropped significantly to 0 L per year as the generator was not in this scenario.
- Cost and ROI: Energy O&M costs increased to $502,000, reflecting increased demand for battery energy storage. Mining profits still generate a negative overall ROI.
- Emissions: By completely replacing fossil fuels with renewable energy, carbon emissions have been reduced to zero.
5.3.5. Scenario 5: Hybrid Load—Combined Urban and Mining Load Optimization
- Total Energy Production: The system produced 2865 MWh/year, with renewable energy sources contributing 0% of the total demand.
- Renewable Energy Utilization: PV panels and wind turbines did not contribute to the supply, while the diesel generator supplied 100%. The battery storage system played a backup role in managing peak loads and reducing the need for diesel during high-demand periods.
- Fuel Consumption: Diesel consumption was optimized at 1,336,469 L per year, as the system prioritized the use of non-renewable energy for both loads because of the fuel subsidy.
- Cost and ROI: The energy system’s operational costs were $70,541 per year, and due to subsidized local fuel prices, the system achieved a favorable payback period of 1.4 years.
- Emissions: This system’s carbon emissions increase by approximately 400% compared to systems with only a mining load connected to it. That is because the urban load is connected to the microgrid.
5.3.6. Scenario 6: Model Validation and Parametric Adjustments for Diverse Climates
- Total Energy Consumption: Total electrical demand—including mining operations and cooling requirements—remained constant across all evaluated sites, reaching approximately 91.94 kW, with 17.34 kW specifically allocated for cooling systems (η = 0.7, COP = 4).
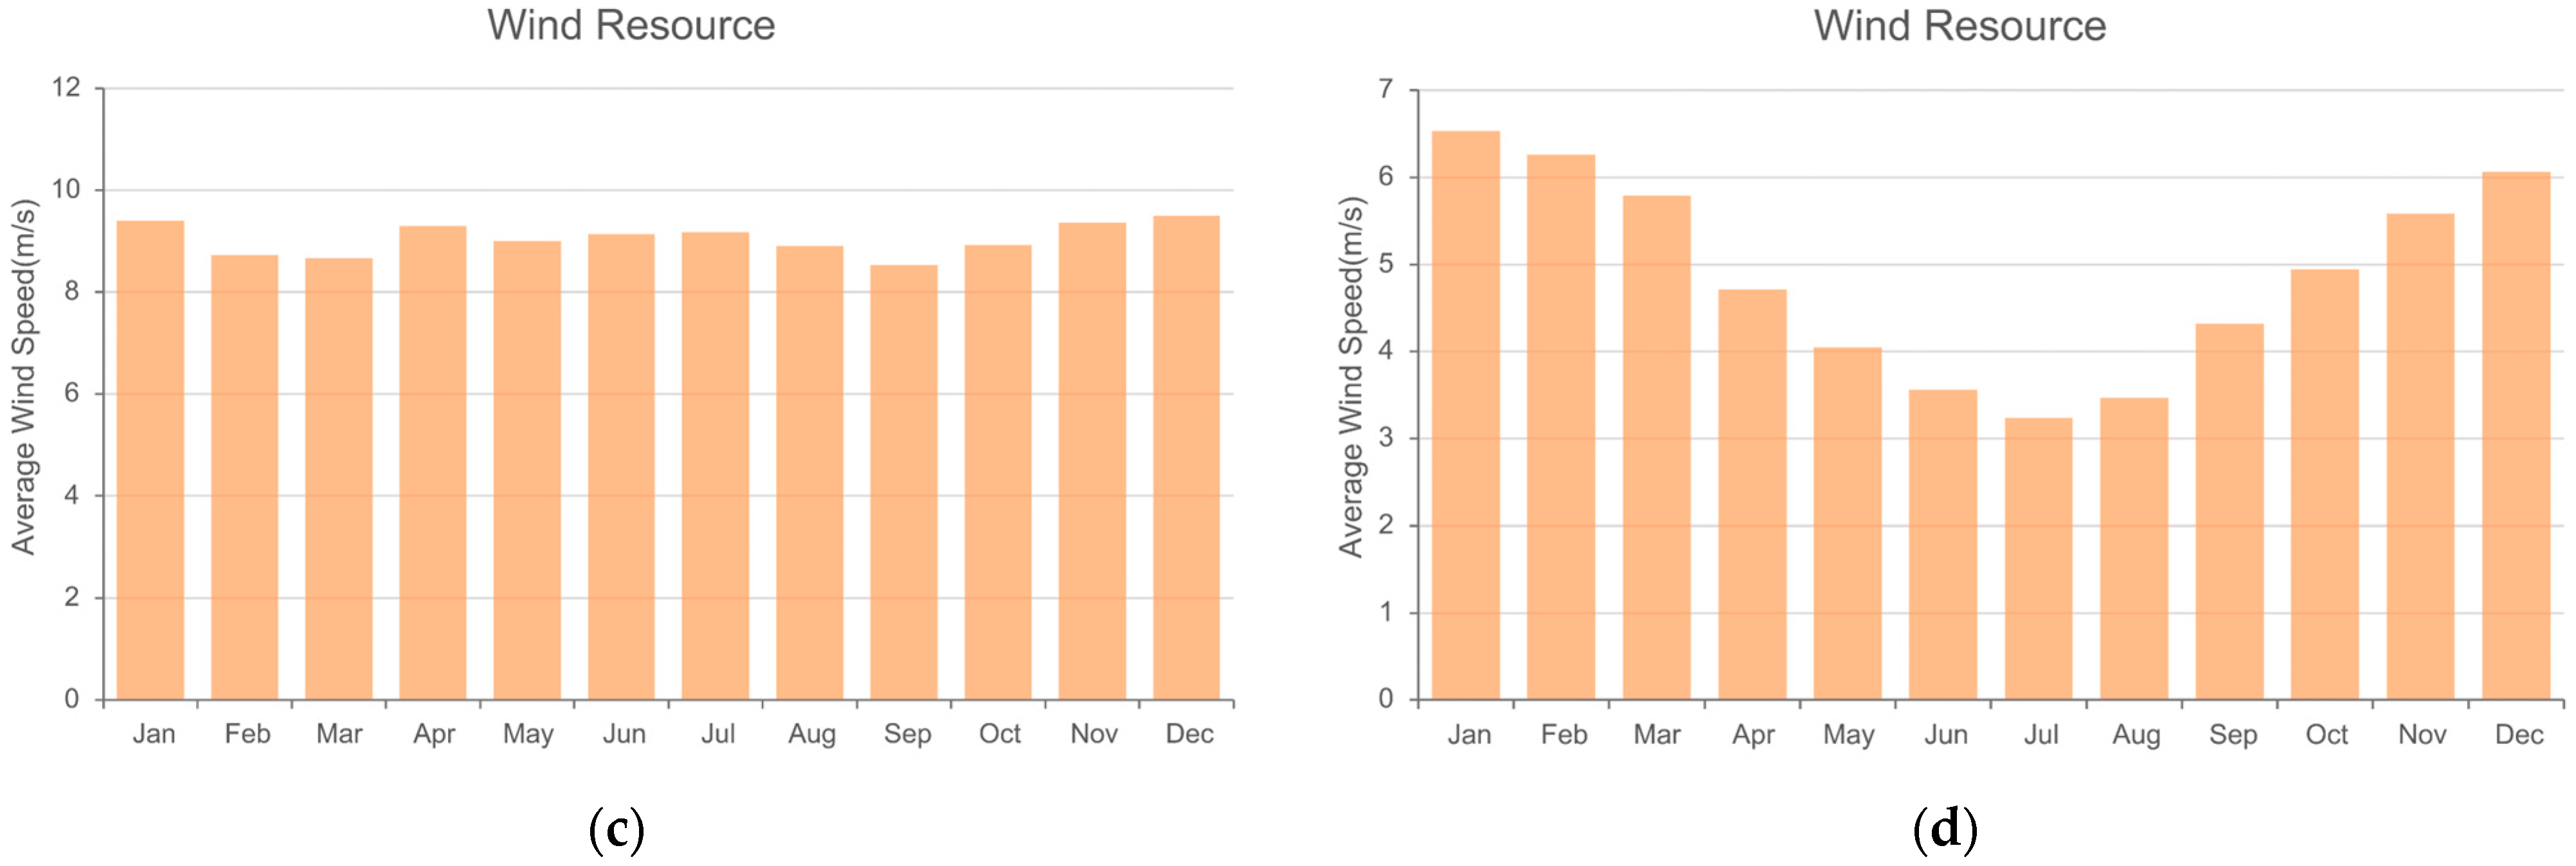
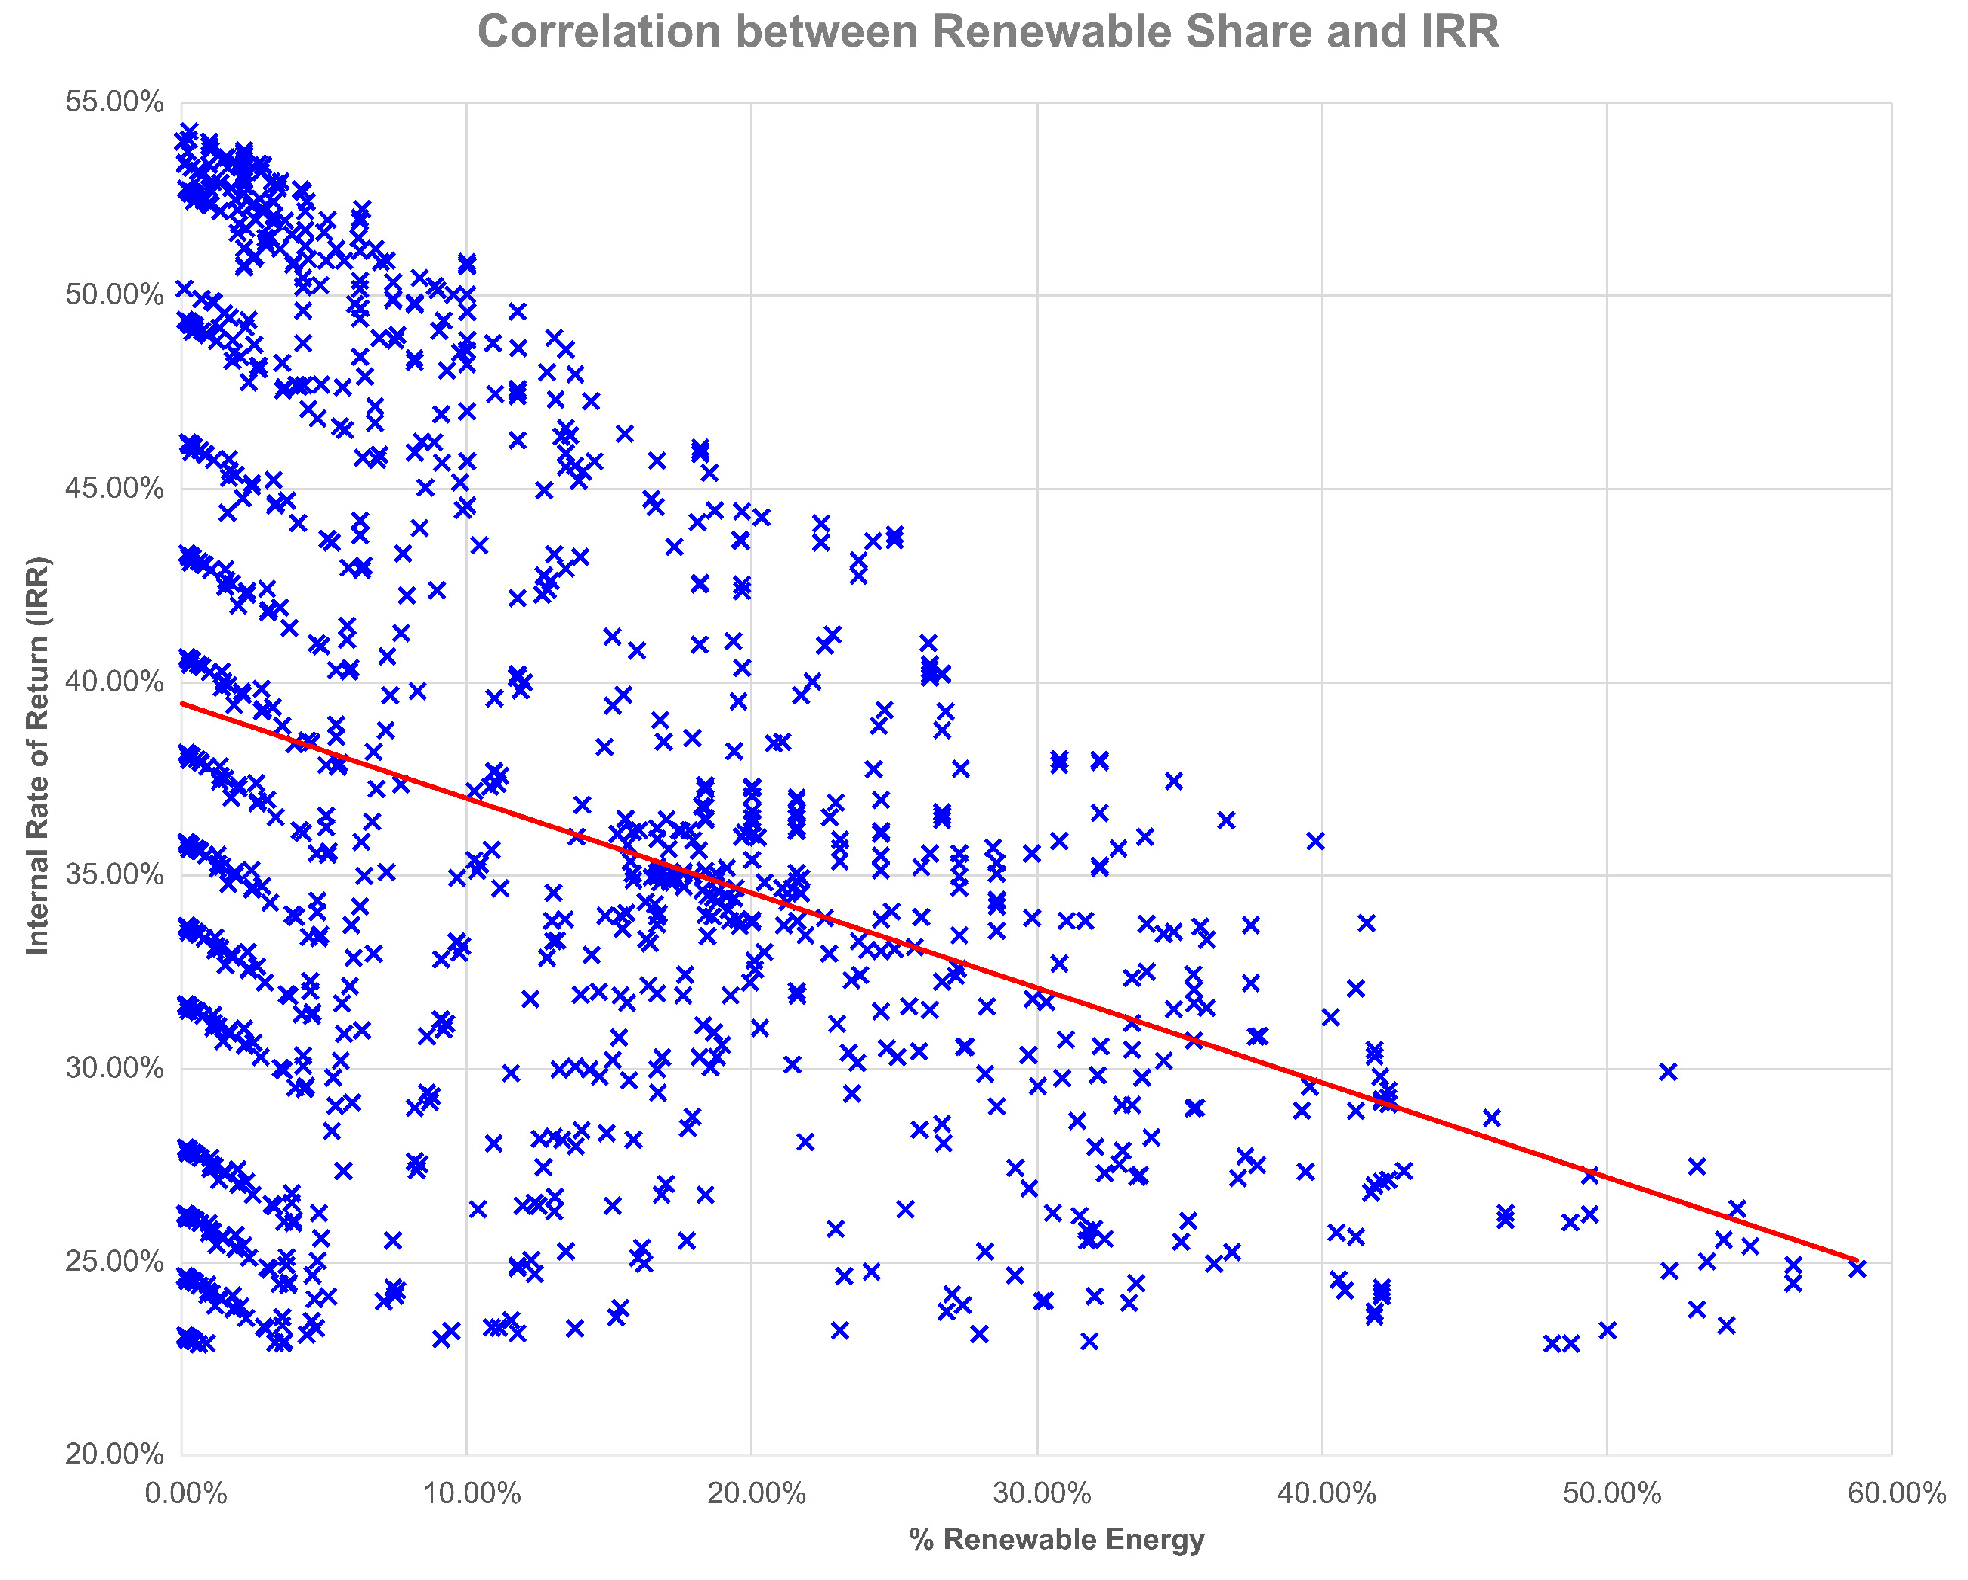
- Income and Profitability: Daily mining income was consistent across locations, reported at $50.67/day. Over a 5-year period, inflation-adjusted income totaled approximately $1.62 million per site. However, the IRR varied significantly depending on location: 21% in Skopun, 18% in Comodoro Rivadavia, 0% in both Trondheim and Kashan, and −3% in Palm Springs. This indicates notable disparities in investment feasibility based on regional parameters.
- NPC: Total costs, including capital expenditure on miners and energy systems as well as operation and maintenance, varied by site. The lowest NPC was recorded in Skopun at $706,971, while Palm Springs reported the highest NPC at $1,527,977. Sites like Kashan and Trondheim presented mid-to-high level costs, reflecting local infrastructure and fuel pricing conditions.
- Operating Costs: Operational expenditures were standardized across sites with available data, comprising $39,960 for mining O&M and $20,000 for auxiliary infrastructure (rent, labor, internet).
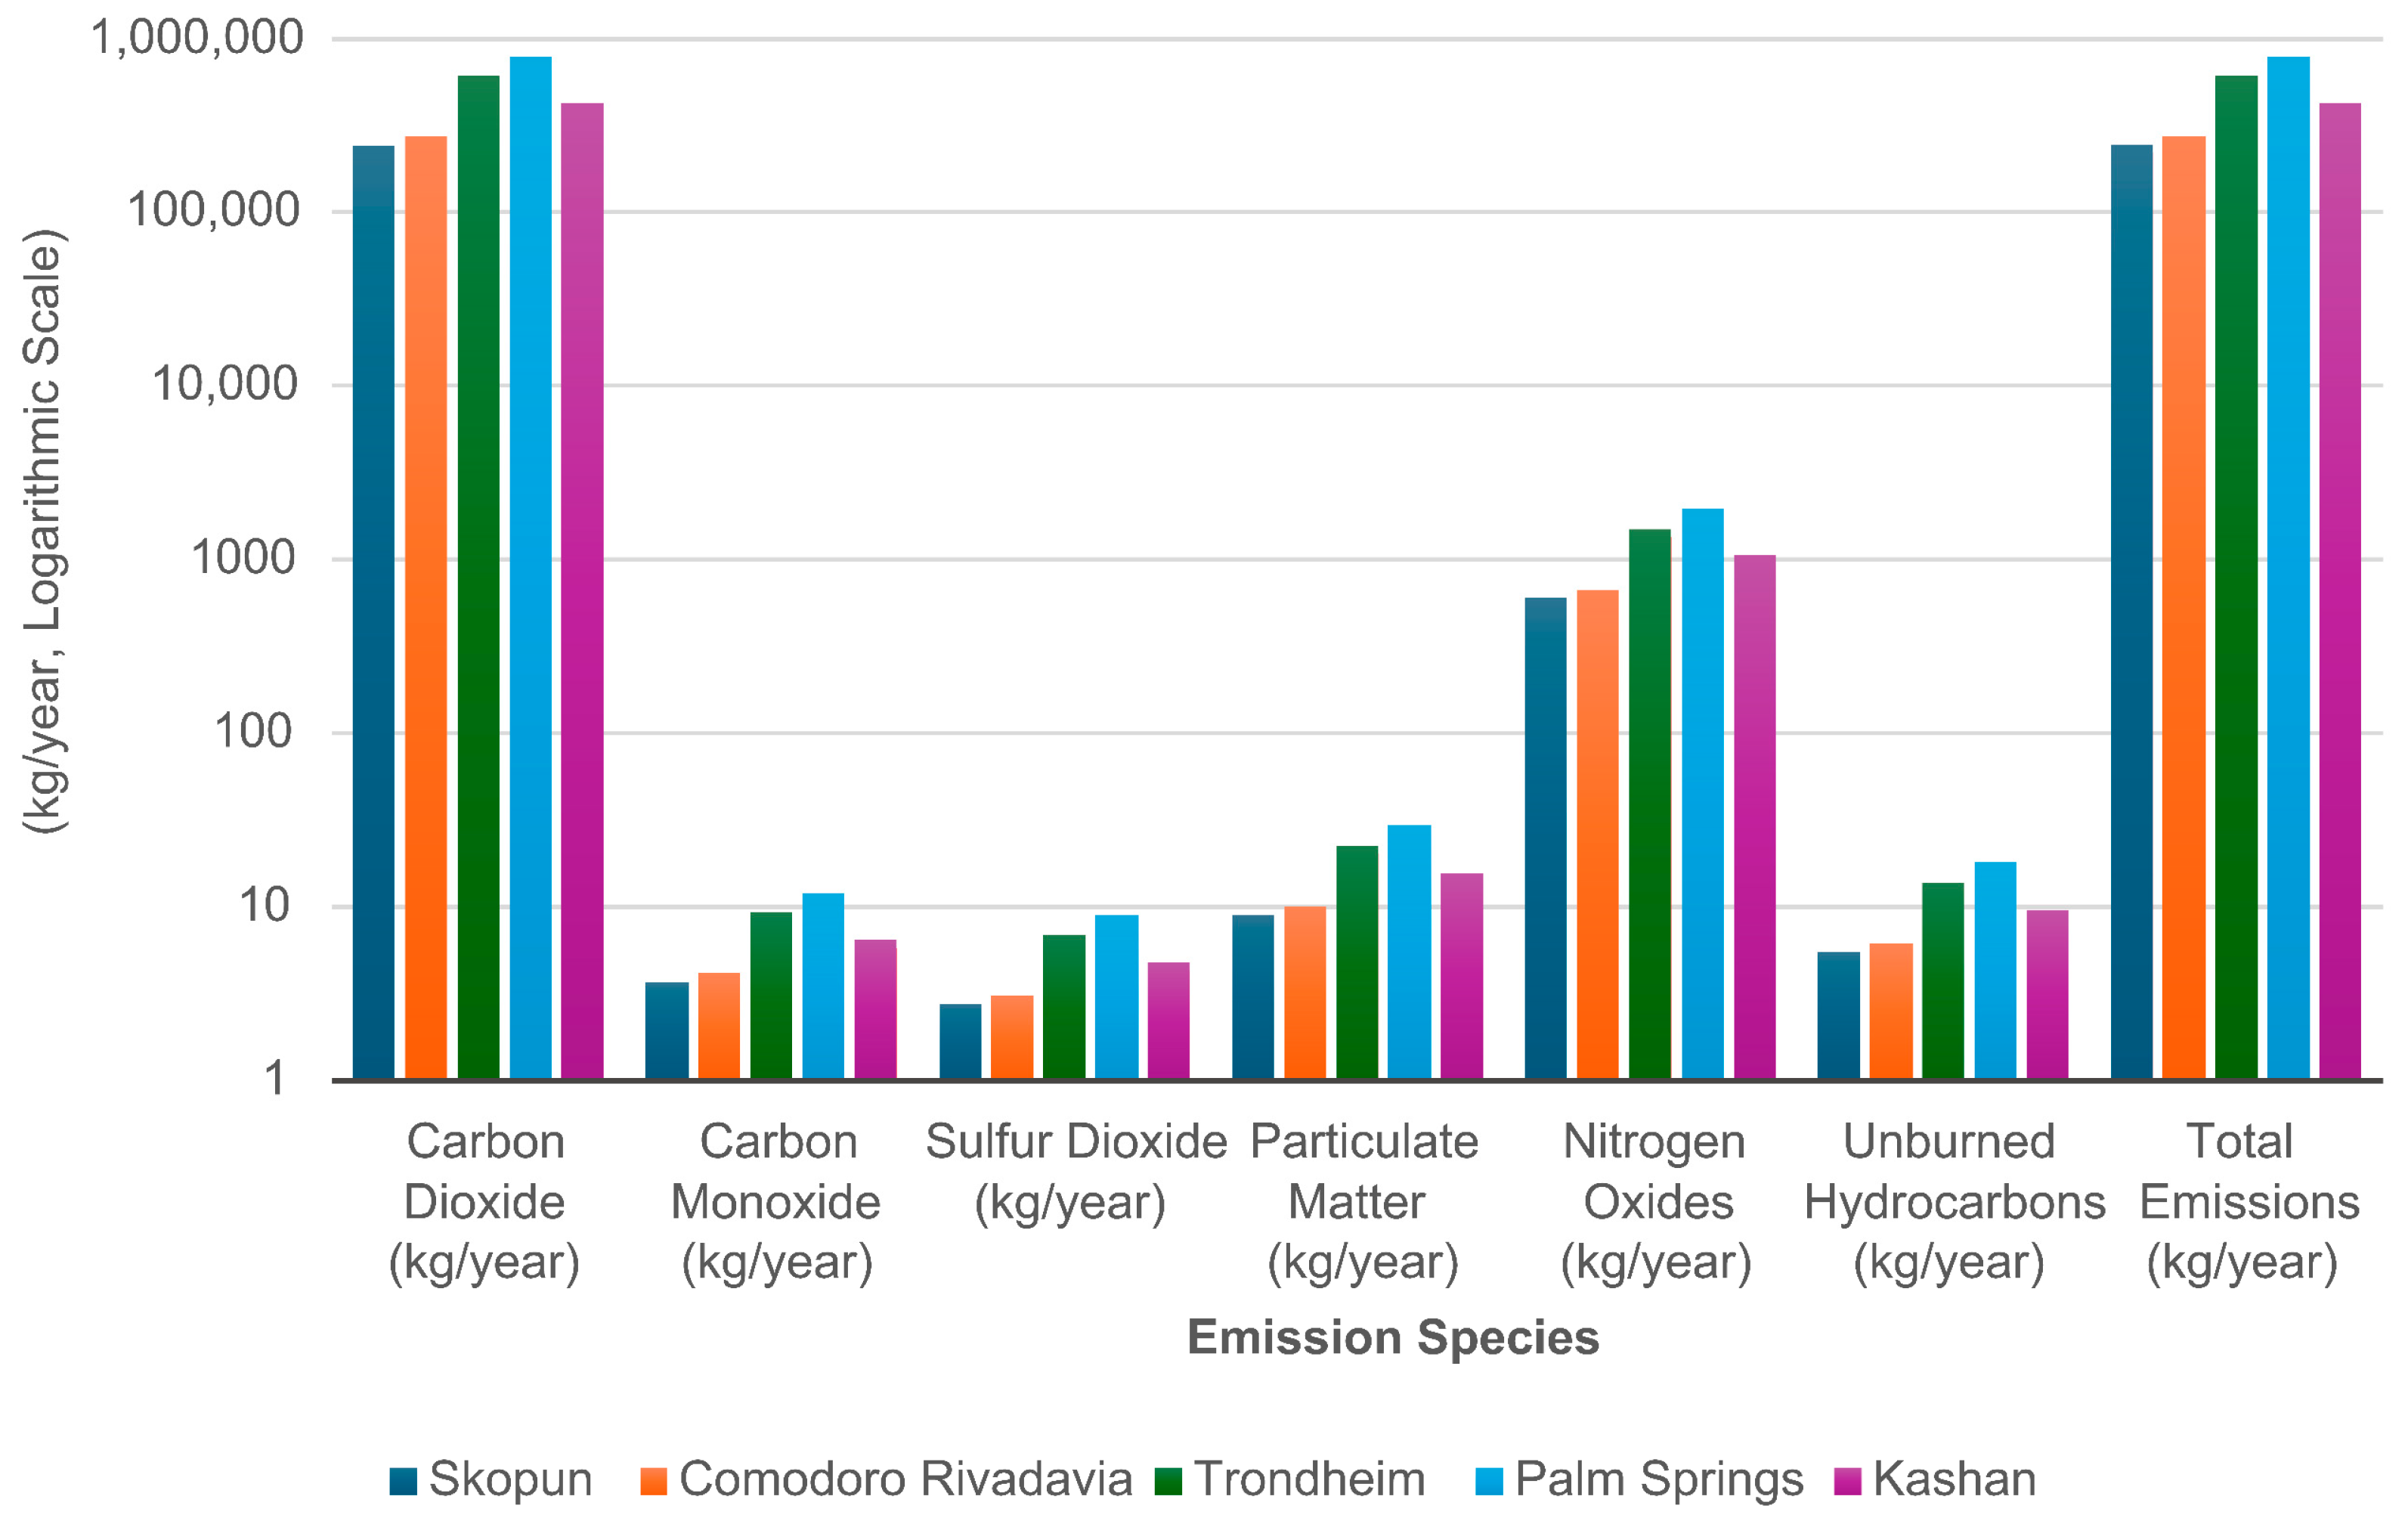
- Carbon Emissions: Annual emissions varied considerably by location. Palm Springs reported the highest total emissions at 788,520 kg/year, followed by Trondheim (611,572 kg/year) and Kashan (594,158 kg/year). In contrast, Skopun and Comodoro Rivadavia exhibited notably lower emissions at 243,211 and 272,807 kg/year, respectively. These differences largely reflect variations in fuel consumption and generator efficiency.
- Renewable Utilization: All sites used wind turbines (360–390 kW), and Palm Springs also incorporated 57.89 kW of PV panels. Despite this, diesel generators (90 kW) remained the dominant energy source due to limited renewable capacity and intermittency. Renewables played a supporting role, not a primary one.
5.3.7. Scenario 7: Flexible Crypto Mining and System Resilience Under Renewable and Fuel Price Uncertainty
- Fuel-Price Sensitivity and Cost Buffering through Load Flexibility: From the simulation results, increasing the diesel fuel price from $0.6/L to $1.8/L led to a substantial cost escalation in the fixed-load scenario, where the COE rose from $0.244/kWh to $0.551/kWh, representing a 125.8% increase. The corresponding NPC increased from $959,356 to $2.17 million, a 126.3% rise. In contrast, under the flexible-load scenario, the system exhibited markedly lower sensitivity to fuel price fluctuations. The COE increased from $0.239/kWh to $0.521/kWh, a relatively moderate 118% increase, while the NPC rose from $938,739 to $2.05 million, reflecting a 118.4% increase. This comparison clearly demonstrates that deferrable mining operations attenuate the economic impact of fuel price volatility. The smaller increase in both COE and NPC under the flexible configuration highlights the role of load schedulability in mitigating operational cost surges under extreme fuel pricing conditions.
- Renewable Energy Utilization: “Flexible mining increased annual renewable energy penetration from 29.3% to 33.9% in our top-performing configuration, compared to Scenario 2. Despite the inclusion of PV and wind in certain configurations (e.g., Configurations 1 to 4), the overall renewable contribution remained marginal due to the high and continuous nature of the mining load. Diesel generators remained the dominant source of supply, especially in scenarios with higher fuel availability.
- Fuel Consumption: Under increasing diesel fuel prices, the system’s operational strategy exhibited a significant reduction in fuel consumption—especially when mining load flexibility was enabled. In the fixed-load scenario, diesel consumption dropped from 247,537 L/year at $0.6/L to 174,239 L/year at $1.8/L, representing a 29.6% reduction in annual fuel usage. In contrast, the flexible-load scenario achieved even greater fuel savings. Consumption declined from 228,561 L/year at $0.6/L to just 106,050 L/year at $1.8/L, resulting in a 53.6% reduction. This outcome highlights the key role of deferrable mining operations in reducing generator runtime and enhancing fuel efficiency under volatile cost conditions. By shifting or curtailing load during peak-price periods, the system effectively mitigated excessive fuel dependency and contributed to overall cost containment and environmental benefit.
- Cost and ROI: Although load flexibility contributed to a reduction in fuel consumption and improved operational efficiency, the overall financial return remained limited due to the high capital and fuel costs. The total NPC of the system, including energy infrastructure, miner procurement, O&M, and operational expenses, amounted to $1,600,581. Annual mining income—based on dynamic operation and load adaptability—was estimated at $369,891, with a projected 5-year revenue (adjusted for inflation) reaching $1,619,298. However, due to the significant upfront investment and ongoing expenses, the IRR was calculated at only 0.40%, and the payback period extended close to the end of the 5-year operational horizon. Despite the extended payback, the ROI remained positive, and the model proved financially viable under stable operating conditions. More importantly, the use of deferrable load enabled the system to sustain mining activity while limiting cost escalation, especially under volatile diesel pricing—a critical factor in long-term feasibility.
- Emissions: In this scenario with high renewable usage, total annual emissions were as low as 581,592 kg/year (Config 1). In diesel-dominant cases, emissions rose to 853,711 kg/year (Configs 5–7). Compared to Scenario 2 (fixed load), emissions across most configurations decreased significantly, validating the environmental benefit of incorporating load flexibility.
5.3.8. Scenario 8: Seasonal Energy Configuration for Enhanced Mining and System Performance
- Total Energy Production: The hybrid system produced approximately 804,103 kWh/year, of which 33.81% was supplied by renewable energy sources.
- Renewable Energy Utilization: Seasonal mining demand was effectively synchronized with resource availability. Renewable penetration reached levels comparable to Scenario 7, though slightly lower than the top-performing flexible-load configurations.
- Fuel Consumption: Diesel usage reached 208,894 L/year, which—despite being substantial—is lower than fixed-load scenarios under high fuel prices, demonstrating the benefit of seasonal adaptation.
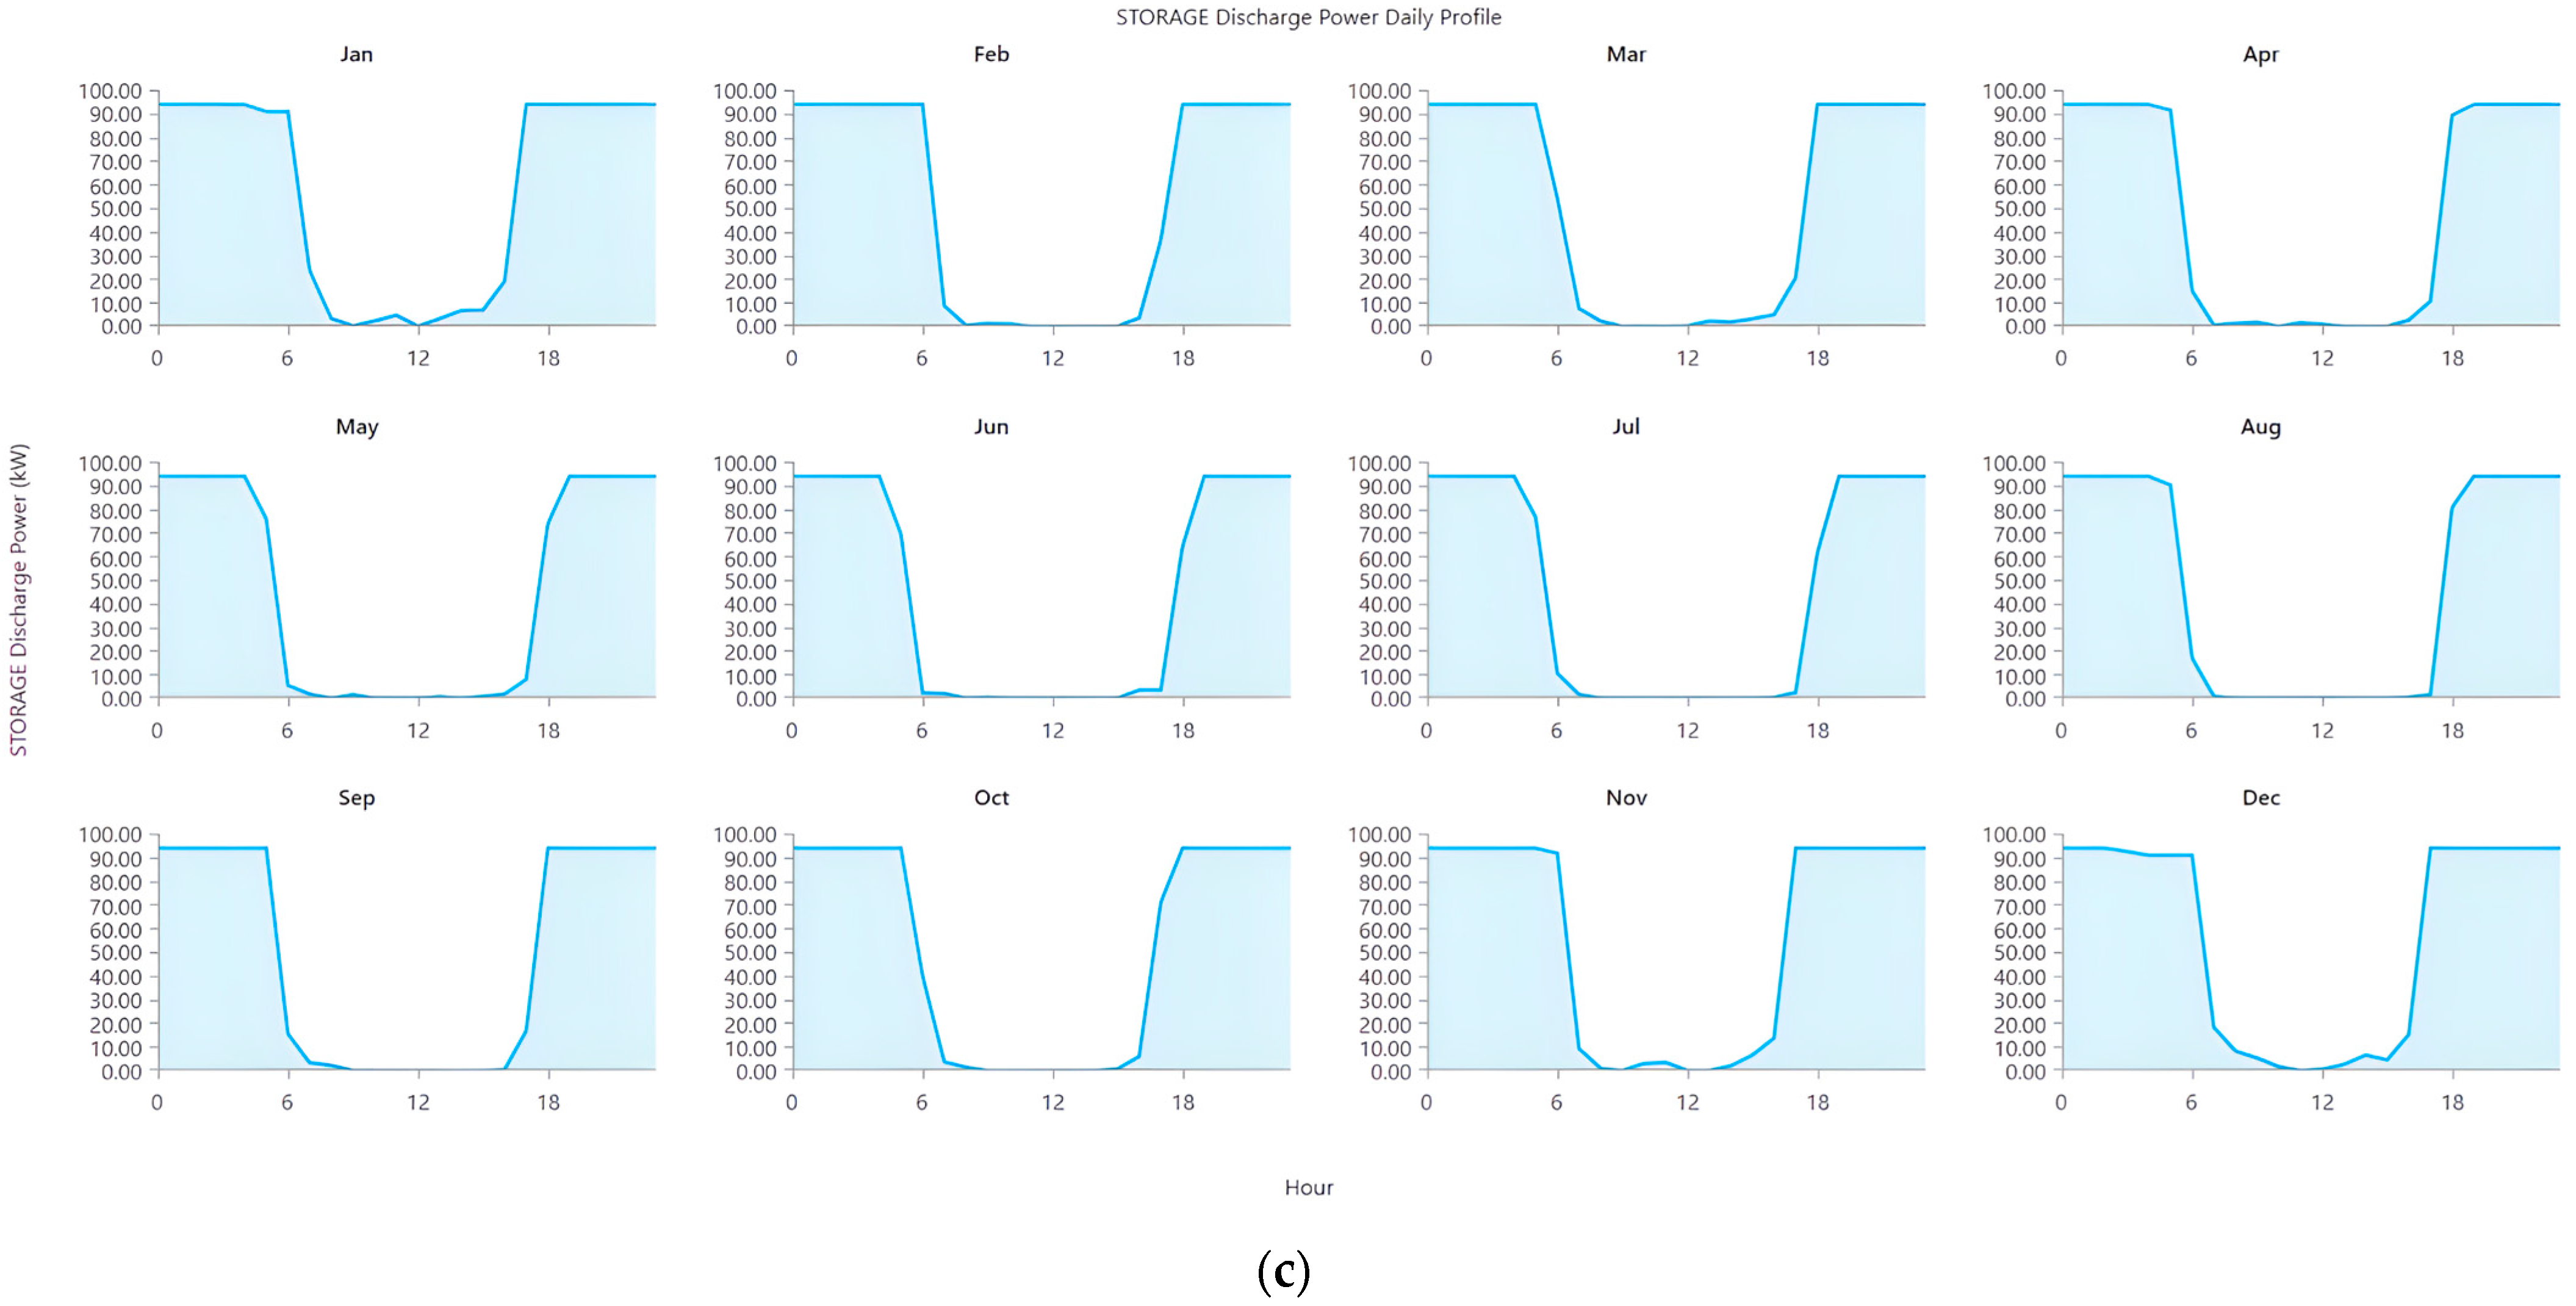
- System Dispatch Strategy: The adoption of the Combined Dispatch (CD) strategy improved fuel efficiency by allowing the generator to run at optimal load and charge the battery during low-demand hours. This led to more stable operational conditions and reduced marginal fuel cost per kWh.
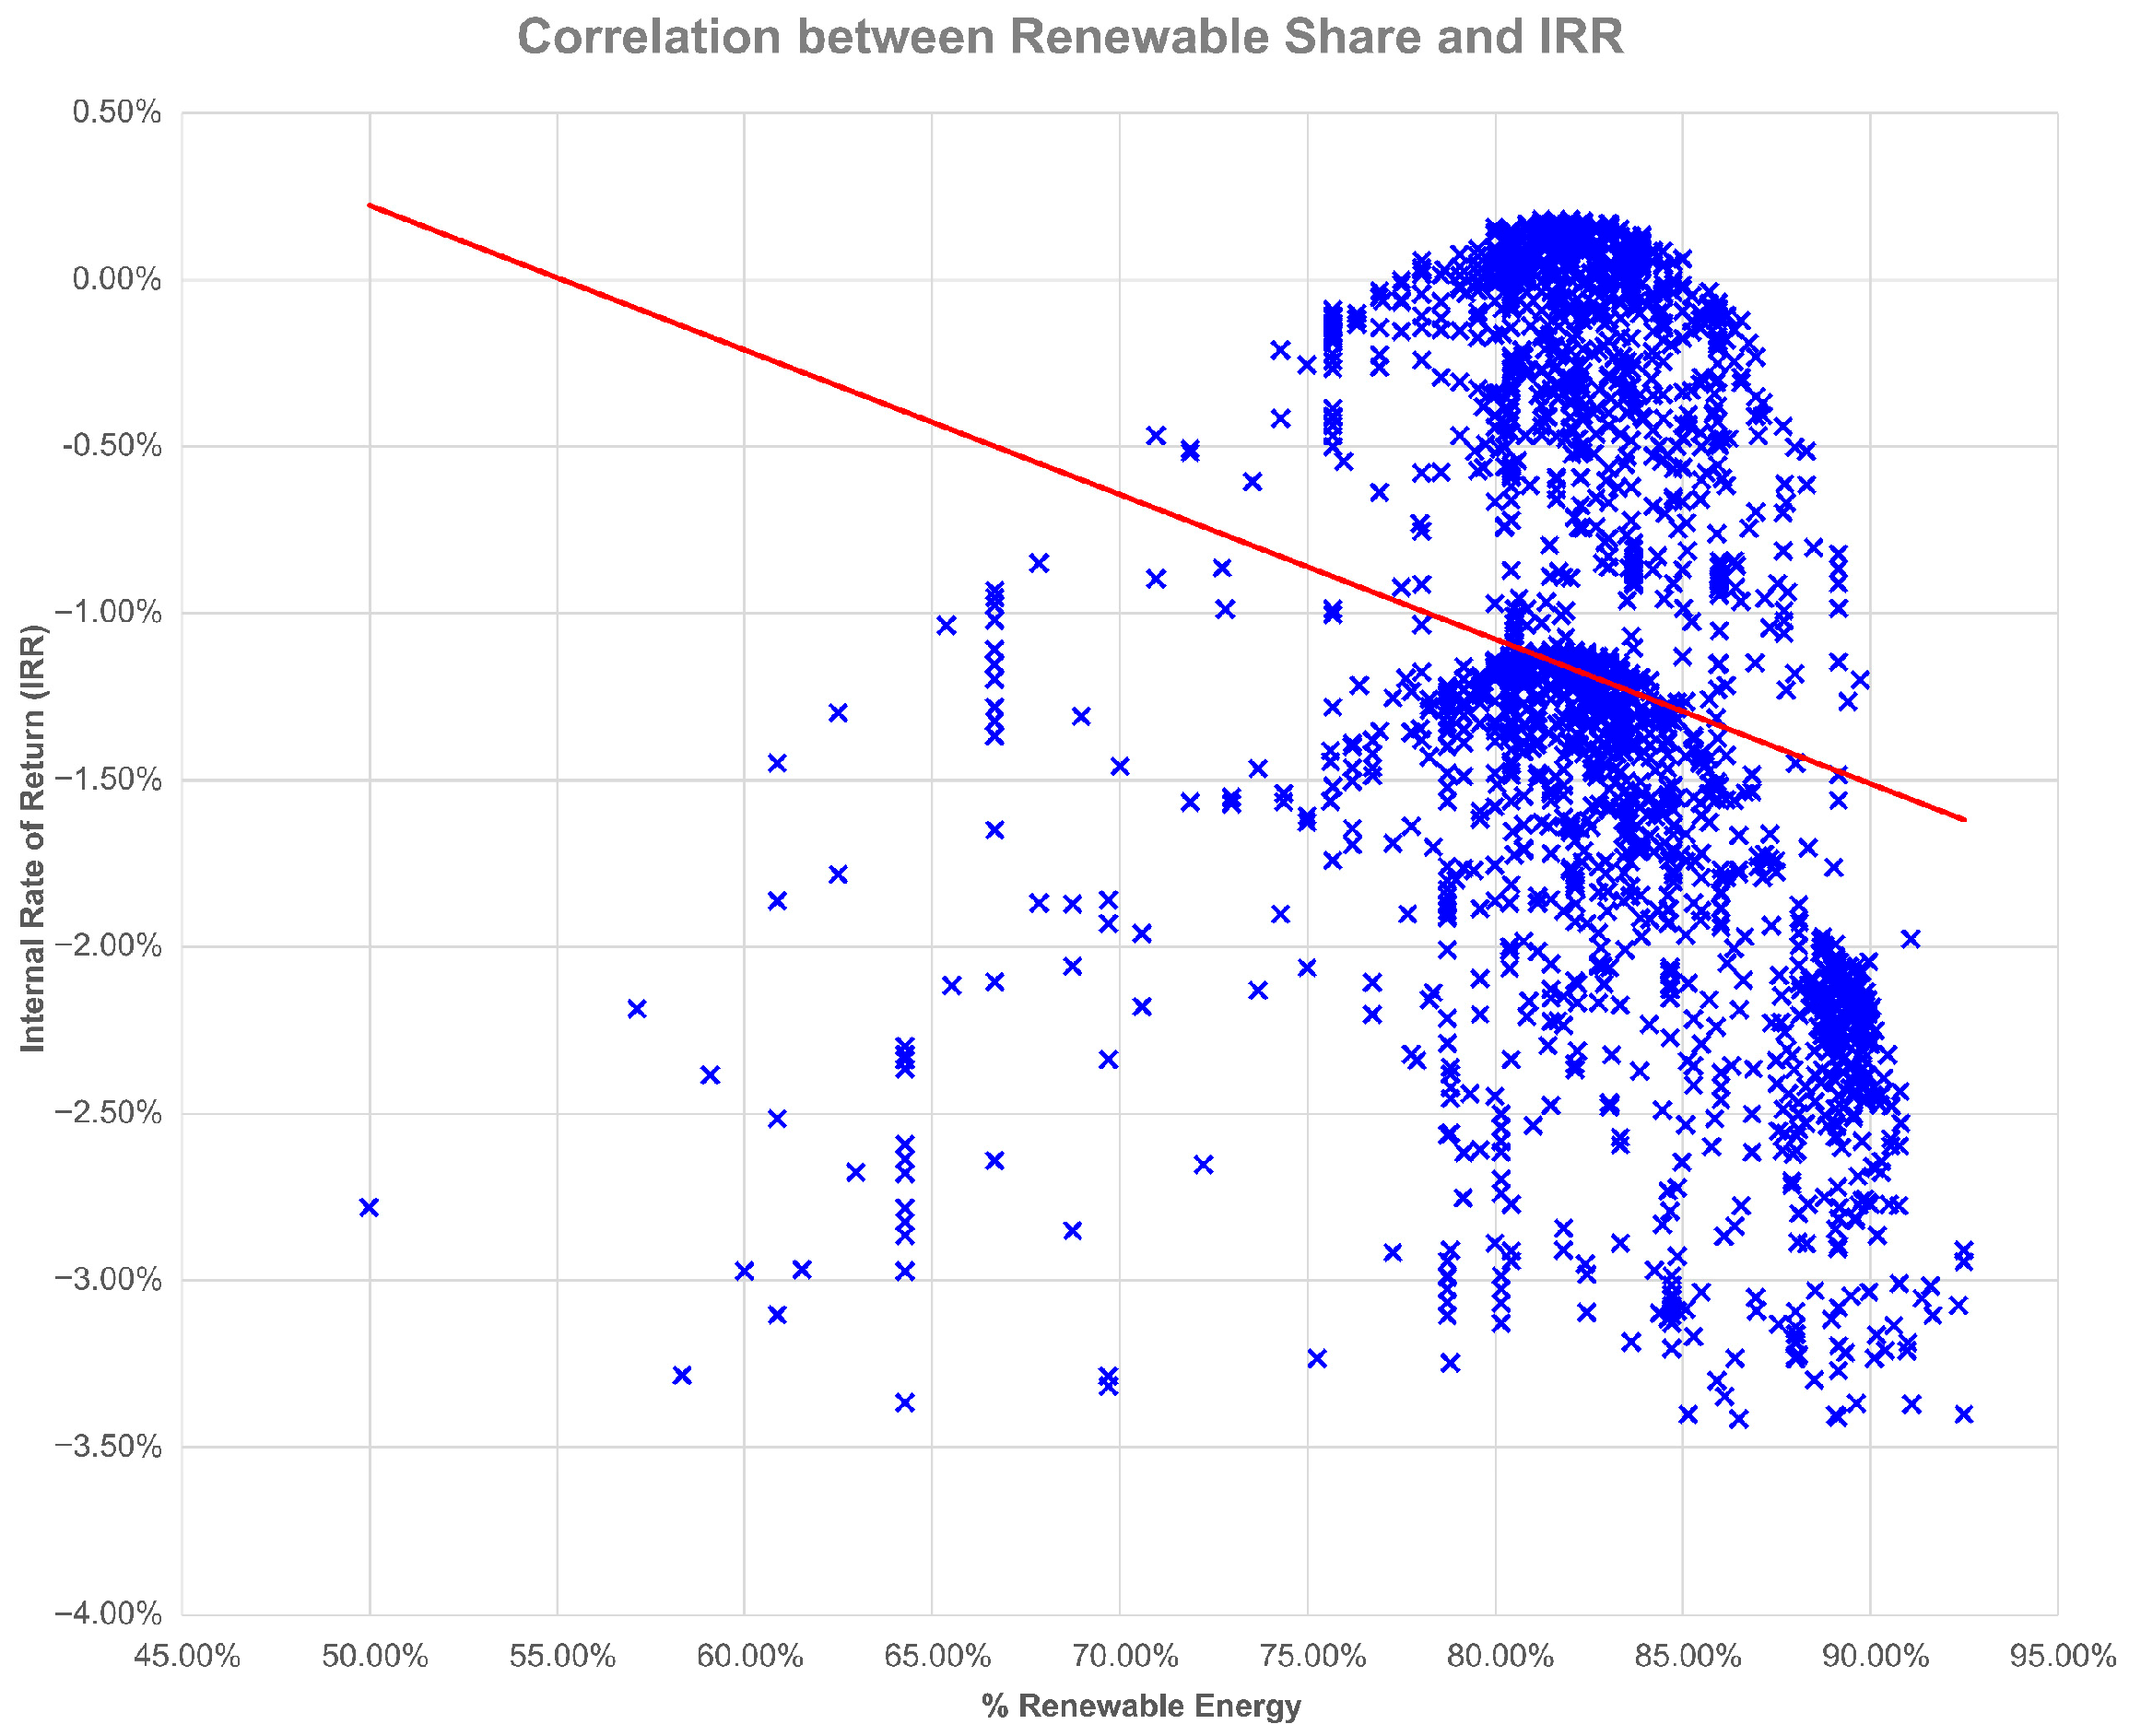
- Cost and ROI: The NPC of the system was $1,245,373, with a COE of $0.3975/kWh. Annual O&M and operational expenses were estimated at $113,501, and the five-year projected revenue (adjusted for inflation) totaled $1,288,802. Despite moderate energy performance, the overall IRR was −5.10%, indicating limited financial viability under global diesel pricing.
- Summary and Comparative Insights: Compared to Scenario 7, which utilized deferrable loads to dynamically adapt mining activity to fuel price and renewable fluctuations, Scenario 8 focused on pre-planned seasonal adjustment of demand. While Scenario 7 achieved better fuel savings and a positive IRR (0.40%) under volatile fuel conditions, Scenario 8 delivered a more predictable but less cost-resilient configuration. Nonetheless, the seasonal mining strategy in Scenario 8 improved alignment between load and renewable supply, reduced peak generator dependency, and demonstrated the potential of passive demand coordination as an alternative to dynamic load control. Future improvements could integrate both seasonal shaping and flexible dispatch to optimize for cost, emissions, and system stability simultaneously.
5.3.9. Summary of Results
6. Discussion
6.1. Interpretation of Results
6.2. Limitations
6.2.1. Simplified Modeling of Energy Resources
6.2.2. Fixed Load Profiles for Cryptocurrency Mining and Urban Loads
6.2.3. Dependence on Subsidies and Pricing Policies
6.2.4. Limited Exploration of Regulatory and Policy Impacts
6.2.5. Cryptocurrency Market Volatility
6.2.6. Limited Battery Storage Capacity
6.2.7. Geographic and Climatic Specificity
6.2.8. Technological Assumptions
6.2.9. Social and Environmental Factors
7. Conclusions
7.1. Summary of Key Findings
- High Renewable Energy Utilization: In scenarios where fuel prices were elevated (e.g., Scenario 2), the system successfully integrated renewable sources, increasing renewable energy contribution by 58.6%, and significantly reducing fuel consumption and carbon emissions.
- Diesel Backup Optimization: The diesel generator functioned as an effective backup during periods of low renewable generation. Its usage was minimized through optimized dispatch strategies, resulting in up to 49% emission reductions compared to diesel-only systems.
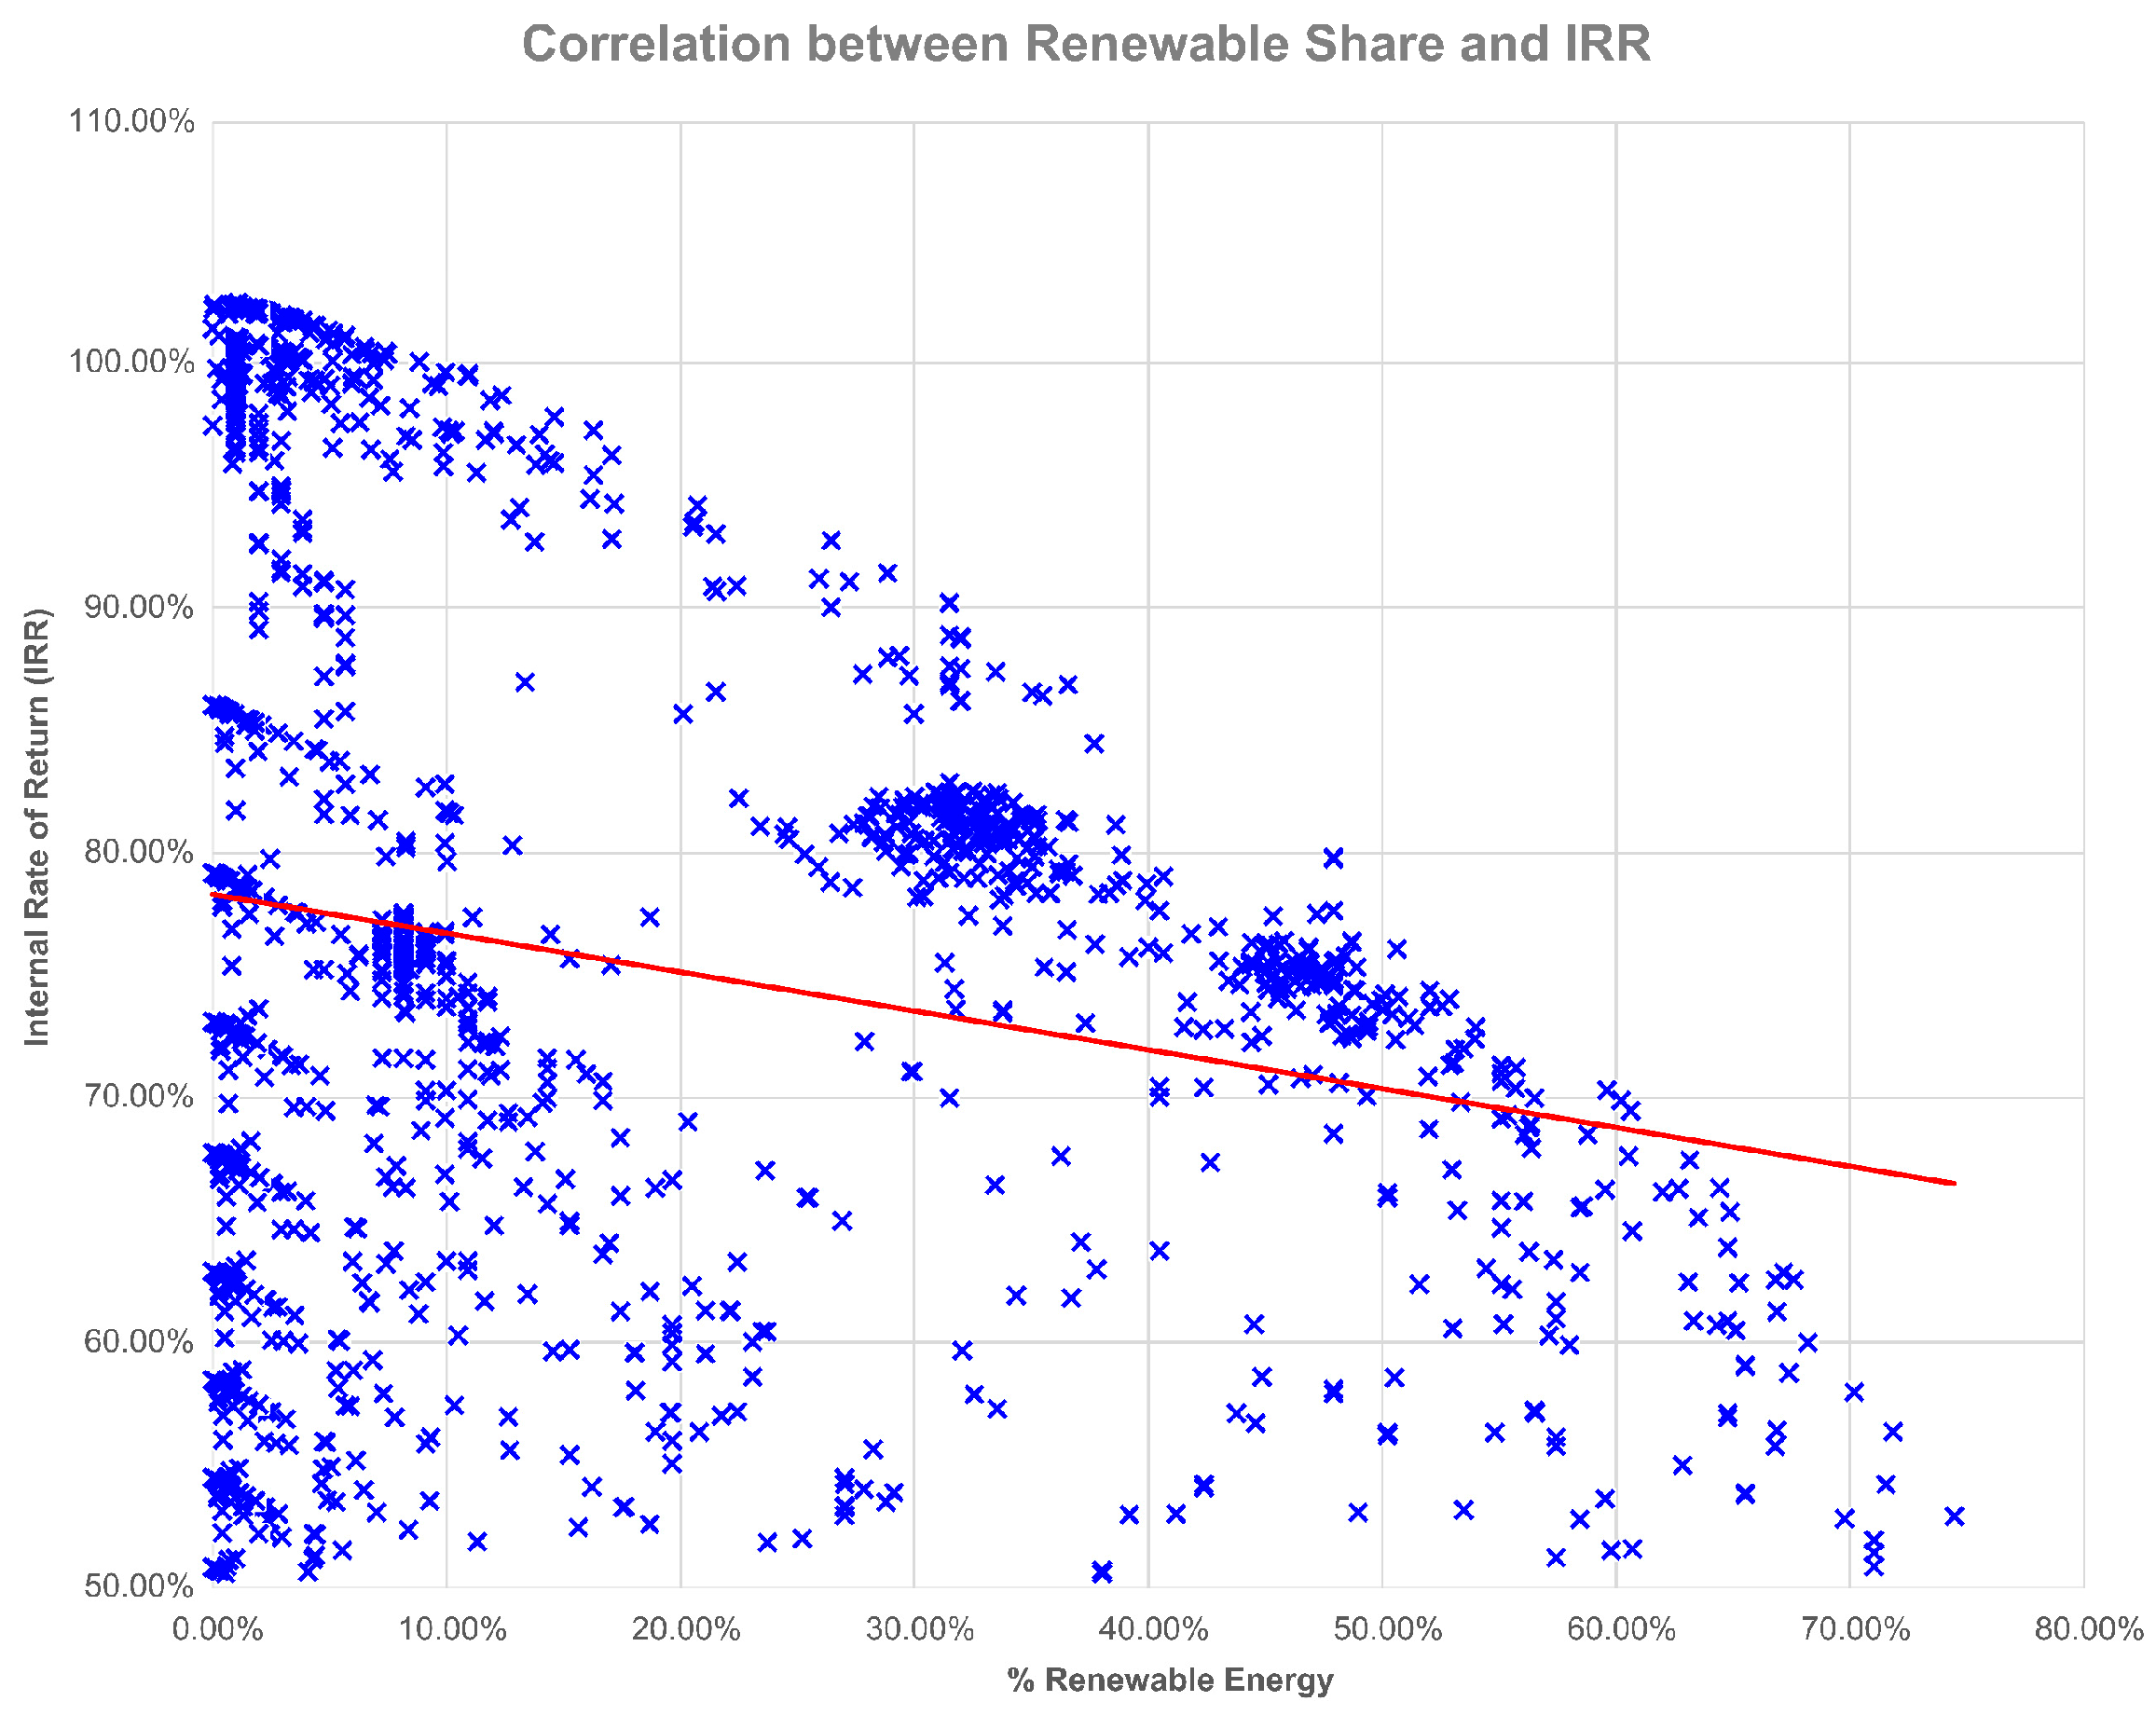
- Economic Viability: Under locally subsidized fuel conditions (Scenario 1), the system achieved an exceptional IRR of 103% and a payback period of approximately one year, confirming the financial attractiveness of hybrid systems when low-cost fuel is accessible.
- Sensitivity to Fuel Prices: As fuel prices increased (Scenario 2), the system dynamically shifted toward greater renewable usage. Although this transition extended the payback period to around 20 years, it demonstrated the system’s adaptability and environmental benefits.
- Environmental Benefits: Across scenarios, particularly under flexible load configurations (Scenario 7), hybrid systems achieved substantial reductions in greenhouse gas emissions while maintaining mining uptime and profitability.
7.2. Addressing Feasibility Constraints and Objective Weighting
- Pure Renewable Limitations: Despite the environmental appeal of fully renewable systems, Scenario 4—comprising a PV-only microgrid with battery storage—resulted in a negative Net Present Value (−$940,462), indicating that standalone renewable deployments are not yet economically feasible under current cost structures. Therefore, the conclusion regarding the feasibility of large-scale renewable energy adoption must be interpreted as conditional upon diesel backup support, which ensures both reliability and cost-effectiveness at scale.
- Clarification of Optimization Priorities: The optimization in this study was performed using HOMER Pro, which identifies the optimal configuration by minimizing the NPC over the project lifetime. While the software does not explicitly apply a multi-criteria weighting matrix, it provides a comprehensive set of technical and economic performance indicators—including renewable energy share, fuel consumption, carbon emissions, and LCOE—for each configuration. These outputs allow decision-makers to evaluate trade-offs between technical efficiency and financial returns. To assess the impact of varying decision priorities, a sensitivity analysis was conducted across scenarios with different fuel prices, resource availabilities, and mining loads. The results revealed that configurations with minimal NPC often favored diesel-reliant setups (e.g., Scenario 1), while scenarios prioritizing environmental performance (e.g., Scenario 2 and 7) shifted toward higher renewable integration but with longer payback periods. This confirms that optimal system design in HOMER Pro reflects economic priorities by default, but technical–environmental outcomes can still be extracted for comparative and policy-based decision-making.
- Validation Through Sensitivity Analysis: A sensitivity analysis was performed to assess how varying the weights in the objective function affects the optimal configuration. Results showed that prioritizing economic metrics led to diesel-heavy systems with faster payback (e.g., Scenario 1), while increasing the weight of technical efficiency favored systems with higher renewable integration and lower emissions (e.g., Scenario 2 and 7), albeit with extended payback periods. This confirms that optimal system design is sensitive to stakeholder preferences and external factors such as fuel prices and capital subsidies.
- Policy considerations and market risk: It is important to note that the prominent economic results reported for some scenarios are materially contingent on fuel pricing structures and any policy incentives or subsidies. In addition, mining revenues are subject to pronounced cryptocurrency market volatility; hence, the economic robustness reported here should be interpreted cautiously and treated as conditional on relative stability in both fuel prices and cryptocurrency markets over the study period.
7.3. Recommendations for Future Research
7.3.1. Dynamic Load Management
7.3.2. Integration of Advanced Energy Storage Technologies
7.3.3. Incorporating Machine Learning and AI for Predictive Optimization
7.3.4. Exploration of Diverse Geographic Regions
7.3.5. Long-Term Economic and Environmental Impact Analysis
7.3.6. Policy and Regulatory Framework Analysis
7.3.7. Enhancing System Scalability and Resilience
7.3.8. Hybrid Microgrid Applications Beyond Cryptocurrency Mining
7.3.9. Social and Ethical Implications
Author Contributions
Funding
Data Availability Statement
Conflicts of Interest
References
- Bekele, G.; Boneya, G. Design of a photovoltaic-wind hybrid power generation system for Ethiopian remote area. Energy Procedia 2012, 14, 1760–1765. [Google Scholar] [CrossRef]
- Bentouba, S.; Bourouis, M. Feasibility study of a wind–photovoltaic hybrid power generation system for a remote area in the extreme south of Algeria. Appl. Therm. Eng. 2016, 99, 713–719. [Google Scholar] [CrossRef]
- Ajlan, A.; Tan, C.W.; Abdilahi, A.M. Assessment of environmental and economic perspectives for renewable-based hybrid power system in Yemen. Renew. Sustain. Energy Rev. 2017, 75, 559–570. [Google Scholar] [CrossRef]
- Rajbongshi, R.; Borgohain, D.; Mahapatra, S. Optimization of PV-biomass-diesel and grid base hybrid energy systems for rural electrification by using HOMER. Energy 2017, 126, 461–474. [Google Scholar] [CrossRef]
- Hossain, M.; Mekhilef, S.; Olatomiwa, L. Performance evaluation of a stand-alone PV-wind-diesel-battery hybrid system feasible for a large resort center in South China Sea, Malaysia. Sustain. Cities Soc. 2017, 28, 358–366. [Google Scholar] [CrossRef]
- De Vries, A. Bitcoin’s growing energy problem. Joule 2018, 2, 801–805. [Google Scholar] [CrossRef]
- Humbatova, S.I.; Gasimov, R.K.; Hajiyev, N.G.-O. Impact Oil Factor Azerbaijan economy. Int. J. Energy Econ. Policy 2019, 9, 381–387. [Google Scholar] [CrossRef]
- Krishan, O.; Suhag, S. Techno-economic analysis of a hybrid renewable energy system for an energy poor rural community. J. Energy Storage 2019, 23, 305–319. [Google Scholar] [CrossRef]
- Stoll, C.; Klaaßen, L.; Gallersdörfer, U. The carbon footprint of bitcoin. Joule 2019, 3, 1647–1661. [Google Scholar] [CrossRef]
- Kristoufek, L. Bitcoin and its mining on the equilibrium path. Energy Econ. 2020, 85, 104588. [Google Scholar] [CrossRef]
- Das, D.; Dutta, A. Bitcoin’s energy consumption: Is it the Achilles heel to miner’s revenue? Econ. Lett. 2020, 186, 108530. [Google Scholar] [CrossRef]
- Gallersdörfer, U.; Klaaßen, L.; Stoll, C. Energy consumption of cryptocurrencies beyond bitcoin. Joule 2020, 4, 1843–1846. [Google Scholar] [CrossRef]
- Karmakar, S.; Demirer, R.; Gupta, R. Bitcoin mining activity and volatility dynamics in the power market. Econ. Lett. 2021, 209, 110111. [Google Scholar] [CrossRef]
- Hojjat, M.; Kalali, M.H. Techno-economic analysis of a grid-connected hybrid PV power plant integrated with a crypto currency mining system. In Proceedings of the 2021 11th Smart Grid Conference (SGC), Tabriz, Iran, 7–9 December 2021; IEEE: New York, NY, USA, 2021. [Google Scholar]
- Khalil, L.; Bhatti, K.L.; Awan, M.A.I.; Riaz, M.; Khalil, K.; Alwaz, N. Optimization and designing of hybrid power system using HOMER pro. Mater. Today Proc. 2021, 47, S110–S115. [Google Scholar] [CrossRef]
- Alonso, S.L.N.; Jorge-Vázquez, J.; Fernández, M.Á.E.; Forradellas, R.F.R. Cryptocurrency mining from an economic and environmental perspective. Analysis of the most and least sustainable countries. Energies 2021, 14, 4254. [Google Scholar] [CrossRef]
- Nikzad, A.; Mehregan, M. Techno-economic, and environmental evaluations of a novel cogeneration system based on solar energy and cryptocurrency mining. Sol. Energy 2022, 232, 409–420. [Google Scholar] [CrossRef]
- Menati, A.; Zheng, X.; Lee, K.; Shi, R.; Du, P.; Singh, C.; Xie, L. High resolution modeling and analysis of cryptocurrency mining’s impact on power grids: Carbon footprint, reliability, and electricity price. Adv. Appl. Energy 2023, 10, 100136. [Google Scholar] [CrossRef]
- Chamanara, S.; Ghaffarizadeh, S.A.; Madani, K. The environmental footprint of bitcoin mining across the globe: Call for urgent action. Earth’s Future 2023, 11, e2023EF003871. [Google Scholar] [CrossRef]
- Rudd, M.A.; Bratcher, L.; Collins, S.; Branscum, D.; Carson, M.; Connell, S.; David, E.; Gronowska, M.; Hess, S.; Mitchell, A.; et al. Bitcoin and its energy, environmental, and social impacts: An assessment of key research needs in the mining sector. Challenges 2023, 14, 47. [Google Scholar] [CrossRef]
- Hajiaghapour-Moghimi, M.; Hajipour, E.; Hosseini, K.A.; Vakilian, M.; Lehtonen, M. Cryptocurrency mining as a novel virtual energy storage system in islanded and grid-connected microgrids. Int. J. Electr. Power Energy Syst. 2024, 158, 109915. [Google Scholar] [CrossRef]
- Hakimi, A.; Pazuki, M.-M.; Salimi, M.; Amidpour, M. Renewable energy and cryptocurrency: A dual approach to economic viability and environmental sustainability. Heliyon 2024, 10, e39765. [Google Scholar] [CrossRef] [PubMed]
- Laimon, M.; Almadadha, R.; Goh, S. Energy Consumption of Crypto Mining: Consequences and Sustainable Solutions Using Systems Thinking and System Dynamics Analysis. Sustainability 2025, 17, 3522. [Google Scholar] [CrossRef]
- Ding, B.; Li, Z.; Li, Z.; Xue, Y.; Chang, X.; Su, J.; Sun, H. Cooperative Operation for Multiagent Energy Systems Integrated with Wind, Hydrogen, and Buildings: An Asymmetric Nash Bargaining Approach. IEEE Trans. Ind. Inform. 2025, 21, 6410–6421. [Google Scholar] [CrossRef]
- Wang, X.; Wang, C.; Xu, T.; Guo, L.; Li, P.; Yu, L.; Meng, H. Optimal voltage regulation for distribution networks with multi-microgrids. Appl. Energy 2018, 210, 1027–1036. [Google Scholar] [CrossRef]
- Muhtadi, A.; Pandit, D.; Nguyen, N.; Mitra, J. Distributed energy resources based microgrid: Review of architecture, control, and reliability. IEEE Trans. Ind. Appl. 2021, 57, 2223–2235. [Google Scholar] [CrossRef]
- García-Ceballos, C.; Pérez-Londoño, S.; Mora-Flórez, J. Integration of distributed energy resource models in the VSC control for microgrid applications. Electr. Power Syst. Res. 2021, 196, 107278. [Google Scholar] [CrossRef]
- Correia, S.; Pinto, S.F.; Silva, J.F. Smart integration of Distributed Energy Resources in microgrids. In Proceedings of the 2017 International Young Engineers Forum (YEF-ECE), Caparica, Portugal, 5 May 2017; IEEE: New York, NY, USA, 2017. [Google Scholar]
- Krause, M.J.; Tolaymat, T. Quantification of energy and carbon costs for mining cryptocurrencies. Nat. Sustain. 2018, 1, 711–718. [Google Scholar] [CrossRef]
- Sedlmeir, J.; Buhl, H.U.; Fridgen, G.; Keller, R. The energy consumption of blockchain technology: Beyond myth. Bus. Inf. Syst. Eng. 2020, 62, 599–608. [Google Scholar] [CrossRef]
- Sapra, N.; Shaikh, I. Impact of Bitcoin mining and crypto market determinants on Bitcoin-based energy consumption. Manag. Financ. 2023, 49, 1828–1846. [Google Scholar] [CrossRef]
- Bublyk, Y.; Borzenko, O.; Hlazova, A. Cryptocurrency energy consumption: Analysis, global trends and interaction. Environ. Econ. 2023, 14, 49. [Google Scholar] [CrossRef]
- Liang, Y.; Saner, C.B.; Lim, B.M.K.; Hong, K.T.; Lim, J.W.C.; Ho, K.J.H.; Lim, L.Z.; Loh, Y.Y. Sustainable energy-based cryptocurrency mining. In Proceedings of the 2022 IEEE PES Innovative Smart Grid Technologies-Asia (ISGT Asia), Singapore, 1–5 November 2022; IEEE: New York, NY, USA, 2022. [Google Scholar]
- Zafar, B.; Slama, S.B. Energy internet opportunities in distributed peer-to-peer energy trading reveal by blockchain for future smart grid 2.0. Sensors 2022, 22, 8397. [Google Scholar] [CrossRef]
- Rusovs, D.; Jaundālders, S.; Stanka, P. Blockchain mining of cryptocurrencies as challenge and opportunity for renewable energy. In Proceedings of the 2018 IEEE 59th International Scientific Conference on Power and Electrical Engineering of Riga Technical University (RTUCON), Riga, Latvia, 12–13 November 2018; IEEE: New York, NY, USA, 2018. [Google Scholar]
- Menati, A.; Lee, K.; Xie, L. Modeling and analysis of utilizing cryptocurrency mining for demand flexibility in electric energy systems: A synthetic texas grid case study. IEEE Trans. Energy Mark. Policy Regul. 2023, 1, 1–10. [Google Scholar] [CrossRef]
- Li, J.; Li, N.; Peng, J.; Cui, H.; Wu, Z. Energy consumption of cryptocurrency mining: A study of electricity consumption in mining cryptocurrencies. Energy 2019, 168, 160–168. [Google Scholar] [CrossRef]
- Hajiaghapour-Moghimi, M.; Hosseini, K.A.; Hajipour, E.; Vakilian, M. An approach to targeting cryptocurrency mining loads for energy efficiency enhancement. IET Gener. Transm. Distrib. 2022, 16, 4775–4790. [Google Scholar] [CrossRef]
- Strezoski, L.; Stefani, I.; Brbaklic, B. Active management of distribution systems with high penetration of distributed energy resources. In Proceedings of the IEEE EUROCON 2019-18th International Conference on Smart Technologies, Novi Sad, Serbia, 1–4 July 2019; IEEE: New York, NY, USA, 2019. [Google Scholar]
- Magdalena, R.; Mohammed, K.S.; Nassani, A.A.; Dascalu, N. Evaluating the environmental effects of bitcoin mining on energy and water use in the context of energy transition. Sci. Rep. 2025, 15, 8230. [Google Scholar] [CrossRef] [PubMed]
- Bashari, M.; Doostkouei, S.G.; Fathabadi, M.; Soufimajidpour, M. The environmental cost of cryptocurrency: Analyzing CO2 emissions in the 9 leading mining countries. Sustain. Futures 2025, 10, 100792. [Google Scholar] [CrossRef]
- Hutabarat, S. Bitcoin Mining and Renewable Energy: Navigating Sustainability, Profitability, and Electricity Market Dynamics. Profitab. Electr. Mark. Dyn. 2025; ahead of print. [Google Scholar]
- Asif, R.; Hassan, S.R. Shaping the future of Ethereum: Exploring energy consumption in Proof-of-Work and Proof-of-Stake consensus. Front. Blockchain 2023, 6, 1151724. [Google Scholar] [CrossRef]
- Nasrinasrabadi, M.; Hejazi, M.A.; Chaharmahali, E.; Hussein, M. A comprehensive review of blockchain integration in smart grid with a special focus on internet of things. Energy Convers. Manag. X 2025, 27, 101196. [Google Scholar] [CrossRef]
- Ali, F.; Khurram, M.U.; Sensoy, A.; Vo, X.V. Green cryptocurrencies and portfolio diversification in the era of greener paths. Renew. Sustain. Energy Rev. 2024, 191, 114137. [Google Scholar] [CrossRef]
- Neeraj Shrivastava, P.M.B.M.; Lokeshwar Reddy, M.C.; Lavanya Banda, S.N.V.; Ramana, M.; Gayatri, P.; Siva Shankar, S. Optimizing Smart Grids for Distributed Energy Resource Integration and Management. J. Inf. Syst. Eng. Manag. 2025, 10, 421–427. [Google Scholar] [CrossRef]
- Hosseinalizadeh, M.; Pordanjani, I.R.; Sayyadroushan, N.; Baneh, A.M.; Nasrinasrabadi, M.; Farbin, E. Computing the Future: Research at the Convergence of Computer Engineering, Artificial Intelligence and Intelligent Technologies; Nobel Sciences: Stockholm, Sweden, 2025. [Google Scholar]
- Wongthongtham, P.; Marrable, D.; Abu-Salih, B.; Liu, X.; Morrison, G. Blockchain-enabled Peer-to-Peer energy trading. Comput. Electr. Eng. 2021, 94, 107299. [Google Scholar] [CrossRef]
- Bâra, A.; Oprea, S.-V.; Panait, M. Insights into Bitcoin and energy nexus. A Bitcoin price prediction in bull and bear markets using a complex meta model and SQL analytical functions. Appl. Intell. 2024, 54, 5996–6024. [Google Scholar] [CrossRef]
- Okorie, D.I.; Gnatchiglo, J.M.; Wesseh, P.K. Electricity and cryptocurrency mining: An empirical contribution. Heliyon 2024, 10, e33483. [Google Scholar] [CrossRef]
- Bouri, E.; Saeed, T.; Vo, X.V.; Roubaud, D. Quantile connectedness in the cryptocurrency market. J. Int. Financ. Mark. Inst. Money 2021, 71, 101302. [Google Scholar] [CrossRef]
- Harasheh, M.; Bouteska, A.; Hammad, M.H. Dynamic connectedness between energy markets and cryptocurrencies: Evidence from the COVID-19 pandemic. J. Energy Mark. 2023, 16, 1–27. [Google Scholar] [CrossRef]
- Lu, Y.; Zheng, Z.; Tian, K.; Zhang, Y. A novel agent model of heterogeneous risk based on temporal interaction network for stock price simulation. Phys. A Stat. Mech. Its Appl. 2023, 625, 128981. [Google Scholar] [CrossRef]
- Heydaritafreshi, O.; Moghimi, M.H.; Hajipour, E. Utilization of Cryptocurrency Mining Load as High Flexible Load in Virtual Power Plant. Electr. Power Syst. Res. 2025, 250, 112074. [Google Scholar] [CrossRef]
- Jain, A.; Gupta, S. Evaluation of electrical load demand forecasting using various machine learning algorithms. Front. Energy Res. 2024, 12, 1408119. [Google Scholar] [CrossRef]
- Nakabi, T.A.; Toivanen, P. Deep reinforcement learning for energy management in a microgrid with flexible demand. Sustain. Energy Grids Netw. 2021, 25, 100413. [Google Scholar] [CrossRef]
- Chen, H.; Xiong, R.; Lin, C.; Shen, W. Model predictive control based real-time energy management for hybrid energy storage system. CSEE J. Power Energy Syst. 2020, 7, 862–874. [Google Scholar] [CrossRef]
- Parvathareddy, S.; Yahya, A.; Amuhaya, L.; Samikannu, R.; Suglo, R.S. A Hybrid Machine Learning and Optimization Framework for Energy Forecasting and Management. Results Eng. 2025, 26, 105425. [Google Scholar] [CrossRef]
- Hosseina, M.; Moghaddam, M.S.; Hassannia, A. Optimizing energy and load management in island microgrids for enhancing resilience against resource interruptions. Sci. Rep. 2025, 15, 16297. [Google Scholar] [CrossRef]
- SunPower. Available online: https://us.sunpower.com/products/solar-panels (accessed on 8 July 2025).
- T.I.C. Ltd. Tumo-Int 10kW Wind Turbine. Available online: https://store.tumo-int.com/collections/wind-turbine-generator?srsltid=AfmBOooSn5ddZhGC1lVLlT-SV-oFl5ttLpUIaqK_u7MddVuIocgO5bdi (accessed on 27 September 2025).
- Caterpillar. C4.4 (50 Hz)|50–110 kVA Diesel Generator. Available online: https://www.cat.com/en_US/products/new/power-systems/electric-power/diesel-generator-sets/1000001234.html (accessed on 27 September 2025).
- U.S.E.I. Administration, Carbon Dioxide Emissions by Fuel. Available online: https://www.eia.gov/environment/ (accessed on 27 September 2025).
- Mårtensson, L. Emissions from Volvo’s Trucks, Volvo Truck Corporation. Available online: https://www.volvotrucks.com/content/dam/volvo-trucks/markets/global/our-values/environmental-care/our-trucks/Emis_eng_10110_14001.pdf (accessed on 27 September 2025).
- Pro, H. Advanced Kinetic Model. Available online: https://www.homerenergy.com/products/pro/docs/3.15/advanced_kinetic_model.html (accessed on 27 September 2025).
- Pro, H. Kinetic Battery Model. Available online: https://www.homerenergy.com/products/pro/docs/3.15/kinetic_battery_model.html (accessed on 27 September 2025).
- Pro, H. Storage Library. Available online: https://www.homerenergy.com/products/pro/docs/3.15/storage_library.html (accessed on 27 September 2025).
- SMA Sunny Tripower 5.0 Smart Energy—Hybrid. Available online: https://shop.naturenergieladen.de/SMA-Sunny-Tripower-5.0-Smart-Energy-Hybrid/BW-2021-06-002 (accessed on 27 September 2025).
- ASICMinerValue. September 2024. Available online: https://www.asicminervalue.com/ (accessed on 27 September 2025).
- Rinaldi, F.; Moghaddampoor, F.; Najafi, B.; Marchesi, R. Economic feasibility analysis and optimization of hybrid renewable energy systems for rural electrification in Peru. Clean. Technol. Environ. Policy 2021, 23, 731–748. [Google Scholar] [CrossRef]
- Colerick, K. Internal Rate of Return (IRR) Calculator. Available online: https://www.calculatestuff.com/financial/irr-calculator (accessed on 27 September 2025).
- Küfeoğlu, S.; Özkuran, M. Bitcoin mining: A global review of energy and power demand. Energy Res. Soc. Sci. 2019, 58, 101273. [Google Scholar] [CrossRef]
- Cengel, Y.A. Thermodynamics: An Engineering Approach; McGraw-Hill: Columbus, OH, USA, 2011. [Google Scholar]
- Chandra, A.R.; Arora, R.C. Refrigeration and Air Conditioning; PHI Learning Pvt. Ltd.: Delhi, India, 2012. [Google Scholar]
- Geng, H. Data Center Handbook; John Wiley & Sons: Hoboken, NJ, USA, 2014. [Google Scholar]
- Louis, F.R.B.O.S. Federal Reserve Economic Data, Since 1991. Available online: https://fred.stlouisfed.org/ (accessed on 27 September 2025).
- Dunlop, J.P. Photovoltaic Systems; American Technical Publishers, Incorporated: Orland Park, IL, USA, 2012. [Google Scholar]
- Duffie, J.A.; Beckman, W.A.; Worek, W. Solar Engineering of Thermal Processes; Wiley: Hoboken, NJ, USA, 1994. [Google Scholar]
- Li, Z.; Huang, J.; Liaw, B.Y.; Zhang, J. On state-of-charge determination for lithium-ion batteries. J. Power Sources 2017, 348, 281–301. [Google Scholar] [CrossRef]
- Jufri, F.H.; Aryani, D.R.; Garniwa, I.; Sudiarto, B. Optimal battery energy storage dispatch strategy for small-scale isolated hybrid renewable energy system with different load profile patterns. Energies 2021, 14, 3139. [Google Scholar] [CrossRef]
- Puglia, G. Study and Development of a Web-Based Software for Hybrid Energy System Design and Solar Prediction Analysis. Ph.D. Dissertation, Università Politecnica delle Marche, Ancona, Italy, 2017. Available online: https://iris.univpm.it/retrieve/e18b8790-6cc8-d302-e053-1705fe0a27c8/tesi_puglia.pdf (accessed on 8 July 2025).
- Lambert, T.; Gilman, P.; Lilienthal, P. Micropower system modeling with HOMER. Integr. Altern. Sources Energy 2006, 1, 379–385. [Google Scholar]
- Bastian-Pinto, C.L.; Araujo, F.V.D.S.; Brandão, L.E.; Gomes, L.L. Hedging renewable energy investments with Bitcoin mining. Renew. Sustain. Energy Rev. 2021, 138, 110520. [Google Scholar] [CrossRef]
- Asgari, N.; McDonald, M.T.; Pearce, J.M. Energy modeling and techno-economic feasibility analysis of greenhouses for tomato cultivation utilizing the waste heat of cryptocurrency miners. Energies 2023, 16, 1331. [Google Scholar] [CrossRef]
- Alexander, C.K.; Sadiku, M.N. Electric circuits. Transformation 2000, 135, 4–5. [Google Scholar]
- Edition, F.; Chapman, S.J. Electric Machinery Fundamentals; McGraw-Hill: Columbus, OH, USA, 2012. [Google Scholar]
- Saadat, H. Power System Analysis; McGraw-Hill: Columbus, OH, USA, 1999; Volume 2. [Google Scholar]
- Kreith, F.; Krumdieck, S. Principles of Sustainable Energy Systems; CRC Press: Boca Raton, FL, USA, 2013. [Google Scholar]
- Rogers, G.F.C.; Mayhew, Y.R. Engineering Thermodynamics, Work and Heat Transfer; CRC Press: Boca Raton, FL, USA, 1992. [Google Scholar]
- Everett, R.; Boyle, G.; Peake, S.; Ramage, J. Energy Systems and Sustainability: Power for a Sustainable Future; Oxford University Press: Oxford, UK, 2012. [Google Scholar]
- Xin, Q. Diesel Engine System Design; Elsevier: Amsterdam, The Netherlands, 2011. [Google Scholar]
- Gupta, H.N. Fundamentals of Internal Combustion Engines; PHI Learning Pvt. Ltd.: Delhi, India, 2012. [Google Scholar]
- Li, Z.; Sun, H.; Xue, Y.; Li, Z.; Jin, X.; Wang, P. Resilience-Oriented Asynchronous Decentralized Restoration Considering Building and E-Bus Co-Response in Electricity-Transportation Networks. IEEE Trans. Transp. Electrif. 2025, 11, 11701–11713. [Google Scholar] [CrossRef]
- Du, Y.; Xue, Y.; Wu, W.; Shahidehpour, M.; Shen, X.; Wang, B.; Sun, H. Coordinated planning of integrated electric and heating system considering the optimal reconfiguration of district heating network. IEEE Trans. Power Syst. 2023, 39, 794–808. [Google Scholar] [CrossRef]
- Lal, A.; You, F. Climate Sustainability through AI-Crypto Synergies and Energy Transition in the Digital Landscape to Cut 0.7 GtCO2e by 2030. Environ. Sci. Technol. 2025, 59, 6061–6073. [Google Scholar] [CrossRef] [PubMed]
| Reference | Year of Publication | PV | Wind Turbine | Diesel Generator | Storage | Converter | Load Profile | HOMER Pro Software 3.14.7524.23887 | Cryptocurrency |
|---|---|---|---|---|---|---|---|---|---|
| Bekele & Boneya [1] | 2012 | Yes | Yes | No | No | No | No | Yes | No |
| Bentouba & Bourouis [2] | 2016 | Yes | Yes | Yes | No | No | No | No | No |
| Ajlan et al. [3] | 2017 | Yes | Yes | No | Yes | No | Yes | Yes | No |
| Rajbongshi et al. [4] | 2017 | Yes | No | Yes | No | No | Yes | No | No |
| Hossain et al. [5] | 2017 | Yes | Yes | Yes | Yes | Yes | No | Yes | No |
| de Vries [6] | 2018 | No | No | No | No | No | No | No | Yes |
| Humbatova et al. [7] | 2019 | No | No | No | No | No | No | No | Yes |
| Krishan & Suhag [8] | 2019 | Yes | Yes | No | Yes | No | No | Yes | No |
| Stoll et al. [9] | 2019 | No | No | No | No | No | No | No | Yes |
| Kristoufek [10] | 2020 | No | No | No | No | No | No | No | Yes |
| Das & Dutta [11] | 2020 | No | No | No | No | No | No | No | Yes |
| Gallersdörfer et al. [12] | 2020 | Yes | Yes | No | No | No | No | No | Yes |
| Karmakar et al. [13] | 2021 | No | No | No | No | No | Yes | No | Yes |
| Hojjat & Kalali [14] | 2021 | Yes | No | No | No | No | No | No | Yes |
| Khalil et al. [15] | 2021 | Yes | Yes | No | No | Yes | Yes | Yes | No |
| Náñez Alonso et al. [16] | 2021 | Yes | Yes | Yes | Yes | Yes | No | No | Yes |
| Nikzad & Mehregan [17] | 2022 | Yes | No | No | No | Yes | Yes | No | Yes |
| Menati et al. [18] | 2023 | No | No | No | No | No | Yes | No | Yes |
| Chamanara et al. [19] | 2023 | No | No | No | No | No | No | No | Yes |
| A. Rudd et al. [20] | 2023 | No | No | No | No | No | No | No | Yes |
| Hajiaghapour-Moghimi et al. [21] | 2024 | Yes | Yes | No | Yes | Yes | Yes | No | Yes |
| Hakimi et al. [22] | 2024 | Yes | No | No | No | Yes | Yes | No | Yes |
| Laimon et al. [23] | 2025 | No | No | No | No | No | No | No | Yes |
| B. Ding et al. [24] | 2025 | No | Yes | No | Yes | No | Yes | No | No |
| Our Work | 2025 | Yes | Yes | Yes | Yes | Yes | Yes | Yes | Yes |
| Parameter | Value |
|---|---|
| Name/Model | SunPower SPR-X22-370 |
| Rated Output Power (kW) | 0.37 kW (370 W) |
| Initial Investment Cost (USD/kW) | 700–1000 USD/kW |
| Operation & Maintenance Cost (USD/kW/year) | 10–20 USD/kW/year |
| Replacement Cost (USD/kW) | 600–800 USD/kW |
| Nominal Operating Temperature (°C) | 45–50 °C |
| Module Efficiency (%) | 22.80% |
| Lifespan (years) | 25 years |
| Tracking System | Fixed or Single-axis Tracking |
| Annual Degradation Factor (%) | 0.25% per year |
| Temperature effects on power (%/°C) | −0.29%/°C |
| Nominal operating cell temperature (NOCT) (°C) | 45 °C |
| Efficiency at standard test conditions (STC) (%) | 22.80% |
| Derating Factor based on installation situation (%) | 10–15% (Dust, Shading, etc.) * |
| Parameter | Value |
|---|---|
| Name/Model | Tumo-Int 10 kW Wind Turbine |
| Rated Output Power | 10 kW |
| Capital Investment Cost | $15,000–20,000 USD |
| Operation & Maintenance Cost | $200–250 USD/year |
| Replacement Cost | $15,000–18,000 USD |
| Lifespan | 15–20 years |
| Cut-in Speed | 3.0 m/s |
| Hub Height | 10 m |
| Output Voltage | 400 V (three-phase) |
| Availability Losses 1 | 0% |
| Wake Effects Losses 2 | 5% |
| Turbine Performance Losses 3 | 10% |
| Electrical Losses 4 | 2% |
| Environmental Losses 5 | 2% |
| Curtailment Losses 6 | 2% |
| Other Losses 7 | 1% |
| Overall, Loss Factor | 22% |
| Parameter | Value |
|---|---|
| Name/Model | Caterpillar C4.4 Diesel Generator |
| Rated Output Power (kW) | 50 kW |
| Capital Investment Cost (USD) | Approx. 10,000–12,000 |
| Replacement Cost (USD) | 8000–10,000 |
| Operation & Maintenance Cost (USD/kW/year) | 15–25 USD, kW/year |
| Lifespan (h) | 20,000–30,000 h |
| Government Diesel Fuel Price (USD/liter) | 0.0047–0.0095 |
| Global Diesel Fuel Price (USD/liter) | 0.95 |
| The following parameters are required in HOMER Pro | |
| Reference Generator Capacity | 50 kW |
| Intercept Coefficient (L/h/kW rated) | 0.23 |
| Slope (L/h/kW output) | 0.15 |
| Carbon Monoxide (g/L of fuel) | 0.02–0.04 |
| Unburned Hydrocarbons (g/L of fuel) | 0.01–0.03 |
| Particulate Matter (g/L of fuel) | 0.098 |
| Proportion of Fuel Sulfur converted to PM (%) | 0.15% |
| Nitrogen Oxides (g/L of fuel) | 0.04–0.06 |
| Pollutant | Amount (g/L of Fuel) |
|---|---|
| Carbon Dioxide (CO2) | 2645.7 |
| Carbon Monoxide (CO) | 0.04 |
| Unburned Hydrocarbons (HC) | 0.03 |
| Particulate Matter (PM) | 0.098 |
| Fuel Sulfur converted to PM | 15% |
| Nitrogen Oxides (NOx) | 0.06 |
| Parameter | Value |
|---|---|
| Brand | kinetic battery model |
| Type | Lead Acid |
| Capital Investment Cost (USD) | 300 |
| Replacement Cost (USD) | 300 |
| Operation & Maintenance Cost (USD/year) | 10 |
| Lifespan (years) | 10 |
| Nominal Voltage (V) | 12 |
| Nominal Capacity (kWh) | 1 |
| Maximum Capacity (Ah) | 83.4 |
| Capacity Ratio | 0.403 |
| Rate Constant (1/h) | 0.827 |
| Roundtrip Efficiency (%) | 0.8 |
| Maximum Charge Current (A) | 16.7 |
| Maximum Discharge Current (A) | 24.3 |
| Maximum Charge Rate (A/Ah) | 1 |
| Throughput (kWh) | 0.8 |
| Site-Specific Input | |
| String Size | 1 |
| Initial State of Charge | 100% |
| Minimum State of Charge | 40% |
| Parameter | Value |
|---|---|
| Name/Model | SMA Sunny Tripower 5.0 Smart Energy—Hybrid |
| Capacity | 56 kW (if cos = 1) |
| Nominal power | 56,000 VA |
| Lifespan (years) | 10 |
| Converter and Rectifier Efficiency | 98% |
| Capital Investment Cost (USD/kW) | $42.5 |
| Replacement Cost (USD/kW) | $42.5 |
| Operation & Maintenance Cost (USD/kW/year) | $15 |
| Storage system | DC coupling |
| Number of MPPTs | 2 pieces |
| MPP voltage min | 250.0 volts |
| MPP voltage max | 800.0 volts |
| Dimensions in mm | L: 173 mm W: 500 mm H: 598 mm |
| Weight | 31 kg |
| Row | Manufacturer | Miner Model | Release | Hashrate | Power | Efficiency | Top Minable Coins Based on Profit | Algorithm | Income/Day | Electricity/Day | Profit/Day |
|---|---|---|---|---|---|---|---|---|---|---|---|
| 1 | Bitmain | Bitmain Antminer AL1 Pro (16.6 Th) | September 2024 | 16.6 Th/s | 3730 W | 0.225 j/Gh | ALPH (Alephium) | Blake3 | $50.67 | $7.16 | $43.51 |
| 2 | Bitmain | Bitmain Antminer AL1 (15.6 Th) | July 2024 | 15.6 Th/s | 3510 W | 0.225 j/Gh | ALPH (Alephium) | Blake3 | $47.62 | $6.74 | $40.88 |
| 3 | IceRiver | IceRiver AL3 | October 2024 | 15 Th/s | 3500 W | 0.233 j/Gh | ALPH (Alephium) | Blake3 | $45.79 | $6.72 | $39.07 |
| 4 | Bitmain | Bitmain Antminer S21e XP Hyd 3U | December 2024 | 860 Th/s | 11,180 W | 13 j/Th | BTC (Bitcoin) | SHA-256 | $40.43 | $21.47 | $18.96 |
| 5 | Bitmain | Bitmain Antminer L9 (16 Gh) | May 2024 | 16 Gh/s | 3360 W | 0.21 j/Mh | DOGE (Dogecoin) & LTC (Litecoin) | Scrypt | $25.59 | $6.45 | $18.31 |
| 6 | Bitmain | Bitmain Antminer L9 (17 Gh) | May 2024 | 17 Gh/s | 3260 W | 0.21 j/Mh | DOGE (Dogecoin) & LTC (Litecoin) | Scrypt | $24.92 | $6.85 | $19.45 |
| 7 | ElphaPex | ElphaPex DG 1+ | April 2024 | 14 Gh/s | 3920 W | 0.28 j/Mh | DOGE (Dogecoin) & LTC (Litecoin) | Scrypt | $22.39 | $7.53 | $14.14 |
| 8 | Bitmain | Bitmain Antminer S21 XP Hyd (473 Th) | November 2024 | 473 Th/s | 5676 W | 12 j/Th | BTC (Bitcoin) | SHA-256 | $22.24 | $10.90 | $11.34 |
| 9 | Bitmain | Bitmain Antminer KS5 Pro (21 Th) | March 2024 | 21 Th/s | 3150 W | 0.15 j/Gh | KAS (Kaspa) | KHeavyHash | $17.66 | $6.05 | $13.39 |
| 10 | Bitmain | Bitmain Antminer KS5 (20 Th) | March 2024 | 20 Th/s | 3000 W | 0.15 j/Gh | KAS (Kaspa) | KHeavyHash | $16.30 | $5.76 | $12.75 |
| 11 | ElphaPex | ElphaPex DG 1 | March 2024 | 11 Gh/s | 3420 W | 0.311 j/Mh | DOGE (Dogecoin) & LTC (Litecoin) | Scrypt | $16.08 | $6.57 | $10.46 |
| Parameter | Value |
|---|---|
| Global (in USA) | |
| Energy system project lifetime (years) | 5 |
| Nominal Discount Rate in 2024 (percent) | ~5.4% [76] |
| Inflation rate in 2024 (percent) | ~4.6% [76] |
| Minimum operating reserve (percent/solar output power) | 80% |
| Minimum operating reserve (percent/wind output power) | 50% |
| Minimum load Ratio (percent/Diesel Generator output power) | 25% |
| Parameter | Value | Description |
|---|---|---|
| Peak Load | 91.94 kW | Maximum combined power demand of miners and cooling systems |
| Scaled Average | 2206.56 kWh/day | Total daily energy requirement based on continuous operation |
| Minimum Load Ratio | 5% | Minimum allowable operating level |
| Storage Capacity | 1103.28 kWh | Equivalent to 50% of daily load; enables up to half-day interruption |
| Sensitivity Input | Values |
|---|---|
| Diesel Fuel Price ($/L) | 0.6, 0.95, 1.0, 1.8 |
| Solar Scaled Average (kWh/m2/day) | 3, 4, 5, 6, 7 |
| Wind Scaled Average (m/s) | 3, 4, 5, 6 |
| Month | Daily Radiation (kWh/m2/day) | Average Wind Speed (m/s) | K (Renewable Supply Coefficient) | Load (kWh) |
|---|---|---|---|---|
| Jan | 3.090 | 4.770 | 0.6 | 0.6 × 91.94 = 55.17 |
| Feb | 4.100 | 5.260 | 0.75 | 68.96 |
| Mar | 4.940 | 5.410 | 0.8 | 73.56 |
| Apr | 5.830 | 5.190 | 0.85 | 78.15 |
| May | 6.640 | 4.800 | 0.9 | 82.75 |
| Jun | 7.340 | 5.090 | 1 | 91.94 |
| Jul | 6.960 | 5.780 | 1 | 91.94 |
| Aug | 6.620 | 5.420 | 0.95 | 87.35 |
| Sep | 5.780 | 4.550 | 0.8 | 73.56 |
| Oct | 4.430 | 4.280 | 0.7 | 64.36 |
| Nov | 3.360 | 4.280 | 0.6 | 55.17 |
| Dec | 2.850 | 4.540 | 0.6 | 55.17 |
| Miner Model | Best Price | Top Minable Coins Based on Profit | Income/Day | NPC(Miners) for 20 Qty | O&M Miners | The Cost of Renting, Labor, Internet Bandwidth | NPC (Energy System—Local Fuel Cost) | Total Power for Miners Consumption (kW) | = 0.7, COP = 4) | Total Power Consumption (kW) | Total Income (365 Days—1 Year) | Total Income with USA Inflation Rate for 5 Years | Total NPC | Income 1st Year | Income 2nd Year | Income 3rd Year | Income 4th Year | Income 5th Year | IRR |
|---|---|---|---|---|---|---|---|---|---|---|---|---|---|---|---|---|---|---|---|
| Bitmain Antminer AL1 Pro (16.6 Th) | $9990 | ALPH | $50.67 | $199,800 | $39,960 | $20,000 | $62,534 | 74.6 | 17.3445 | 91.9445 | $369,891 | $1,619,298 | $322,294 | $353,624.28 | $338,072.93 | $323,205.48 | $308,991.85 | $295,403.30 | 103% |
| Bitmain Antminer AL1 (15.6 Th) | $9299 | ALPH | $47.62 | $185,980 | $37,196 | $20,000 | $60,044 | 70.2 | 16.3215 | 86.5215 | $347,626 | $1,521,827 | $303,220 | $332,338.43 | $317,723.17 | $303,750.64 | $290,392.58 | $277,621.97 | 103% |
| IceRiver AL3 | $9450 | ALPH | $45.79 | $189,000 | $37,800 | $20,000 | $60,044 | 70 | 16.275 | 86.275 | $334,267 | $1,463,344 | $306,844 | $319,566.92 | $305,513.31 | $292,077.73 | $279,233.01 | $266,953.17 | 97% |
| Bitmain Antminer S21e XP Hyd 3U | $19,705 | BTC | $40.43 | $394,100 | $78,820 | $20,000 | $186,992 | 223.6 | 51.987 | 275.587 | $295,139 | $1,292,051 | $679,912 | $282,159.66 | $269,751.11 | $257,888.25 | $246,547.08 | $235,704.67 | 27% |
| Bitmain Antminer L9 (16 Gh) | $6450 | DOGE& LTC | $25.59 | $129,000 | $25,800 | $20,000 | $56,151 | 67.2 | 15.624 | 82.824 | $186,807 | $817,798 | $230,951 | $178,591.78 | $170,737.84 | $163,229.29 | $156,050.95 | $149,188.29 | 68% |
| Bitmain Antminer L9 (17 Gh) | $6630 | DOGE& LTC | $24.92 | $132,600 | $26,520 | $20,000 | $55,075 | 65.2 | 15.159 | 80.359 | $181,916 | $796,386 | $234,195 | $173,915.87 | $166,267.56 | $158,955.60 | $151,965.20 | $145,282.22 | 65% |
| ElphaPex DG 1+ | $7521 | DOGE& LTC | $22.39 | $150,420 | $30,084 | $20,000 | $67,399 | 78.4 | 18.228 | 96.628 | $163,447 | $715,533 | $267,903 | $156,259.08 | $149,387.27 | $142,817.66 | $136,536.96 | $130,532.46 | 47% |
| Bitmain Antminer S21 XP Hyd (473 Th) | $9100 | BTC | $22.24 | $182,000 | $36,400 | $20,000 | $120,030 | 113.52 | 26.3934 | 139.9134 | $162,352 | $710,740 | $358,430 | $155,212.24 | $148,386.46 | $141,860.86 | $135,622.24 | $129,657.97 | 29% |
| Bitmain Antminer KS5 Pro (21 Th) | $2650 | KAS | $17.66 | $53,000 | $10,600 | $20,000 | $54,355 | 63 | 14.6475 | 77.6475 | $128,918 | $564,373 | $137,955 | $123,248.57 | $117,828.46 | $112,646.71 | $107,692.84 | $102,956.82 | 81% |
| Bitmain Antminer KS5 (20 Th) | $2180 | KAS | $16.30 | $43,600 | $8720 | $20,000 | $50,255 | 60 | 13.95 | 73.95 | $118,990 | $520,911 | $122,575 | $113,757.17 | $108,754.46 | $103,971.76 | $99,399.39 | $95,028.10 | 85% |
| ElphaPex DG 1 | $4940 | DOGE& LTC | $16.08 | $98,800 | $19,760 | $20,000 | $57,830 | 68.4 | 15.903 | 84.303 | $117,384 | $513,880 | $196,390 | $112,221.80 | $107,286.61 | $102,568.46 | $98,057.80 | $93,745.51 | 46% |
| Emission Species | Config 1 * | Config 2 | Config 3 | Config 4 | Config 5 | Config 6 | Config 7 | Config 8 |
|---|---|---|---|---|---|---|---|---|
| Carbon Dioxide (kg/year) | 852,688 | 852,340 | 849,183 | 849,143 | 1,385,746 | 1,385,744 | 1,382,240 | 1,381,243 |
| Carbon Monoxide (kg/year) | 12.9 | 12.8 | 12.8 | 12.8 | 21 | 21 | 20.9 | 20.9 |
| Sulfur Dioxide (kg/year) | 9.67 | 9.66 | 9.63 | 9.63 | 15.7 | 15.7 | 15.7 | 15.7 |
| Particulate Matter (kg/year) | 31.6 | 31.6 | 31.5 | 31.5 | 51.3 | 51.3 | 51.2 | 51.2 |
| Nitrogen Oxides (kg/year) | 2111 | 2110 | 2102 | 2102 | 3431 | 3431 | 3422 | 3420 |
| Unburned Hydrocarbons (kg/year) | 19.3 | 19.3 | 19.3 | 19.3 | 31.4 | 31.4 | 31.3 | 31.3 |
| Total Emissions (kg/year) | 854,872 | 854,523 | 851,358 | 851,318 | 1,389,296 | 1,389,294 | 1,385,781 | 1,384,782 |
| Configuration Number | PV Panel (kW) | Wind Turbine (kW) | Diesel Generator (kW) | Battery (kWh) | Converter (kW) | NPC (USD) | COE (USD/kWh) | Emission Rate (kg/year) |
|---|---|---|---|---|---|---|---|---|
| 1 | - | - | ✔* 100 | ✔ 5 | ✔ 1.63 | $62,533.88 | 0.01588658 | 854,872 |
| 2 | ✔ 0.502 | - | ✔ 100 | ✔ 5 | ✔ 2.92 | $63,039.56 | 0.01601505 | 854,523 |
| 3 | - | ✔ 10 | ✔ 100 | ✔ 4 | ✔ 2.03 | $67,453.81 | 0.01713648 | 851,358 |
| 4 | ✔ 0.0578 | ✔ 10 | ✔ 100 | ✔ 4 | ✔ 1.91 | $67,487.29 | 0.01714498 | 851,318 |
| 5 | - | - | ✔ 200 | - | - | $117,103.30 | 0.02974981 | 1,389,296 |
| 6 | ✔ 0.00182 | - | ✔ 200 | - | ✔ 1.41 | $117,239.10 | 0.02978431 | 1,389,294 |
| 7 | - | ✔ 10 | ✔ 200 | - | - | $122,189.80 | 0.03104202 | 1,385,781 |
| 8 | ✔ 2.94 | ✔ 10 | ✔ 200 | - | ✔ 0.705 | $124,521.60 | 0.03163441 | 1,384,782 |
| Miner Model | Best Price | Top Minable Coins Based on Profit | Income/Day | NPC(Miners) for 20 Qty | O&M Miners | The Cost of Renting, Labor, Internet Bandwidth | NPC (Energy System—USA Fuel Cost) | Total Power for Miners Consumption (kW) | = 0.7, COP = 4) | Total Power Consumption (kW) | Total Income (365 Days—1 Year) | Total Income with USA Inflation Rate for 5 Years | Total NPC | Income 1st Year | Income 2nd Year | Income 3rd Year | Income 4th Year | Income 5th Year | IRR |
|---|---|---|---|---|---|---|---|---|---|---|---|---|---|---|---|---|---|---|---|
| Bitmain Antminer AL1 Pro (16.6 Th) | $9990 | ALPH | $50.67 | $199,800 | $39,960 | $20,000 | $1,350,975 | 74.6 | 17.3445 | 91.9445 | $369,891 | $1,619,298 | $1,610,735 | $353,624.28 | $338,072.93 | $323,205.48 | $308,991.85 | $295,403.30 | 0.2% |
| Bitmain Antminer AL1 (15.6 Th) | $9299 | ALPH | $47.62 | $185,980 | $37,196 | $20,000 | $1,100,000 | 70.2 | 16.3215 | 86.5215 | $347,626 | $1,521,827 | $1,343,176 | $332,338.43 | $317,723.17 | $303,750.64 | $290,392.58 | $277,621.97 | 4% |
| IceRiver AL3 | $9450 | ALPH | $45.79 | $189,000 | $37,800 | $20,000 | $1,100,000 | 70 | 16.275 | 86.275 | $334,267 | $1,463,344 | $1,346,800 | $319,566.92 | $305,513.31 | $292,077.73 | $279,233.01 | $266,953.17 | 3% |
| Bitmain Antminer S21e XP Hyd 3U | $19,705 | BTC | $40.43 | $394,100 | $78,820 | $20,000 | $3,520,000 | 223.6 | 51.987 | 275.587 | $295,139 | $1,292,051 | $4,012,920 | $282,159.66 | $269,751.11 | $257,888.25 | $246,547.08 | $235,704.67 | −29% |
| Bitmain Antminer L9 (16 Gh) | $6450 | DOGE& LTC | $25.59 | $129,000 | $25,800 | $20,000 | $1,050,000 | 67.2 | 15.624 | 82.824 | $186,807 | $817,798 | $1,224,800 | $178,591.78 | $170,737.84 | $163,229.29 | $156,050.95 | $149,188.29 | −12% |
| Bitmain Antminer L9 (17 Gh) | $6630 | DOGE& LTC | $24.92 | $132,600 | $26,520 | $20,000 | $1,020,000 | 65.2 | 15.159 | 80.359 | $181,916 | $796,386 | $1,199,120 | $173,915.87 | $166,267.56 | $158,955.60 | $151,965.20 | $145,282.22 | −13% |
| ElphaPex DG 1+ | $7521 | DOGE& LTC | $22.39 | $150,420 | $30,084 | $20,000 | $1,230,000 | 78.4 | 18.228 | 96.628 | $163,447 | $715,533 | $1,430,504 | $156,259.08 | $149,387.27 | $142,817.66 | $136,536.96 | $130,532.46 | −20% |
| Bitmain Antminer S21 XP Hyd (473 Th) | $9100 | BTC | $22.24 | $182,000 | $36,400 | $20,000 | $1,920,000 | 113.52 | 26.3934 | 139.9134 | $162,352 | $710,740 | $2,158,400 | $155,212.24 | $148,386.46 | $141,860.86 | $135,622.24 | $129,657.97 | −29% |
| Bitmain Antminer KS5 Pro (21 Th) | $2650 | KAS | $17.66 | $53,000 | $10,600 | $20,000 | $994,366 | 63 | 14.6475 | 77.6475 | $128,918 | $564,373 | $1,077,966 | $123,248.57 | $117,828.46 | $112,646.71 | $107,692.84 | $102,956.82 | −19% |
| Bitmain Antminer KS5 (20 Th) | $2180 | KAS | $16.30 | $43,600 | $8720 | $20,000 | $936,261 | 60 | 13.95 | 73.95 | $118,990 | $520,911 | $1,008,581 | $113,757.17 | $108,754.46 | $103,971.76 | $99,399.39 | $95,028.10 | −19% |
| ElphaPex DG 1 | $4940 | DOGE& LTC | $16.08 | $98,800 | $19,760 | $20,000 | $1,070,000 | 68.4 | 15.903 | 84.303 | $117,384 | $513,880 | $1,208,560 | $112,221.80 | $107,286.61 | $102,568.46 | $98,057.80 | $93,745.51 | −24% |
| Emission Species | Config 1 * | Config 2 | Config 3 | Config 4 | Config 5 | Config 6 | Config 7 | Config 8 |
|---|---|---|---|---|---|---|---|---|
| Carbon Dioxide (kg/year) | 594,158 | 578,046 | 791,007 | 852,688 | 1,191,290 | 1,159,044 | 1,385,746 | 1,384,818 |
| Carbon Monoxide (kg/year) | 8.98 | 8.74 | 12 | 12.9 | 18 | 17.5 | 21 | 20.9 |
| Sulfur Dioxide (kg/year) | 6.74 | 6.55 | 8.97 | 9.67 | 13.5 | 13.1 | 15.7 | 15.7 |
| Particulate Matter (kg/year) | 22 | 21.4 | 29.3 | 31.6 | 44.1 | 42.9 | 51.3 | 51.3 |
| Nitrogen Oxides (kg/year) | 1471 | 1431 | 1958 | 2111 | 2949 | 2869 | 3431 | 3428 |
| Unburned Hydrocarbons (kg/year) | 13.5 | 13.1 | 17.9 | 19.3 | 27 | 26.3 | 31.4 | 31.4 |
| Total Emissions (kg/year) | 595,680 | 579,527 | 793,033 | 854,872 | 1,194,342 | 1,162,013 | 1,389,296 | 1,388,365 |
| Configuration Number | PV Panel (kW) | Wind Turbine (kW) | Diesel Generator (kW) | Battery (kWh) | Converter (kW) | NPC (USD) | COE (USD/kWh) | Emission Rate (kg/year) |
|---|---|---|---|---|---|---|---|---|
| 1 | - | ✔* 390 | ✔ 90 | ✔ 304 | ✔ 76.9 | $1,350,975 | 0.3432118 | 595,680 |
| 2 | ✔ 1.27 | ✔ 440 | ✔ 90 | ✔ 302 | ✔ 77.62 | $1,352,003 | 0.343473 | 579,527 |
| 3 | ✔ 75.56 | - | ✔ 90 | ✔ 209 | ✔ 65.64 | $1,537,458 | 0.3906226 | 793,033 |
| 4 | - | - | ✔ 100 | ✔ 5 | ✔ 1.63 | $1,543,946 | 0.3922358 | 854,872 |
| 5 | - | ✔ 600 | ✔ 200 | - | $2,483,739 | 0.6309879 | 1,194,342 | |
| 6 | ✔ 0.92 | ✔ 730 | ✔ 200 | - | ✔ 0.55 | $2,492,950 | 0.6333279 | 1,162,013 |
| 7 | - | - | ✔ 200 | - | $2,524,618 | 0.6413732 | 1,389,296 | |
| 8 | ✔ 11.49 | - | ✔ 200 | - | ✔ 0.72 | $2,531,970 | 0.6432409 | 1,388,365 |
| Scenario Number | Electricity Generated for Sale to Grid in 1 Year (kWh) | Guaranteed Purchase Price (USD) | Revenue from Sale to Grid in 1 Year (USD) (kWh) | Miner Income (365 Days—1 Year) | Total Income (365 Days—1 Year) | Total Revenue from Electricity Sale to Grid Over Project Lifetime (USD) | Total Farm Downtime in One Year (Hours) | Farm Operation Ratio in a Year (Relative to Full-Time Operation) | Revenue from the Mining Farm over the Project Lifetime (USD) | Total Revenue from the Mining Farm and Grid Electricity Sales over the Project Lifetime (USD) | NPV | Total NPC | IRR |
|---|---|---|---|---|---|---|---|---|---|---|---|---|---|
| A | 68,405 | $0.058 | $3967 | $338,476 | $342,443 | $17,369 | 744 | 0.9151 | $1,481,768 | $1,499,137 | $1,176,843 | $322,294 | 94% |
| B | 136,809 | $0.058 | $7935 | $307,060 | $314,995 | $34,737 | 1488 | 0.8301 | $1,344,239 | $1,378,976 | $1,056,682 | $322,294 | 86% |
| C | 45,603 | $0.058 | $2645 | $348,947 | $351,592 | $11,579 | 496 | 0.9434 | $1,527,612 | $1,539,191 | $1,216,897 | $322,294 | 97% |
| Equipment | Optimal Capacity | NPC of Microgrid (USD) | COE (USD/kWh) | Emission Rate (kg/Year) | Cost of Mining Equipment (USD) + O&M Miners + The Cost of Renting, Labor, Internet Bandwidth | Total NPC | Revenue from Mining Farm (USD) | NPV (USD) | IRR |
|---|---|---|---|---|---|---|---|---|---|
| PV | 1008 (kW) | $2,300,000 | 0.584 | 0 | $259,760 | $2,559,760 | $1,619,298 | −$940,462 | −10% |
| Storage | 7361 (kWh) | ||||||||
| Converter | 125 (kW) |
| Electricity Generated for Sale to Grid in 1 Year (kWh) | Guaranteed Purchase Price (USD) | Revenue from Sale to Grid in 1 Year (USD) (kWh) | Miner Income (365 Days—1 Year) | Total Income (365 Days—1 Year) | Total Revenue from Electricity Sale to Grid over Project Lifetime (USD) | Revenue from the Mining Farm over the Project Lifetime (USD) | Total Revenue from the Mining Farm and Grid Electricity Sales over the Project Lifetime (USD) | NPV | Total NPC | IRR |
|---|---|---|---|---|---|---|---|---|---|---|
| 2,060,391 | $0.058 | $119,503 | $369,891 | $489,394 | $523,155 | $1,619,298 | $2,142,453 | $2,689,306.11 | $546,853 | 77% |
| Emission Species | Config 1 * | Config 2 | Config 3 | Config 4 | Config 5 | Config 6 | Config 7 | Config 8 |
|---|---|---|---|---|---|---|---|---|
| Carbon Dioxide (kg/year) | 3,535,904 | 3,535,049 | 3,532,412 | 3,530,738 | 3,802,554 | 3,802,549 | 3,799,063 | 3,796,401 |
| Carbon Monoxide (kg/year) | 53.5 | 53.5 | 53.4 | 53.4 | 57.5 | 57.5 | 57.4 | 57.4 |
| Sulfur Dioxide (kg/year) | 40.1 | 40.1 | 40.1 | 40 | 43.1 | 43.1 | 43.1 | 43 |
| Particulate Matter (kg/year) | 131 | 131 | 131 | 131 | 141 | 141 | 141 | 141 |
| Nitrogen Oxides (kg/year) | 8754 | 8752 | 8745 | 8741 | 9414 | 9414 | 9405 | 9399 |
| Unburned Hydrocarbons (kg/year) | 80.2 | 80.2 | 80.1 | 80.1 | 86.2 | 86.2 | 86.2 | 86.1 |
| Total Emissions (kg/year) | 3,544,963 | 3,544,106 | 3,541,462 | 3,539,784 | 3,812,296 | 3,812,291 | 3,808,796 | 3,806,128 |
| Configuration Number | PV Panel (kW) | Wind Turbine (kW) | Diesel Generator (kW) | Battery (kWh) | Converter (kW) | NPC (USD) | COE (USD/kWh) | Emission Rate (kg/Year) |
|---|---|---|---|---|---|---|---|---|
| 1 | - | - | ✔* 450 | ✔ 69.1 | ✔ 22.7 | $287,094 | 0.02050497 | 3,544,963 |
| 2 | ✔ 1.23 | - | ✔ 450 | ✔ 69.1 | ✔ 22.1 | $287,978 | 0.02056811 | 3,544,106 |
| 3 | - | ✔ 10 | ✔ 450 | ✔ 68.1 | ✔ 19.7 | $291,683 | 0.02083276 | 3,541,462 |
| 4 | ✔ 2.42 | ✔ 10 | ✔ 450 | ✔ 71.1 | ✔ 21.6 | $294,324 | 0.02102135 | 3,539,784 |
| 5 | - | - | ✔ 500 | - | - | $298,693 | 0.0213326 | 3,812,296 |
| 6 | ✔ 0.00649 | - | ✔ 500 | - | ✔ 7.17 | $299,382 | 0.02138178 | 3,812,291 |
| 7 | - | ✔ 10 | ✔ 500 | - | - | $303,780 | 0.02169588 | 3,808,796 |
| 8 | ✔ 13.1 | ✔ 10 | ✔ 500 | - | ✔ 1.73 | $314,047 | 0.02242913 | 3,806,128 |
| Simulated Cities | Best Price | Top Minable Coins based on Profit | Income/Day | NPC (Miners) for 20 Qty | O&M Miners | The Cost of Renting, Labor, Internet Bandwidth | NPC (Energy System—USA Fuel Cost) | Total Power for Miners Consumption (kW) | = 0.7, COP = 4) | Total Power Consumption (kW) | Total Income (365 Days—1 Year) | Total Income with USA Inflation Rate for 5 Years | Total NPC | Income 1st Year | Income 2nd Year | Income 3rd Year | Income 4th Year | Income 5th Year | IRR |
|---|---|---|---|---|---|---|---|---|---|---|---|---|---|---|---|---|---|---|---|
| Skopun | $9,990 | ALPH | $50.67 | $199,800 | $39,960 | $20,000 | $706,971 | 74.6 | 17.3445 | 91.9445 | $369,891 | $1,619,298 | $966,731 | $353,624.28 | $338,072.93 | $323,205.48 | $308,991.85 | $295,403.30 | 21% |
| Comodoro Rivadavia | $760,029.70 | $1,019,789 | 18% | ||||||||||||||||
| Kashan | $1,350,975 | $1,610,735 | 0% | ||||||||||||||||
| Trondheim | $1,365,573 | $1,625,333 | 0% | ||||||||||||||||
| Palm Springs | $1,527,977 | $1,787,737 | −3% |
| Emission Species | Skopun | Comodoro Rivadavia | Trondheim | Palm Springs | Kashan |
|---|---|---|---|---|---|
| Carbon Dioxide (kg/year) | 243,211 | 272,807 | 610,009 | 788,520 | 594,158 |
| Carbon Monoxide (kg/year) | 3.68 | 4.12 | 9.22 | 11.9 | 8.98 |
| Sulfur Dioxide (kg/year) | 2.76 | 3.09 | 6.92 | 8.94 | 6.74 |
| Particulate Matter (kg/year) | 9.01 | 10.1 | 22.6 | 29.2 | 22 |
| Nitrogen Oxides (kg/year) | 602 | 675 | 1510 | 1952 | 1471 |
| Unburned Hydrocarbons (kg/year) | 5.52 | 6.19 | 13.8 | 17.9 | 13.5 |
| Total Emissions (kg/year) | 243,834 | 273,506 | 611,572 | 790,540 | 595,680 |
| Optimal Hybrid Systems in Simulated Cities | PV Panel (kW) | Wind Turbine (kW) | Diesel Generator (kW) | Battery (kWh) | Converter (kW) | NPC (USD) | COE (USD/kWh) | Emission Rate (kg/Year) |
|---|---|---|---|---|---|---|---|---|
| Skopun | - | ✔* 370 | ✔ 90 | ✔ 308 | ✔ 78.88 | $706,971 | 0.1796043 | 243,834 |
| Comodoro Rivadavia | - | ✔ 370 | ✔ 90 | ✔ 308 | ✔ 78.16 | $760,029 | 0.1930835 | 273,506 |
| Trondheim | - | ✔ 360 | ✔ 90 | ✔ 306 | ✔ 78.70 | $1,365,573 | 0.3469206 | 611,572 |
| Palm Springs | ✔ 57.89 | ✔ 40 | ✔ 90 | ✔ 135 | ✔ 98.38 | $1,527,977 | 0.3882008 | 790,540 |
| Kashan | - | ✔ 390 | ✔ 90 | ✔ 304 | ✔ 76.9 | $1,350,975 | 0.3432118 | 595,680 |
| Miner Model | Best Price | Top Minable Coins Based on Profit | Income/Day | NPC(Miners) for 20 Qty | O&M Miners | The Cost of Renting, Labor, Internet Bandwidth | NPC (Energy System—USA Fuel Cost) | Total Power for Miners Consumption (kW) | = 0.7, COP = 4) | Total Power Consumption (kW) | Total Income (365 Days—1 Year) | Total Income with USA Inflation Rate for 5 Years | Total NPC | Income 1st Year | Income 2nd Year | Income 3rd Year | Income 4th Year | Income 5th Year | IRR |
|---|---|---|---|---|---|---|---|---|---|---|---|---|---|---|---|---|---|---|---|
| Bitmain Antminer AL1 Pro (16.6 Th) | $9990 | ALPH | $50.67 | $199,800 | $39,960 | $20,000 | $1,340,821 | 74.6 | 17.3445 | 91.9445 | $369,891 | $1,619,298 | $1,600,581 | $353,624.28 | $338,072.93 | $323,205.48 | $308,991.85 | $295,403.30 | 0.40% |
| Emission Species | Config 1 * | Config 2 | Config 3 | Config 4 | Config 5 | Config 6 | Config 7 | Config 8 |
|---|---|---|---|---|---|---|---|---|
| Carbon Dioxide (kg/year) | 580,106 | 606,752 | 675,948 | 606,242 | 851,530 | 851,530 | 851,530 | 851,019 |
| Carbon Monoxide (kg/year) | 9 | 9 | 10 | 9 | 13 | 13 | 13 | 13 |
| Sulfur Dioxide (kg/year) | 7 | 7 | 8 | 7 | 10 | 10 | 10 | 10 |
| Particulate Matter (kg/year) | 22 | 23 | 25 | 23 | 32 | 32 | 32 | 32 |
| Nitrogen Oxides (kg/year) | 1436 | 1502 | 1673 | 1501 | 2108 | 2108 | 2108 | 2107 |
| Unburned Hydrocarbons (kg/year) | 13 | 14 | 15 | 14 | 19 | 19 | 19 | 19 |
| Total Emissions (kg/year) | 581,592 | 608,306 | 677,679 | 607,795 | 853,711 | 853,711 | 853,711 | 853,199 |
| Configuration Number | PV Panel (kW) | Wind Turbine (kW) | Diesel Generator (kW) | Battery (kWh) | Converter (kW) | NPC (USD) | COE (USD/kWh) | Emission Rate (kg/Year) |
|---|---|---|---|---|---|---|---|---|
| 1 | - | ✔* 490 | ✔ 90 | ✔ 167 | ✔ 32.26 | $1,340,821 | 0.3414297 | 581,592 |
| 2 | ✔ 18.42 | ✔ 380 | ✔ 90 | ✔ 149 | ✔ 127 | $1,353,357 | 0.344635 | 608,306 |
| 3 | - | ✔ 410 | ✔ 100 | - | $1,437,153 | 0.3655802 | 677,679 | |
| 4 | ✔ 1.05 | ✔ 730 | ✔ 100 | - | ✔ 1.98 | $1,477,204 | 0.3757679 | 607,795 |
| 5 | - | - | ✔ 100 | - | $1,540,678 | 0.3919305 | 853,711 | |
| 6 | - | - | ✔ 100 | ✔ 2 | ✔ 0.385 | $1,541,124 | 0.3920439 | 853,711 |
| 7 | ✔ 0.002 | - | ✔ 100 | - | ✔ 5.1 | $1,541,167 | 0.3920546 | 853,711 |
| 8 | ✔ 4.17 | - | ✔ 100 | ✔ 1 | ✔ 1.23 | $1,543,339 | 0.3926072 | 853,199 |
| Miner Model | Best Price | Top Minable Coins Based on Profit | Income/Day | NPC(Miners) for 20 Qty | O&M Miners | The Cost of Renting, Labor, Internet Bandwidth | NPC (Energy System—USA Fuel Cost) | Total Power for Miners Consumption (kW) | = 0.7, COP = 4) | Total Power Consumption (kW) | Total Income (365 Days—1 Year) | Total Income with USA Inflation Rate for 5 Years | Total NPC | Income 1st Year | Income 2nd Year | Income 3rd Year | Income 4th Year | Income 5th Year | IRR |
|---|---|---|---|---|---|---|---|---|---|---|---|---|---|---|---|---|---|---|---|
| Bitmain Antminer AL1 Pro (16.6 Th) | $9990 | ALPH | $50.67 | $199,800 | $39,960 | $20,000 | $1,245,373 | 74.6 | 17.3445 | 91.9445 | $294,397 | $1,288,802 | $1,505,133 | $281,450.10 | $269,072.76 | $257,239.73 | $245,927.08 | $235,111.93 | −5.10% |
| Emission Species | Config 1 * | Config 2 | Config 3 | Config 4 | Config 5 | Config 6 | Config 7 | Config 8 |
|---|---|---|---|---|---|---|---|---|
| Carbon Dioxide (kg/year) | 552,673 | 670,962 | 552,482 | 670,962 | 603,906 | 609,037 | 840,796 | 840,796 |
| Carbon Monoxide (kg/year) | 8 | 10 | 8 | 10 | 9 | 9 | 13 | 13 |
| Sulfur Dioxide (kg/year) | 6 | 8 | 6 | 8 | 7 | 7 | 10 | 10 |
| Particulate Matter (kg/year) | 21 | 25 | 21 | 25 | 22 | 23 | 31 | 31 |
| Nitrogen Oxides (kg/year) | 1368 | 1661 | 1368 | 1661 | 1495 | 1508 | 2082 | 2082 |
| Unburned Hydrocarbons (kg/year) | 13 | 15 | 13 | 15 | 14 | 14 | 19 | 19 |
| Total Emissions (kg/year) | 554,089 | 672,681 | 553,898 | 672,681 | 605,453 | 610,598 | 842,950 | 842,950 |
| Configuration Number | PV Panel (kW) | Wind Turbine (kW) | Diesel Generator (kW) | Battery (kWh) | Converter (kW) | NPC (USD) | COE (USD/kWh) | Emission Rate (kg/Year) |
|---|---|---|---|---|---|---|---|---|
| 1 | - | ✔* 430 | ✔ 90 | ✔ 90 | ✔ 15.59 | $1,245,373 | 0.3975044 | 554,089 |
| 2 | - | - | ✔ 80 | ✔ 99 | ✔ 121.65 | $1,246,423 | 0.4139255 | 672,681 |
| 3 | ✔ 2.37 | ✔ 430 | ✔ 90 | ✔ 82 | ✔ 28.96 | $1,246,505 | 0.3978605 | 553,898 |
| 4 | ✔ 0.72 | - | ✔ 80 | ✔ 107 | ✔ 121.84 | $1,248,636 | 0.4146076 | 672,681 |
| 5 | - | ✔ 420 | ✔ 100 | - | - | $1,314,537 | 0.4195304 | 605,453 |
| 6 | ✔ 16.87 | ✔ 400 | ✔ 100 | - | ✔ 1.33 | $1,326,719 | 0.423418 | 610,598 |
| 7 | - | - | ✔ 110 | - | - | $1,526,538 | 0.4871897 | 842,950 |
| 8 | ✔ 0.001 | - | ✔ 110 | - | ✔ 1.40 | $1,526,673 | 0.487233 | 842,950 |
Disclaimer/Publisher’s Note: The statements, opinions and data contained in all publications are solely those of the individual author(s) and contributor(s) and not of MDPI and/or the editor(s). MDPI and/or the editor(s) disclaim responsibility for any injury to people or property resulting from any ideas, methods, instructions or products referred to in the content. |
© 2025 by the authors. Licensee MDPI, Basel, Switzerland. This article is an open access article distributed under the terms and conditions of the Creative Commons Attribution (CC BY) license (https://creativecommons.org/licenses/by/4.0/).
Share and Cite
Nasrinasrabadi, M.; A. Hejazi, M.; Jaberi, A.; Hashemi-Dezaki, H.; Shahinzadeh, H. Maximizing Return on Investment in Cryptocurrency Mining Through Energy Optimization. Energies 2025, 18, 5910. https://doi.org/10.3390/en18225910
Nasrinasrabadi M, A. Hejazi M, Jaberi A, Hashemi-Dezaki H, Shahinzadeh H. Maximizing Return on Investment in Cryptocurrency Mining Through Energy Optimization. Energies. 2025; 18(22):5910. https://doi.org/10.3390/en18225910
Chicago/Turabian StyleNasrinasrabadi, Mohammad, Maryam A. Hejazi, Arefeh Jaberi, Hamed Hashemi-Dezaki, and Hossein Shahinzadeh. 2025. "Maximizing Return on Investment in Cryptocurrency Mining Through Energy Optimization" Energies 18, no. 22: 5910. https://doi.org/10.3390/en18225910
APA StyleNasrinasrabadi, M., A. Hejazi, M., Jaberi, A., Hashemi-Dezaki, H., & Shahinzadeh, H. (2025). Maximizing Return on Investment in Cryptocurrency Mining Through Energy Optimization. Energies, 18(22), 5910. https://doi.org/10.3390/en18225910


