Article

Parameter Optimization for Dual-Mode Operation of Unitized Regenerative Fuel Cells via Steady-State Simulation

by
Yuhang Hu
1,
Yijia Li
1,
Yuehua Li
1,*,
Fang Yang
2,
Bin Zhang
2 and
Dan Wang
2
1
School of Mechanical Engineering, University of Science and Technology Beijing, Beijing 100083, China
2
Xiangyang DAAN Automobile Test Center Corporation Limited, Xiangyang 441004, China
*
Author to whom correspondence should be addressed.
Energies 2025, 18(22), 5899; https://doi.org/10.3390/en18225899
Submission received: 7 June 2025 / Revised: 16 July 2025 / Accepted: 18 August 2025 / Published: 10 November 2025
(This article belongs to the Section D: Energy Storage and Application)

Abstract

Mathematical modeling of unitized regenerative fuel cells (URFCs) faces significant challenges in reconciling parameter conflicts between fuel cell (FC) and electrolysis cell (EC) modes. This study establishes a COMSOL-based multi-physics framework coupling water–gas–heat–electric transport for both operational states. The critical factors associated with the model were identified through a systematic sensitivity analysis of structural and operational parameters, including temperature, exchange current density, conductivity, porosity, and flow rates. FC modes exhibited strong sensitivity to exchange current density (27.8–40.5% performance variation) and conductivity of membrane (10.1–35.6%), while temperature degraded performance (−4.2% to −4.0%). Spatial analysis revealed temperature-induced membrane dehydration and accelerated gas depletion at electrodes, thus explaining the negative correlation. EC modes were dominantly governed by temperature (8.6–9.4%), exchange current density (13.0–16.4%), and conductivity (2.5–13.3%). Channel simulations revealed that elevated temperature contributed to enhanced liquid water fluidity, while high flow rates had a relatively limited effect on mitigating species concentration gradients. Parameter optimization guided by sensitivity thresholds (e.g., porosity > 0.4 in FC GDLs, conductivity > 222 S/m in EC modes) enabled dual-mode calibration. The model achieved <4% error in polarization curve validation under experimental conditions, demonstrating robust prediction of voltage–current dynamics. This work resolves key conflicts of URFC modeling through physics-informed parameterization to provide a foundation for efficient dual-mode system design.

1. Introduction

Green hydrogen is a crucial pathway towards deep decarbonization [1]. The full life-cycle carbon emissions of hydrogen are close to zero when generated by electrolyzing water from renewable energy sources, which makes it irreplaceable for achieving the goal of carbon neutrality [2]. In addition, hydrogen energy has large-scale, long-cycle energy storage capacity, while avoiding the intermittency and volatility of renewable energy sources such as wind and solar. Furthermore, the flexible conversion of hydrogen energy across mediums allows for multi-dimensional synergistic optimization of the energy network [3].
The traditional technologies of hydrogen energy, proton exchange membrane electrolytic cells (PEMECs), and proton exchange membrane fuel cells (PEMFCs) need to be discrete systems, which suffers from equipment redundancy, high cost, and loss of energy efficiency. Proton exchange membrane unitized regenerative fuel cells (PEM-URFCs), operating reversibly between fuel cell (FC) and electrolytic cell (EC) modes using the same electrode assemblies, represent a transformative technology for energy storage and management, particularly vital for renewable energy integration and applications demanding long-duration storage like space explorations and off-grid electricity [4]. In contrast to stand-alone FC/EC stacks, the critical aspect of the URFC is the continuous operation of the electrodes, where the same structure of the stack supports both discharge (power generation) and charge (hydrogen production) cycles, which involves complex dual-mode parameter optimization and the maintenance of electrode integrity during mode switching between wet and dry-like cycles [5].
Current research on PEM-URFC focuses on the following aspects: (1) Developing bifunctional catalysts (e.g., Pt/IrOx [6]) to ensure durability under cyclic oxidation/reduction potentials [7] and dual modes [8,9]; in addition, the optimized constant electrode configurations (CE) URFCs achieve are 57% and 60% RTE for 90% iridium black at 80 °C and 1 A cm−2 with air and O2, respectively [10]; (2) overcoming the opposing demands for water management [11] (hydrophilic needs in the EC mode versus hydrophobic needs in the FC mode) and the asymmetric heat generation/absorption in different modes [12] (the alternating hydrophilic–hydrophobic flow channels with hydrophilic and hydrophobic strips with contact angles of 75° and 126°, respectively, provide excellent water management [13]); (3) optimizing the structural design to accommodate bi-directional gas/liquid flow, such as the amphiphilic Ti porous transport layer (PTL) [14] using ultra-thin polydimethylsiloxane (PDMS) brushes as hydrophobic surface modifiers, which have been validated for FC and EC modes [15]; furthermore, with stratified pore gradients, PTLs [16] are beneficial for mass transfer [17]; (4) enhancing membrane stability and mitigating mechanical stresses [18] on the PEM caused by humidity, pressure, and potentiostatic cycling [19]. It is worth noting that URFCs are still understudied compared to either stand-alone PEMFCs or PEMECs, which stems from the experimental complexity of analyzing two different electrochemical processes in a single stack.
Given the relative paucity of comprehensive experimental data, multi-physics field modeling is indispensable for URFC development. Three-dimensional models of PEMFC or PEMEC alone present difficulties in accurately determining and validating spatially resolved parameters (e.g., local effective diffusivity, thermal conductivity, contact resistance, electrochemically active surface area), which are even more challenging in URFC models.
The modeling requires focusing on dynamic reversible transport mechanisms such as gas/liquid phase pair permeability [20], the capillary pressure–saturation relationship in PTL, electroosmotic resistance coefficients with operating modes (FC or EC), current/polarity directions, and pressure gradients.
In addition, the boundary conditions of the modes and the inversion potential should be of interest. The driving forces at the electrode–film interface are completely opposite to the electrochemical reactions, fundamentally altering the heat source/heatsink, species consumption/generation, and overpotential distribution [21].
The coupling of mass–heat–charge needs to be integrated in URFC modeling, which often includes complex scenarios such as drying, front formation (involving vapor transport, conduction, membrane dehydration), or local flooding (involving liquid pressure, pore plugging, concentration polarization) [22]. In addition, strongly coupled mass transfer (reactants/product gases/liquids), heat generation/conduction/convection, proton/electron charge transfer, and electrochemical kinetic processes should be clarified.
This study utilizes the COMSOL platform to construct a three-dimensional multi-physics field model of the PEM-URFC. The model explicitly incorporates the integrated mass–heat–charge coupling required to analyze the performance and limitations of both FC and EC modes, providing important ideas for advancing this promising but underdeveloped technology. The study aims to address the parameterization challenges associated with dual-mode operation by designing models and targeted sensitivity analyses.

2. Numerical Method

In this study, a 3D multi-physics field coupled numerical model of URFC is established using the COMSOL Multiphysics® 6.2 simulation platform in combination with its embedded PEMEC and PEMFC modules. The complete structure of the model is shown in Figure 1.
Regarding the modeling methodology, the study follows a strict multi-physics coupling process. Based on the theoretical framework of electrochemistry–hydrodynamics–heat and mass transfer, the system of control equations is firstly established. Then the mass, momentum, charge, and energy conservation equations and their corresponding boundary conditions are systematically elaborated, with respect to the two modes of operation of the PEMEC and PEMFC. Finally, the numerical solution of the equations is realized by the finite element analysis method, and adaptive mesh encryption is adopted to ensure the computational accuracy.
The key geometrical parameters of the model are listed in Table 1. However, it should be noted that the catalytic layer in the model is treated by the thin-layer interface approximation method, which has been confirmed by the validation experiments in the preliminary stage [23].

2.1. Geometric Configuration

The 3D geometrical configuration of the computational domain is shown in Figure 1, and the model adopts a symmetric layered design covering the cathode and anode bifunctional assemblies, which contain the flow field ribbed plate (RIB), the gas flow channel (GC), the gas diffusion layer (GDL), the bipolar plates (BP), and the catalytic layer (CL), with ionic conduction and gas isolation realized by the proton exchange membrane (PEM) at both sides.
Extremely fine size was chosen for meshing the EC model in this study. The meshes are drawn by first dividing all edges in the X–Z plane. Then the PEM, CL, PTL /GDL, GC, and BP at the entrance cross-section are mapped for division. Finally, sweeping is performed along the Y-axis. The maximum and minimum unit sizes were 0.6 mm and 0.006 mm, respectively, with a maximum unit growth rate of 1.3, a curvature factor of 0.2, and a narrow region resolution of 1. The resulting grid was constructed with larger grid elements for the BP plate and smaller grid elements for the catalyst layer. The number of grid elements plotted is 58,752, with a minimum unit mass and average unit mass of 1.0, a unit volume ratio of about 0.0011, and a grid volume of about 0.5 mm3.
In the EC mode, liquid water is supplied from the anode side channel (AGC) inlet and migrates to the catalytic layer of anode side (ACL) through the capillary force-dominated permeation process in the PTL. The water molecules undergo an oxidation reaction at the gas–liquid–solid three-phase interface of the ACL, and the generated oxygen and the residual liquid water form a gas–liquid two-phase flow, which is discharged through the AGC outlet. At the same time, H+ released by the reaction combines with electrons transported through the ribbed plate of the cathode side (CRIB) to form H2 in the cathode side catalytic layer (CCL). Hydrogen is in turn discharged along the cathode side channel (CGC) outlet under the synergistic effects of concentration gradient and convection. The principle of the reaction is shown in Equations (1)–(3).
In FC mode, the humidified processed oxygen and hydrogen are injected through the CGC and AGC inlets, respectively. When the wet hydrogen flows through the gas diffusion layer of the cathode side (CGDL), the directional transport within the porous medium is realized under the pressure gradient and diffusion. The mass transfer efficiency of wet oxygen through the gas diffusion layer of the anode side (AGDL) is dynamically regulated by the saturation degree of the gas phase and the volume fraction of liquid water. At the three-phase reaction interface, hydrogen oxidation reaction occurs at the anode side, and the released protons are conducted to the cathode side through the PEM, while the electrons form the working current through the external circuit. On the cathode side, oxygen reacts with the protons and electrons migrating there in a reduction reaction, and the generated water molecules are discharged from the AGC outlet through the reverse capillary force drive [24]. The principle of the reaction is shown in Equations (4)–(6).
H 2 O 1 2 O 2 + 2 H + + 2 e
2 H + + 2 e H 2
H 2 O H 2 + 1 2 O 2
H 2 2 H + + 2 e
1 2 O 2 + 2 H + + 2 e H 2 O
H 2 + 1 2 O 2 H 2 O

2.2. Assumptions

In performing the simulation calculations, the three-dimensional model is established in this study based on the following assumptions [25]:
(1)
The flow within the URFC is laminar, and the effect of gravity is neglected;
(2)
Evaporation of water and transfer of concentrated substances at the anode side are neglected;
(3)
All gases are considered as ideal gases and are incompressible;
(4)
PEM is fully hydrated;
(5)
The only manner in which water is transported across the membrane is considered to be electro-osmotic resistance. The effects of diffusion and pressure are ignored;
(6)
PEM is non-permeable to substances;
(7)
Thermal contact resistance between layers is ignored;
(8)
All operations are considered as steady state.

2.3. Governing Equations

In the computational field, the physical problem involves the transport processes of electric charge, gaseous mixtures, and liquid water, and the mathematical model consists of equations for the conservation of mass, momentum, gas, liquid water, and electric charge.
Mass conservation equation (FC + EC)
Anode (anode fluid, PTL/GDL, CL, CH):
ρ u a = Q m
Cathode (cathode chamber fluid, PTL/GDL, CL, CH):
ρ u c = Q m
where ρ is the fluid density, u a and u c are the fluid flow velocity vector, and Q m is the mass source term.
Momentum conservation equation (FC + EC)
ρ u a u a = p + μ 2 u a
ρ u c u c = p + μ 2 u c
where p, μ, and K denote pressure, dynamic viscosity, and permeability, respectively.
Anode (anode fluid, PTL/GDL, CL, CH):
1 ε 2 , p ρ u a u a = p a l + Κ μ κ 1 + β ρ u a + Q m ε p 2 u a + F
K = μ 1 ε p u a + u a T 2 3 μ 1 ε p u a l
Cathode (cathode chamber fluid, PTL/GDL, CL, CH):
1 ε 2 , p ρ u a u a = p c l + Κ μ κ 1 + β ρ u c + Q m ε p 2 u c + F
K = μ 1 ε p u c + u c T 2 3 μ 1 ε p u c l
where ε p is the porosity, p a l and p c l are the fluid pressure, T is the temperature, and F is the volume force term.
Species conservation equation (FC + EC)
Mass transfer equations (solved in anode and cathode chambers, PTL/GDL, CL, CH):
j i + ρ u ω i = R i
j i = ρ ω i k D ˜ i k , e f f x k + 1 p A x k ω k p A
k i x i x k D i k , e f f j i ω i ρ j k ω k ρ = d i
where j is the diffusion flux, ρ is the mixture density, u is the fluid flow rate, D is the diffusion coefficient, ω is the mass fraction, and M is the molar mass.
x k = ω k M k M n , M n = i ω i M i 1 , D i k , e f f = f g D i k
where x is the molar fraction, M n is the average molar mass, D i k , e f f is the effective diffusion coefficient, and p i is the partial pressure, which could be obtained from the following equation:
p i = x i p A
where p A is the absolute pressure.
The effective transfer factor is denoted as
f g = ε g 1.5
where ε g is the gas porosity.
Species conservation equations (solved in a cathode chamber, PTL/GDL, CL, CH):
j i + ρ u ω i = R i
j i = ρ D i m ω i + ρ ω i D i m M n M n j c , i + D e , i T T T
where j is the diffusive flux, ρ is the mixture density, and u is the fluid flow rate.
In this case, j c is given by the following equation:
ω 0 , i = x 0 , i M i M n , D i m = 1 ω i k i x k D e , i k , M n = i ω i M i 1 , j c , i = ρ ω i k M j M n D k m x k
where x is the mole fraction, ω 0 is the initial mass fraction, D m is the mixing average diffusion coefficient, and M n is the average molar mass.
The effective diffusion coefficient in the above equation and the effective thermal diffusion coefficient are expressed as
D e , i k = f e ε p , τ F D i k , D e , i T = f e ε p , τ F D i T
where f e is the effective transfer factor, τ F is the fluid tortuosity factor, and ε p is the porosity.
Gas pressure conservation equation (solved for oxygen in anode PTL/GDL and CL):
ρ κ r g μ g K p g = Q g
Liquid pressure conservation equation (solved in cathode PTL/GDL and CL):
ρ κ r l μ l K p l = Q l
where κ r is the relative permeability, μ , is the dynamic viscosity, and p , is the pressure.
The model establishes the relationship between capillary pressure (Pc) and liquid saturation (sl). With the help of Leverett-J function, the sl in the porous electrode is obtained [25]:
P c = P g P l
P c = σ cos θ ( ε K ) 0.5 J s l
J s l = 1.42 ( 1 s l ) 2.12 ( 1 s l ) 2 + 1.26 ( 1 s l ) 3 θ < 90 °
J s l = 1.42 s l 2.12 s l 2 + 1.26 s l , 3 θ > 90 °
Conservation equation for electric charge
Potential equations (solved in anode and cathode BP, PTL/GDL, and CL)
( σ s e f f ϕ s ) = j ϕ s
Ionic potential equations (solved in anode and cathode CL and membranes)
( σ m e f f ϕ m ) = j ϕ m
where σ s e f f and σ m e f f are the effective conductivity and effective ionic conductivity [26], and ϕ s and ϕ m are the potential and ionic potential, respectively.
Energy conservation equation (solved for the entire computational domain):
ρ f C p , f u T 1 + k e f f T 1 = Q + Q p + Q v d + Q g e o
where ρ f is the fluid density, and C p , f is the fluid heat capacity at constant pressure.
The effective thermal conductivity ( k e f f ) is expressed as
k e f f = k b + ε p k f + k d i s p
where k b is the thermal conductivity of the porous medium, ε p is the porosity, k f is the fluid thermal conductivity, and k d i s p is the thermal dispersion coefficient.
Electrochemical reaction kinetics
The local current density is obtained from the modified Butler–Volmer formula [27]:
i l o c = j exp α a n F η R T exp 1 α c n F η R T
where α a is the anodic transfer coefficient, α c is the cathodic transfer coefficient, R is the molar gas constant, and F is the Faraday constant.
The overpotential η and the exchange current density j are denoted, respectively, as follows:
η = E c t E e q , E c t = φ s φ l , j = i 0 exp E a c t R 1 T 1 T r e f
where Ect is the electrode potential, Eeq is the equilibrium potential, Eact is the activation energy of electrochemical reaction, and the reference temperature (Tref) is taken as 353.15 K.

2.4. Boundary Conditions

Figure 1 shows the main boundaries of the model. Surfaces 1 and 2 are set to ground and potential, respectively. The cell operates in FC mode when the cell voltage is below the equilibrium potential; otherwise, it operates in EC mode. Thermal fluid flows in from the inlets and out from the outlets. In addition, impermeable surfaces were set as boundary conditions for electrical, species, or thermal insulation. The reactant supply and inlet velocities were synchronized with the switching of the cell voltage.

3. Experimental Validation

3.1. Test Rig Design

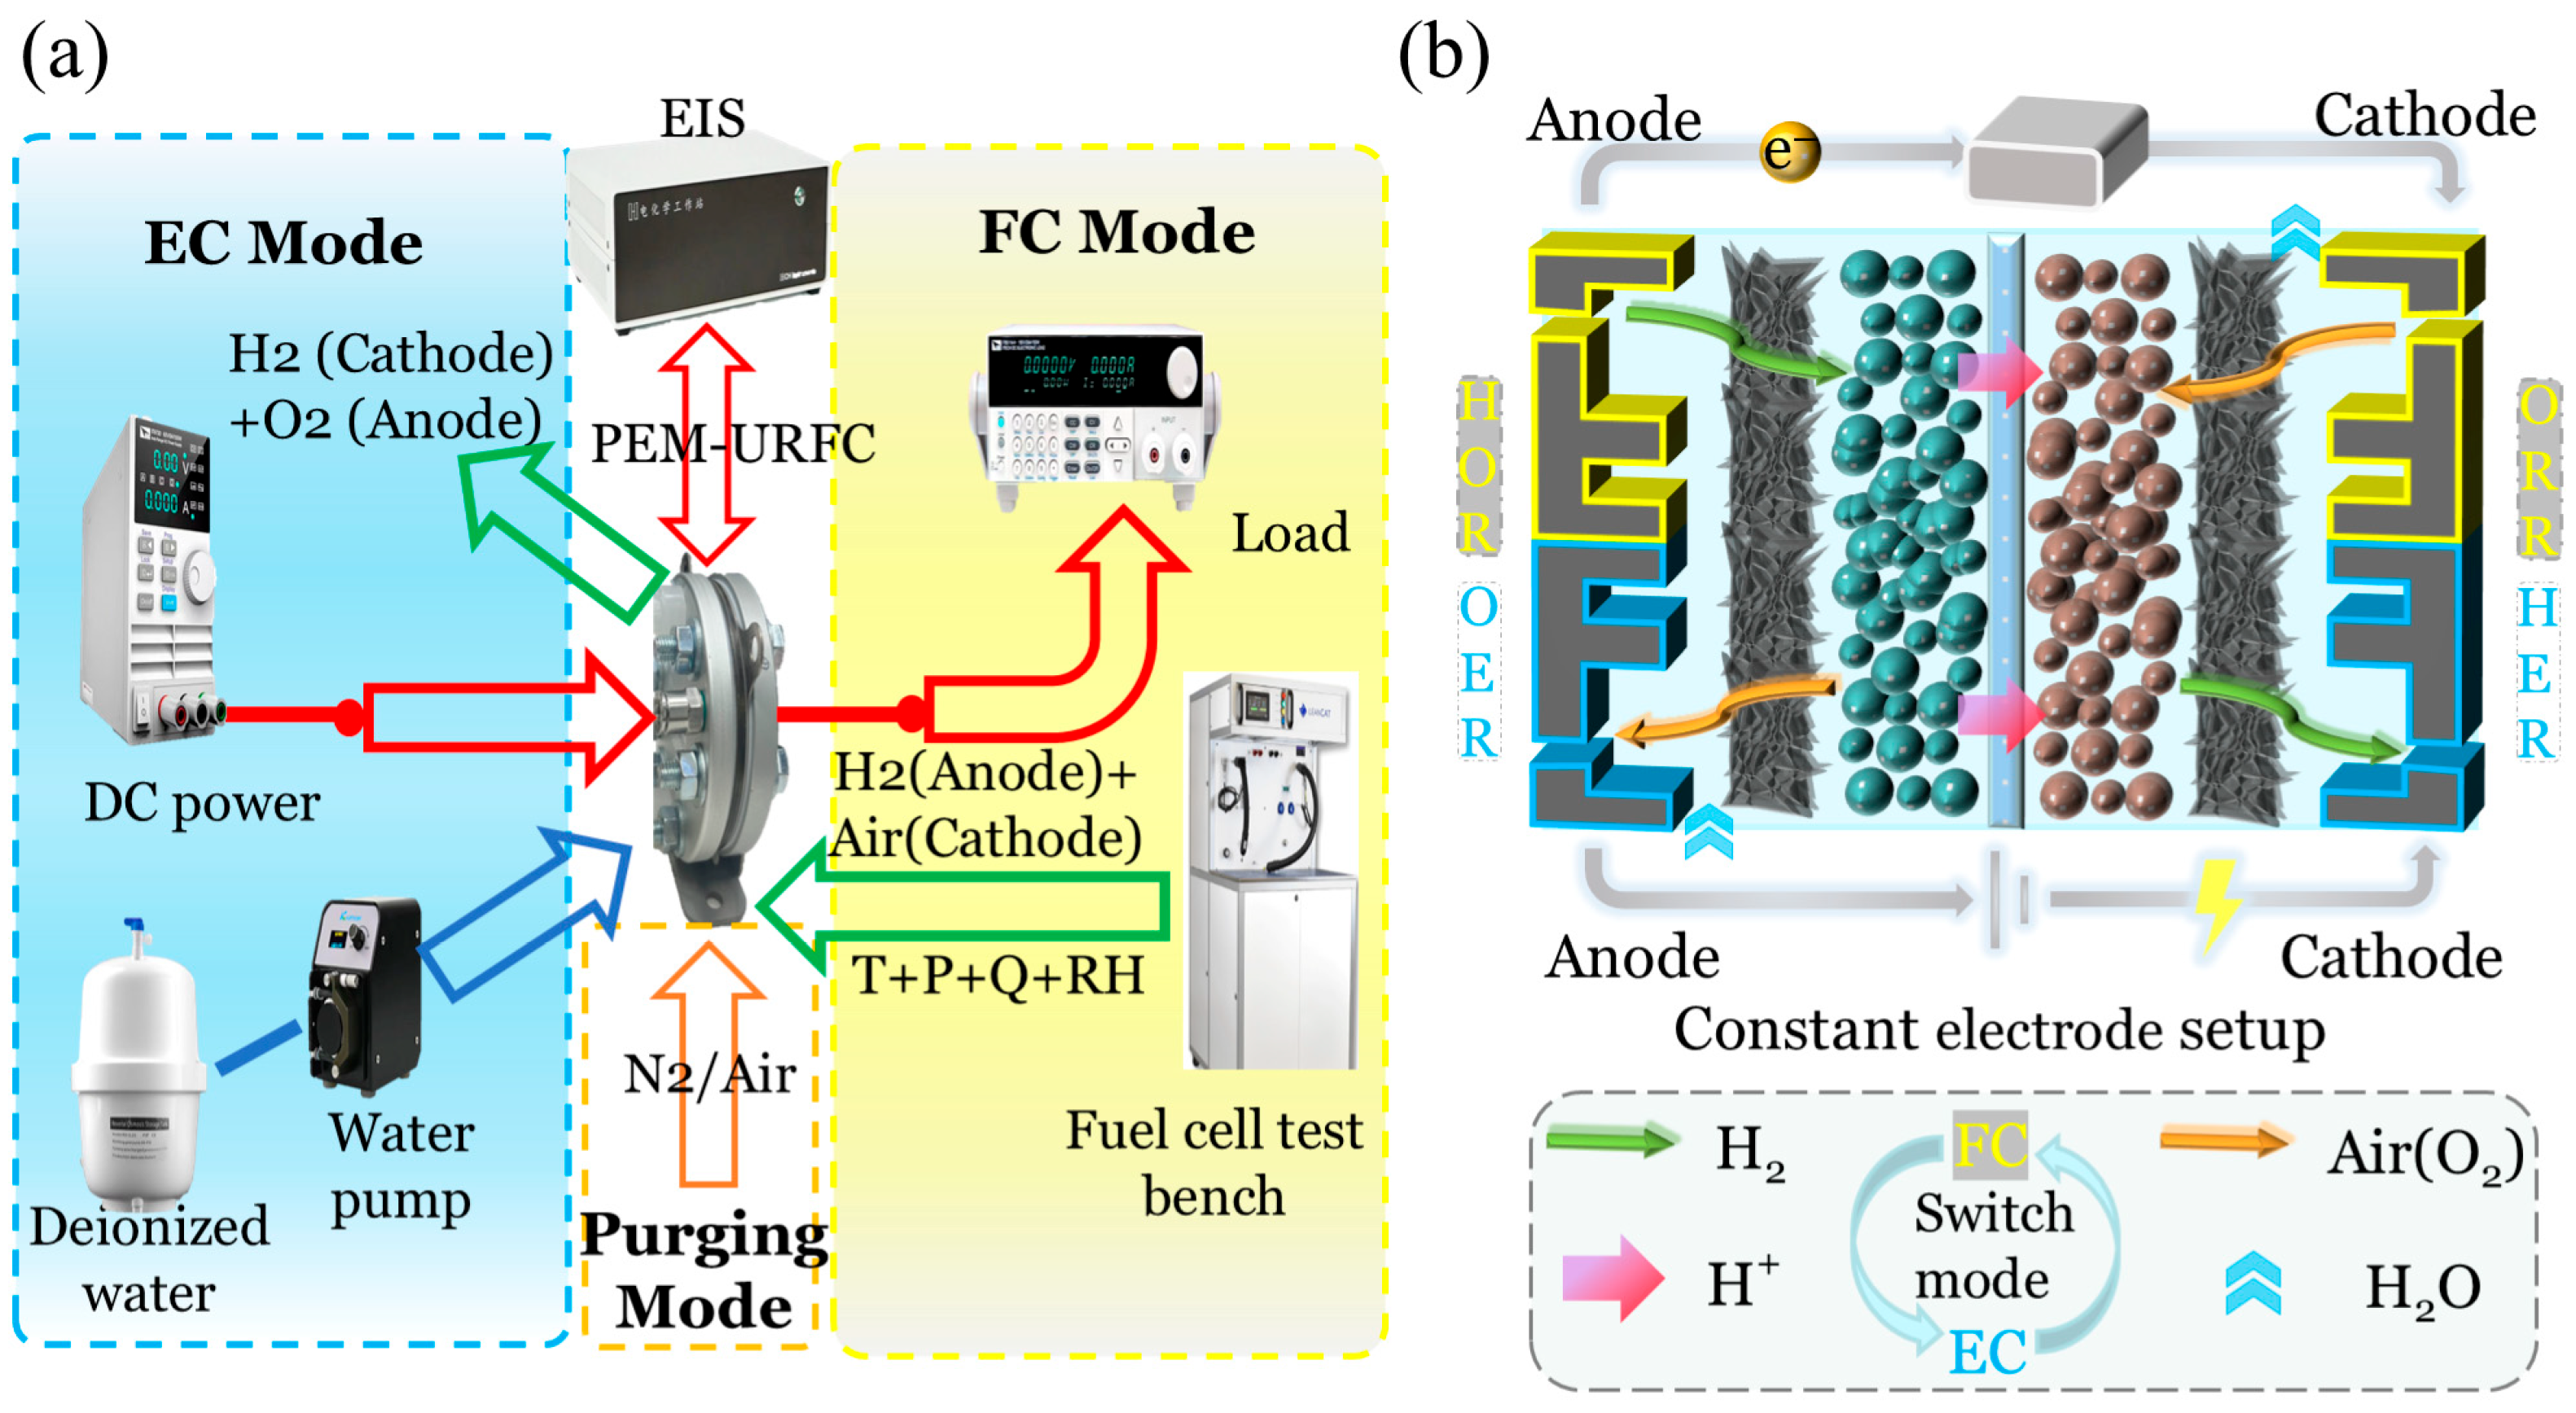
Figure 2a shows a schematic diagram of the experimental apparatus. A 2 kW test bench was used to supply hydrogen and air with accurate and stable temperature (T), pressure (P), flow rate (Q), and relative humidity (RH) for FC mode. The peristaltic pump was used for liquid water charging for EC mode, which is KCS PRO 2-S403-GB from Kamoer, Shanghai, China. The temperature of the PEM-URFC is maintained in both EC and FC modes using a surface-mounted heating band, and the water charging in EC mode is pre-heated with a water-bath heater. The electrochemical workstation is CHI660E (Chinstruments, Austin, TX, USA) for the EIS test. The digital acquisition device (DAQ) is a USB-4716 (Advantech, Taiwan, China) for the sampling of voltage and current. The operating parameters are listed in Table 2. The proton exchange membrane of the URFC used in the study was a Nafion® 117 (183 μm thickness, DuPont, Wilmington, DE, USA). For the anode catalyst loading, 4–5 mg cm−2 iridium black was used, while there was 3–4 mg cm−2 platinum for the cathode catalyst. Moreover, the stack was tested with a constant-electrode configuration, which is shown in Figure 2b.

3.2. Parametric Study

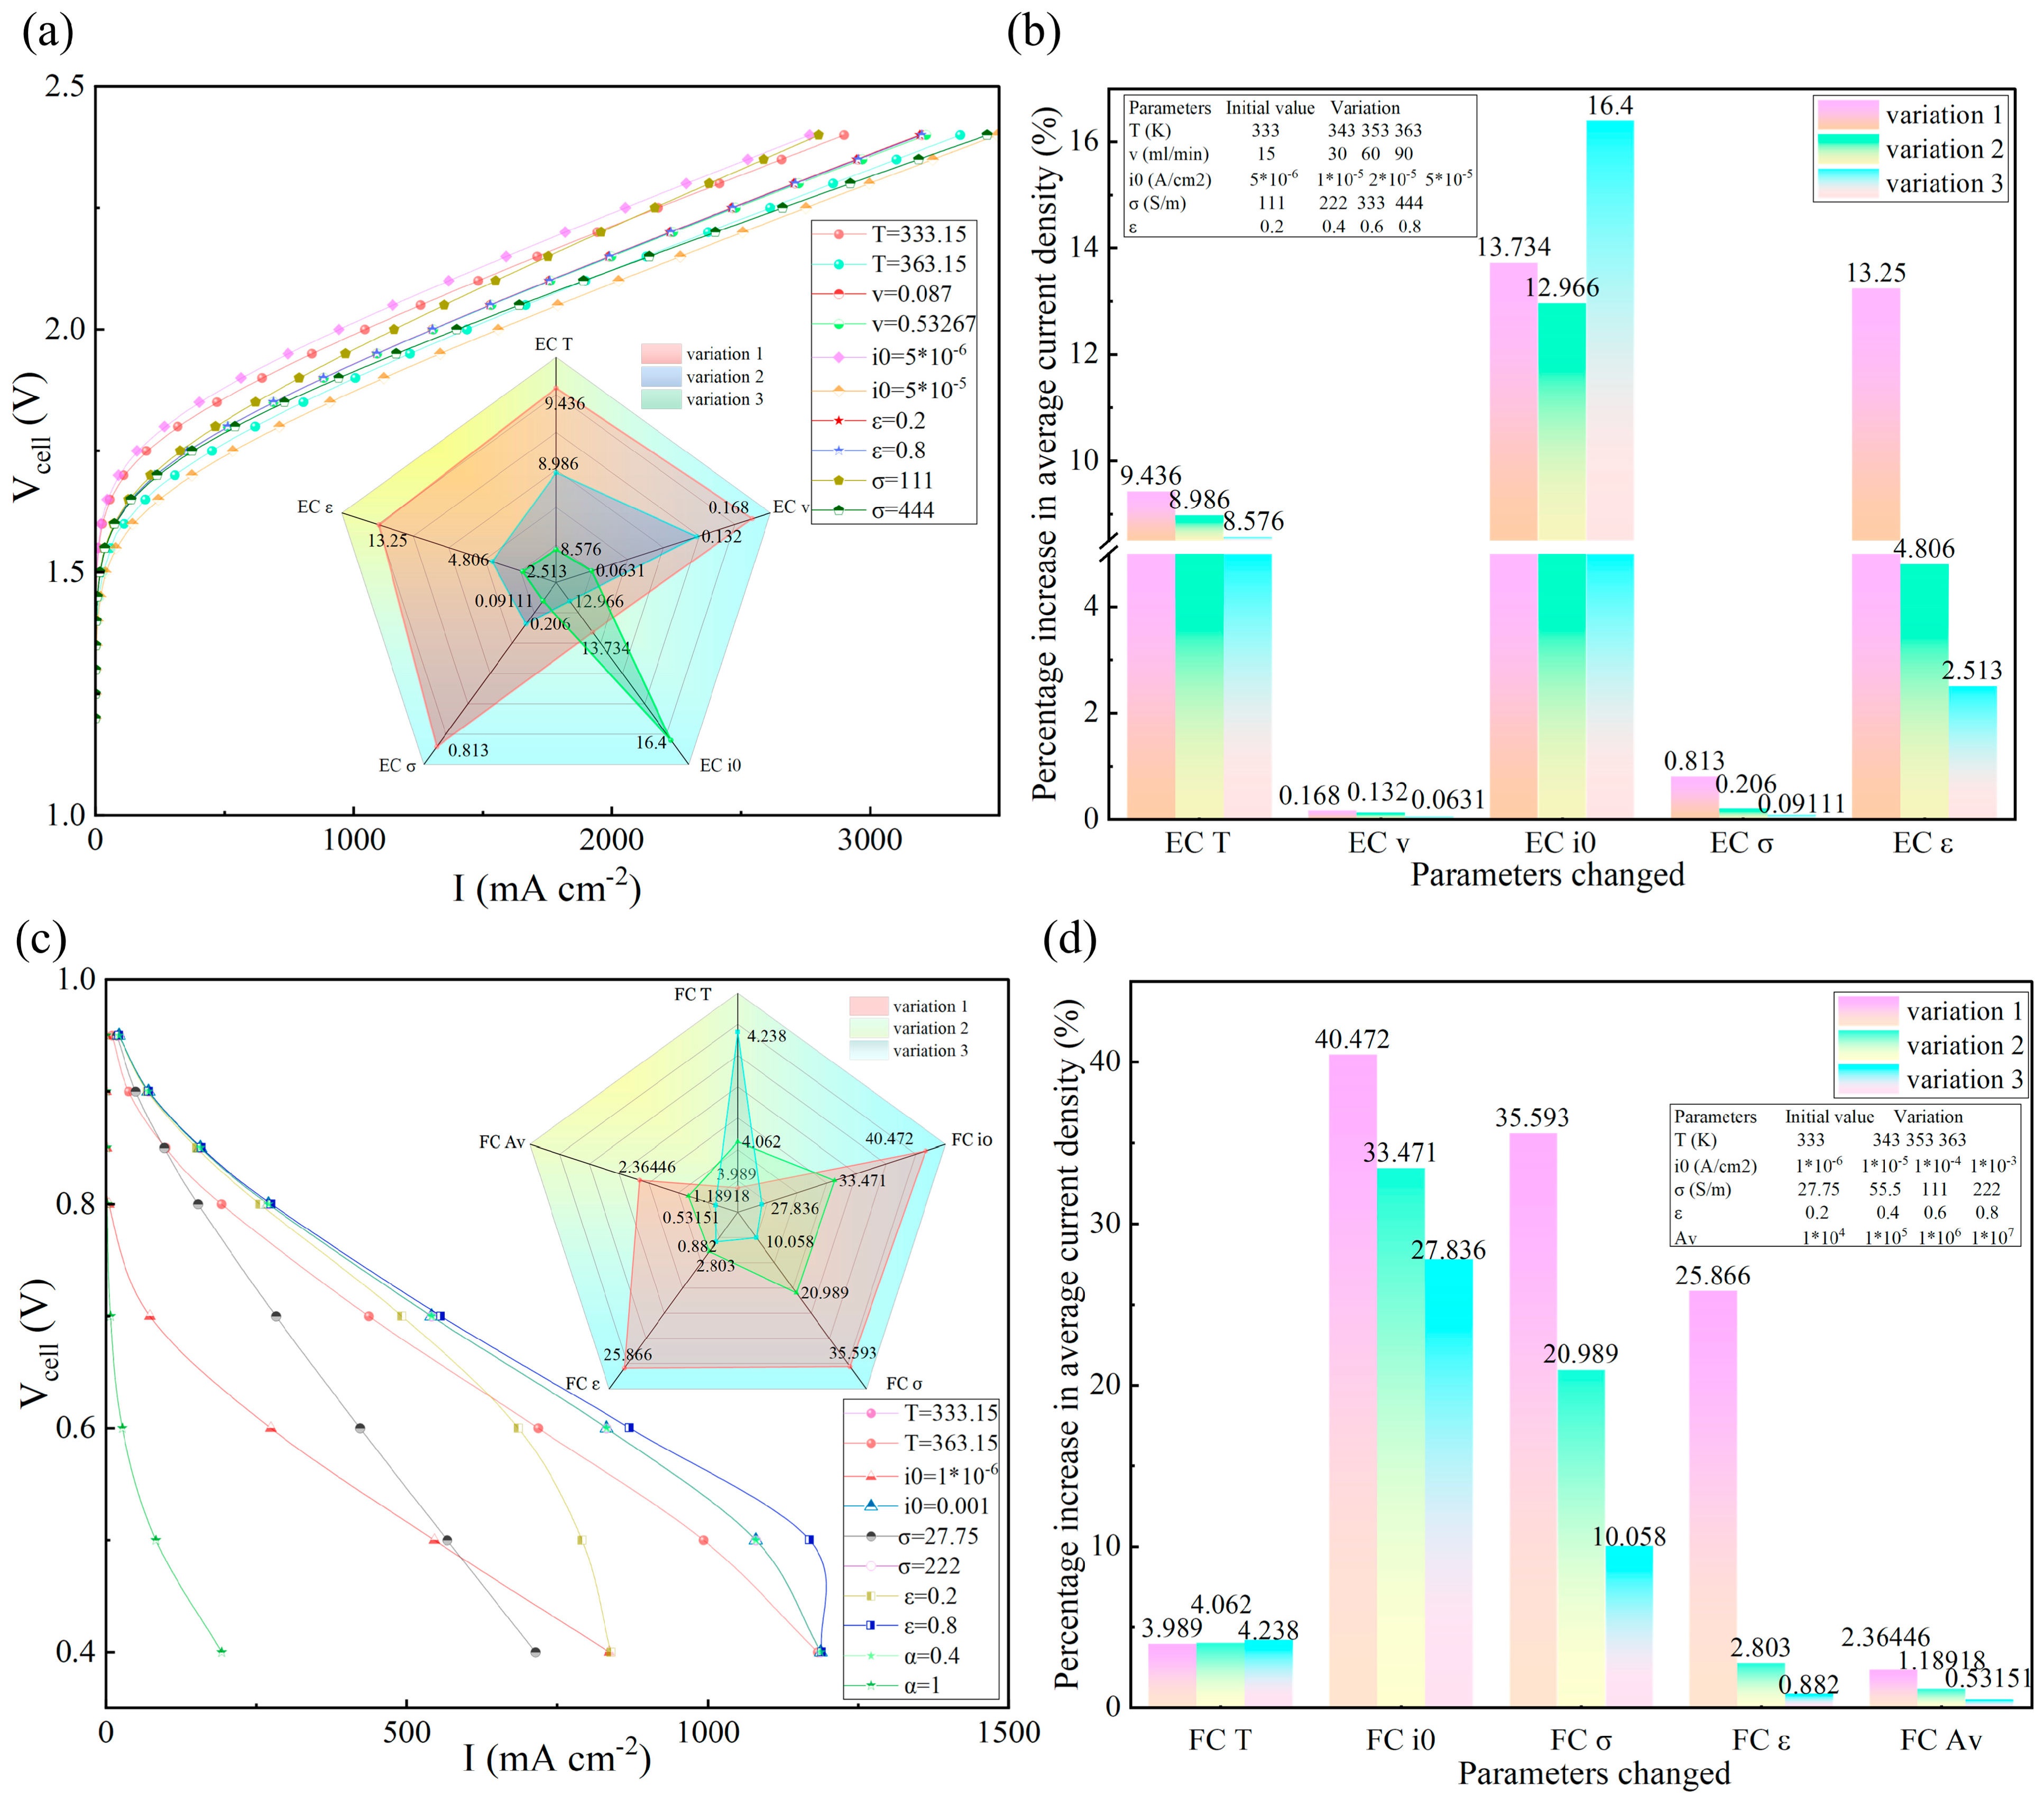
In order to investigate the effect of the relevant modulation of operating conditions and optimization of structural parameters on the performance of URFC, the study conducted a multi-parameter sensitivity analysis with the above model. The data covered in the following discussion are presented in Figure 3. The polarization curves in Figure 3a,c correspond to the performance changes due to the maximum and minimum values of the same varying conditions in EC and FC modes, respectively. The radar plots in the figure reveal the percentage of performance improvement when each parameter is varied, while Figure 3b,d clearly present the amount of percentage increase in average current density due to the three variations of the parameters.

3.2.1. Sensitivity of Flow Rates

The increase in inlet flow rate from 15 to 90 mL/min resulted in a cumulative increase in EC mode current density of 0.36%, which refers to the average current density corresponding to the voltage range of 1.2–2.4 V, though the unit increase (this refers to a single adjustment of flow rates, e.g., 15 mL/min to 30 mL/min) decreased from 0.17% to 0.06%. The positive gain is attributed to the enhancement of the flow rate, which enhances the mass transfer capability, reduces the concentration polarization, and accelerates the bubble detachment at the electrode surface, thus reducing the coverage of the active sites. As the flow rate exceeds 60 mL/min, the compressive effect of turbulent shear on the boundary layer will further reduce the marginal benefit of flow rates enhancement.

3.2.2. Differentiation of Dual Modes of Temperature Regulation

FC Mode
Temperature is negatively correlated with performance in the 333.15–363.15 K interval. High temperatures alter the water phase equilibrium within the electrode pores, which induces the risk of localized drying out or water flooding and reduces the effective active sites of the catalyst [28]. Despite the model being set to have a constant inlet relative humidity of 50%, the local RH of the membrane decreases as the temperature increases, which is due to the exponential growth with temperature of the saturation vapor pressure of water (governed by the Clausius–Clapillon equation). The saturation pressure is significantly higher at the membrane/CL interface with higher temperatures, which means identical absolute water vapor concentrations correspond to lower local RH within the cell. The incremental decrease indicates that membrane dehydration enters the critical zone of drying out at temperatures >353.15 K. The decrease in oxygen solubility, in turn, triggers a sudden increase in concentration polarization. Hydrogen crossover [29] and free radicals will accelerate membrane degradation [30].
EC Mode
At the same rise in temperature, the gains in current density are similar, proving a positive correlation between temperature and performance. Increased temperature promotes electrode reaction kinetics, reduces electrolyte viscosity, and accelerates the detachment of gas bubbles [31], which together reduce polarization losses. When the temperature is higher, catalyst dissolution and membrane dehydration will partially offset the gain.

3.2.3. The Central Role of Exchange Current Density

FC Mode
The reference exchange current density exhibits a decreasing positive correlation with performance. The increase of j0 significantly reduces the activation polarization and accelerates the interfacial charge transfer. After j0 > 10−5 A cm−2, ohmic/transfer polarization gradually becomes the dominant factor. Reactant mass transfer at extremely high j0 is unable to match the kinetic demand, and saturation of the active site further limits the gain space.
EC Mode
A nonmonotonic positive correlation between j0 and current density was observed. The initial gain decline is dominated by ohmic/mass-transfer polarization. When j0 > 2 × 10⁻⁵ A cm−2, the leap in catalyst activity may trigger the reconstruction of the interfacial bilayer and the optimization of the proton transport pathway, which result in the formation of synergistic gain.

3.2.4. Positive Gain Characteristics of Membrane Conductivity Tending to Decay

Conductivity enhancement shows a continuously decreasing gain in current density for both modes. The conductivity enhancement unlocks the catalyst potential by reducing ohmic losses and improving current distribution uniformity, which is attributed to the fact that higher conductivity reduces the spatial variation of ohmic resistance. Based on Ohm’s law, a small Rohm results in a relatively uniform drop in ohmic voltage across the electrode area for a given current. The gradual decay of gain arises from activation/concentration polarization and contact resistance at the electrode–membrane interface.

3.2.5. Differential Response of Porosity Regulation for GDL on Both Sides

FC Mode
The gain of current density decreases in a cliff-like manner as porosity increases. The initial gain stems from the improvement of gas diffusion with the increase of mass transfer. When the porosity exceeds 0.4, the thinning of the fiber structure leads to a two-stage decay. One is the reduction of the effective conductive path reducing the electron conductivity, and the other is the significant decrease of capillary pressure, which triggers liquid water blockage and interfacial contact loss [32].
EC Mode
Porosity enhancement brings only a weak gain of 0.05–0.07%. With a porosity greater than 0.7, bubbles tend to merge and remain in the micropores, blocking ion channels in the ionomer network and impeding reactant (liquid water) transport, which limits charge and mass transfer kinetics while increasing the loss of active sites.

3.2.6. Marginal Effect of Active Specific Surface Area

Active specific surface area (Av) means the surface area of catalyst per unit volume of CL that effectively participates in the electrochemical reaction. In FC mode, the increase in Av yields a gain in performance of only 2% to 0.5%. When the specific surface area increases, the diffusion rate of the reactants could not match the growth of the theoretical active sites; i.e., the limited mass transfer leads to the low utilization of the added surface area. In addition, the high specific surface area is accompanied by a rise in the pore tortuosity and an increase in the gas-phase transport resistance, which triggers a localized concentration polarization and counteracts a part of the gain of the active sites.

3.2.7. Summary

FC Mode
The reference exchange current density (gain 27.84–40.47%) and conductivity (initial gain 35.59%) are the dominant factors, while the temperature exhibits a steady negative effect (decrease 3.99–4.24%), and the porosity gain changes drastically with the value domain (25.87–0.88%), which indicates that the performance is regulated by the parameters’ strong nonlinear coupling regulation.
EC Mode
The reference exchange current density (gain 12.97–16.40%), conductivity (initial gain 13.25%), and temperature (gain 8.58–9.44%) are the core influencing factors, with weak flow rates and porosity gains (<0.17%) and continuous decay.

3.3. Experimental Verification

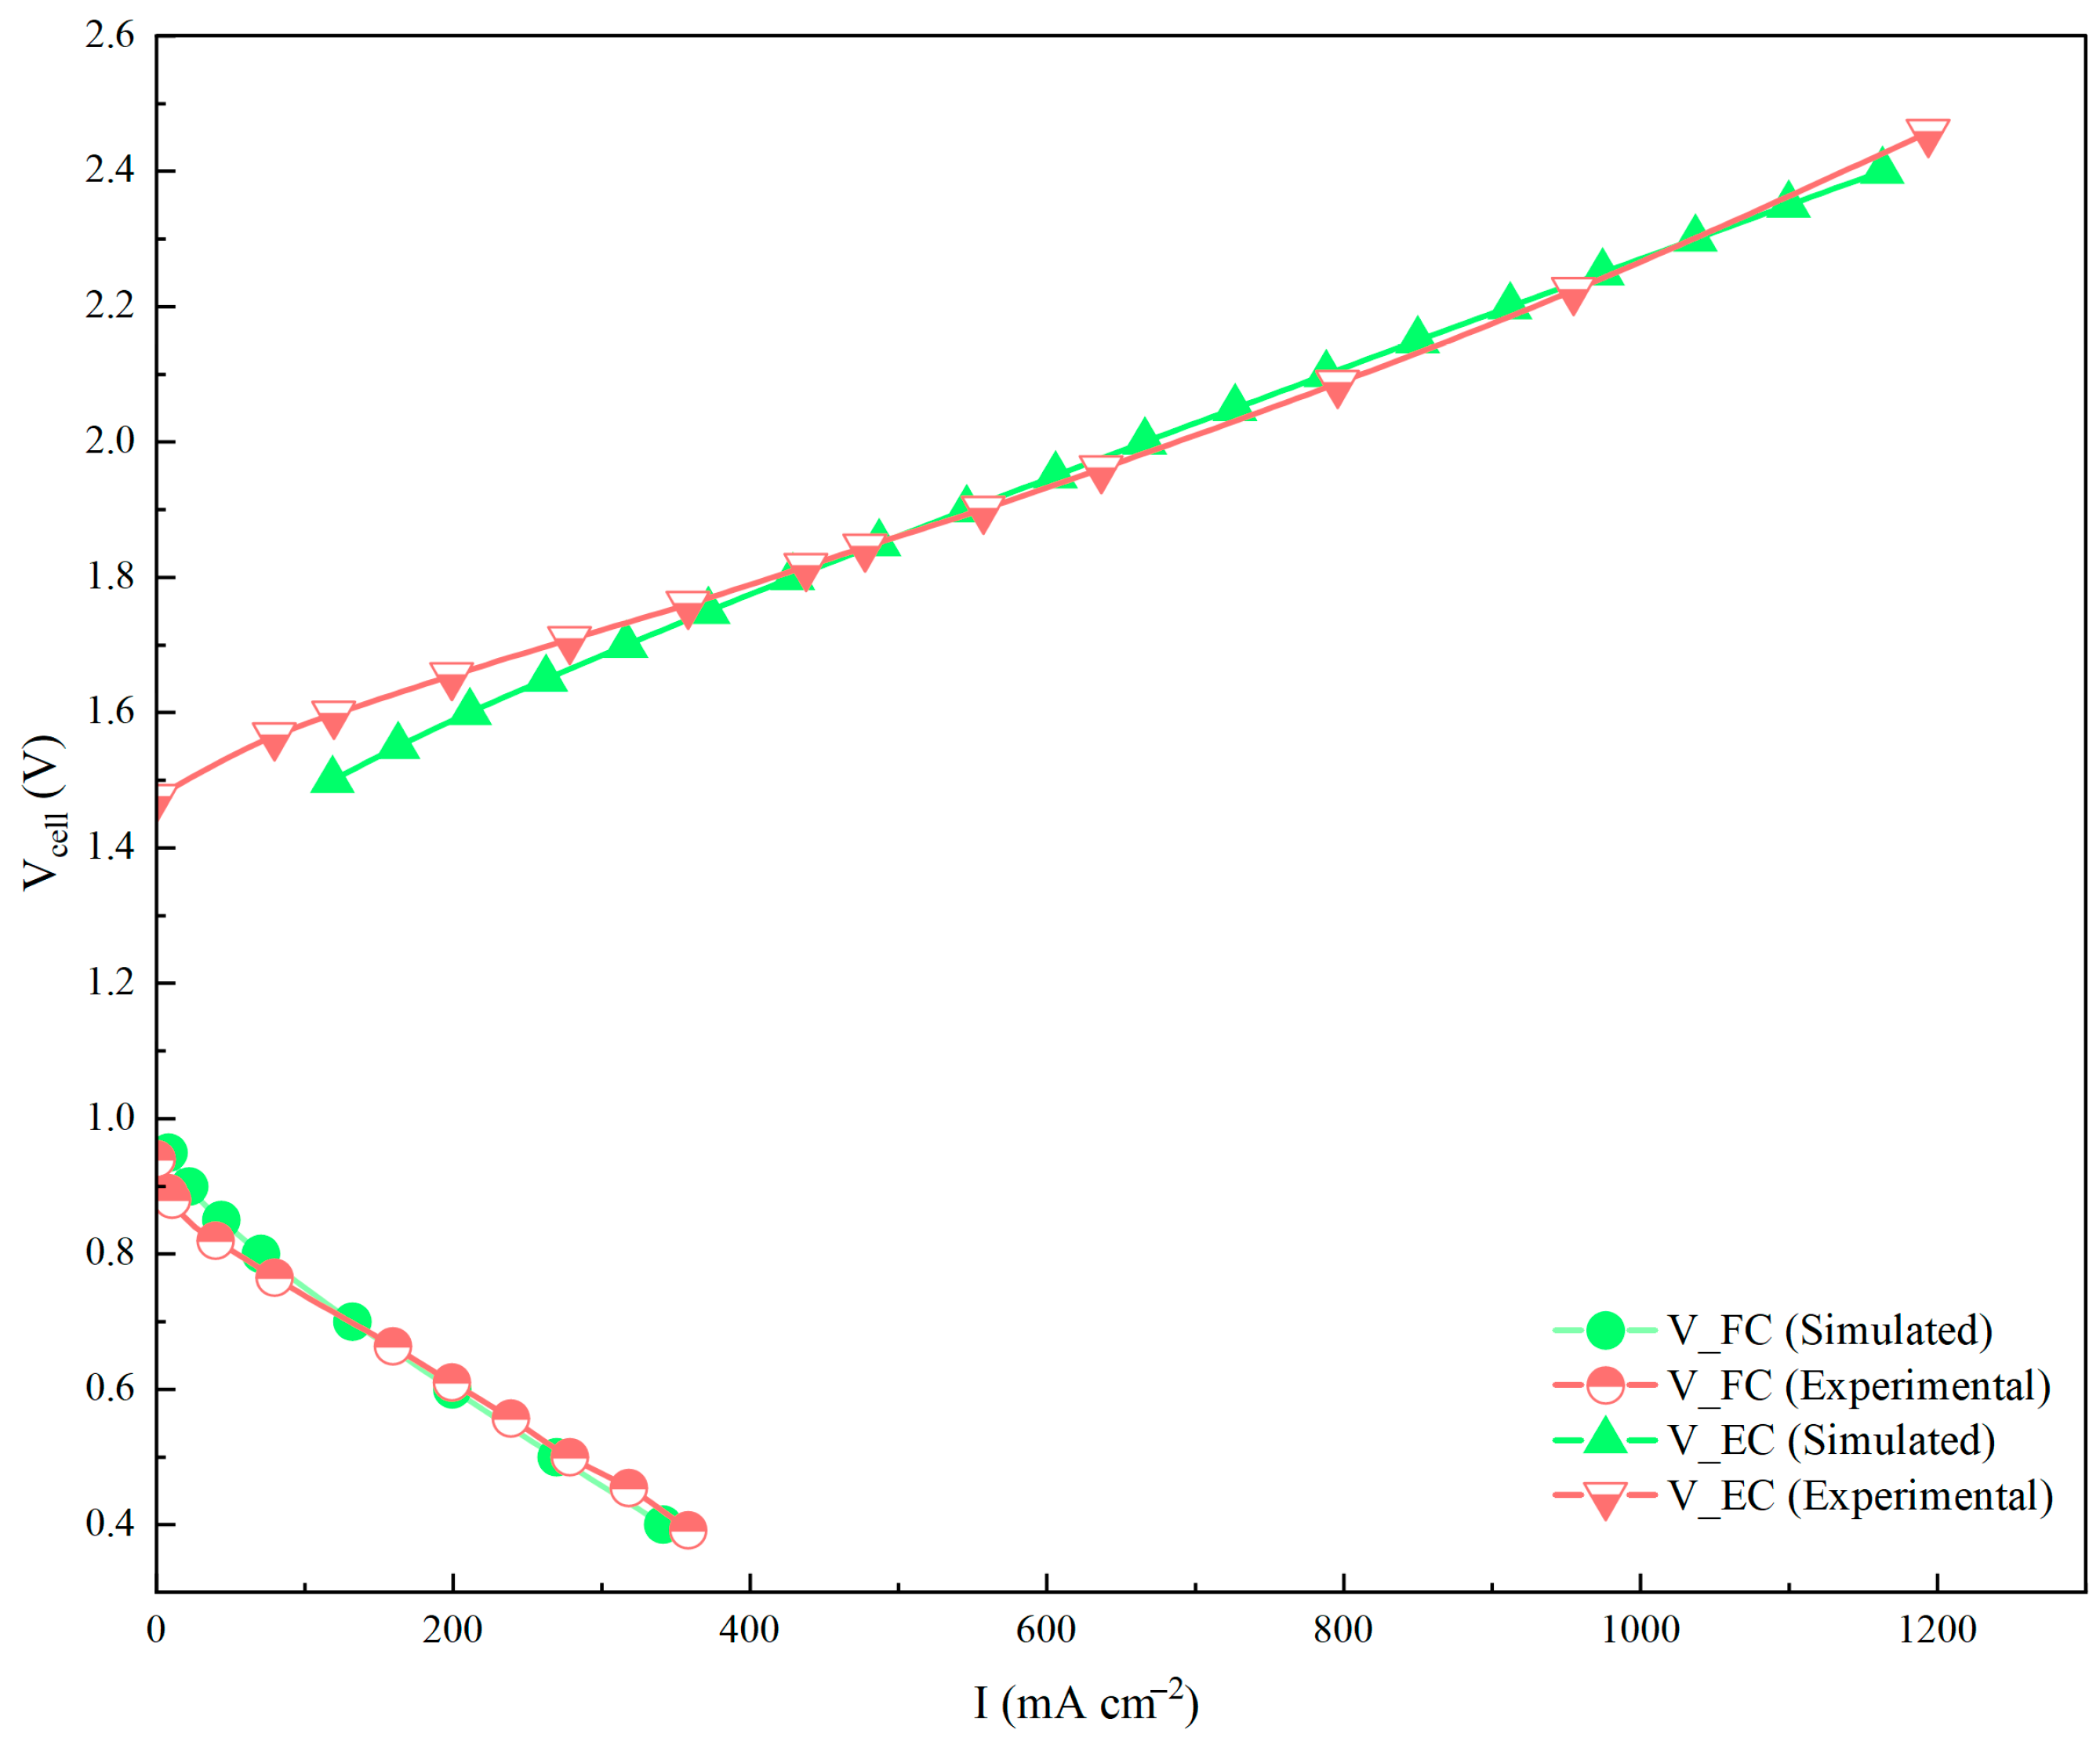
In order to verify the reliability of the numerical model, this study adopts an experimental-simulation cross-validation strategy; the polarization curves of the steady-state numerical simulation are compared with the experimental test data under uniform operating conditions, whereas most of the parameters were determined after the parameter analysis and regulation in Section 3.2, as shown in Table 3.
As shown in Figure 4, the simulation results show a high degree of agreement with the experimental data over a wide voltage range. In FC mode, the relative error between the experimental and simulated values of current density is only 3.2% at an operating voltage lower than 0.7 V. And the maximum relative error within the voltage interval of 1.8–2.3 V in EC mode is less than 3.8%. This accurate matching across modes and wide working conditions confirms the model’s ability to couple reaction kinetics and mass transfer of multiphase flow within porous media. In addition, the nonlinear correlation mechanism between the resistance of proton conduction and the activation overpotential could be reproduced.

4. Results and Discussions

4.1. Numerical Results

4.1.1. Heat–Mass Transfer Analysis at Different Temperatures

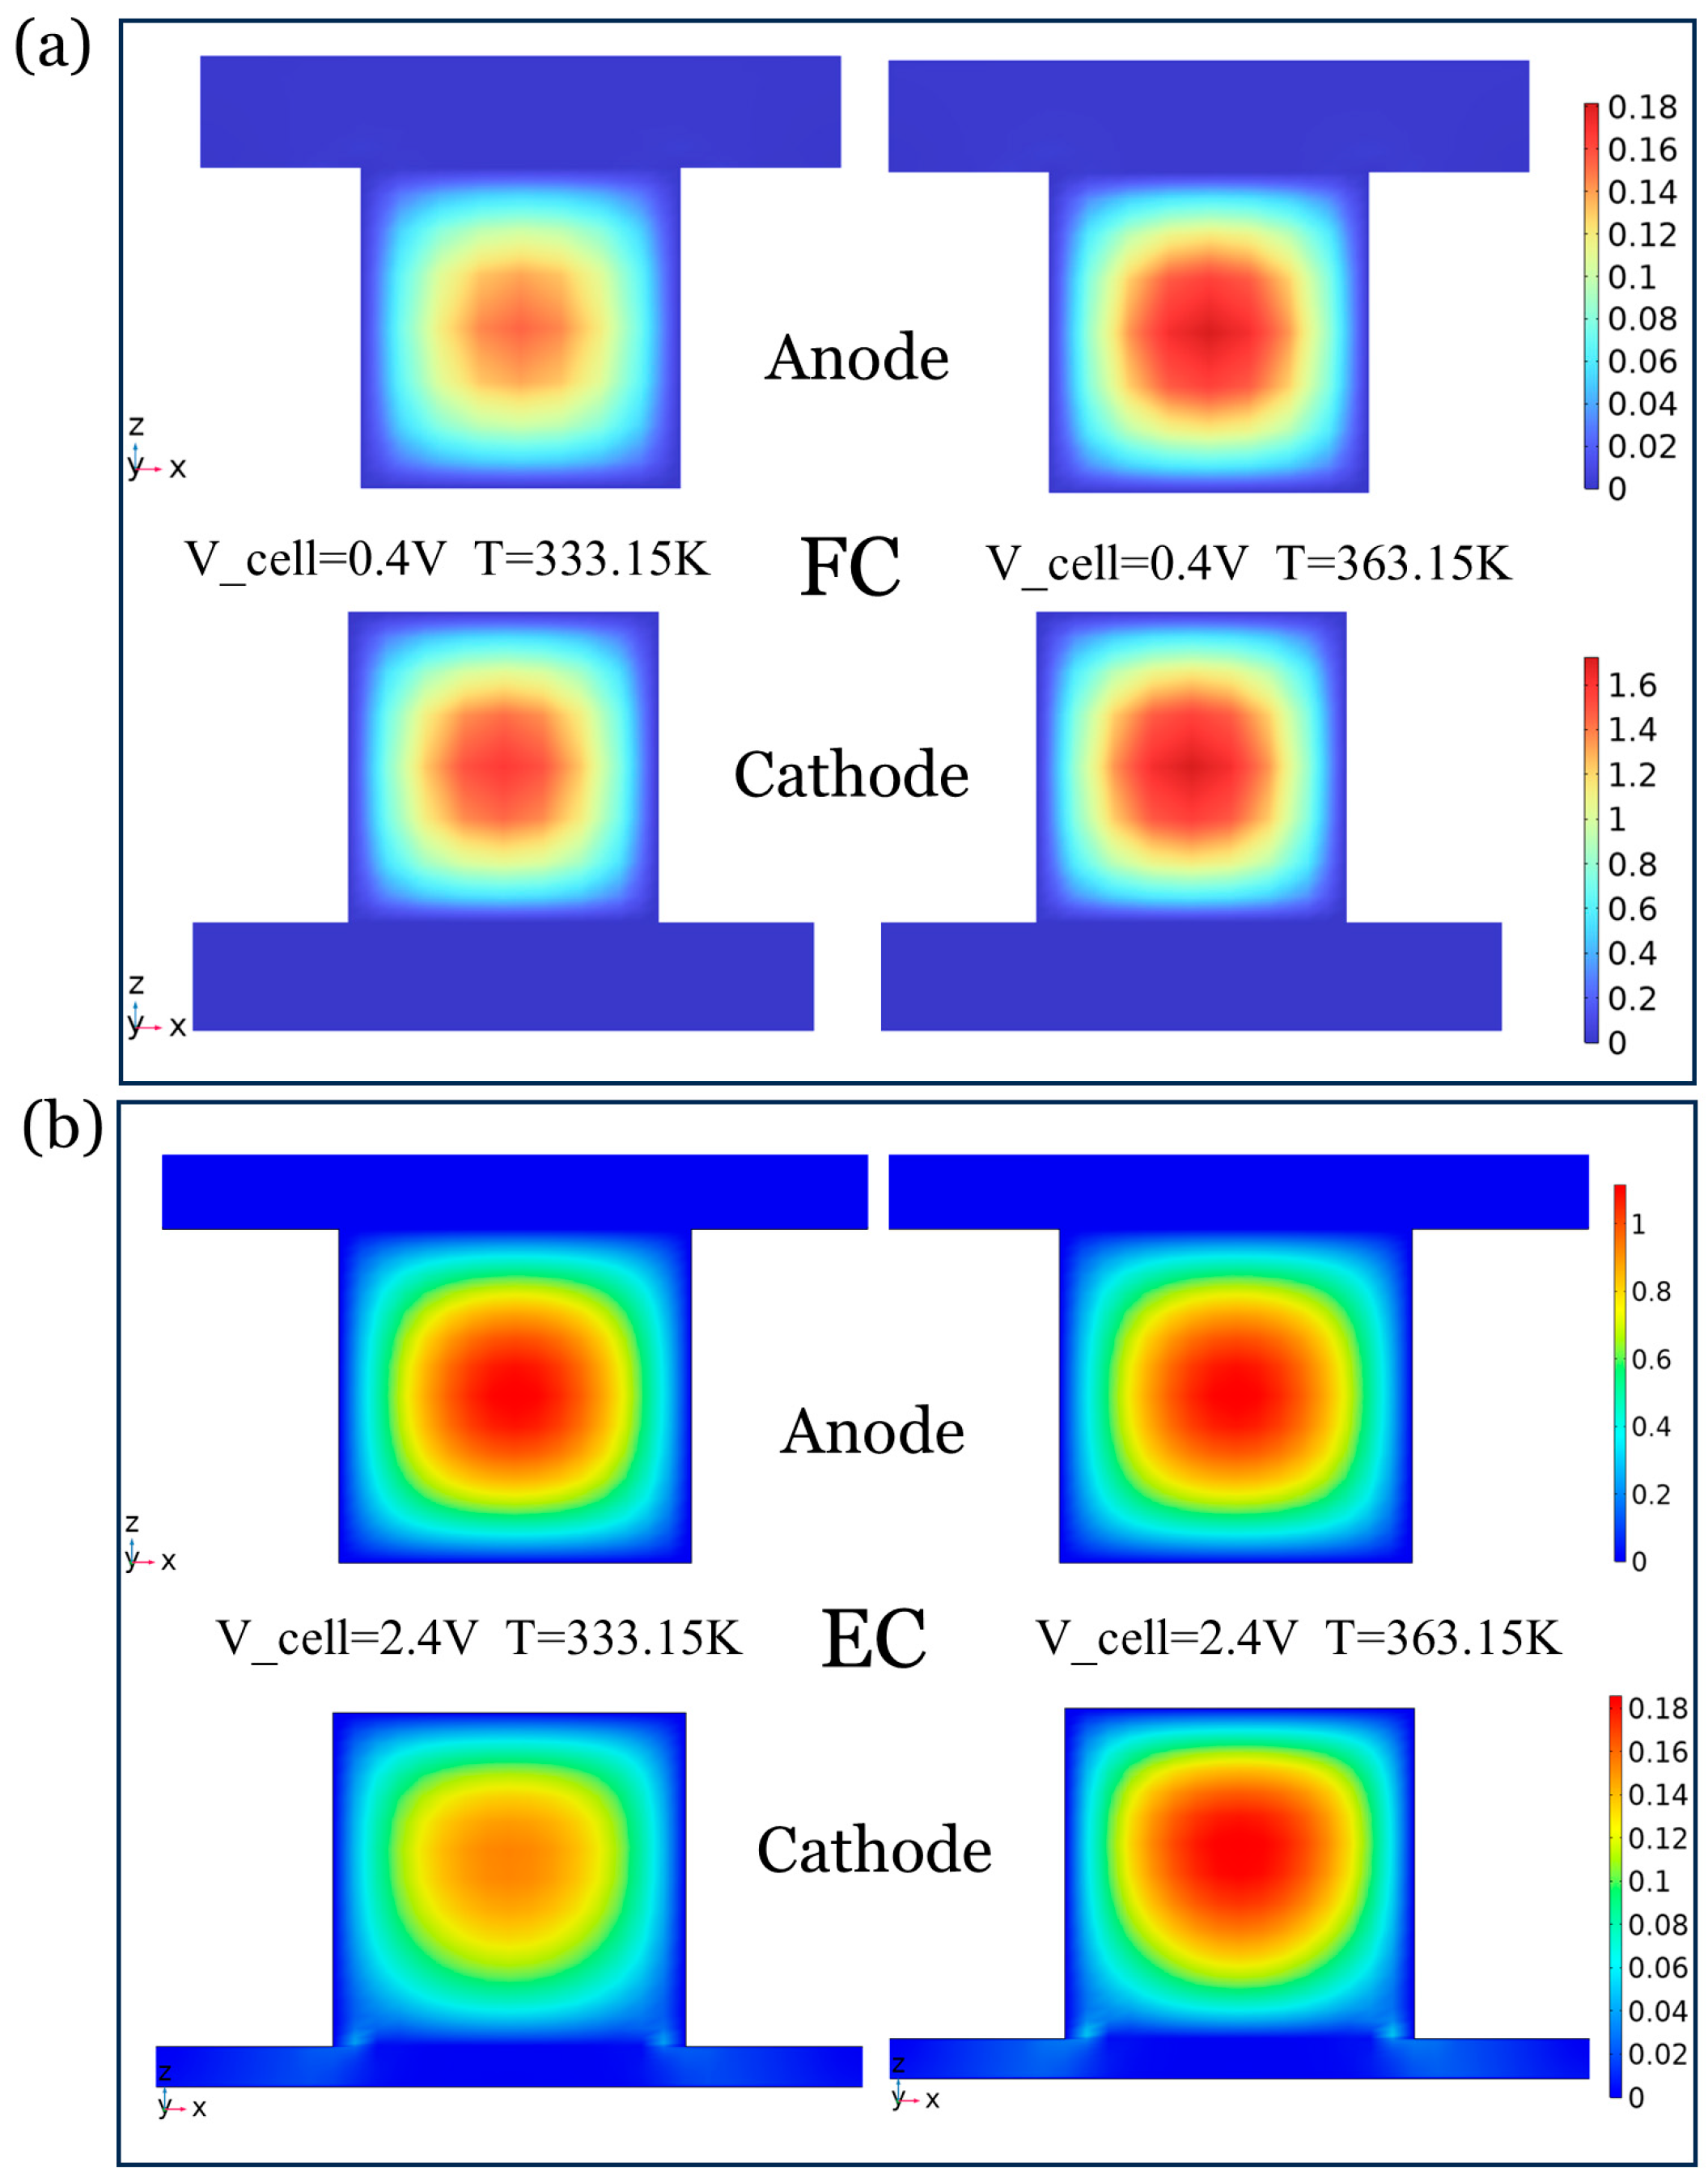
The FC model shows a symmetric thermal expansion effect due to the gas dominance in the channels, with a 40% increase in flow velocity in the core of the channel (Figure 5).
In contrast, the EC mode shows an asymmetric response: the cathode channel is significantly increased by 32.4% due to the hydrogen expansion, while the anode is less affected by the temperature, owing to the high viscosity of the liquid water. The water on the cathode side is supplied via saturated steam introduced through boundary conditions to maintain a vapor-saturated environment, ensuring adequate proton conductivity across the membrane.

4.1.2. Coupling of Temperature and Concentration Fields in FC Modes

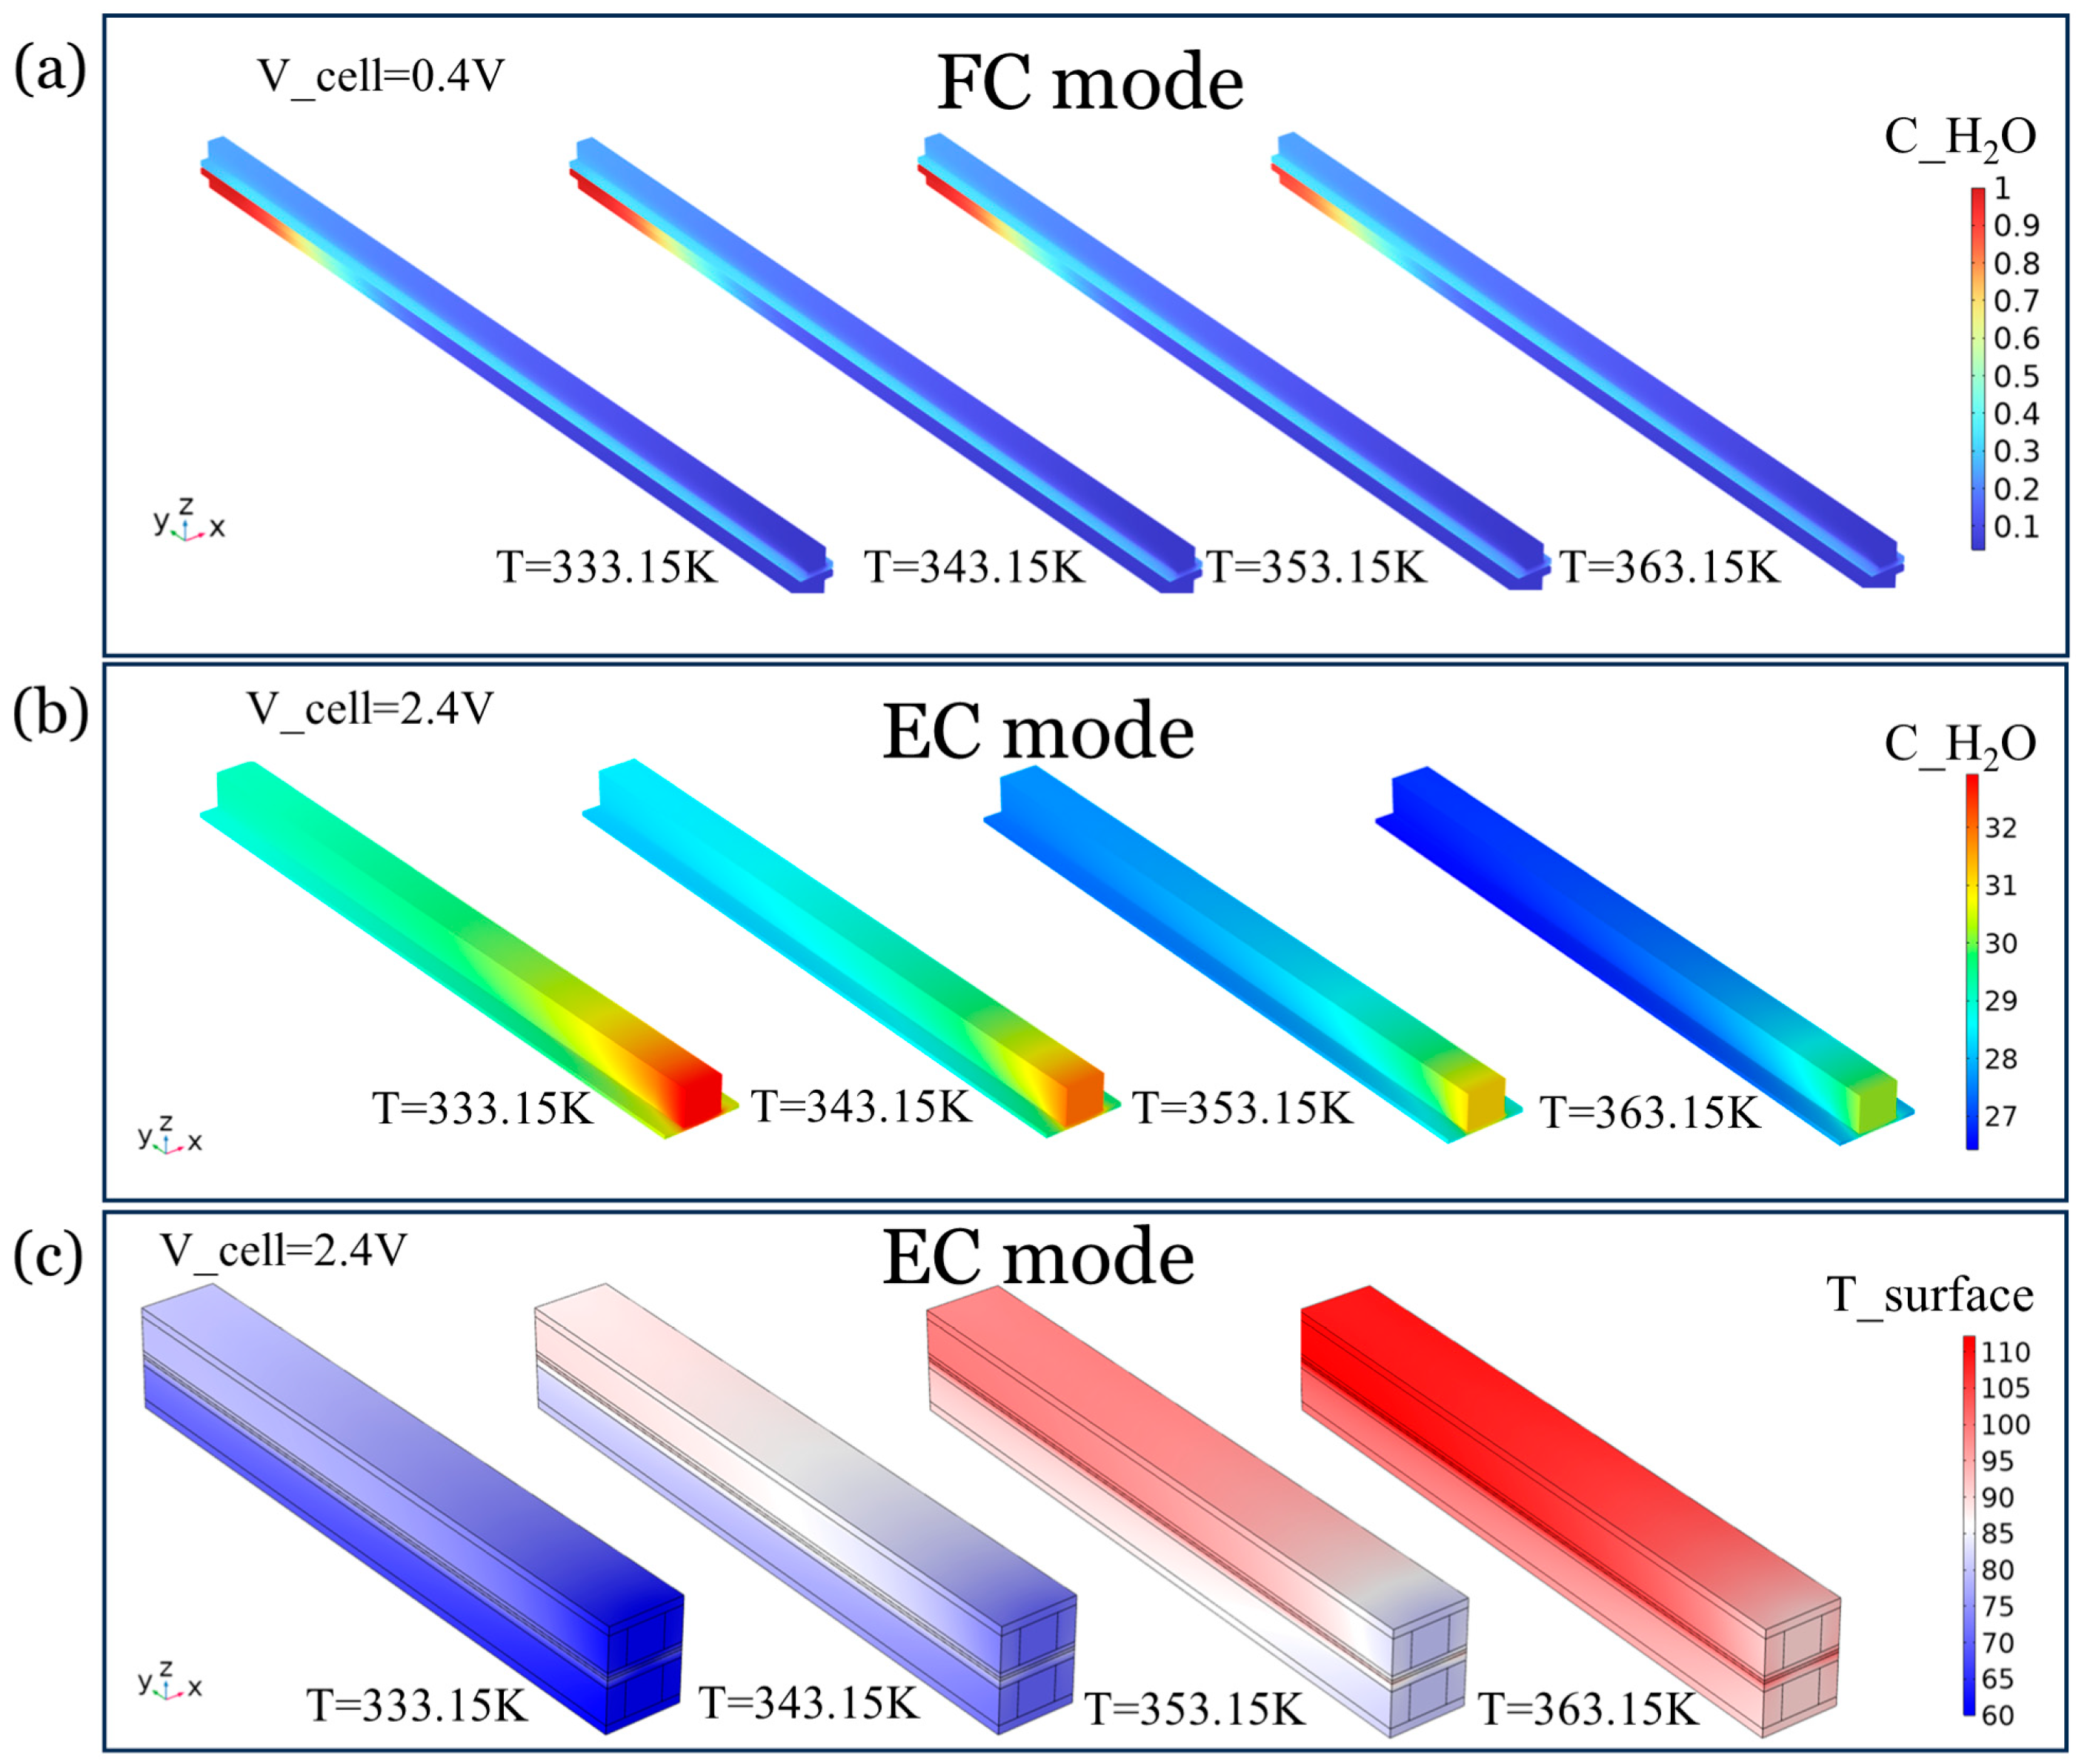
In FC mode, the humidity anode side is controlled by supplying reactant gas with a constant relative humidity of 100% through boundary conditions. The liquid water originates from the phase change processes (evaporation/condensation) within the gas diffusion layer and flow channels, governed by the conservation equations and phase change source terms in our model. The temperature increase (333–363 K) changes the water distribution in the FC (Figure 6a,b): Liquid water enrichment (>0.8 mol/m3) occurs at the anode exit, and the H2O concentration in the GDL and catalytic layer is slightly higher than that in the channel, which is attributed to the significant capillary effect. In addition, the high temperature may trigger the phase transition migration of liquid water, which causes the water concentration at the outlet to decrease with temperature, while the gas flow rate increases significantly (Figure 5a).

4.1.3. Heat–Mass Coupling in the EC Modes

The EC model exhibits intense thermo–mass coupling at an inlet flow rate and temperature of 90 mL and 303 K, respectively. A low temperature and high concentration characteristic occur at the inlet of the channel, which owes to the fact that the increase in cooling flux of the liquid water at the inlet is larger than the heat of reaction, thus forming a local thermal boundary. The higher local temperature at the outlet at 363 K tends to induce a polarization of the concentration gradient.

4.1.4. Sensitivity Mechanisms of Flow Velocity in EC Modes

The modulation of the inlet flow rate significantly affected the mass transfer in the EC mode. As shown in Figure 7a, the anodic channel maintains laminar flow characteristics, with a linear increase in flow rate with flux (up to 0.92 m/s at 90 mL/min), which is attributed to the viscous confinement effect of liquid water. The cathodic channel forms a local enrichment of H2O at the inlet in the region of low flow rate (<30 mL/min). When the flow rate is greater than 60 mL/min, it triggers the polarization of the flow rate gradient (Figure 7b).
The concentration field response of H2O exhibits a dual-stage characteristic: the liquid phase retention at low flow rates leads to a sharp increase in the inlet concentration, and the gas-phase shear is enhanced at high flow rates, resulting in an elevated concentration uniformity and a shrinkage of the inlet–outlet difference in concentration.

5. Conclusions

Experimental validation shows that the parameter-calibrated model has a prediction error of <4% over a wide voltage range, which accurately reproduces the kinetic properties of steady-state operation and confirms its ability to analyze the coupling of mass transfer and electrochemical reactions of multiphase flow in porous media.
(a)
The parametric contradictions between FC and EC modes were successfully reconciled by a coupled multi-physical field model (COMSOL®), which reveals the mechanisms by different operating conditions and structural parameters on the performance of the dual modes. In particular, both FC and EC modes are sensitive to temperature, exchange current density, and conductivity. Thus, the modeling process is well guided by the parameter determinations.
(b)
A dual mechanism of action was observed for temperature (333–353 K), where high temperature induced membrane dehydration with accelerated gas depletion in FC modes, which resulted in performance degradation (−4.2% to −4.0%). For the EC modes, the high temperature accelerates the electrochemical kinetics and enhances the liquid water mobility, which facilitates the mass transfer and promotes the detachment of gas bubbles, which greatly reduces the polarization loss (gain of 8.6–9.4%).
(c)
Sensitivity analysis determines the optimal interval of key structural parameters: the porosity of GDL needs to be >0.4 in FC mode to avoid water flooding, and the conductivity >222 S/m in EC mode inhibits ohmic loss effectively. Breaking the threshold will trigger nonlinear performance degradation (e.g., FC current density gain plummets 25.87–0.88% at porosity > 0.4).
(d)
The increase in flow rates for the EC modes (15–90 mL/min) resulted in a current density gain of only 0.36%, with diminishing marginal benefits. Higher flow rates (>60 mL/min) could not significantly improve the species concentration gradient due to turbulent shear effects, which suggests that the channel’s design needs to be synergistically optimized with other parameters.
(e)
The spatial distribution analysis reveals that the temperature increase in the FC modes leads to the enrichment of liquid water (>0.8 mol/m3) at the anode exit, while the EC mode inlet forms a low-temperature and high-concentration boundary layer, which emphasizes the strong coupling characteristics of the water-phase equilibrium and the heat–mass transfer in the dual modes.
Based on the parametric sensitivity and performance analysis, the FC mode demonstrates greater practical viability under optimized structural parameters (GDL porosity >0.4), which achieves stable operation with minimal performance degradation while offering significant current density gains when porosity thresholds are maintained. In contrast, the EC mode exhibits diminishing returns at higher flow rates and requires stringent conductivity control to mitigate ohmic losses.
While the single-cell findings offer crucial baseline understanding and reveal parameter sensitivities, the specific numerical thresholds will likely require re-evaluation for multi-cell stacks. Future work will explicitly investigate multi-cell URFC operation, building upon this foundational single-cell study.

Author Contributions

Conceptualization, Y.H. and Y.L. (Yijia Li); methodology, Y.L. (Yuehua Li); software, Y.L. (Yijia Li); validation, Y.H., Y.L. (Yuehua Li), and Y.L. (Yijia Li); formal analysis, Y.L. (Yuehua Li); investigation, Y.L. (Yijia Li); resources, B.Z.; data curation, Y.L. (Yijia Li); writing—original draft preparation, Y.H.; writing—review and editing, Y.L. (Yuehua Li); visualization, F.Y.; funding acquisition, D.W. All authors have read and agreed to the published version of the manuscript.

Funding

This research received no external funding.

Data Availability Statement

The original contributions presented in the study are included in the article, further inquiries can be directed to the corresponding author.

Acknowledgments

This work has been supported by the Hubei Provincial Key R&D Program, China (NO. 2023BAB147), the National Natural Science Foundation of China (NO. 22005026), and the Fundamental Research Funds for the Central Universities, China (NO. 00007711). The authors gratefully acknowledge Xiaopeng Zhang, Zhenbo Shi, and Bin Zeng for their valuable technical discussions and constructive suggestions during the manuscript preparation.

Conflicts of Interest

Authors Fang Yang, Bin Zhang and Dan Wang were employed by the company Xiangyang DAAN Automobile Test Center Corporation Limited. The remaining authors declare that the research was conducted in the absence of any commercial or financial relationships that could be construed as a potential conflict of interest.

Nomenclature

ρ density
u fluid flow velocity vector
Q m mass source term
μ , dynamic viscosity
ppressure
Kpermeability
ε porosity
T temperature
j diffusion flux
D diffusion coefficient
ω mass fraction
M molar mass
x molar fraction
f e effective transfer factor
τ F fluid tortuosity factor
σ s e f f effective conductivity
σ m e f f effective ionic conductivity
ϕ s potential
ϕ m ionic potential
k b thermal conductivity of the porous medium
k f fluid thermal conductivity
k d i s p thermal dispersion coefficient
αtransfer coefficient
R molar gas constant
F Faraday constant
η overpotential
Avactive specific surface area

References

  1. Lee, J.J.; Jeong, K.; Kwon, S.; Yook, H.; Kim, S.M.; Han, J.W.; Choi, J.; Park, J.H. ‘Magic methyl effect’ in 2-benzylpyridine-based H2 storage materials: Enhanced H2 storage/release performances. Energy Storage Mater. 2024, 67, 103259. [Google Scholar] [CrossRef]
  2. Yang, Y.; Liu, J.; Ahmad, M.; Sun, X.; Liu, C.; Chen, S.; Zhang, J.; Luo, J.; Fu, X. Dual Hydrogen-Producing Formaldehyde-Water fuel cell for pollutant treatment and valuable chemical Co-generation. Chem. Eng. J. 2025, 505, 159653. [Google Scholar] [CrossRef]
  3. Ga, S.; An, N.; Lee, G.Y.; Joo, C.; Kim, J. Economic analysis with multiscale high-throughput screening for covalent organic framework adsorbents in ammonia-based green hydrogen separation. Renew. Sustain. Energy Rev. 2024, 189, 113989. [Google Scholar] [CrossRef]
  4. Wang, Y.; Leung, D.Y.C.; Xuan, J.; Wang, H. A review on unitized regenerative fuel cell technologies, part-A: Unitized regenerative proton exchange membrane fuel cells. Renew. Sustain. Energy Rev. 2016, 65, 961–977. [Google Scholar] [CrossRef]
  5. Hu, Y.; Li, Y.; Ren, P.; Wang, D.; Song, X.; Zhu, Z.; Zhang, L.; Pei, P. Impedance Investigation and Switching Strategy Study of Constant-Electrode Unitized Regenerative Fuel Cell from Electrolytic Cell Through Purging to Fuel Cell. Energy 2024, 32, 137327. [Google Scholar] [CrossRef]
  6. Da Silva, G.C.; Fernandes, M.R.; Ticianelli, E.A. Activity and Stability of Pt/IrO2 Bifunctional Materials as Catalysts for the Oxygen Evolution/Reduction Reactions. ACS Catal. 2018, 8, 2081–2092. [Google Scholar] [CrossRef]
  7. Lim, A.; Kim, J.; Lee, H.J.; Kim, H.; Yoo, S.J.; Jang, J.H.; Young Park, H.; Sung, Y.; Park, H.S. Low-loading IrO2 supported on Pt for catalysis of PEM water electrolysis and regenerative fuel cells. Appl. Catal. B Environ. 2020, 272, 118955. [Google Scholar] [CrossRef]
  8. Zhang, Y.; Zhang, H.; Ma, Y.; Cheng, J.; Zhong, H.; Song, S.; Ma, H. A novel bifunctional electrocatalyst for unitized regenerative fuel cell. J. Power Sources 2010, 195, 142–145. [Google Scholar] [CrossRef]
  9. Peng, X.; Taie, Z.; Liu, J.; Zhang, Y.; Peng, X.; Regmi, Y.N.; Fornaciari, J.C.; Capuano, C.; Binny, D.; Kariuki, N.N.; et al. Hierarchical electrode design of highly efficient and stable unitized regenerative fuel cells (URFCs) for long-term energy storage. Energy Environ. Sci. 2020, 13, 4872–4881. [Google Scholar] [CrossRef]
  10. Regmi, Y.N.; Peng, X.; Fornaciari, J.C.; Wei, M.; Myers, D.J.; Weber, A.Z.; Danilovic, N. A low temperature unitized regenerative fuel cell realizing 60% round trip efficiency and 10,000 cycles of durability for energy storage applications. Energy Environ. Sci. 2020, 13, 215–296. [Google Scholar] [CrossRef]
  11. Lim, A.; Lee, J.S.; Lee, S.; Lee, S.Y.; Kim, H.; Yoo, S.J.; Jang, J.H.; Sung, Y.; Park, H.S. Polymer electrolyte membrane unitized regenerative fuel cells: Operational considerations for achieving high round trip efficiency at low catalyst loading. Appl. Catal. B Environ. 2021, 297, 120458. [Google Scholar] [CrossRef]
  12. Li, Y.; Yang, F.; Chen, D.; Hu, S.; Xu, X. Thermal-physical modeling and parameter identification method for dynamic model with unmeasurable state in 10-kW scale proton exchange membrane fuel cell system. Energy Convers. Manag. 2023, 276, 116580. [Google Scholar] [CrossRef]
  13. Zhang, Z.; Guo, M.; Yu, Z.; Yao, S.; Wang, J.; Qiu, D.; Peng, L. A novel cooperative design with optimized flow field on bipolar plates and hybrid wettability gas diffusion layer for proton exchange membrane unitized regenerative fuel cell. Energy 2022, 239, 122375. [Google Scholar] [CrossRef]
  14. Choe, S.; Lee, B.; Cho, M.K.; Kim, H.; Henkensmeier, D.; Yoo, S.J.; Kim, J.Y.; Lee, S.Y.; Park, H.S.; Jang, J.H. Electrodeposited IrO2/Ti electrodes as durable and cost-effective anodes in high-temperature polymer-membrane-electrolyte water electrolyzers. Appl. Catal. B Environ. 2018, 226, 289–294. [Google Scholar] [CrossRef]
  15. Lim, A.; Jeong, H.; Lim, Y.; Kim, J.Y.; Park, H.Y.; Jang, J.H.; Sung, Y.; Kim, J.M.; Park, H.S. Amphiphilic Ti porous transport layer for highly effective PEM unitized regenerative fuel cells. Sci. Adv. 2021, 7, eabf7866. [Google Scholar] [CrossRef]
  16. Yilmaz, A.; Komini Babu, S.; Kissane, J.; Pasaogullari, U.; Spendelow, J.S. Stratified Porous Transport Layers for Unitized Reversible Fuel Cells. ACS Appl. Energ. Mater. 2025, 8, 1986–1993. [Google Scholar] [CrossRef]
  17. Komini Babu, S.; Yilmaz, A.; Uddin, M.A.; Lamanna, J.; Baltic, E.; Jacobson, D.L.; Pasaogullari, U.; Spendelow, J.S. A goldilocks approach to water management: Hydrochannel porous transport layers for unitized reversible fuel cells. Adv. Energy Mater. 2023, 13, 3952. [Google Scholar] [CrossRef]
  18. Kusoglu, A.; Weber, A.Z. New Insights into Perfluorinated Sulfonic-Acid Ionomers. Chem. Rev. 2017, 117, 987–1104. [Google Scholar] [CrossRef]
  19. Tian, Y.; Hong, J.; Cao, D.; You, S.; Song, Y.; Cheng, B.; Wang, Z.; Guan, D.; Liu, X.; Zhao, Z.; et al. Visualizing Eigen/Zundel cations and their interconversion in monolayer water on metal surfaces. Science 2022, 377, 315–319. [Google Scholar] [CrossRef]
  20. Du, Y.; Li, Y.; Ren, P.; Zhang, L.; Wang, D.; Xu, X. Oxygen Transfer at Mesoscale Catalyst Layer in Proton Exchange Membrane Fuel Cell: Mechanism, Model and Resistance Characterization. Chem. Eng. J. 2024, 494, 153021. [Google Scholar] [CrossRef]
  21. Ma, M.; Shen, L.; Zhao, Z.; Guo, P.; Liu, J.; Xu, B.; Zhang, Z.; Zhang, Y.; Zhao, L.; Wang, Z. Activation methods and underlying performance boosting mechanisms within fuel cell catalyst layer. Escience 2024, 4, 100254. [Google Scholar] [CrossRef]
  22. Guo, H.; Guo, Q.; Ye, F.; Ma, C.F.; Liao, Q.; Zhu, X. Improving the electric performance of a unitized regenerative fuel cell during mode switching through mass transfer enhancement. Energy Convers. Manag. 2019, 188, 27–39. [Google Scholar] [CrossRef]
  23. Guo, H.; Guo, Q.; Ye, F.; Ma, C.F.; Zhu, X.; Liao, Q. Three-dimensional two-phase simulation of a unitized regenerative fuel cell during mode switching from electrolytic cell to fuel cell. Energy Convers. Manag. 2019, 195, 989–1003. [Google Scholar] [CrossRef]
  24. Yelegen, N.; Kümük, B.; Kaplan, R.N.; İlbaş, M.; Kaplan, Y. Numerical and experimental studies on unitized regenerative proton exchange membrane fuel cell. Int. J. Hydrogen Energy 2023, 48, 12969–12981. [Google Scholar] [CrossRef]
  25. Guo, H.; Song, J.; Ye, F.; Chong Fang, M.A. Dynamic response during mode switching of unitized regenerative fuel cells with orientational flow channels. Renew. Energy 2022, 188, 698–710. [Google Scholar] [CrossRef]
  26. Xu, Y.; Zhang, G.; Wu, L.; Bao, Z.; Zu, B.; Jiao, K. A 3-D multiphase model of proton exchange membrane electrolyzer based on open-source CFD. Digit. Chem. Eng. 2021, 1, 100004. [Google Scholar] [CrossRef]
  27. Falcão, D.S.; Pinto, A.M.F.R. A review on PEM electrolyzer modelling: Guidelines for beginners. J. Clean. Prod. 2020, 261, 121184. [Google Scholar] [CrossRef]
  28. Shen, W.; Su, H.; Gao, J.; Fan, L.; Zhang, G.; Zhou, S. A Multi-Objective Temperature Control Method for a Multi-Stack Fuel Cell System with Different Stacks Based on Model Predictive Control. Energies 2025, 18, 2443. [Google Scholar] [CrossRef]
  29. Lv, L.; Pei, P.; Ren, P.; Wang, H.; Wang, G. Exploring Performance Degradation of Proton Exchange Membrane Fuel Cells Based on Diffusion Transformer Model. Energies 2025, 18, 1191. [Google Scholar] [CrossRef]
  30. Fu, X.; Pei, P.; Ren, P.; Zhu, Z.; Wang, H.; Song, X.; Wang, Z. On-board and in-situ identification of cell-individual hydrogen crossover in fuel cell stacks based on electrochemical dynamics during shutdown. Chem. Eng. 2025, 506, 159952. [Google Scholar] [CrossRef]
  31. Deng, L.; Jin, L.; Yang, L.; Feng, C.; Tao, A.; Jia, X.; Geng, Z.; Zhang, C.; Cui, X.; Shi, J. Bubble Evolution Dynamics in Alkaline Water Electrolysis. Escience 2024, 5, 100353. [Google Scholar] [CrossRef]
  32. Ren, P.; Fu, X.; Pei, P.; Li, Y.; Zhu, Z.; Wang, H.; Song, X.; Wang, Z. Bridging the gap between prediction and real-time diagnosis of water failures in proton exchange membrane fuel cell stacks via gas distribution characterization. Appl. Energy 2025, 389, 125755. [Google Scholar] [CrossRef]
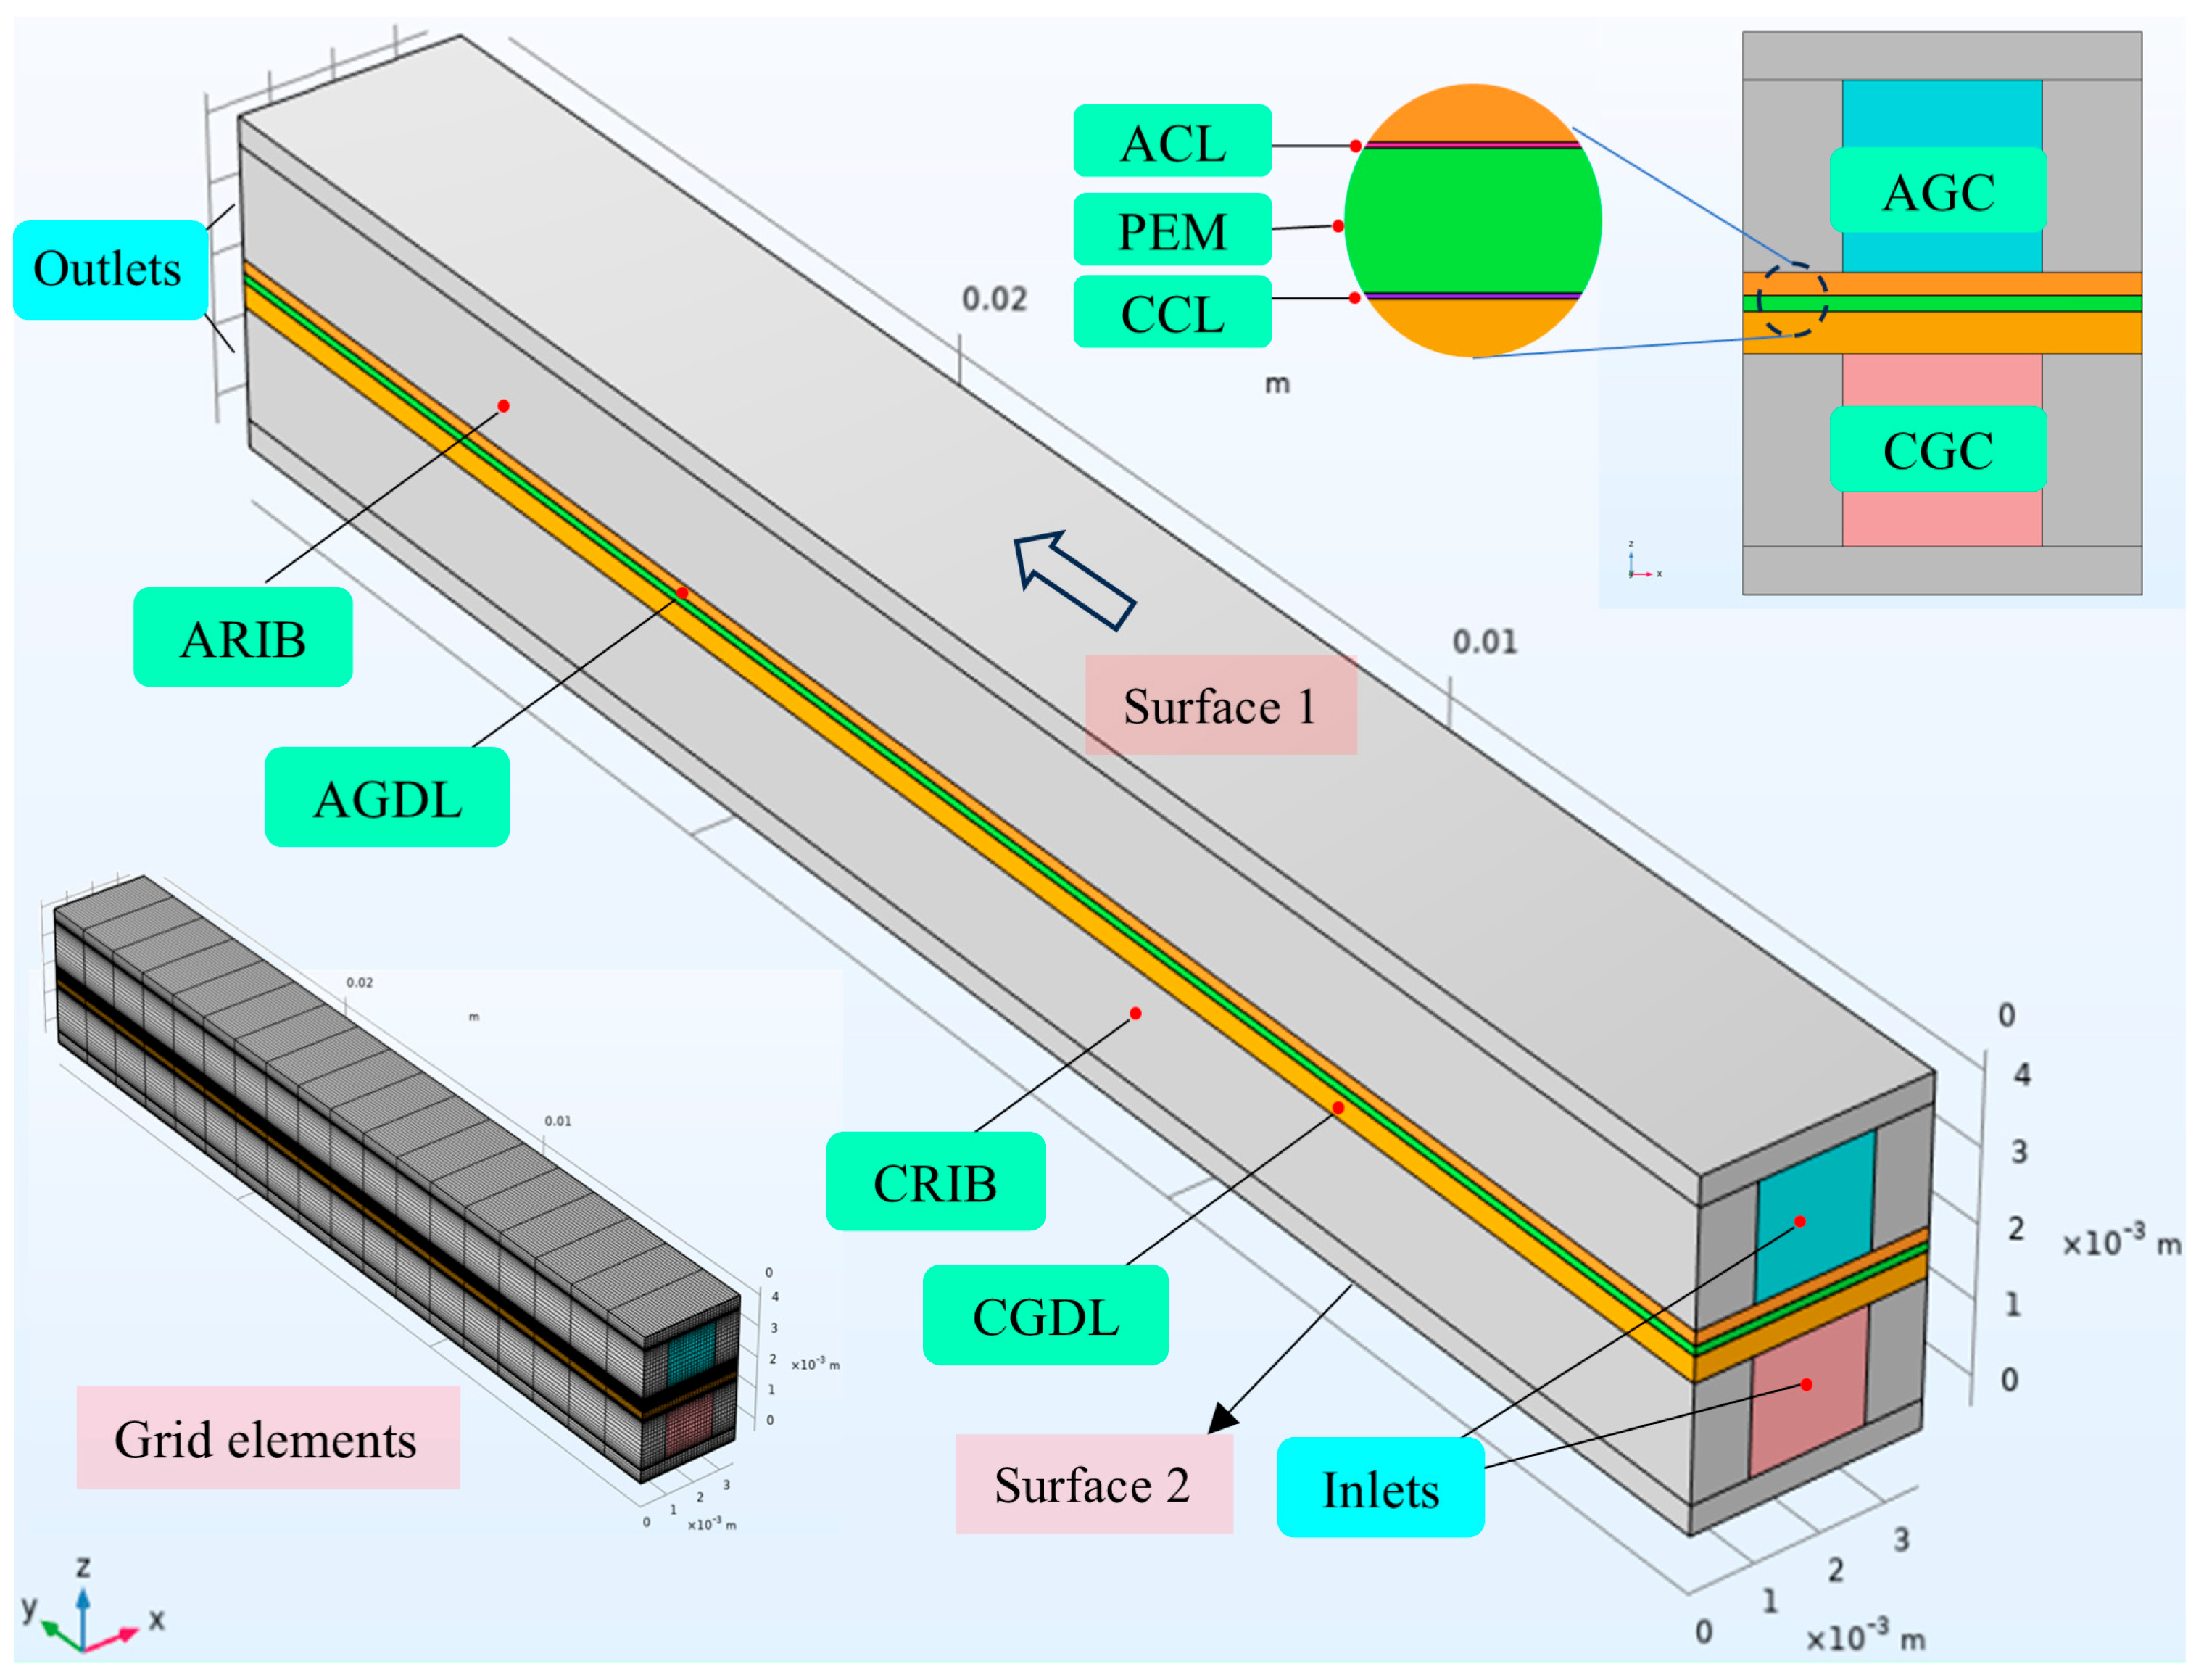
Figure 1. Computational domain of the 3D PEM-URFC model for constant electrode configuration.
Energies 18 05899 g001
Figure 2. (a) Experimental setup and system design of PEM-URFC. (b) Schematic diagram of constant-electrode configuration.
Energies 18 05899 g002
Figure 3. Parameter sensitivity analysis. (a) Polarization curves while changing each parameter of EC mode and FC mode. (b) Percentage variations of EC mode (c) and FC mode (d) in current density.
Energies 18 05899 g003
Figure 4. Polarization curves and model comparison results between FC and EC modes under the same operating conditions.
Energies 18 05899 g004
Figure 5. Cross-sectional distribution of liquid water velocity magnitude in the X–Z plane at the anode and cathode under varying operational temperatures of 333.15–363.15 K. (a) FC mode, (b) EC mode.
Energies 18 05899 g005
Figure 6. (a) Surface concentration of H2O at different temperatures. (b) Distribution of surface concentration for H2O on the cathode side at different temperatures. (c) Surface temperature at different temperatures.
Energies 18 05899 g006
Figure 7. (a) Cross-sectional plots of fluid velocities at the anode and cathode sides at different initial flow rates (X–Z direction). (b) Surface concentration plots of H2O on the cathode side at different initial flow rates.
Energies 18 05899 g007
Table 1. Physical parameters of URFC.
SubdomainsSymbolsValues (mm)
Gas channelsLCH, HCH, WCH30, 1.6, 1.76
Bipolar platesLBP, HBP, WBP30, 2, 3.5
RibsδRib, WRib, LRib1.6, 1.76, 30
Gas diffusion layersδGDL, WGDL, LGDL0.35, 3.5, 30
Catalyst layersδCL, WCL, LCL0.005, 3.5, 30
Proton exchange membraneδm, Wm, Lm0.127, 3.5, 30
Table 2. Parameter reference table for PEM-URFC.
DescriptionSymbolUnitValue (EC)Value (FC)
Flow ratesvm3/s2.5 × 10−7--
Cell temperatureTK303.15333.15
Anode reference exchange current densityi0,aA/m22 × 10−51 × 10−3
Conductivity of GDLσGDLS/m222222
Porosity of GDLεGDL\0.60.6
Table 3. Parameter list for EC and FC validation.
DescriptionSymbolUnitValue (EC)Value (FC)
Anode porosityεaLGDL, εaCL\0.4, 0.30.4, 0.3
Cathode porosityεcLGDL, εcCL\0.4, 0.30.4, 0.3
Anode permeabilityΚaLGDL, ΚaCLμm2118, 23.6118, 23.6
Cathode permeabilityΚcLGDL, ΚcCLμm2118, 23.6118, 23.6
Anode conductivityκaLGDL, κaCLS/m20,000, 10, 500020,000, 10, 5000
Cathode conductivityκcLGDL, κcCLS/m20,000, 10, 500020,000, 10, 5000
MEM ConductivityκMEMS/m9.8259.825
Cell temperatureTK303.15363.15
Reference pressurePrefatm11
Reference exchange current density j0a, j0cA/m30.05, 30000.001, 100
Charge transfer coefficientsαa, αc\0.5, 0.50.5, 0.5
Disclaimer/Publisher’s Note: The statements, opinions and data contained in all publications are solely those of the individual author(s) and contributor(s) and not of MDPI and/or the editor(s). MDPI and/or the editor(s) disclaim responsibility for any injury to people or property resulting from any ideas, methods, instructions or products referred to in the content.