1. Introduction
Lithium-ion batteries (LIBs) have emerged as a pivotal energy storage technology in contemporary society, playing an essential role in global efforts to achieve sustainable development goals [
1,
2]. Owing to their notable advantages, including high energy density, low energy consumption, and low environmental impact, LIBs have become the dominant choice for a wide range of applications, from portable electronics to large-scale energy storage systems (ESSs) and electric vehicles (EVs). Their integration is crucial for stabilizing power grids with high penetration of intermittent renewable energy sources, such as solar and wind, thereby supporting the transition towards a more sustainable and resilient energy infrastructure [
3]. Extended utilization of LIBs leads to progressive performance deterioration, characterized by capacity loss and elevated internal resistance, which significantly impairs their power delivery and safety [
4]. State of health (SOH) reflects the extent of performance degradation that occurs throughout the charge–discharge cycles of a battery [
5,
6], serving as a key indicator of its reliability and operational safety. Thus, accurate prediction of the SOH of LIBs has become increasingly critical.
Methods for estimating the SOH of LIBs are primarily divided into two categories: physics-based models (PBMs) and data-driven approaches [
7,
8,
9]. PBMs typically utilize physical or mathematical principles to simulate the operational mechanisms of batteries and assess their performance and aging characteristics [
10,
11]. For example, Xiao-Guang Yang et al. [
12] developed a physics-based aging model that reveals the transition from linear solid electrolyte interphase (SEI)-dominated decay to nonlinear rapid degradation driven by lithium plating and pore clogging in cycled LIBs. Yizhao Gao et al. [
13] presented a dual nonlinear filter-based co-estimation scheme for state of charge (SOC) and SOH using a reduced-order electrochemical model, effectively addressing performance decay issues in lithium-ion batteries. However, the application of PBMs is often constrained by several practical challenges. First, the accuracy of PBMs heavily relies on the representational capability of the underlying model. Yet, most existing physical models struggle to comprehensively characterize the complex degradation processes and electrochemical behavior of LIBs, particularly under unconventional or extreme operating conditions. Second, PBMs generally demand high-precision measurement data and are highly susceptible to sensor noise—requirements that are difficult to consistently meet in real-world applications. Consequently, despite their potential for high estimation accuracy, the computational complexity and substantial resource requirements of PBMs hinder their widespread practical adoption [
14].
In contrast, data-driven approaches eschew explicit physical modeling and instead utilize machine learning techniques to directly learn statistical mappings between SOH and indicative features from battery operational data, such as voltage, current, and temperature [
15,
16,
17]. A variety of deep learning and machine learning techniques have been developed for this purpose. For example, Jing Han et al. [
18] proposed a fractional-derivative enhanced long short-term memory network (LSTM) that significantly improves SOH estimation accuracy by incorporating fractional calculus to capture multi-scale memory effects in battery degradation. Chen Liang et al. [
19] proposed a quantum convolutional neural network that achieves accurate, robust, and generalizable SOH estimation for LIBs under noisy and stochastic conditions. While data-driven approaches currently dominate the field of battery SOH estimation, they do face certain limitations regarding dataset dependency and interpretability, with occasional predictions that may not fully align with established physical principles [
20].
The development of physics-informed neural networks (PINNs) provides a promising approach to overcome the constraints associated with traditional machine learning and deep learning frameworks [
21,
22,
23]. PINNs integrate the physical constraints of battery systems directly into the training loss function, enabling the modeling of intricate nonlinear degradation behaviors while guaranteeing that all model predictions adhere to underlying physical laws [
24]. For example, Jinhua Ye et al. [
25] presented a PINN that incorporates electrochemical features from incremental capacity and differential temperature curves to enhance the interpretability and accuracy of SOH estimation for LIBs. Guoqing Su et al. [
20] proposed a battery PINN that incorporates physical constraints derived from incremental capacity curve peaks to enhance the interpretability and accuracy of feedforward neural networks in predicting the SOH of LIBs. Aina Tian et al. [
14] proposed a PINN with a dual-branch structure to achieve accurate and robust SOH estimation for LIBs by integrating a universal differential equation-based degradation model and health features within a restricted voltage window.
Existing PINN frameworks, however, remain constrained in processing high-dimensional inputs and dynamically capturing the coupled interactions among multiple variables. These limitations hinder their effectiveness in practical applications such as SOH estimation for LIBs. Given the strong high-dimensional function approximation capabilities exhibited by Kolmogorov–Arnold networks (KANs), integrating them into LIB degradation modeling holds significant potential to overcome the shortcomings associated with PINN-based methods [
26]. KANs have recently gained significant traction in the field of battery systems. In a study by Zequera et al. [
27], KAN was employed for algorithm development within battery energy storage systems and validated on novel battery datasets. The implemented KAN model achieved an accuracy exceeding 96%, demonstrating superior performance compared to recurrent neural networks (RNNs), convolutional neural networks (CNNs), and multilayer perceptrons (MLPs) in the context of algorithm design and battery energy storage applications. Yilin Yang et al. [
28] proposed a crayfish optimization algorithm-based Kolmogorov–Arnold network (COA–KAN) for accurate and robust SOC estimation of LIBs under multiple temperatures and driving cycles.
In summary, lithium battery degradation is complex. Data-driven methods have poor interpretability, while physical models are computationally expensive. PINNs are a compromise but struggle with high-dimensional data and dynamic coupling.
To address the above limitations, this paper proposes a novel SOH estimation framework fusing Kolmogorov–Arnold networks with physics-informed neural network (KAN-PINN) [
29]. This hybrid model leverages KAN’s superior approximation capability for high-dimensional functions and integrates the physical constraints of PINNs, ensuring predictions adhere to fundamental battery degradation physics while maintaining data-driven flexibility. The framework aims to enhance SOH prediction accuracy, robustness, and interpretability. The main contributions are:
Physics-Guided Modeling: The proposed KAN-PINN framework incorporates the Verhulst model into its PINN component. This architecture not only achieves high-precision SOH estimation but also identifies physical model parameters, effectively addressing interpretability challenges in data-driven SOH estimation.
Enhanced Nonlinear Representation: Replacing standard MLPs in PINNs with KANs, which employ learnable activation functions on edges parameterized via splines instead of linear weight matrices, significantly boosts nonlinear representation capacity and model flexibility. This design is particularly suited for capturing intricate battery degradation dynamics.
Comprehensive Experimental Validation: Extensive comparative experiments and generalization tests on a public dataset demonstrate the method’s superior performance, achieving a root mean square percentage error (RMSPE) of 0.300% and a mean absolute error (MAE) of 1.342%. Ablation studies and hyperparameter analyses corroborate the framework’s scientific coherence and operational stability, with results consistently demonstrating its adaptability and robustness across diverse battery chemistries and operating conditions.
The paper is structured as follows:
Section 2 describes the Toyota Research Institute (TRI, Los Altos, CA, USA) dataset and the preprocessing steps applied.
Section 3 explains the fundamental principles of KAN and PINN, along with the specific architecture of the proposed KAN-PINN framework.
Section 4 presents experimental results, provides a multi-faceted comparative analysis, and discusses the advantages of the framework. Finally,
Section 5 concludes the paper and suggests potential directions for future research.
2. Experimental Data and Data Processing
This study employs the TRI dataset to predict SOH, utilizing commercial lithium iron phosphate (LFP) cells (A123 Systems APR18650M1A, A123 Systems, Waltham, MA, USA) [
30]. Key experimental parameters are summarized in
Table 1. The dataset comprised multiple features, including voltage and current profiles, surface temperature dynamics, charge/discharge capacity records, and cycle indices. As depicted in
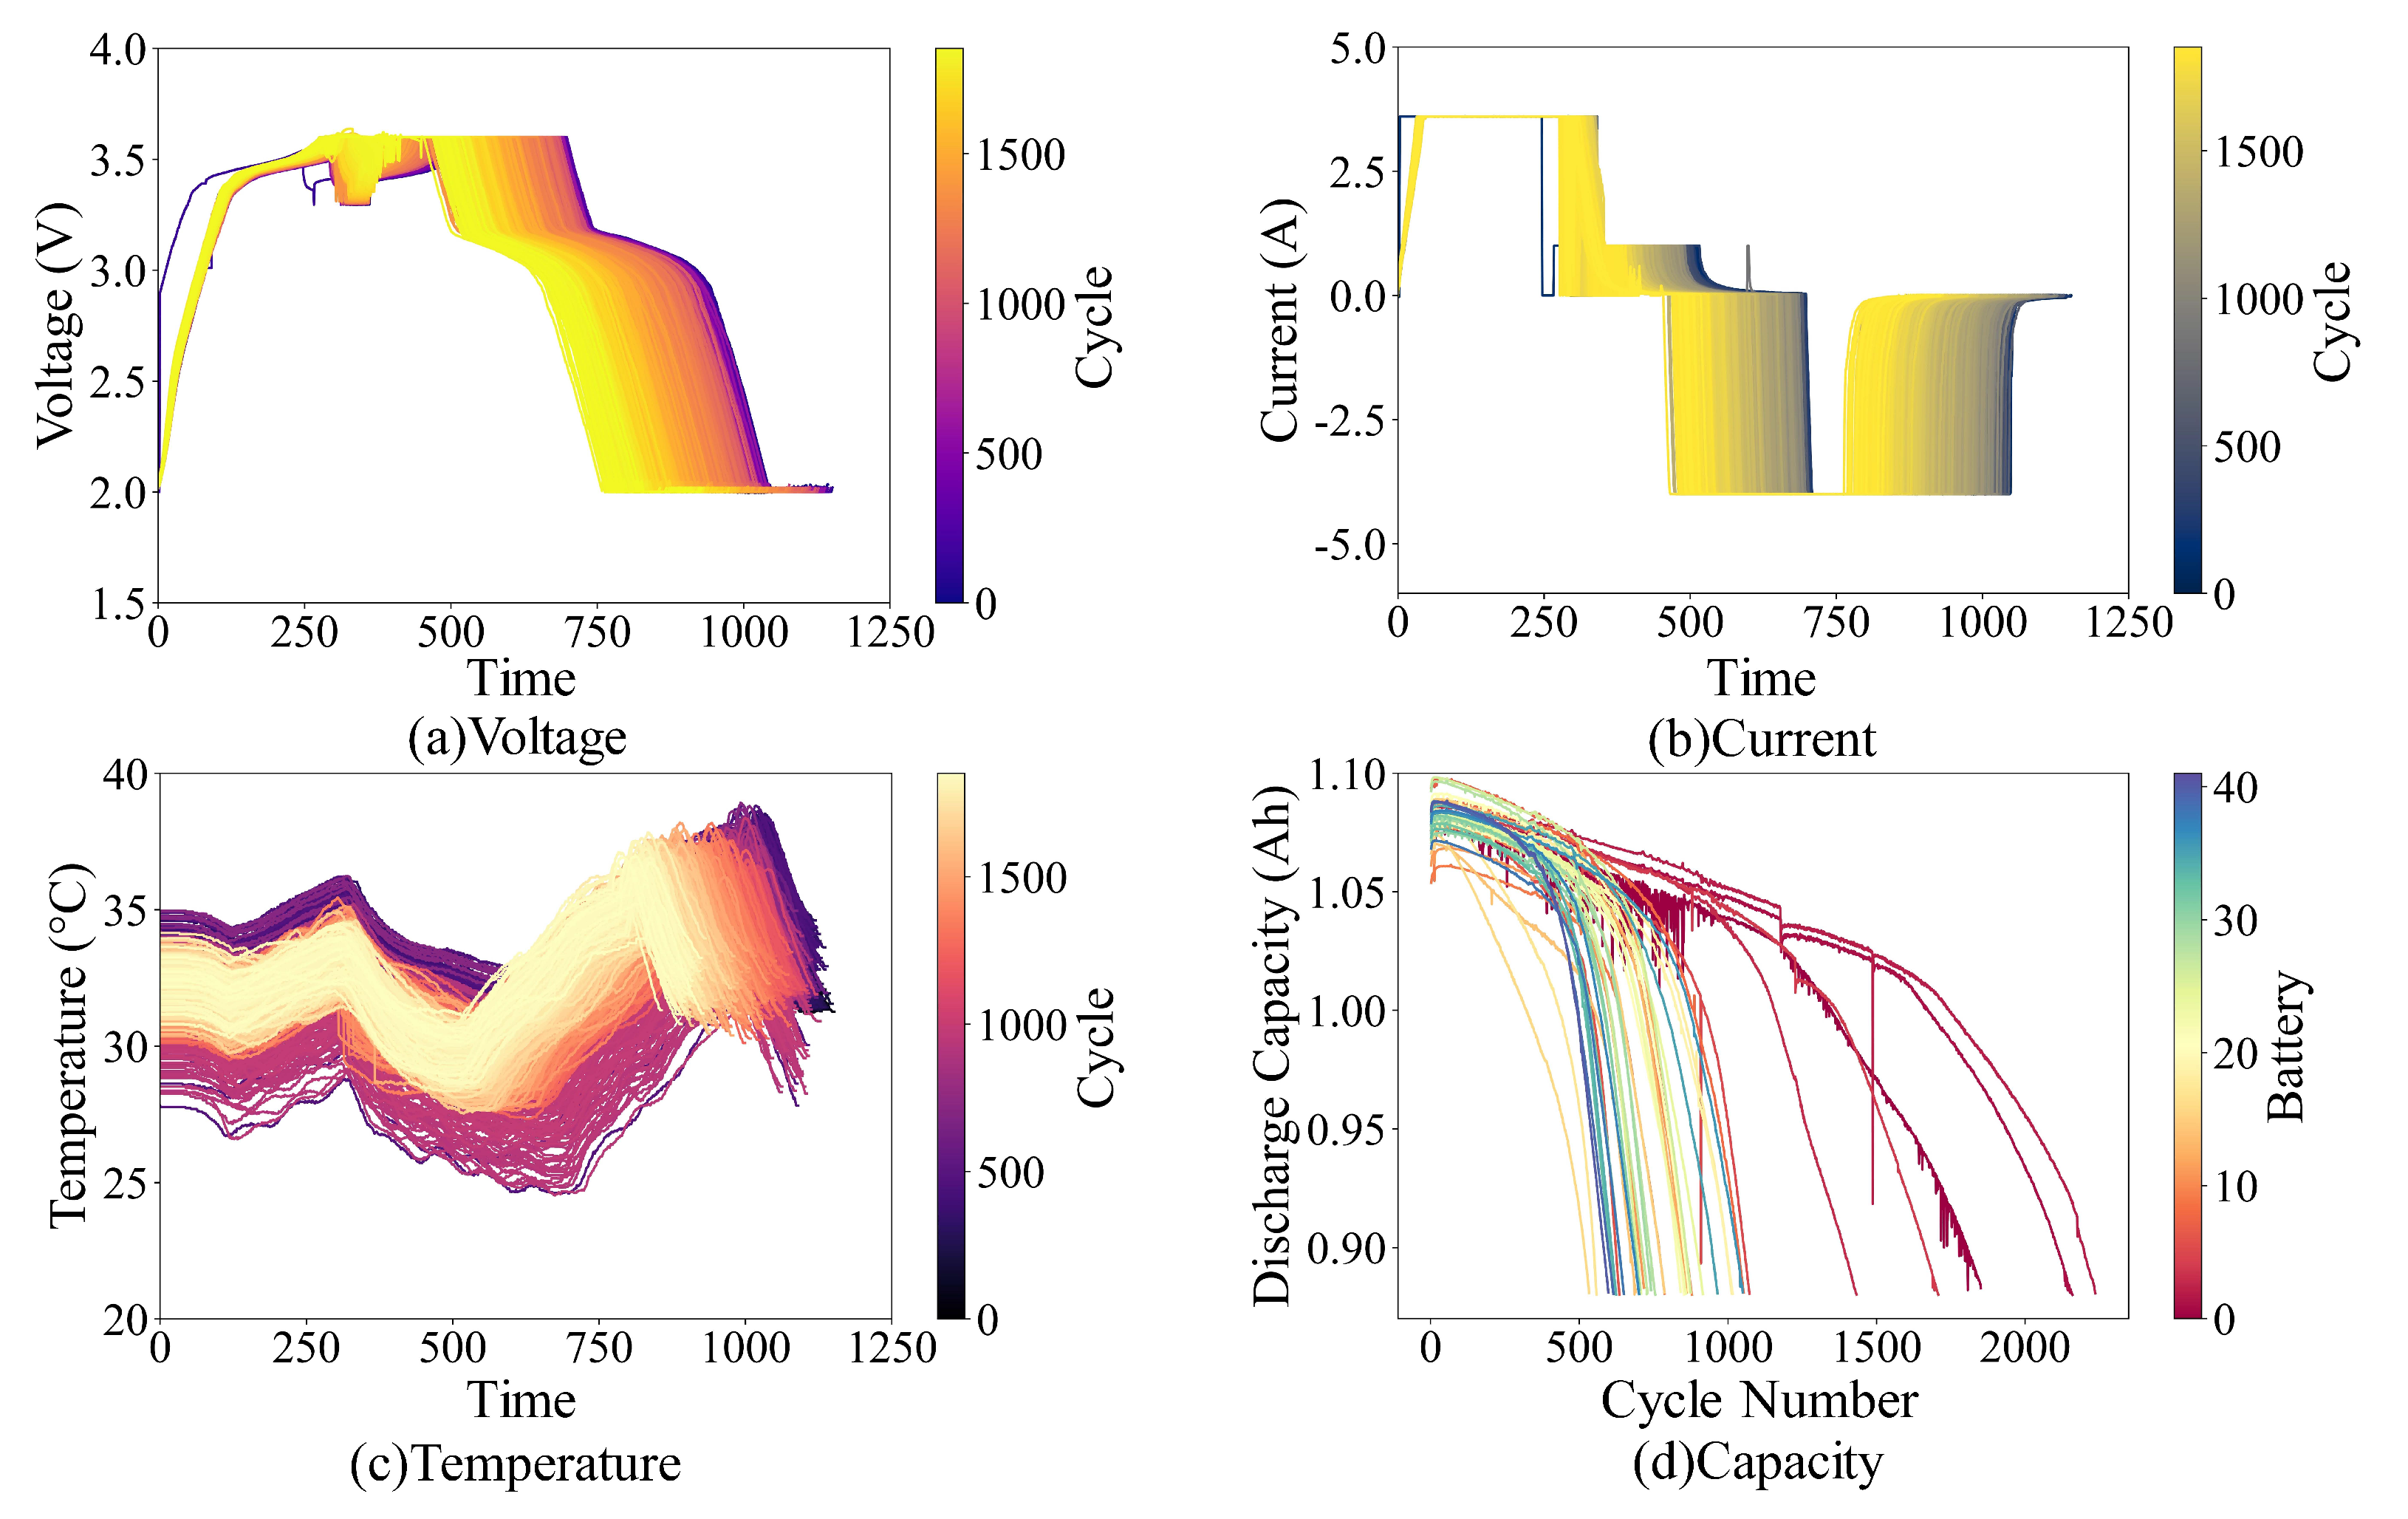
Figure 1a–c, the cyclic aging process of cell ‘b1c0’ involves constant current-constant voltage (CC-CV) charging followed by constant-current discharging at 4 C. Temperature peaks are observed during high-current stages.
The rationale for the experimental framework in this study is based on the findings from Reference [
30], which utilized the TRI dataset. The primary reason for selecting only the discharge phase data is as follows: During the initial stages where no significant battery capacity degradation has yet occurred, key degradation modes (such as loss of delithiated negative electrode active material) have already induced alterations in the thermodynamic properties of the electrodes. These alterations subsequently lead to subtle yet detectable evolutions in the shape of the discharge voltage curve. Under constant discharge conditions, these evolutions are particularly clear and stable. This approach effectively eliminates interference from variable charging strategies, thereby enabling the sensitive capture of hidden features strongly correlated with the battery’s ultimate lifespan.
Since the length of discharge data may vary, it is necessary to perform interpolation on the data. With the original discharge time
preserved, both voltage and temperature profiles are interpolated to a standardized length of 1024 points, balancing accuracy and efficiency. This preprocessing step ensures full reconstructability of the original data from the uniform-length series using
. Min-max scaling is employed to improve numerical stability: voltage values originally between 2.0–3.6 V are scaled to [0, 1], forming the voltage input vector
; similarly, temperature values in the range of 26–42 °C are normalized to [0, 1], yielding the temperature vector
. Aging indicators, including SOH and cycle number, are systematically documented for degradation modeling. The TRI dataset provides standardized discharge capacity measurements for each cycle, as shown in
Figure 1d. SOH is defined as:
where
denotes the current maximum capacity and
is the nominal capacity (1.1 Ah). Cycle numbers are normalized to facilitate cross-sample comparison. The preprocessed inputs—comprising voltage
, temperature
, and discharge time
, along with corresponding SOH and normalized cycle index
t—are randomly shuffled as the final preprocessing step.
3. Methodology
To improve the accuracy and interpretability of SOH estimation for LIBs, this study proposes a KAN-PINN architecture, which integrates physical constraints derived from the Verhulst degradation model. By optimizing a composite loss function that balances data fidelity, physical residual, and temporal smoothness, the model effectively captures the underlying battery degradation dynamics. Replacing the conventional MLP in PINNs with KANs enables better modeling of complex nonlinear relationships inherent in battery aging processes, thereby improving overall estimation accuracy. This framework simultaneously identifies key degradation parameters and achieves high-precision SOH estimation, ensuring both physical interpretability and generalization capability.
3.1. Physics-Informed Neural Networks
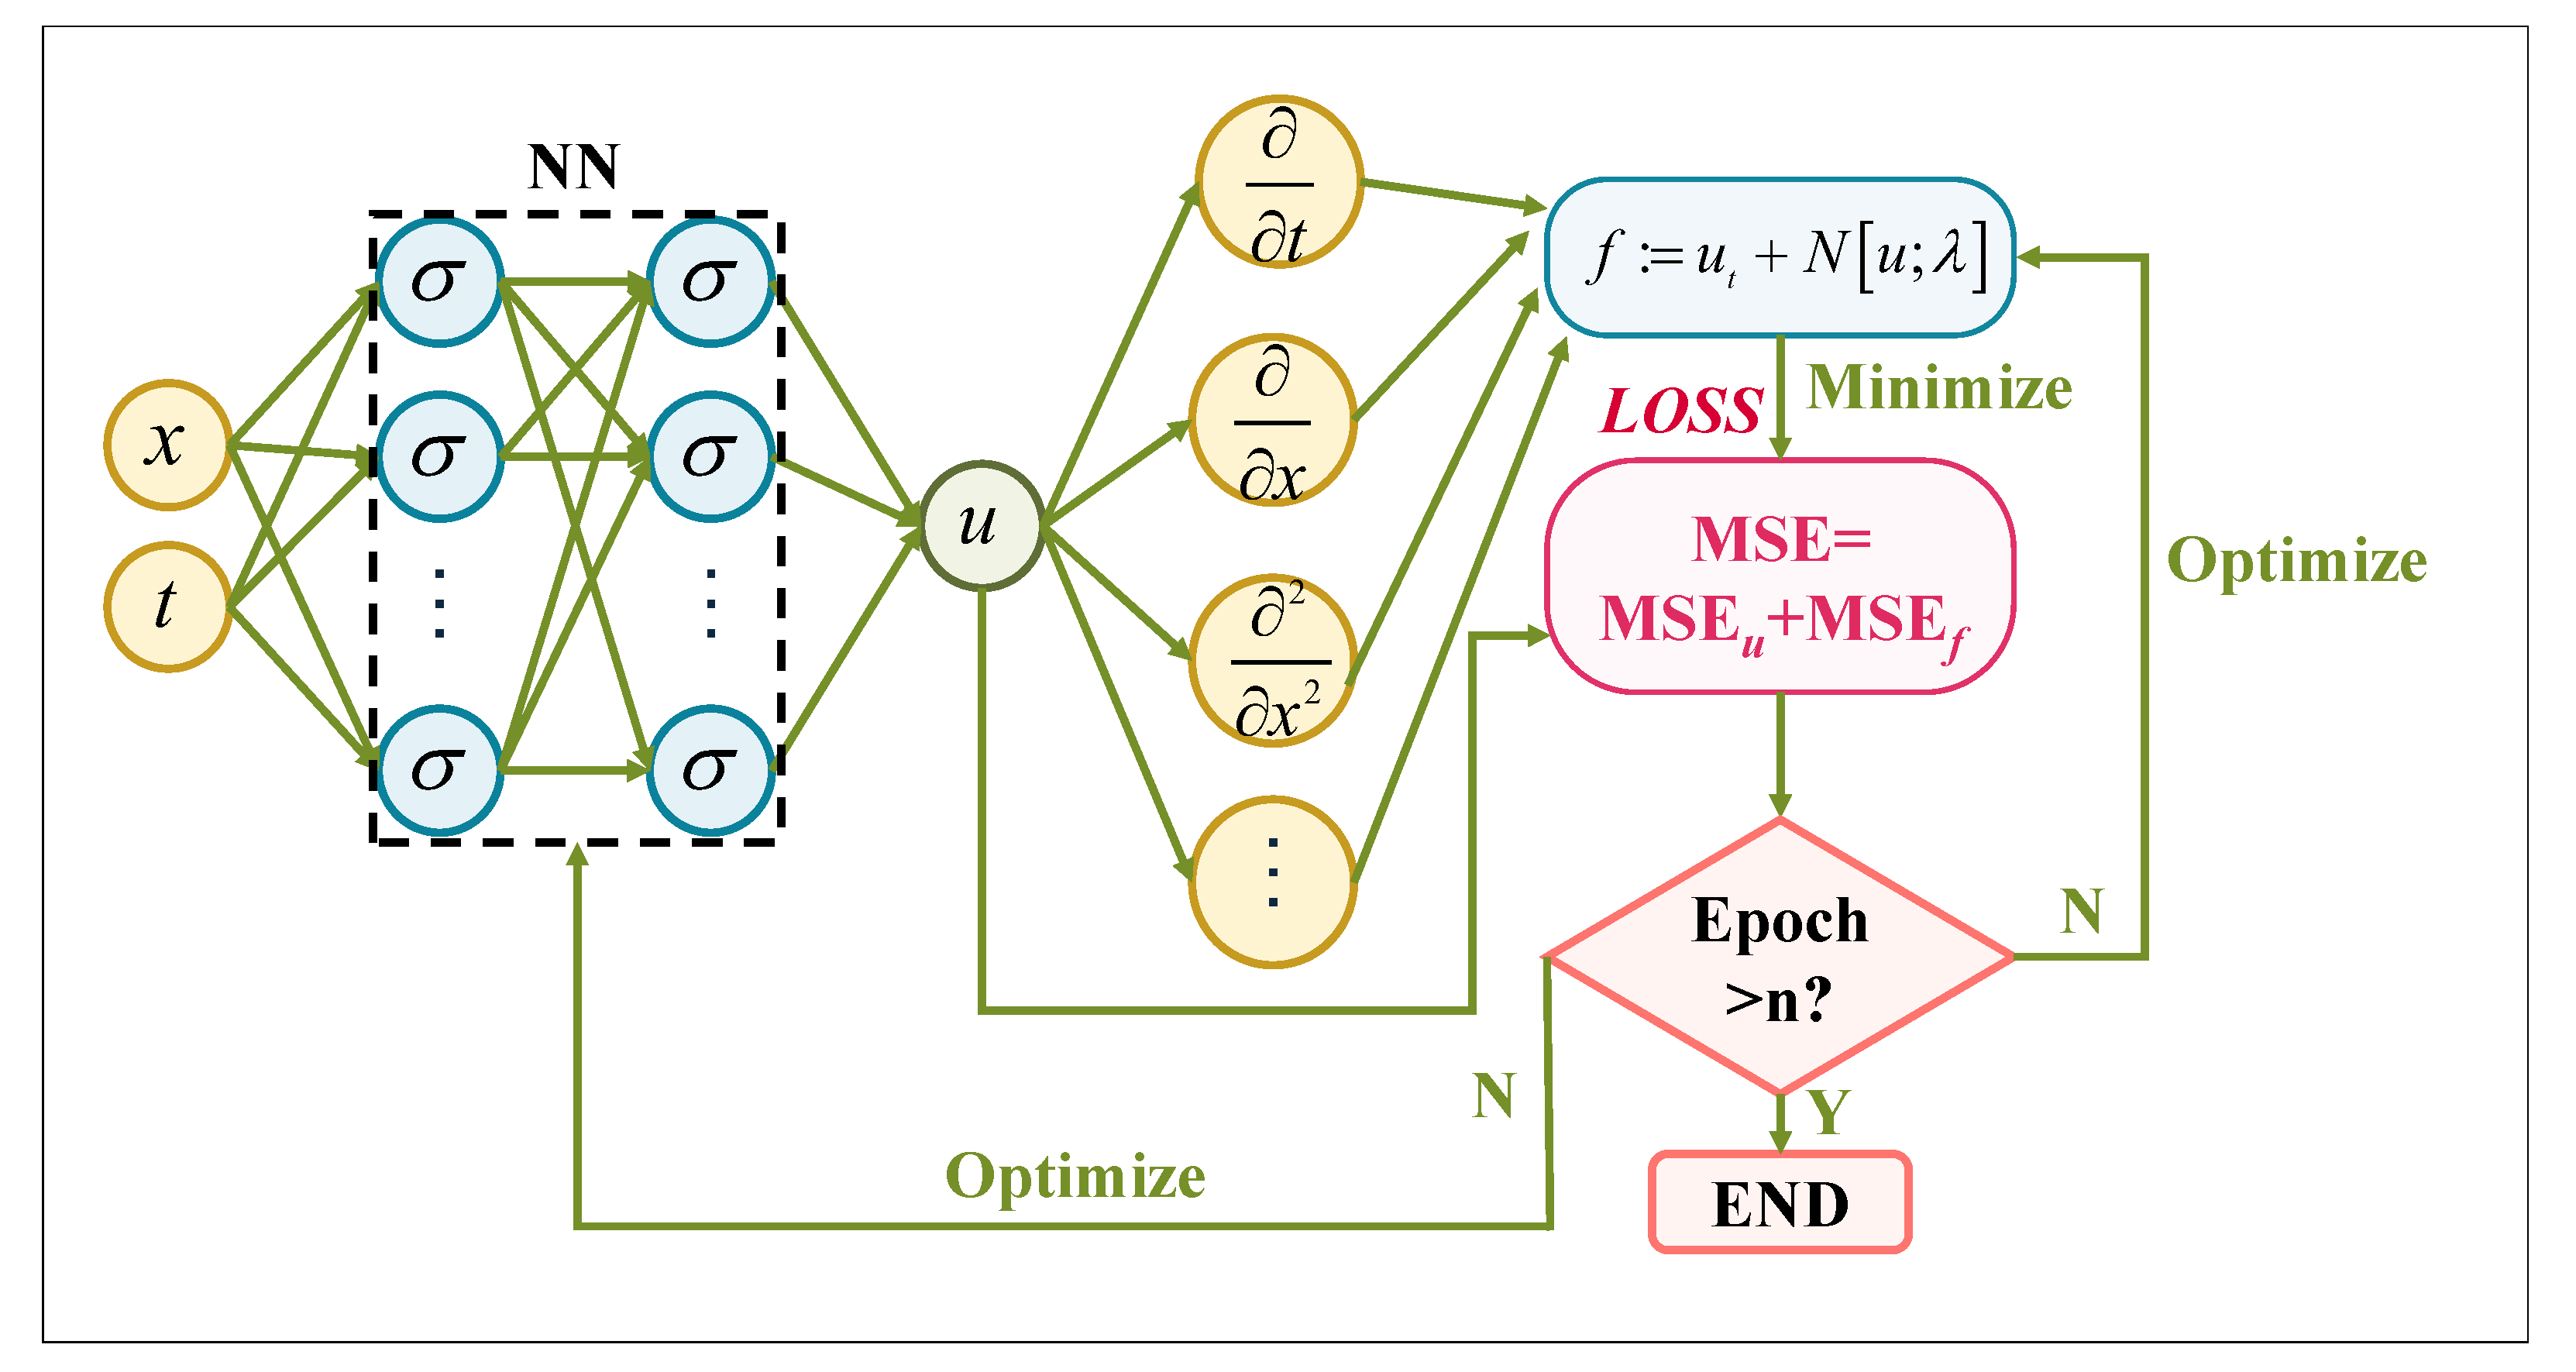
PINNs incorporate physical principles into neural network architectures to improve the model’s adherence to physical laws and its predictive precision. Specifically, as illustrated in
Figure 2, PINNs incorporate physical principles as constraints into the network’s structure, forming a hybrid modeling framework. For battery SOH estimation, PINNs integrate data-driven learning with the enforcement of physical constraints. This approach ensures that the predictions comply with fundamental governing equations, such as conservation laws and kinetic equations that describe battery degradation processes.
The basic workflow of a PINN is as follows: Input data is fed into the neural network to obtain predictions of physical quantities; automatic differentiation is then used to compute specified derivatives of the predictions with respect to the inputs, which are substituted into the target PDEs and parameters to construct the equation residuals. The total loss function is defined as the sum of the data/condition error () and the physical residual error (). Gradient descent-based optimizers are employed to minimize this loss function, updating both the neural network weights and the learnable parameters simultaneously via backpropagation. The above process continues until the number of epochs meets the predefined criteria, at which point the training ends.
The loss function in a PINN comprises a data fidelity term and a physics-informed regularization term. The data-fidelity error is computed by comparing network outputs with experimental measurements, while the physical consistency error is evaluated by assessing the residual of the governing physical equations with respect to the network’s predictions. Many battery degradation mechanisms are described by partial differential equations (PDEs). PINNs leverage automatic differentiation to compute exact derivatives, thereby embedding the PDEs directly into the learning process. This allows PINNs to estimate unknown parameters in the PDEs in an end-to-end manner without requiring explicit numerical solvers.
Compared to conventional neural networks, PINNs introduce physical constraints that enhance generalization performance and reduce the risk of overfitting, particularly valuable in data-sparse scenarios such as battery SOH estimation.
Degradation Dynamics via the Verhulst Model
The Verhulst model employs a modified Verhulst equation, first introduced by Xian et al. [
31] for prognostics, to characterize the aging process of lithium-ion batteries in terms of capacity fade. This nonlinear growth model describes the evolution of capacity loss percentage, defined as
SOH, through the following first-order differential equation:
The degradation rate constant k reflects the intrinsic capacity fade rate under given operating conditions, including state of charge, depth of discharge, and temperature. The initial capacity loss accounts for early-cycle capacity reduction due to SEI formation—a phenomenon occurring shortly after battery manufacture. The parameter M denotes the maximum allowable capacity loss, defining the threshold at which the battery is considered to have reached its end of life. As u approaches M, the degradation rate decreases asymptotically toward zero.
These parameters, which are not directly measurable, are intrinsically linked to fundamental degradation mechanisms such as SEI growth, lithium plating, and active material loss. The framework proposed in this work is designed not only to accurately predict battery SOH, but also to simultaneously infer these hidden physical parameters.
In the model, the parameter
k must be greater than zero to reflect the irreversible nature of battery aging, ensuring
, as a non-positive
k would contradict the fundamental physical process of capacity decay. The maximum capacity loss
M is constrained between 20% and 100%, where the 20% lower bound corresponds to the industry-standard end-of-life threshold of 80% SOH, preventing premature convergence, while the upper bound of 100% avoids numerical instability. Additionally, the instantaneous capacity loss
u is maintained within the range
, ensuring that the capacity degradation remains within physically feasible limits and preventing scenarios such as negative capacity or exceeding the maximum allowable degradation. These constraint boundaries are established based on the general understanding of battery degradation mechanisms and are widely supported by existing literature [
23].
3.2. Kolmogorov–Arnold Network
Previous research on PINNs for battery SOH estimation has primarily employed MLPs. These MLPs typically utilize fixed activation functions and apply nonlinear transformations at the nodes. Such an inflexible architectural design, however, constrains their capacity to approximate complex functional mappings. Given that battery degradation involves intricate and nonlinear processes, the performance of MLP-based PINNs in fitting such relationships remains unsatisfactory. Therefore, it is necessary to explore novel network architectures to enhance the capability of PINNs in modeling battery degradation behavior.
KAN, as illustrated in
Figure 3b, introduces significant innovations to conventional MLP, shown in
Figure 3a, by leveraging the Kolmogorov–Arnold representation theorem, with the central formula expressed as:
where
and
represent continuously defined single-variable function.
Unlike conventional MLPs that employ fixed activation functions at nodes, KANs incorporate learnable activation functions along edges through spline-parameterized univariate functions, replacing standard linear weight matrices. This architectural innovation substantially strengthens the model’s ability to represent nonlinear relationships and increases its adaptability, rendering it especially effective for modeling complex battery degradation mechanisms.
The KAN architecture employs a dual-branch structure consisting of a B-spline branch and a shortcut branch, which are combined in a cascaded fashion to effectively integrate nonlinear activation with linear transformation. In the shortcut branch, a SiLU activation function is applied prior to a linear transformation, thereby enhancing overall network performance. Given an input feature vector
x, the forward propagation process of the B-spline branch is described by Equation (
4):
In this formulation, A represents a learnable weight matrix. The Spline function within the KAN acts as an element-wise nonlinear activation applied to the feature matrix. It accepts a matrix as input and returns an output matrix of the same dimensions. Each individual input element undergoes a unique nonlinear transformation via the spline. Although all operations adhere to a shared structural template, their parameters are learned independently for each element.
In the standard KAN architecture, B-spline functions are employed as activation functions. The parameters governing these splines are trained and optimized concurrently with the remaining network parameters. We therefore initiate our analysis with a single-layer MLP that integrates such nonlinear transformations. Its forward propagation can be mathematically represented as:
The principal distinctions between KAN and conventional MLP reside in their treatment of activation functions and the sequence of computational operations. Unlike MLPs, which employ fixed, non-adaptive activation functions (such as ReLU or GELU) applied uniformly across neurons, KANs utilize learnable, parametrized spline functions that allow activation behavior to be tailored individually to each input. Furthermore, while standard MLPs first execute a linear transformation followed by a nonlinear activation, KANs reverse this order: nonlinear transformations are applied prior to linear combination. Consequently, KANs can be conceptualized as fully connected networks adhering to a “nonlinearity-first, linearity-later” computational paradigm.
In the field of battery state of health estimation, KANs, with their learnable activation functions based on spline parameterization and computational paradigm of “nonlinearity-first, linearity-later” can more flexibly capture complex nonlinear interactions among input variables [
26]. In contrast, traditional networks like convolutional neural networks (CNNs), which rely on local convolutional kernels, and Transformers, which depend on self-attention mechanisms, often exhibit rigid structures when handling high-dimensional dynamically coupled systems, making it difficult for them to adaptively model implicit physical relationships among variables.
Furthermore, the structure of KANs enables more natural coupling of data-driven predictions and physical residual optimization through automatic differentiation when embedding physical equations. This allows for the simultaneous identification of degradation parameters and ensures physical consistency in predictions during training. In comparison, architectures like CNNs and Transformers typically require complex structural adaptations or additional regularization designs to incorporate physical constraints, making it challenging to achieve end-to-end physically interpretable modeling while maintaining high accuracy. Consequently, when dealing with multivariate, strongly coupled dynamic systems such as battery degradation, KAN-PINN demonstrate greater adaptability and modeling efficiency.
3.3. Kolmogorov–Arnold Network Enhanced Physics-Informed Neural Networks for Battery State of Health Estimation
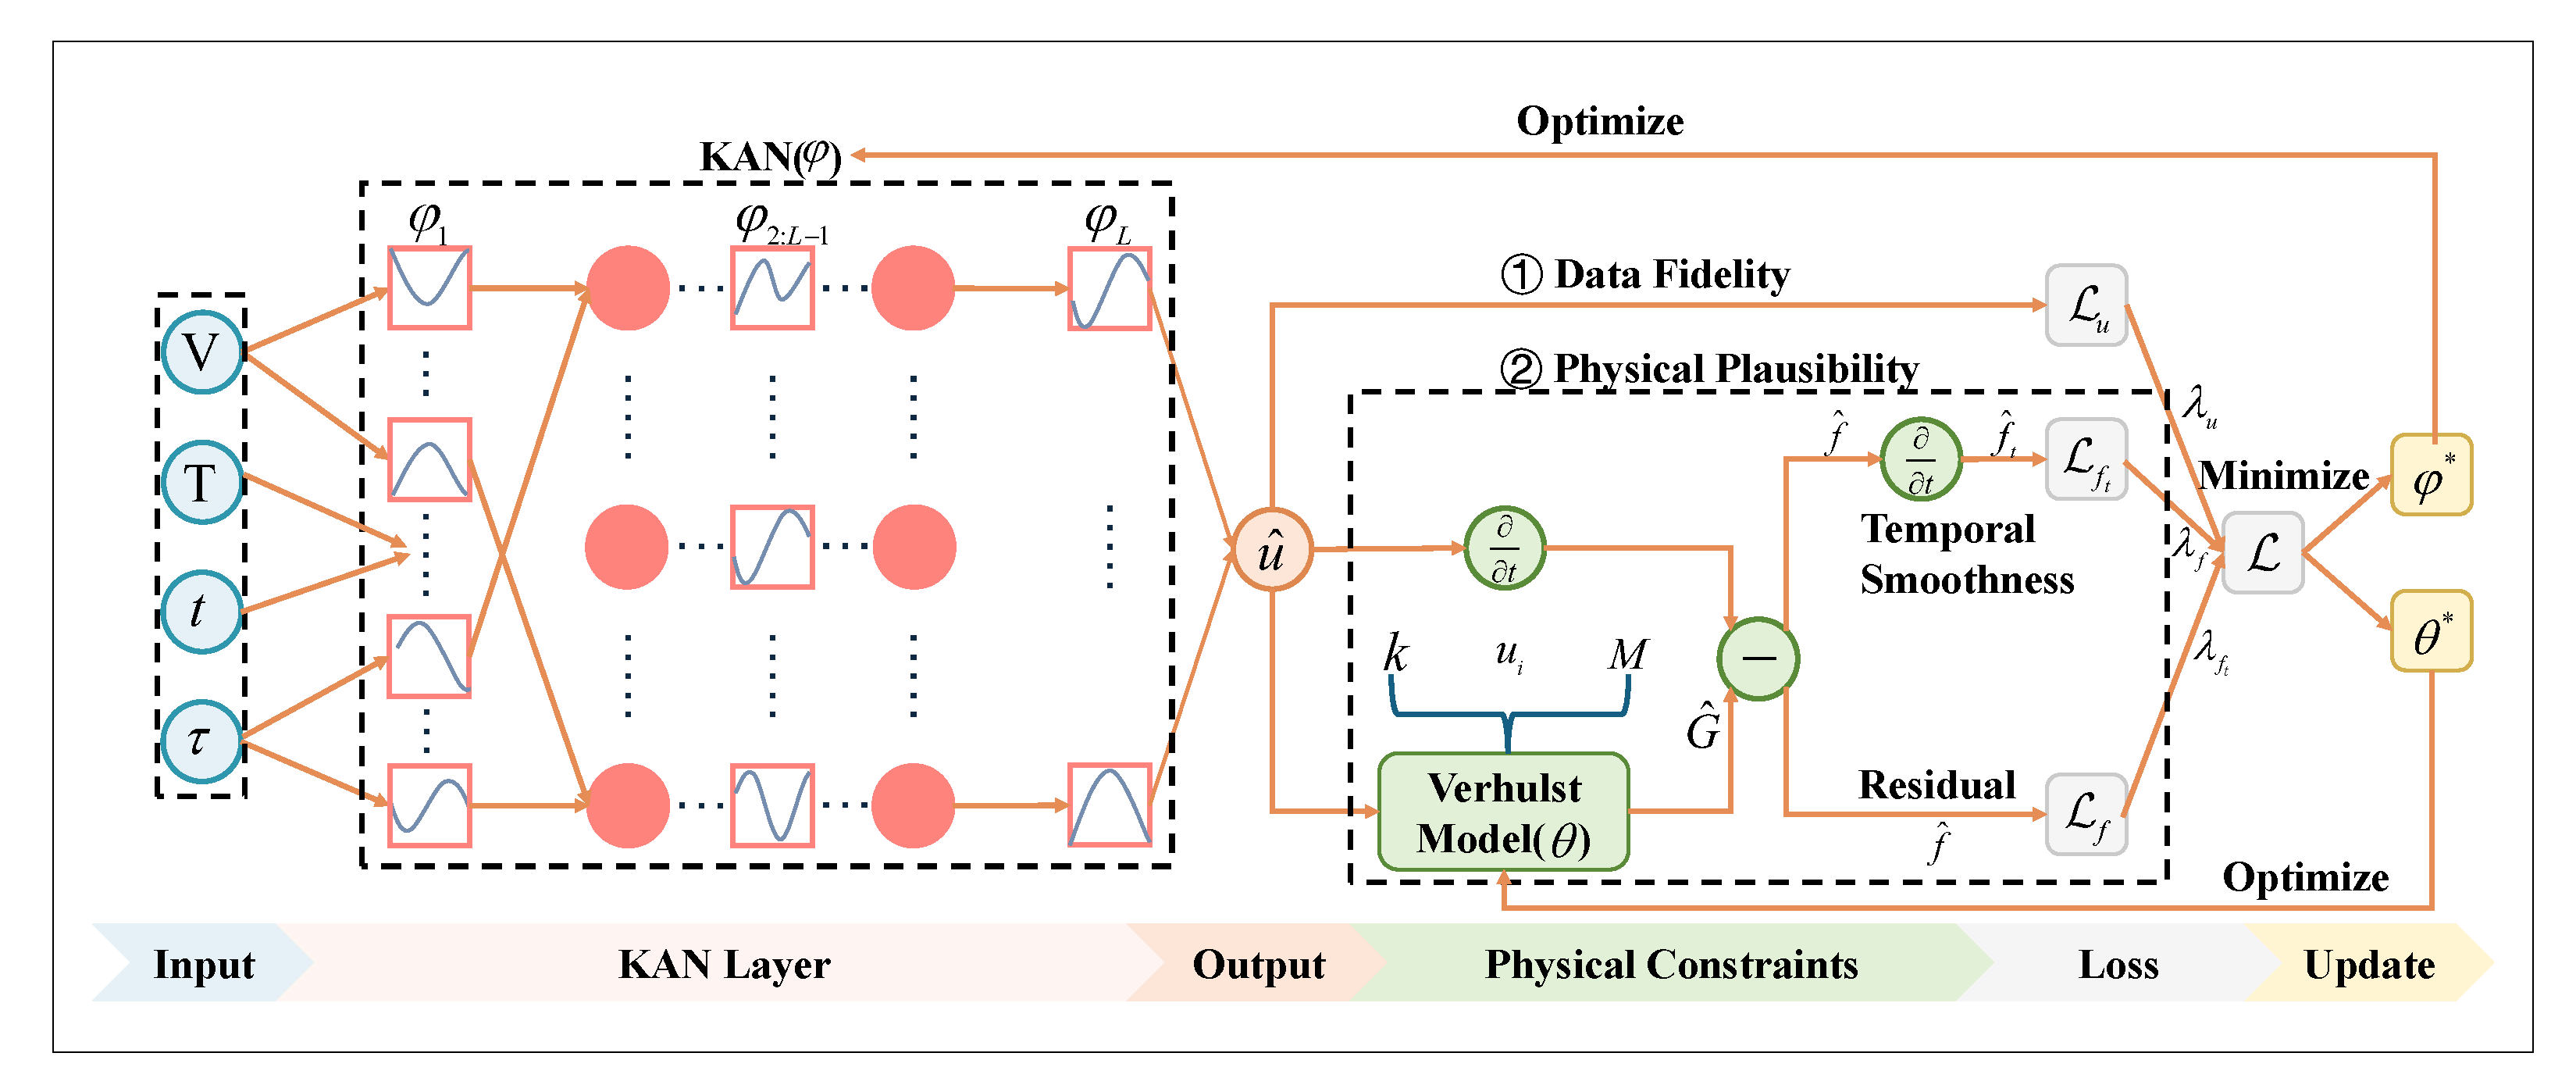
The proposed KAN-PINN architecture (
Figure 4) integrates KAN with PINNs by combining electrochemical constraints with the enhanced fitting capability of KAN. The framework consists of two main components: a KAN-based neural network, which replaces MLP, and a physics-informed embedding (Verhulst model) to improve the interpretability of the overall system. This hybrid methodology combines the enhanced function approximation of KANs, which employ learnable univariate functions, with the physics-informed interpretability of PINNs, maintained through automatic differentiation and a residual-based loss.
This network processes multi-dimensional input data, including a 1024-dimensional voltage vector , a 1024-dimensional temperature vector , and two scalar parameters: discharge cycle time and normalized cycle number t, forming a 2050-dimensional input vector. Feature extraction is performed via a KAN, whose optimal number of layers, node configuration, and hyperparameters are determined during the experimental phase through grid search. By substituting the fixed activation functions in conventional MLPs with learnable spline-based activations, KANs gain the ability to autonomously identify and model intricate nonlinear dependencies between inputs. This approach enhances both the function approximation capacity and interpretability of the model. Moreover, its built-in regularization mechanism (e.g., regularization_loss) effectively mitigates overfitting and enhances the model’s generalization performance.
The output layer produces a scalar estimate of capacity fade percentage
. A dual-path structure is then utilized to impose Verhulst-based physical constraints, ensuring that predictions are both data-consistent and physically plausible. One branch yields the direct capacity loss prediction, while the other enhances electrochemical interpretability via a Verhulst degradation model. Using automatic differentiation, the temporal derivative
is computed and compared against a degradation function
G, defined as:
The physical residual
f, which captures deviations from the expected degradation dynamics, is given by:
This residual serves a dual purpose: it is directly incorporated into the loss function, and its temporal smoothness is assessed via the derivative . Degradation parameters k, , and M are treated as trainable parameters and optimized during backpropagation.
A weighted composite loss function
is adopted to balance data-driven accuracy with physical consistency:
where the coefficients
,
, and
are tuned via grid search. The data fidelity term
quantifies the mean squared error between predicted and actual capacity loss:
The physics residual loss
enforces mechanistic alignment by minimizing the residual magnitude:
Additionally, to promote temporal smoothness of the physical residual, the term
penalizes variations in
f over time:
This integrated training strategy enhances generalization under data scarcity while preserving interpretability through embedded physics.
4. Experimental Result Analysis
This section presents and discusses the experimental results of KAN-PINN. First, the proposed model is benchmarked against several simplified variants—namely, standard KAN and MLP-PINN—to validate the efficacy of the overall KAN-PINN framework and its embedded KAN component. Subsequently, a grid search is employed to investigate the impact of hyperparameters and identify the optimal KAN architecture. Comparative experiments are then conducted against mainstream models, including other PINN-based approaches, to demonstrate the superior performance of KAN-PINN. All experiments were executed on an NVIDIA GeForce RTX 4090 GPU, adhering to the TRI benchmark specifications. The dataset was divided into statistically representative subsets, comprising 41 cells for training, 40 for validation, and 43 for testing, based on the criteria outlined in Reference [
30], which ensured the randomness and representativeness of the sample distribution, thereby enabling a rigorous assessment. A fixed random seed of 1234 was used, and shuffling was enabled during the training data loading phase to ensure reproducibility of initialization and data order. Finally, generalization tests were performed using the Xi’an Jiaotong University (XJTU) battery dataset, confirming the model’s robust generalization capability across varying acquisition protocols and chemical materials.
4.1. Performance Evaluation Metrics
To systematically evaluate the predictive performance of the proposed framework, this study employs the following three metrics:
The lower values of both MAE and RMSPE indicate higher model accuracy. While MAE provides a linear measure of absolute error magnitudes, RMSPE focuses on relative percentage errors and imposes a stronger penalty on large deviations through its quadratic term. This characteristic makes RMSPE particularly suitable for battery SOH estimation, where accurately capturing nonlinear degradation trends and minimizing significant prediction outliers are crucial. In contrast, the larger the coefficient of determination (R2) value, the better the algorithm model fits the data. The integration of these three evaluation metrics enables a more comprehensive and accurate assessment of the prediction results.
4.2. Ablation Experiments
Table 2 presentsthe efficiency analysis of KAN-PINN with different interpolation lengths indicates that a length of 512 yields relatively lower accuracy, while a length of 2048 results in a substantially larger model size. Therefore, adopting a length of 1024 is identified as the optimal choice to balance accuracy and efficiency. The remaining experimental parameters are configured as detailed in
Table 3.
As shown in
Table 4, which compares the performance metrics of the KAN-PINN model at different stages of battery degradation, the model demonstrates good estimation performance in both the early SEI film formation stage (90–100% SOH) and the mid-term stable degradation stage (80–90% SOH). Notably, the model exhibits particularly outstanding performance during the early SEI formation stage, achieving an RMSPE of 0.260 and an MAE of 0.0120%. The visualization of the estimation results in
Figure 5c further confirms this, as the data points in the early SEI formation stage are more closely clustered along the reference line, reflecting the model’s superior estimation accuracy in this phase.
To independently validate the practical effect of the Verhulst model constraint and investigate the effectiveness of replacing the MLP in PINNs with KAN, experiments were conducted under the same training dataset and conditions. A comparison was made among MLP-PINN, the KAN model without physical constraints, and KAN-PINN. The impact of each module on the state of health prediction for lithium batteries was evaluated through ablation experiments, and the corresponding experimental results are summarized in
Table 5.
According to the performance data presented in
Table 5, it is observed that the proposed KAN-PINN achieves the best overall prediction performance, with the lowest MAE and RMSPE. The introduction of KAN, which utilizes B-spline basis functions for nonlinear transformations, enhances the approximation accuracy due to its superior local approximation capability and smoothness compared to the simple activation functions used in MLPs. Furthermore, the incorporation of physical constraints through the PINN framework further improves the performance of KAN. Furthermore, the derived physical degradation parameters—
k of 0.003389,
M of 0.956, and
of 0.0167—demonstrated strong alignment with established electrochemical principles. Overall, the proposed model achieves a good balance between accuracy and computational efficiency.
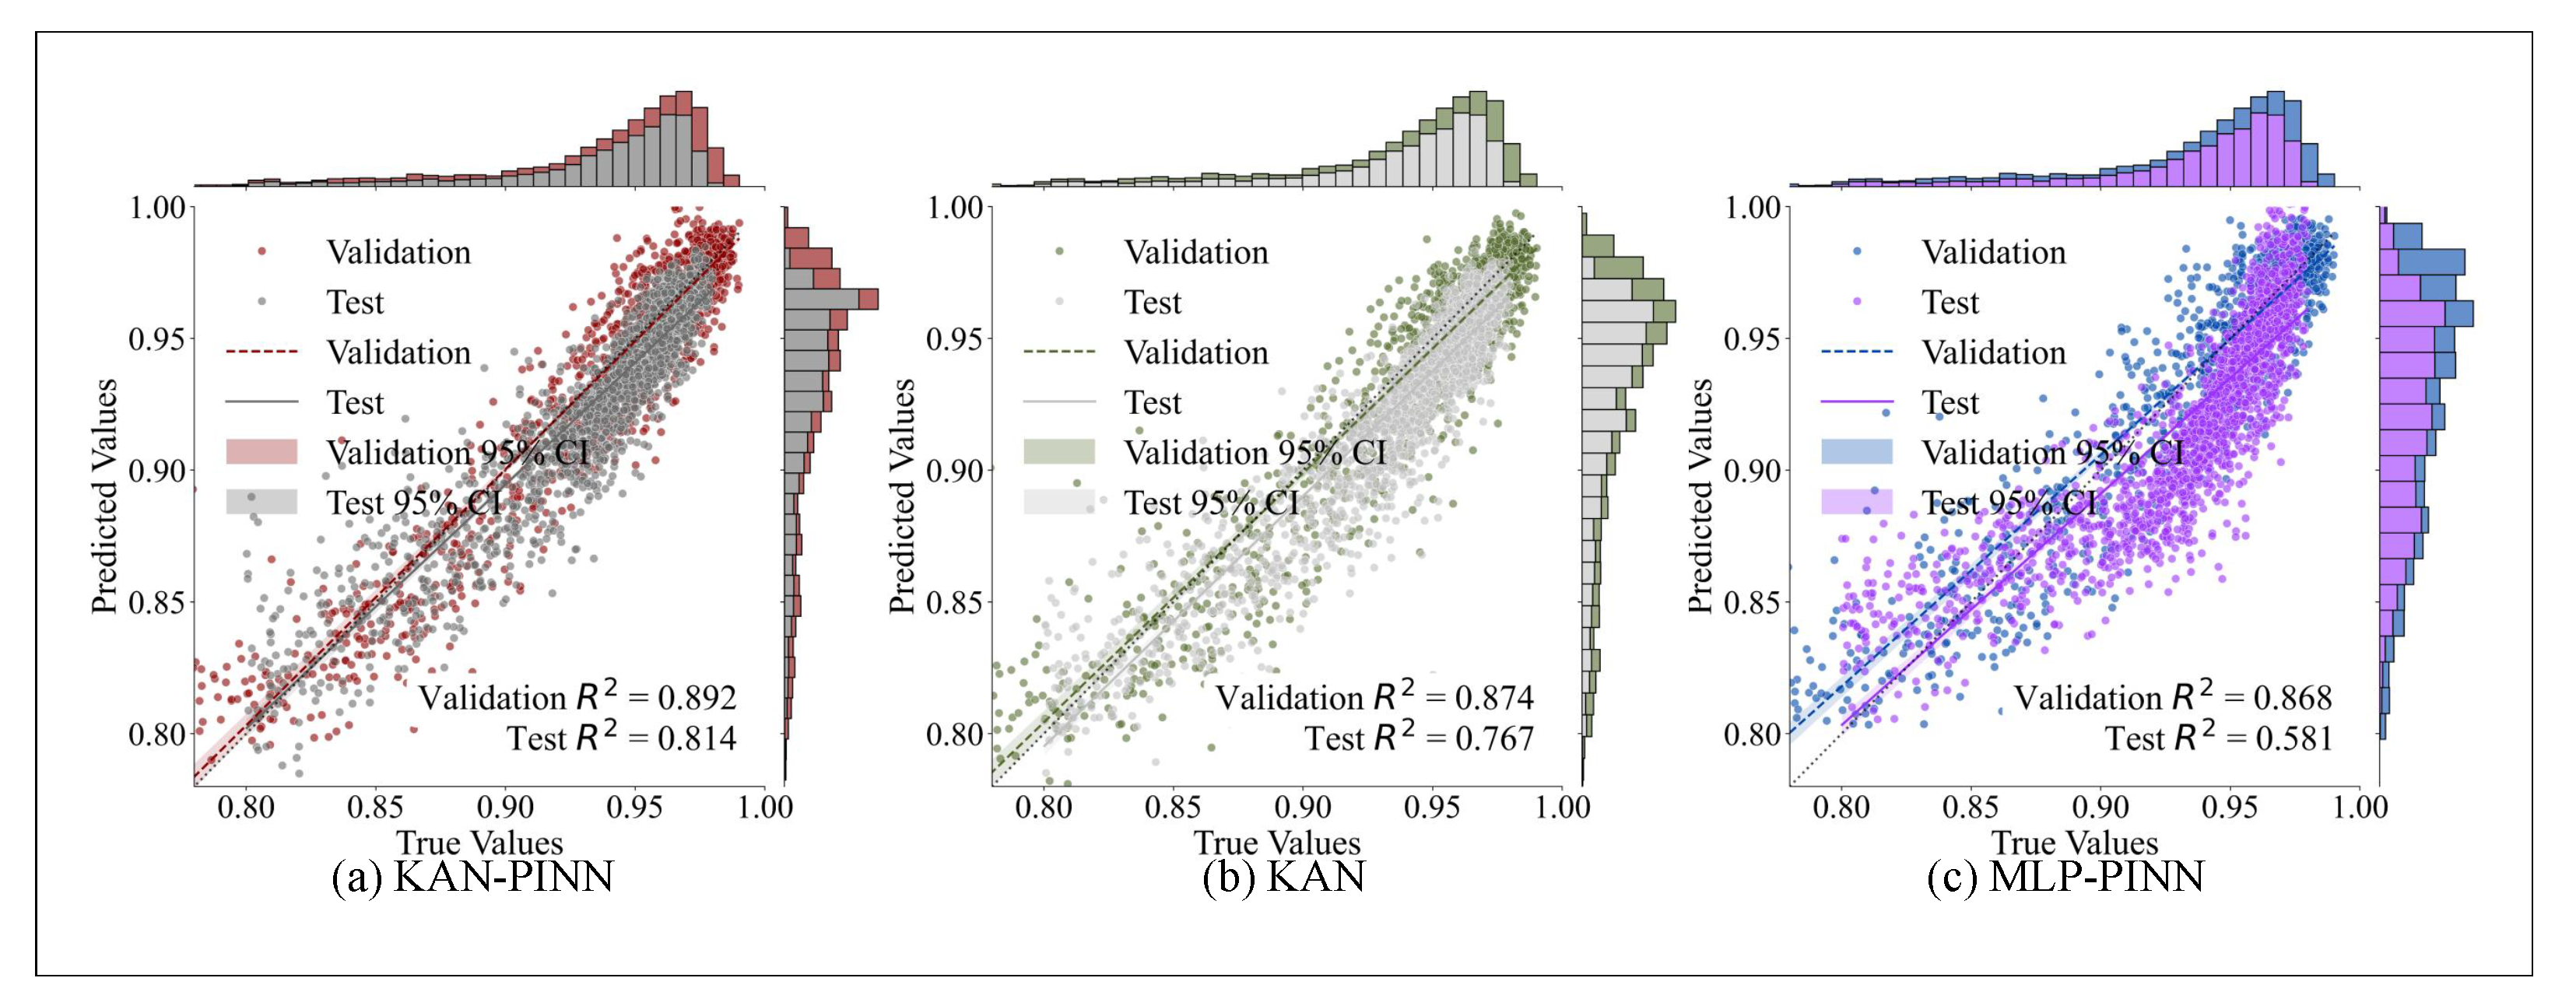
The SOH estimation results are illustrated in
Figure 5. The x-axis corresponds to the true SOH values from the TRI dataset, and the y-axis indicates the SOH predictions generated by each model. A closer alignment of the data points with the diagonal reference line reflects better estimation performance. As demonstrated in the figure, the KAN-PINN model achieves superior SOH prediction accuracy relative to the KAN and MLP-PINN models, attaining higher R
2 scores on both the validation and test sets.
Figure 6 illustrates the error distributions of KAN-PINN, KAN, and MLP-PINN. Analysis of these distributions reveals that the predictions of both KAN and MLP-PINN exhibit greater fluctuations. This observation indicates that while KAN’s enhanced local approximation ability improves the performance of PINNs, the incorporation of physical constraints ensures predictions remain consistent with actual battery degradation patterns, thereby strengthening the model’s robustness and accuracy. In comparison, the KAN-PINN model effectively suppresses such fluctuations, yielding more stable and precise predictions.
4.3. Hyperparameter Optimization Experiments
Through a systematic design of hyperparameter experiments, a phased grid search strategy was employed to identify the optimal configuration among combinations of grid sizes {2, 3, 5}, spline orders {2, 3, 4}, numbers of network layers {1, 2, 3}, and numbers of nodes per layer {16, 32, 64}. As shown by the RMSPE of each combination in the test set in
Figure 7, the experimental results indicate that the configuration with a grid size of 2, spline order of 3, and two hidden layers (each with 16 nodes) achieved the lowest RMSPE on the test set. Furthermore, as shown in
Table 6, among the combinations of network layers {1, 2, 3} and single-layer node counts {16, 32, 64}, the configuration with two hidden layers (each with 16 nodes) consistently exhibited the lowest errors across all metrics. This outcome can be explained by the mathematical characteristics of KANs: a smaller grid size (2) significantly reduces computational complexity while maintaining sufficient fitting accuracy, thereby mitigating overfitting risks; a spline order of 3 achieves an optimal balance between smoothness and expressive power, ensuring both continuity in function approximation and avoiding numerical instability that may arise from higher-order splines; the two-layer architecture with 16 nodes provides adequate nonlinear expressive capacity under the physical constraints of the Verhulst equation, while avoiding potential gradient vanishing issues that can occur in deeper networks within the PINN framework, thus ensuring effective propagation of the physical loss term.
4.4. Comparative Experiments
To objectively evaluate the advantages of the proposed framework in terms of estimation accuracy and robustness, a comparative experiment was conducted with several common deep learning architectures. The effectiveness of the proposed KAN-PINN model in battery SOH estimation was validated through comparisons with LSTM, BiLSTM, GRU, Transformer, and the PINN-Verhulst method [
23].
To ensure a fair comparison, all baseline models were trained and evaluated under identical conditions: the same dataset splits (41 cells for training, 40 for validation, and 43 for testing), consistent preprocessing procedures (as described in
Section 2), and the same computational budget (GPU: NVIDIA GeForce RTX 4090). The hyperparameter configurations of the baseline models (such as the number of hidden units and training epochs) were kept consistent with those of KAN-PINN. No data augmentation was applied beyond the standard interpolation and normalization steps. This setup guarantees that performance differences are attributable to model architectures rather than variations in training protocols.
As shown in
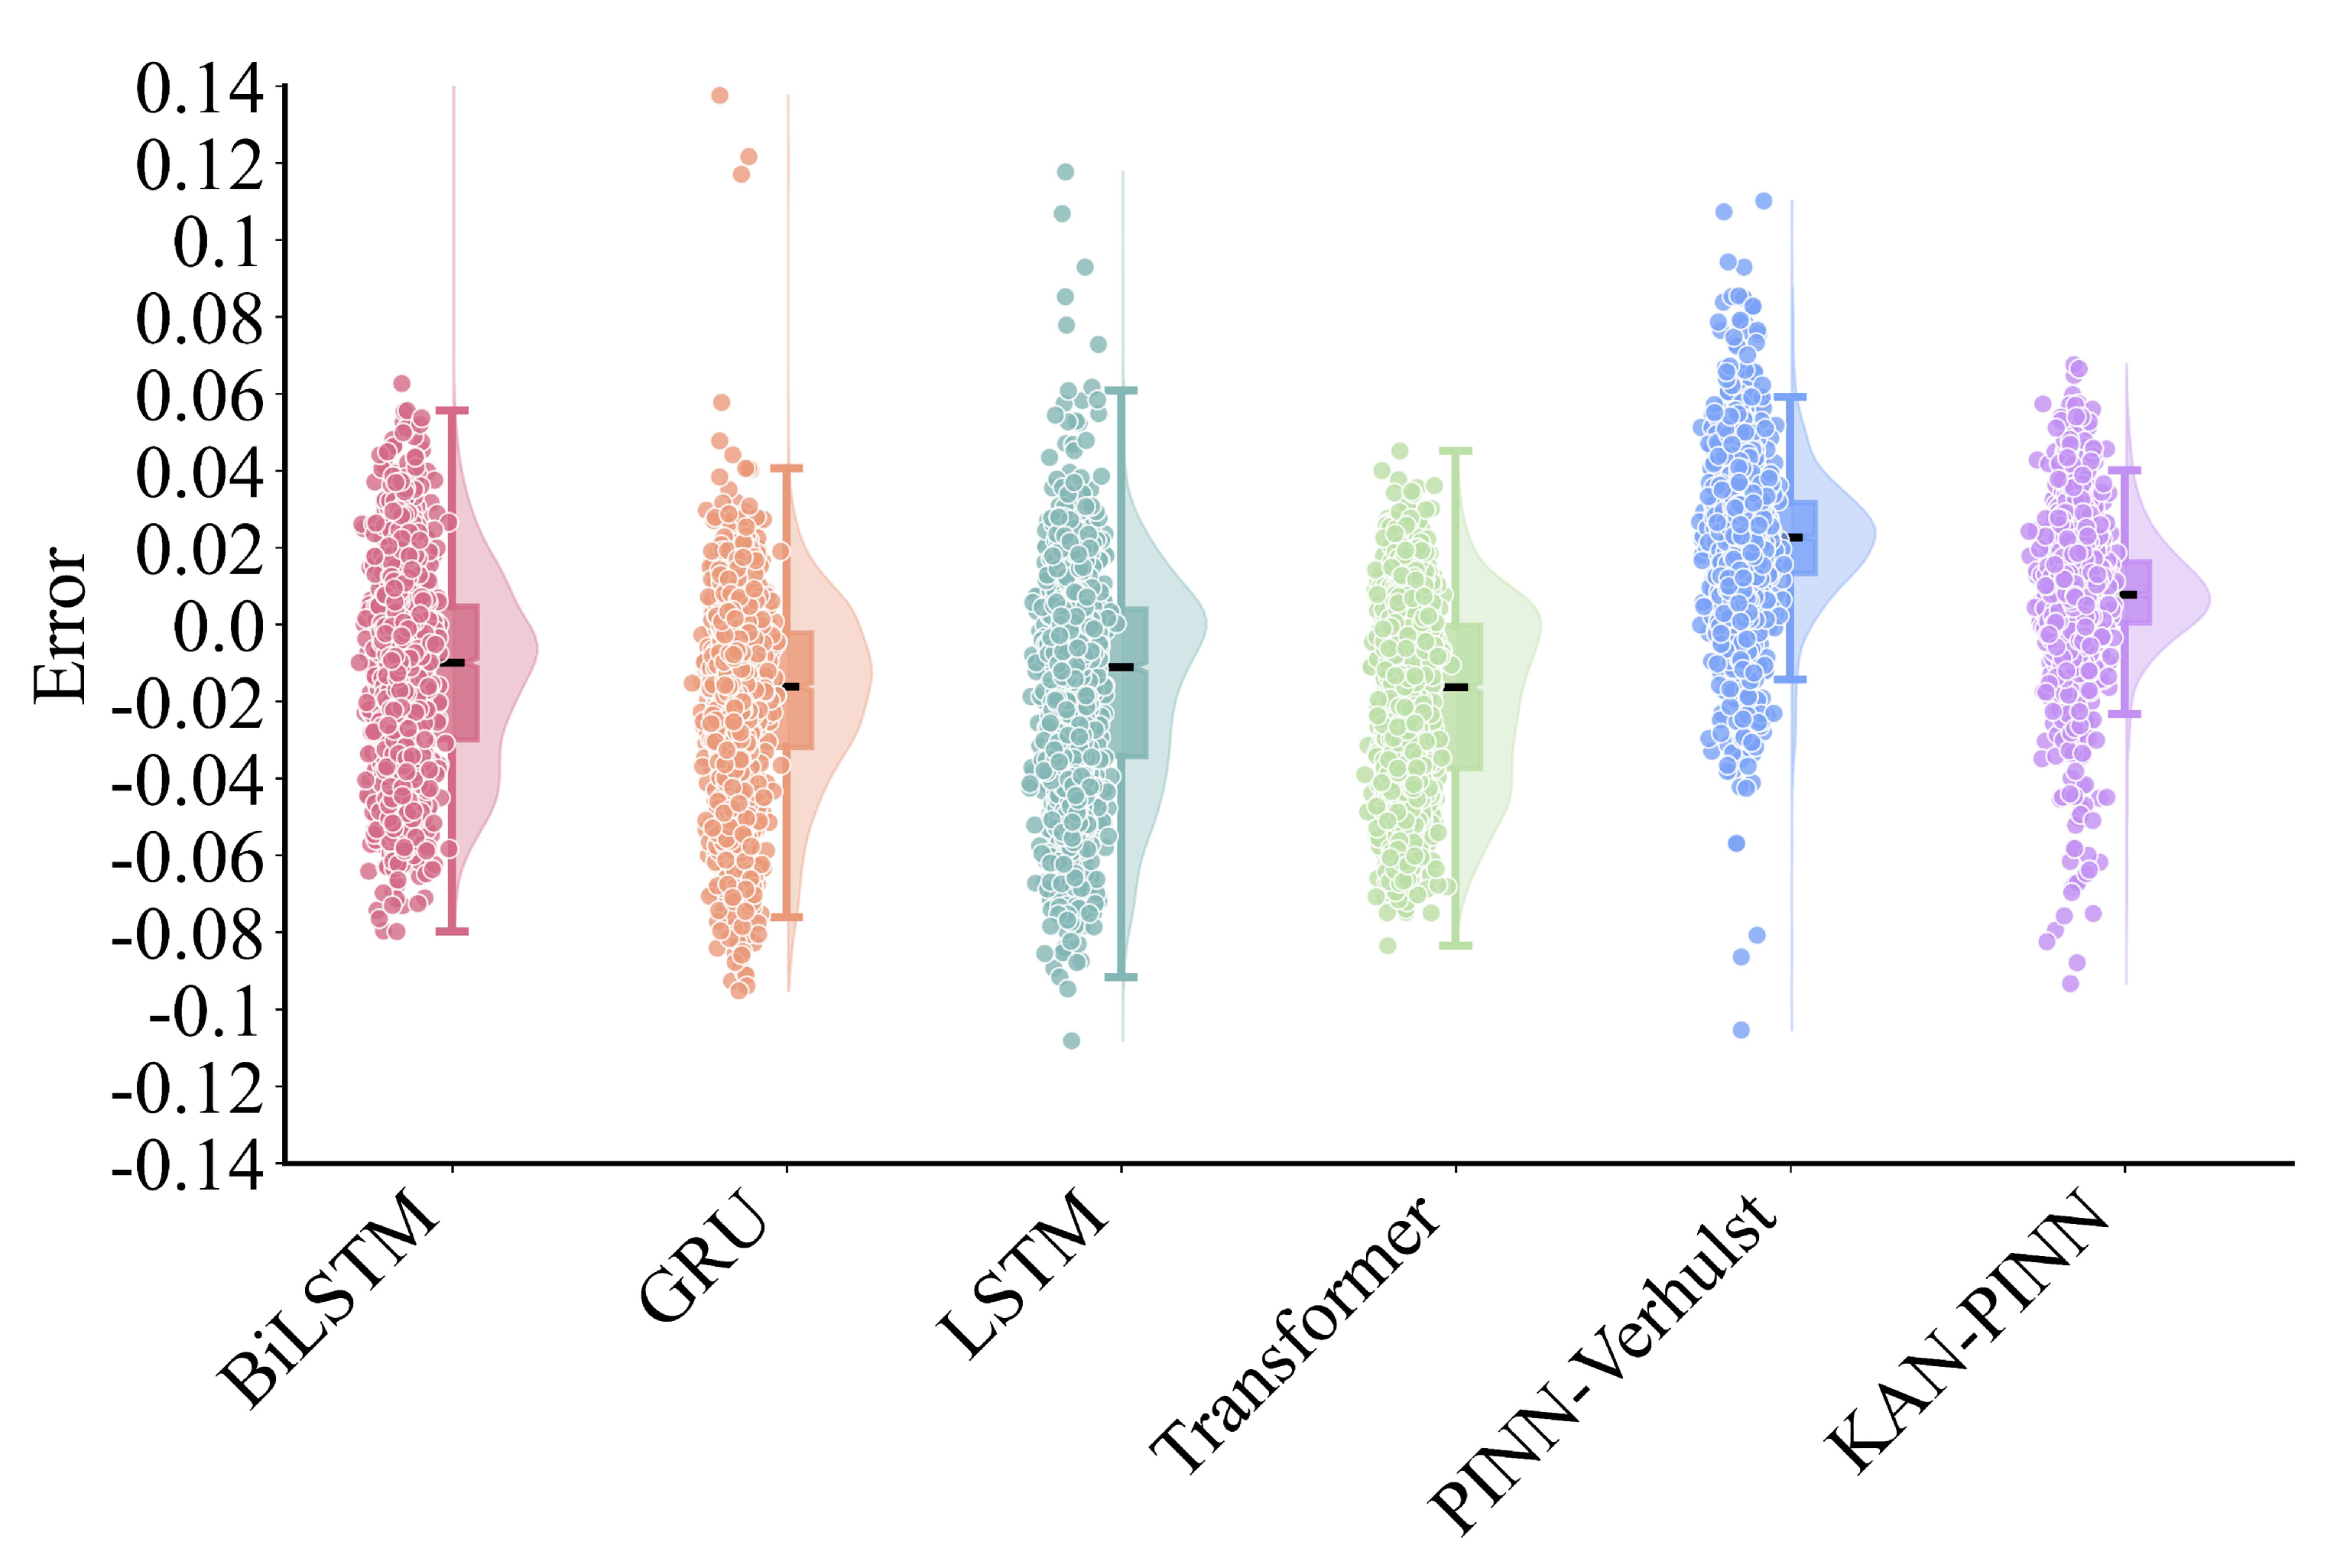
Table 7, in terms of overall prediction performance, the KAN-PINN model achieved the best results across all evaluation metrics, with an RMSPE of 0.300 and an MAE of 1.342%. Furthermore, it attained an R
2 value of 0.814, which is more than 25 percentage points higher than that of other models, highlighting its superior accuracy in degradation modeling. The PINN-Verhulst model ranked second in prediction accuracy, with an RMSPE of 0.448, an MAE of 2.153%, and an R
2 of 0.493, performing noticeably better than the other models due to its embedded physical constraints. However, the PINN-Verhulst model underperformed compared to the MLP-PINN model discussed in the previous subsection, as the latter removed the dropout layer that had limited its performance.
A comparative visualization of SOH estimation performance (
Figure 8) and error analysis (
Figure 9) provided deeper insights. It was observed that the estimation performance of the KAN-PINN model deteriorated significantly when the SOH values in the test set fell within the lower range around 0.8. This phenomenon can be attributed to two main factors: first, the limited number of samples in this interval in the original dataset before data augmentation increased the difficulty of model fitting; second, traditional models lack guidance from physical principles. In contrast, the proposed KAN-PINN model, which combines the enhanced local approximation capability of KAN with appropriate physical constraints, achieved more accurate estimates and smaller error fluctuations on the test set, demonstrating superior stability and robustness.
4.5. Experimental Results on the XJTU Dataset
To further validate the generalization ability of KAN-PINN across different battery chemistries or data acquisition protocols, we conducted experiments on an open-access lithium-ion battery dataset (hereinafter referred to as the XTJU dataset (Xi’an Jiaotong University, Xi’an, China)) generated by Wang, F. et al. [
22]. This dataset comprises 18650-type LiNi
0.5 Co
0.2 Mn
0.3 O
2 lithium-ion batteries with a rated capacity of 2000 mAh, an operating voltage range of 2.5 V (discharge cutoff voltage) to 4.2 V (charge cutoff voltage), and a nominal voltage of 3.6 V. We selected Batch 1 and Batch 2, which were obtained under fixed charge-discharge strategies but with different testing protocols, along with Batch 3 (involving complete charge-discharge cycles with variable discharge strategies) and Batch 4 (involving incomplete charge-discharge cycles with variable discharge strategies). The data preprocessing procedure was kept consistent with that applied to the TRI dataset, as described in
Section 2 of this paper. The dataset was partitioned into training, validation, and test sets in an 8:1:1 ratio, with the random seed fixed at 1234 (consistent with the TRI dataset processing). All other experimental parameters remained unchanged from those used in the TRI experiments.
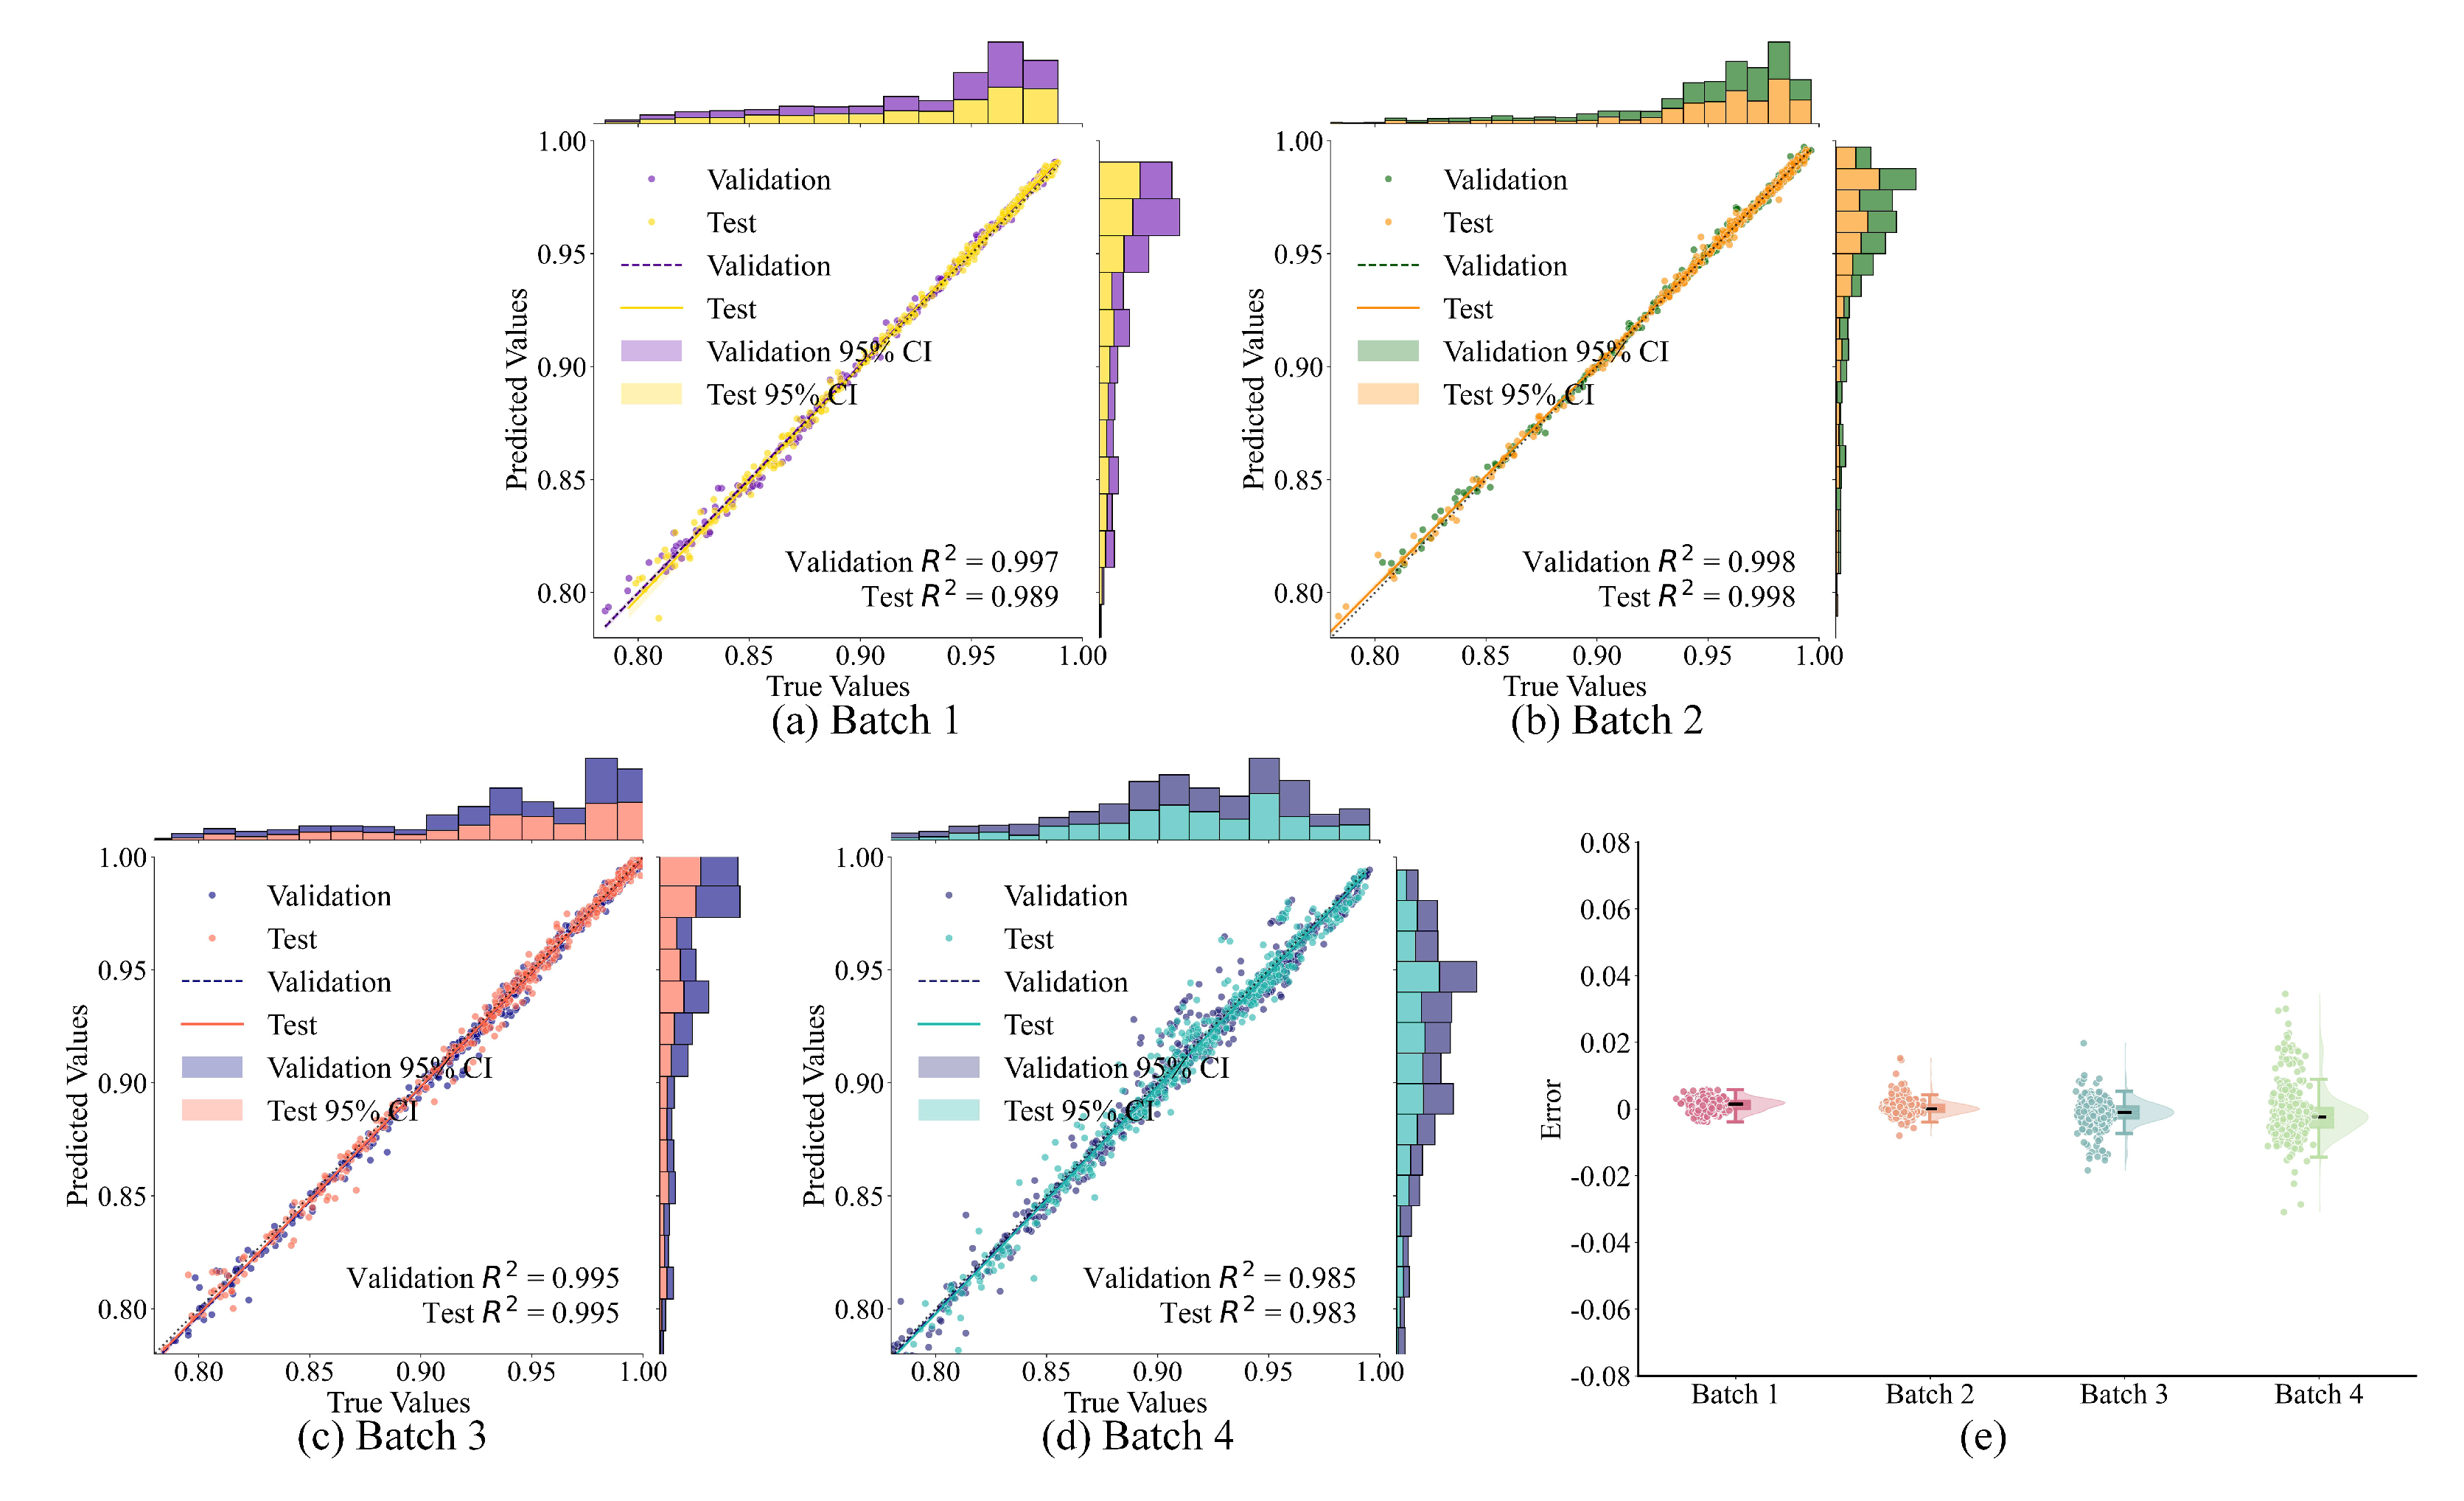
Experiments were conducted on the aforementioned four batches, and the results are summarized in
Table 8. The model demonstrated exceptionally high performance on Batch 1, 2, and 3. Specifically, on the test set, the lowest RMSPE of 0.074 was achieved in Batch 1, while the smallest MAE of 0.142% was observed in Batch 2, indicating only minimal deviations between the estimated and actual values. In contrast, due to the incomplete charge-discharge cycles adopted in Batch 4, the proposed KAN-PINN model exhibited higher error metrics on this batch. Nevertheless, the RMSPE and MAE remained as low as 0.152 and 0.520%, respectively, still demonstrating satisfactory performance.
Figure 10 presents the prediction results of the proposed KAN-PINN model on the XJTU dataset. The analysis indicates a gradual improvement in estimation accuracy across four batches. The data points are closely clustered around the reference line, with the error distribution concentrated near zero. These findings demonstrate that the model can accurately capture the SOH state across different degradation stages. The results confirm the strong generalization capability of the KAN-PINN model across diverse datasets.
4.6. Discussion
The experimental results demonstrate that the proposed KAN-PINN framework significantly outperforms both pure data-driven models (e.g., KAN, LSTM) and physics-informed baselines (e.g., MLP-PINN, PINN-Verhulst) in SOH estimation accuracy and robustness. The superior performance, evidenced by the lowest RMSPE and MAE on the TRI dataset, confirms that integrating KAN’s high-dimensional approximation capability with the Verhulst-based physical constraints effectively captures complex degradation dynamics while ensuring physical plausibility. The derived degradation parameters (k, , M) align well with electrochemical principles, enhancing model interpretability. Furthermore, the model’s strong generalization on the XJTU dataset under varying protocols underscores its adaptability. The ablation study validates that KAN enhances nonlinear representation, while physical regularization mitigates overfitting and stabilizes predictions.
5. Conclusions
This paper has introduced a novel KAN-PINN framework for lithium-ion battery SOH estimation, which represents a significant step towards reconciling the flexibility of data-driven methods with the rigor of physics-based models. The core innovation lies in the seamless integration of KANs, renowned for their superior high-dimensional function approximation capabilities, with the PINN paradigm, which embeds the fundamental laws of battery degradation. Notably, the Verhulst model is chosen for its parsimonious structure and effectiveness in capturing the essential nonlinear degradation trends, making it particularly suitable for integration within a PINN framework where computational efficiency and differentiability are crucial. While more complex models like the pseudo-two-dimensional (P2D) model offer detailed electrochemical insights, their high computational cost and parameter sensitivity limit their practicality for real-time SOH estimation under varying operational conditions. By replacing the standard MLP in PINNs with a KAN and incorporating the Verhulst model as a soft physical constraint, the framework achieves a remarkable balance. It delivers high-precision SOH predictions (evidenced by an RMSPE of 0.300 and MAE of 1.342% on the TRI dataset) while simultaneously identifying key, non-directly measurable degradation parameters, thereby significantly enhancing the model’s interpretability.
The proposed framework holds substantial promise for practical industrial applications. In the field of new energy vehicles and grid-scale energy storage, accurate and reliable SOH estimation is paramount for battery safety, lifetime prediction, and maintenance scheduling. The model’s robustness to varying operational conditions and its ability to provide physically consistent estimates reduce the risk of false alarms or missed failures, which are critical for operational safety. While this study validates the effectiveness of KAN-PINN, several promising directions warrant further investigation. Firstly, future work will explore the extension of this framework to multi-task learning, such as the simultaneous estimation of SOH, SOC, and remaining useful life (RUL), which would provide a more comprehensive health management solution for battery management systems (BMSs). Secondly, efforts will be directed towards developing lightweight and efficient versions of the model to enable its deployment on the resource-constrained hardware of embedded BMSs for real-time inference. Finally, investigating the framework’s applicability under more extreme and complex aging conditions, such as varying thermal environments and mixed fast-charging protocols, will be essential to enhance its practical robustness.
