Abstract
This study successfully monitored the formation of secondary minerals resulting from CO2–H2O–rock reactions under high-temperature, high-pressure conditions (approximately 250 °C and 6 MPa, respectively) in real time using a sensor based on the attenuated total reflection (ATR) detection principle. First, a verification experiment was conducted using a saturated calcium carbonate solution. This experiment quantitatively confirmed an increase in precipitation and a decrease in transmittance as the temperature increased from 25 °C to 250 °C. Next, CO2–H2O–rock reaction tests were conducted within a batch-type apparatus. Under neutral conditions (pH 7.3), the transmittance rapidly decreased to approximately 20% within five days of initiating the reaction. Combined with our previous results from separate batch-based rock reaction tests conducted under identical conditions, it was revealed that the rapid precipitation of secondary minerals, primarily smectite, was the dominant process. Conventional methods estimate precipitation amounts by analyzing rock surface morphology after reaction tests, which leaves the reaction mechanism unclear. The primary innovation of this study lies in directly capturing precipitation dynamics during the initial reaction stage, which could not be achieved using conventional post reaction analysis methods. By employing this monitoring technique to measure the precipitation rates and quantities of secondary minerals under various test conditions, this study is expected to make significant contributions to the understanding and controlling of precipitation phenomena and changes in formation permeability in CO2 geological storage and carbon-recycling geothermal power generation projects.
1. Introduction
In recent years, various technologies, including CCS (carbon dioxide capture and storage), have been introduced to achieve carbon neutrality. As part of this effort, the development of the “Carbon Recycling CO2 Geothermal Power Generation Technology” utilizing CO2 is also progressing [1,2,3]. This novel power generation method involves injecting supercritical CO2 into geothermal reservoirs and recovering the geothermally heated CO2 from production wells to drive turbines and generate electricity. Conventional geothermal power generation methods have faced challenges in regions with high temperatures and minimal heat transfer fluids. However, supercritical CO2 makes this technology applicable to such regions, expanding viable power generation areas. This advancement is based on the use of supercritical geothermal resources obtainable deep within the Earth’s crust, near the brittle–ductile transition zone. Supercritical water fluids reach temperatures (above 374 °C) and pressures (above 22.1 MPa) that exceed their critical point and possess high energy density. This makes it possible to use high-temperature geothermal resources that were difficult to harness with conventional water-based fluids [4]. Furthermore, under high-temperature, high-pressure conditions, CO2 exhibits greater mobility than water, making it an extremely efficient heat exchange medium. This allows for higher thermal energy extraction rates than conventional water-based systems and simultaneously enables CO2 storage and sequestration within the geology. This outcome has the potential to reduce atmospheric CO2 while generating electricity and contribute to the development of carbon-negative geothermal power plants [5,6]. Additionally, recent advances in drilling technologies and reservoir evaluation techniques enable geothermal utilization in regions where development was previously constrained by resource uncertainty. These technological innovations reduce the capital required for geothermal power projects and improve the energy conversion efficiency, making geothermal energy more economically and widely viable [7]. Additionally, some of the injected CO2 dissolves into groundwater, making it more acidic and promoting interactions with the surrounding rock. These likely leach cations, such as Ca2+ and Mg2+, which then combine with carbonate ions to form carbonate minerals. This process effectively mineralizes CO2. As mentioned earlier, exploring supercritical geothermal systems and utilizing CO2 as a working fluid is an innovative approach that overcomes the limitations of conventional hydrothermal geothermal power generation. This approach enables the use of high-temperature geothermal resources. This constitutes a significant step toward achieving climate change mitigation and a sustainable energy supply.
Laboratory studies on CO2–H2O–rock interactions conducted under various temperature and pressure conditions have reported the precipitation of secondary minerals such as kaolinite, smectite, and zeolite [8,9,10,11,12]. Gysi and Stefansson [13] predicted that at pH < 6.5, (Ca, Mg, Fe)–smectite and Fe-rich carbonate minerals would form, whereas at pH > 6.5, zeolite, (Ca, Mg, Fe)–smectite, and carbonate minerals would form. In the study, post reaction samples were collected for morphological observations and chemical analyses of precipitated minerals through SEM-EDS and related techniques. These conventional methods estimate precipitation amounts by analyzing rock surface morphology after reaction tests, which leaves the reaction mechanism unclear. The reaction conditions for each mineral are discussed theoretically based on the composition of the post-reaction solution. Alongside such fundamental research, diverse insights concerning CO2–H2O–rock interactions have been shared in recent years. Under high-pressure, high-temperature conditions, the reaction between CO2 and water produces carbonic acid. This effect becomes particularly pronounced at pressures exceeding 2.4 GPa and temperatures above 110 °C. This finding provides a new perspective on understanding fluid–rock interactions in subduction zones [14]. Furthermore, the immiscibility between CO2–H2O fluids has been confirmed in the shallow crust. Kaszuba et al. [15] reported that the coexistence of supercritical CO2 fluid and H2O-rich liquid phases influences the saturation and precipitation behavior of carbonates and silicas. Additionally, molecular dynamics simulations have analyzed CO2 dissolution in water and its interactions with quartz at the interface, improving the accuracy of predictions regarding interfacial tension and contact angles and deepening the understanding of capillary trapping in CO2 storage [16]. Moreover, in situ observations using micro-reaction systems have confirmed the formation of magnesium carbonate under high-pressure conditions, suggesting the possibility of stable geological sequestration [17]. Furthermore, since these previous studies analyzed secondary minerals after returning pressure and temperature to ambient conditions, the minerals could have formed or dissolved during this period. To better understand the formation and dissolution of secondary minerals, a combination of real-time monitoring techniques and advanced modeling must be used. These insights will deepen our understanding of CO2 subsurface sequestration processes and play a crucial role in determining optimal conditions for long-term stable storage through mineralization.
The precipitation of secondary minerals, such as clay and carbonate minerals, resulting from changes in water quality due to reactions with rock under high-temperature, high-pressure conditions, is expected to significantly impact the permeability of geothermal reservoirs. Zotzmann et al. [18] employed optical fiber sensors to observe crystal growth under high-temperature and high-pressure conditions. They monitored barite (BaSO4) precipitation using an attenuated total reflection (ATR) optical fiber sensor in high-concentration NaCl solutions at 25 °C and 150 °C. However, there are no existing reports on the precipitation of secondary minerals during the reaction between rock and CO2 dissolved water at high temperatures and pressures.
This study focuses on an optical fiber sensor that uses the ATR method for the real-time monitoring of mineral precipitation during rock–water interaction. This technology was developed to evaluate secondary mineral precipitation phenomena in real time under high-temperature and high-pressure conditions. This sensor can rapidly and easily detect inorganic salt precipitation and has been used to address scaling challenges in geothermal power plants and hot spring facilities by enabling the real-time monitoring of calcium carbonate and silica scale precipitation behavior. Additionally, the sensor has demonstrated the effectiveness of scale prevention conditions achieved through pH adjustment and chemical dosing [19,20,21].
The aim of this study is to monitor precipitation phenomena in rock–water interactions under high-temperature, high-pressure conditions in real time using optical fiber sensors. This will help us to identify the precipitating mineral species and determine the precipitation rates. Previous studies have demonstrated that, at temperatures up to 150 °C, the saturation index (SI) increases with rising calcium carbonate temperature and concentration, resulting in increased precipitation [22]. In this study, the experimental apparatus was modified to enable the monitoring of precipitation changes at higher temperatures (up to ~250 °C) and pressures exceeding the saturated vapor pressure of water (up to ~6 MPa) at depths exceeding 500 m in geothermal reservoirs. Two types of experiments were conducted. In Test A, calcium carbonate precipitation was monitored by reacting a supersaturated calcium carbonate mixture at a specified temperature under high-temperature, pressure conditions. In Test B, CO2–H2O–rock interactions were reproduced under high-temperature, and high-pressure conditions. The test conditions were determined based on the results of previously conducted batch tests using Teflon containers. These tests examined changes in water quality during the 15-day reaction period and identified precipitates via scanning electron microscopy (SEM) observation [23]. This previous study simulates the geochemical behavior of CO2 water reacting with rock, as well as the geochemical reaction processes involved. This test was conducted at 250 °C using Rishiri Island basalt to observe the precipitation of clay minerals. In the test, the entire vessel rotated once per minute (1 rpm). Since the apparatus in this study did not rotate, Test C was performed using a stationary batch-type Teflon vessel. This reaction test enabled a comparative analysis with prior research.
2. Materials and Methods
2.1. Reagents
Sodium bicarbonate (NaHCO3), calcium chloride (CaCl2), potassium chloride (KCl), potassium hydroxide (KOH), acetone, and ethanol were purchased from Fujifilm Wako Pure Chemical Corporation, Osaka, Japan (https://www.fujifilm.com/ffwk/en/).
2.2. Optical Fiber Sensor
The sensor used a step-index multimode optical fiber (FT200EMT, core diameter = 200 µm), purchased from Thorlabs, Inc. (Newton, NJ, USA: https://www.thorlabs.co.jp/careers/united-states). A 28-cm sensing section was fabricated in the central portion of the fiber by immersing the cladding in acetone to remove it and expose the core.
2.3. Rock Sample
The rock used was Rishiri Island basalt, which contains plagioclase, orthopyroxene, and olivine as phenocrysts, with glass present in the groundmass. The rock was first crushed into fist-sized pieces, and weathered portions were removed. Subsequently, it was crushed further using an iron mortar, and the resulting material was sieved (Tokyo Screen Co., Ltd., Tokyo, Japan, Test Sieve, JIS Z8801, https://www.tokyo-screen.com/) to obtain particles in the 0.14–1 mm range. The sample was immersed in distilled water and washed several times for 5 min using an ultrasonic cleaner (Azone, Tokyo, Japan, Ultrasonic Cleaner MCS-2: www.as-1.co.jp). Finally, it was subsequently dried and stored at room temperature.
2.4. Experimental Apparatus and Methods (Experiments A and B)
The high-temperature, high-pressure apparatus (up to 300 °C and 15 MPa) consisted of a gas injection line and a liquid delivery line, both made of SUS316, connected to a 10 mL high-temperature, high-pressure chamber made of Hastelloy (HC-276; Koatsu System Company Ltd., Saitama, Japan) (Figure 1). The optical fiber sensor could be inserted and secured inside the chamber using a PEEK tube and ferrule (Koatsu System Company Ltd., Saitama, Japan). One end of the sensor was connected to a spectrophotometer (MV-3000 series, JASCO Corp., Tokyo, Japan) and the other end to a white light source (Tungsten Halogen Light Sources, Ocean Insight, Tokyo, Japan). This setup enabled the real-time monitoring of the sensor’s transmittance, calculated as T (%) = (I/I0) × 100, where I0 is the light intensity propagating through the sensor before scale deposition, and I is the light intensity at any time point after deposition. Temperature and pressure were monitored throughout the experiment. The experimental solution could be introduced through two pipes on the chamber side, allowing both flow-through and batch experiments to be conducted.
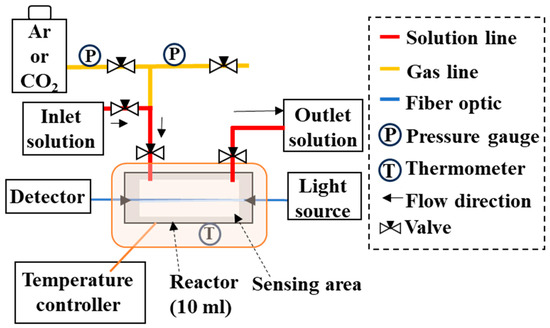
Figure 1.
Experimental apparatus used to reproduce reactions under high-temperature and high-pressure conditions. The sensor can be fixed horizontally to the floor of the high-temperature, high-pressure vessel (10 mL capacity, HC-276 material). Experimental solutions or gases can be injected or discharged through the two nozzles at the top.
For each run, the optical fiber sensor was placed inside the chamber such that the 28- centimeter sensing section was fully enclosed. The experimental solution was then introduced through the inlet and recovered through the outlet. The efflux from the outlet confirmed that the chamber was filled with solutions. Air in the solution was degassed by replacing the gas above the liquid surface with argon (Ar) from the gas line, preventing oxidative conditions during the reaction. The chamber was then pressurized to 6 MPa with Ar or CO2 gas, heated to a desired temperature between 25 °C and 250 °C, and the sensor response was monitored. In CO2–H2O–rock reaction experiments, basalt particles were placed inside the chamber to simulate the reactions.
2.5. Experimental Apparatus and Methods (Experiment C)
A high-temperature, high-pressure SUS316 stainless steel vessel with a nozzle-type inner tube (Sanai-Kagaku, Nagoya, Japan; https://www.sanai-kagaku.co.jp/index_english.html; accessed 24 September 2025) was used to simulate CO2–H2O–rock interactions. This vessel allowed for degassing and the injection of CO2 or Ar gas at arbitrary pressures. An electric furnace (rotating-reaction decomposition vessel, RDV-TM1; Sanai-Kagaku, Nagoya, Japan; https://www.sanai-kagaku.co.jp/rdv-tm_english.html; accessed 24 September 2025) was used to heat the reaction vessel. The vessel was kept stationary, without rotation, to simulate static reaction conditions as in Experiment B.
2.6. Experimental Conditions
The experimental conditions for Experiments A–C are summarized in Table 1. In Experiment A, the amount of precipitation relative to the CaCO3 SI was monitored in real time to observe precipitation rates and other parameters, because the SI varies with temperature. For Experiment A-1, a solution was prepared by mixing 5 mL of 10 mM NaHCO3 and 5 mL of CaCl2 to achieve calcium carbonate supersaturation at the experimental temperature. The SI was calculated using the geochemical code PHREEQC with the llnl.dat thermodynamic database [24,25].

Table 1.
Experimental conditions.
In Experiment B, the reaction between Rishiri Island basalt and CO2-saturated water, as well as the precipitation rate of secondary minerals formed by the reaction were monitored. Rock particles sized 0.14–1.0 mm were added to the chamber.
Experiment C was conducted separately using a Teflon batch-type reaction vessel with CO2 and water. Rishiri Island basalt was used for comparative analysis with Experiment B. Because the experimental solution volume in Experiment B was limited to 10 mL, making the analysis difficult, Experiment C was designed to supplement those data. Seven grams of basalt and 70 g of distilled water were placed in a Teflon container. After degassing, CO2 and Ar gases were sealed inside the container, which was then placed in a SUS protective vessel. The reaction was conducted at 150 °C in an electric furnace.
2.7. Analysis
The morphologies of the precipitates and the chemical composition of the sensor and rock surfaces before and after reactions in Experiments A and B were examined through SEM-EDS (JCM7000 + JED2300, JEOL, Tokyo, Japan; https://www.jeol.co.jp/; accessed 24 September 2025). Water samples from Experiments B and C were analyzed by ICP-AES (Optima 7300DV, PerkinElmer, Waltham, MA, USA) to measure the concentrations of Na+, K+, Mg2+, Ca2+, Cl−, and SO42−.
3. Results and Discussion
3.1. Carbonate Mineral Precipitation Reaction Monitoring (Experiment A)
Changes in the sensor response were monitored as the SI of calcium carbonate increased within a saturated solution (Table 1). Carbonate occurs in polymorphic forms such as calcite and aragonite. As temperature rises, its solubility decreases, leading to greater calcium carbonate precipitation at higher temperatures [26,27]. Figure 2a shows the SI of calcite and aragonite as a function of temperature. SI is defined as SI = LOG(Q/K) where Q is the activity product and K is the solubility constant. SI > 0 indicates supersaturation and a tendency toward precipitation; SI = 0 indicates equilibrium; and SI < 0 indicates undersaturation and a tendency toward dissolution. As expected, SI values for both calcite and aragonite increased with rising temperature. Under the present test conditions, SI at 25 °C and at 250 °C. Figure 2b shows the results of introducing a solution containing equal volumes of 10 mM NaHCO3− and CaCl2 into the experimental chamber. To simulate geothermal reservoir conditions, pressure was maintained at 6 MPa (equivalent to ~500 m depth) with Ar gas, while the temperature was gradually increased from 25 °C to 100 °C, 150 °C, 200 °C, and 250 °C (Experiment A).
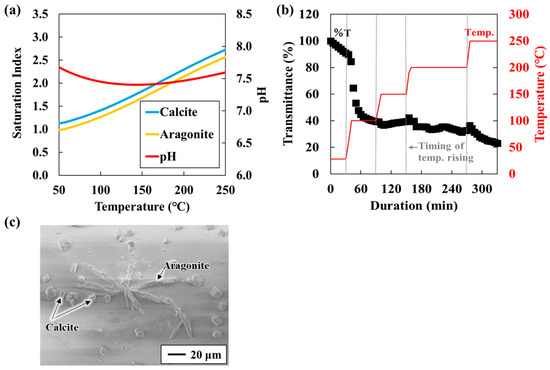
Figure 2.
(a) CaCO3 and solution pH in a mixed solution of NaHCO3 and CaCl2 (Experiment A-1; 10 mL, 5 mM Ca2+); (b) Sensor response to temperature increases in a mixed solution of NaHCO3 and CaCl2 (Experiment A-1; 10 mL, 5 mM Ca2+); and (c) Sensor surface image obtained through SEM-EDS analysis after the experiment (Experiment A-1).
Transmittance changed abruptly when the temperature was raised and stabilized once the temperature reached a new constant value. Okazaki et al. [20] reported that transmittance decreases as the coverage of calcium carbonate on the sensor surface increases, confirming that transmittance depends on surface coverage. Accordingly, the observed decrease in transmittance with increasing temperature indicates enhanced calcium carbonate precipitation. Notably, in this study, transmittance decreased to ~50% at 100 °C. Above 150 °C, the transmittance decrease with increasing temperature was minimal. This slight change is consistent with previous findings that when SI is sufficiently high, further increases have a negligible effect on the precipitation rate [28]. Similar behavior was confirmed in our earlier atmospheric-pressure study, which evaluated calcium carbonate precipitation rates under different SI conditions between 25 °C and 95 °C. The initial decline in transmittance during the first 30 min after reaction initiation (Figure 3) suggests that the response rate becomes constant as SI approaches a value of two [22]. Furthermore, the SEM-EDS analysis of the sensor surface after the experiment revealed a nearly complete coverage with parallelepiped-shaped calcite and needle-shaped aragonite crystals (Figure 2c). As the coverage of carbonate minerals on the sensor surface increases, transmittance decreases. Thus, the period of rapid transmittance decline corresponds to a phase of rapid carbonate precipitation and increased surface coverage. Based on these results, the experimental setup and the unclad optical fiber sensor developed in this study are effective for experiments conducted under high-temperature and high-pressure conditions (approximately 250 °C and 6 MPa) and for the real-time monitoring of inorganic salt precipitation reactions.
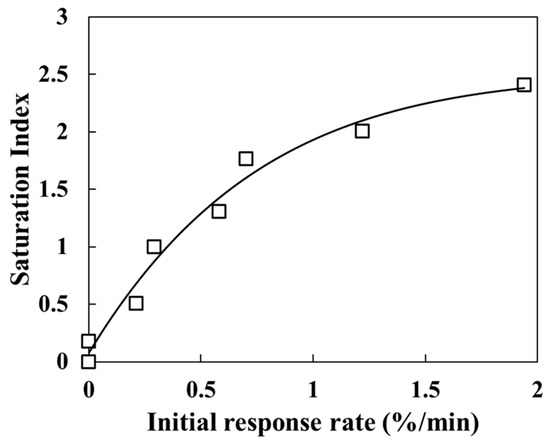
Figure 3.
Calcite saturation index (SI) and sensor transmittance change in the solution for Test A-1.
3.2. CO2–H2O–Rock Reaction Monitoring (Experiment B)
In this experiment, secondary mineral precipitation from the CO2–H2O–rock reaction was continuously monitored at a constant temperature of 150 °C. The experimental conditions are summarized in Table 1, and the post-reaction solution compositions are presented in Table 2. For comparison, Table 2 also presents data from separate indoor rock reaction tests conducted in a batch-type Teflon vessel (Experiments C-1 and C-2) under conditions similar to those of Experiment B-1. In Experiment B-1, CO2 gas served as the CO2 source, whereas in Experiments B-2 and B-3, NaHCO3 solution was used.
Table 2.
Chemical composition of the post-reaction solution.
In Experiment B-1, transmittance gradually decreased from the beginning of the reaction, reaching 60% by day 15. A significant decrease observed on day 10 could not be fully explained, though the instability of the light source may have contributed. In contrast, Experiments B-2 and B-3 exhibited a rapid transmittance decrease to ~20% within the first five days (Figure 4). The marked difference in transmittance behavior between CO2 sources is attributed to pH differences. PHREEQC calculations indicate that the pH in Experiment B-1 (CO2 gas) was ~4.5 at 150 °C, whereas it was 7.3 in Experiments B-2 and B-3 (NaHCO3 solution). Under acidic conditions, dissolution rates of plagioclase, olivine, and basaltic glass are faster than under neutral conditions [29,30]. Conversely, secondary minerals such as carbonate minerals, Mg(OH)2, and CaSO4 tend to dissolve in acidic solutions, but under neutral conditions their supersaturation increases, leading to precipitation [31]. Moreover, at low pH levels, SiO2 precipitation is suppressed while the dissolution rate of Mg-bearing silica minerals such as smectite increases [32,33]. These factors explain why Experiment B-1 showed less secondary mineral precipitation and a slower transmittance decrease than Experiments B-2 and B-3. The transmittance decrease in Experiment B-2 was slightly faster than in B-3. This was likely due to differences in the initial salt concentration. Marieni et al. [34] reported that CO2–H2O–rock interactions between seawater and basalt accelerated with increasing salt concentrations. In this study, the initial solution for Experiment B-2 contained 100 mM KCl, whereas that of Experiment B-3 contained no KCl.
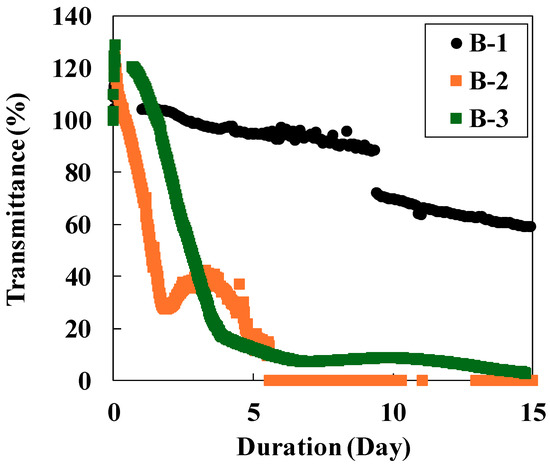
Figure 4.
Sensor response to the CO2–H2O–rock reaction (black plot: Experiment B-1; orange plot: Experiment B-2; green plot: Experiment B-3).
The post-reaction solution from Experiment B-1 showed higher Na+ and K+ concentrations than that from Experiment C under the same conditions (Table 2). This is attributed to the longer reaction time of 25 days compared to the batch test. However, the SiO2 concentration in Experiment B-1 was lower than that in the 15-day batch reaction, suggesting that the dissolved SiO2 subsequently precipitated, with some adhering to the sensor surface.
Differences in sensor responses were clearly reflected in the SEM-EDS observations of the sensor surfaces after the experiments (Figure 5). Fragments of secondary minerals were observed on the surface of the B-1 sensor, whereas film-like secondary minerals adhered to the surfaces of the B-2 and B-3 sensors. Based on SEM-EDS images and the EDS analytical results (Figure 5 and Figure 6), these film-like deposits are smectite. The SI calculations for secondary minerals under each test condition (Table 3) support this interpretation, exhibiting supersaturation for smectite minerals such as montmorillonite and nontronite. Furthermore, it was visually apparent that greater reductions in the sensor transmittance corresponded to larger amounts of secondary mineral precipitation. The rock surfaces after the experiments were also coated with secondary minerals similar to those found on the sensor surfaces (Figure 6). In Experiment B-1, smectite was confirmed on the sensor surface [35,36], consistent with findings from other CO2–H2O–rock reaction studies (Figure 6b). These results demonstrate that the experimental setup successfully reproduced CO2–H2O–rock interactions comparable to those reported in previous studies and that real-time monitoring using the optical fiber sensor was effective.
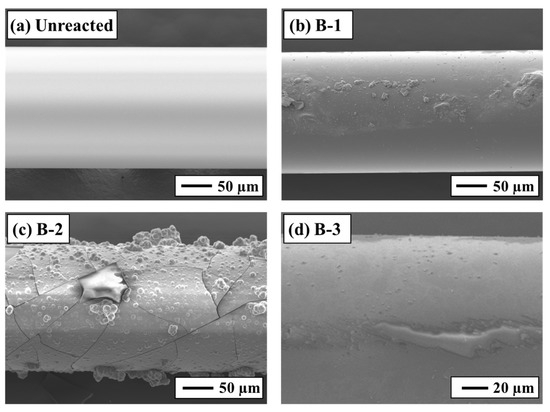
Figure 5.
SEM-EDS analysis of the sensor surface: (a) unreacted, (b) Experiment B-1, (c) Experiment B-2, and (d) Experiment B-3.
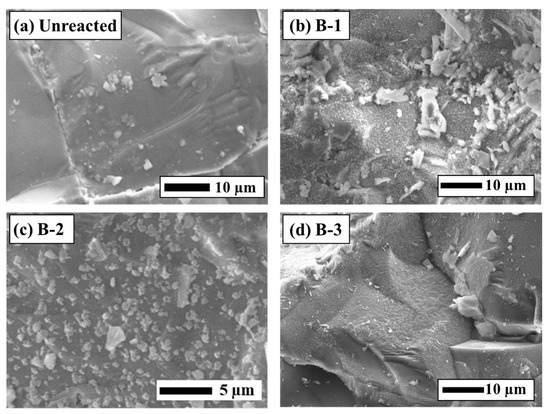
Figure 6.
SEM-EDS analysis of the rock surface before and after the experiments (a) Unreacted, (b) Experiment B-1, (c) Experiment B-2, (d) Experiment B-3.
Table 3.
Saturation index (SI) for secondary minerals in post-reaction solutions.
Results from earlier batch reaction experiments conducted in Teflon containers revealed that, during the initial reaction phase lasting about one day, chemical components rapidly leached from the rock into CO2-saturated water, leading to the supersaturation of secondary minerals [23]. In this study, sensor transmittance changes were used to monitor precipitation levels during the reaction, confirming that the amount of precipitate also increased rapidly within a few days. This rapid transmittance change during the early reaction phase was also observed in tests using supersaturated barite solutions [18]. These results further reveal that secondary mineral components such as silica and clay precipitate more rapidly as the SI increases. These findings are consistent with batch reaction results, in which components such as Na+ and K+ increased significantly within a few days before stabilizing around day five, whereas components such as Mg2+ and Al3+ decreased with longer reaction times.
4. Conclusions
This study evaluated secondary mineral precipitation in CO2–H2O–rock interactions using an ATR-based optical fiber sensor. An apparatus was developed to reproduce these reactions under high-temperature, high-pressure conditions while enabling real-time monitoring. Using this system, calcium carbonate formation was successfully measured from room temperature to 250 °C at 6 MPa for the first time. The results confirmed that sensor transmittance decreases corresponded to increased calcium carbonate precipitation with rising temperature. The reproduction of CO2–H2O–rock interactions under high-temperature, high-pressure conditions further demonstrated that secondary mineral precipitation rates vary with pH level and salt concentration, consistent with previous studies. These findings confirm that the real-time monitoring of CO2–H2O–rock interactions is feasible and provide valuable insights into precipitation mechanisms. The results can be applied to the advancement of carbon recycling and CO2 geothermal power generation technologies under development in Japan, which utilize CO2 fluid as a heat transfer medium across a wide range of temperatures.
Author Contributions
Methodology, S.S.; Investigation, S.S., A.H., H.K., A.U. and A.T.; writing—original draft, S.S.; data curation, S.S., A.H., H.K., A.U. and A.T.; writing—review and editing, S.S., A.H., H.K., A.U. and A.T.; supervision. H.K. and A.T.; Project administration, A.T. All authors have read and agreed to the published version of the manuscript.
Funding
This research received no external funding.
Data Availability Statement
The original contributions presented in this study are included in the article. Further inquiries can be directed to the corresponding author.
Acknowledgments
We thank the members of the Faculty of Science at the University of Toyama for their cooperation and discussions. This research is one of the outcomes of a research and development project subcontracted by Taisei Corporation for JOGMEC’s “Carbon Cycle CO2 Geothermal Power Generation Technology” project. We thank all JOGMEC and Taisei Corporation members who contributed to this research through cooperation, advice, and valuable feedback. We sincerely thank to the editor and three anonymous reviewers for their critical, helpful, and constructive comments to improve the manuscript.
Conflicts of Interest
Author Amane Terai was employed by the Japan Organization for Metals and Energy Security (JOGMEC). The remaining authors declare that the research was conducted in the absence of any commercial or financial relationships that could be construed as a potential conflict of interest.
References
- Agency for Natural Resources and Energy Japan’s Newest “Strategic Energy Plan” Toward Carbon Neutrality by 2050. Available online: https://www.enecho.meti.go.jp/en/category/special/article/detail_168.html (accessed on 15 May 2025).
- Ministry of the Environment Government of Japan Plan for Global Warming Countermeasures. Available online: https://www.env.go.jp/content/000249336.pdf (accessed on 15 May 2025).
- Abe, A.; Tamura, K.; Hirase, K.; Terai, A.; Tosha, T. Numerical Study on Thermal Performance of Enhanced Geothermal System with CO2 Using Multistage Hydraulic Stimulation. Sustain. Energy Res. 2025, 12, 40. [Google Scholar] [CrossRef]
- Reinsch, T.; Dobson, P.; Asanuma, H.; Huenges, E.; Poletto, F.; Sanjuan, B. Utilizing Supercritical Geothermal Systems: A Review of Past Ventures and Ongoing Research Activities. Geotherm. Energy 2017, 5, 16. [Google Scholar] [CrossRef]
- Randolph, J.B.; Saar, M.O. Coupling Carbon Dioxide Sequestration with Geothermal Energy Capture in Naturally Permeable, Porous Geologic Formations: Implications for CO2 Sequestration. Energy Procedia 2011, 4, 2206–2213. [Google Scholar] [CrossRef]
- Cong, L.; Lu, S.; Jiang, P.; Zheng, T.; Yu, Z.; Xiaoshu, L. CO2 Sequestration and Soil Improvement in Enhanced Rock Weathering: A Review from an Experimental Perspective. Greenh. Gases Sci. Technol. 2024, 14, 1122–1138. [Google Scholar] [CrossRef]
- Younger, P.L. Geothermal Energy: Delivering on the Global Potentia. Energies 2015, 8, 11737–11754. [Google Scholar] [CrossRef]
- Gislason, S.R.; Wolff-Boenisch, D.; Stefansson, A.; Oelkers, E.H.; Gunnlaugsson, E.; Sigurdardottir, H.; Sigfusson, B.; Broecker, W.S.; Matter, J.M.; Stute, M.; et al. Mineral Sequestration of Carbon Dioxide in Basalt: A Pre-Injection Overview of the CarbFix Project. Int. J. Greenh. Gas Control 2010, 4, 537–545. [Google Scholar] [CrossRef]
- Gysi, A.P.; Stefánsson, A. CO2-Water-Basalt Interaction. Low Temperature Experiments and Implications for CO2 Sequestration into Basalts. Geochim. Cosmochim. Acta 2012, 81, 129–152. [Google Scholar] [CrossRef]
- Schaef, H.T.; McGrail, B.P.; Owen, A.T. Basalt Reactivity Variability with Reservoir Depth in Supercritical CO2 and Aqueous Phases. Energy Procedia 2011, 4, 4977–4984. [Google Scholar] [CrossRef]
- Aradóttir, E.S.P.; Sonnenthal, E.L.; Björnsson, G.; Jónsson, H. Multidimensional Reactive Transport Modeling of CO2 Mineral Sequestration in Basalts at the Hellisheidi Geothermal Field, Iceland. Int. J. Greenh. Gas Control 2012, 9, 24–40. [Google Scholar] [CrossRef]
- Alfredsson, H.A.; Hardarson, B.S.; Franzson, H.; Gislason, S.R. CO2 Sequestration in Basaltic Rock at the Hellisheidi Site in SW Iceland: Stratigraphy and Chemical Composition of the Rocks at the Injection Site. Miner. Mag. 2008, 72, 1–5. [Google Scholar] [CrossRef]
- Gysi, A.P.; Stefánsson, A. CO2-Water-Basalt Interaction. Numerical Simulation of Low Temperature CO2 Sequestration into Basalts. Geochim. Cosmochim. Acta 2011, 75, 4728–4751. [Google Scholar] [CrossRef]
- Wang, H.; Zeuschner, J.; Eremets, M.; Troyan, I.; Willams, J. Stable Solid and Aqueous H2CO3 from CO2 and H2O at High Pressure and High Temperature. Sci. Rep. 2016, 6, 19902. [Google Scholar] [CrossRef]
- Kaszuba, J.; Yardley, B.; Andreani, M. Experimental Perspectives of Mineral Dissolution and Precipitation Due to Carbon Dioxide-Water-Rock Interactions. Rev. Miner. Geochem. 2013, 77, 153–188. [Google Scholar] [CrossRef]
- Javanbakht, G.; Sedghi, M.; Welch, W.; Goual, L. Molecular Dynamics Simulations of CO2/Water/Quartz Interfacial Properties: Impact of CO2 Dissolution in Water. Langmuir 2015, 31, 5812–5819. [Google Scholar] [CrossRef] [PubMed]
- Wolf, G.H.; Chizmeshya, A.V.G.; Diefenbacher, J.; McKelvy, M.J. In Situ Observation of CO2 Sequestration Reactions Using a Novel Microreaction System. Environ. Sci. Technol. 2004, 38, 932–936. [Google Scholar] [CrossRef] [PubMed]
- Zotzmann, J.; Hastreiter, N.; Mayanna, S.; Reinsch, T.; Regenspurg, S. A Fibre-Optical Method for Monitoring Barite Precipitation at High Pressure/High Temperature Conditions. Appl. Geochem. 2021, 127, 104906. [Google Scholar] [CrossRef]
- Okazaki, T.; Kuramitz, H.; Watanabe, T.; Ueda, A. Scale Sensor: Rapid Monitoring of Scale Deposition and Inhibition Using Fiber Optics in a Geothermal System and Comparison with Other Monitoring Devices. Geothermics 2021, 93, 102069. [Google Scholar] [CrossRef]
- Okazaki, T.; Imai, K.; Tan, S.Y.; Yong, Y.T.; Rahman, F.A.; Hata, N.; Taguchi, S.; Ueda, A.; Kuramitz, H. Fundamental Study on the Development of Fiber Optic Sensor for Real-Time Sensing of CaCO3 Scale Formation in Geothermal. Anal. Sci. 2015, 31, 177–183. [Google Scholar] [CrossRef]
- Satake, S.; Hosoki, A.; Suka, A.; Hoshino, Y.; Yang, H.; Ueda, A.; Kuramitz, H.; Terai, A. Scale Evaluation in Geothermal Fluids by a Batch-Type Method Using Fiber Optic Scale Sensor. Geothermics 2025, 131, 103387. [Google Scholar] [CrossRef]
- Satake, S.; Hosoki, A.; Okazaki, T.; Ueda, A.; Kuramitz, H.; Terai, A. Real-Time Monitoring of CaCO3 Precipitation Using Fiber Optics Scale Sensor Under High Temperature and Pressure Conditions. In Proceedings of the 2024 IEEE SENSORS, Kobe, Japan, 20–23 October 2024. [Google Scholar]
- Satake, S.; Yang, H.; Mori, K.; Hoshino, Y.; Ueda, A.; Kuramitz, H.; Masuoka, K.; Enomoto, H.; Terai, A. CO2 Geothermal Power Generation: Laboratory Experiment on the Interaction Between Carbonated Water and Rishiri Island Basalt in the Vicinity of Injection Wells. Energies 2025, 18, 2251. [Google Scholar] [CrossRef]
- Parkhurst, D.L.; Appelo, C.A.J. User’s Guide to PHREEQC (Ver2)-A Computer Program for Speciation, Batch-Reaction, One- Dimensional Transport, and Inverse Geochemical Calculations. Water Resour. Investig. Rep. 1999, 99, 312. [Google Scholar] [CrossRef]
- Xu, T.; Sonnenthal, E.; Spycher, N.; Pruess, K. TOUGHREACT—A Simulation Program for Non-Isothermal Multiphase Reactive Geochemical Transport in Variably Saturated Geologic Media: Applications to Geothermal Injectivity and CO2 Geological Sequestration. Comput. Geosci. 2006, 32, 145–165. [Google Scholar] [CrossRef]
- Oelkers, E.H.; Addassi, M. A Comprehensive and Consistent Mineral Dissolution Rate Database: Part III: Non-Silicate Minerals Including Carbonate, Sulfate, Phosphate, Halide, and Oxy-Hydroxide Minerals. Chem. Geol. 2024, 673, 122528. [Google Scholar] [CrossRef]
- Busenburg, E.; Plummer, L.N. A Comparative Study of the Dissolution Kinetics of Calcite and Aragonite. Stud. Diagenesis 1986, 1578, 139–168. [Google Scholar]
- Aagaard, P.; Helgeson, H.C. Thermodynamic and Kinetic Constraints on Reaction Rates among Minerals and Aqueous Solutions. I. Theoretical Considerations. Am. J. Sci. 1982, 282, 237–285. [Google Scholar] [CrossRef]
- Gislason, S.R.; Broecker, W.S.; Gunnlaugsson, E.; Snæbjörnsdóttir, S.; Mesfin, K.G.; Alfredsson, H.A.; Aradottir, E.S.; Sigfusson, B.; Gunnarsson, I.; Stute, M.; et al. Rapid Solubility and Mineral Storage of CO2 in Basalt. Energy Procedia 2014, 63, 4561–4574. [Google Scholar] [CrossRef]
- Bray, A.W.; Oelkers, E.H.; Bonneville, S.; Wolff-Boenisch, D.; Potts, N.J.; Fones, G.; Benning, L.G. The Effect of PH, Grain Size, and Organic Ligands on Biotite Weathering Rates. Geochim. Cosmochim. Acta 2015, 164, 127–145. [Google Scholar] [CrossRef]
- Karo, N.; Itov, G.; Mayraz, O.; Vogt, C. Carbon Dioxide Sequestration through Mineralization from Seawater: The Interplay of Alkalinity, PH, and Dissolved Inorganic Carbon. Chem. Eng. J. 2024, 500, 156380. [Google Scholar] [CrossRef]
- Heřmanská, M.; Voigt, M.J.; Marieni, C.; Declercq, J.; Oelkers, E.H. A Comprehensive and Consistent Mineral Dissolution Rate Database: Part II: Secondary Silicate Minerals. Chem. Geol. 2023, 636, 121632. [Google Scholar] [CrossRef]
- Gallup, D.L. Brine PH Modification Scale Control Technology. 2. A Review. GRC Trans. 1996, 20, 749–755. [Google Scholar]
- Marieni, C.; Matter, J.M.; Teagle, D.A.H. Experimental Study on Mafic Rock Dissolution Rates within CO2-Seawater-Rock Systems. Geochim. Cosmochim. Acta 2020, 272, 259–275. [Google Scholar] [CrossRef]
- Wolff-Boenisch, D.; Galeczka, I.M. Flow-through Reactor Experiments on Basalt-(Sea)Water-CO2 Reactions at 90 °C and Neutral PH. What Happens to the Basalt Pore Space under Post-Injection Conditions? Int. J. Greenh. Gas Control 2018, 68, 176–190. [Google Scholar] [CrossRef]
- Voigt, M.; Marieni, C.; Baldermann, A.; Galeczka, I.M.; Wolff-Boenisch, D.; Oelkers, E.H.; Gislason, S.R. An Experimental Study of Basalt–Seawater–CO2 Interaction at 130 °C. Geochim. Cosmochim. Acta 2021, 308, 21–41. [Google Scholar] [CrossRef]


Disclaimer/Publisher’s Note: The statements, opinions and data contained in all publications are solely those of the individual author(s) and contributor(s) and not of MDPI and/or the editor(s). MDPI and/or the editor(s) disclaim responsibility for any injury to people or property resulting from any ideas, methods, instructions or products referred to in the content. |
© 2025 by the authors. Licensee MDPI, Basel, Switzerland. This article is an open access article distributed under the terms and conditions of the Creative Commons Attribution (CC BY) license (https://creativecommons.org/licenses/by/4.0/).