Article

Optimized Defense Resource Allocation for Coupled Power-Transportation Networks Considering Information Security

1
State Grid Jiangsu Electric Power Co., Ltd., Nanjing 210000, China
2
School of Electrical Engineering, Southeast University, Nanjing 210000, China
*
Author to whom correspondence should be addressed.
Energies 2025, 18(21), 5855; https://doi.org/10.3390/en18215855
Submission received: 27 September 2025 / Revised: 19 October 2025 / Accepted: 23 October 2025 / Published: 6 November 2025

Abstract

Electric vehicle charging stations (EVCSs) are critical interfaces between urban mobility and distribution grids and are increasingly exposed to false data that can mislead operations and degrade voltage quality. This study proposes a defense-planning framework that models how cyber manipulation propagates to physical impacts in a coupled transport–power system. The interaction is modeled as a tri-level defender–attacker–operator problem in which a defender hardens a subset of charging stations, an attacker forges measurements and demand, and an operator redispatches resources to keep the system secure. We solve this problem with a method that embeds corrective operation into the evaluation and uses improved implicit enumeration (IIE) with pruning to identify a small set of high-value stations to protect with far fewer trials than an exhaustive search. On a benchmark feeder coupled to a road network, protecting a few traffic-critical stations restores compliance with voltage limits under tested attack levels while requiring roughly an order of magnitude fewer evaluations than complete enumeration. Sensitivity analysis shows that the loss of reactive power from PV inverters (PV VARs) harms voltage profiles more than an equivalent reduction in distributed storage, indicating that maintaining local reactive capability reduces the number of stations that must be hardened to meet a given voltage target. These results guide utilities and city planners to prioritize protection at traffic-critical EVCSs and co-plan local Volt/VAR capability, achieving code-compliant voltage quality under adversarial conditions with markedly lower planning effort.

1. Introduction

EVCSs sit at the interface of transportation and distribution networks; they coordinate and control the load scheduling and energy management via real-time telemetry and control, but this information and communication technology reliance also makes them prime targets for cyberattacks [1,2,3,4,5].
Prior work examines multiple attack vectors against EV charging infrastructures. Refs. [6,7,8] analyze security protocols for authentication, privacy, and billing between EVs and charging stations; Ref. [9] compares defenses against denial-of-service attacks; and Refs. [10,11,12,13,14] develop deep reinforcement learning methods for detecting false-data-injection attacks (FDIAs) on EVCS. Beyond data theft, attacks can manipulate charging and discharging behavior and thereby affect grid operations [15]. For example, Refs. [16,17] show that rapid switching at charging stations can induce inter-area low-frequency oscillations, potentially precipitating generator trips and cascading failures. Ref. [18] demonstrates botnet-driven load-altering attacks that aggregate megawatt-level charging demand, while Ref. [19] shows that phishing via text messages can concentrate charging and cause a supply–demand imbalance. Ref. [20] reports market manipulation by falsifying demand forecasts; Ref. [21] presents a comprehensive analysis of FDIA impacts on distribution system stability; Ref. [22] proposes a real-time, data-driven active-defense framework for false-data mitigation in power cyber-physical systems. For broader context and terminology, see recent surveys of cyberattacks and defenses in EV ecosystems [23] and system-theoretic views of cyber-physical attacks in smart grids [24].
However, much of this literature remains attack-centric: it stresses disruptive effects yet often omits the operator’s endogenous corrective dispatch when quantifying physical consequences, which can overstate risk. Conversely, when planning or coupling studies, uncoordinated distributions of EV charging loads and traffic flows in coupled transport–power systems [25] often model siting/sizing or transport–power interactions without an explicit security layer, offering limited guidance on where to invest scarce protection resources. Relying solely on post-attack corrective actions is therefore insufficient; proactive defense resource allocation prior to attacks is critical for secure and stable operation.
Defense-oriented formulations have emerged in recent years; for example, Bayesian adaptive risk-assessment frameworks for allocating cyber defenses under resource constraints [26]; tri-level defense–attack–defense (DAD) models for substations [27,28,29]; cyber-physical attack–defense games with hierarchical defense policies [30,31]; and bi-level cyber-defense optimization with alternative equilibrium models [32]. Yet these strands pay limited attention to distribution networks with large-scale EV integration and to EVCS-centric transport–power coupling, where traffic-driven charging demand co-evolves with grid physics, including intercity highway charging-network planning under time-expanded user equilibriums [33].
Recent studies further clarify the landscape and help position our contribution. Refs. [34,35] formulate a tri-level DAD model for grid-side resource allocation; while methodologically related, they targets bulk-system generation/protection and do not preserve EVCS-driven transport–power coupling or distribution-level voltage-quality tracking. Ref. [36] focuses on frequency stability under FDIAs and proposes defense policies; our scope is steady-state voltage quality under EVCS-centric threats, with frequency-oriented extensions left for future work. Ref. [37] provides broader context by systematizing charger-side threats, defense mechanisms, and available datasets for EV charging systems.
In addition, Ref. [38] addresses protection-layer coordination against relay-setting manipulation but does not explicitly include EVCS-driven coupling or voltage-quality metrics; Ref. [39] studies resilience via line hardening and communication routing under renewable/communication constraints, without allocating defenses for EVCS-centric FDIAs or linking outcomes to voltage quality; Ref. [40] analyzes mobility-platform vulnerabilities with city-scale data and is attack/impact-centric rather than defense-allocation oriented; Ref. [41] models EV-side false data that bias demand/market signals in distribution systems, typically without an endogenous corrective-dispatch layer or defense-planning stage; and Ref. [42] probes attacks on reinforcement-learning-based charging coordination and proposes a countermeasure, but does not provide a joint defense–attack–correction (DAC) optimization with transport–power coupling or distribution-level voltage-quality tracking.
We develop an operation-aware, defense-oriented framework for EVCS-centric FDIAs that keep transport–power coupling explicit, unifies defense, attack, and corrective operation, and offers a like-for-like baseline against complete enumeration under identical settings, achieving the same solution quality with roughly an order of magnitude fewer evaluations of candidate hardening sets.
The present study contributes the following key innovations:
(1)
We formulated a tri-level DAC model as a Stackelberg game, casting cybersecurity planning in coupled transport–power networks as multi-agent sequential decision-making.
(2)
We designed a hybrid KKT-reduced solution framework that combines KKT optimality conditions with IIE to tackle the computational challenges of tri-level optimization.
(3)
We adopted three evaluation metrics—maximum voltage deviation (MVD), root-mean-square (RMS) voltage deviation, and voltage qualification rate (VQR)—to quantify the synergy between defense allocation and corrective operation, with effectiveness validated in simulation studies.

2. A Tri-Level Defense–Attack–Correction Optimization Formulation in a Stackelberg Framework

This paper adopts a Stackelberg game framework to characterize the sequential decision-making of the defender, the attacker, and the system operator (scheduling center), as illustrated in Figure 1. The hallmark of this framework is its sequential structure and information asymmetry: the defender acts as the leader, anticipating the attacker’s best response, while the attacker plays the follower.
As the Stackelberg leader, the defender strategically allocates scarce protection resources to harden critical nodes, such as EV charging stations, so that EV charging behavior cannot be manipulated by adversaries. These resources include software-based protection and financial budgets, among others.
As the follower, the attacker selects targets and devises attack strategies subject to its own resource constraints, which may include technical expertise, network access rights, and financial capital.
When an FDIA occurs, the system operator performs corrective dispatch based on the current operating state, adjusting PV and DESS outputs, among other controls, to stabilize bus voltages and ensure secure system operation.

3. Formulation

3.1. Objective

The decision problems of the defender, the attacker, and the scheduling center have the same objective function, and the objective function of the optimal allocation model of distribution network defense resources for charging information security can be expressed as follows:
m i n d m a x a m i n w i B V i V r e f 2 ,
where d , a , and w denote the decision variables of the defender, the attacker, and the scheduling center in turn, with the node voltage offset as the optimization objective, V i denotes the voltage square of grid node i , and V r e f is the node reference voltage.

3.2. Constraints

The limited network protection resources used by the defender to exert can be expressed as follows:
k K ζ k K ζ ,
where constraint (2) is the defense resource budget constraint. ζk is a 0–1 variable indicating whether charging station k is protected or not, when ζk = 1, then the charging station is protected, and K ζ represents the defense resource budget.
The optimization model for mid-level attack can be specified as follows:
k K ψ k K ψ ,
a k = ψ k ( 1 ξ k ) ,
P ~ p , w , k E V = P p , w , k E V + Δ P k E V a k ,   p , w
k K Δ P k E V = 0 ,
P m a x p i l e P ~ p , w , k E V P m a x p i l e ,
P ~ k E V = w W p p w f p , w P ~ p , w , k E V ,
where constraint (3) is the attack resource budget constraint, ψ k is a 0–1 variable indicating whether charging station k is attacked or not, when ψ k = 1 then the charging station is attacked; constraint (4) represents the interaction between the defender and the attacker, a k denotes the security status of the charging station at node k , where a k = 1 indicates an insecure station and a k = 0 indicates a secure station; and P ~ p , w , k E V denotes the charging/discharging power of the EVs on path p for origin–destination (O-D) pair w at station k under attack. A negative value indicates discharging to the grid via vehicle-to-grid (V2G), whereas a positive value indicates charging. The parameter P m a x p i l e is the charging maximum power maximum charging power of a single charger. P ~ k E V denotes the aggregate power at charging station k . The path flow f p , w for O-D pair w is computed by the user-equilibrium traffic assignment (UE-TAP) model.
The lower-level scheduling center optimization model can be specified as follows:
P i + P i G + P i S u b + P i P V = P i I n + P ~ i E V + P i E S , i B ,
Q i + Q i S u b + Q i P V = P i I n + P ~ i E V + P i E S tan ( θ i ) , i B ,
P i = j i Ω L i n e P j i i h Ω L i n e P i h ,
Q i = j i Ω L i n e Q j i i h Ω L i n e Q i h ,
P i j , m a x P i j P i j , m a x , i j L ,
Q i j , m a x Q i j Q i j , m a x , i j L ,
V j V i + 2 R i j P i j + X i j Q i j = 0 , i j L ,
V r e f = 1 ,
where constraints (8) and (9) denote the node active–reactive power balance and P i I n denotes the base load of node i . P i E S denotes the power of DESS (charging if P i E S > 0 , discharging otherwise); θ i is the power-factor angle; and P i and Q i are the active and reactive injected power at node i , respectively. Constraints (11)–(14) denote the power-flow constraints, and P i j and Q i j are the active and reactive power flows on line i j ; P i j , m a x and Q i j , m a x are the maximum active and reactive power limits of line i j ; R i j and X i j are the resistance and reactance of line i j ; P i s u b and Q i s u b are the active and reactive power transferred from the upstream grid to the distribution grid through the transformer; P i P V and Q i P V are the active and reactive power generated by the photovoltaic (PV); and P i , t G is the power output of distributed generators in the distribution grid. Constraints (15) and (16) enforce the nodal voltage constraints. V i is the voltage magnitude at node i and V r e f is the reference voltage.
P g , m i n G P g G P g , m a x G , g G ,
0 P s P V P s , m a x P V , s S ,
Q s , m a x P V Q s P V Q s , m a x P V , s S ,
0 P u s u b P u , m a x s u b , u U ,
0 Q u s u b Q u , m a x s u b ,   u U ,
P e , d m a x E S P e E S c h P e , c m a x E S , e E ,
P e , d m a x E S = m i n ( E e , 0 E S E e , m i n E S Δ t , P e , m a x E S ) , e E ,
P e , c m a x E S = m i n E e , m a x E S E e , 0 E S Δ t , P e , m a x E S , e E ,
where constraint (17) enforces the upper and lower bounds on microgenerator output; G denotes the set of microgenerator buses; and P g , m a x G and P g , m i n G denote the upper and lower bounds for microgenerator g . Constraints (18) and (19) enforce the upper and lower bound on PV active and reactive outputs; S denotes the set of PV installation buses; and P s , m a x P V and Q s , m a x P V denote maximum PV active and reactive power outputs. U denotes the transformer node, and constraints (20) and (21) denote the power-transfer constraints with the upstream grid through the transformer; P u , m a x s u b and Q u , m a x s u b denote the maximum active and reactive power transferred from the upstream grid; E denotes the set of DESS installation buses; constraints (22)–(24) specify the DESS operating constraints; and P e , d m a x E S and P e , c m a x E S denote the maximum discharging and charging power of the DESS, which depend on the storage capacity and rated power.
In summary, the optimal allocation model of distribution-network defense resources for EV-charging information security can be expressed as follows:
m i n d m a x a m i n w i B V i V r e f 2 s . t . ( 3 ) , ( 5 ) ( 34 )

4. Model Solution Method

4.1. Construction of the Bi-Level Optimization Model

To solve the proposed tri-level defense–attack–correction problem involving the defender, attacker, and system operator (scheduling center), we adopt an implicit enumeration approach. The problem is first reformulated as a bi-level mixed-integer program (MIP) between the attacker and defender. Because the lowest-tier operator’s optimization is convex, its KKT optimality conditions are used to equivalently replace the operator subproblem, embedding corrective dispatch into the attacker level and yielding a single inner optimization. The resulting bi-level MIP can thus be represented as follows:
m a x ψ k , Δ P k E V m i n P i G , P i S u b , P i P V , P i E S η
s . t .   η = i B V i 1 2 a k = ψ k ( 1 ξ ^ k ) s . t . ( 7 ) ( 34 )
where ξ ^ k is the defense strategy derived from the upper-level optimization problem.
Using the KKT conditions, the middle-level and lower-level optimization models are transformed into a single-level optimization model for the solution. The equivalent inner decision problem can be expressed as follows:
m a x a , w i B V i 1 2
In addition to the attacker’s constraints, the equivalent inner decision problem must include the KKT conditions of the lower-level scheduling center’s minimization problem. The KKT conditions include the gradient conditions, complementary slackness, and dual feasibility.
The gradient conditions are as follows:
L P e E S = λ e ν e t a n ( θ e ) α e P e s + β e P e s = 0 , e E L P g G = λ g α g G + β g G = 0 , g G L P s P V = λ s α s P p v + β s P p v = 0 , s S L Q s P V = ν s α s Q p v + β s Q p v = 0 , s S L P u s u b = λ u α u P s u b + β u P s u b = 0 , u U L Q u s u b = ν u α u Q s u b + β u Q s u b = 0 , u U L P i j = λ j λ i + 2 μ i j R i j α i j P l i n e + β i j P l i n e = 0 , i j L L Q i j = ν j ν j + 2 μ i j X i j α i j Q l i n e + β i j Q l i n e = 0 , i j L L V i = 2 V i 2 ( i , j ) L μ i j + ( k , j ) L μ k , i = 0 , i 0
The complementary slackness conditions are as follows:
α g G P g , m i n G P g G = 0 ,     β g G P g G P g , m a x G = 0 α i j P l i n e P i j , m a x P i j = 0 ,     β i j P l i n e P i j P i j , m a x = 0 α i j Q l i n e Q i j , m a x Q i j = 0 ,     β i j Q l i n e Q i j Q i j , m a x = 0 α s P p v 0 P s P V = 0 ,     β s P p v P s P V P s , m a x P V = 0 α s Q p v Q s , m a x P V Q s P V = 0 ,     β s Q p v Q s P V Q s , m a x P V = 0 α e P e s P e , d m a x E S P e E S = 0 ,     β e P e s P e E S P e , c m a x E S = 0 α P s u b 0 P s u b = 0 ,     β P s u b P s u b P s u b m a x = 0 α Q s u b 0 Q s u b = 0 ,     β Q s u b Q s u b Q s u b m a x = 0
The dual feasibility conditions are as follows:
α i V , β i V , α g G , β g G , α i j P l i n e , β i j P l i n e , α i j Q l i n e , β i j Q l i n e , α s P p v , β s P p v , α s Q p v , β s Q p v , α φ P e s , β φ P e s , α P s u b , β P s u b , α Q s u b , β Q s u b 0
Among them, λ i , ν i , and μ i j are the Lagrange multipliers corresponding to the equality constraint. α g G , β g G , α i j P l i n e , β i j P l i n e , α i j Q l i n e , β i j Q l i n e , α s P p v , β s P p v , α s Q p v , β s Q p v , α φ P e s , β φ P e s , α P s u b , β P s u b , α Q s u b , a n d   β Q s u b   denote the Lagrangian multipliers corresponding to the inequality constraints.
The defense–attack–operation process is sequential and information-asymmetric. The defender commits a protection d before an attack; the attacker observes d and chooses an FDIA a subject to a budget; the scheduling center then reacts optimally via a corrective dispatch w that determines the voltage-quality objective (e.g., node-voltage offsets V i V r e f ). This timing corresponds to a Stackelberg game with the defender as the leader, the attacker as follower, and the operator as a terminal optimizer. Writing the operator’s problem as a value function
Φ d , a = min w { C w ; d , a : G w ; d , a 0 }
keeps the physical linkage from cyber decisions ( d ,   a ) to distribution-level voltage outcomes ( V i , V r e f ) explicit. Relative to a bi-level robust form m i n d m a x a   f ( d ,   a ) that treats the operator implicitly, the Stackelberg structure mitigates potential risk overestimation by recognizing the operator’s endogenous redispatch, w . Compared with stochastic programming, which models exogenous randomness via probability distributions, the Stackelberg game captures a strategic attacker best-responding to d . We assume a conservative (attacker-favorable) selection among multiple follower optima. The convexity of the operator’s problem enables the KKT-based reduction used next.

4.2. Solution Method Based on the Improved Implicit Enumeration Algorithm

The multi-level optimization in Equation (25) has a hierarchical, nonlinear structure that is expensive to solve directly. Column-and-Constraint Generation (C&CG) is a common baseline because it can decompose complex constraints and typically uses modest memory; however, its convergence hinges on well-designed generation rules. Poorly chosen columns and constraints can lead to slow or stalled convergence, and for nonconvex structures, the method may be trapped in local optima in high-dimensional settings. Motivated by these limitations and by the structure of our problem, we adopt a KKT-reduced inner evaluator combined with an IIE outer search for the defense decision.
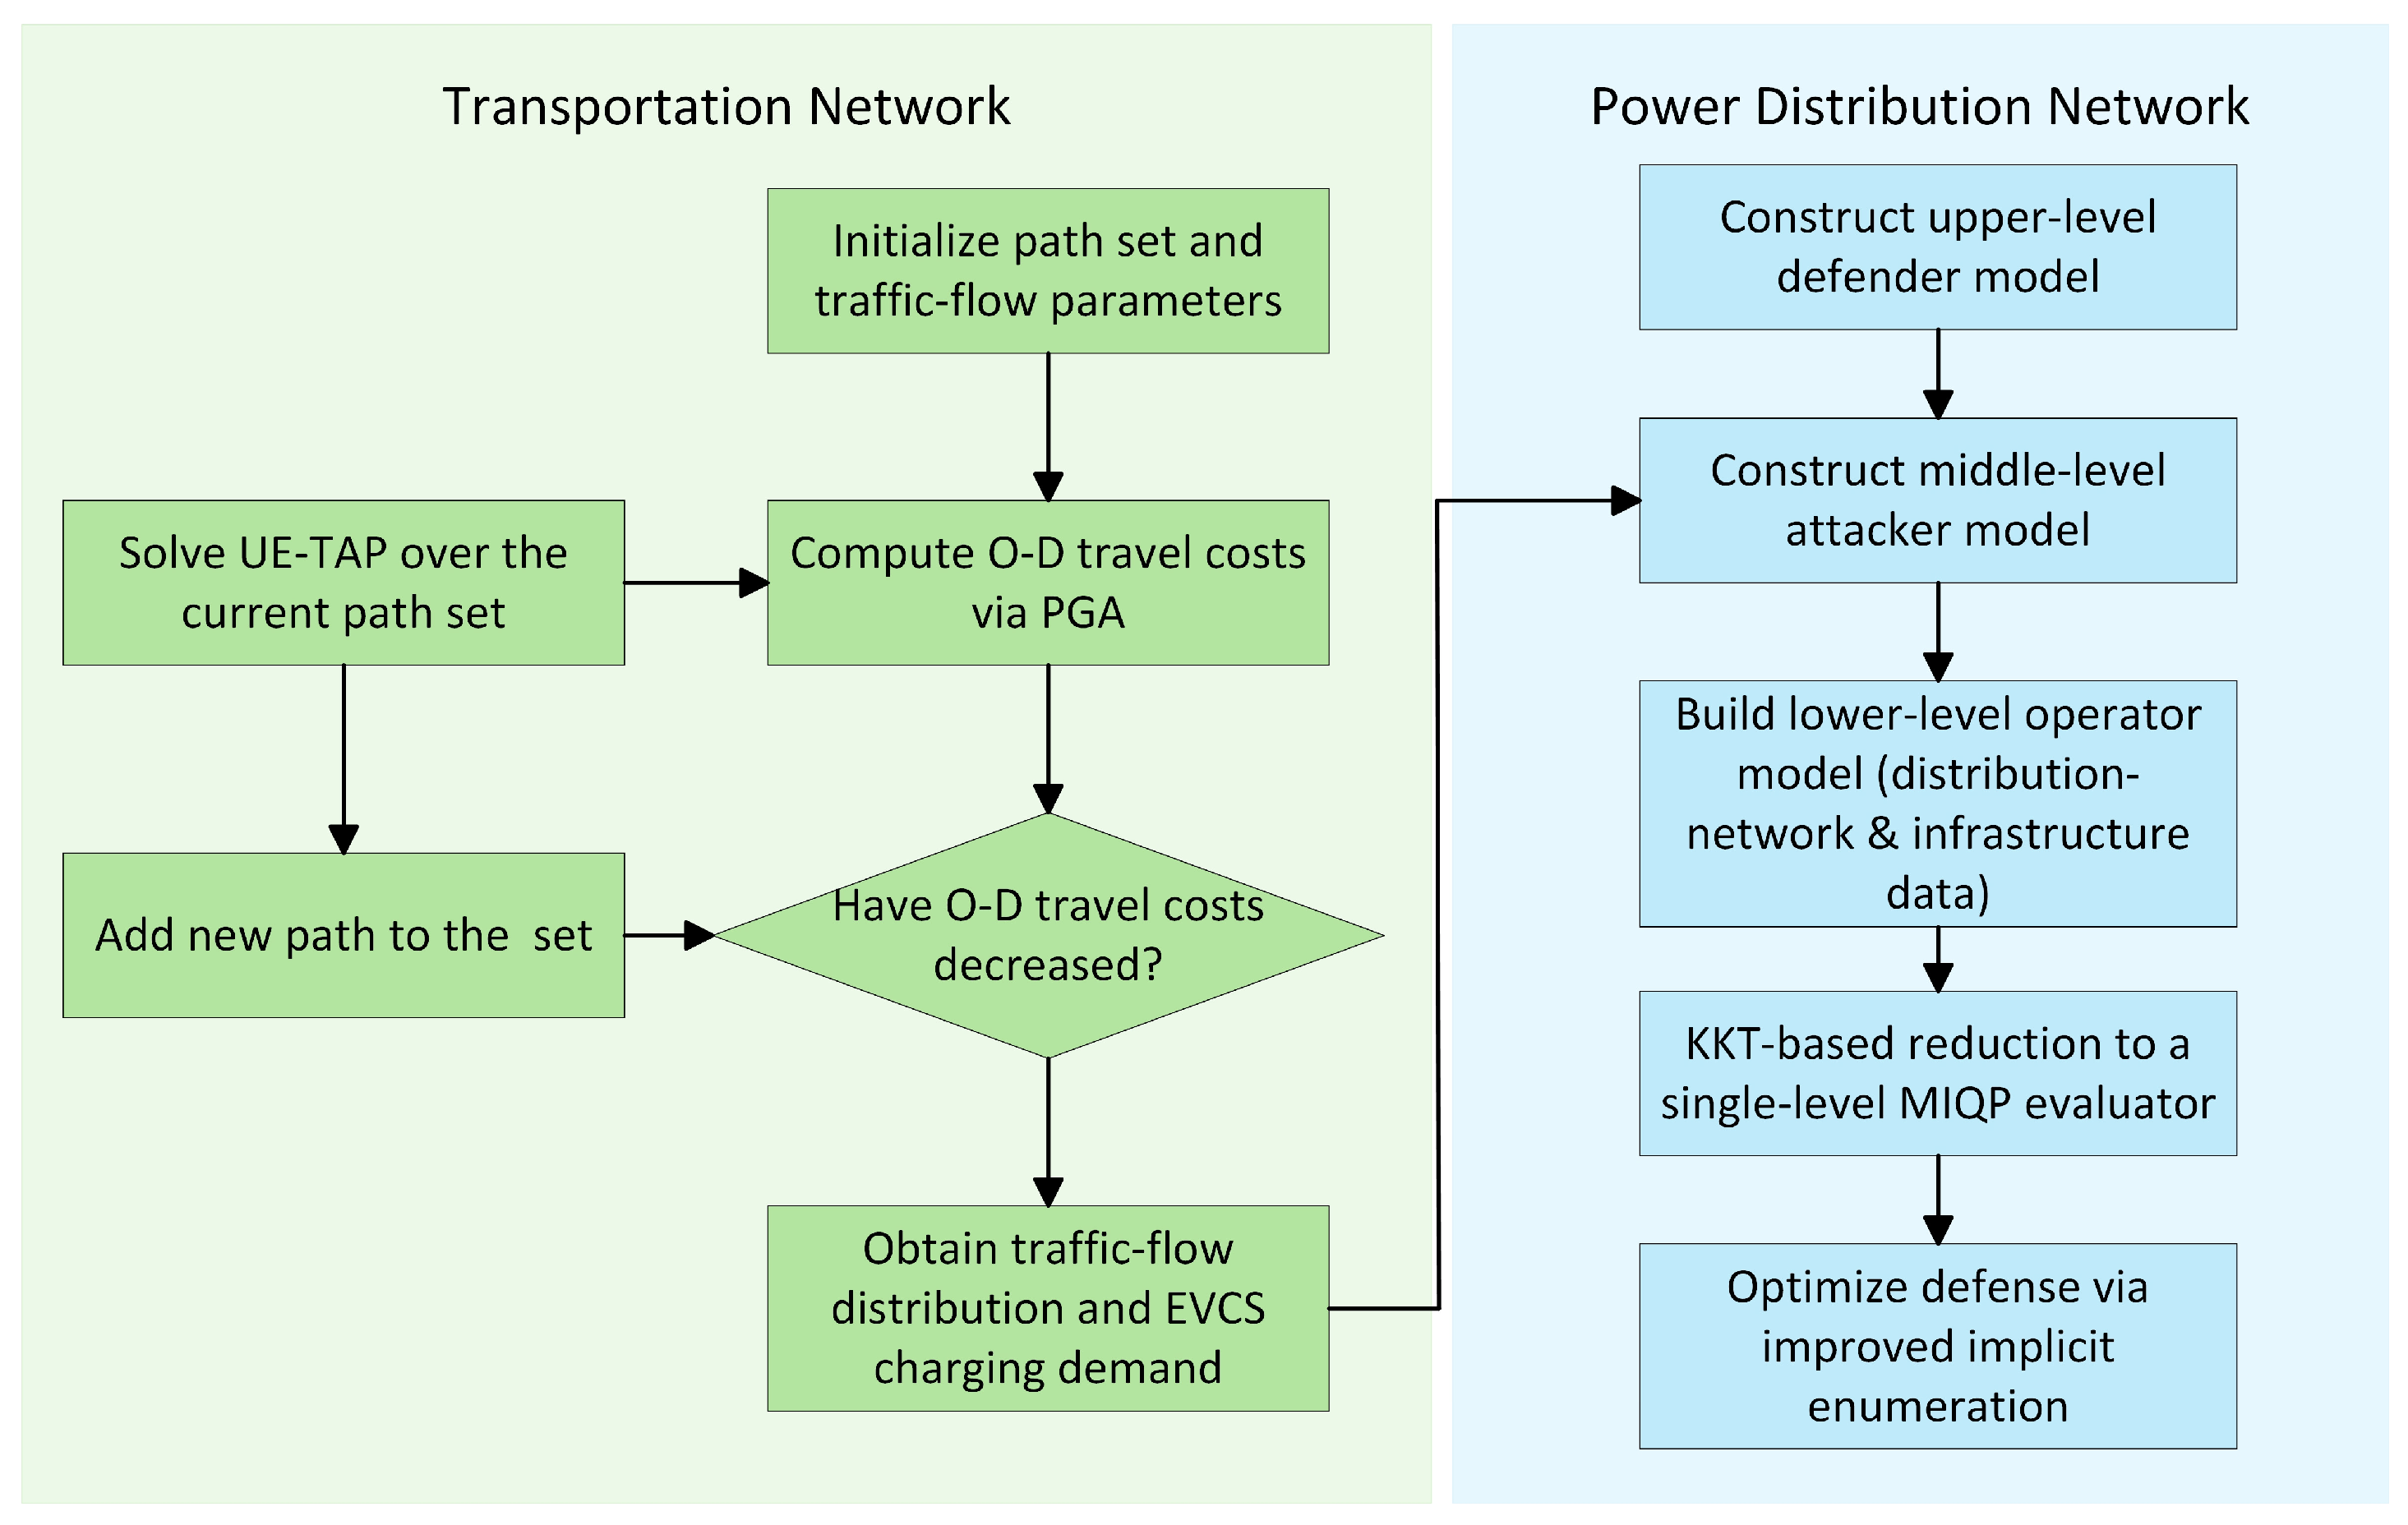
Figure 2 summarizes the full pipeline. The transport block iterates path generation and UE-TAP until O-D travel costs stabilize, yielding path flows and EVCS charging demand. These demands feed the power/distribution block, where the defender chooses B   EVCSs to protect, the attacker selects FDIA actions under a budget, and the operator performs corrective dispatch. The inner “attack + correction” stack is reduced via KKT optimality to a single-level mixed-integer quadratic programming (MIQP) evaluator, Φ ( d ) that returns the operation-aware objective for any defended set d . In what follows, one outer evaluation denoted one call to this KKT-reduced evaluator with fixed data and solver tolerances.
Let D denote an optimal defended EVCS set and Λ the set of EVCS that would be attacked if no defenses were deployed (the worst-case attack under zero defense). Then, D * Λ . Intuitively, if the defender protected none of the stations targeted in the zero-defense worst-case, the attacker could still realize the same worst-case damage, contradicting optimality of the defense. This property informs the branching order and early feasible completions in IIE.
Complete enumeration (CE) evaluates all N B size- B subsets among N candidates, i.e., O N B outer evaluations (upper-bounded by O 2 N ); for a fixed B , it grows as O N B . IIE preserves the same inner evaluator as CE but prunes large portions of the search space using bounds and feasibility checks, yielding the same or better solution quality in our tests with far fewer outer evaluations.
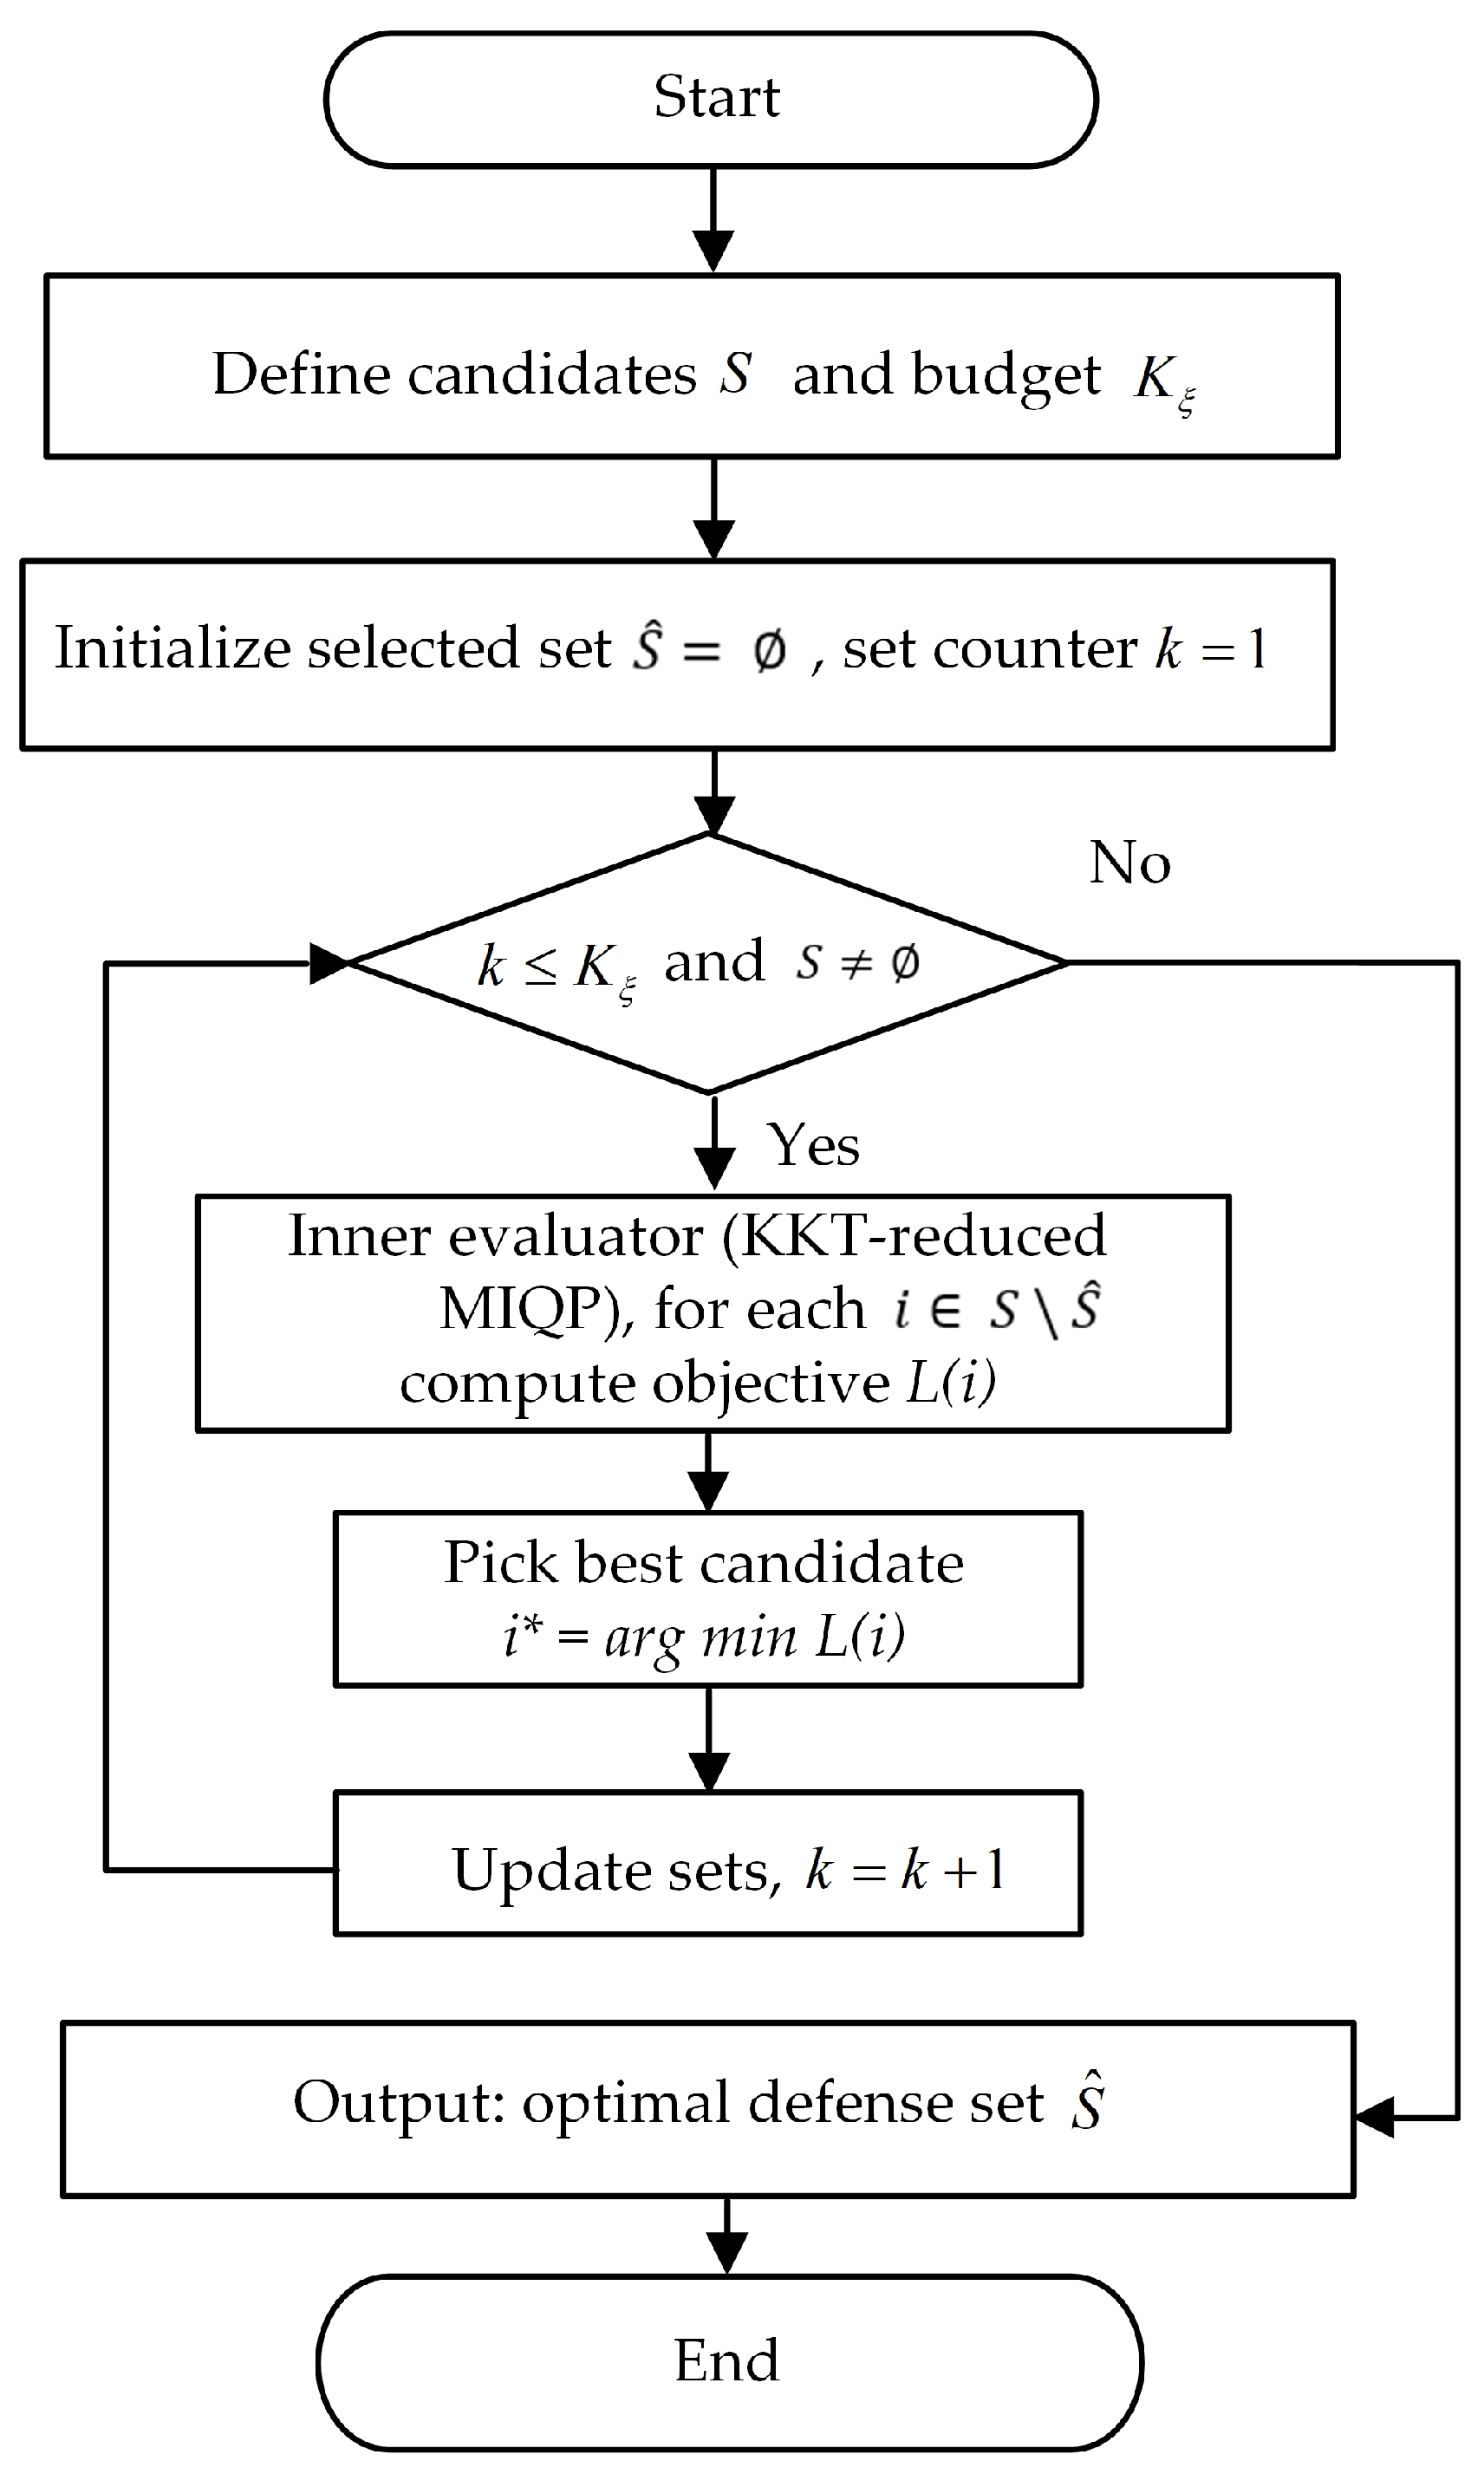
Figure 3 depicts the outer search for defense allocation: the algorithm maintains an incumbent defense set S ^ and iteratively refines it by scoring remaining candidates with the inner optimization model.
Step 1: Define the candidate set for defense allocation, S and the budget, K ξ . Initialize the optimal set as S ^ = , and the counter k = 1 .
Step 2: Based on the current candidate set S , initialize a trial allocation (or enumerate candidates) for evaluation.
Step 3: Using the inner optimization model, iterate over nodes in S and evaluate their defense effectiveness. If a node, i , yields the smallest inner objective, add it to the optimal set S ^ , remove it from S , updating k = k + 1 .
Step 4: If k K ξ and S , return to Step 2. Otherwise, output the optimal defense resource allocation set S ^ .

4.3. Node Voltage Evaluation Index

We assessed steady-state voltage quality at the distribution level using three complementary metrics that align with common utility/grid-code practices (band-based compliance at customer nodes). Let V i denote the squared voltage magnitude at node i (as in our model) and V r e f the nominal reference.
  • Maximum Node Voltage Deviation.
The maximum node voltage deviation reflects the imbalance in voltage distribution across the system and is expressed as follows:
Δ V m a x = V m a x V m i n
where V m a x and V m i n represent the maximum and minimum node voltages, respectively. This index captures the feeder-wide voltage spread after an attack and corrective dispatch, reflecting how unbalanced the nodal voltages remain. It corresponds to the standard practice of checking the worst-case voltage range across buses against admissible service bands in distribution networks.
2.
Root Mean Square (RMS) of Node Voltage Deviation.
The RMS of voltage deviation measures the overall dispersion of voltage levels, providing insight into system voltage stability. It is calculated as follows:
V R M S = 1 N i = 1 N V i V r e f 2
where N is the total number of nodes and V r e f denotes the reference node voltage. This index aggregates system-wide voltage departures from nominal conditions and is aligned with RMS/mean-square measures commonly used in power-quality reporting to summarize overall steady-state voltage performance.
3.
Bus-Voltage Qualification Rate (VQR).
The VQR quantifies the proportion of monitored buses operating within the allowable voltage range and is defined as follows:
V Q R = γ q l f = N q l f N × 100 %
where N q l f is the number of buses satisfying the voltage limits and N is the total number of monitored buses in the distribution grid ( N = 18 in this study: 17 load buses + feeder-head/substation bus).
This index directly quantifies service compliance, i.e., the share of customers operating within prescribed steady-state limits, which is a standard compliance-style indicator in distribution practice.
Taken together, Δ V m a x characterizes the extreme spread of node voltages across the feeder, V R M S quantifies the aggregate severity of departures from the nominal level, and γ q l f indicates the proportion of customer nodes within the admissible steady-state band. This set is minimal and non-redundant for the study of steady-state voltage resilience under EVCS-centric false-data attacks with endogenous corrective dispatch, because it captures localized extremes, system-wide stress, and service compliance. Indices designed for collapsed margins or dynamic behavior, such as voltage-stability margins and frequency-related measures, address different phenomena and are complementary; they can be incorporated when the objective extends beyond steady-state voltage quality.

5. Case Study

5.1. Parameter Settings for the Case Study

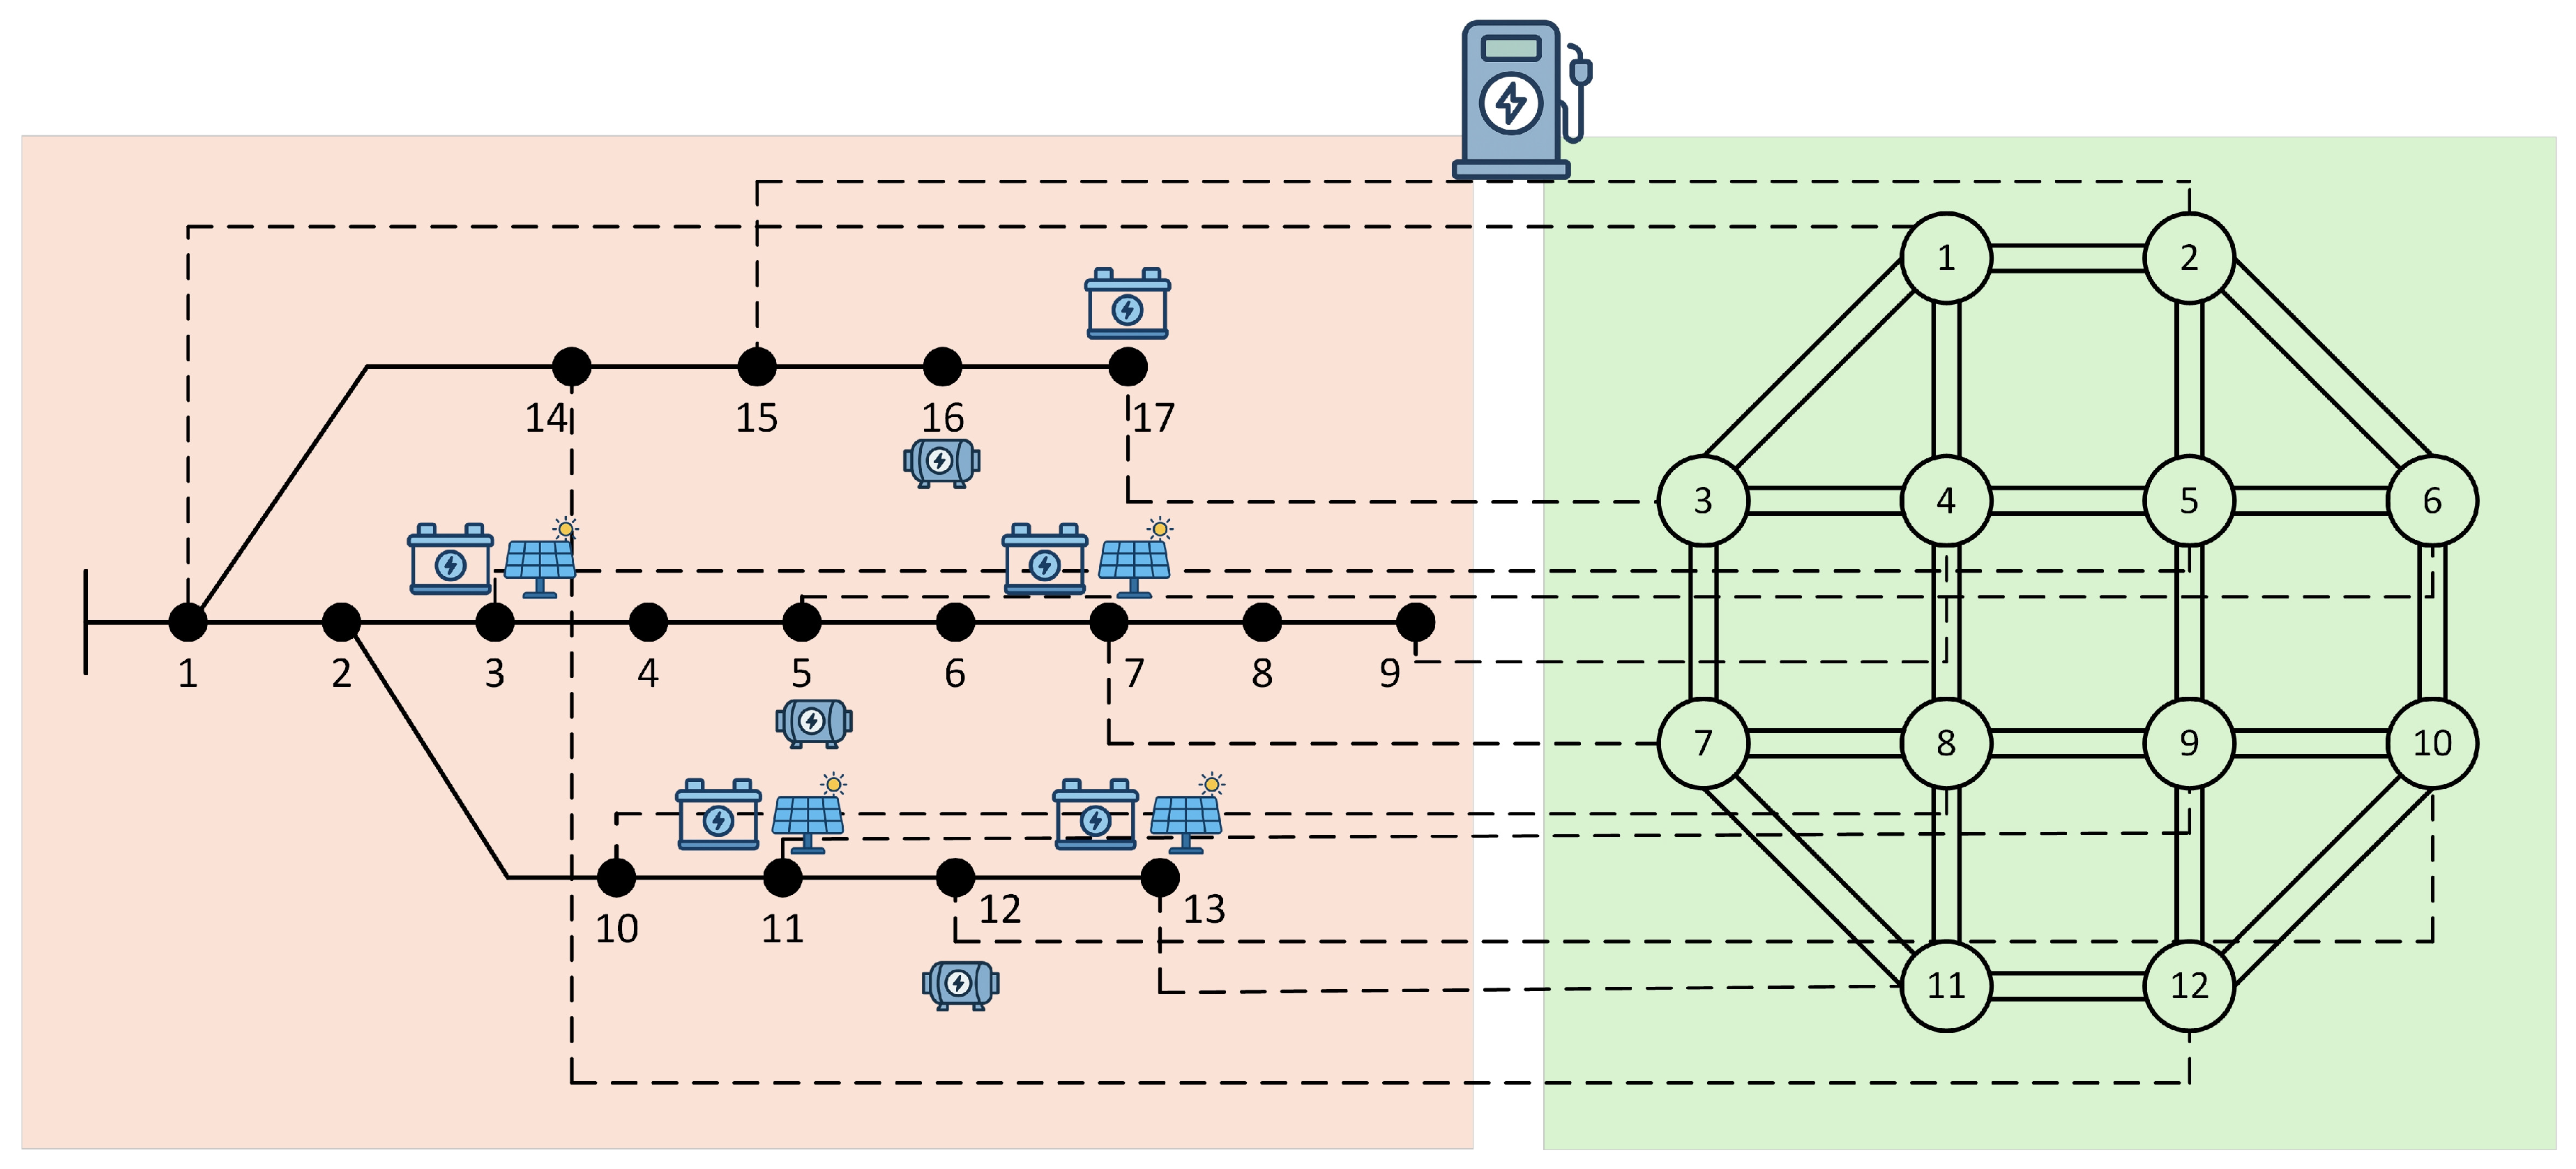
A 17-bus, 35 kV distribution feeder and a 12-node transportation network are used to validate the proposed defense-resource-allocation model. The distribution system includes DESS, PV units, and distributed generators. The two networks are coupled via an EVCS: at each coupled location, both conventional chargers and V2G-enabled chargers are available, enabling bidirectional energy exchange between EVs and the distribution grid. Figure 4 illustrates the network topology, DER placements, and EVCS couplings, while Table 1 summarizes the one-to-one mapping between transportation nodes and distribution buses.

5.2. Analysis of Defense Resource Allocation Effectiveness

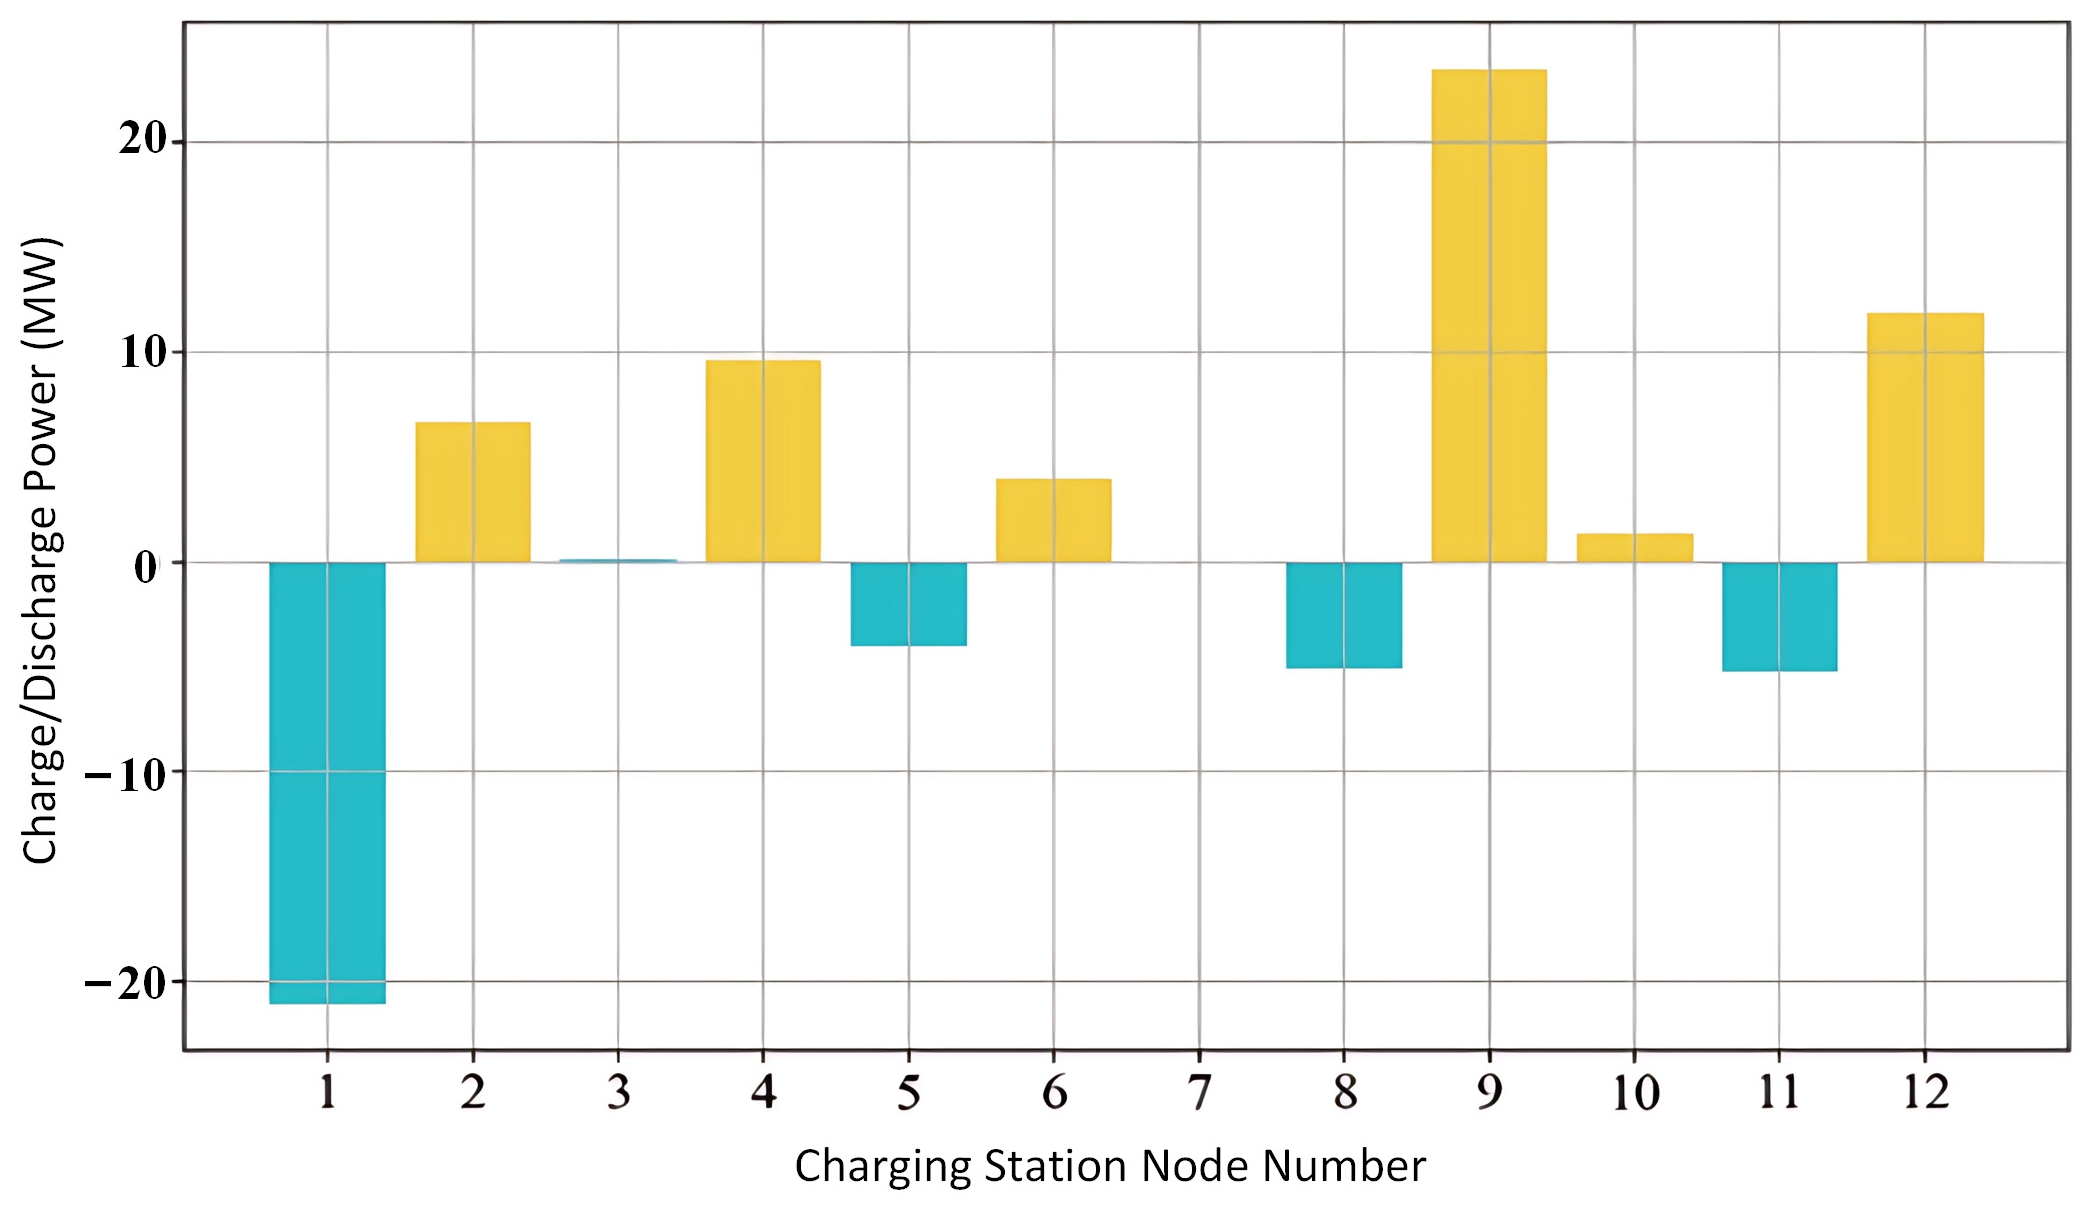
Defense resource allocation is evaluated during peak travel periods and low-renewable output conditions. Station-level charging/discharging profiles at these times are computed via the UE-TAP model, as described in the cited reference, and the resulting power distribution is shown in Figure 5.
Table 2 reports the optimal defense strategy together with the node-level MVD, RMS voltage deviation, and VQR for a defense budget K ψ = 6 . With K ψ = 6 , protecting transportation nodes 4 and 11 yields an MVD of 0.0948 p.u., an RMS voltage deviation of 0.0423 p.u., and a VQR of 66.67%. Under this configuration, the attacker’s best response targets nodes 1, 6, 7, 8, 10, and 12.
As the defense budget increases, more key nodes are hardened, voltage deviations under attack decline, and overall system stability improves. In our tests, the MVD decreases from 0.1006 p.u. to 0.0787 p.u., while the RMS voltage deviation drops from 0.0439 p.u. to 0.0354 p.u. In the base case, a budget of K ψ = 4 achieves VQR = 100%, indicating that the network can fully withstand the tested attacks.
From a defense strategy perspective, the selection of critical hub nodes is decisive for robustness. The configuration protecting nodes 4, 7, 10, and 11 effectively reduces node-voltage deviations and enhances overall stability. Conversely, when defense resources are scarce, some critical nodes remain unprotected, leading to larger deviations and a lower VQR. This further confirms the value of prioritizing hub nodes in defense allocation.
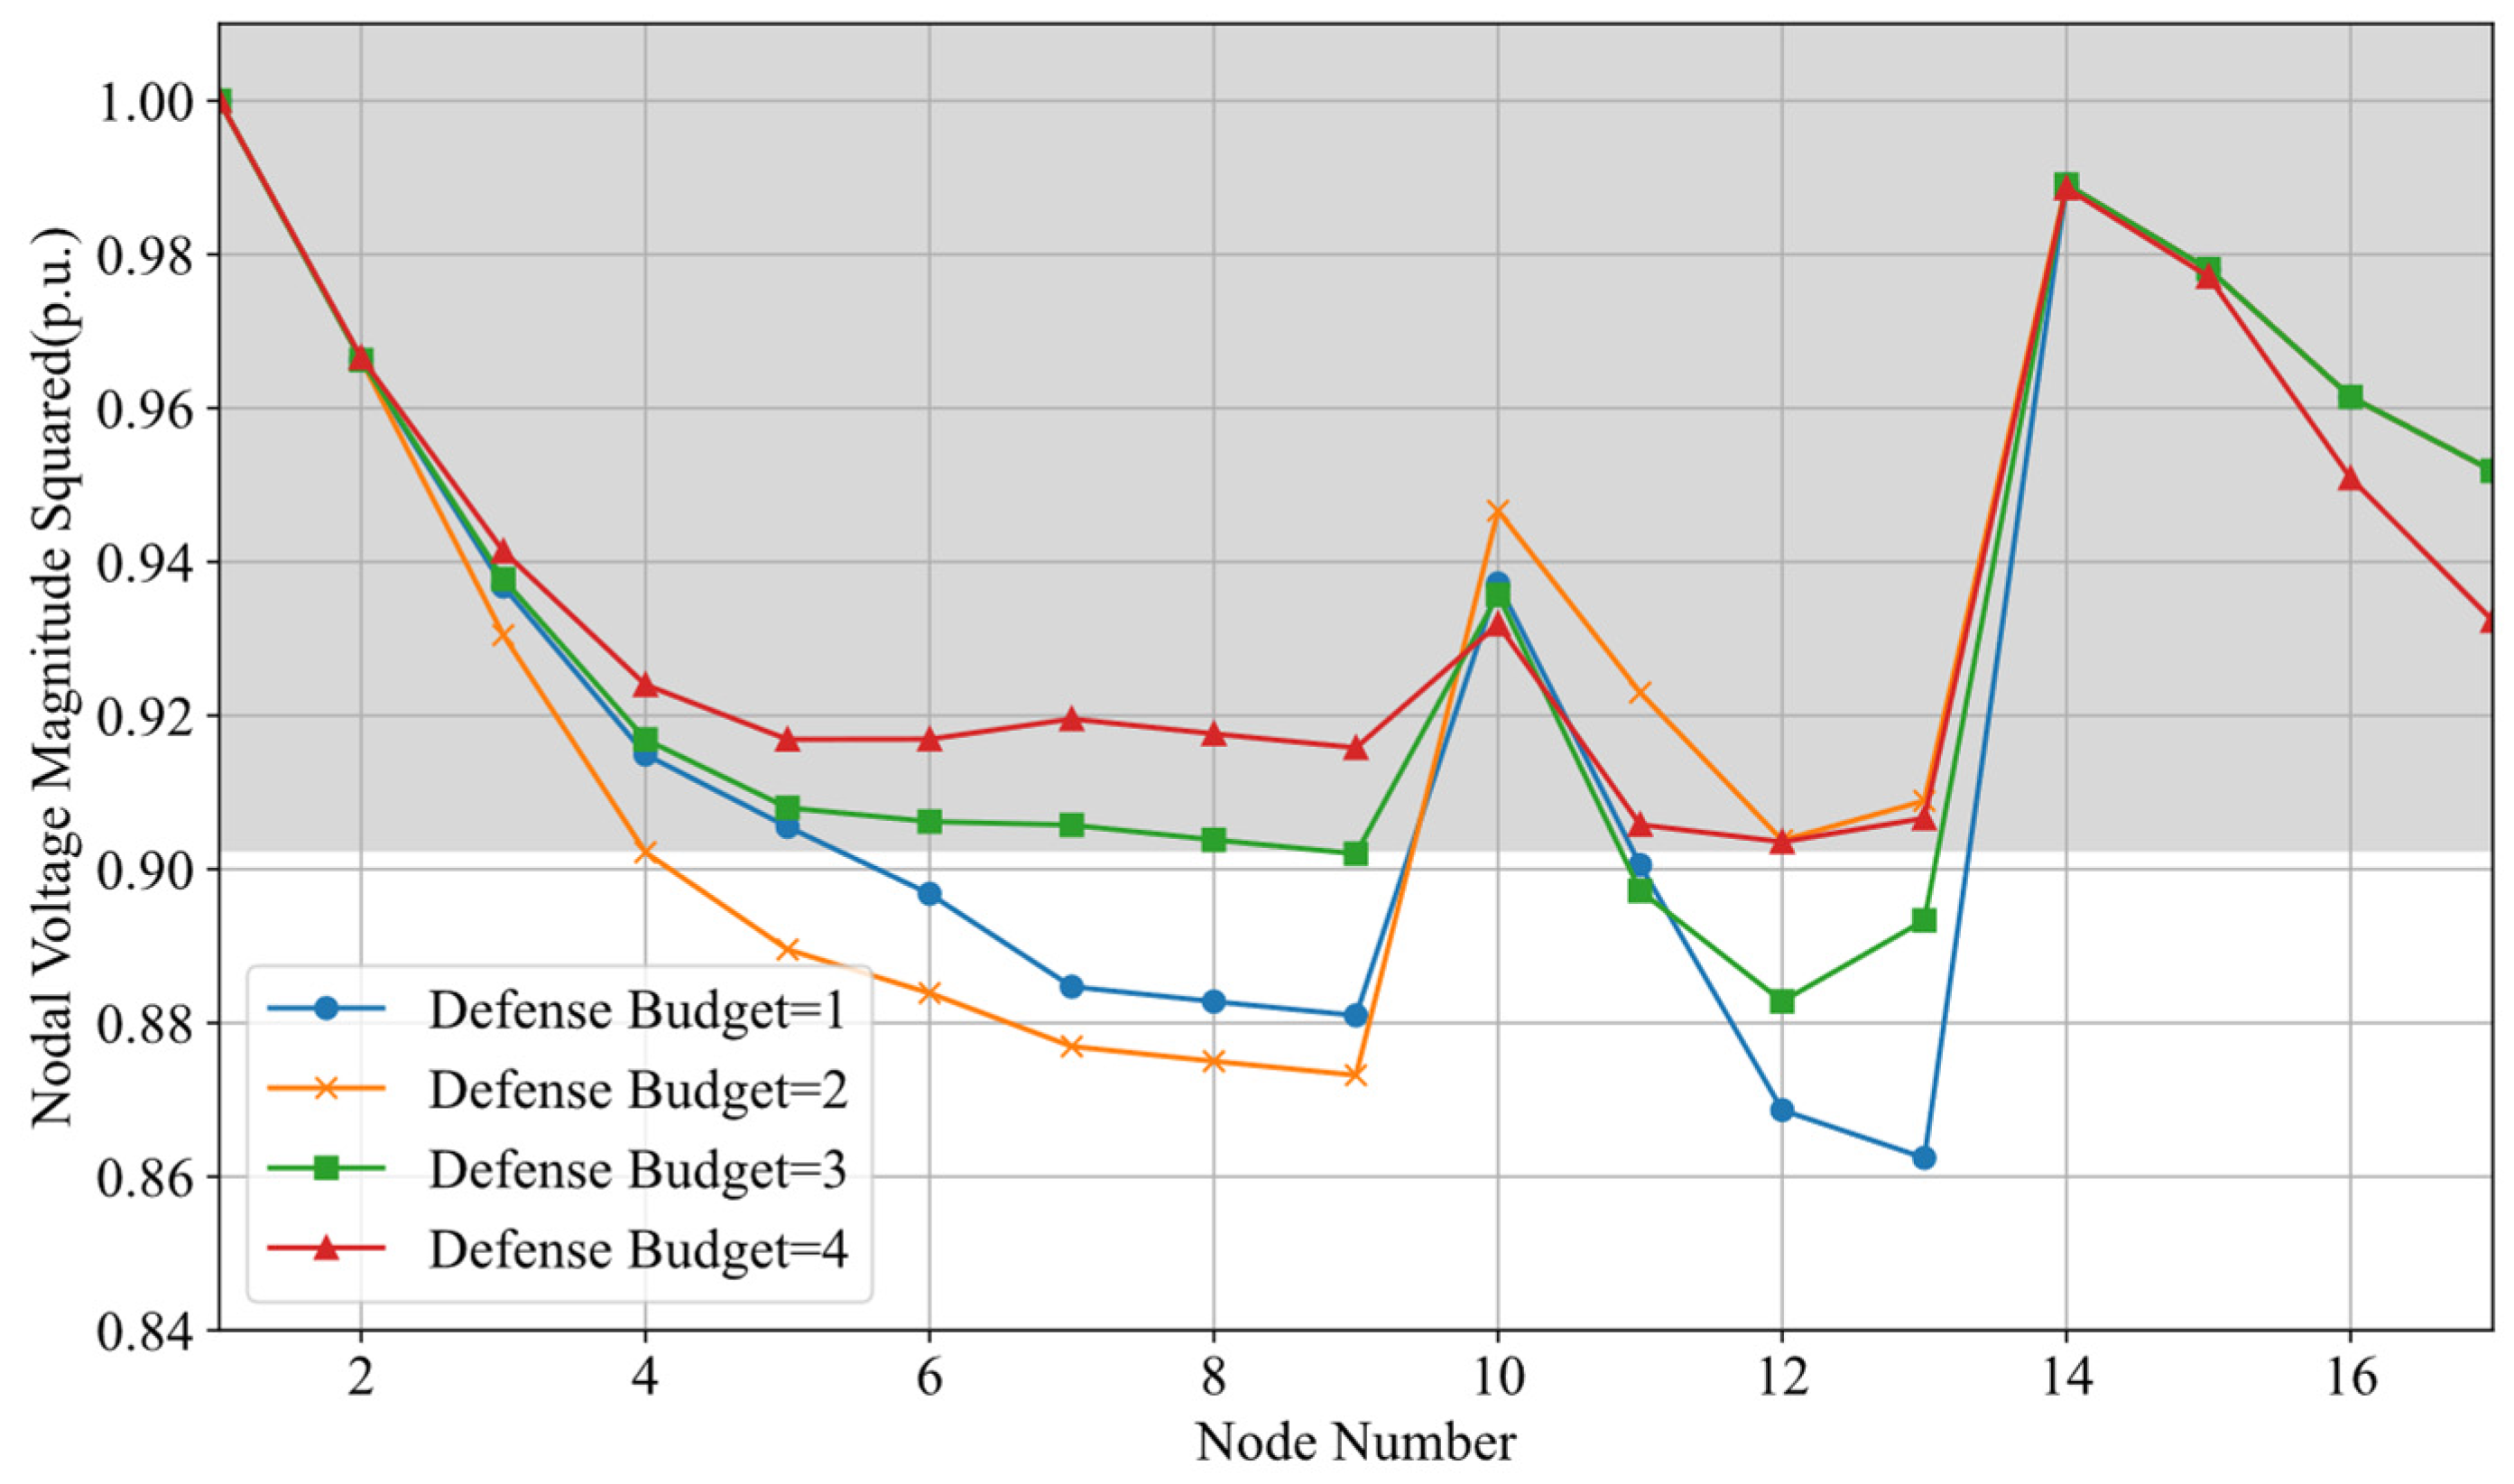
Figure 6 illustrates the distribution of bus-voltage magnitudes under different defense budgets. The gray band denotes the safe-operating region, with a lower bound of 0.9025 p.u. When the defense budget is one, several buses remain below the bound, for example, node 12 at 0.8667 p.u. and node 6 at 0.8959 p.u., indicating that, under a low budget, attacks still cause substantial voltage degradation and some buses cannot be maintained within the safe range. As the budget increases, the number of violations decreases. With a budget of two, some buses recover (e.g., node 12 rises to 0.9001 p.u.) but still fall short of the safe-operating region, showing that added resources improve robustness but do not yet achieve full resilience. When the budget reaches four, node 3 rises to 0.9413 p.u., node 6 to 0.9167 p.u., and node 12 to 0.9033 p.u.; all buses are then within the safe range and no violations remain.
Quantitatively, as the defense budget increases, the MVD decreases from 0.1006 p.u. to 0.0787 p.u. (−21.77%), and the RMS voltage deviation decreases from 0.0439 p.u. to 0.0354 p.u. (−19.36%). These results demonstrate that defense-resource allocation significantly enhances system stability by reducing boundary violations and improving distribution-network security.

5.3. Analysis of the Impact of DESS and PV on Defense Resource Allocation

To quantify the corrective effect of the lower-level system operator (scheduling center) when re-dispatching DESS and PV under the attacker’s FDIA, and to further verify the need to plan DESS/PV in the distribution network, we examine the scenarios in Table 3. Scenario 1 is the benchmark (optimal) case. Scenario 2 reduces installed PV capacity by 50% relative to Scenario 1. Scenario 3 reduces installed DESS capacity by 50% relative to Scenario 1.
Analysis is conducted under the scenario of the attack resource budget K ψ = 8 , and the resulting defense resource allocation for each scenario is presented in Table 4, Table 5 and Table 6.
Across the scenarios, when installed PV and DESS capacities are sufficient, hardening only four key EVCS nodes is enough to achieve VQR = 100%. When PV capacity is insufficient (Scenario 2), the defense budget required to reach VQR = 100% increases by 50% relative to Scenario 1, indicating a pronounced loss of voltage support. This is because PV inverters supply both active power and local reactive power; reducing PV capacity simultaneously diminishes P and VAR support, especially at voltage-sensitive buses, thereby degrading voltage stability.
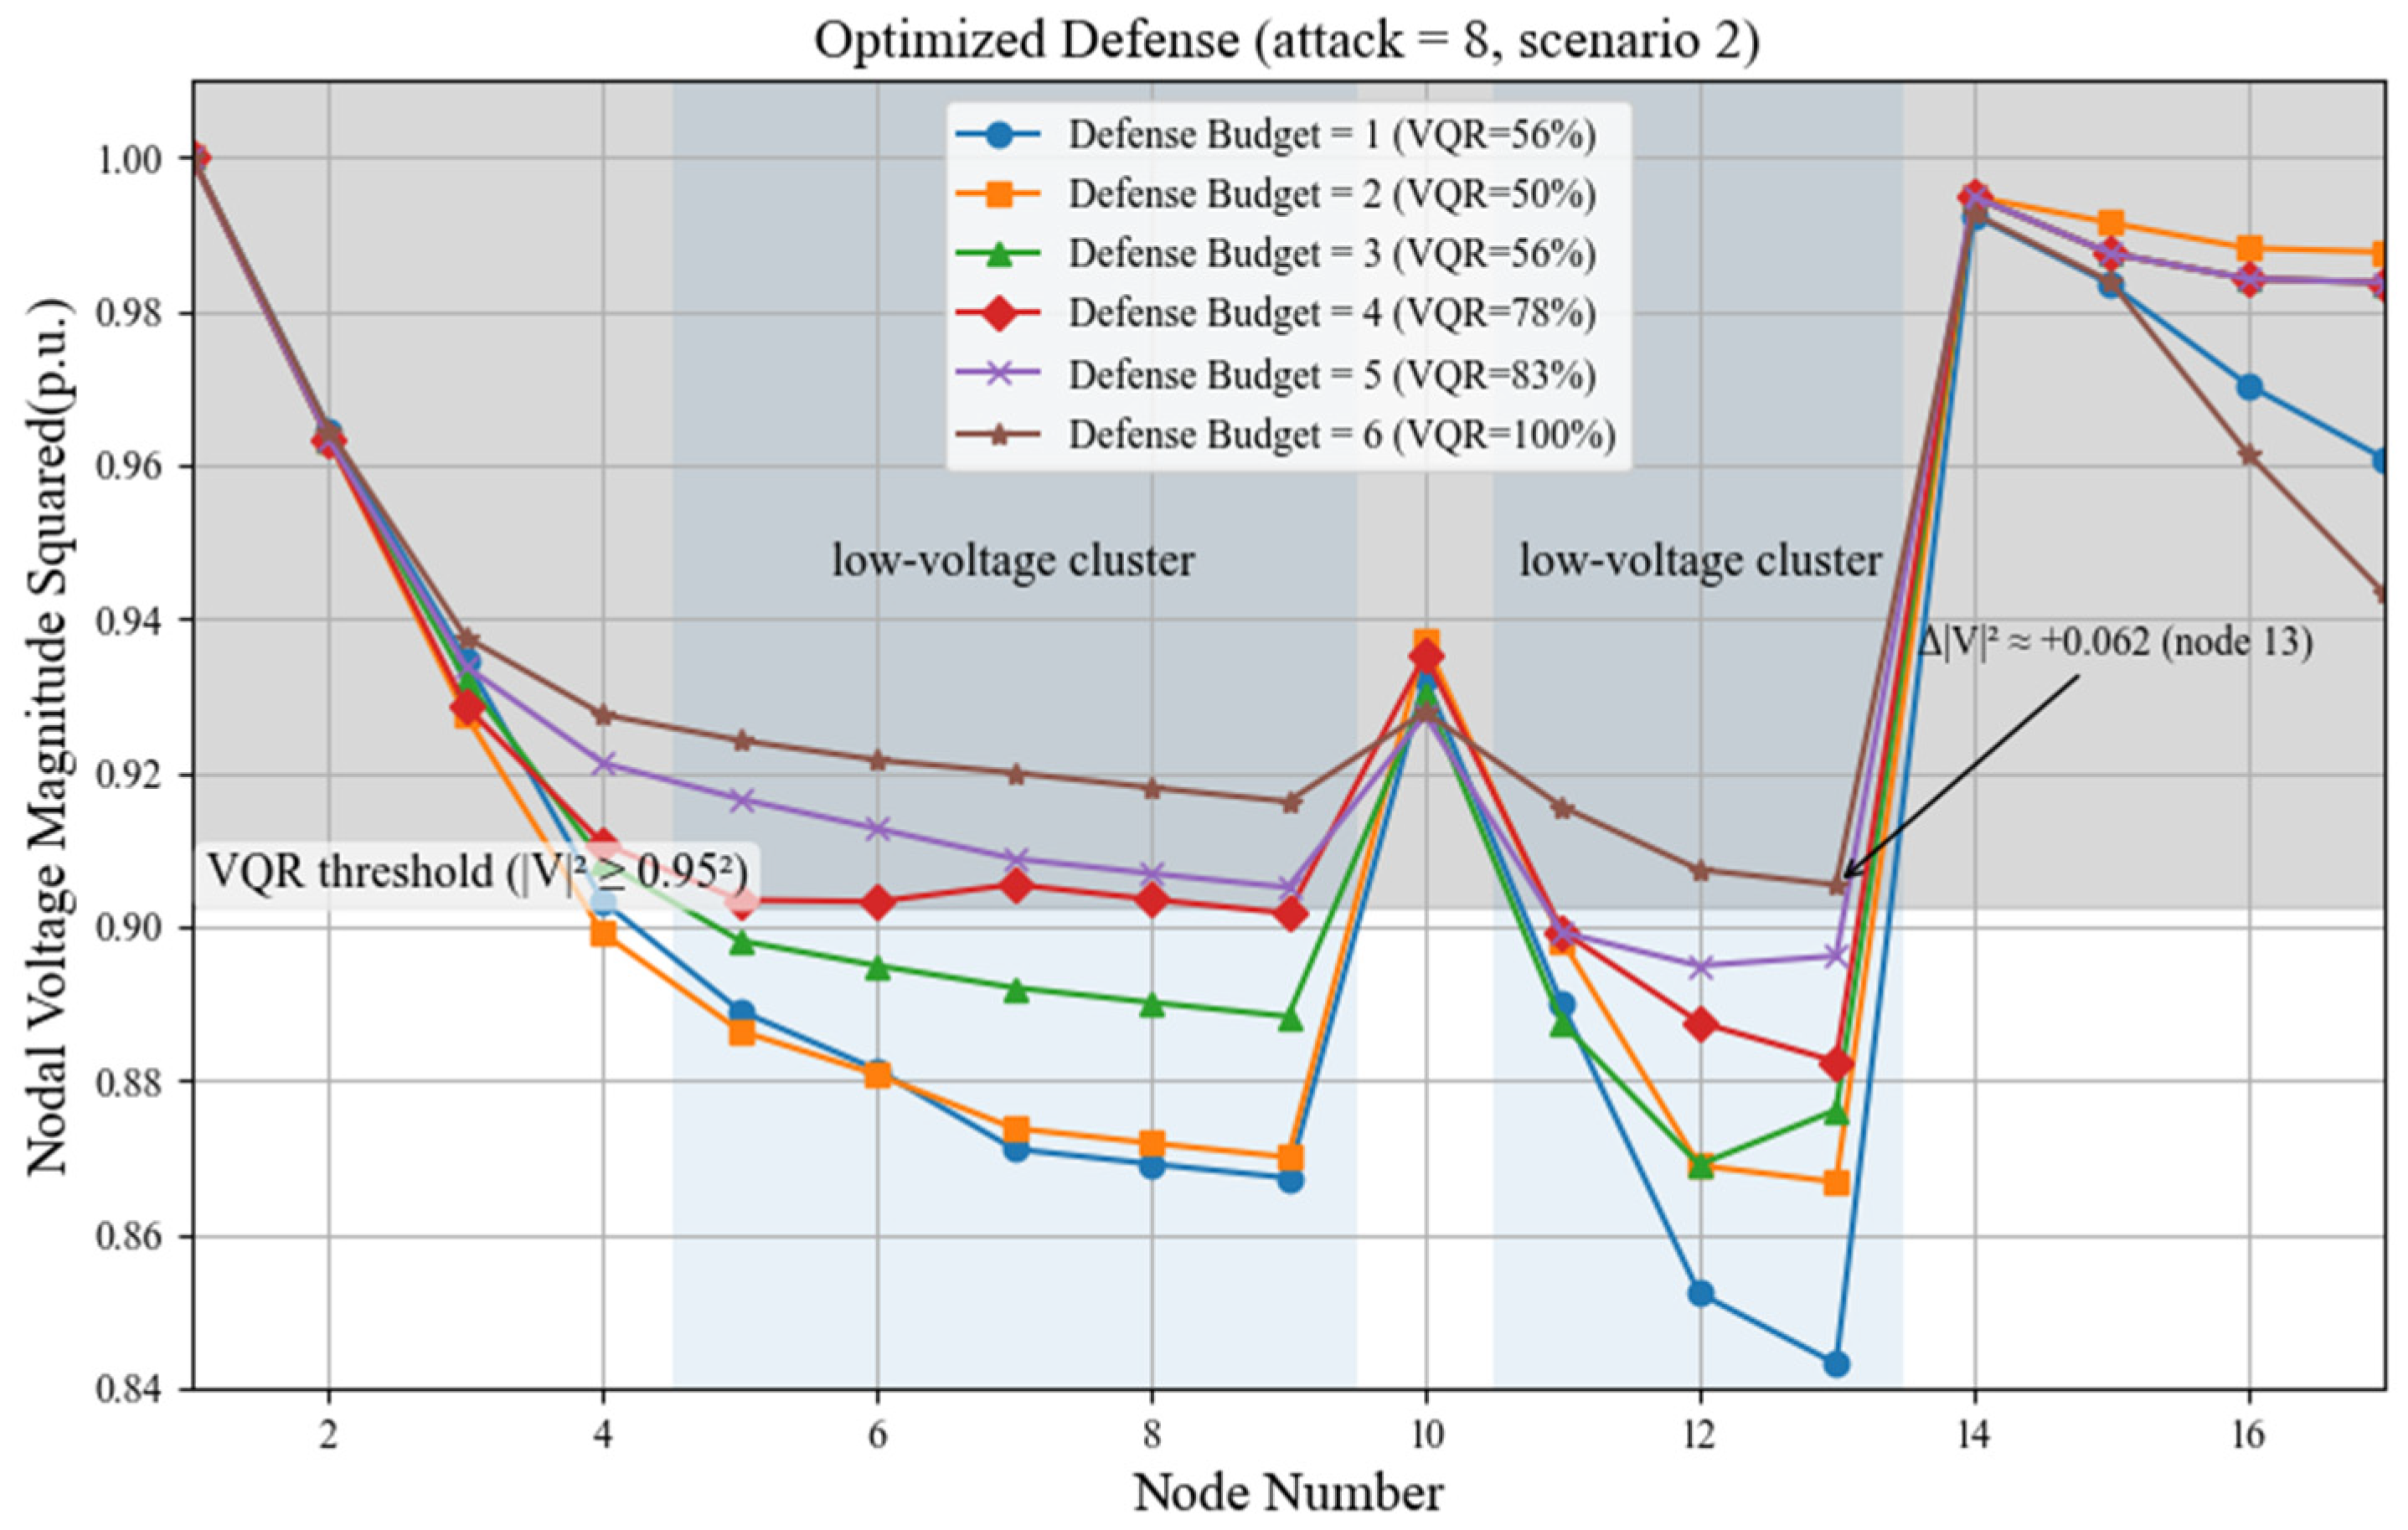
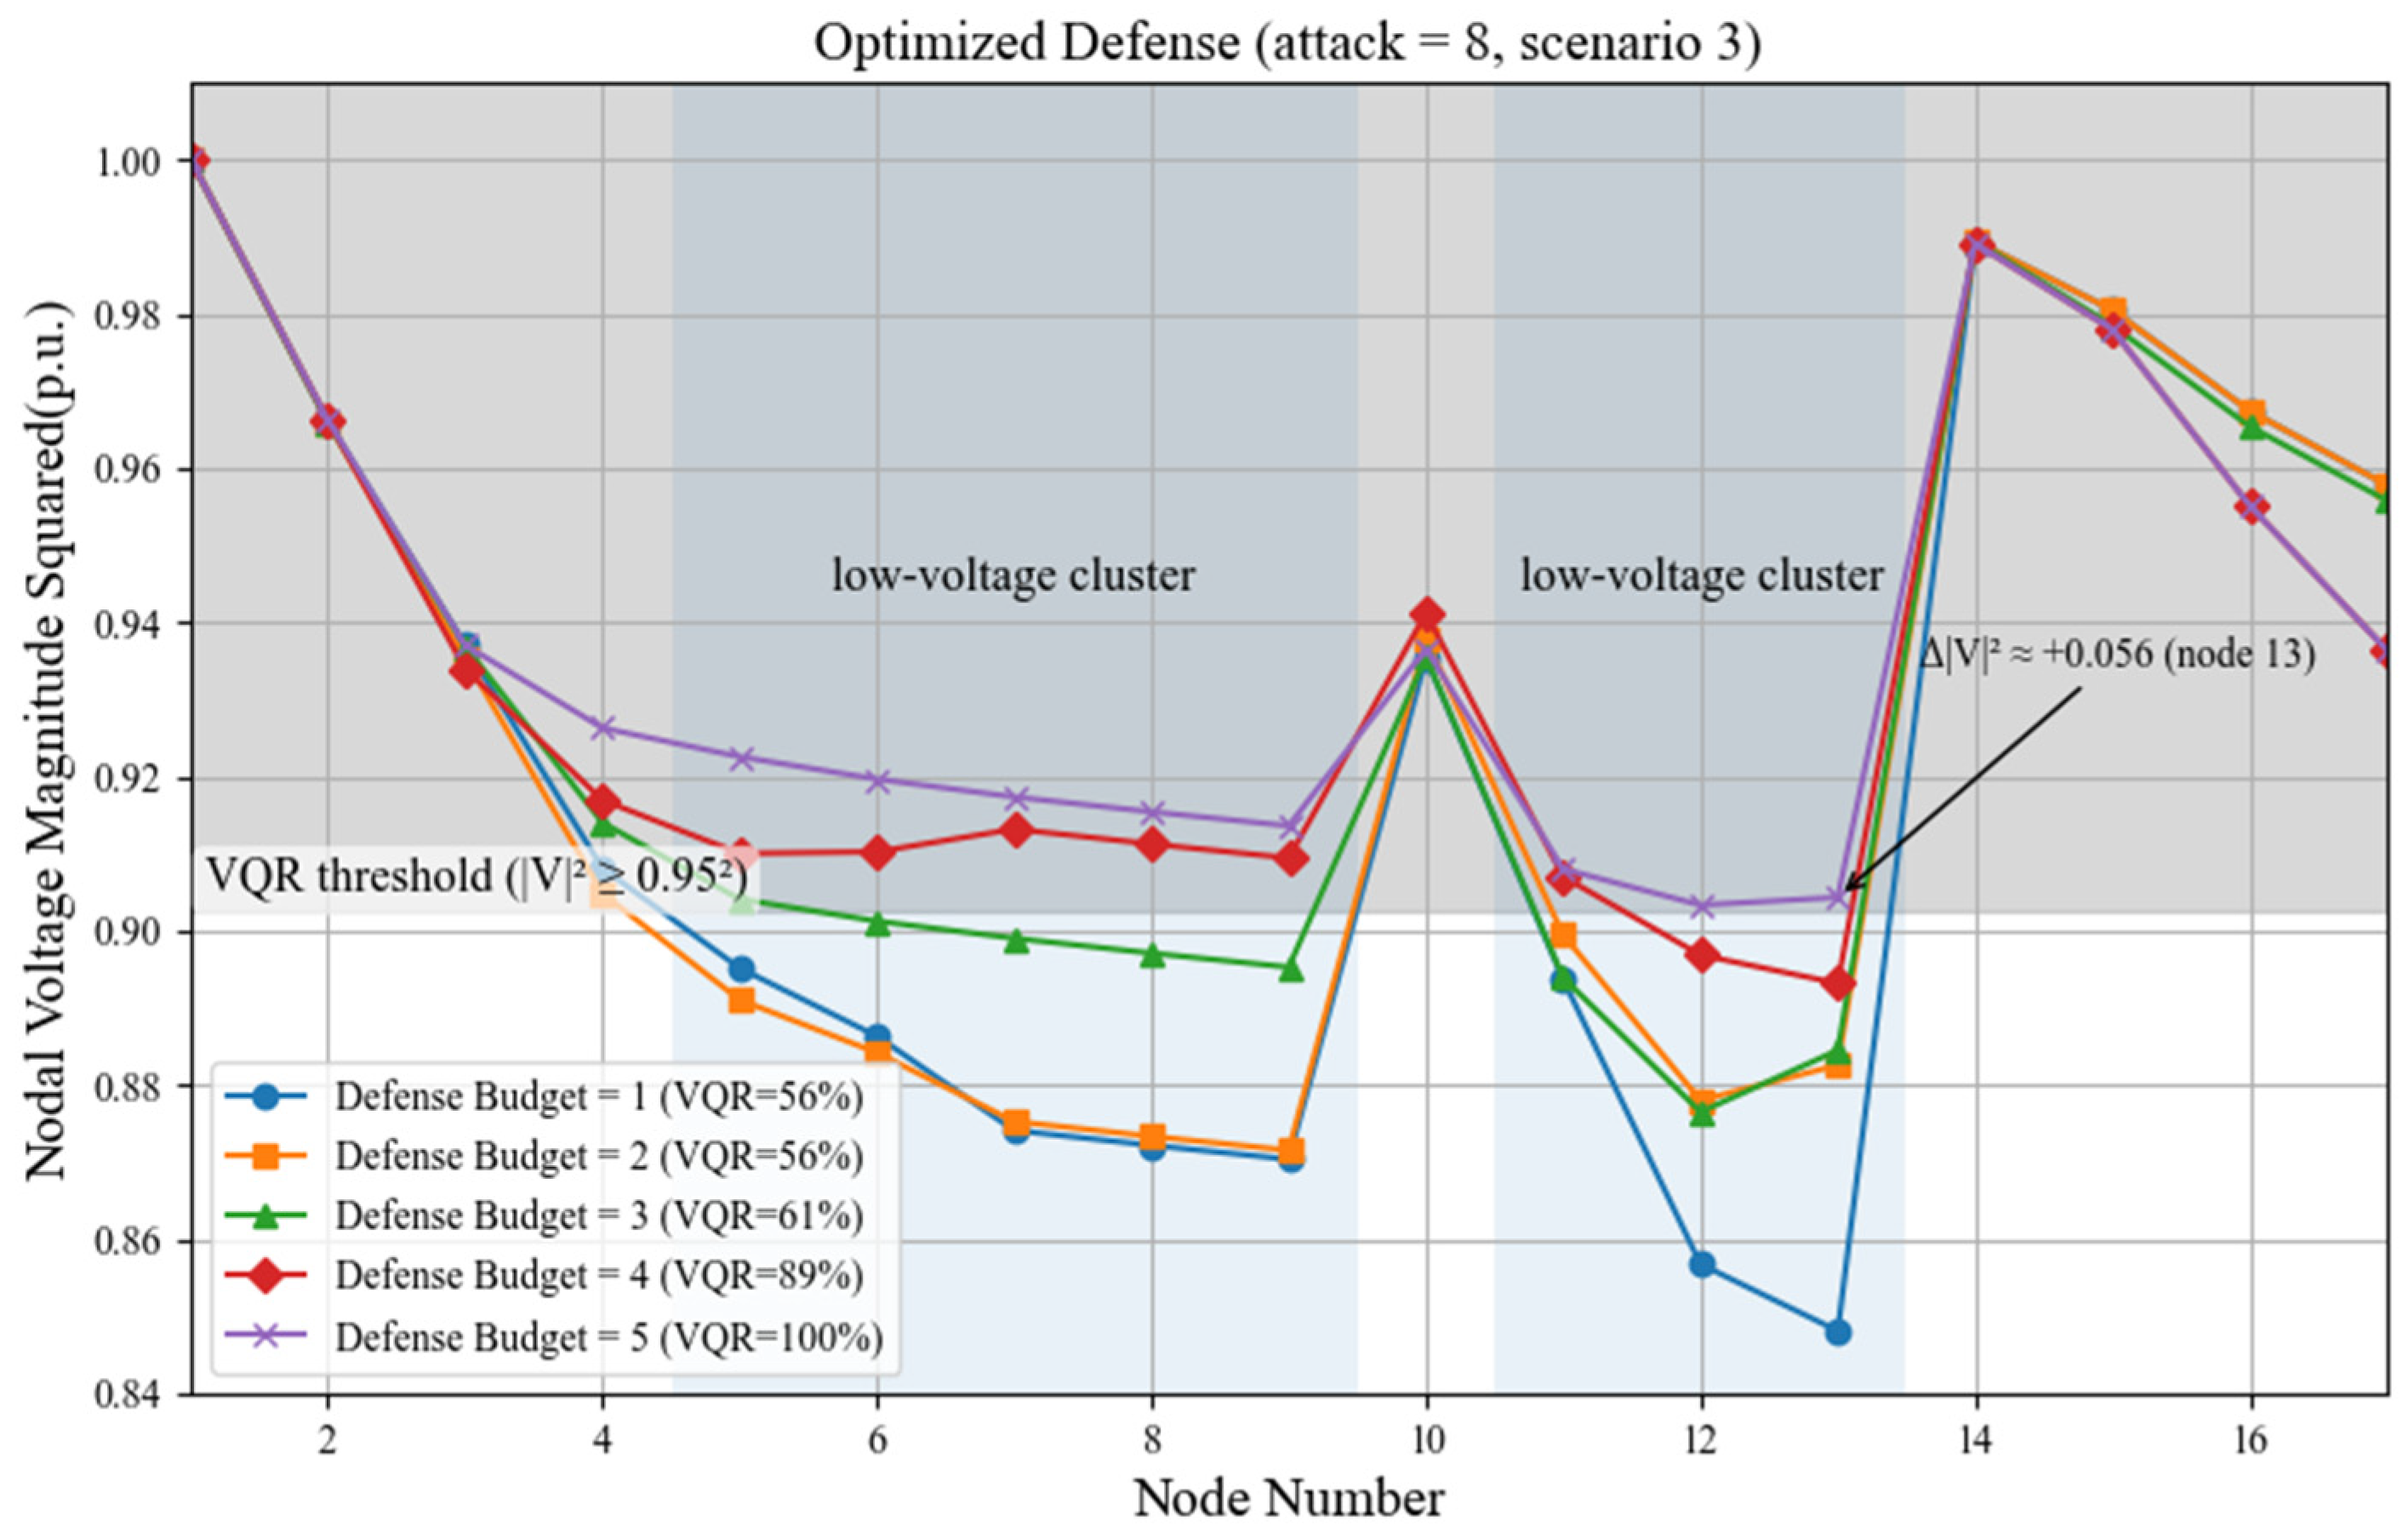
Node-voltage profiles for Scenarios 1–3 are shown in Figure 7, Figure 8 and Figure 9.
Under sufficient PV and DESS capacities, increasing the defense budget steadily reduces nodal voltage deviations and eliminates low-voltage clusters. Hardening buses 4, 7, 10, and 11 lowers the MVD from 0.1050 p.u. to 0.0793 p.u. (−24.48%), and the RMS deviation from 0.0462 p.u. to 0.0356 p.u. (−22.94%). The VQR reaches 100%, with all buses meeting the qualification threshold.
With limited PV headroom, more defense resources are needed to achieve comparable voltage quality because corrective redispatch operates with a lower margin. Hardening buses 4, 6, 7, 9, 10, and 11 reduces the MVD from 0.1101 p.u. to 0.0767 p.u. (−30.30%) and the RMS voltage deviation from 0.0489 p.u. to 0.0341 p.u. (−30.26%). Low-voltage regions contract but fully clear only at higher defense budgets.
With insufficient DESS capacity, low-voltage clusters persist, requiring a higher defense budget to clear them. Hardening buses 4, 6, 7, 10, and 11 reduces the MVD from 0.1083 p.u. to 0.0789 p.u. (−27.15%) and the RMS deviation from 0.0474 p.u. to 0.0352 p.u. (−25.74%), while the VQR rises from 55.56% to 100% as all bus curves cross the threshold.
Across the three figures, the DAC framework improves voltage quality by breaking the spatial correlation induced by coordinated FDIAs along feeder sections. The optimizer prioritizes junction and measurement hubs (e.g., buses 4, 7, 10, and 11); hardening these nodes blocks falsified data propagation and unlocks the corrective layer so that PV/DESS and tap/reactive controls can support stressed corridors. As a result, we observe cluster-level recovery and worst-node uplift, not merely a uniform shift, with the VQR increasing as the defense budget rises.
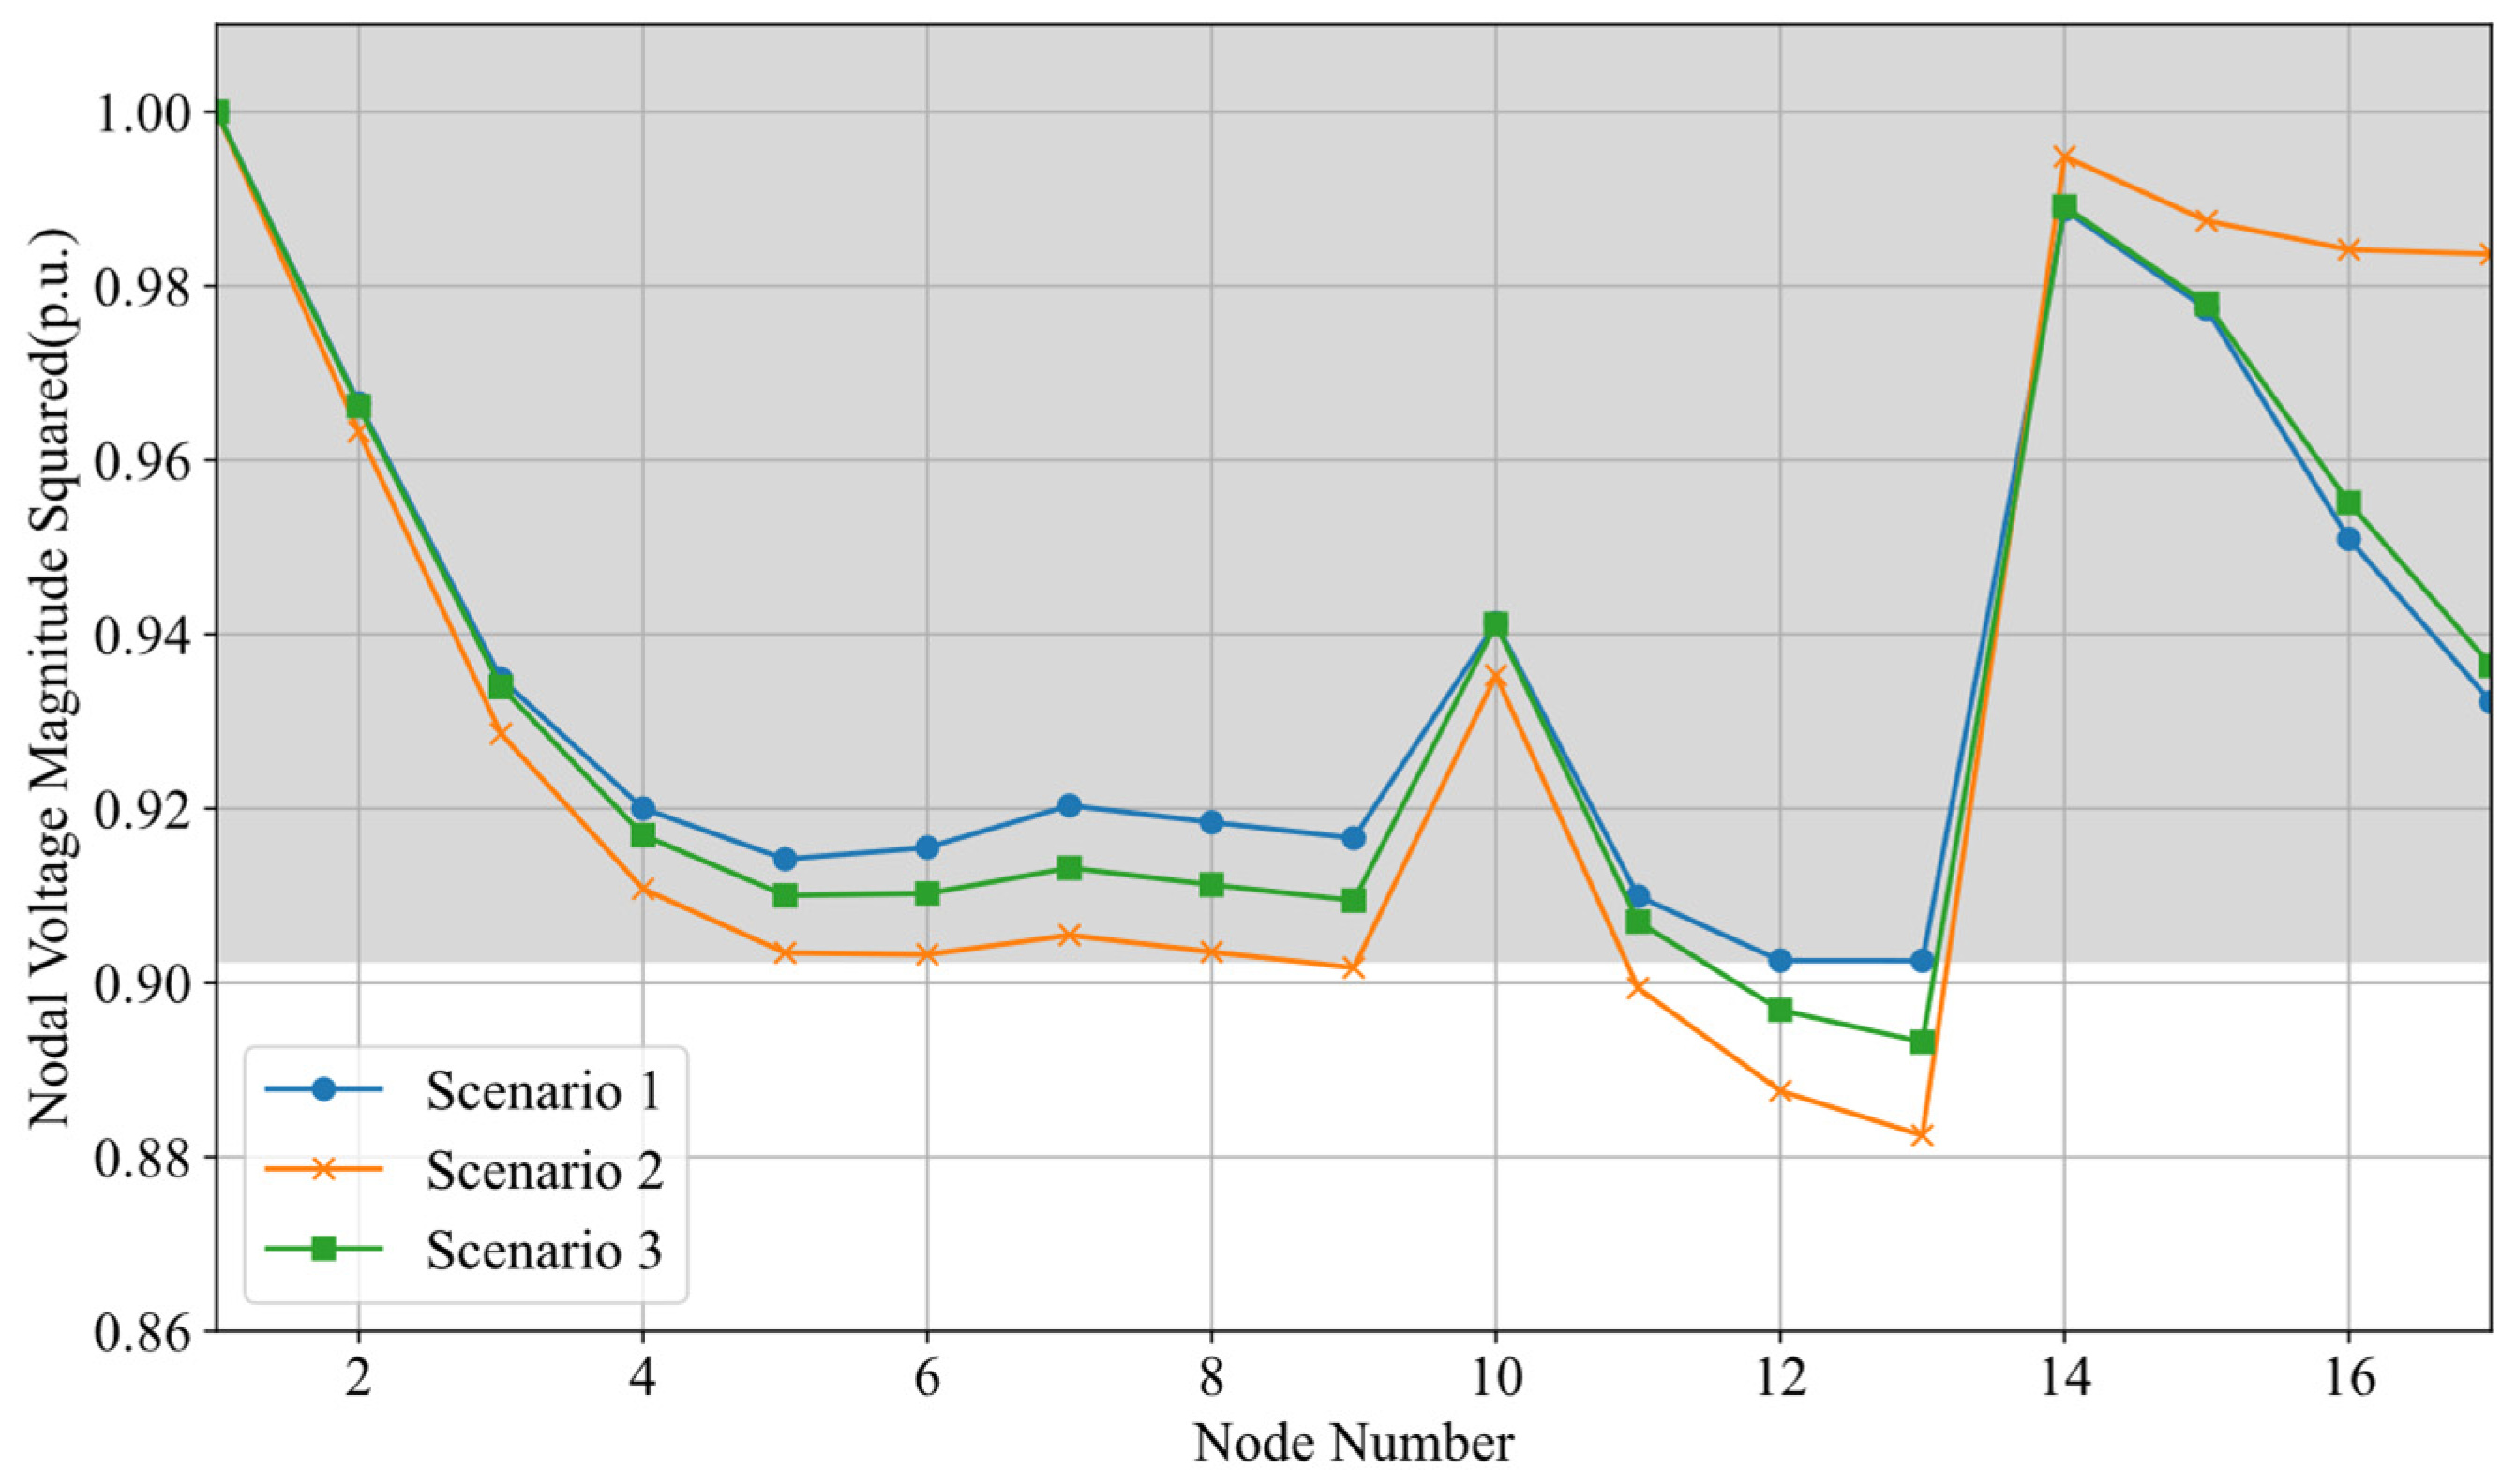
To enable a vertical comparison of node-voltage distributions across scenarios under a common defense budget, we analyze the case with K ψ = 4 ; results are shown in Figure 10.
Overall, across all three scenarios, buses near the upstream source (e.g., buses 1–2) maintain higher voltages, while voltages decline with electrical distance along the feeder, reaching their lowest levels around buses 8–13. Under a common defense budget (e.g., K ψ = 4 and fixed attack budget, the node-voltage distributions differ materially across scenarios. For the same setting, the MVD values for Scenarios 1–3 are 0.0793 p.u., 0.0884 p.u., and 0.0842 p.u., respectively—+11.47% and +6.18% for Scenarios 2 and 3 relative to Scenario 1. The RMS voltage deviations are 0.0356 p.u., 0.0392 p.u., and 0.0374 p.u., corresponding to +10.11% and +5.06% increases for Scenarios 2 and 3 versus Scenario 1.
In this test system, reducing PV capacity degrades voltage quality in more than an equal proportional reduction in DESS under the same adversarial setting. To reach VQR = 100%, halving PV requires two additional protected sites ( k : 4 → 6, +50%), whereas halving DESS requires one ( k : 4 → 5, +25%). At a common defense budget, the PV-reduction case exhibits larger deviations, higher MVD and RMS, than the DESS-reduction case, consistent with the steeper deterioration visible in bus-voltage profiles. Mechanistically, in our formulation, PV inverters provide both active power and local reactive-power support, while the modeled DESS primarily supplies active-power shifting subject to SOC/power limits; cutting PV therefore removes both P and local VAR in electrically weak buses, reducing the leverage of the lower-level voltage-correction layer and necessitating a larger protected set to meet the same VQR target.
From a planning and operations standpoint, these results indicate that Volt/VAR capabilities and the cyber-defense footprint act as partially substitutable levers for meeting a fixed voltage-quality target. Where dependable, PV VAR is maintained at voltage-sensitive locations, the target can be met with fewer hardened EVCS sites; when PV VAR is scarce or uncertain, the target can instead be achieved by enabling VAR-capable assets at high-sensitivity buses or by expanding the protected set. Accordingly, the planning model should jointly optimize defense allocation with Volt/VAR provisioning and DER siting, enforcing the VQR requirement as a hard constraint while minimizing total cost across two knobs: incremental VAR enablement and protection expansion. In real-time operations, the distributed energy resource management system (DERMS) should link adaptive protection priorities to forecasts of PV VAR availability and telemetry quality, with priority for hardening at PV-rich, voltage-sensitive buses where the loss of VAR would have an outsized impact.

5.4. Analysis of the Superiority of the Improved Implicit Enumeration Algorithm

  • Quality and search effort (Table 7).
Under the same model/data and solver tolerances (with K ψ = 6 ), IIE matches CE in solution quality while using far fewer outer evaluations. Across budgets B = 1 4 , IIE delivers solution quality that is identical to or better than CE: the defended/attacked EVCS sets and VQR coincide in most cases, and in the remaining case, IIE attains the same objective value (with respect to the bus-voltage-offset objective) while achieving a higher VQR, all with substantially fewer outer evaluations. In terms of search effort, CE evaluates all N B size- B defenses (12, 66, 220, and 495 evaluations for B = 1 , 2 , 3 , a n d   4 ), whereas IIE requires only 12, 23, 33, and 42 evaluations, respectively. At B = 3 , IIE uses about 15% of CE’s evaluations; at B = 4 , IIE reduces outer evaluations from 495 to 42 (a 91.5% reduction). These results confirm that IIE preserves solution quality and, in cases with objective ties, can select defenses with at least comparable (and here higher) compliance as measured by VQR, while sharply shrinking the outer search. Table 6 reports the defended and attacked sets, VQR, and outer evaluations for each budget.
  • Complexity perspective.
For the outer defense search, CE evaluates all size- B -defended sets among N candidates, i.e., O N B outer evaluations, upper-bounded by O 2 N . For fixed B it grows as O N B . Each outer evaluation calls the KKT-reduced inner model to obtain the operation-aware objective. IIE performs a branch-and-bound-style search with problem-guided upper and lower bounds plus pruning, which substantially reduces the explored space in practice. We do not provide a formal worst-case bound for IIE; the experiments in this subsection show large empirical savings in outer evaluations while preserving solution quality relative to CE.
Beyond iteration counts, we compare wall-clock time (Wall), aggregated CPU time across threads (CPU), and peak resident set size recorded by the operating system (Peak RSS) under identical settings. For the representative case B   =   4   over three runs (Table 7), IIE attains an average Wall of 121.41 s versus 865.88 s for CE (−86.0%, about 7.1× speedup) and an average CPU of 270.77 s versus 2693.41 s for CE (−89.9%, about 10×). Per-run Wall speedups range from 3.7× to 12.9×; per-run CPU speedups range from 7.8× to 12.7×. For the two runs with memory logging, Peak RSS averages 191.3 MB for IIE versus 209.7 MB for CE (about 8.8% lower). CPU time can exceed Wall because it aggregates across parallel solver threads. These measurements, together with the solution-quality parity in Table 7, show that IIE’s efficiency gains are manifested in runtime, not only in iteration counts.
  • Measurement protocol.
All comparisons use the same hardware and software stack and identical solver tolerances for IIE and CE: Ubuntu 22.04, Intel Xeon Gold 6348 at 2.6 GHz (2 sockets, 24 cores each), 128 GB RAM, Python 3.10, Gurobi 10.0.3 with eight threads.

5.5. Comparison with Column-and-Constraint Generation

The C&CG algorithm decomposes the original problem into a master problem and a subproblem and iteratively generates new columns or constraints. This strategy can handle large-scale instances and reduce computational burden. However, its performance hinges on well-designed generation rules; in nonconvex settings it may stall or become trapped in locally optimal regions and fail to reach the global optimum.
By contrast, the IIE method employs a systematic branch-and-bound search that does not rely on local information and, upon completion, certifies global optimality, thereby mitigating the risk of premature local convergence. IIE is particularly advantageous when decisions are 0–1: (i) a predictive pruning mechanism discards unpromising branches early, avoiding redundant computation; and (ii) the discreteness of integer variables enables a hierarchical search structure that markedly improves global search efficiency. To assess IIE’s suitability for defense-resource allocation with many 0–1 variables, we conduct a head-to-head comparison between IIE and C&CG.
When the defense-resource budget is   B = 1 , IIE attains the optimal defense allocation within 12 outer evaluations, whereas C&CG stalls and does not reach a final solution under the same evaluation budget—likely because the generated columns/constraints did not sufficiently tighten the relaxation or effectively guide the master toward the optimum, impeding convergence. This performance gap highlights IIE’s dual advantages: at the algorithmic level, its deterministic search avoids solution-space distortions caused by suboptimal column/constraint generation; at the problem level, explicitly enumerating discrete decision combinations makes IIE especially suitable for resource-allocation problems with numerous 0–1 variables.

6. Conclusions

This paper addresses cybersecurity-aware defense-resource optimization for transport–power networks and formulates a tri-level DAC model in a Stackelberg framework. The information-security defense problem is cast as multi-agent sequential decision-making, with the objective of mitigating bus-voltage deviations under FDIAs via proactive defense allocation. To solve the tri-level program, we propose a KKT-reduced solution framework combined with IIE. Performance is evaluated using MVD, RMS voltage deviation, and VQR.
Simulation results validate the approach: hardening key EVCS sites prevents attack-induced voltage violations and reveals a synergy between defense allocation and physical dispatch. Compared with CE, the KKT-reduced model with IIE provides an operation-aware security assessment and scalable defense planning for EVCS-centric threats, achieving target voltage quality with substantially fewer outer evaluations. Under identical settings, IIE attains the same defended sets and voltage outcomes as CE while reducing outer evaluations by up to 91.5%, demonstrating a clear computational-efficiency advantage.
Future work will pursue three thrusts:
(i)
Frequency-aware resilience. Extend the DAC architecture to frequency stability by modeling convex proxies for system frequency response—nadir, rate of change in frequency, and automatic generation control/area control error—and co-optimize DESS and EV fast-frequency-response headroom together with hardening of frequency-critical telemetry and control channels.
(ii)
Uncertainty and co-design. Develop multi-period, uncertainty-aware scheduling that couples traffic-demand and PV-output variability with adversarial perturbations, while jointly designing detection and defense via robust state estimation and anomaly aware reweighting.
(iii)
Scalability and validation. Scale the framework to city-scale, unbalanced three-phase networks using decomposition, parallelization, and learning-guided pruning; release open benchmarks, a reference solver, and digital-twin co-simulation to enable reproducible validation.

Author Contributions

Conceptualization, Y.L. (Yuheng Liu) and W.L.; Data Curation, Y.L. (Yuheng Liu), W.L. and Y.L. (Yan Li); Project Administration, J.L.; Formal analysis, Y.X. and T.Q.; Funding Acquisition, Q.H.; Methodology, W.L. and Q.H.; Resources, Y.X. and Y.L. (Yan Li); Software, Y.X. and T.Q.; Supervision, Q.H.; Validation, J.L.; Visualization, Y.X., Y.L. (Yan Li) and J.Y.; Writing—Original Draft, Y.L. (Yuheng Liu) and T.Q.; Writing—Review and Editing, J.Y., W.L. and J.L. All authors have read and agreed to the published version of the manuscript.

Funding

This research was funded by the State Grid Jiangsu Electric Power Co., Ltd. Science and Technology Project (J2023123).

Data Availability Statement

The data supporting this study originate from State Grid Jiangsu Electric Power Co., Ltd. and are subject to contractual confidentiality and grid-security restrictions; therefore, they are not publicly available but may be obtained from the corresponding author upon reasonable request and with permission from the data owner.

Conflicts of Interest

Authors Yuheng Liu, Wenteng Liang, Jie Li, Yufeng Xiong, Yan Li were employed by the company State Grid Jiangsu Electric Power Co., Ltd. The remaining authors declare that the research was conducted in the absence of any commercial or financial relationships that could be construed as a potential conflict of interest. The authors declare that this study received funding from the State Grid Jiangsu Electric Power Co., Ltd. Science and Technology Project (J2023123). The funder was not involved in the study design, collection, analysis, interpretation of data, the writing of this article or the decision to submit it for publication.

Abbreviations

The following abbreviations are used in this manuscript:
EVCSElectric vehicle charging station
EVElectric vehicle
V2GVehicle-to-grid
FDIAFalse data injection attack
UE-TAPUser-equilibrium traffic assignment
DADDefense–attack–defense
C&CGColumn-and-constraint generation
PVPhotovoltaic
KKTKarush–Kuhn–Tucker
IIEImproved implicit enumeration
MVDMaximum voltage deviation
RMSRoot-mean-square
VQRVoltage qualification rate
DESSDistributed energy storage systems
MIPBi-level mixed-integer program
MIQPMixed-integer quadratic programming
CEComplete enumeration
DERDistributed energy resources
p.u.Per-unit
PV VARReactive power from PV inverters
WallWall-clock time
RSSResident set size
DACDefense–attack–correction

References

  1. Acharya, S. Cybersecurity of Electric Vehicle Charging. Doctoral Dissertation, New York University Tandon School of Engineering, Brooklyn, NY, USA, 2022. [Google Scholar]
  2. Qian, T.; Fang, M.; Hu, Q.; Shao, C.; Zheng, J. V2Sim: An Open-Source Microscopic V2G Simulation Platform in Urban Power and Transportation Network. arXiv 2024. [Google Scholar] [CrossRef]
  3. Ribas Monteiro, L.F.; Rodrigues, Y.R.; Zambroni De Souza, A.C. Cybersecurity in Cyber–Physical Power Systems. Energies 2023, 16, 4556. [Google Scholar] [CrossRef]
  4. Wang, B.; Dehghanian, P.; Wang, S.; Mitolo, M. Electrical Safety Considerations in Large-Scale Electric Vehicle Charging Stations. IEEE Trans. Ind. Appl. 2019, 55, 6603–6612. [Google Scholar] [CrossRef]
  5. Zhang, Y.; Xu, T.; Chen, T.; Hu, Q.; Chen, H.; Hu, X.; Jiang, Z. A High-Resolution Electric Vehicle Charging Transaction Dataset with Multidimensional Features in China. Sci. Data 2025, 12, 643. [Google Scholar] [CrossRef]
  6. Babu, P.R.; Palaniswamy, B.; Reddy, A.G.; Odelu, V.; Kim, H.S. A Survey on Security Challenges and Protocols of Electric Vehicle Dynamic Charging System. Secur. Priv. 2022, 5, e210. [Google Scholar] [CrossRef]
  7. Antoun, J.; Kabir, M.E.; Moussa, B.; Atallah, R.; Assi, C. A Detailed Security Assessment of the EV Charging Ecosystem. IEEE Netw. 2020, 34, 200–207. [Google Scholar] [CrossRef]
  8. Fraiji, Y.; Ben Azzouz, L.; Trojet, W.; Saidane, L.A. Cyber Security Issues of Internet of Electric Vehicles. In Proceedings of the 2018 IEEE Wireless Communications and Networking Conference (WCNC), Barcelona, Spain, 15–18 April 2018; pp. 1–6. [Google Scholar] [CrossRef]
  9. Subran, A.K.; Sankaran, S.; Sutraye, P.; Nishad, A.K. Threat Modeling and Attack Simulation of Charging Infrastructures in Electric Vehicles. In Proceedings of the 2024 15th International Conference on Computing Communication and Networking Technologies (ICCCNT), Kamand, India, 24–28 June 2024; pp. 1–7. [Google Scholar] [CrossRef]
  10. Sepehrzad, R.; Faraji, M.J.; Al-Durra, A.; Sadabadi, M.S. Enhancing Cyber-Resilience in Electric Vehicle Charging Stations: A Multi-Agent Deep Reinforcement Learning Approach. IEEE Trans. Intell. Transp. Syst. 2024, 25, 18049–18062. [Google Scholar] [CrossRef]
  11. Qian, T.; Ming, W.; Shao, C.; Hu, Q.; Wang, X.; Wu, J.; Wu, Z. An Edge Intelligence-Based Framework for Online Scheduling of Soft Open Points with Energy Storage. IEEE Trans. Smart Grid 2024, 15, 2934–2945. [Google Scholar] [CrossRef]
  12. Gorzałczany, M.B.; Rudziński, F. Detection and Localization of False Data Injection Attacks in Smart Grids Applying an Interpretable Fuzzy Genetic Machine Learning/Data Mining Approach. Energies 2025, 18, 1568. [Google Scholar] [CrossRef]
  13. Radhoush, S.; Vannoy, T.; Liyanage, K.; Whitaker, B.M.; Nehrir, H. Distribution System State Estimation and False Data Injection Attack Detection with a Multi-Output Deep Neural Network. Energies 2023, 16, 2288. [Google Scholar] [CrossRef]
  14. Kausar, F.; Deo, S.; Hussain, S.; Ul Haque, Z. Federated Deep Learning Model for False Data Injection Attack Detection in Cyber Physical Power Systems. Energies 2024, 17, 5337. [Google Scholar] [CrossRef]
  15. Alcaraz, C.; Lopez, J.; Wolthusen, S. OCPP Protocol: Security Threats and Challenges. IEEE Trans. Smart Grid 2017, 8, 2452–2459. [Google Scholar] [CrossRef]
  16. Ghafouri, M.; Kabir, E.; Moussa, B.; Assi, C. Coordinated Charging and Discharging of Electric Vehicles: A New Class of Switching Attacks. ACM Trans. Cyber-Phys. Syst. 2022, 6, 1–26. [Google Scholar] [CrossRef]
  17. Kabir, M.E.; Ghafouri, M.; Moussa, B.; Assi, C. A Two-Stage Protection Method for Detection and Mitigation of Coordinated EVSE Switching Attacks. IEEE Trans. Smart Grid 2021, 12, 4377–4388. [Google Scholar] [CrossRef]
  18. Wei, F.; Lin, X. Cyber-Physical Attack Launched from EVSE Botnet. IEEE Trans. Power Syst. 2024, 39, 3603–3614. [Google Scholar] [CrossRef]
  19. Soykan, E.U.; Bagriyanik, M.; Soykan, G. Disrupting the Power Grid via EV Charging: The Impact of the SMS Phishing Attacks. Sustain. Energy Grids Netw. 2021, 26, 100477. [Google Scholar] [CrossRef]
  20. Acharya, S.; Mieth, R.; Karri, R.; Dvorkin, Y. False Data Injection Attacks on Data Markets for Electric Vehicle Charging Stations. Adv. Appl. Energy 2022, 7, 100098. [Google Scholar] [CrossRef]
  21. Nasr, T.; Torabi, S.; Bou-Harb, E.; Fachkha, C.; Assi, C. Power Jacking Your Station: In-Depth Security Analysis of Electric Vehicle Charging Station Management Systems. Comput. Secur. 2022, 112, 102511. [Google Scholar] [CrossRef]
  22. Bo, X.; Qu, Z.; Wang, L.; Dong, Y.; Zhang, Z.; Wang, D. Active Defense Research against False Data Injection Attacks of Power CPS Based on Data-Driven Algorithms. Energies 2022, 15, 7432. [Google Scholar] [CrossRef]
  23. Aljohani, T.; Almutairi, A. A Comprehensive Survey of Cyberattacks on EVs: Research Domains, Attacks, Defensive Mechanisms, and Verification Methods. Def. Technol. 2024, 42, 31–58. [Google Scholar] [CrossRef]
  24. Liberati, F.; Garone, E.; Di Giorgio, A. Review of Cyber-Physical Attacks in Smart Grids: A System-Theoretic Perspective. Electronics 2021, 10, 1153. [Google Scholar] [CrossRef]
  25. Qian, T.; Liang, Z.; Shao, C.; Guo, Z.; Hu, Q.; Wu, Z. Unsupervised Learning for Efficiently Distributing EVs Charging Loads and Traffic Flows in Coupled Power and Transportation Systems. Appl. Energy 2025, 377, 124476. [Google Scholar] [CrossRef]
  26. Smith, M.D.; Paté-Cornell, M.E. Cyber Risk Analysis for a Smart Grid: How Smart Is Smart Enough? A Multiarmed Bandit Approach to Cyber Security Investment. IEEE Trans. Eng. Manag. 2018, 65, 434–447. [Google Scholar] [CrossRef]
  27. Zhao, Y.; Cao, Y.; Li, Y.; Li, Z.; Yao, W.; Shi, X. Robust Substation Enhancement Strategy for Allocating the Defensive Resource against the Cyber-Attacks on IEDs. IEEE Trans. Ind. Inform. 2024, 20, 3539–3550. [Google Scholar] [CrossRef]
  28. Tang, X.; Sun, R.; Tan, Y.; Zhao, Y. IED-Attacks Oriented Robust Optimization Model of Defender-Attacker-Defender forMultiple Substations. Proc. CSU-EPSA 2024, 36, 124–134. [Google Scholar]
  29. Wen, J.; Gan, W.; Chu, C.-C.; Jiang, L.; Luo, J. Robust Resilience Enhancement by EV Charging Infrastructure Planning in Coupled Power Distribution and Transportation Systems. IEEE Trans. Smart Grid 2025, 16, 491–504. [Google Scholar] [CrossRef]
  30. Shan, X.G.; Zhuang, J. A Game-Theoretic Approach to Modeling Attacks and Defenses of Smart Grids at Three Levels. Reliab. Eng. Syst. Saf. 2020, 195, 106683. [Google Scholar] [CrossRef]
  31. Qian, T.; Liang, Z.; Chen, S.; Hu, Q.; Wu, Z. A Tri-Level Demand Response Framework for EVCS Flexibility Enhancement in Coupled Power and Transportation Networks. IEEE Trans. Smart Grid 2025, 16, 598–611. [Google Scholar] [CrossRef]
  32. Shao, C.-W.; Li, Y.-F. Optimal Defense Resources Allocation for Power System Based on Bounded Rationality Game Theory Analysis. IEEE Trans. Power Syst. 2021, 36, 4223–4234. [Google Scholar] [CrossRef]
  33. Liang, Z.; Qian, T.; Shao, C.; Hu, Q.; Wu, Z.; Xu, Q.; Zheng, J. A Strategic EV Charging Networks Planning Framework for Intercity Highway With Time-Expanded User Equilibrium. IEEE Trans. Smart Grid 2025. [Google Scholar] [CrossRef]
  34. Zhang, Y.; Zou, B.; Jin, X.; Luo, Y.; Song, M.; Ye, Y.; Hu, Q.; Chen, Q.; Zambroni, A.C. Mitigating Power Grid Impact from Proactive Data Center Workload Shifts: A Coordinated Scheduling Strategy Integrating Synergistic Traffic—Data—Power Networks. Appl. Energy 2025, 377, 124697. [Google Scholar] [CrossRef]
  35. Dong, Z.; Tian, M.; Tang, M.; Liang, J. Power Generation Allocation of Cyber–Physical Power Systems from a Defense–Attack–Defense Perspective. Int. J. Electr. Power Energy Syst. 2024, 156, 109690. [Google Scholar] [CrossRef]
  36. Zhao, Z.; Shang, Y.; Qi, B.; Wang, Y.; Sun, Y.; Zhang, Q. Research on Defense Strategies for Power System Frequency Stability under False Data Injection Attacks. Appl. Energy 2024, 371, 123711. [Google Scholar] [CrossRef]
  37. Drake, D.; Mavikumbure, H.S.; Cobilean, V.; Manic, M. Cyber-Physical Security Trends of EV Charging Systems: A Survey. In Proceedings of the IECON 2024—50th Annual Conference of the IEEE Industrial Electronics Society, Chicago, IL, USA, 3–6 November 2024; pp. 1–8. [Google Scholar] [CrossRef]
  38. Ren, L.; Binyuan, Y.; Hengdao, G.; Junrong, L.; Yihua, Z.; Yun, F.; Liang, T.; Zeyuan, Z. Research on Relay Setting Attack Defense in Power Systems Based on a Three-Layer Optimization Model. Front. Energy Res. 2024, 12, 1502078. [Google Scholar] [CrossRef]
  39. Li, X.; Li, W.; Wang, N.; Li, L.; Gong, X. Resilience Enhancement by Line Hardening for Communication Routing Considering Renewable Energy Sources in Cyber-physical Power Systems. IET Renew. Power Gener. 2024, 18, 2477–2495. [Google Scholar] [CrossRef]
  40. Wang, F.; Zhuge, C.; Chen, A. Data-Driven Vulnerability Analysis of Shared Electric Vehicle Systems to Cyberattacks. Transp. Res. Part D Transp. Environ. 2024, 135, 104379. [Google Scholar] [CrossRef]
  41. Naderi, E.; Asrari, A.; Fajri, P. False Data Injection Cyberattacks Targeting Electric Vehicles in Smart Power Distribution Systems. In Proceedings of the 2024 IEEE Transportation Electrification Conference and Expo (ITEC), Chicago, IL, USA, 19–21 June 2024; pp. 1–5. [Google Scholar] [CrossRef]
  42. Elshazly, A.A.; Elgarhy, I.; Eltoukhy, A.T.; Mahmoud, M.; Eberle, W.; Alsabaan, M.; Alshawi, T. False Data Injection Attacks on Reinforcement Learning-Based Charging Coordination in Smart Grids and a Countermeasure. Appl. Sci. 2024, 14, 10874. [Google Scholar] [CrossRef]
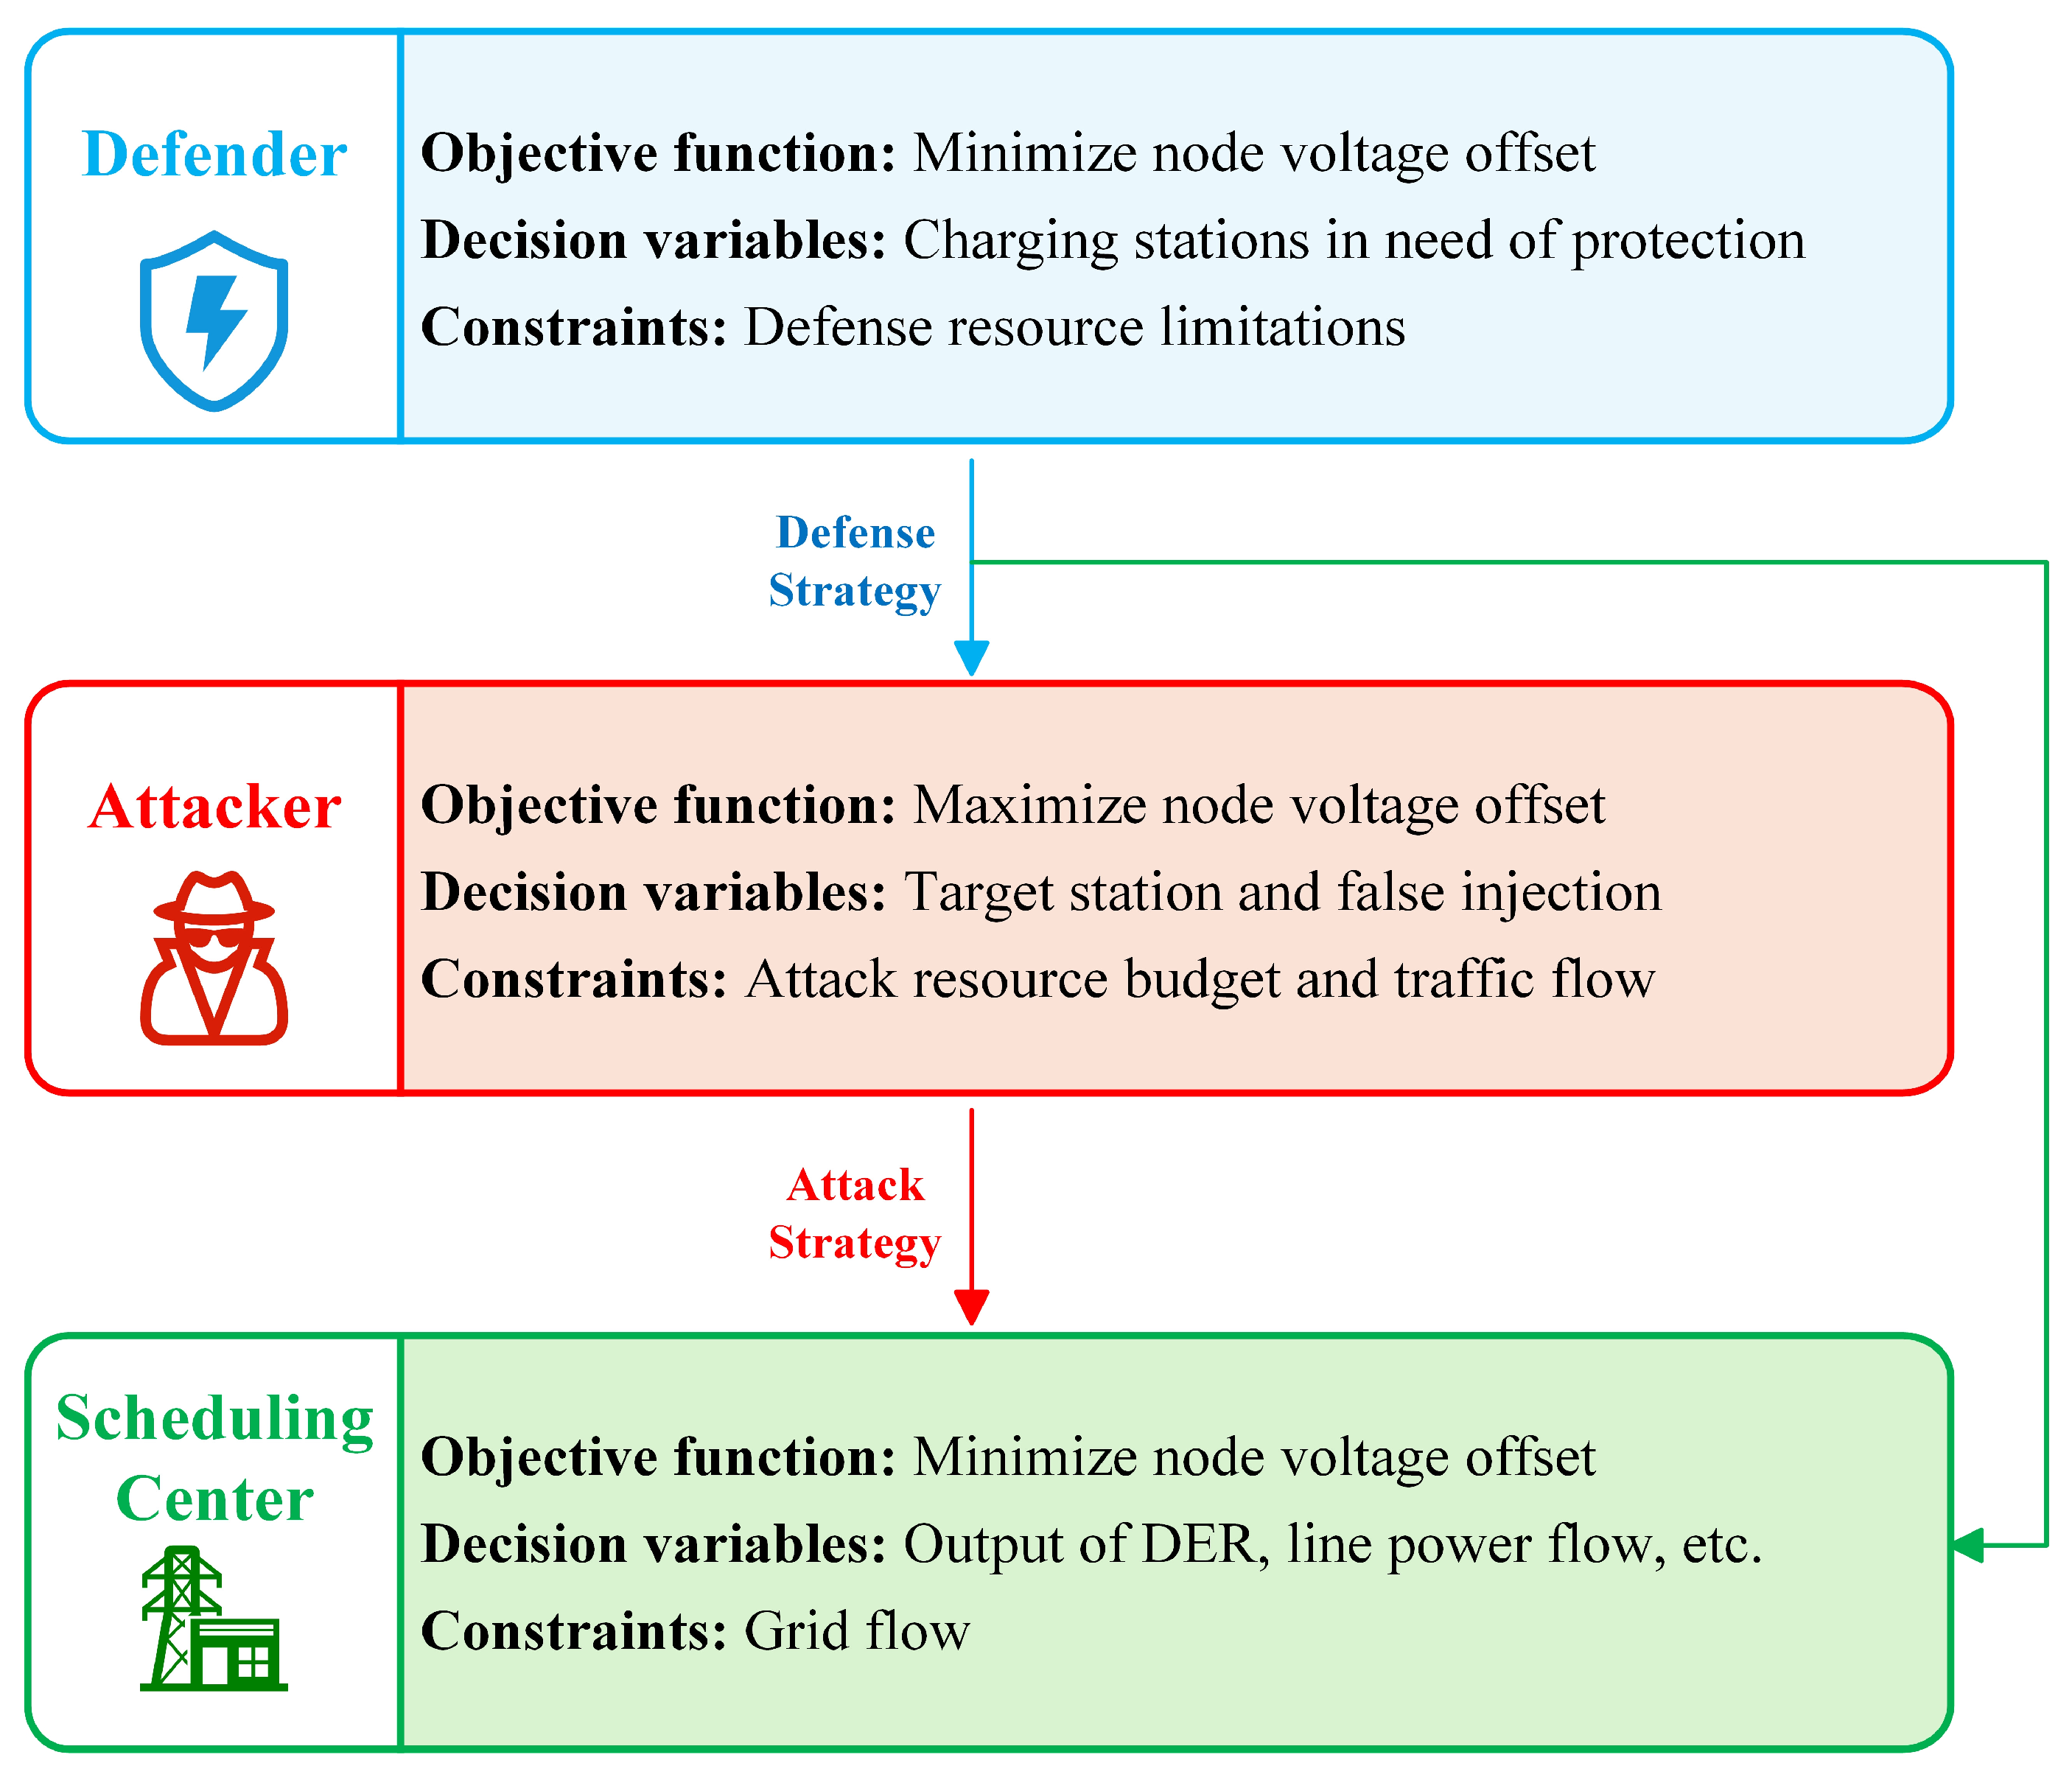
Figure 1. Stackelberg formulation of the DAC problem.
Energies 18 05855 g001
Figure 2. End-to-end workflow for transport–power co-simulation and EVCS defense planning.
Energies 18 05855 g002
Figure 3. Model solution process based on the improved implicit enumeration method.
Energies 18 05855 g003
Figure 4. Power–transportation topology with EVCS couplings and DER siting.
Energies 18 05855 g004
Figure 5. Charging and discharging dower of EVCSs.
Energies 18 05855 g005
Figure 6. K ψ = 6 bus-voltage profiles.
Energies 18 05855 g006
Figure 7. Voltage in Scenario 1.
Energies 18 05855 g007
Figure 8. Voltage in Scenario 2.
Energies 18 05855 g008
Figure 9. Voltage in Scenario 3.
Energies 18 05855 g009
Figure 10. Comparison of voltages across scenarios (common defense budget).
Energies 18 05855 g010
Table 1. EVCS-based mapping between transportation nodes and distribution buses.
Transportation NodeDistribution BusTransportation NodeDistribution Bus
1177
215810
317911
491012
531113
651214
Table 2. Defense resource allocation results.
Defense Resource BudgetProtected EVCSAttacked EVCSMVD (p.u.)RMS (p.u.)VQR
141, 7, 8, 10, 11, 120.10060.043961.11%
24, 111, 6, 7, 8, 10, 120.09480.042366.67%
34, 7, 111, 6, 8, 9, 10, 120.08970.039077.78%
44, 7, 10, 111, 2, 3, 6, 9, 120.07870.0354100.00%
Table 3. Research S = scenarios.
Scenario NumberDESSPV
1
250% Reduction
350% Reduction
Table 4. Defense resource allocation results in Scenario 1.
Defense Resource BudgetProtected EVCSMVD (p.u.)RMS (p.u.)VQR
140.10500.046255.56%
24, 110.09470.043550.00%
34, 7, 110.08910.039283.33%
44, 7, 10, 110.07930.0356100.00%
Table 5. Defense resource allocation results in Scenario 2.
Defense Resource BudgetProtected EVCSMVD (p.u.)RMS (p.u.)VQR
140.11010.048955.56%
24, 110.09670.046455.56%
34, 7, 110.09550.043055.56%
44, 7, 10, 110.08840.039277.78%
54, 6, 7, 10, 110.08180.036983.33%
64, 6, 7, 9, 10, 110.07670.0341100%
Table 6. Defense resource allocation results in Scenario 3.
Defense Resource BudgetProtected EVCSMVD (p.u.)RMS (p.u.)VQR
140.10830.047455.56%
24, 110.09570.044955.56%
34, 7, 110.09310.040961.11%
44, 7, 10, 110.08420.037488.88%
54, 6, 7, 10, 110.07890.0352100.00%
Table 7. Comparison between complete enumeration and improved implicit enumeration.
Defense Resource BudgetSolution MethodProtected EVCSAttacked EVCSVQROuter Evaluations
1CE41, 7, 8, 10, 11, 1261.11%12
IIE41, 7, 8, 10, 11, 1261.11%12
2CE7, 111, 4, 6, 8, 10, 1261.11%66
IIE4, 111, 6, 7, 8, 10, 1266.67%23
3CE4, 7, 111, 6, 8, 9, 10, 1277.78%220
IIE4, 7, 111, 6, 8, 9, 10, 1277.78%33
4CE4, 7, 10, 111, 2, 3, 6, 9, 12100.00%495
IIE4, 7, 10, 111, 2, 3, 6, 9, 12100.00%42
Table 8. Runtime and memory under identical settings (B = 4).
RunAlgoWall (s)CPU (s)Outer EvalsPeak RSS (MB)
1CE878.3562511.781495209.7
IIE80.105321.20342191.3
2CE794.6272686.250495209.8
IIE212.322211.29742190.3
3CE924.6652882.203495209.6
IIE71.797279.81242192.3
Avg.CE865.8802693.410495209.7
IIE121.410270.77042191.3
Disclaimer/Publisher’s Note: The statements, opinions and data contained in all publications are solely those of the individual author(s) and contributor(s) and not of MDPI and/or the editor(s). MDPI and/or the editor(s) disclaim responsibility for any injury to people or property resulting from any ideas, methods, instructions or products referred to in the content.