Article

Kinetic Study on Pyrolysis of Tung Seed Shells and In Situ Characterization by Using TG–FTIR Analysis

1
School of Environmental Science and Engineering, Shanghai Jiao Tong University, Shanghai 200240, China
2
State Key Laboratory of Non-Food Biomass and Enzyme Technology, Guangxi Key Laboratory of Bio-Refinery, Institute of Eco-Environmental Research, Guangxi Academy of Sciences, Nanning 530007, China
*
Authors to whom correspondence should be addressed.
Energies 2025, 18(21), 5842; https://doi.org/10.3390/en18215842
Submission received: 23 September 2025 / Revised: 28 October 2025 / Accepted: 4 November 2025 / Published: 5 November 2025
(This article belongs to the Special Issue Biomass to Liquid Fuels)

Abstract

This study investigates the pyrolysis behavior of tung seed shells (TSSs), an underutilized lignocellulosic residue from Vernicia fordii, using thermogravimetric analysis (TGA) and in situ TG–FTIR spectroscopy. The thermal decomposition process was found to occur in multiple stages, corresponding to the sequential degradation of hemicellulose, cellulose, and lignin. Particle size and heating rate strongly influenced the decomposition profile, with finer particles exhibiting enhanced devolatilization due to improved heat and mass transfer. Kinetic analysis using the Coats–Redfern, Doyle, and Kissinger methods revealed apparent activation energies ranging from 30 to 122 kJ/mol, consistent with typical values for lignocellulosic biomass. The evolution of gaseous species, including CO, CO2, and CH4, throughout all pyrolysis stages confirms the potential of TSSs for bio-syngas and biochar production. These findings provide new insights into the kinetic and mechanistic characteristics of tung seed shell pyrolysis and support its application as a renewable feedstock for sustainable bioenergy generation.

1. Introduction

In the quest for sustainable and low-carbon energy solutions, biomass pyrolysis has emerged as a promising thermochemical approach for converting abundant lignocellulosic materials into high-value gaseous fuels, primarily CO, H2, and hydrocarbons [1,2,3]. The syngas provides a cleaner alternative to conventional fossil fuels, enhancing energy efficiency and reducing pollutant emissions. Its versatility in applications such as power generation, heating, and syngas synthesis highlights their strategic importance in the renewable energy sector. A comprehensive understanding of pyrolysis mechanisms, product distribution, and reaction kinetics is crucial for optimizing and scaling up biomass-to-gas conversion processes. The pyrolytic conversion of locally abundant biomass resources and biomass processing residues into biogas holds significant implications for both environmental remediation and the improvement of local economies.
Tung seed shells, by-products of tung oil extraction from Vernicia fordii, represent a major lignocellulosic residue that is widely generated but underutilized in regions such as China, India, and the United States [4]. These shells, composed mainly of cellulose, hemicellulose, and lignin, possess favorable thermal properties for pyrolytic conversion [5]. However, systematic kinetic studies on their thermal degradation behavior remain limited. Previous research has explored their gasification and thermal decomposition in downdraft gasifiers under various heating rates [6,7], revealing relatively low thermal stability but lacking detailed kinetic parameterization. The inherent challenges arise from the complex organic matrix, multistage decomposition dynamics, and sensitivity to operational variables, which complicate reliable kinetic modeling and hinder broader application.
Accurate determination of kinetic parameters, including apparent activation energy, reaction order, and pre-exponential factors, is essential for modeling biomass pyrolysis and guiding reactor design, process control, and scale-up. Thermogravimetric analysis (TGA) [8], combined with kinetic modeling techniques such as the Coats–Redfern [9], Doyle [10], Kissinger [11], and distributed activation energy models (DAEM) [12], has proven effective in elucidating pyrolytic behavior across various biomasses. For tung seed shells, conducting such rigorous kinetic analysis would not only clarify its thermal decomposition stages and energy barriers but also support its optimized utilization in energy recovery systems. This study, therefore, employs TGA and multiple kinetic modeling approaches to extract the dynamic pyrolysis parameters of tung seed shell, aiming to address existing research gaps and enhance its potential as a valuable renewable energy feedstock.
In this study, we utilized the solid waste derived from the tung seed shells of Vernicia fordii (Millennium Tung) as the biomass feedstock locally abundant in Guangxi, China. Thermogravimetric analysis (TGA) was conducted to examine the distinct pyrolysis stages, and mathematical models were developed to determine the apparent activation energy of the pyrolysis process. Furthermore, Thermogravimetry–Fourier transform infrared (TG–FTIR) spectroscopy was employed to analyze the gaseous products formed during pyrolysis. By integrating the results of kinetic modeling, this approach provides a deeper understanding of the reaction mechanisms involved in the energy conversion of tung seed shells and similar biomass wastes, as well as their potential for practical applications. The novelty of this work lies in the comprehensive kinetic investigation of tung seed shell pyrolysis through the combined application of the Coats–Redfern, Doyle, and Kissinger models, enabling a systematic comparison of their applicability and reliability in describing biomass pyrolysis kinetics. In addition, the integration of thermogravimetric analysis (TGA), differential scanning calorimetry (DSC), and in situ TG–FTIR spectroscopy allows real-time monitoring of gaseous product evolution, providing deeper insight into the multi-stage decomposition behavior and gas formation pathways of tung seed shells. Furthermore, the effects of particle size and heating rate on the apparent activation energy and reaction mechanism are quantitatively elucidated, offering valuable guidance for optimizing bio-gas production from oil-rich biomass residues. Collectively, these findings establish a solid theoretical and experimental foundation for the thermochemical valorization of tung seed shells and other lignocellulosic wastes.

2. Materials and Methods

The raw material used in this experiment was the shell of Vernicia fordii (tung oil tree), obtained from tung nuts produced in Bobai County, Guangxi (22°16′5″ N, 109°58′41″ E). The shell accounted for 38.70% of the tung nuts. Elemental analysis was determined using a German Elementar Vario EL III. Prior to analysis, the tung seed shells were air-dried at 105 °C for 12 h to remove residual moisture until a constant weight was obtained. The dried samples were then cooled in a desiccator and stored in airtight containers before further analysis, ensuring negligible influence on subsequent thermogravimetric measurements and kinetic parameter evaluation. TSS samples were grounded using a high-speed mill. The resulting powder was sieved through a standard vibrating sieve to obtain fractions of different particle sizes. Eight representative size ranges were collected for kinetic and thermal analyses: ≥380 μm, 250–380 μm, 180–250 μm, 150–180 μm, 120–150 μm, 109–120 μm, 96–109 μm, and ≤75 μm. These size fractions were selected to evaluate the effect of particle size on the pyrolysis behavior and kinetic parameters of tung seed shells. The proximate and ultimate analyses were performed using the samples of uniform particle size (160–180 mesh), and the results are presented in Table 1.
Thermogravimetric analysis (TGA) was carried out using a Q50 thermogravimetric analyzer (TA Instruments, New Castle, DE, USA). Approximately 20 mg of the sample was placed in a ceramic crucible and heated from 30 °C to 800 °C at heating rates of 30 °C/min, 40 °C/min, 50 °C/min, 60 °C/min and 70 °C/min under a high-purity nitrogen flow of 30 mL/min. Before heating, the ground sample was maintained at 30 °C for 10 min to ensure thermal equilibrium. After reaching the maximum temperature of 800 °C, the ground sample was held isothermally for 20 min to complete devolatilization and carbonization. No combustion or oxidation step was performed after pyrolysis, as all experiments were carried out under an inert nitrogen atmosphere to avoid secondary oxidation reactions.
Differential Scanning Calorimetry (DSC) analysis was performed using a TA Instruments Q20 calorimeter to investigate the thermal behavior of tung seed shell powder. Approximately 5–10 mg of finely ground sample (160–180 mesh) was accurately weighed and sealed in a hermetic aluminum pan, with an empty sealed pan used as the reference. The measurements were carried out under a nitrogen atmosphere (flow rate: 50 mL/min) to prevent oxidation during heating. The sample was heated from room temperature to 380 °C at a constant heating rate ranging from 5 to 20 °C /min. Thermal events were recorded as heat flow (mW) versus temperature. All data were analyzed using TA Universal Analysis software v5.5.24.
Thermogravimetry–Fourier transform infrared spectroscopy (TG–FTIR) analysis was conducted using a NETZSCH STA 449 F3 Jupiter (NETZSCH, Selb, Germany) thermobalance coupled with a Bruker Tensor 27 FTIR spectrometer (Bruker, Billerica, MA, USA). Approximately 10 mg of 160–180 mesh sample was heated at heating rates of 5, 7.5, 10, 12.5, 15 and 20 °C/min and held isothermally for 150 min under a nitrogen atmosphere (60 mL/min). The evolved gases were continuously transferred through a heating line (maintained at 250 °C) to the FTIR gas cell. Spectra were collected every 30 s over a range of 4000–500 cm−1 with a resolution of 4 cm−1. This setup enabled real-time monitoring of volatile organic species released under isothermal decomposition conditions.
The pyrolysis reaction of tung seed shell can be briefly expressed as follows:
A ( s ) k B ( s ) + C ( g )
Assuming the initial mass fraction of the sample is w 0 , the sample undergoes a decomposition reaction during a programmed temperature increase. At a given time t , its mass fraction becomes w . The thermal decomposition kinetics can then be expressed as follows:
d a d t = k f ( a )
In Equation (2), a = w 0 w w 0 w × 100 % represents the rate of weight loss during the pyrolysis reaction process; w denotes the final residual mass fraction. Assuming that the pyrolysis reaction rate k follows the Arrhenius equation, it can be expressed as follows:
k = A   exp ( E R T )
In Equation (3), A is the pre-exponential factor, E is the apparent activation energy, R is the universal gas constant, T is the absolute temperature. It is usually assumed that the function f ( a ) is independent of both T and t , and depends only on the conversion degree, a. For a simple reaction, f ( a ) = ( 1 a ) n , when heating rate β = d T d t is constant, Equation (2) can be rewritten as:
d a a T = A β exp ( E R T ) ( 1 a ) n
The adoption of different approach to Equation (4) can yield various mathematical models for describing pyrolysis kinetics.
When the Coats–Redfern method [13] is applied, separating the variables and integrating Equation (4) leads to the following approximate expression:
When n = 1 , it can be simplified as:
ln [ ln 1 a T 2 ] = ln [ A β R E exp ( 1 2 R T E ) ] E R T
ln [ 1 ( 1 a ) 1 n T 2 ( 1 n ) ] = ln [ A β R E exp ( 1 2 R T E ) ] E R T
For most cases of pyrolysis, the value of 2 R T E is much less than 1, so the first terms on the right-hand side of Equations (5) and (6) can be considered constants. Therefore, when n = 1, the plot is generated using g ( a ) = ln [ ln 1 a T 2 ] and 1 T ; when n ≠ 1, the plot is obtained using g ( a ) = ln [ 1 ( 1 a ) 1 n T 2 ( 1 n ) ] . If the selected value of n is correct, the plot will be a straight line, from which the slope and intercept can be used to determine the apparent activation energy E and the pre-exponential factor A .
Using the approximate integration method (Doyle method [14]), the solution to Equation (4) is obtained by separating variables and integrating as follows:
ln β = ln [ A E R 1 F a ] 2 ln ( E R T ) E R T
In Equation (7), F ( a ) = 0 a d a f ( a ) , when a specific value of a is selected, the corresponding value of f ( a ) is considered constant, and 2 ln ( E R T ) is assumed to vary negligibly. With the experimental values of the heating rate β at the same selected a , ln β and 1 T are linear related, where the slope represents the E .
When the maximum rate method (Kissinger method [15]) is applied, Equation (4) is differentiated with respect to T . Assuming n = 1 , the following expression is obtained:
d 2 a d T 2 = A β exp ( E R T ) ( E R T 2 ) ( 1 a ) d a d T
When T = T max , d 2 a d T 2 = 0 , Equation (8) can be transferred into:
d a d T = ( E R T 2 ) ( 1 a )
By substituting Equation (9) into Equation (4), taking the natural logarithm of both sides, and rearranging, the following expression is obtained:
ln β T 2 = ln A R E E R T
A straight line can be obtained by plotting versus ln β T 2 and 1 T . The apparent activation energy E can then be determined from the slope of the line, while the pre-exponential factor A can be calculated from the intercept.
The fitting of the Coats–Redfern, Doyle, and Kissinger models to the experimental thermogravimetric data was performed using MATLAB (R2023b). The objective function for model fitting was defined as the sum of squared residuals (SSR) between the experimental conversion degree ( a exp ) and the calculated conversion degree ( a calc ), expressed as:
SSR = i = 1 n ( a exp , i a calc , i ) 2
The apparent activation energy (Ea) and pre-exponential factor (A) were determined by minimizing SSR using a nonlinear least-squares fitting algorithm. This procedure ensures the best agreement between experimental data and model predictions. The fitting accuracy was further evaluated by calculating the linear correlation coefficient (R), with |R| > 0.98 indicating a strong correlation between experimental and modeled results.
The three selected kinetic models including Coats–Redfern, Doyle, and Kissinger were employed to provide a comparative evaluation of apparent activation energies under different heating rates. Although the Coats–Redfern method assumes a single-step reaction mechanism, it remains widely applied for preliminary kinetic estimation of lignocellulosic biomass, particularly when combined with multi-heating-rate data. This study adopts a comparative approach rather than a full isoconversional analysis, aiming to clarify the influence of particle size and heating rate on the apparent kinetic parameters of tung seed shell pyrolysis [16,17,18]. The approach is consistent with recent kinetic studies on biomass and co-pyrolysis systems [19,20,21,22].

3. Results

3.1. Thermal Mass Loss and Mass Loss Rate of Tung Seed Shells with Different Particle Sizes

The thermal mass-loss and mass-loss rate curves of tung seed shells with different particle sizes under varying heating rates are presented in Figure 1, where panels A–J correspond to successively smaller particle sizes. From the general behavior of these curves, the thermal decomposition of tung seed shells can be broadly divided into five stages. The first stage occurs between 30 to 160 °C, mainly corresponding to moisture removal, with a weight loss of approximately 4.5%. The second stage spans from 160 to 320 °C, during which the sample undergoes pre-heating and the initial decomposition of easily volatile components, resulting in a weight loss of about 12.5%. The third stage, between 320 and 410 °C, marking the rapid decomposition phase in which most thermally decomposable components break down; a large portion volatilizes, a smaller fraction forms solid residue, and a minor amount converting into liquid oil. This phase accounts for an additional 31.5% weight loss. The fourth stage (410 and 600 °C) involves slow secondary pyrolysis of the products formed in the rapid decomposition stage. During this phase, residual solids continue to decompose, and part of the liquid oil further vaporized, resulting in a weight loss of about 15.5%. The final stage, from 600 to 800 °C, corresponds to the decomposition of the remaining solids and liquids, ultimately yielding char, with a further 4.4% mass loss. The remaining undecomposed residue accounts for roughly 31.6% of the original sample mass. The overall decomposition behavior agrees well results reported in the literature [14,15]. However, the secondary re-pyrolysis stage (410–600 °C) is a distinctive feature observed in this study.
Comparing the thermal decomposition profiles of tung seed shells with different particle sizes (Figure 1) reveals clear variations. Coarser particles (especially A–D) exhibit a more pronounced second decomposition stage, whereas this stage becomes less distinct and merges with the rapid decomposition phase as the particle size decreases. Conversely, finer particles (F–J) exhibit a more significant decomposition in the final stage.
Gas–solid reactions generally involve internal and external mass diffusion, chemical reactions, and thermal conduction. Thus, particle size affects decomposition behavior primarily through mass- and heat-transfer resistances. Larger particles experience greater resistances to both heat and mass transfer, resulting in a more distinct pre-heating decomposition stage.
At different heating rates, the maximum decomposition temperature (Tmax), corresponding to the peak decomposition rate, increases almost linearly with the heating rate. Table 2 summarizes the Tmax values of tung seed shells under various heating rates, as well as the relationship between Tmax and β.
From the relationship between Tmax and β presented in Table 2, extrapolation by allowing β to approach zero yields the equilibrium decomposition temperature (Tmax0) for the pyrolysis of tung seed shells under nitrogen atmosphere. This indicates that the equilibrium thermal decomposition temperature of Tung seed shells in nitrogen atmosphere is approximately in the range of 330–350 °C, which coincides precisely with the third stage of tung seed shell pyrolysis.

3.2. Calculated Results of the Coats–Redfern Pyrolysis Kinetic Model Parameters

In this work, the Coats–Redfern, Doyle, and Kissinger methods were selected to represent three complementary approaches commonly used for analyzing biomass pyrolysis kinetics. The Coats–Redfern method provides a model-fitting approach that assumes a specific reaction mechanism and enables simultaneous determination of the apparent activation energy (Ea) and pre-exponential factor (A) under different reaction orders [13,19,20]. The Doyle method, by contrast, is an iso-conversional approximation derived from the Arrhenius equation, which avoids the assumption of a single reaction order and captures the variation of Ea with the extent of conversion (α) [14,18]. The Kissinger method employs peak temperature analysis based on the maximum rate of weight loss, offering a rapid and reliable estimation of Ea without requiring detailed knowledge of the reaction mechanism [15,22,23]. Together, these three methods provide a comprehensive kinetic framework that integrates model-fitting and iso-conversional perspectives, thereby enhancing the reliability of kinetic interpretation for complex biomass pyrolysis systems.
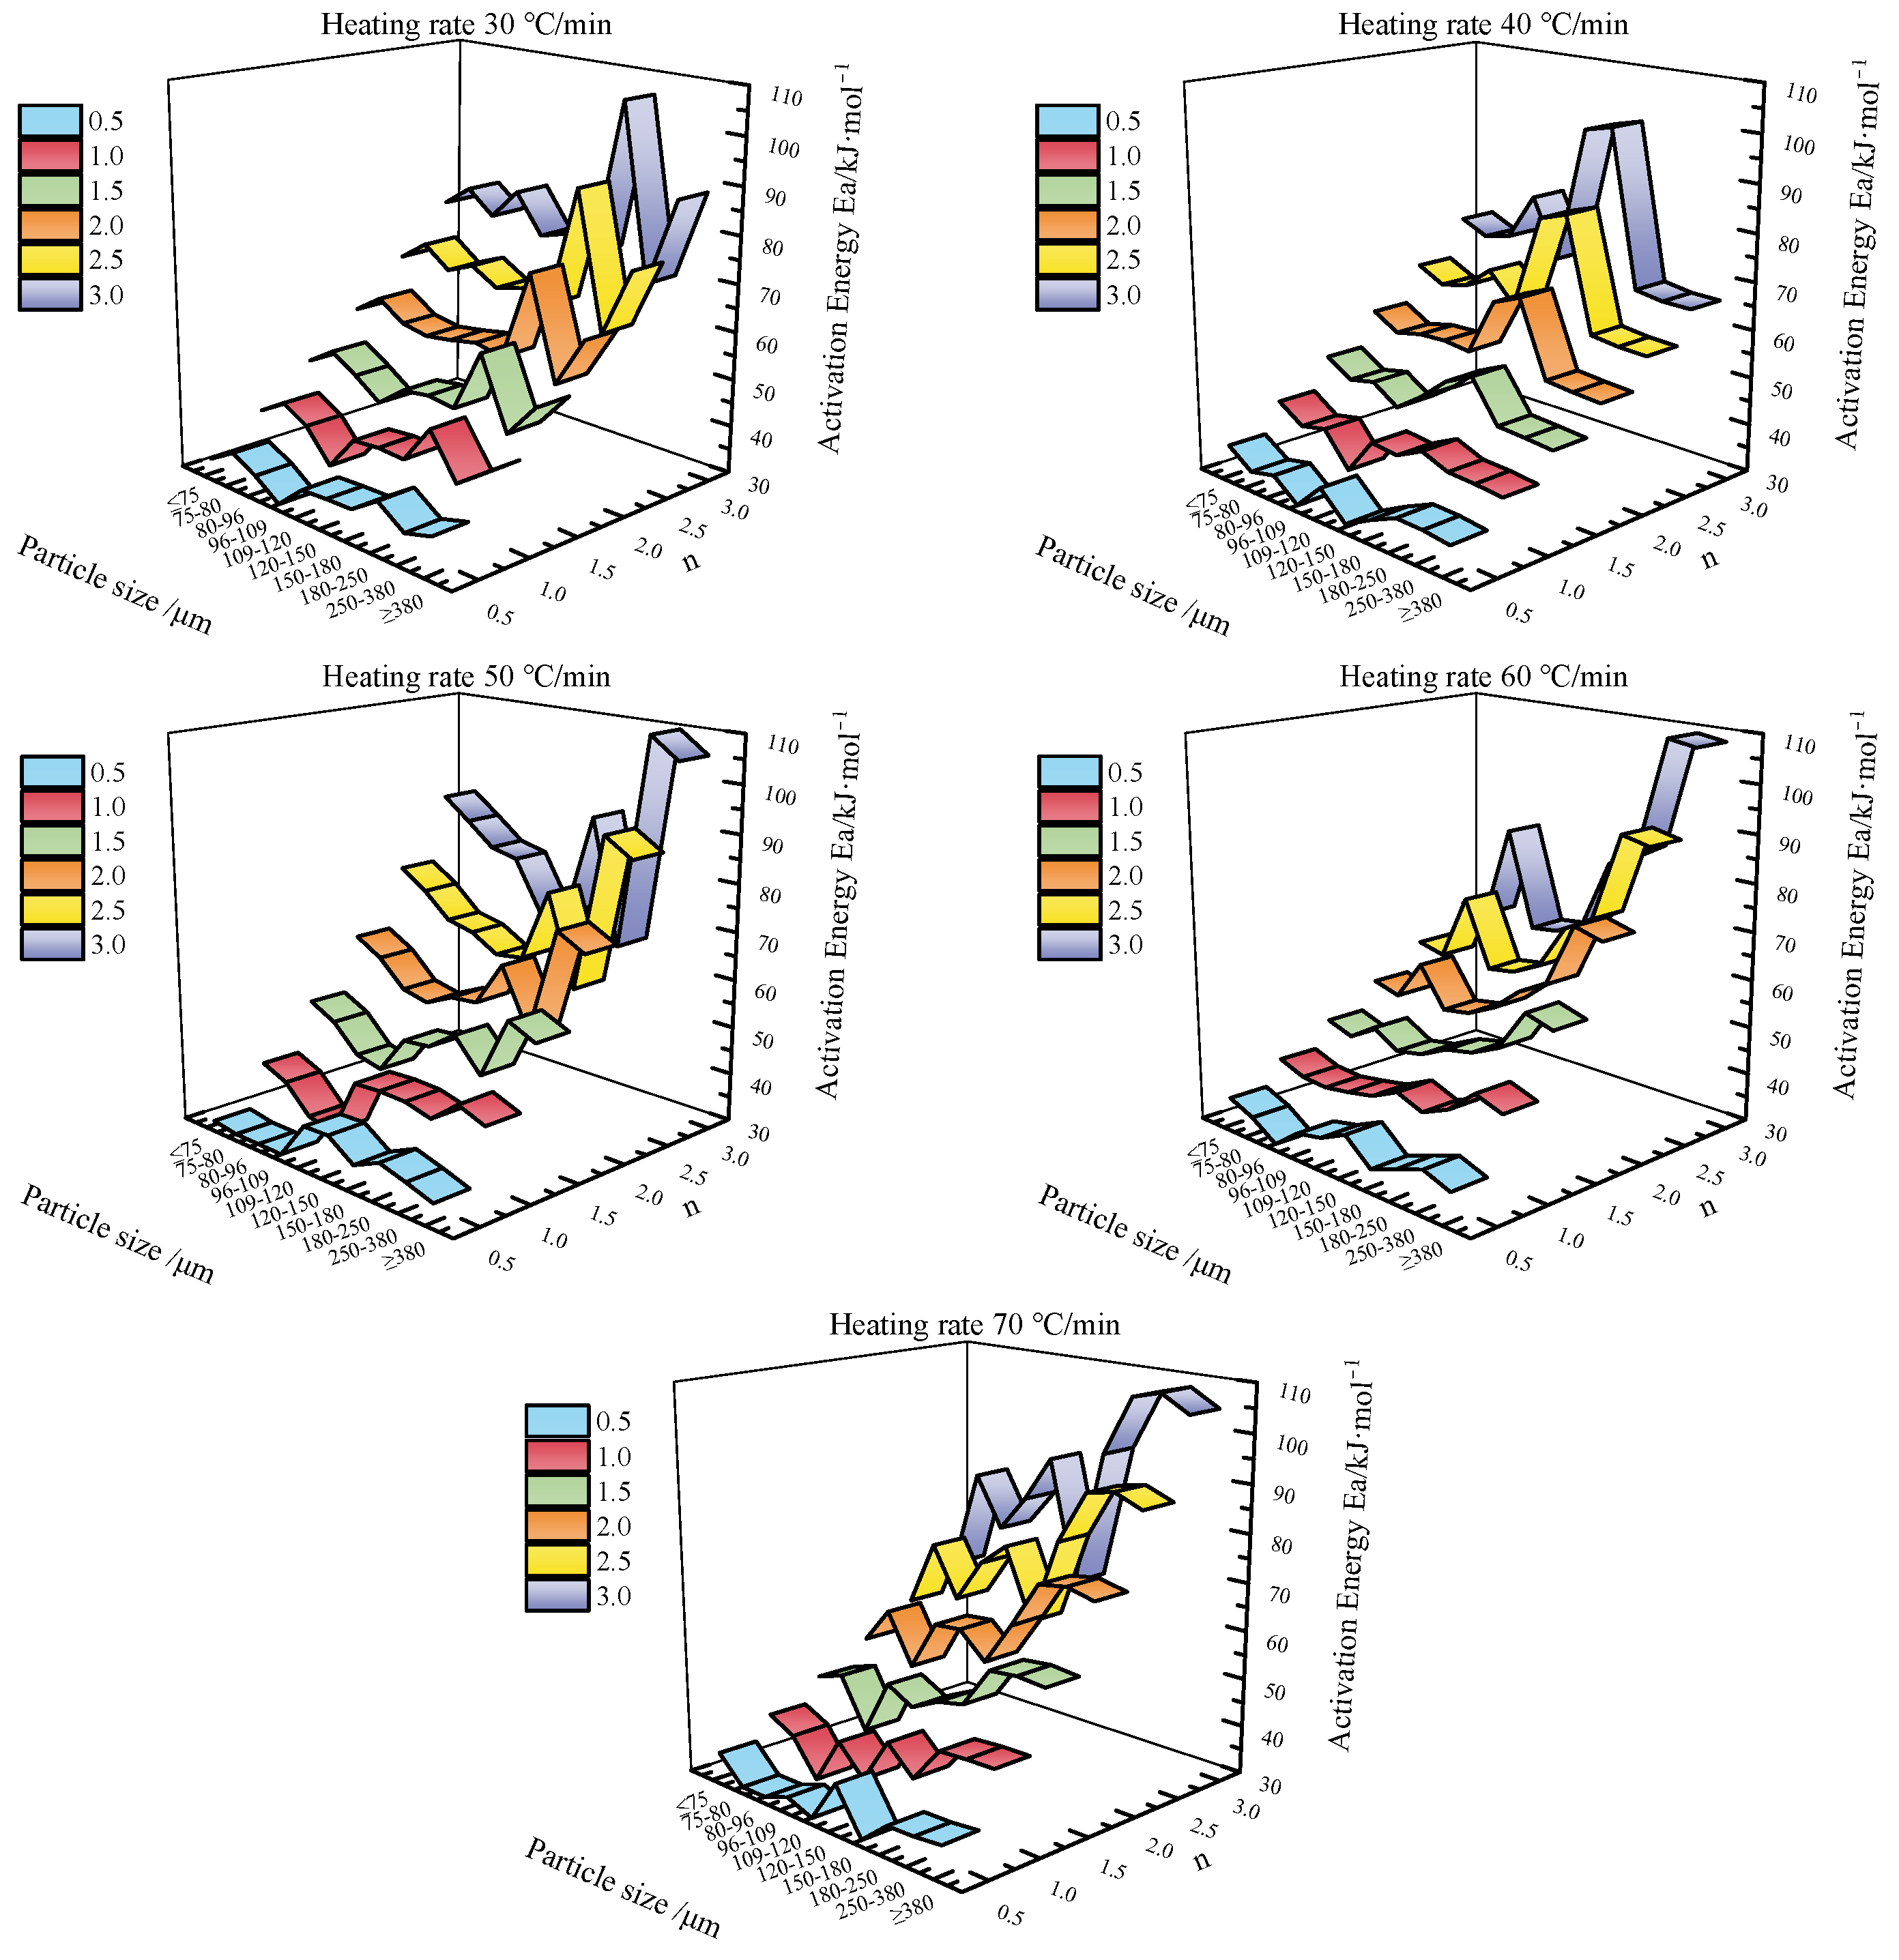
The numerical values of the equations were calculated using MATLAB software based on Equations (5) and (6). During the MATLAB computation, it was found that the data exhibited a good linear relationship when the temperature was in the range of 315–352 °C. As a result, the apparent activation energy (Ea) for tung seed shell with different particle sizes was determined through regression analysis within this temperature range. The results are shown in Figure 2.
From the calculation results, it can be observed that when the assumed reaction order (n) ranges from 0.5 to 3.0, the apparent activation energy for tung seed shell pyrolysis lies within 30 to 110 kJ/mol. Moreover, it is evident that the assumed reaction order significantly affects the obtained kinetic parameters, lower reaction orders result in lower activation energy values, while higher orders yield higher activation energies. This dependence suggests that the reaction mechanism and the rate-controlling step may vary depending on the assumed order. Furthermore, the results reveal that tung seed shells of different particle sizes exhibit different apparent activation energies, but the variation is not monotonically increasing or decreasing with increasing particle size. This nonuniform behavior indicates potential differences in thermal decomposition mechanisms and possible effects of mass transfer limitations for larger particles. The observed variation in activation energy with particle size can be attributed to internal diffusion and heat transfer effects. Larger particles develop stronger temperature and concentration gradients between their surface and core, causing slower volatile release and higher apparent activation energies due to limited heat and mass transfer. In contrast, smaller particles enable more uniform heating and faster devolatilization, resulting in lower activation energies. Similar trends have been reported for syagrus romanzoffiana palm fibers and rice husk pyrolysis, where diffusion resistance within larger particles increased the apparent activation energy [19,20].
Due to the large volume of data, a total of 300 sets (10 particle sizes × 6 reaction orders × 5 heating rates) of apparent activation energies (Ea), pre-exponential factors (A), and linear correlation coefficients (R) were calculated based on the Coats–Redfern model. Among these, the apparent activation energy values have been graphically presented in Figure 2. For illustration, Table 3 lists the calculated A and R values when the reaction order n = 1.0 and the heating rate β = 30 °C/min, demonstrating the magnitude of the pre-exponential factor and the degree of linear correlation under specific model conditions. Additional results indicate that the maximum magnitude of the pre-exponential factor, on the order of 1010, is observed in the calculation model with n = 3.0 and β = 70 °C/min, while the minimum value, on the order of 101, appears in the model with n = 0.5. Moreover, regardless of the selected calculation model, the absolute value of the linear correlation coefficient (|R|) consistently exceeds 0.98 within the temperature range of 315–352 °C, indicating a high degree of linearity in the fitted data. The lowest correlation coefficient is observed at n = 0.5 and β = 70 °C/min for the particle size range of 80–96 μm, with a value of −0.98405, still indicating strong linear correlation. This overall trend strongly supports the validity and accuracy of the Coats–Redfern method in describing the kinetics of tung seed shell pyrolysis.

3.3. Calculation of Parameter of Pyrolysis Kinetic Models by the Doyle Method

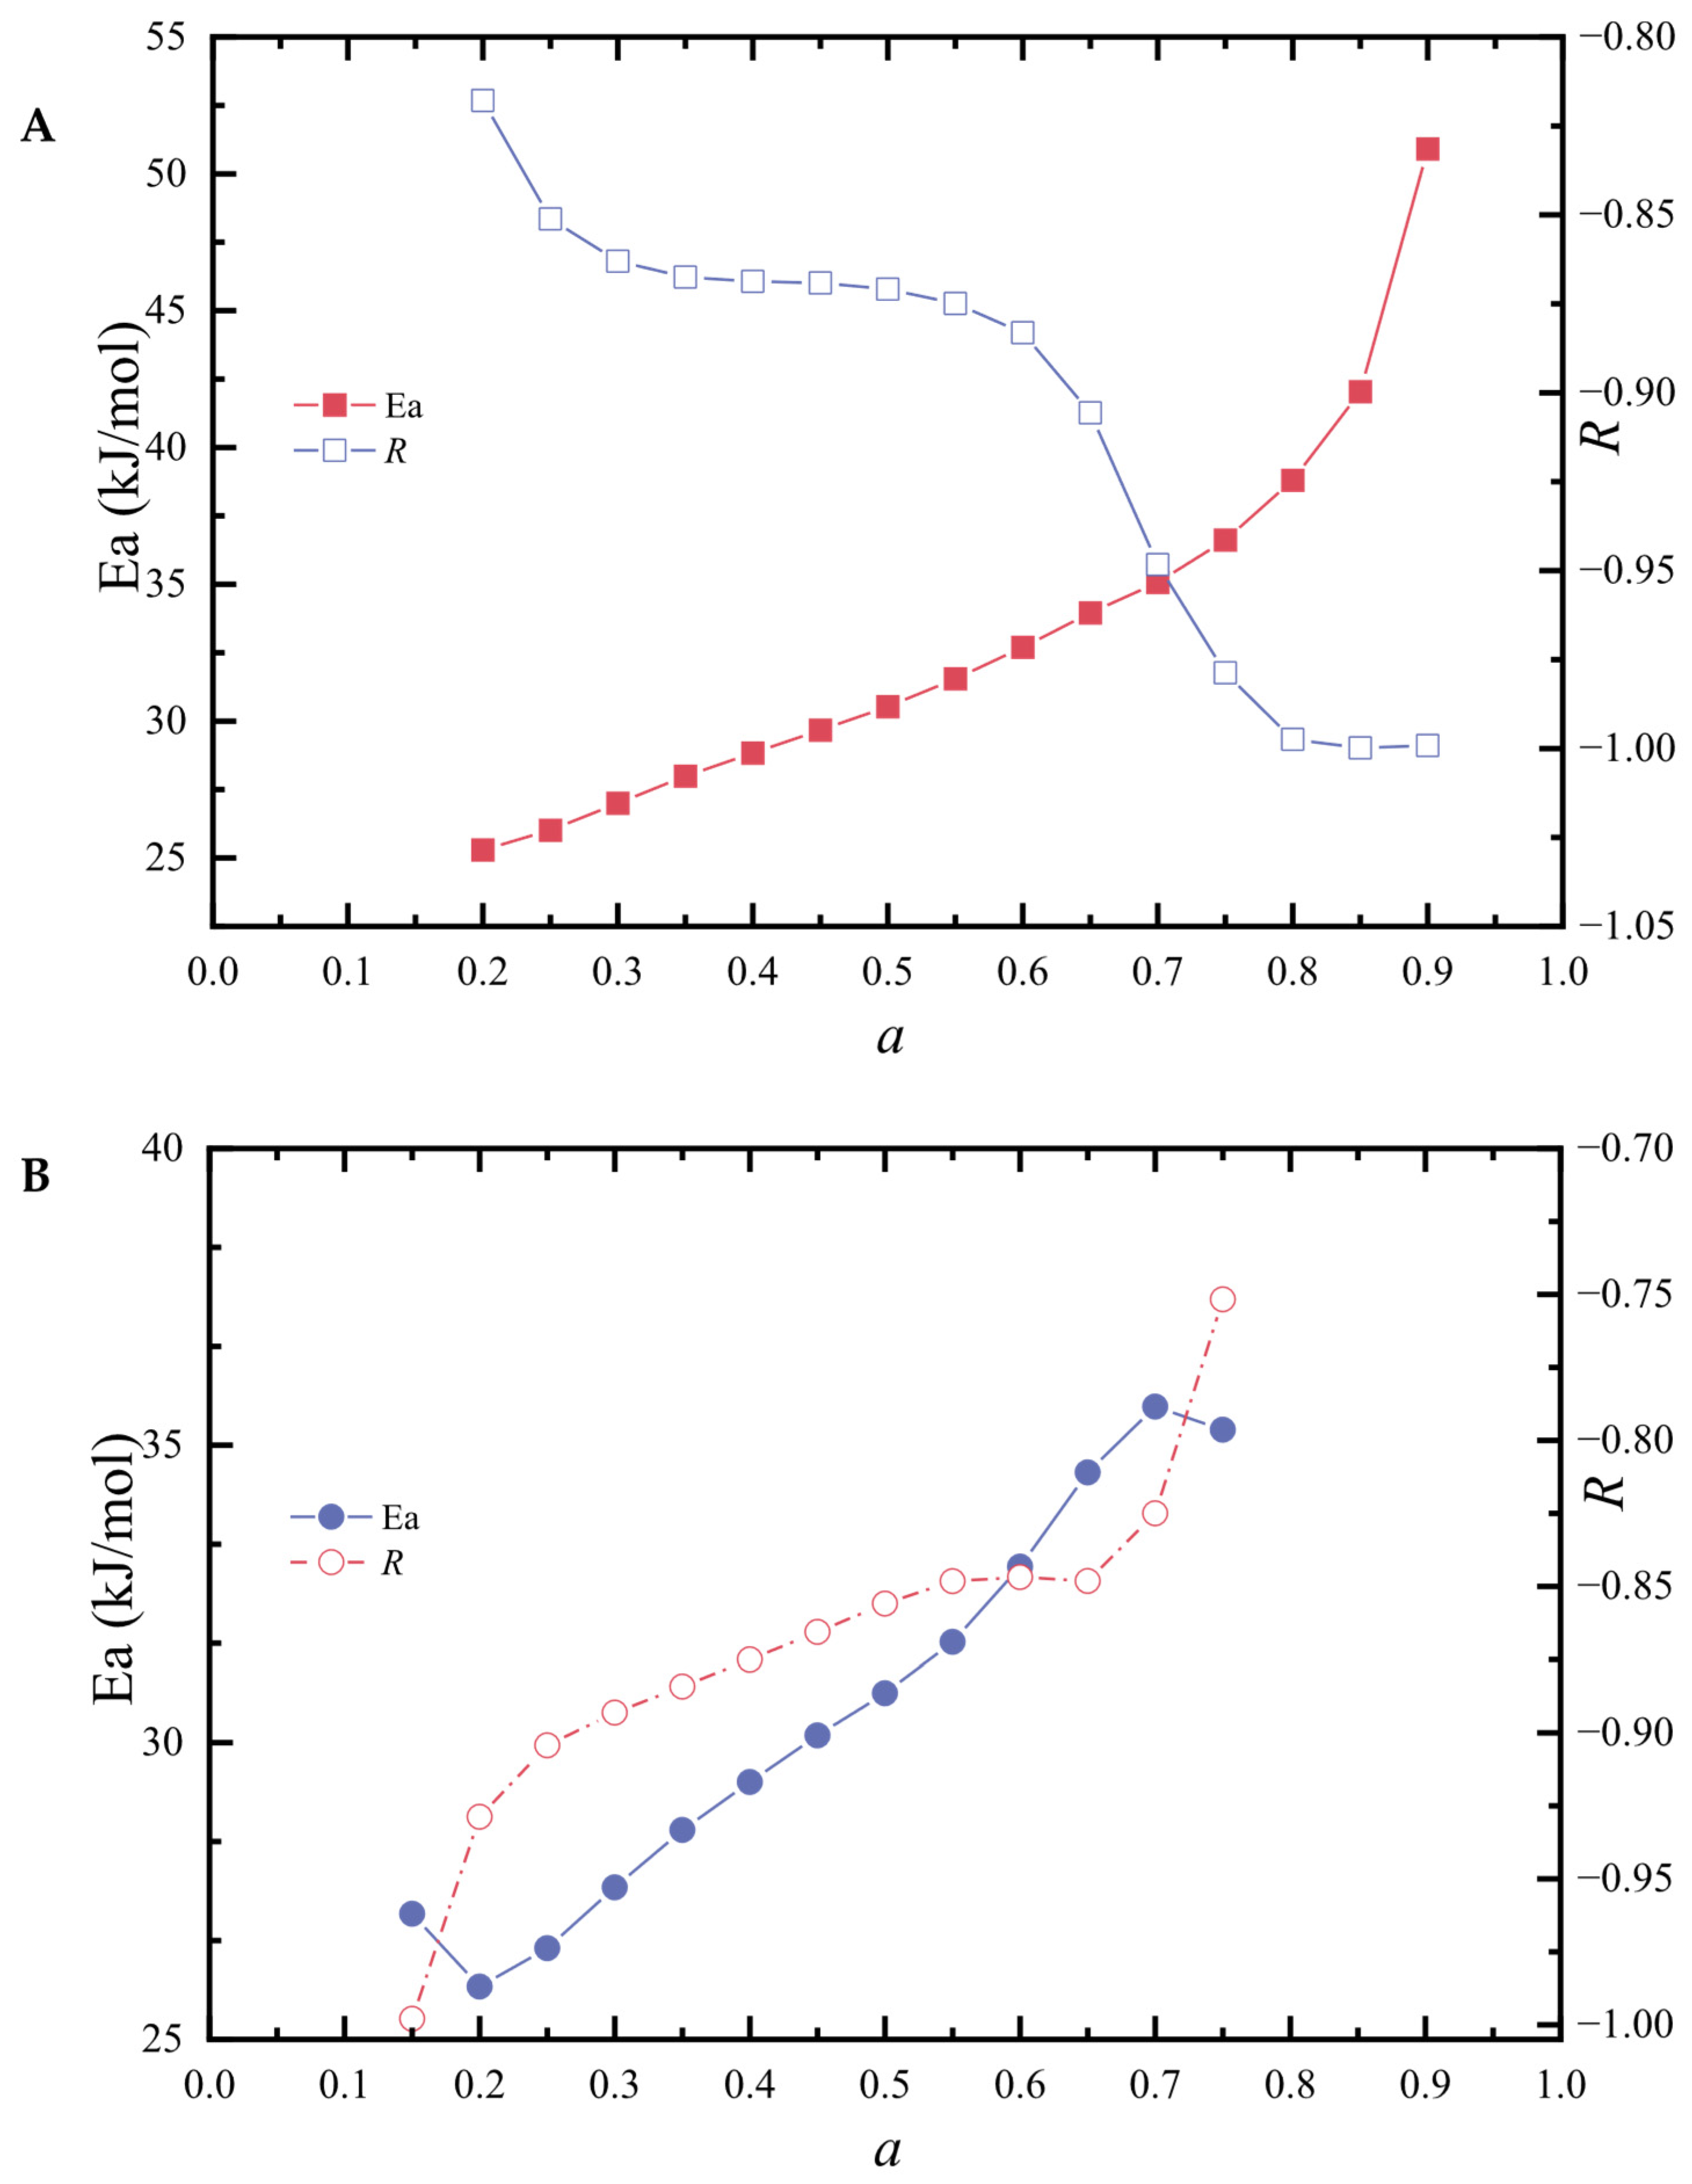
Using MATLAB for data processing and model calculations with the Doyle method, it was found that only two specific particle size ranges (≤75 μm and 96–109 μm) produced results consistent with logical and physical expectations. Specifically, acceptable results were obtained only when the absolute value of the linear correlation coefficient (|R|) was between 0.75 and 1, and the resulting apparent activation energy was positive and within a plausible range. Furthermore, the calculations strongly indicate that the chosen conversion degree (α), which reflects the progress of the pyrolysis reaction, significantly impacts the fitting results. Different ranges or selections of α led to markedly different estimates of activation energy, suggesting that the choice of α is crucial for obtaining reliable kinetic parameters using the Doyle method. The detailed results of applying the Doyle model to tung seed shells are presented in Figure 3A,B.
The calculation results show that for both particle size ranges (≤75 μm and 96–109 μm), the activation energy of tung seed shell pyrolysis increases as the reaction progresses (α) and reaches a maximum at α ≈ 0.8. This observation aligns with the typical behavior of complex organic compound pyrolysis, in which products formed at later stages of the reaction generally exhibit higher thermal stability and therefore require greater activation energy for further decomposition. This phenomenon also explains why the pyrolysis of such organic materials typically exhibits a maximum decomposition rate around 400 °C and why higher temperatures (up to 600 °C or more) are required to achieve complete pyrolysis. Additionally, the apparent activation energies for both particle size groups were found to range from 25 to 45 kJ/mol, which is consistent with the results obtained using the Coats–Redfern method when the reaction order (n) is assumed to be 1.0. Given that the Doyle method assesses the overall reaction progress without relying on an assumed reaction order, this consistency supports the hypothesis that the pyrolysis of tung seed shells follows a first-order reaction mechanism according to the Coats–Redfern model. The convergence between the Doyle and Coats–Redfern methods, along with the variation in Ea with α, confirms the complex and continuous nature of the pyrolysis process and underscores the validity of assuming a reaction order of 1.0 in the kinetic modeling of tung seed shell pyrolysis.

3.4. Calculation of Parameters of Pyrolysis Kinetic Models by the Kissinger Method

The Kissinger method, also known as the maximum-rate method, is an approximate kinetic analysis technique that relies on the peak temperature (Tp) corresponding to the maximum weight loss observed during thermogravimetric analysis (TGA). By substituting the experimental data into Equation (10) and plotting the relevant variables, the apparent activation energy (Ea) for the pyrolysis of tung seed shells with various particle sizes can be estimated. The calculation results are presented in Figure 4. The apparent activation energy of tung seed shell pyrolysis, as determined using the Kissinger method, ranged from 95 to 122 kJ/mol. Unlike the Doyle method, the Ea values showed no clear trend with respect to particle size.
This suggests that variations in activation energy are more likely influenced by differences in elemental composition or structural characteristics of the samples at different particle size ranges, rather than by heat or mass transfer resistance. The results obtained using the Kissinger method are consistent with previously reported data in the literature [7,8], further validating the method’s applicability for estimating the approximate activation energy of biomass pyrolysis. It is important to note that the Kissinger method primarily utilizes the peak decomposition temperature, which corresponds to the maximum rate of weight loss. This makes it susceptible to instrumental errors, especially at higher heating rates where measurement deviations can be significant. Although the method is computationally simple and convenient, it is generally considered less accurate than other iso-conversional methods, such as the Doyle or Coats–Redfern methods, particularly for precise activation-energy estimation. To enhance accuracy, the method could be applied at lower heating rates and with finer heating-rate intervals. In the context of this study, the focus is on fast pyrolysis under rapid heating conditions, aimed at reducing tar formation by promoting the production of char and gases through efficient thermal decomposition.
The pre-exponential factors (A) and linear correlation coefficients (R) obtained from the Kissinger method fitting are summarized in Table 4. As shown, the pre-exponential factors generally fall in the order of 108 s−1, except for samples in the 150–180 μm and 109–120 μm size ranges, where they reach 109 s−1 and 1010 s−1, respectively. For all particle size distributions examined, the linear correlation coefficients (R) exceed 0.97 and approach 1.00, indicating a high degree of linearity in the regression of activation-energy values. This suggests that the data fit well to the model assumptions, validating the Kissinger method as a reliable and reasonable approach for estimating pyrolysis kinetics under the investigated conditions. Although the method inherently limits the precision of the activation energy, the strong linear relationship and high confidence in the fittings support the utility of the Kissinger method as a practical and preliminary tool for screening and comparing kinetic parameters across different biomass samples and particle size ranges.

3.5. In Situ Observation and Supposed Mechanism of Tung Seed Shells Pyrolysis

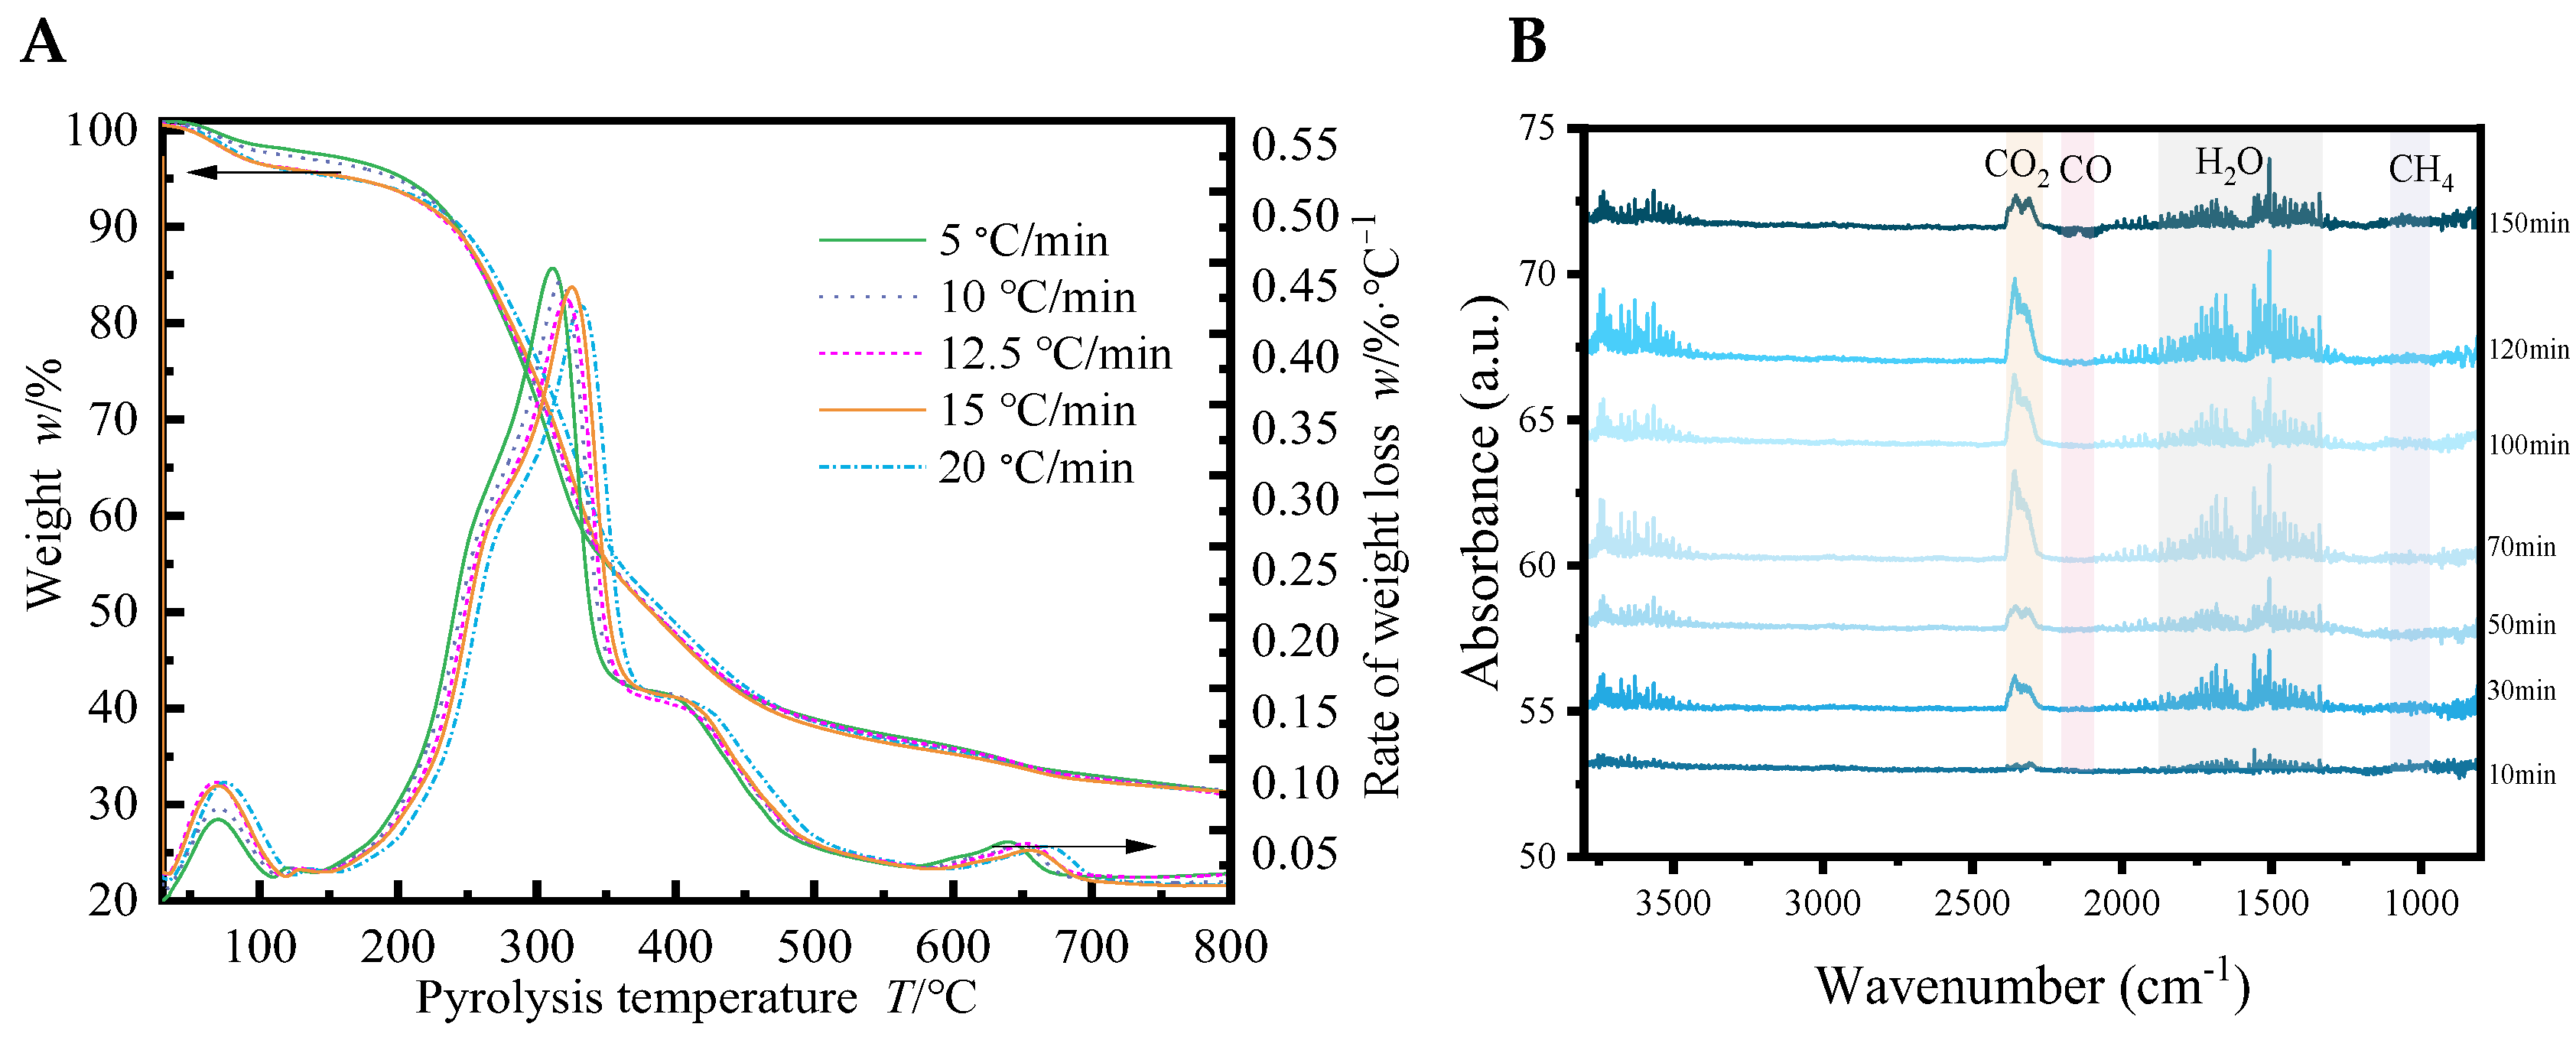
The thermal degradation behavior of tung seed shell was investigated using thermogravimetric analysis (TGA) and differential scanning calorimetry (DSC), as illustrated in Figure 5A and Figures S1–S6. The TGA curve revealed a multistep decomposition process. At heating rates ranging from 5 to 20 °C/min, an initial mass loss of approximately 10% was observed between 60 °C and 80 °C, corresponding to the evaporation of moisture and low-boiling-point volatiles. The major thermal decomposition occurred between approximately 310 °C and 330 °C, with the maximum weight loss rate recorded at 303.04 °C (5 °C/min), 310.69 °C (7.5 °C/min), 316.51 °C (10 °C/min), 320.39 °C (12.5 °C/min), 324.74 °C (15 °C/min), and 325.79 °C (20 °C/min). This region reflects the pyrolysis of hemicellulose and cellulose, the primary polysaccharide components of lignocellulosic biomass. This observation is consistent with the DSC results (Figures S1–S6), which showed strong endothermic peaks at 285.41 °C (5 °C/min), 356.58 °C (7.5 °C/min), 333.91 °C (10 °C/min), 303.34 °C (12.5 °C/min), 305.97 °C (15 °C/min), and 262.02 °C (20 °C/min), indicating intense thermal decomposition and energy absorption of 57.80, 122.5, 62.63, 61.48, 56.51, and 49.33 J/g, respectively. A minor endothermic event at lower temperatures of 231.9 °C (5 °C/min), 265.12 °C (7.5 °C/min), 262.86 °C (10 °C/min), 269.05 °C (12.5 °C/min), and 259.76 °C (15 °C/min) corresponds to the degradation of hemicellulose and the onset of cellulose depolymerization [4]. Above 350 °C, a slower weight-loss trend was observed around 420 °C, likely associated with the gradual breakdown and carbonization of lignin components, leading to the formation of residual char. The relatively high char residue (>20%) suggests the presence of thermally stable aromatic structures and indicates potential for biochar production. These findings confirm that tung seed shell exhibits favorable thermal decomposition characteristics, with a dominant degradation peak around 320 °C and a significant biochar yield. The thermal behavior highlights it suitability as a feedstock for pyrolysis-based bioenergy conversion processes.
To confirm the formation of syngas during tung seed shell pyrolysis, in situ TG-FTIR observations were conducted on gaseous products evolving from pyrolysis of 160–180 mesh shells heated at rates of 5–20 °C/min. According to previously reported FTIR spectra [21,22,23], the TG–FTIR spectra (Figure 5B and Figures S7–S12) show a progressive increase in the H2O absorption peak (1350–1850 cm−1 and > 3500 cm−1) with increasing pyrolysis time, which is likely attributed to dehydration and decarboxylation reactions. Simultaneously, the cleavage of oxygen-containing functional groups and C–C bonds was observed, as indicated by the emergence of CO2 (2293 cm−1), CO (2150 cm−1), and CH4 (1034 cm−1) peaks. After 120 min, the generation of H2O and CO2 bands in the TG–FTIR spectra decreased, suggesting the predominance of biochar formation. In contrast, the continuous increase in CO and CH4 signals indicates that the generation of these gases occurs throughout all stages of tung seed shell pyrolysis.

4. Discussion

The thermal decomposition of tung seed shell follows a four-stage pathway, as derived from the combined TG–FTIR analysis. Initially, between 30 and 120 °C, a minor mass loss is observed, attributed to the evaporation of physically adsorbed moisture and low-molecular-weight volatiles. This is followed by the onset of structural degradation in the 200–260 °C range, where hemicellulose depolymerization becomes prominent, leading to a noticeable weight reduction and the appearance of a mild endothermic peak in the DSC profile. The third stage, occurring between 300 and 330 °C, corresponds to the main pyrolytic degradation of cellulose, which is characterized by the maximum weight-loss rate and a strong endothermic response, indicative of extensive glycosidic bond cleavage and volatile evolution. Beyond 350 °C, the degradation proceeds more slowly, suggesting the gradual breakdown and carbonization of lignin, accompanied by aromatic structure condensation and residual char formation. This thermally stable fraction contributes significantly to the high fixed-carbon content observed in the final solid residue. The decomposition behavior observed in the DTG profiles corresponds to the typical degradation of lignocellulosic biomass components. The initial peak (200–300 °C) mainly arises from the decomposition of hemicellulose, followed by the sharp main peak at approximately 320–360 °C associated with cellulose depolymerization and volatilization, while the gradual decline above 400 °C corresponds to the slow degradation of lignin. This multi-stage behavior is consistent with previously reported pyrolysis patterns of various biomasses, such as rice husk, common reed, coastal zone, and land-derived feedstocks, in which hemicellulose decomposes at lower temperatures, cellulose dominates the main devolatilization region, and lignin decomposes gradually over a wide temperature range [17,18,24,25]. The relatively high residual char content (>20%) not only indicates potential for biochar production but also highlights its environmental relevance. Due to its stable aromatic carbon structure, this char can act as a long-term carbon sink, contributing to carbon sequestration and mitigating greenhouse gas emissions. Furthermore, its porous structure and surface functionality make it a promising soil amendment material that can enhance soil fertility, water retention, and microbial activity. Such multifunctional utilization reinforces the sustainable value of tung seed shell pyrolysis by linking energy recovery with environmental benefits, consistent with previous findings on biochar’s dual role in energy and carbon management [26,27].
By establishing three different thermal decomposition kinetic models including Coats–Redfern, Doyle, and Kissinger methods, the fitting and calculation results demonstrate that each model yields distinct kinetic parameters, particularly in terms of the apparent activation energy (Ea). The results obtained from the Coats–Redfern and Doyle methods are relatively close to each other, both showing apparent activation energies in the range of 30–50 kJ/mol. However, differences in the approximations employed by each method lead to variations in the calculated results. Specifically, the Coats–Redfern method emphasizes the effect of reaction order (n) on the activation energy, whereas the Doyle method highlights the influence of reaction progress (α) on Ea. Based on the neglected terms in these two methods (i.e., the omitted integral or derivative terms during approximation), it can be inferred that the Coats–Redfern method is more accurate at lower temperatures, while the Doyle method is more applicable in the higher-temperature range. In contrast, the Kissinger method yields significantly higher apparent activation energies (95–122 kJ/mol) than the other two methods. This discrepancy is mainly attributed to the uncertainty in determining the peak decomposition temperature (i.e., the temperature corresponding to the maximum decomposition rate), which serves as the key parameter in the Kissinger calculation. It is acknowledged that the Coats–Redfern method, in its original form, is a single-heating-rate approach and has been questioned for its simplified assumptions. Nevertheless, when used together with multi-rate data and complementary models such as the Doyle and Kissinger methods, it provides a useful approximation for apparent activation energies. This comparative application aligns with the practical use of the method in many recent studies on biomass pyrolysis. In accordance with the recommendations of the International Confederation for Thermal Analysis and Calorimetry (ICTAC) [28,29,30], future work will incorporate multi-heating-rate isoconversional analyses to further improve kinetic accuracy and mechanistic interpretation.
The apparent activation energies obtained in this study are generally consistent with those reported for other lignocellulosic biomasses. For example, Xiao et al. reported Ea values of 32–58 kJ/mol for rice husk pyrolysis using the Coats–Redfern approach [21], while Ferfari et al. found a similar range of 45–68 kJ/mol for palm fibers [20]. Xu et al. reported Ea values of 40–72 kJ/mol for common reed [26], and Wu et al. observed 28–52 kJ/mol for waste ryegrass under nitrogen atmosphere [23]. Bisen et al. investigated the co-pyrolysis of rice husk and low-density polyethylene, reporting Ea values ranging from 32.7 to 73.6 kJ/mol depending on the mixing ratio, which further supports the moderate activation energy range typical for lignocellulosic biomass decomposition [27]. These results are comparable to the Coats–Redfern and Doyle method outcomes in this work (30–50 kJ/mol), suggesting that tung seed shells exhibit similar kinetic behavior to other cellulose-rich agricultural residues. In contrast, the higher activation energies (95–122 kJ/mol) obtained using the Kissinger method are within the range reported for coastal and land biomasses (90–125 kJ/mol) [22], reflecting the influence of heating rate and decomposition peak-based estimation. Overall, this comparison confirms that tung seed shells follow a typical multistage pyrolysis pattern characteristic of lignocellulosic feedstocks and possess comparable energy barriers for decomposition, reinforcing their suitability as a renewable bioenergy precursor.
The variation in apparent activation energy with particle size may be attributed to the combined influence of internal diffusion and heat transfer effects during pyrolysis. Larger particles tend to exhibit higher temperature gradients and longer diffusion paths for volatile products, resulting in partial heat and mass transfer limitations that can delay devolatilization and lower apparent reactivity [31,32]. Conversely, smaller particles experience more uniform heating and enhanced gas diffusion, leading to faster decomposition and a lower apparent energy barrier [33]. Similar trends have been reported for various lignocellulosic biomasses, where diffusion and thermal resistance dominate the kinetic response of larger particles [34,35]. Therefore, the non-linear relationship between particle size and activation energy in this study likely reflects the interplay between intrinsic chemical kinetics and external heat and mass transfer resistances [36,37,38].
The TG–FTIR observation suggested the trend of actual pyrolysis process, as affected by the heating rate, is generally consistent with the calculation results, further confirming the potential of tung seed shell for biofuel gases production. Regardless of the kinetic model employed, the results should be considered as reference values only, since numerous external and model-related factors may affect the accuracy of the calculated Ea. These include the inherent limitations of the models themselves, as well as heat and mass transfer constraints during the decomposition process, which are not fully accounted for in the kinetic formulations. Moreover, the activation energies derived in this study represent apparent values, reflecting an empirical rather than intrinsic characterization of the pyrolysis reaction. A comparison and analysis of the thermal decomposition data for tung seed shells with different particle sizes reveal that samples of varying sizes exhibit considerable differences in their apparent activation energies, likely due to variations in elemental composition and reaction mechanism. Furthermore, the variation of Ea with the conversion degree (α) suggests that the pyrolysis of tung seed shells involves a series of complex and continuous reactions rather than a single-step process. This finding highlights the importance of considering both the reaction mechanism and the choice of model in kinetic analysis. Additionally, it reinforces that the activation energy is not a fixed property but instead reflects the rate-controlling step and the reaction conditions at each stage of the pyrolysis process.

5. Conclusions

This study comprehensively investigated the pyrolysis kinetics and in situ thermal decomposition behavior of tung seed shells (TSSs) using thermogravimetric (TGA) and TG–FTIR analyses combined with Coats–Redfern, Doyle, and Kissinger models. The results revealed that TSS undergoes a multistage thermal degradation process, involving the sequential decomposition of hemicellulose, cellulose, and lignin, with distinct kinetic characteristics depending on particle size and heating rate. Coats–Redfern and Doyle methods produced comparable apparent activation energies (30–50 kJ/mol), while the Kissinger method yielded higher values (95–122 kJ/mol), reflecting the influence of peak-based analysis and rapid heating conditions. The variation of activation energy with particle size and conversion degree highlights the complex, multi-step nature of biomass pyrolysis and emphasizes that both reaction kinetics and heat/mass transfer govern the overall decomposition behavior. In situ TG–FTIR analysis confirmed that gaseous species such as CO, CO2, and CH4 evolve continuously throughout pyrolysis, consistent with progressive decarboxylation and deoxygenation reactions. The generation of these gases demonstrates the high potential of TSSs for syngas and bio-gas production. The relatively high residual char yield further suggests the feasibility of using TSS-derived char for biochar or catalyst applications. These insights contribute to a deeper mechanistic understanding of oil-rich biomass pyrolysis and provide valuable guidance for optimizing thermochemical conversion systems. Although the classical Coats–Redfern and Kissinger methods have certain limitations for complex multi-step reactions, their combined use with multi-rate TGA data provides a valid preliminary kinetic assessment. Future studies will employ advanced isoconversional and distributed reactivity models, following ICTAC recommendations, to refine the kinetic interpretation of tung seed shell pyrolysis.
Overall, this work establishes a robust kinetic and mechanistic framework for the pyrolysis of tung seed shells. The findings clarify the intrinsic energy barriers and gas-evolution behavior, while emphasizing the significance of heat and mass transfer in determining the overall decomposition process. The consistent agreement between kinetic models and experimental results underscores the reliability of the adopted approaches and confirms that tung seed shells exhibit pyrolysis characteristics typical of lignocellulosic biomass. Moreover, the identification of continuous CO and CH4 evolution throughout all pyrolysis stages highlights their potential for producing high-quality bio-syngas and biochar. These insights not only deepen the mechanistic understanding of oil-rich biomass conversion but also suggest promising opportunities for optimizing thermochemical valorization. Future investigations should therefore aim to refine kinetic modeling through advanced in situ characterization techniques, explore catalytic and co-pyrolysis strategies to enhance product selectivity, and extend the present findings to pilot- and industrial-scale systems. Such efforts will further bridge the gap between fundamental kinetic understanding and practical application, contributing to the sustainable utilization of tung seed shells and similar biomass residues as renewable energy resources.

Supplementary Materials

The following supporting information can be downloaded at: https://www.mdpi.com/article/10.3390/en18215842/s1, Figure S1: DSC curve of Tung seed shell pyrolysis at a heating rate of 5 °C/min; Figure S2: DSC curve of Tung seed shell pyrolysis at a heating rate of 7.5 °C/min; Figure S3: DSC curve of Tung seed shell pyrolysis at a heating rate of 10 °C/min; Figure S4: DSC curve of Tung seed shell pyrolysis at a heating rate of 12.5 °C/min; Figure S5: DSC curve of Tung seed shell pyrolysis at a heating rate of 15 °C/min; Figure S6: DSC curve of Tung seed shell pyrolysis at a heating rate of 20 °C/min; Figure S7: TG-FTIR spectra of Tung seed shell pyrolysis at a heating rate of 5 °C/min; Figure S8: TG-FTIR spectra of Tung seed shell pyrolysis at a heating rate of 7.5 °C/min; Figure S9: TG-FTIR spectra of Tung seed shell pyrolysis at a heating rate of 10 °C/min; Figure S10: TG-FTIR spectra of Tung seed shell pyrolysis at a heating rate of 12.5 °C/min; Figure S11: TG-FTIR spectra of Tung seed shell pyrolysis at a heating rate of 15 °C/min; Figure S12: TG-FTIR spectra of Tung seed shell pyrolysis at a heating rate of 20 °C/min.

Author Contributions

Conceptualization, K.H. and Y.L.; methodology, Y.L.; software, Y.L.; validation, Y.L. and K.H.; formal analysis, Y.L.; investigation, Y.L.; resources, K.H.; data curation, Y.L.; writing—original draft preparation, Y.L.; writing—review and editing, Y.L. and K.H.; visualization, Y.L.; supervision, K.H.; project administration, K.H.; funding acquisition, K.H. All authors have read and agreed to the published version of the manuscript.

Funding

This research was funded by National Natural Science Foundation of China (No. 22268013) and Guangxi Key R&D Program Project (No. Guike AB25069465).

Data Availability Statement

All data was included in main text and Supplementary Materials of this article.

Acknowledgments

We thank the support from National Natural Science Foundation of China and Guangxi Key R&D Program Project.

Conflicts of Interest

The authors declare no conflicts of interest.

Abbreviations

The following abbreviations are used in this manuscript:
TSSTung seed shell
TGAThermogravimetric analysis
DSCDifferential Scanning Calorimetry
TG–FTIRThermogravimetric Fourier Transform Infrared Spectroscopy
EaApparent activation energies
TmaxDecomposition temperature
APre-exponential factors
RLinear correlation coefficients
Tmax0Equilibrium decomposition temperature
TpPeak temperature
βHeating rate
nReaction order
αReaction progresses

References

  1. Wang, S.; Zhang, A.; Li, N.; Shah, T.A.; Li, Z.; Yi, W. Biomass Pyrolysis and Clean Energy Production. In Advanced Technology for Smart Environment and Energy; Springer: Berlin/Heidelberg, Germany, 2024; pp. 137–148. [Google Scholar]
  2. Li, P.; Chen, Y.; Lin, Y.; Chen, W.; Hu, J.; Yang, W.; Chang, C.; Pang, S. Research progress on the preparation of high-value carbon materials by biomass pyrolysis. Biomass Bioenergy 2025, 193, 107520. [Google Scholar] [CrossRef]
  3. Rasaq, W.A.; Golonka, M.; Scholz, M.; Białowiec, A. Opportunities and challenges of high-pressure fast pyrolysis of biomass: A review. Energies 2021, 14, 5426. [Google Scholar] [CrossRef]
  4. Sharma, V.; Pradhan, R.; Naik, S.; Bhatnagar, N.; Singh, S. Evaluation of a centrifugal impaction-type decorticator for shelling tung fruits. Ind. Crops Prod. 2013, 43, 126–131. [Google Scholar] [CrossRef]
  5. Zornitta, N.; Nadaleti, W.C.; Bariccatti, R.A.; dos Santos, R.F.; Zornitta, R.L.; Nogueira, C.E.C. Evaluation of the Tung’s fruits as a possible source of sustainable energy. Acta Scientiarum. Technol. 2017, 39, 487–493. [Google Scholar] [CrossRef]
  6. Prasad, L.; Salvi, B.; Kumar, V. Thermal degradation and gasification characteristics of Tung Shells as an open top downdraft wood gasifier feedstock. Clean Technol. Environ. Policy 2015, 17, 1699–1706. [Google Scholar] [CrossRef]
  7. Suttibak, S.; Saengmanee, C.; Chuntanapum, A. Production of bio-oil from Tung seed residues in a fluidized-bed reactor. Heliyon 2024, 10, e28310. [Google Scholar] [CrossRef]
  8. Saldarriaga, J.F.; Aguado, R.; Pablos, A.; Amutio, M.; Olazar, M.; Bilbao, J. Fast characterization of biomass fuels by thermogravimetric analysis (TGA). Fuel 2015, 140, 744–751. [Google Scholar] [CrossRef]
  9. Naqvi, S.R.; Tariq, R.; Hameed, Z.; Ali, I.; Naqvi, M.; Chen, W.-H.; Ceylan, S.; Rashid, H.; Ahmad, J.; Taqvi, S.A. Pyrolysis of high ash sewage sludge: Kinetics and thermodynamic analysis using Coats–Redfern method. Renew. Energy 2019, 131, 854–860. [Google Scholar] [CrossRef]
  10. Ji, A.; Zhang, S.; Lu, X.; Liu, Y. A new method for evaluating the sewage sludge pyrolysis kinetics. Waste Manag. 2010, 30, 1225–1229. [Google Scholar] [CrossRef]
  11. Li, K.-Y.; Huang, X.; Fleischmann, C.; Rein, G.; Ji, J. Pyrolysis of medium-density fiberboard: Optimized search for kinetics scheme and parameters via a genetic algorithm driven by Kissinger’s method. Energy Fuels 2014, 28, 6130–6139. [Google Scholar] [CrossRef]
  12. Wang, J.; Lian, W.; Li, P.; Zhang, Z.; Yang, J.; Hao, X.; Huang, W.; Guan, G. Simulation of pyrolysis in low rank coal particle by using DAEM kinetics model: Reaction behavior and heat transfer. Fuel 2017, 207, 126–135. [Google Scholar] [CrossRef]
  13. Coats, A.W.; Redfern, J. Kinetic parameters from thermogravimetric data. Nature 1964, 201, 68–69. [Google Scholar] [CrossRef]
  14. Doyle, C.D. Kinetic analysis of thermogravimetric data. J. Appl. Polym. Sci. 1961, 5, 285–292. [Google Scholar] [CrossRef]
  15. Kissinger, H.E. Variation of peak temperature with heating rate in differential thermal analysis. J. Res. Natl. Bur. Stand. 1956, 57, 217–221. [Google Scholar] [CrossRef]
  16. Vasilevich, S.V.; Mitrofanov, A.V. A Kinetic Study of the Nonisothermal Pyrolysis of Wood. Kinet. Catal. 2024, 65, 320–335. [Google Scholar] [CrossRef]
  17. Lalaymia, I.; Bedjaoui, A.; Belaadi, A.; Abdullah, M.M.S.; Ghernaout, D.; Al-Khawlani, A. Slow Pyrolysis of Agave americana L. Fibers: Analysis of Kinetics and Thermodynamics Using the Coats–Redfern Method at Different Heating Rates. Ind. Crops Prod. 2024, 219, 119043. [Google Scholar] [CrossRef]
  18. Fischer, O.; Lemaire, R.; Bensakhria, A. Thermogravimetric Analysis and Kinetic Modeling of the Pyrolysis of Different Biomass Types by Means of Model-Fitting, Model-Free, and Network Modeling Approaches. J. Therm. Anal. Calorim. 2024, 149, 10941–10963. [Google Scholar] [CrossRef]
  19. Ferfari, O.; Belaadi, A.; Bourchak, M.; Ghernaout, D.; Ajaj, R.M.; Chai, B.X. Thermal Decomposition of Syagrus romanzoffiana Palm Fibers: Thermodynamic and Kinetic Studies Using the Coats–Redfern Method. Renew. Energy 2024, 231, 120928. [Google Scholar] [CrossRef]
  20. Xiao, R.; Yang, W.; Cong, X.; Dong, K.; Xu, J.; Wang, D.; Yang, X. Thermogravimetric Analysis and Reaction Kinetics of Lignocellulosic Biomass Pyrolysis. Energy 2020, 201, 117537. [Google Scholar] [CrossRef]
  21. Li, J.; Shang, Y.; Wei, W.; Liu, Z.; Qiao, Y.; Qin, S.; Tian, Y. Comparative Study on Pyrolysis Kinetics Behavior and High-Temperature Fast Pyrolysis Product Analysis of Coastal Zone and Land Biomasses. ACS Omega 2022, 7, 10144–10155. [Google Scholar] [CrossRef] [PubMed]
  22. Wu, Y.; Jiang, M.; Liu, Y.; Deng, Y. Pyrolysis Kinetics of Waste Ryegrass under Nitrogen and Air Atmosphere. Heliyon 2024, 10, e36293. [Google Scholar] [CrossRef]
  23. Shen, D.; Gu, S.; Luo, K.; Bridgwater, A.V.; Fang, M. Kinetic study on thermal decomposition of woods in oxidative environment. Fuel 2009, 88, 1024–1030. [Google Scholar] [CrossRef]
  24. Wang, G.; Li, W.; Li, B.; Chen, H. TG study on pyrolysis of biomass and its three components under syngas. Fuel 2008, 87, 552–558. [Google Scholar] [CrossRef]
  25. Azzolina-Jury, F.; Thibault-Starzyk, F. Mechanism of low pressure plasma-assisted CO2 hydrogenation over Ni-USY by microsecond time-resolved FTIR spectroscopy. Top. Catal. 2017, 60, 1709–1721. [Google Scholar] [CrossRef]
  26. Xu, F.; Nešumajev, D.; Konist, A. Thermal Decomposition Behaviors and Kinetic Parameter Calculations during Common Reed and Its Components Pyrolysis. Renew. Energy 2025, 248, 123130. [Google Scholar] [CrossRef]
  27. Bisen, D.; Chouhan, A.P.S.; Sarma, A.K.; Rajamohan, S.; Elumalai, P.V.; Balasubramanian, D.; Cherie, A. Thermogravimetric Analysis of Rice Husk and Low-Density Polyethylene Co-Pyrolysis: Kinetic and Thermodynamic Parameters. Sci. Rep. 2024, 14, 31798. [Google Scholar] [CrossRef]
  28. Brown, M.E.; Maciejewski, M.; Vyazovkin, S.; Nomen, R.; Sempere, J.; Burnham, A.; Opfermann, J.; Strey, R.; Anderson, H.L.; Kemmler, A.; et al. Computational Aspects of Kinetic Analysis. Part A: The ICTAC Kinetics Project—Data, Methods, and Results. Thermochim. Acta 2000, 355, 125–143. [Google Scholar] [CrossRef]
  29. Vyazovkin, S.; Burnham, A.K.; Criado, J.M.; Pérez-Maqueda, L.A.; Popescu, C.; Sbirrazzuoli, N. ICTAC Kinetics Committee Recommendations for Performing Kinetic Computations on Thermal Analysis Data. Thermochim. Acta 2011, 520, 1–19. [Google Scholar] [CrossRef]
  30. Koga, N.; Vyazovkin, S.; Burnham, A.K.; Favergeon, L.; Muravyev, N.V.; Pérez-Maqueda, L.A.; Saggese, C.; Sánchez-Jiménez, P.E. ICTAC Kinetics Committee Recommendations for Analysis of Thermal Decomposition Kinetics. Thermochim. Acta 2023, 719, 179384. [Google Scholar] [CrossRef]
  31. Di Blasi, C. Modeling Chemical and Physical Processes of Wood and Biomass Pyrolysis. Prog. Energy Combust. Sci. 2008, 34, 47–90. [Google Scholar] [CrossRef]
  32. Branca, C.; Albano, A.; Di Blasi, C. Critical Evaluation of Global Mechanisms of Wood Devolatilization. Thermochim. Acta 2005, 429, 133–141. [Google Scholar] [CrossRef]
  33. Yuan, T.Q.; You, T.T.; Wang, W.; Xu, F.; Sun, R.C. Synergistic Benefits of Ionic Liquid and Alkaline Pretreatments of Poplar Wood. Part 2: Characterization of Lignin and Hemicelluloses. Bioresour. Technol. 2013, 136, 345–350. [Google Scholar] [CrossRef]
  34. Tian, B.; Qiao, Y.Y.; Tian, Y.Y.; Liu, Q. Investigation on the Effect of Particle Size and Heating Rate on Pyrolysis Characteristics of a Bituminous Coal by TG–FTIR. J. Anal. Appl. Pyrolysis 2016, 121, 376–386. [Google Scholar] [CrossRef]
  35. Mariyam, S.; Al-Ansari, T.; McKay, G. Particle Size Impact on Pyrolysis of Multi-Biomass: A Solid-State Reaction Modeling Study. Energy Sources Part A Recovery Util. Environ. Eff. 2023, 45, 7088–7104. [Google Scholar] [CrossRef]
  36. White, J.E.; Catallo, W.J.; Legendre, B.L. Biomass Pyrolysis Kinetics: A Comparative Critical Review with Relevant Agricultural Residue Case Studies. J. Anal. Appl. Pyrolysis 2011, 91, 1–33. [Google Scholar] [CrossRef]
  37. Yang, H.; Yan, R.; Chen, H.; Lee, D.H.; Zheng, C. Characteristics of Hemicellulose, Cellulose and Lignin Pyrolysis. Fuel 2007, 86, 1781–1788. [Google Scholar] [CrossRef]
  38. Pecha, M.B.; Montoya Arbelaez, J.I.; Garcia-Perez, M.; Chejne, F.; Ciesielski, P.N. Progress in Understanding the Four Dominant Intra-Particle Phenomena of Lignocellulose Pyrolysis: Chemical Reactions, Heat Transfer, Mass Transfer, and Phase Change. Green Chem. 2019, 21, 2868–2898. [Google Scholar] [CrossRef]
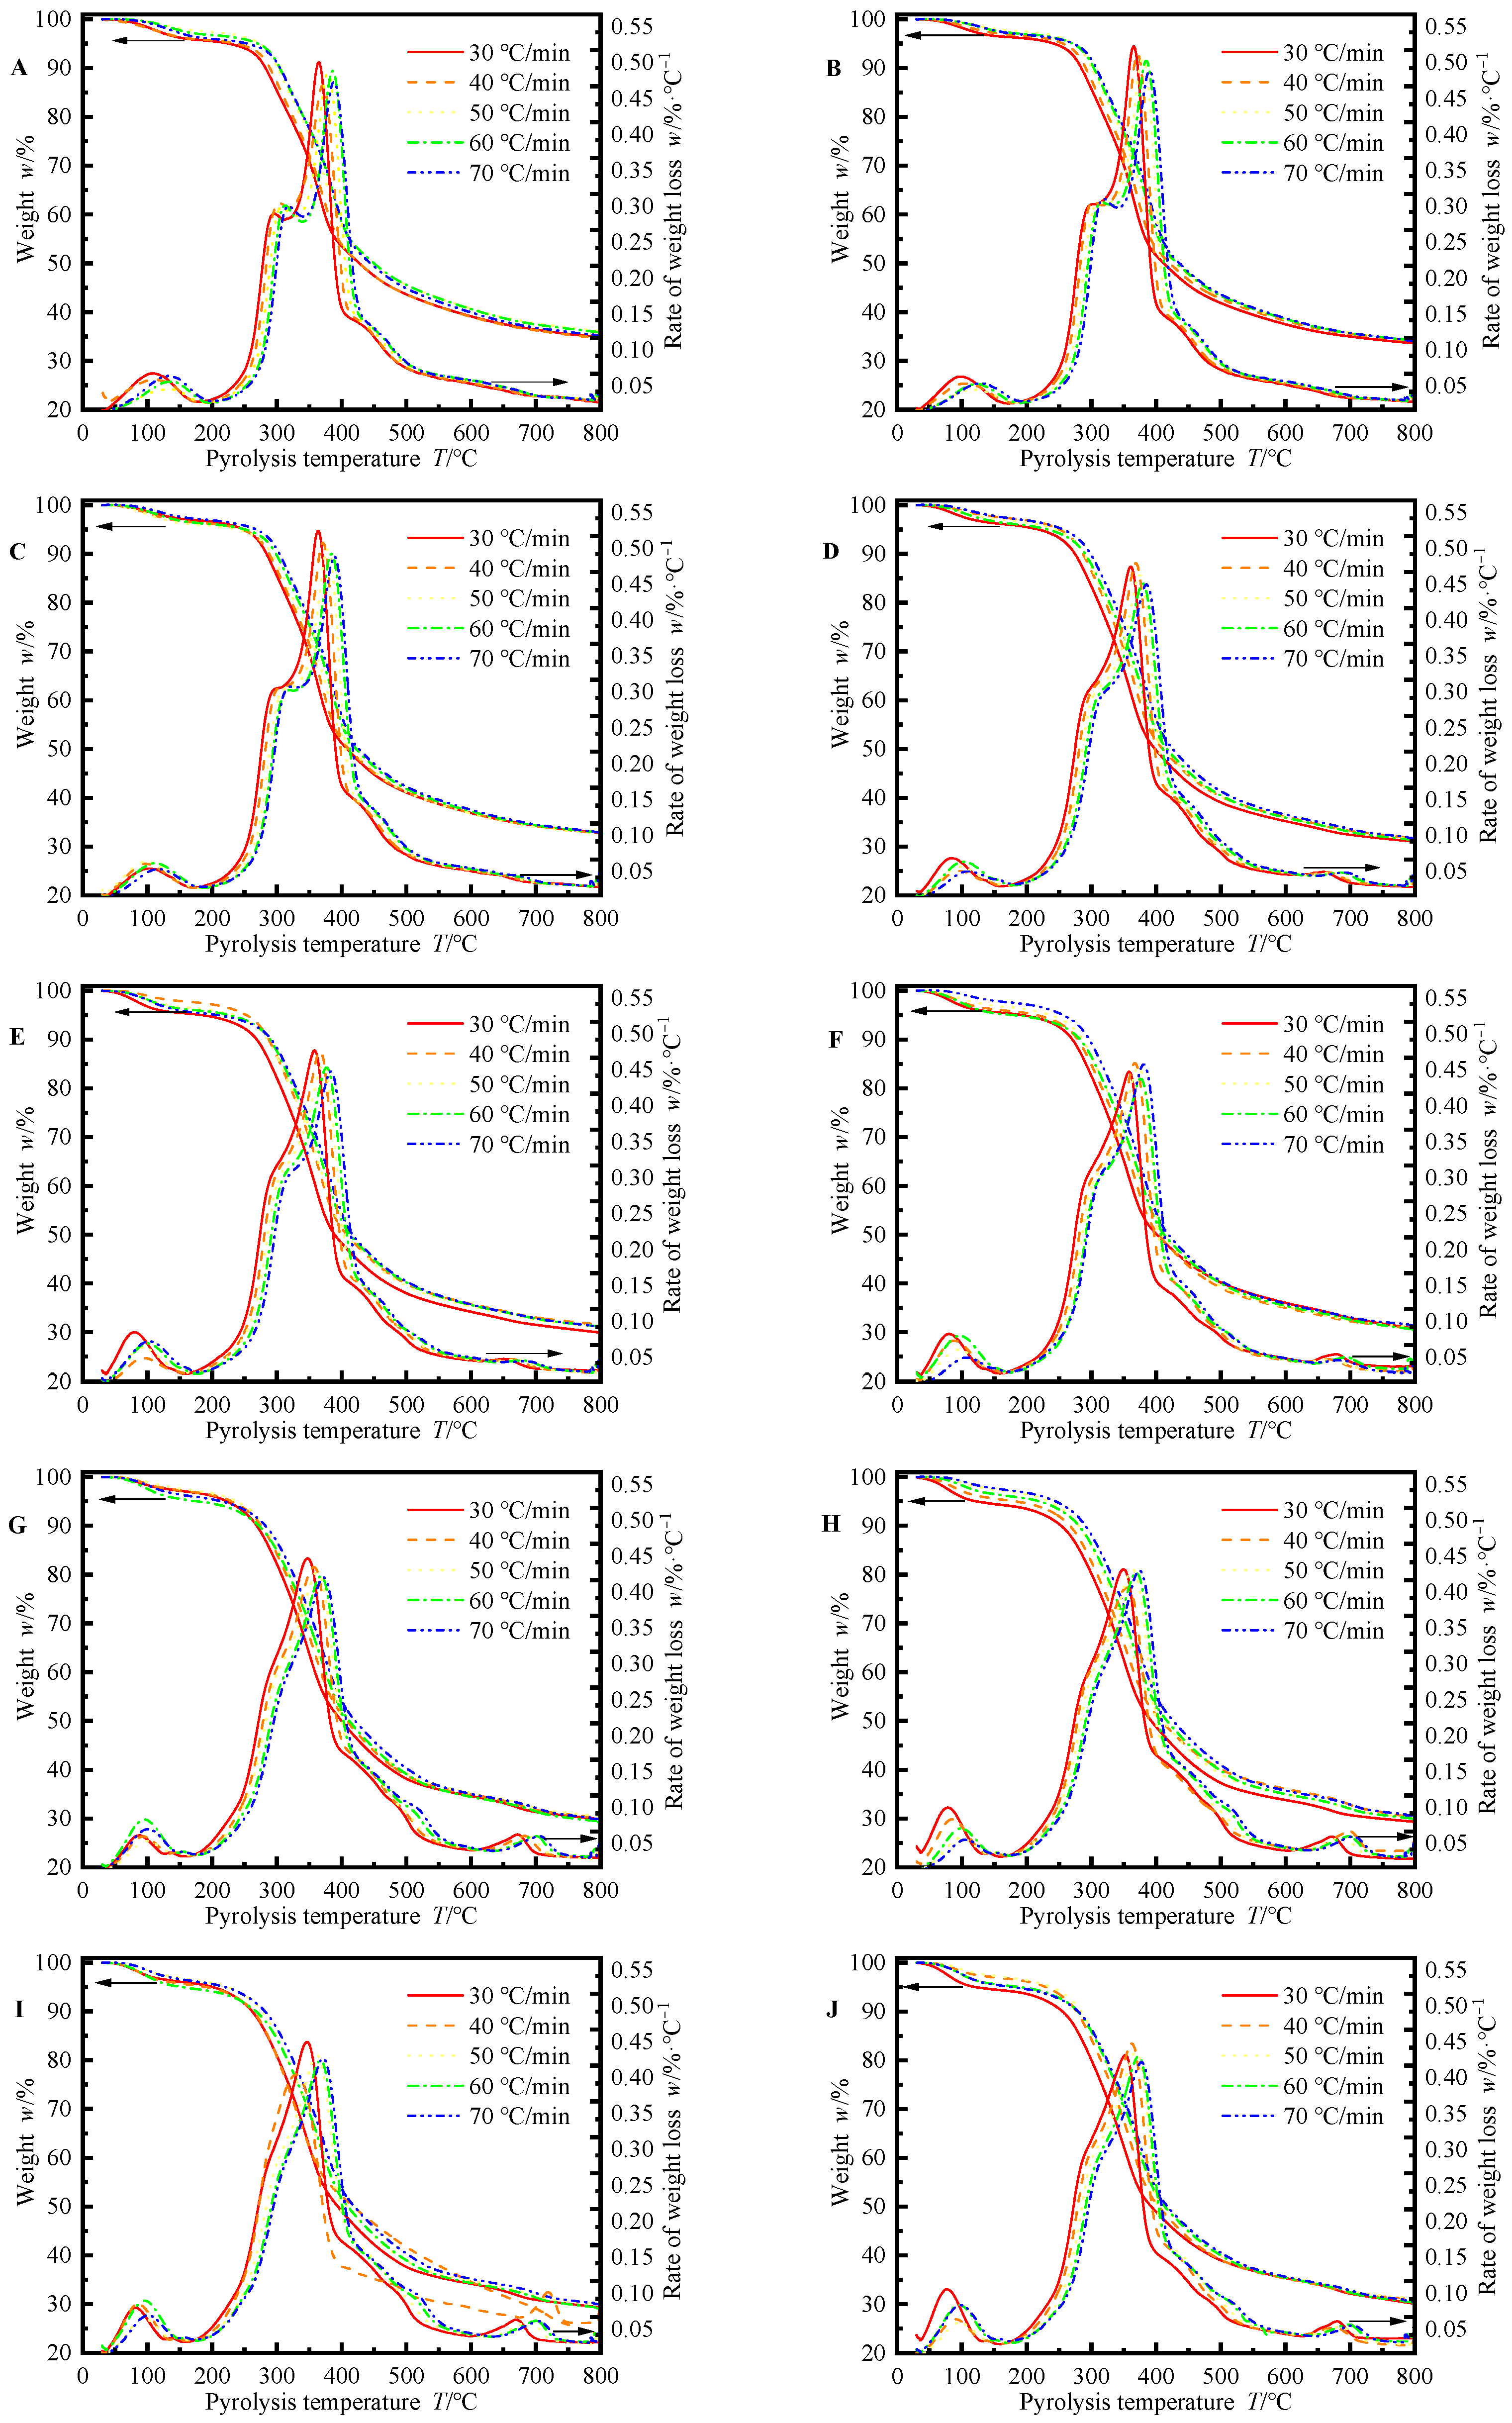
Figure 1. Calculated curves of thermal-mass loss and thermal-mass loss rate for tung seed shells with different particle sizes at various heating rates. ((A) ≥ 380 μm; (B) 250–380 μm; (C) 180–250 μm; (D) 150–180 μm; (E) 120–150 μm; (F) 109–120 μm; (G) 96–109 μm; (H) 80–96 μm; (I) 75–80 μm; (J) ≤ 75 μm.)
Energies 18 05842 g001
Figure 2. Apparent Activation Energy for the pyrolysis of tung seed shells with different particle size calculated by Coats–Redfern method.
Energies 18 05842 g002
Figure 3. Apparent Activation Energy at different extent of tung seed shell pyrolysis calculated by the Doyle method ((A). 96~109 μm; (B). ≤75 μm).
Energies 18 05842 g003
Figure 4. Apparent Activation Energy for tung seed shell pyrolysis with different particle sizes calculated by the Kissinger method.
Energies 18 05842 g004
Figure 5. TG–FTIR analysis of pyrolysis of 160–180 mesh tung seed shells. (A). Experimental curve of thermal mass-loss and thermal mass-loss rate of tung seed shells at heating rates of 5–20 °C/min; (B). In situ FTIR spectra of tung shells at a heating rate of 5 °C/min over an extended reaction time.
Energies 18 05842 g005
Table 1. Chemical composition and ultimate analysis of tung seed shell.
Sample Size/μmUltimate Analysis/%
CHON
≥38050.676.1942.380.30
250–38054.996.1638.120.30
180–25048.356.2844.380.30
150–18052.485.9938.360.77
120–15052.126.1339.210.62
109–12051.696.0739.240.80
96–10950.756.0537.391.34
80–9651.166.0237.221.28
75–8050.576.0137.491.37
≤7551.676.1637.490.97
Table 2. Results of pyrolysis temperature at the maximum pyrolysis rate.
Particle Size/μmTmax/°CEquation
30 °C/min40 °C/min50 °C/min60 °C/min70 °C/minTmax = aβ + b
≥380365.26371.74379.37386.82389.15a = 0.6286, b = 347.04
R = 0.9771
250–380366.01371.61380.59385.77390.78a = 0.6370, b = 347.10
R = 0.9885
180–250364.27371.16378.10384.48389.65a = 0.6408, b = 345.49
R = 0.9968
150–180360.99368.78374.73379.65384.77a = 0.5843, b = 347.04
R = 0.9904
120–150358.05366.66371.14376.62383.42a = 0.6070, b = 340.83
R = 0.9898
109–120358.41367.13372.49376.24380.77a = 0.5383, b = 344.09
R = 0.9704
96–109347.71356.73362.31368.36371.98a = 0.6017, b = 331.33
R = 0.9774
80–96349.23355.69363.70369.16374.45a = 0.6391, b = 330.49
R = 0.9937
75–80346.68355.85361.81367.04371.10a = 0.6003, b = 330.48
R = 0.9754
≤75352.78362.65369.34373.05377.97a = 0.6078, b = 336.77
R = 0.9635
Table 3. Results of A and R obtained by Coats–Redfern method for tung seed shell with different particle sizes.
Particle Size/μmA/min−1R
≥3803.0676 × 103−0.9962
250–3809.3746 × 102−0.9996
180–2509.4402 × 103−0.9992
150–1801.1530 × 103−0.9998
120–1501.2927 × 103−0.9997
109–1201.1064 × 103−0.9999
96–1093.7174 × 102−0.9941
80–969.7586 × 10²−0.9996
75–801.8563 × 10³−0.9997
≤759.0325 × 10²−0.9998
Table 4. Results of A and R obtained by the Kissinger method for tung seed shell with different particle size.
Particle Size/μmA/min−1R
≥3804.1305 × 1080.9789
250–3803.6636 × 1080.9809
180–2503.6665 × 1080.9921
150–1802.6269 × 1090.9987
120–1508.7734 × 1080.9812
109–1201.2891 × 10100.9913
96–1096.8004 × 1080.9958
80–962.2314 × 1080.9906
75–806.7291 × 1080.9963
≤755.0796 × 1080.9871
Disclaimer/Publisher’s Note: The statements, opinions and data contained in all publications are solely those of the individual author(s) and contributor(s) and not of MDPI and/or the editor(s). MDPI and/or the editor(s) disclaim responsibility for any injury to people or property resulting from any ideas, methods, instructions or products referred to in the content.