1. Introduction
The rapid expansion of solar photovoltaic (PV) system installations requires reliable and effective monitoring to maintain optimal system performance. Manual inspection methods, such as visual walkthroughs or electrical testing, are labor-intensive, time-consuming, and often unsafe when dealing with large-scale or rooftop installations. Unmanned aerial vehicles (UAVs) equipped with infrared (IR) and RGB cameras, combined with advanced machine learning algorithms like YOLO (You Only Look Once), have emerged as a groundbreaking solution for autonomous solar system inspection. UAVs offer rapid site coverage, improved operational safety, and enhanced defect detection fidelity in terms of thermal anomalies, soiling, and mechanical damage [
1].
Recent advances in enabling technologies include the development of multimodal fusion techniques and real-time onboard processing. For instance, integrated frameworks leveraging both thermal and visual modalities have demonstrated improved classification accuracy and robustness in complex lighting environments [
2,
3]. Keypoint-based detection architectures tailored to solar panel geometry have further advanced detection efficiency, enabling high frame-rate operation on embedded platforms [
4].
In the context of contemporary PV system maintenance, the rapid progression of defects poses a substantial operational challenge. Early-stage anomalies, including partial cell failures, have been observed to progress into fully degraded cells within a few months period, often resulting in additional failures in neighboring cells. This cascading effect underscores the significance of early and comprehensive detection [
5]. The identification of a unified UAV inspection strategy capable of capturing all major defect types—thermal anomalies, bird droppings, dust accumulation, and varying stages of cell failure—is critical for enabling timely maintenance and preventing large-scale performance degradation across solar arrays.
Several studies have investigated PV defect detection using UAVs in combination with machine learning algorithms. The following paragraphs discuss the published studies on this subject of the last couple of years. It is noted that YOLO-based models are predominantly employed as they provide an effective balance between detection speed, accuracy, and computational efficiency for real-time applications. In contrast to two-stage detectors, YOLO operates as a single-stage object detector, enabling the rapid processing of high-resolution UAV imagery—an essential capability for large-scale PV plant inspections.
A method utilizing the DJI Mavic Mini drone and the YOLOv11 model was introduced by Xiang et al. [
6] to automate the inspection and defect detection of rooftop solar PV systems. The drone operated at a mapping height of 50 m, with a camera pitch angle of 90°, ensuring a nadir view optimal for capturing high-resolution images. This altitude was selected to balance image clarity with coverage area, enhancing operational efficiency by reducing the number of required flights and battery consumption. Furthermore, horizontal and vertical overlaps were set to 90%, ensuring seamless image stitching and robust coverage despite potential environmental disturbances. This configuration enabled the system to accurately identify defects such as cracks, discoloration, and delamination, achieving a mAP@0.5 of 0.577.
A monitoring system based on various YOLO computer vision models was introduced by Vourkos et al. [
7] to enhance the detection of hotspots and dirt accumulation on photovoltaic panels using drone-acquired aerial imagery. The study employed a DJI Mavic 2 Enterprise drone to collect both thermal and optical images across four different PV installations, with flight altitudes ranging from 1.22 to 4.85 m and camera angles set at 0°, 20°, 25°, and 90°, depending on the system configuration. This variation in drone parameters allowed the evaluation of different model performances under diverse operational conditions. Five YOLO models (YOLOv5, YOLOv7, YOLOv8, YOLO-NAS, and YOLOv9) were systematically compared using custom datasets targeting bird droppings and thermal hotspots. YOLOv5 achieved the highest mAP@0.5, reaching up to 0.994 for the bird dropping dataset and 0.993 for the hotspot dataset.
A soiling detection system using aerial RGB imagery was developed by Naeem et al. [
8] to inspect the cleanliness of solar photovoltaic panels, with a particular focus on detecting bird droppings and dust. The system employed the DJI Matrice 300 RTK drone, configured to fly at an altitude of 10 m with a camera angle of 90° and a flight speed of 23 m/s. Image overlap ranged between 60% and 80%, optimizing coverage and ensuring reliable data continuity. The drone’s extended flight range of 7000 m and endurance of 55 min supported efficient inspection over large installations. A custom AI model, SDS-YOLO, was introduced, incorporating a Convolutional Block Attention Module (CBAM) and dual detection heads tailored to bird droppings and dust. This model outperformed standard YOLO versions (YOLOv5, YOLOv8, YOLOv11), particularly in detecting small and indistinct features such as bird droppings, achieving a mAP@0.5 ranging from 0.698 to 0.76.
An anomaly detection system for PV modules was introduced by Pinho et al. [
9], utilizing an Autonomous Aerial Vehicle equipped with both thermal and visual cameras to enhance inspection accuracy through multi-modal data fusion. The approach involved early integration of visual and thermal data to detect defects in real time, supported by a standardized dataset. Flights were conducted at altitudes of 2.5 m and 14 m, with corresponding camera angles of 60° and 90°, enabling analysis under different spatial and angular conditions. The system employed both RT-DETR and YOLOv11 models for defect detection, achieving high mean mAP@0.5 values of 0.94 and 0.95, respectively.
A hotspot defect detection algorithm based on infrared aerial imagery, LFS-YOLOv10, was developed by Ma et al. [
10] to enhance the autonomous perception capabilities of drone-based inspection systems in PV power plants. Utilizing the DJIJingwei M350RTK drone (SZ DJI Technology Co., Ltd., Shenzhen, Guangdong, China) at a flight altitude of 50 m and a camera angle of 90°, the system was designed to address practical challenges such as varying defect morphologies, indistinct boundaries, and small target detection. The model focused on detecting critical objects of interest, including solar cell defects, diode failures, and occlusion. It achieved a mAP@0.5 of 0.919, significantly improving detection accuracy and reducing defect omission rates, thereby offering robust technical support for infrared-based UAV inspections of PV panels.
An automated snow coverage detection framework was proposed by Saleem et al. [
11], utilizing drone imagery and deep learning to enhance the operational efficiency of solar photovoltaic systems in snowy environments. The system employed the Parrot Anafi Gov drone, operating at multiple altitudes and camera angles, to capture images of snow-affected panels under various conditions. YOLOv11 was used to detect snow as the primary object of interest, achieving a mAP@0.5 of up to 0.93. By calculating snow coverage percentage (SCP), the framework supports efficient snow removal planning, minimizes panel downtime, and enhances energy yield forecasting.
An AI-based drone inspection method was developed by Ozer et al. [
12] to detect the condition of solar panels in large-scale and elevated installations, aiming to reduce operational time and cost. The system utilized a custom drone equipped with a Raspberry Pi 4B and camera, operating at altitudes ranging from 2 to 6 m with variable tilt angles and a fixed gimbal angle of 0°. The objects of interest included dust accumulation and physical damage to the panels. A Histogram Equalization (HE)-based preprocessing technique was applied to enhance image quality before training deep learning models. Among the evaluated algorithms, i.e., YOLOv5, YOLOv7, and YOLOv8, yolov5l demonstrated the best performance, achieving a mAP@0.5 of 0.981 and an F1 score of up to 0.97 during real-time implementation.
A low-cost AI-based drone system for solar panel condition monitoring was developed by Ozer et al. [
13], aiming to simplify the time-consuming inspection process of large-scale and rooftop solar installations. The custom-built drone operated at altitudes ranging from 2 to 8 m, with tilt angles between 30° and 45° and a fixed gimbal angle of 0°. The system focused on detecting dust and physical damage, using convolutional neural network-based models trained on a custom dataset of 1100 annotated images. YOLOv5, YOLOv6, and YOLOv8 algorithms were evaluated across two detection approaches, with YOLOv5s achieving the highest mAP@0.5 of 0.89. Results indicated that higher flight altitudes led to lower detection performance.
A refined hotspot defect detection framework, RGR-Net, was developed by Zhao et al. [
14] to address the challenges of multi-height UAV-based inspection in photovoltaic farms. The system employed the DJI M200 V2 (SZ DJI Technology Co., Ltd., Shenzhen, Guangdong, China) drone, operating at altitudes of 28, 38, 47, and 60 m with a tilt angle of 54° and a gimbal angle of 60°, flying at speeds between 5 and 10 m/s. Targeting thermal defects, the proposed RGR-Net integrated a Cross-embedding Refined Graph Reasoning (CRGR) module to enhance feature representation and mitigate information loss and noise interference, which is common in aerial PV data. Performance evaluation using the newly introduced Multi-Height Hotspot Dataset (MHHS) demonstrated the model’s effectiveness across varying altitudes, achieving Average Precision scores of 0.898, 0.789, 0.865, and 0.806, respectively.
Table 1 summarizes the related works for comparison, presenting an overview of recent UAV-based photovoltaic inspection studies published between 2023 and 2025. Each entry outlines the key components of the inspection framework, including the defect types targeted (e.g., cracks, bird droppings, dust, snow, or diode failure), the deep learning algorithm employed—primarily various versions of YOLO—and the UAV platform specifications. Additionally, crucial flight parameters such as operational altitude, pan and tilt angles, and speed are included to contextualize each study’s methodology.
From the previously discussed studies on the subject, it is noted that UAV flight parameters are defined either arbitrarily or empirically when conducting PV inspections.
Table 1 reveals a lack of standardized UAV flight parameter settings in PV defect detection research. Most studies rely on fixed nadir views (−90° tilt, 0° pan) and empirically chosen altitudes, while speed is rarely documented. This inconsistency suggests that defect detection performance may be strongly influenced by non-optimized flight configurations, reinforcing the need for systematic evaluation and optimization of UAV flight parameters to improve detection reliability and comparability across studies.
Subsequently, this study extends the existing literature by systematically examining the influence of UAV flight parameters, specifically altitude, camera pan, and tilt, flight speed, and time of day on defect detection performance using the YOLOv11 model. The analysis focuses on the accurate and reliable identification of critical PV defects such as hotspots, dirt spots from bird droppings, dust accumulation, and cell-level failures. By combining empirical flight tests with detailed defect annotation and benchmarking against visual inspection, this research aims to establish optimal UAV configuration guidelines that enhance the reliability of PV plant maintenance and fault detection.
2. Methodology
For the purposes of this study, experimental procedures were conducted under varying flight parameters at a full-scale PV park located at the central part of Cyprus (eastern part of Mediterranean), with an installed capacity of 150 kW. The installation consists of 600 mono-Si solar panels arranged in single-row string configurations, enabling the independent analysis of each string’s performance. It should be noted that all panels are installed with a fixed tilt angle of 25°, aligned towards the south in order to maximize solar irradiance capture in the Northern Hemisphere. The site provides a representative environment for the testing of inspection methodologies, as it reflects the structural and operational characteristics of typical commercial-scale PV systems. Flights were conducted under comparable lighting and ambient parameters, thereby ensuring data consistency across the evaluation period.
2.1. UAV Platform and Camera Configuration
The DJI Mavic 2 Enterprise Dual (M2ED) drone (SZ DJI Technology Co., Ltd., Shenzhen, Guangdong, China) was used because of its compact design and integrated dual-camera system. This system combines a high-resolution visual sensor with a thermal imaging module that is ideal for industrial inspection tasks. The RGB camera features a 1/2.3-inch CMOS sensor with 12-megapixel resolution and an 85-degree field of view. It supports 4K video recording at 30 frames per second (fps), enabling high-detail surface analysis of defects such as soiling and mechanical damage. The thermal camera uses an uncooled VOx microbolometer with 160 × 120 resolution and a 57° horizontal field of view. It operates across the 8–14 μm spectral band. It outputs thermal data with a resolution of 640 × 512 at 8.7 fps and can detect scenes with temperatures ranging from −10 °C to +400 °C, depending on the gain mode. The aircraft was operated via the DJI Pilot application using predefined straight-line routes to ensure repeatability and consistency across data acquisition sessions. GPS-assisted navigation and a stabilized gimbal contributed to precise and reliable image alignment under various flight conditions.
2.2. Dataset Development
In this study, two datasets were developed. The first is a thermal defect dataset comprising 14,000 thermal infrared images, used to detect heat-related anomalies such as overheated junction boxes, hotspots caused by bird droppings, and cell failures of varying intensity. The second is a dust dataset consisting of 24,000 RGB images, specifically designed to identify dust accumulation on PV panels.
To ensure the spatio-temporal diversity and universality of the conclusions, both datasets include images captured from multiple PV parks located in different regions, encompassing various PV module types and installation geometries. The images were collected at different times of the day, under diverse illumination levels and ambient conditions, to reflect real operational variability. Furthermore, data augmentation techniques such as rotation, flipping, brightness variation, and scaling were applied to enhance generalization and increase the effective size of the dataset.
2.2.1. Thermal Defect Dataset
Thermal Defect Dataset is a comprehensive dataset comprising 14,000 IR images developed to facilitate the detection and classification of thermal defects in PV modules. The images were extracted from video footage captured during multiple drone flights conducted across several PV parks. These flights were performed under a diverse set of conditions, including variations in altitude, camera pan and tilt angles, and time of the day, thereby capturing different solar positions and irradiance levels. This diversity in acquisition parameters enhances the robustness of the dataset by exposing the model to multiple ambient and geometric conditions. The images collected concerned PV panels mounted at 25° tilt angles during summer and 45° during fall.
The images were captured at a resolution of 640 × 512 pixels, providing sufficient detail for precise defect localization. The dataset was manually annotated into four distinct defect categories, each corresponding to a thermally relevant abnormality:
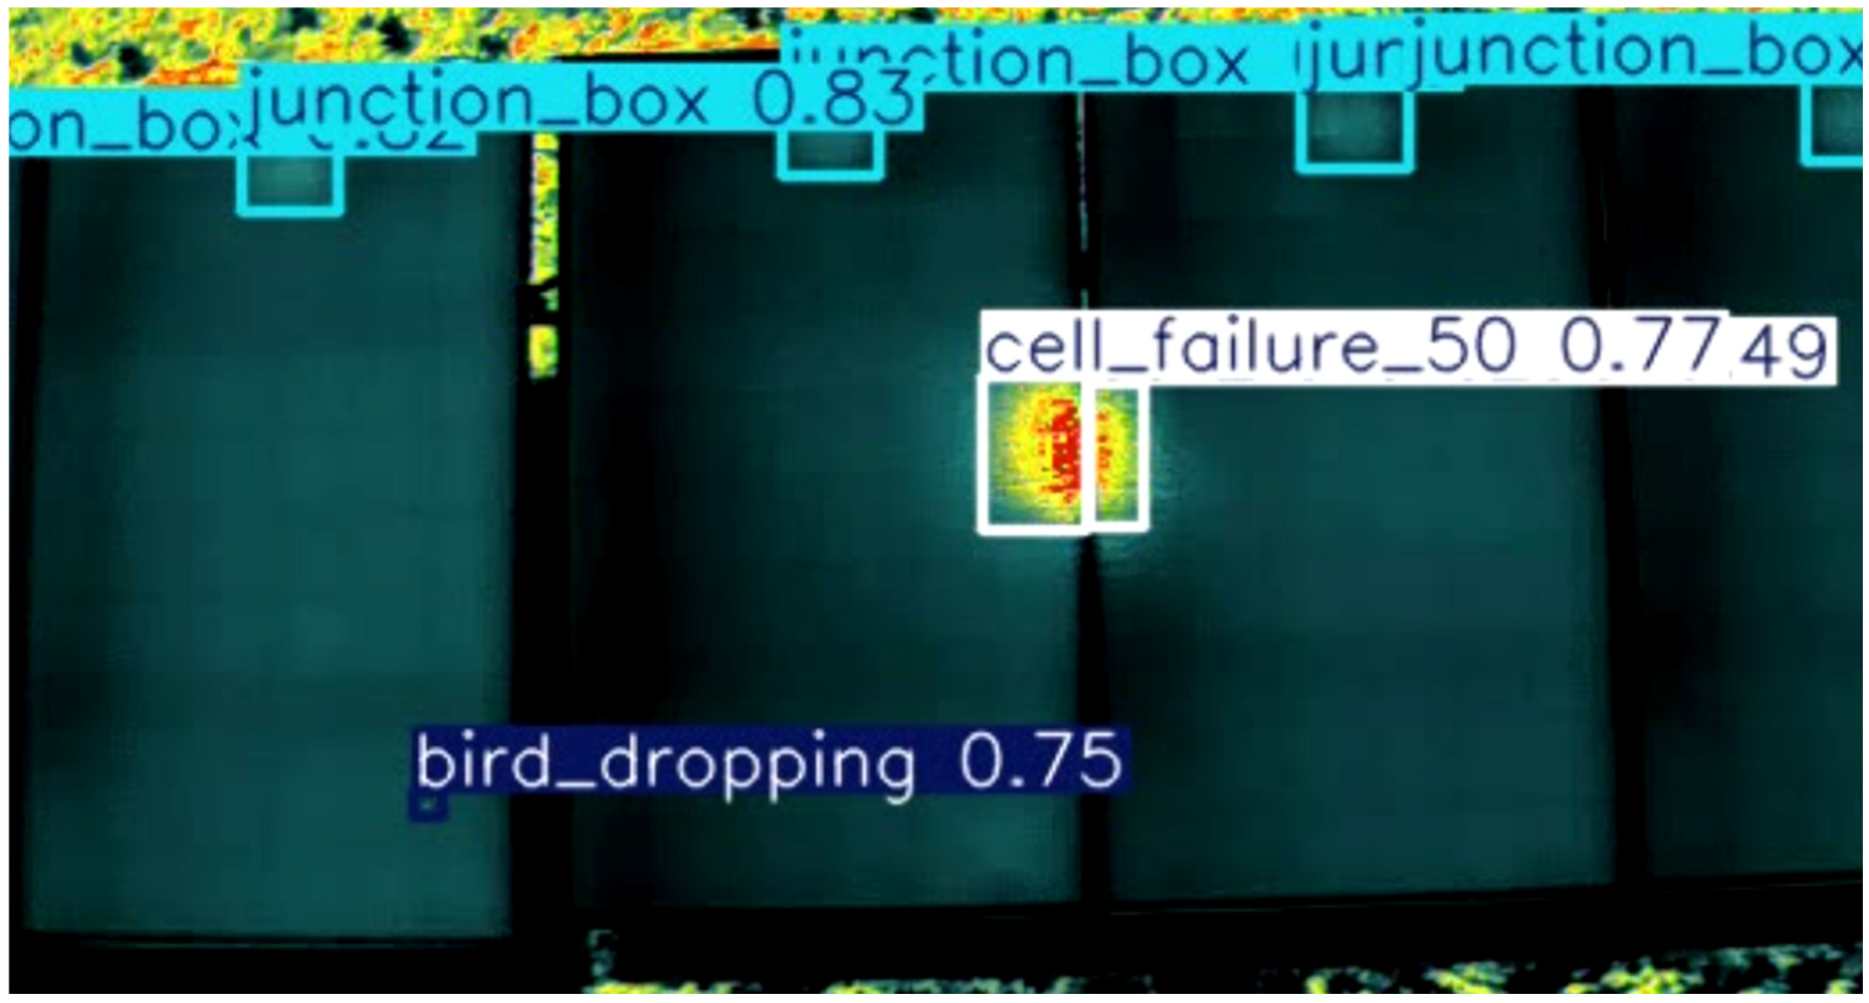
Overheated Junction Box. This is typically associated with aging or degraded panels. These thermal anomalies manifest as localized heat signatures at electrical junctions.
Bird Dropping-Induced Hotspots. Partial shading due to bird droppings results in localized overheating, often appearing with moderate temperature gradients.
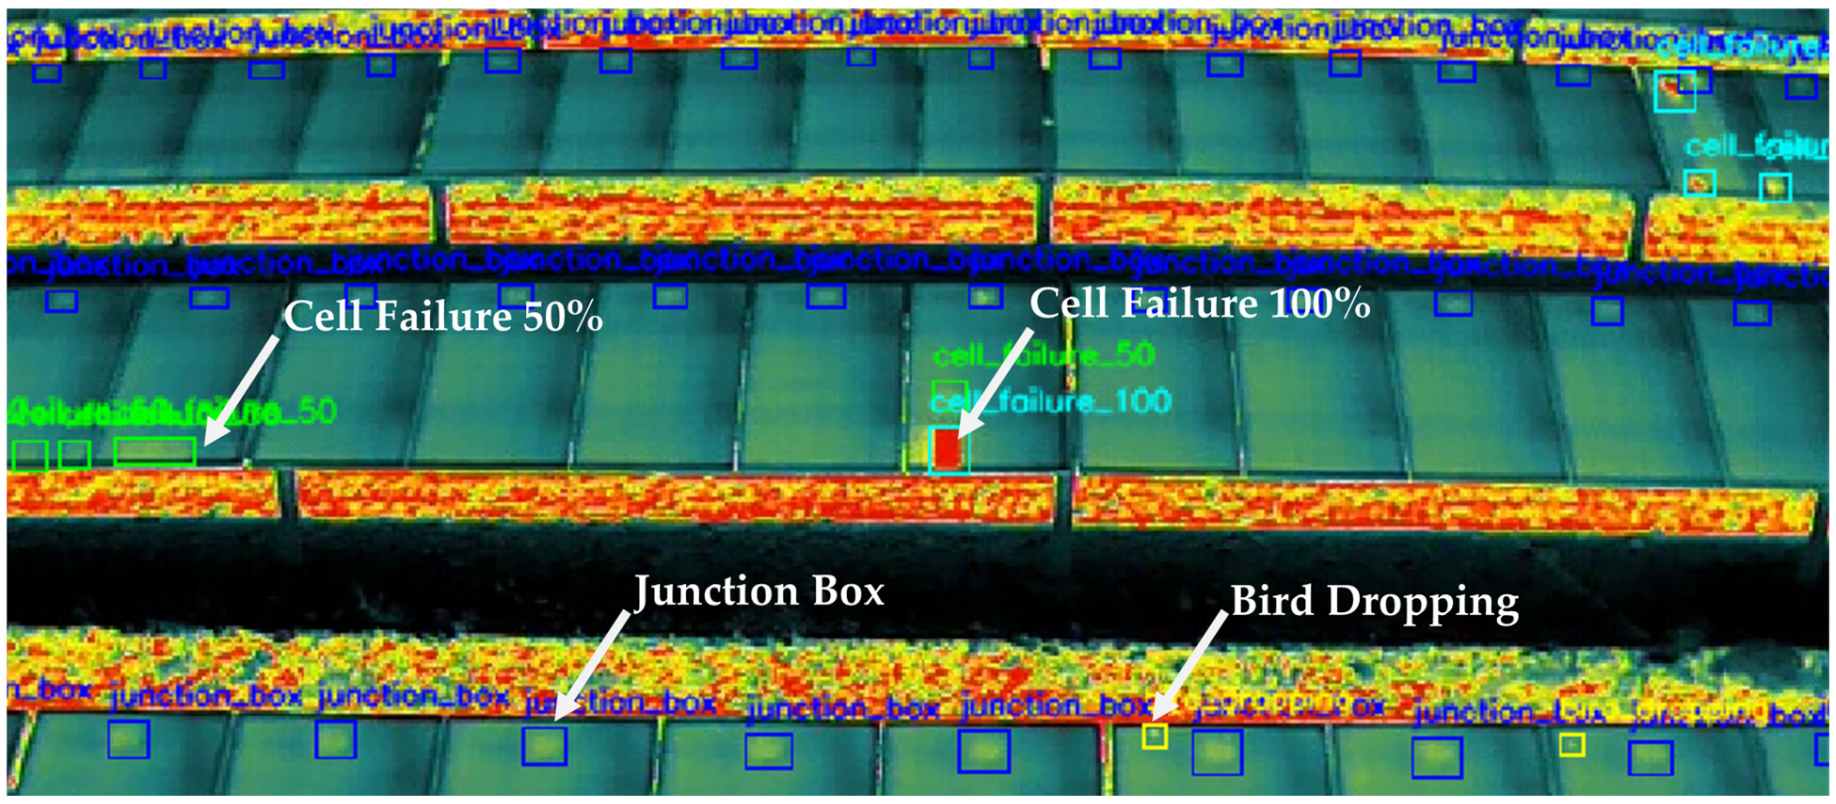
Cell Failure 50%. This is characterized by defect formation covering up to half of the affected cell area, generally appearing in orange to bright yellow tones.
Cell Failure 100%. This is defined by full or near-complete failure (50–100%) of the cell, typically manifesting in deep red tones indicating high heat intensity.
Since the datasets were derived from a real PV system, each image may contain multiple annotated instances across these categories. In total, the dataset includes over 79,753 annotations for overheated junction boxes, 5887 annotations for bird droppings, 9802 for partial cell failures, and 4686 for complete cell failures.
The dataset was split into training, validation, and test subsets with a ratio of 77.3% (10,824 images) for training, 19.4% (2710) for validation, and 4.0% (567) for testing. This allocation ensures that each category is adequately represented across all subsets, supporting consistent model evaluation. To further improve generalization, data augmentation techniques such as random horizontal flipping, brightness variation, and contrast normalization were applied [
7,
15]. These enhancements are particularly important in infrared imaging, where ambient temperature and sensor noise can affect model performance.
Figure 1 presents an IR image which encompasses all four categories of the Thermal Defect Dataset.
2.2.2. Dust Dataset
To investigate the influence of dust accumulation on PV surface soiling on the operational efficiency of solar PV modules, a large-scale dataset consisting of 24,000 high-resolution RGB images was developed. The images were captured across several PV installations, representing a wide spectrum of environmental and structural conditions. Panel tilt angles in the dataset ranged from 20° to 45°, reflecting the diversity of mounting configurations observed in real-world rooftop and ground-mounted systems. Each image was captured at a resolution of 1920 × 1080 pixels, allowing for detailed visual analysis of dust distribution patterns.
The dataset was generated from aerial images collected during a series of drone flights, conducted at varying altitudes, pan and tilt angles, and across different times of the day, including early morning, midday, and late afternoon. These variations in the solar position were intentionally incorporated to account for changes in illumination, shadowing, and reflectivity factors that significantly influence the visibility of fine particulate matter on the surface of PV panels such as soil or dust.
Images were manually annotated into two binary classes:
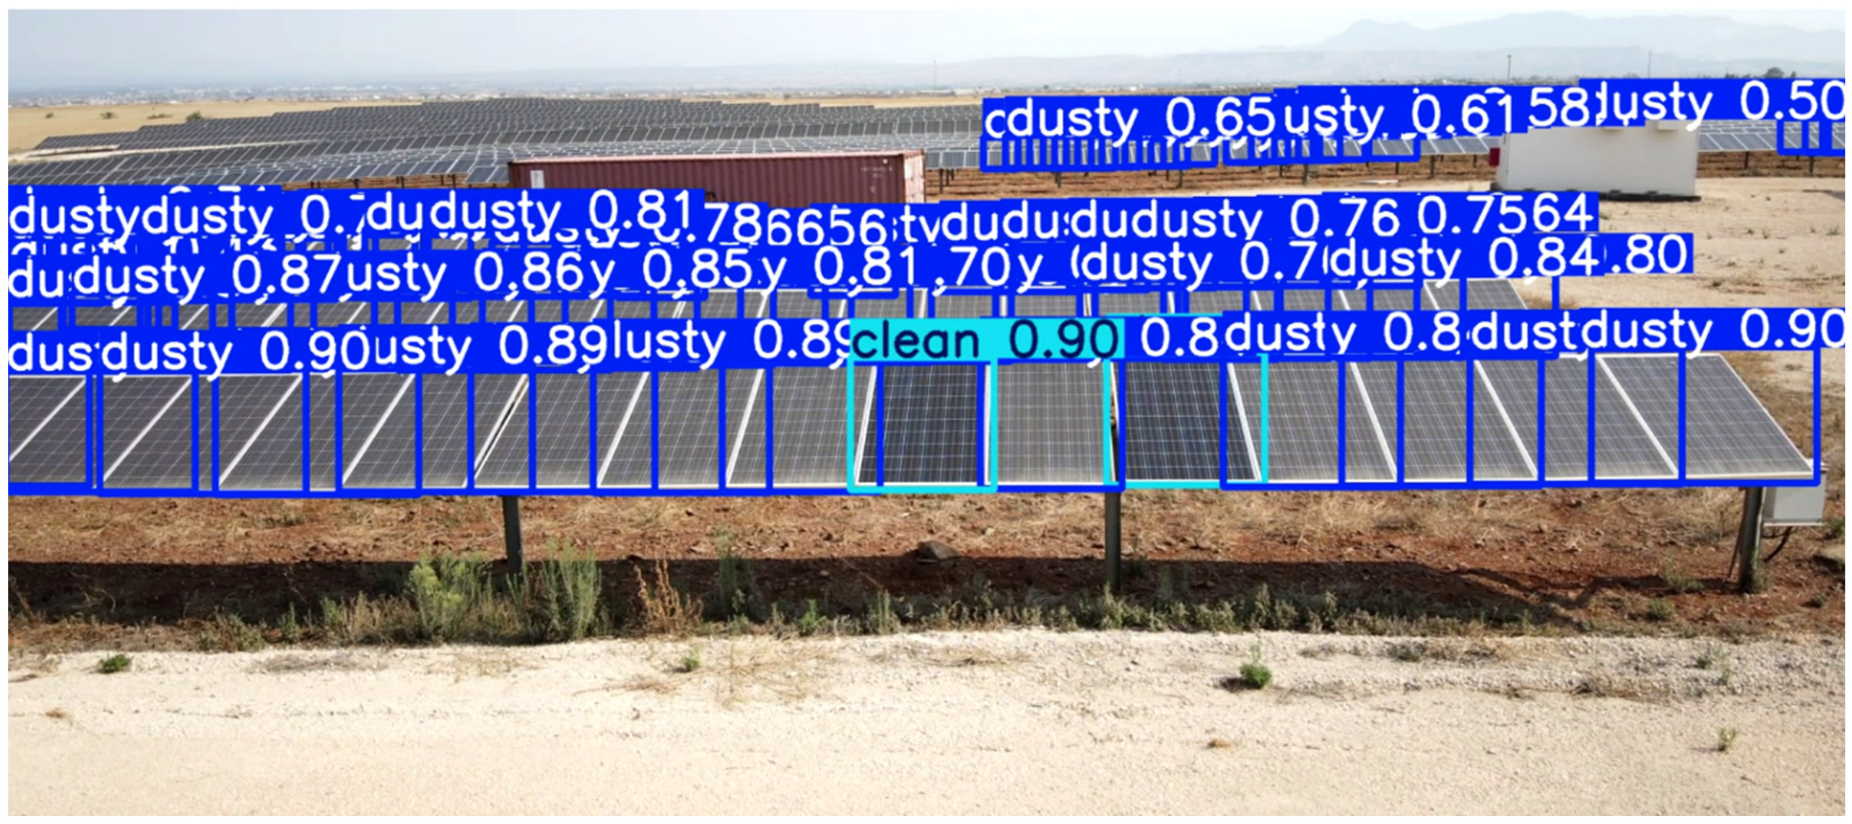
Dusty panels exhibiting visible accumulation of airborne particles, often characterized by a uniform dullness or localized surface discoloration.
Clean panels free from noticeable dust or particulate deposits, representing optimal maintenance conditions.
In total, the dataset contains 285,000 bounding box annotations corresponding to dusty regions, and 173,000 annotations for clean panel sections. Many images contain multiple instances of both clean and dusty panels, thereby increasing the complexity and variability of the dataset.
The dataset was partitioned using stratified random sampling to preserve class distribution across subsets. The split resulted in 18,260 images for training, 4566 for validation, and 1174 for testing, enabling robust model development and unbiased performance evaluation. In order to improve the generalization capability of the models, augmentation techniques such as histogram equalization, pixel value normalization, and random cropping were applied. These enhancements mitigate the impact of lighting disparities, sensor noise, and environmental variability. A representative RGB image that includes the two distinct categories of the Dust Dataset is shown in
Figure 2.
2.3. Deep Learning Architecture and Training
The defect detection tasks were implemented using the YOLOv11 object detection framework, which is renowned for its real-time inference capability and strong spatial localization performance. The Ultralytics library was utilized as a training and inference environment due to its modular structure and extensive support for YOLO variants. Each dataset was trained independently using YOLOv11, and pre-trained weight packages were utilized to accelerate convergence and improve detection precision. The training configurations were optimized for each dataset based on the characteristics of the objects, with hyperparameters such as batch size, learning rate, and input resolution being adjusted accordingly. Monitoring of loss functions was undertaken to ensure proper convergence, with early stopping being applied to prevent overfitting. The evaluation metrics employed included precision, recall, F1 score, and mean Average Precision at an IoU threshold of 0.5 (mAP@0.5), thereby providing a standardized basis for comparing model performance across different datasets [
7,
15].
2.4. Flight Parameters Under Consideration
A series of structured flight tests were conducted for the purpose of evaluating the influence of drone flight parameters on defect detection performance. For each dataset, multiple flights were conducted within the same week in mid-July 2025, under similar lighting and weather conditions to minimize variability. It is important to note that both thermal and RGB images were recorded at the same time for each flight, ensuring that identical YOLO models could be tested across different flight configurations without the potential for bias from dataset variation. The UAV flight parameters varied during the experimental tests included the following:
Flight Altitude: The range of views extends from low-level inspection to higher-overhead views, with the impact of these views on ground sample distance and coverage.
Pan Angle: The drone’s horizontal rotation during flight was found to have an impact on the lateral field of view.
Tilt Angle: The vertical orientation of the camera relative to the panel surface was controlled, thereby affecting the level of detail and perspective.
Flight Speed: The evaluation of motion blur and image sharpness in real-time capture was conducted by varying the range between slow and moderate speeds.
Sun Position: The following factors must be considered in order to arrive at a comprehensive evaluation of the subject: firstly, its influence on reflectance, secondly, shadowing, and thirdly, thermal gradients across panel surfaces.
Each configuration was replicated across all datasets in order to determine the parameter set that achieves the highest detection accuracy for each defect type. To assess the impact of solar position on the performance of real-time defect detection, four rounds of drone flights were conducted across four different times of the day, namely morning, midday, afternoon, and late afternoon. In each round, the same predefined UAV flight path was executed autonomously to capture an identical set of visual and thermal video sequences under varying lighting conditions. This systematic approach facilitated a direct comparison of the YOLOv11 model’s performance across datasets acquired with different sun panel angles. By maintaining all other flight parameters constant, the study isolated the influence of solar position on image quality, shadow presence, reflectance, and thermal contrast. This analysis yielded insights into the way, the direction, and intensity of sunlight influence the visibility and detectability of surface-level and thermal defects during UAV-based inspections.
The experimental design was structured to deal with confounding effects by ensuring testing under consistent ambient/weather as well as operational conditions during all flights.
Table 2 presents a comprehensive overview of the 21 unique UAV flight configurations examined, varying in altitude, pan and tilt angles, and UAV flight speed. Each set was executed within a one-hour time window at four distinct times of day to assess the impact of solar position on image-based defect detection. The flight altitudes ranged from 2 to 12 m, enabling analysis across both low-altitude close-up inspections and higher, broader field-of-view captures. A comprehensive array of tilt angles was subjected to rigorous testing, encompassing both shallow angles, such as −10°, which offer near-horizontal views, and steep nadir angles of −90°, providing a direct overhead perspective. This variation permitted a comprehensive evaluation of the impact of viewing geometry on the visibility of defects under varying illumination conditions.
Furthermore, the pan angle and flight speed were selectively varied at specific height and tilt combinations in order to investigate their secondary influence. Pan angles were adjusted only at 8 m with a −30° tilt to include lateral perspectives of −45°, 0°, and +45°, while speeds of 1.0, 1.8, and 2.6 m/s were tested exclusively at 4 m with a −30° tilt. The objective of these targeted variations was to determine whether directional orientation and motion dynamics impact detection performance when other critical parameters are constant.
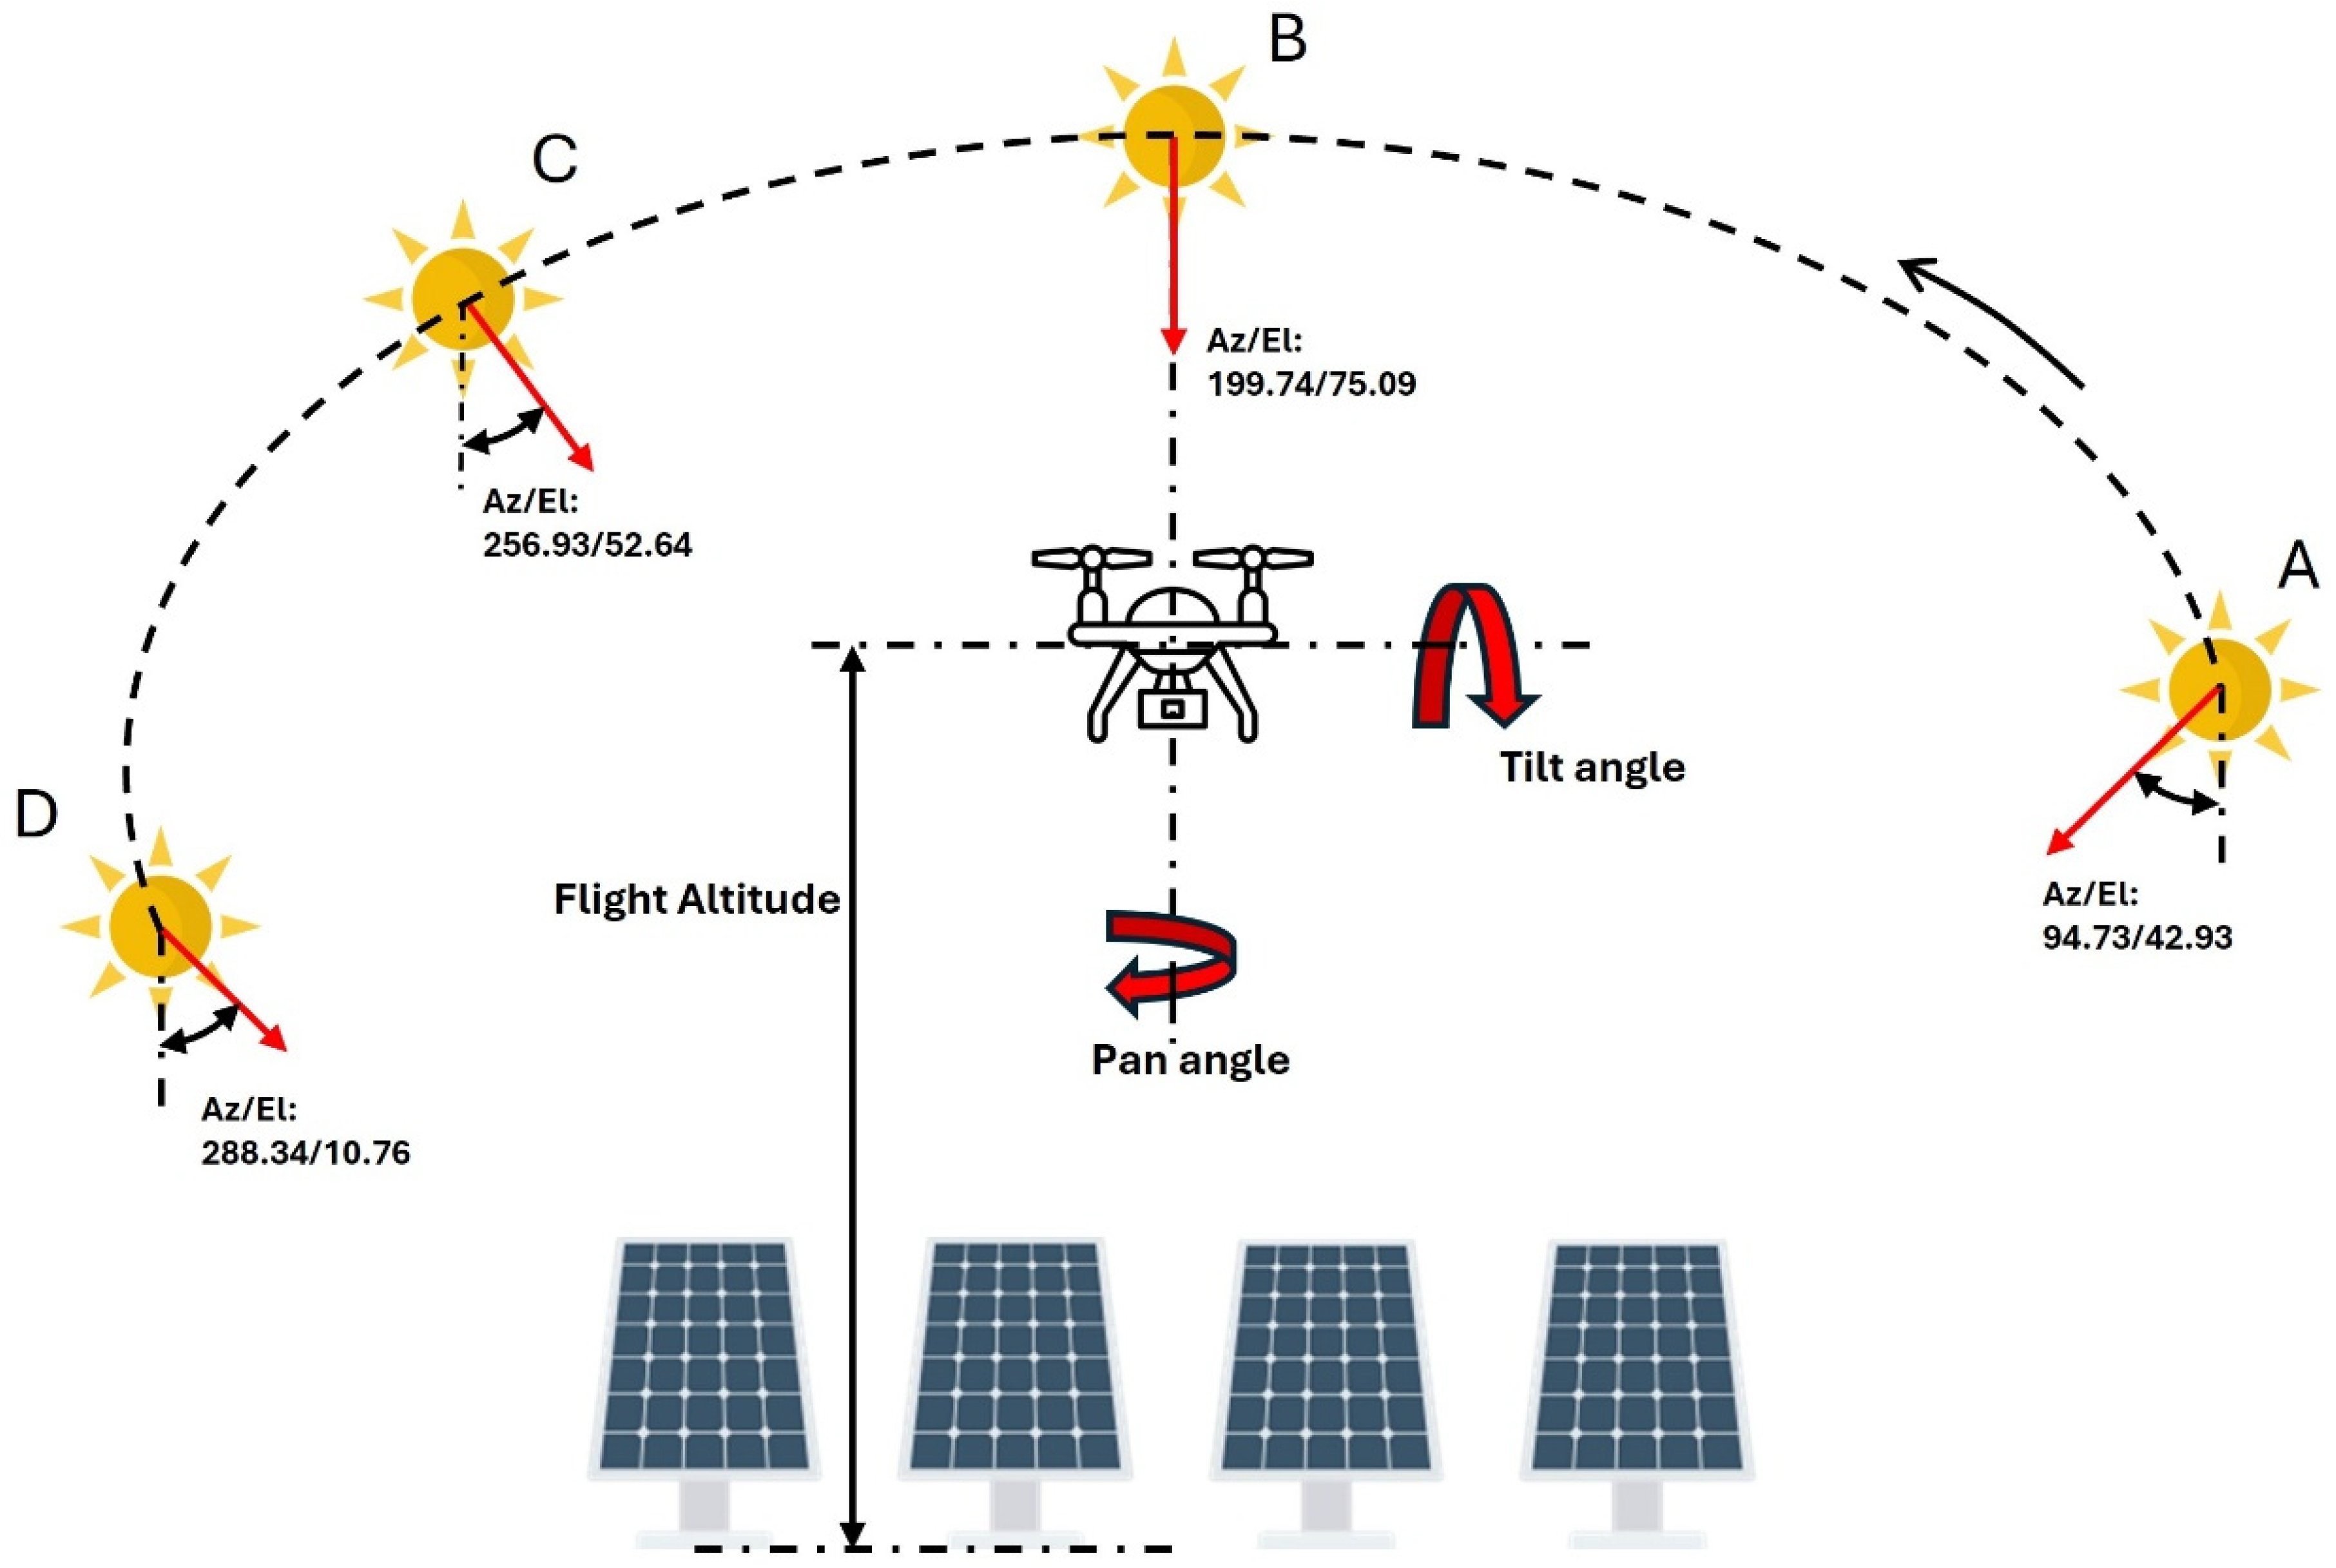
Figure 3 illustrates the configurations of key flight and ambient parameters during the UAV-based data acquisition process, including drone altitude, camera tilt angle, and pan angle, alongside the sun’s relative position at four distinct times of the day. These four positions correspond to the time windows when the four identical sets of visual and thermal video sequences were captured.
Position A (Morning): Captures were taken between 09:00–10:00, with the sun located at an azimuth/elevation (Az/El) of 94.73°/42.93° at 09:30, rising from the east.
Position B (Midday): Captures were taken between 13:00–14:00, with the sun at Az/El 199.74°/75.09° at 13:30, closely aligned with the south-facing panels, resulting in nearly overhead illumination with minimal shadowing.
Position C (Afternoon): Captures were taken between 15:00–16:00, and at 15:30, the sun was positioned at Az/El 256.93°/52.64°, shifting toward the western horizon and casting lateral shadows.
Position D (Late Afternoon): Captures were taken between 18:30–19:30, with the sun descending to Az/El 288.34°/10.76° at 19:00. Notably, at this stage, the sun had moved behind the plane of the panels, introducing significant backlighting and potential reflectance artifacts.
This diagram serves to contextualize the effect of solar azimuth and elevation on the visibility of surface-level and thermal defects. Moreover, it highlights how the flight altitude and camera orientation parameters (tilt and pan angles) interact with the changing solar geometry, impacting the quality and diagnostic utility of aerial images used for defect detection.
2.5. Ground Truth and Performance Evaluation
In order to validate the performance of the trained models under varying flight conditions, manual visual inspection was conducted as ground truth reference. A rigorous review of each captured image or video sequence was conducted to ascertain the presence of hotspots, bird droppings, or dust accumulation. The output of the model from each flight test was then compared to the visual assessments. The evaluation process concentrated not solely on the precision of the model, but also on its practicality, encompassing aspects such as flight efficiency and the quality of the images captured under diverse configurations. The analysis enabled the identification of optimal flight parameter combinations for each defect category, achieving a balance between accuracy and operational feasibility in real-world PV inspection tasks. To evaluate and compare the performance of each flight configuration, Recall was employed as a condensed merit measurement. Recall indicates the ratio of correctly detected defects over the total number of actual defects (Ground Truth—see
Section 3) and reflects the sensitivity of the detection process. Hence, flights achieving higher Recall values correspond to configurations that capture more true anomalies, making Recall a consistent metric for assessing detection efficiency across different flight parameters.
3. Results
As previously discussed, relevant studies primarily report mean Average Precision (mAP) as the main performance indicator for detection accuracy. However, the UAV flight parameters used in these studies such as altitude, camera pan and tilt angles, flight speed, and solar position differ considerably, often being selected empirically or randomly, raising an important question whether all defect anomalies can be reliably detected under randomly selected flight configurations, or if there is an optimal parameter combination required to maximize detection accuracy. To address this, Recall becomes an appropriate metric, as it reflects the ability to identify all true defects across different parameter sets.
Table 3 reports the Recall values for each defect category across 21 UAV flight configurations, evaluated at four different times of day, alongside the detections obtained from manual visual inspection (ground-truth reference values at the top row). The comparison is based on observations from 60 PV panels connected in series. The manual inspection was carried out using a handheld thermal camera with specifications identical to those of the drone-integrated system. The manual inspection was thoroughly performed, and the results were used as the ground truth case for assessing the performance of each flight parameter configuration. However, the manual inspection process was inherently labor-intensive and time-consuming, thereby further supporting the need for the automated inspection methodology pursued in this study. It is also noteworthy that, in several instances, specific defects were more distinctly identifiable in the thermal images acquired by the drone-integrated camera.
While the table emphasizes Recall, i.e., the model’s ability to correctly identify all relevant defects, it is important to note that nearly all detections were made with a precision exceeding 85%, indicating a low false positive rate across categories. Given this consistently high precision, the primary focus of analysis shifts to Recall performance, which reflects whether the algorithm successfully predicts the presence of a defect when it exists. The utilization of high precision ensures that the detected objects are, in fact, true defects. However, in the absence of sufficient Recall, critical anomalies may remain unnoticed. Precision and Recall were computed in accordance with the methodology delineated in paper [
7], thereby ensuring standardization and comparability with existing literature.
The selection of these specific 60 panels was driven by the necessity to maintain uniformity in operating conditions and environmental exposure. The inspection concentrated on identifying the presence of four key defect types: overheated junction boxes, dirt spots from bird droppings, dust accumulation, and cell-level failures.
To capture the temporal variability in detection performance, each flight listed in
Table 3 was repeated on four occasions during a single day (corresponding to four different times). In order to reflect this, the result cells corresponding to each defect category have been subdivided into four columns, which have been labeled A, B, C, and D, respectively. This configuration facilitates meticulous examination of the way solar angle and lighting conditions at varying times of the day influence the model’s capacity to detect hotspots, bird droppings, dust accumulation, and other defects. By aligning these temporal segments with consistent flight parameters, the table facilitates a systematic comparison of the algorithm’s behavior under varying sun positions. The results shown in
Table 3 are discussed extensively in the next paragraphs.
3.1. Results on Dusty Category
The findings from the dust detection analysis indicate that low-altitude flights at 2 m (Flights 1 and 2) consistently yielded near-perfect classification accuracy across all four times of the day. This consistency underscores the efficacy of close-range imaging in capturing fine surface-level soiling, such as dust accumulation. Conversely, flights conducted in the morning (position A) at an altitude of 4 m (Flights 3 to 9) exhibited notably robust performance, indicating that during the early hours, favorable illumination conditions enhance visual contrast. However, the performance at the same altitude declined when steeper tilt angles of −60° and −90° were applied (Flights 8 and 9), indicating a loss of visual detail or suboptimal perspective associated with nadir or near-nadir orientations. These configurations have the potential to introduce specular reflection or fail to capture surface texture variations, which are critical for the identification of dust.
At intermediate altitudes of 8 m (Flights 10 to 16), the combination of a −30° tilt angle and 0° pan orientation (Flight 12) demonstrated high efficacy throughout the day, indicating that this viewing geometry offers a balanced trade-off between field of view and resolution. It is noteworthy that at higher flight altitudes of 12 m (Flights 17 to 21), optimal detection was achieved during the late afternoon, where the model successfully classified all dusty panels. This is a significant finding, as higher-altitude imagery inherently captures a broader spatial context, encompassing more modules within each frame.
An additional observation from the dust detection experiment concerns the influence of pan angle relative to sun position. When the drone was operated with the sun positioned behind it (typically achieved with a +45° pan angle during morning flights) the captured images allowed for clear differentiation between clean and dusty panels, owing to uniform illumination and minimal glare. Conversely, during afternoon flights with opposing pan angles, the presence of strong reflectance and glare on the panel surfaces led to a substantial degradation in image quality. This reflection frequently saturated the visual features employed for classification, resulting in a substantial decline in detection accuracy. These results underscore the significance of aligning flight direction with sun position to mitigate adverse lighting effects during RGB-based inspections.
3.2. Results on Overheated Junction Box Category
The detection results for the Overheated Junction Box category indicate consistently high Recall rates during morning, midday, and afternoon (positions A, B, C) flights. However, a marked decline in detection performance was observed during late afternoon sessions. Among the late afternoon tests, the only configuration that maintained satisfactory performance was the flight at 12 m altitude with a tilt angle of −10° (Flight 17). This finding is noteworthy, as higher-altitude flights cover a broader field of view, allowing the UAV to inspect more panels per frame and thereby reduce the total number of flight paths needed to survey the entire PV array.
Furthermore, conducting inspections at elevated altitudes during off-peak hours such as late afternoon yields operational advantages. These include the mitigation of the risk of shading the panels during peak generation periods, which could otherwise result in a reduction in the system’s power output. Accurate identification of overheated junction boxes is imperative, as they often resemble early-stage cell failures. Timely detection at this stage enables preventive maintenance actions before more severe damage develops.
3.3. Results on Bird Droppings Category
The detection of bird droppings proved to be particularly challenging due to the small size of the affected regions within the captured images. Given that bird droppings frequently occupy only a few pixels, especially when viewed from higher altitudes, YOLO-based models, which are known to struggle with small object detection, demonstrated limited Recall performance under such conditions. As altitude increases, the visible area covered by each drop diminishes, and only larger accumulations remain distinguishable. Furthermore, it was observed that elevated flight speeds resulted in the introduction of motion blur, thereby further diminishing the model’s capacity to discern these complex features.
The optimal detection performance was achieved at an altitude of 2 m, with a tilt angle of −30° (Flight 2) and a low speed. This configuration allowed the model to capture fine surface details due to its proximity to the panels. However, such close-range inspections are subject to significant practical limitations, including safety concerns and reduced efficiency, as only 2–3 panels can be imaged per frame, resulting in prolonged flight durations to cover an entire PV array. The results of the study demonstrated a clear trend: as the altitude increased, the Recall rate decreased accordingly, thereby confirming the sensitivity of bird dropping detection to spatial resolution.
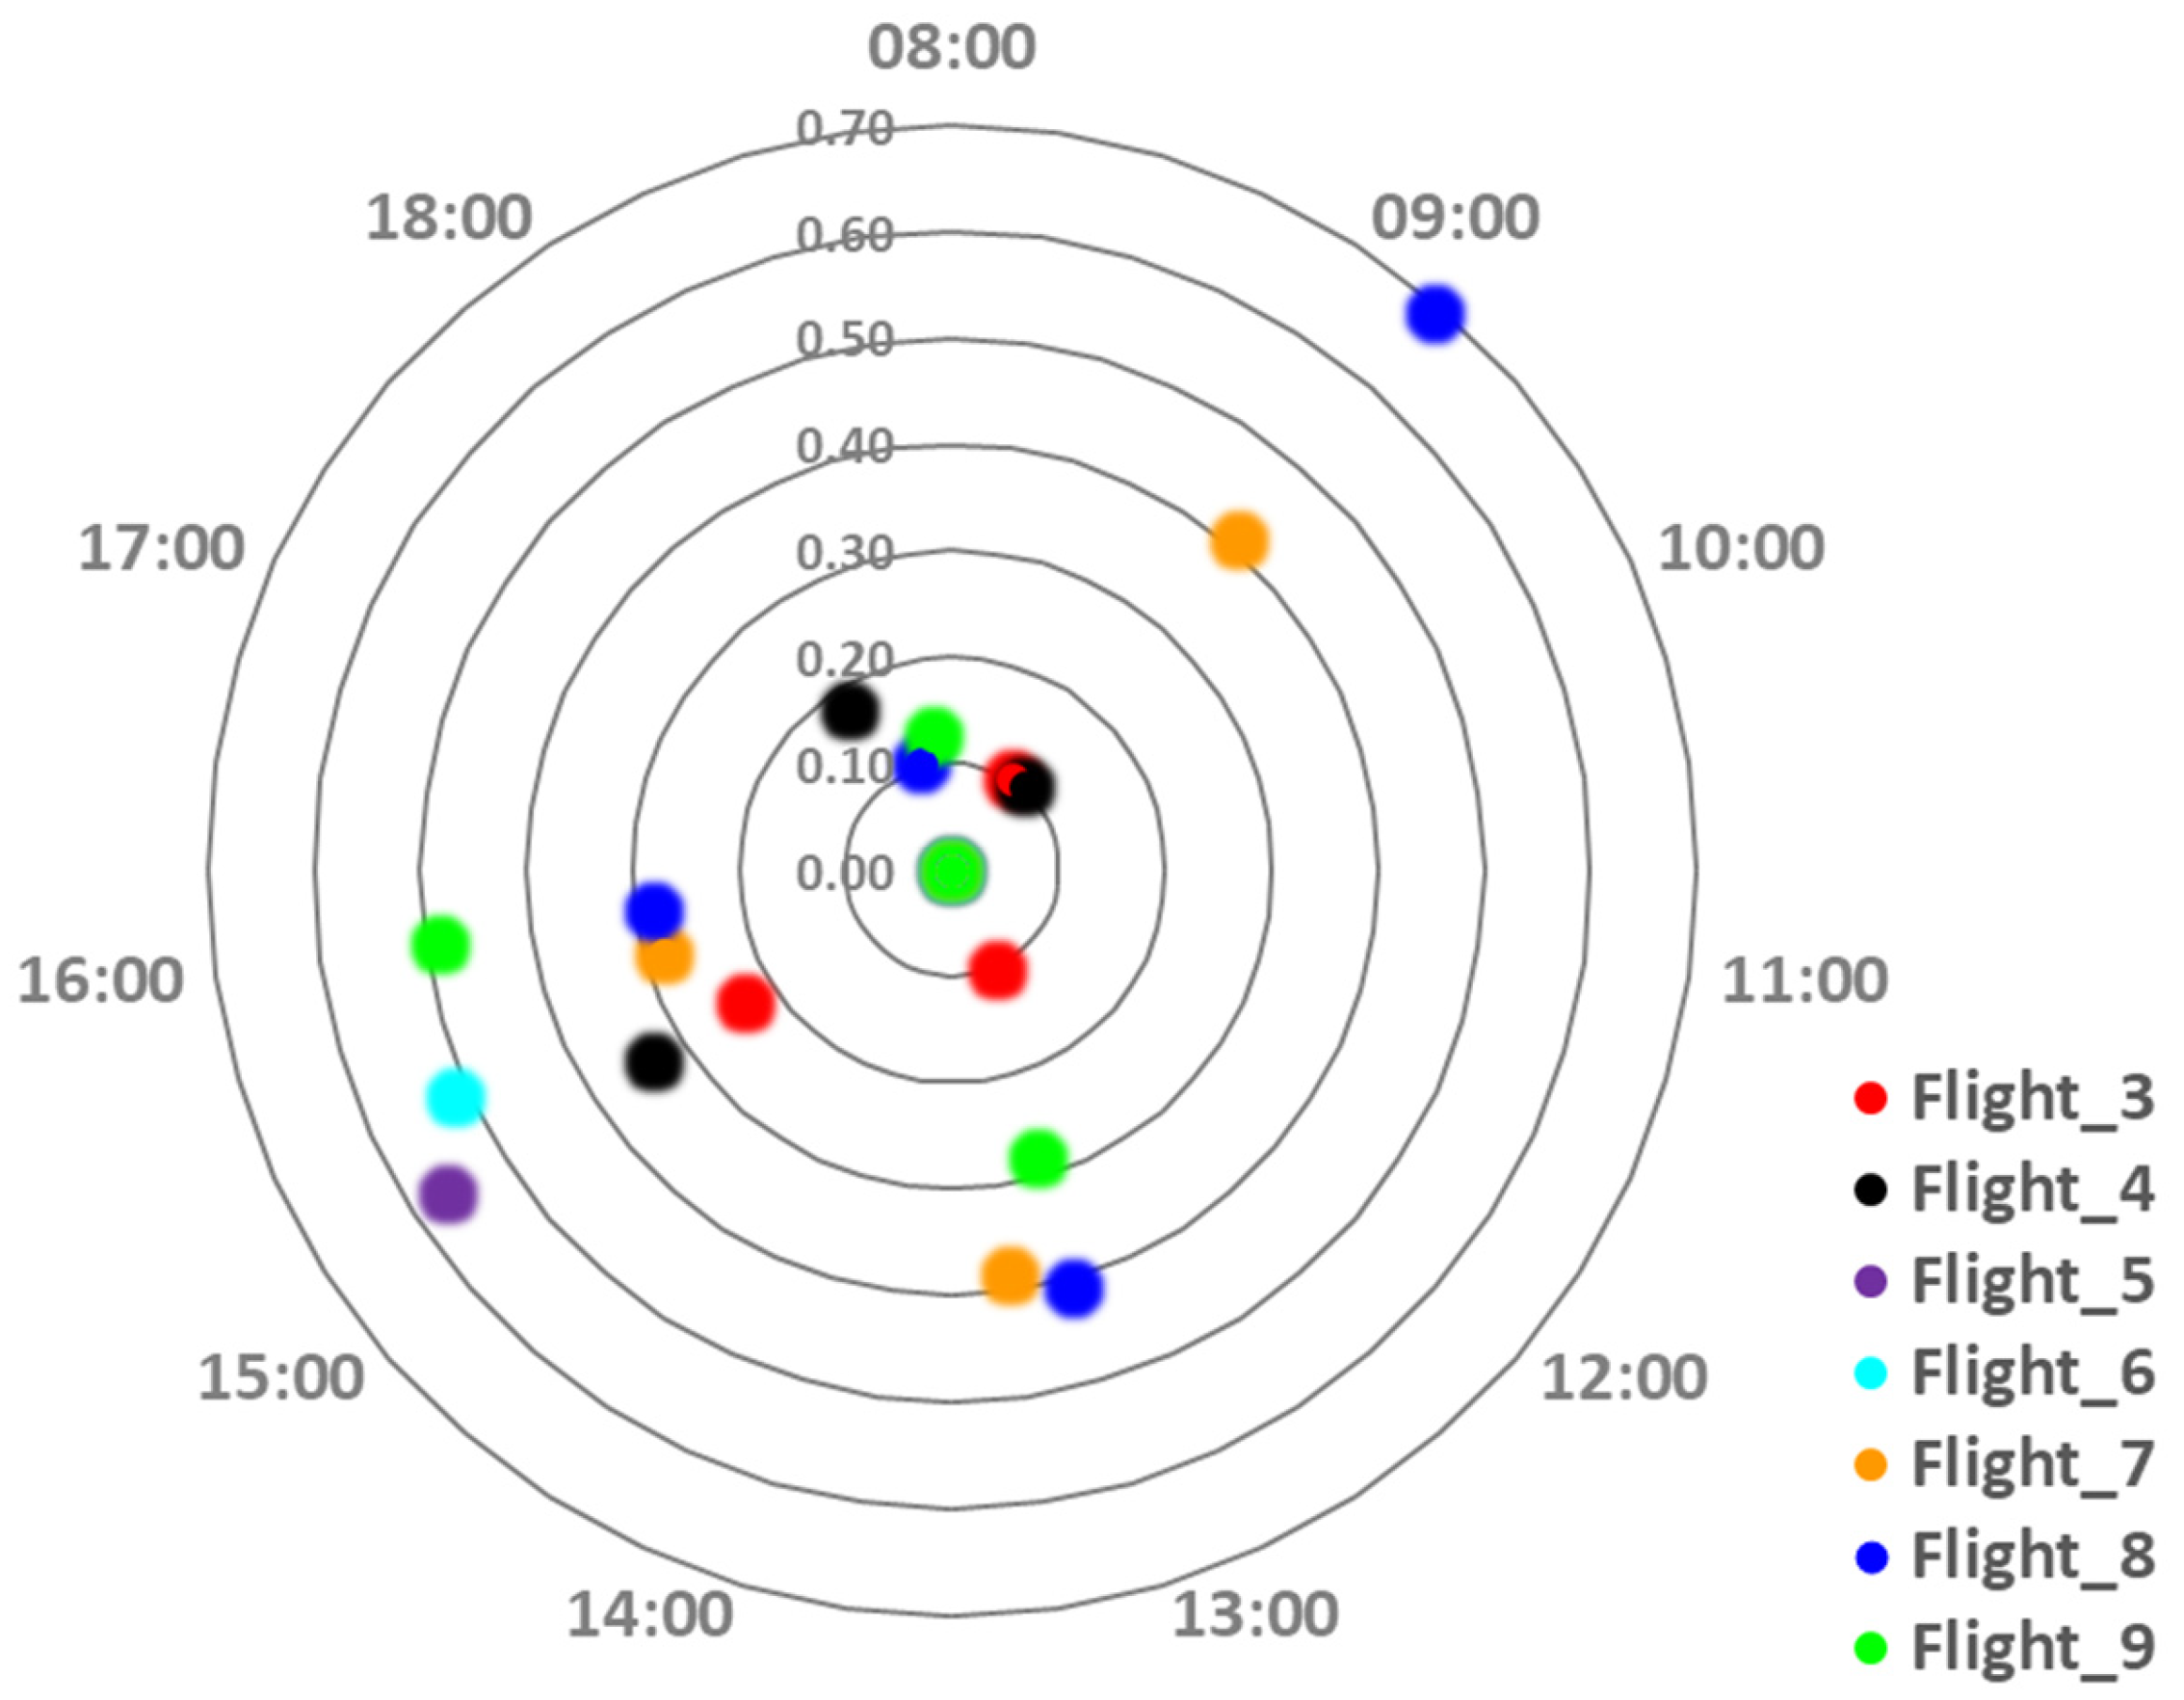
Further analysis of the flights at an altitude of 4 m, as illustrated in
Figure 4, revealed that a tilt angle of −60° significantly improved the detection performance of bird droppings compared to lower tilt angles. This improvement is likely due to enhanced surface contrast and improved projection of small objects at steeper viewing angles. Of all the tested configurations, Flight 8, which was conducted in the morning at an altitude of 4 m, with a 0° pan, a 60° tilt, and a speed of 1 m/s demonstrated the best performance, achieving a Recall rate of 70%. This configuration successfully identified all large and medium-sized droppings but missed the smaller ones that occupied minimal pixel area. While limited detection remains possible at higher altitudes, particularly during morning flights when lighting is more favorable, the overall Recall rate decreases notably as altitude increases. At these elevations, the model predominantly identifies only larger bird droppings, with smaller ones becoming indistinguishable.
3.4. Results on Cell Failure 50%
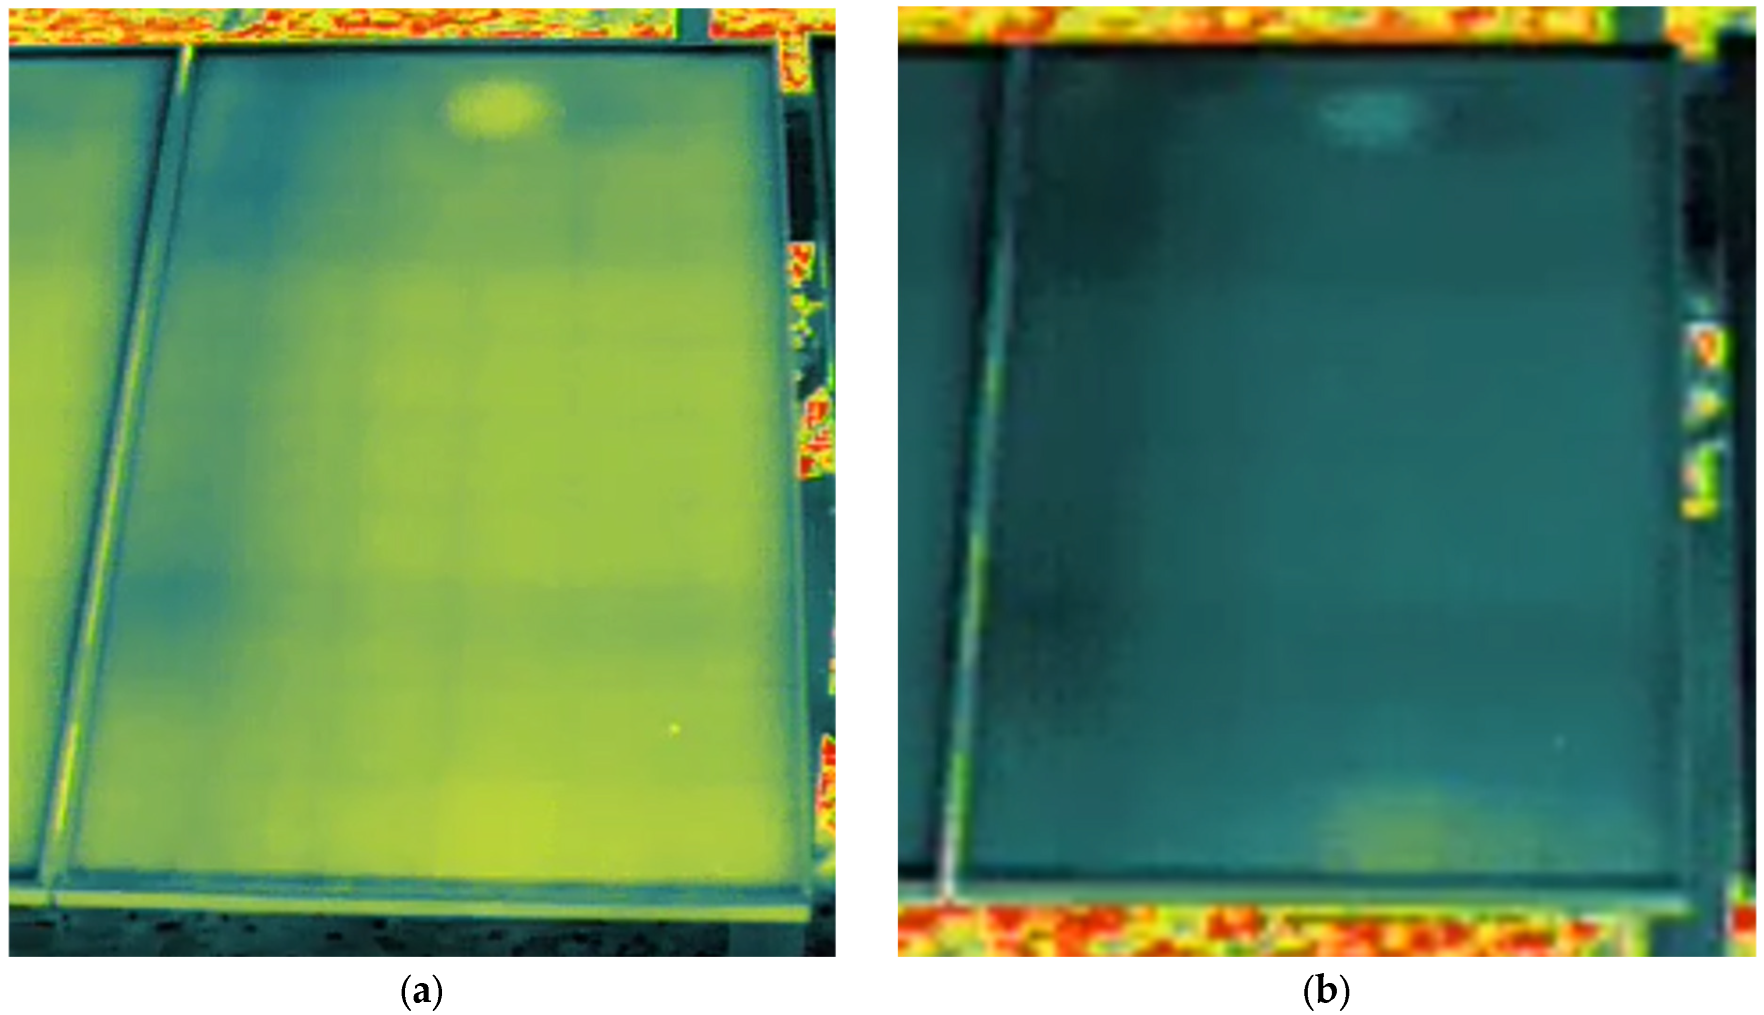
The detection performance of the Cell Failure 50% category was highly sensitive to flight altitude and tilt angle. While low-altitude flights at 2 m typically produce high-resolution thermal imagery, configurations with shallow tilt angles (between −10° and −30°) resulted in suboptimal detection. This limitation is primarily due to thermal shading effects. Specifically, the bright yellow signature of a partially failed cell tends to blend visually into the surrounding green panel surface when viewed from a shallow angle. This blending effect, referred to as thermal color shading, reduces the visual contrast necessary for the model to distinguish and classify the defect. As depicted in
Figure 5a,b, which were taken a few minutes apart, the same panel exhibits significant variation in thermal contrast due to changes in tilt angle and possibly sun panel orientation.
Figure 5a shows the cell anomaly as subdued and harder to distinguish, while
Figure 5b shows the same defect as more pronounced and visually separable from its background.
On the other hand, the Bird Droppings category exhibited an opposite pattern. The best Recall was consistently achieved during low-altitude flights with shallow tilt angles, especially at −30°, when the camera was positioned close to the modules. This proximity allowed the small, irregularly shaped bird droppings to occupy more pixels in the image, making them easier for the YOLOv11 model to detect. However, such configurations are impractical for large-scale inspections due to safety concerns and limited image coverage. On the contrary, these same close-range settings compromise 50% detection of cell failure due to the aforementioned shading issues. This highlights the need for defect-specific parameter optimization in UAV-based PV inspections.
Flights conducted at medium altitudes, particularly in the morning, achieved an effective balance of spatial coverage and thermal clarity for detecting cell failure at a rate of 50%. Higher tilt angles, such as −45° and −60°, enhanced color definition and defect contrast, improving Recall. While performance generally declined at higher altitudes, certain morning configurations produced reliable results. Interestingly, the highest Recall was achieved with a morning flight at a tilt angle of −30° and the fastest tested speed of 2.6 m/s. This counterintuitive result may be due to reduced frame exposure at higher speeds, which mitigated thermal oversaturation in brighter regions surrounding early-stage cell failures. By preserving key temperature gradients and maintaining adequate frame overlap, this setup enabled accurate and efficient detection, highlighting its potential for rapid, large-scale inspections.
3.5. Results on Cell Failure 100%
The detection results for the Cell Failure 100% category showed a clear advantage under specific flight conditions, especially in the morning. In these configurations, the model successfully detected all fully developed cell failures, which are defined as those affecting more than 50% of the cell area. However, at other times of the day, such defects were misclassified as Cell Failure 50% or not identified. Successful detections consistently occurred in flights with a strict 0° pan angle and tilt angles of −30° or steeper (e.g., −45°, −60°). This suggests that a direct, downward-facing perspective combined with favorable lighting enhances the model’s ability to distinguish these high-contrast thermal anomalies.
4. Discussion
The presented results have prompted several critical observations that inform the evaluation of UAV-based inspection strategies for PV defects. A particularly important finding refers to the behavior of midday flights at elevated tilt angles (−60° and above), where pronounced solar reflection on the panel surface has prompted the model to erroneously categorize glare artifacts as cell failures. This underscores the risk of false positives due to extreme lighting conditions, as illustrated in
Figure 6, and emphasizes the necessity of avoiding direct reflection alignments during thermal image acquisition. Such effects have the potential to obscure true thermal patterns, thereby diminishing the reliability of defect detection in high-illumination scenarios.
Furthermore, tilt angles of −10° and −30°, although potentially beneficial for capturing certain viewpoints, require the UAV to reposition farther from the array to maintain the panels within the camera frame, thereby increasing the distance from the target surface. This introduces a trade-off between field of view and resolution, which may compromise the detection of subtle anomalies. Ensuring that each image contains as many panels as possible is vital for inspection efficiency, but only if detection performance remains high across all defect types. Therefore, it is recommended that an image overlap of at least 50% is maintained, particularly at shallow tilt angles. This overlap mitigates geometric distortion, which manifests as an apparent disproportion in the size of the panels, with the lower portion of the frame appearing larger relative to the upper portion. This effect serves to verify detections and ensure uniform spatial analysis across the images.
Given the diversity and often conflicting requirements of detecting multiple defect types, such as large area anomalies like dust, small-scale objects like bird droppings, and thermally subtle patterns such as early-stage cell failures, it is important to note that a single flight parameter configuration may enhance the Recall for one category while concurrently reducing the detectability of another. For instance, low-altitude flights enhance the visibility of small objects but limit coverage, while higher altitudes offer efficiency at the expense of detail. Conversely, specific tilt angles have been shown to enhance thermal contrast, thereby facilitating the identification of cell failures. However, these angles can also result in false positives due to glare in various other conditions. Consequently, identifying an optimal trade-off among competing objectives—namely, detection accuracy across all defect types, spatial coverage, flight duration, and operational safety—requires a structured optimization framework. This approach would enable UAV-based inspection systems to dynamically adapt or pre-select the most efficient flight parameters based on specific inspection goals, environmental constraints, and the condition of the PV system.
From a long-term operational perspective, the progression of defect severity observed through systematic park monitoring reinforces the need for timely intervention. Specifically, partially formed cell failures (Cell Failure 50%) have been shown to evolve into fully developed failures (Cell Failure 100%) within a span of just a few months. Furthermore, these fully developed defects often catalyze the emergence of additional neighboring cell failures within days. Consequently, the early and accurate identification of these anomalies is of great importance not only for the mitigation of defects on an individual basis but also for the discontinuation of defect propagation across modules. This underscores the necessity for a unified flight parameters framework that can reliably detect all defect types, including hotspots, bird droppings, dust, and thermal anomalies, rather than relying on distinct configurations tailored to each category.
5. Conclusions
This study presents a thorough evaluation of UAV-based inspection strategies for PV modules. The investigation encompasses the impact of variations in flight parameters, including altitude, tilt and pan angles, flight speed, and time of day, on the detection performance of various defect types. To this end, extensive experimental cases of various flight parameters were performed under controlled conditions, capturing both thermal and RGB images across a range of configurations. These experiments utilized a unified YOLOv11-based deep learning framework. The findings indicate that defect detectability is highly sensitive to both flight geometry and ambient lighting, with no single configuration universally optimal for all defect categories.
Two custom datasets were developed as part of this study to support the training and evaluation of the YOLOv11 detection models—one based on thermal imagery and the other on RGB visual data. The thermal dataset, comprising 14,000 images and over 100,000 annotations, was meticulously customized to detect four critical defect categories: The following categories are identified: “Overheated Junction Box,” “Bird Droppings,” “Cell Failure 50% (partial failure),” and “Cell Failure 100% (full failure).” Each category was manually annotated based on the intensity and shape of the thermal anomaly, with an emphasis on capturing early-stage degradation patterns. The RGB-based dust dataset, which consists of 24,000 high-resolution images and more than 450,000 annotations, focused on classifying panel surfaces as either Dusty or Clean.
The following key findings were observed: low-altitude flights are highly effective for identifying small-scale defects such as bird droppings; higher altitudes offer improved spatial coverage at the expense of detection precision, particularly for thermally subtle or fine-grained anomalies. For dust detection, the drone was aligned so that its flight path kept the sun positioned behind it. This ensures a reduction in glare and an enhancement in the accuracy of classification. Conversely, midday flights at steep tilt angles were susceptible to false positives, wherein solar reflection artifacts were erroneously classified as thermal anomalies. The detection of partially failed cells (Cell Failure 50%) was enhanced by medium-altitude morning flights using moderate tilt angles, particularly when flown at higher speeds, which helped prevent thermal overexposure in image frames. For fully failed cells (Cell Failure 100%), the most reliable detections occurred at 0° pan and −30° or steeper tilt angles during morning flights, underscoring the importance of sun panel orientation.
These findings underscore the necessity for multi-objective optimization in UAV inspection planning [
16,
17]. Flight configurations that optimize Recall for a specific defect type may, in fact, compromise the detection of other defects. For instance, while low altitude is advantageous for detecting small objects, at the same time, it unavoidably reduces efficiency and increases flight time. Conversely, optimal tilt angles for thermal contrast have the potential to induce glare or diminish spatial coverage. Consequently, an optimized inspection strategy must strike a balance between detection accuracy, inspection speed, operational feasibility, and safety. Subsequent research endeavors should investigate the development of adaptive flight planning systems that can dynamically select the most suitable parameter sets based on real-time feedback, environmental conditions, and inspection priorities. This would facilitate the creation of more intelligent, reliable, and scalable PV monitoring solutions.
The present study identifies the influence of flight altitude, camera angle, speed, and illumination on defect detection accuracy. The optimal set of flight parameters varies depending on the inspection objectives, ambient conditions, and UAV constraints, such as regulatory altitude restrictions and energy autonomy. Consequently, future work should focus on developing a multi-objective optimization strategy capable of dynamically adjusting flight parameters during operation to balance detection accuracy, energy efficiency, and coverage area. Similar adaptive methods have been successfully demonstrated in other domains that require real-time adaptation to time-varying constraints, such as medical video communications [
16] and adaptive video encoding [
17]. This approach would enable the UAV system to autonomously optimize its flight configuration in response to changing conditions, maximizing the effectiveness and robustness of automated PV inspection.
The monitoring framework with optimized parameters developed in this study will be exploited as part of an integrated robotic cleaning system for PV installations. This system will incorporate UAVs equipped with cameras and unmanned ground vehicles (UGVs) fitted with brushes to perform the cleaning process, utilizing either dry or water-based methods. Robotic PV cleaning presents substantial advantages over manual approaches, which are typically labor intensive, costly, and less effective [
18,
19].
When such an autonomous multi-agent system composed of camera-equipped UAVs is deployed, broader issues concerning system reliability arise, including communication failures that must be effectively managed using state-of-the-art solutions [
20]. Moreover, fault tolerance as well as safeguarding against false data injection attacks are also among the issues to be considered [
21].




 ,
,