1. Introduction
The current trend in European Union (EU) and United Kingdom (UK) energy policies is to ensure clean and affordable energy by increasing the share of renewable energy sources (RES) and reducing dependence on fossil fuels [
1,
2]. In the building sector, these strategies translate into improving energy performance through insulation measures, the use of efficient appliances, and the deployment of renewable technologies such as rooftop photovoltaics (PVs) and electric heat pumps (EHPs). Support schemes are also implemented to protect energy-poor households and mitigate the impact of the ongoing energy crisis on price volatility.
This large-scale transition towards modern home energy supply systems (HESSs), combined with decreasing technology costs and uncertain energy prices, is transforming end-users into potential investors in their own energy infrastructure. A typical household can now generate and store its own energy to reduce its energy bill and, in the long term, even generate income compared to conventional centralized supply systems.
However, assessing the techno-economic performance of such decentralized systems is complex. It often requires optimization models capable of determining the optimal design and operation of the system under given constraints. These models can address intermittency challenges and optimize energy flows over a defined period according to specific objectives, such as minimizing cost or carbon footprint [
3]. However, achieving accurate and reliable results depends on several factors: a detailed representation of system components, a suitable spatio-temporal resolution, and a representative set of input data. Inevitably, a trade-off arises between model accuracy and computational complexity [
4].
Adding to this challenge, modern energy systems are subject to multiple sources of uncertainty such as climate conditions, energy demands, renewable energy production, and commodity prices [
5]. From a consumer-centered perspective, it becomes essential to identify which technology combinations are most profitable given local climatic, economic, and regulatory conditions. At the same time, uncertainty and diversity among households must be captured to provide representative investment insights.
Indeed, the energy demand of residential buildings depends on numerous factors: the type and size of the dwelling, its renovation status, the number of occupants, their behavior and comfort preferences, and their use of appliances. Each household has its own load profile, defining its specific energy needs throughout the day and year. Consequently, the design and operation of a HESS must be adapted to these unique characteristics. Using generic or aggregated consumption patterns as input for optimization models can therefore lead to inaccuracies in sizing or operating strategies [
6].
Accurate input data is thus essential. This includes not only energy prices and technology costs but also realistic energy demand and renewable generation profiles. Two main approaches exist for generating these profiles. Top-down models rely on standardized load profiles (SLPs) derived from the aggregation of large numbers of households, offering simplicity but limited representativeness. In contrast, bottom-up models reconstruct energy consumption from individual behaviors, occupancy patterns, and appliance use. Though more complex and data-intensive, bottom-up approaches provide much greater flexibility and realism when capturing household diversity [
7].
Furthermore, as the electrification of thermal energy needs through heat pumps increases, power and heat demand profiles become interdependent. Understanding and estimating space heating (SH) and domestic hot water (DHW) requirements therefore becomes as crucial as modeling electricity demand itself. Consequently, investment and optimization models must rely on multi-energy system (MES) frameworks to account for the interactions between different energy vectors and ensure a coherent, integrated representation of the household energy supply.
Although extensive research has been conducted on the optimal sizing and operation of residential PV-battery systems, most existing studies fail to capture these interdependencies between electricity and heat demands, or to adequately represent household diversity. Mulleriyawage et al. [
8] reviewed the literature on residential PV-battery systems and concluded that optimal battery sizing mainly depends on the power load profile and the local tariff structure. They also highlighted a general lack of consideration for diversity in residential loads. Similarly, Deng et al. [
9] proposed an advanced mathematical framework for optimal residential battery design, but their model did not include heat supply, nor did it account for diversity or uncertainty in the input data.
In contrast, using the energy hub (EH) concept, Kaffash et al. [
10] developed a mathematical framework for the optimal scheduling of a battery within a PV–battery–heat pump system. However, their analysis did not consider thermal storage and assumed perfect knowledge of PV production and building consumption, limiting the realism of the operational results. Mittelviefhaus et al. [
11] extended this line of research by jointly optimizing e-mobility and MES under uncertainty, yet their model also excluded thermal energy storage (TES) and did not integrate dwelling diversity in the uncertainty analysis.
Similarly, Nicoletti et al. [
12] performed a cost-optimal sizing study for a comparable system but without considering TES or climatic uncertainty. Their analysis also focused exclusively on five warm Mediterranean locations, which limits the applicability of the results to colder climates. Nordgård-Hansen et al. [
13] examined the optimal design and operation of a detached house energy system (solar, battery, and ground-source heat pump) in Norway, yet they also neglected TES and did not use individual energy demand profiles, opting instead for “low,” “normal,” and “high” consumption scenarios.
Further methodological advances have been made in modeling the operation of storage systems. Baniasadi et al. [
14] developed a sophisticated framework for the optimal design and operation of thermal and electrical energy storage systems in a smart building, incorporating elements of model predictive control (MPC) to manage energy flows. However, their work remained limited to storage sizing and considered only a restricted number of scenarios. Schwarz et al. [
15] proposed a stochastic program for a MES similar to the one analyzed in this study, accounting for different pricing mechanisms and weather-related uncertainties. Nevertheless, their analysis relied on standardized load profiles aggregated over 29 households, preventing detailed insights at the individual dwelling scale.
Building on these findings and addressing the identified research gaps, the present work focuses on the optimal sizing of a residential PV–battery–EHP–TES system for a single detached UK dwelling. Particular attention is paid to incorporating uncertainty in climate conditions and diversity in household energy use. The goal is to produce results that are representative of the UK building stock, thus supporting decision-making for consumers and policymakers investing in modern home energy supply systems.
The case study is based on 2000 simulated scenarios capturing variations in consumption and production profiles representative of different UK households and weather years. The optimization outputs include the optimal sizing of technologies, the quarterly operation of energy generation and storage units, their contribution to the overall energy supply, and key economic indicators such as investment cost, operating cost, and net present value (NPV) over the project lifetime.
The multi-energy system integrates three energy vectors—electricity, natural gas, and heat—and three supply sources: grid electricity, natural gas, and on-site PV generation. It comprises two conversion technologies (an air-to-water electric heat pump and a residential gas boiler) and two storage technologies (a lithium-ion battery and a thermal buffer tank). The system meets three types of energy demand: electricity consumption, SH, and DHW.
Nevertheless, the present model operates under a deterministic planning horizon, which may limit the generalizability of the results. Perfect foresight of weather and demand conditions simplifies the computational process for long-term design optimization, but it can overestimate performance and distort system sizing compared to real-world conditions, where only limited foresight is available.
This limitation can be mitigated by introducing a rolling-horizon approach, which balances long-term and short-term decision-making. As shown by Cuisinier et al. [
16], such an approach effectively reduces the bias of deterministic assumptions in complex heating systems with seasonal storage. Rolling-horizon optimization is a cornerstone of MPC, or receding-horizon control, and has already been successfully applied in residential contexts: Saleem et al. [
17] used stochastic MPC for a PV–battery–EV charger system, while Yoshida et al. [
18] applied it to a residential fuel cell cogeneration system with TES.
2. Methodology
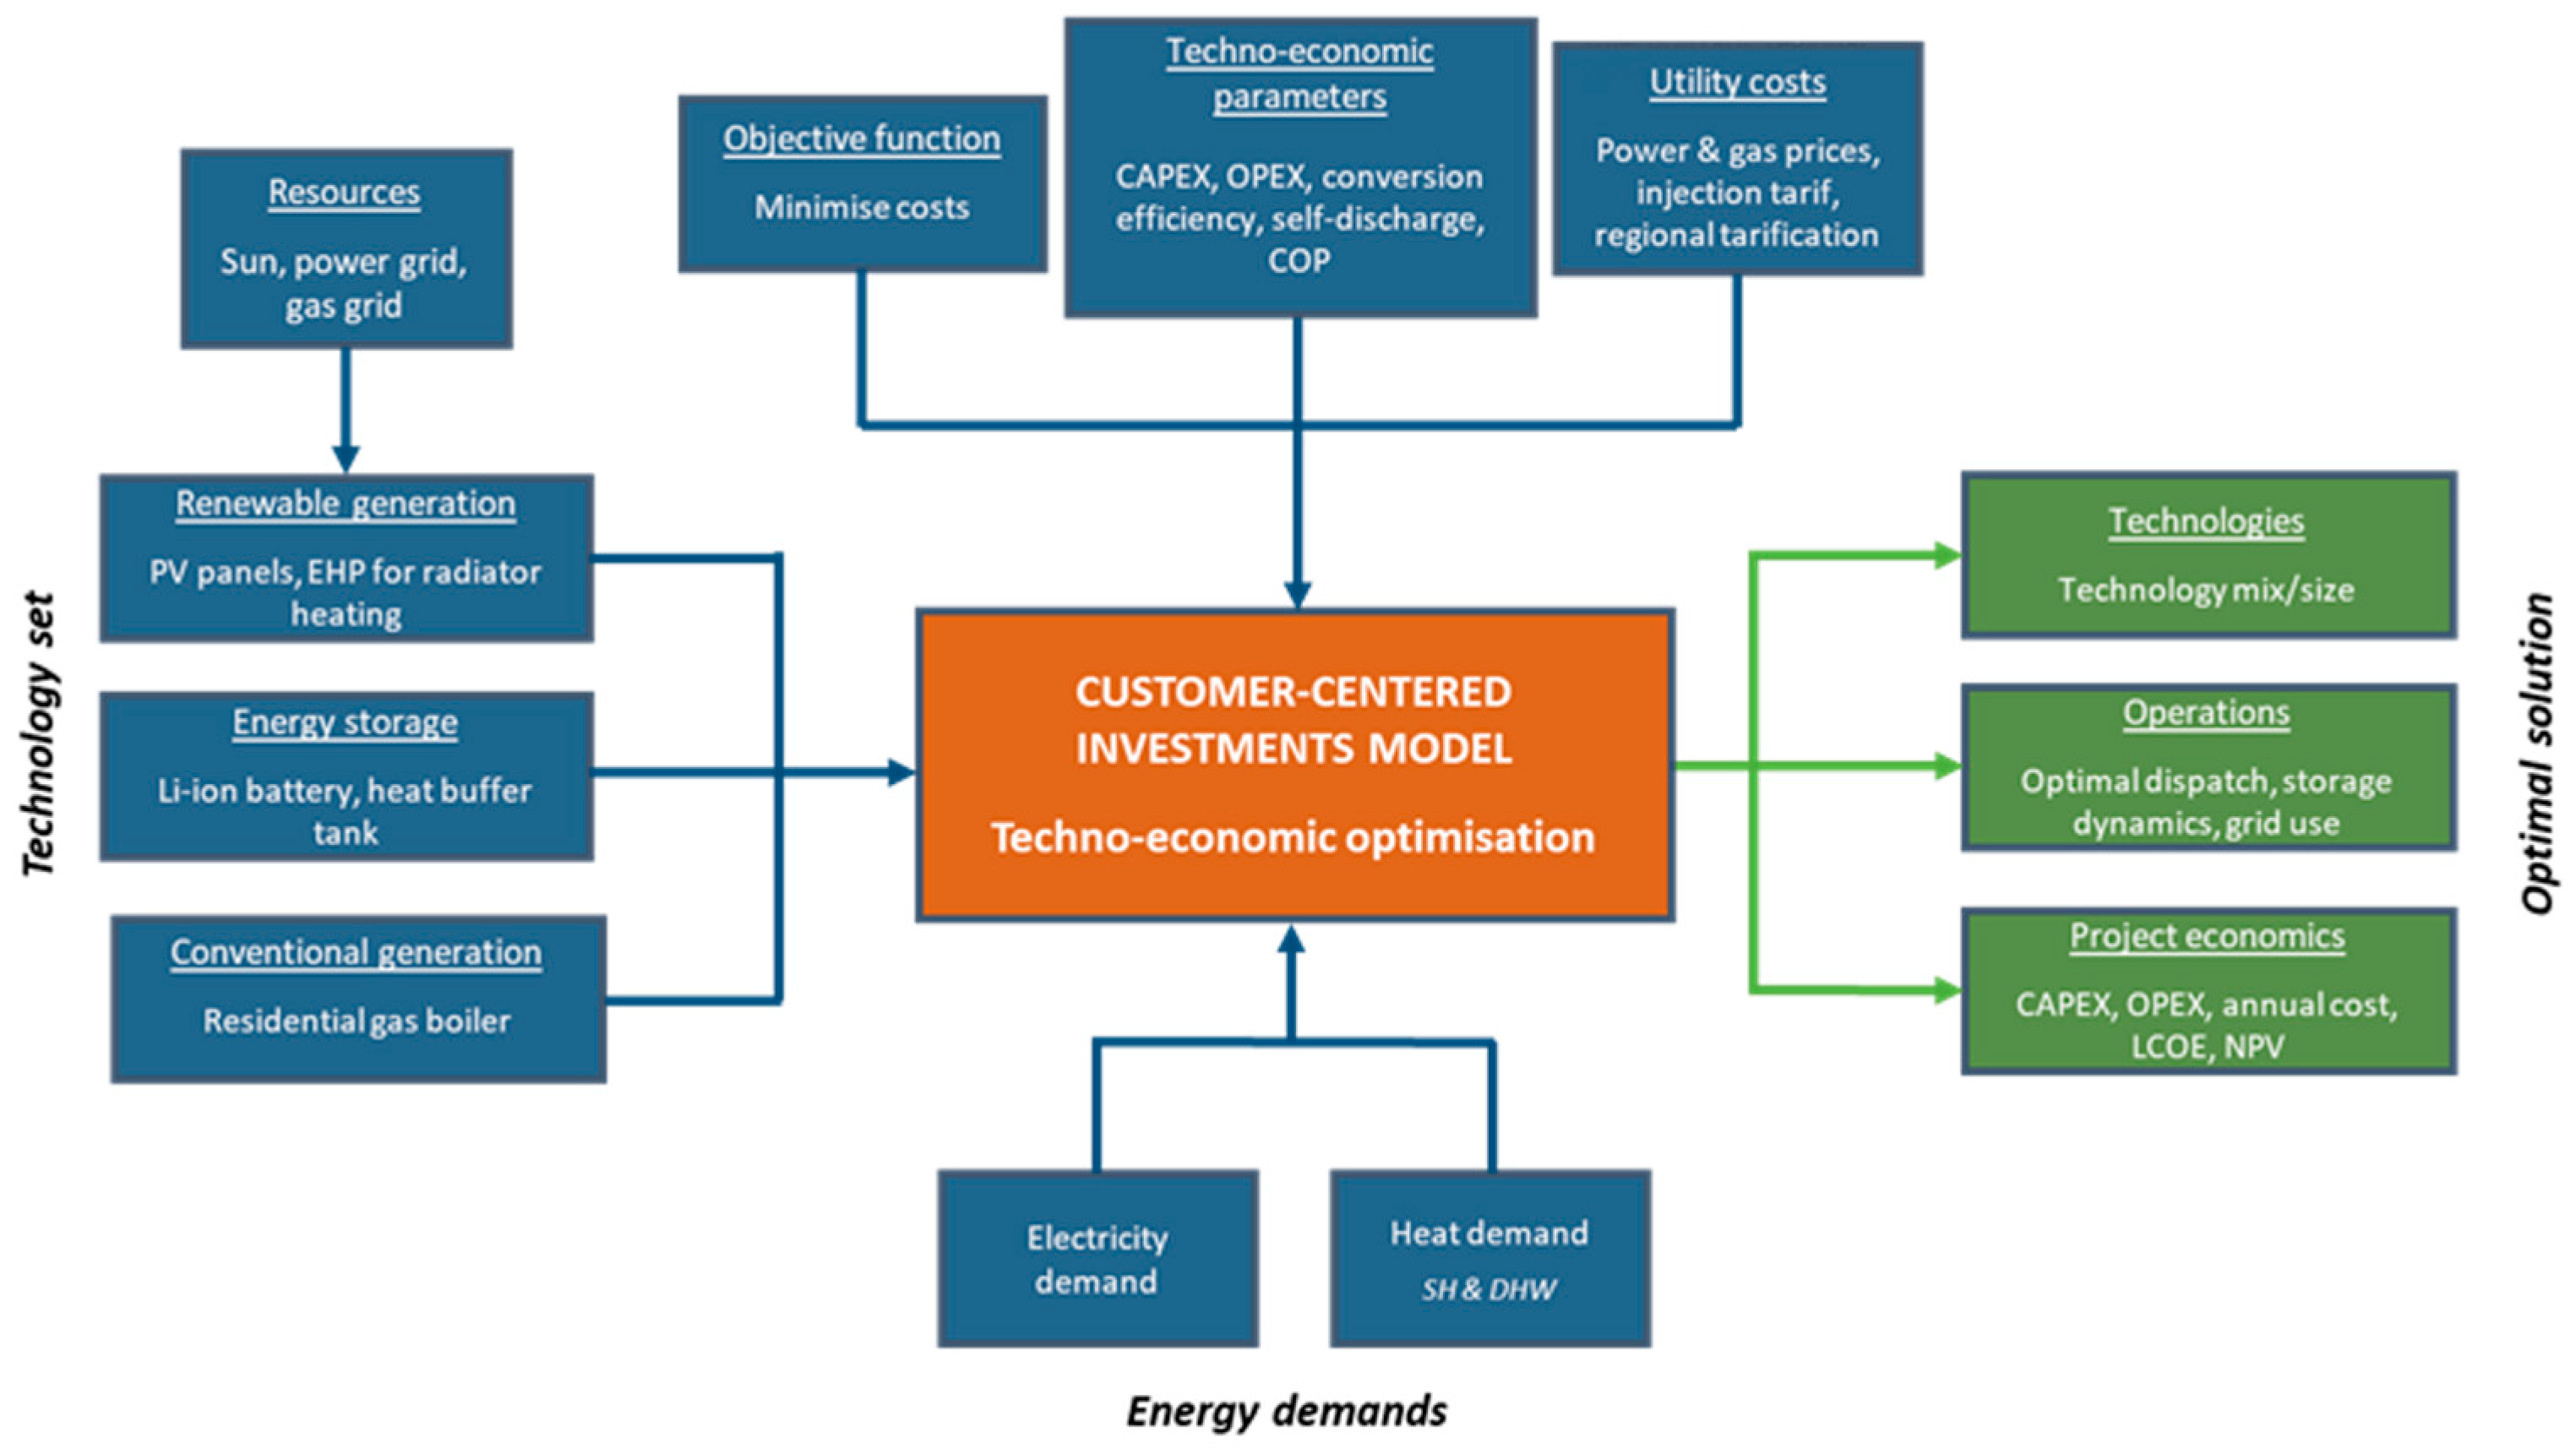
In this section, we will first introduce the structure of the investment model, with a view on the inputs and outputs of the model shown in
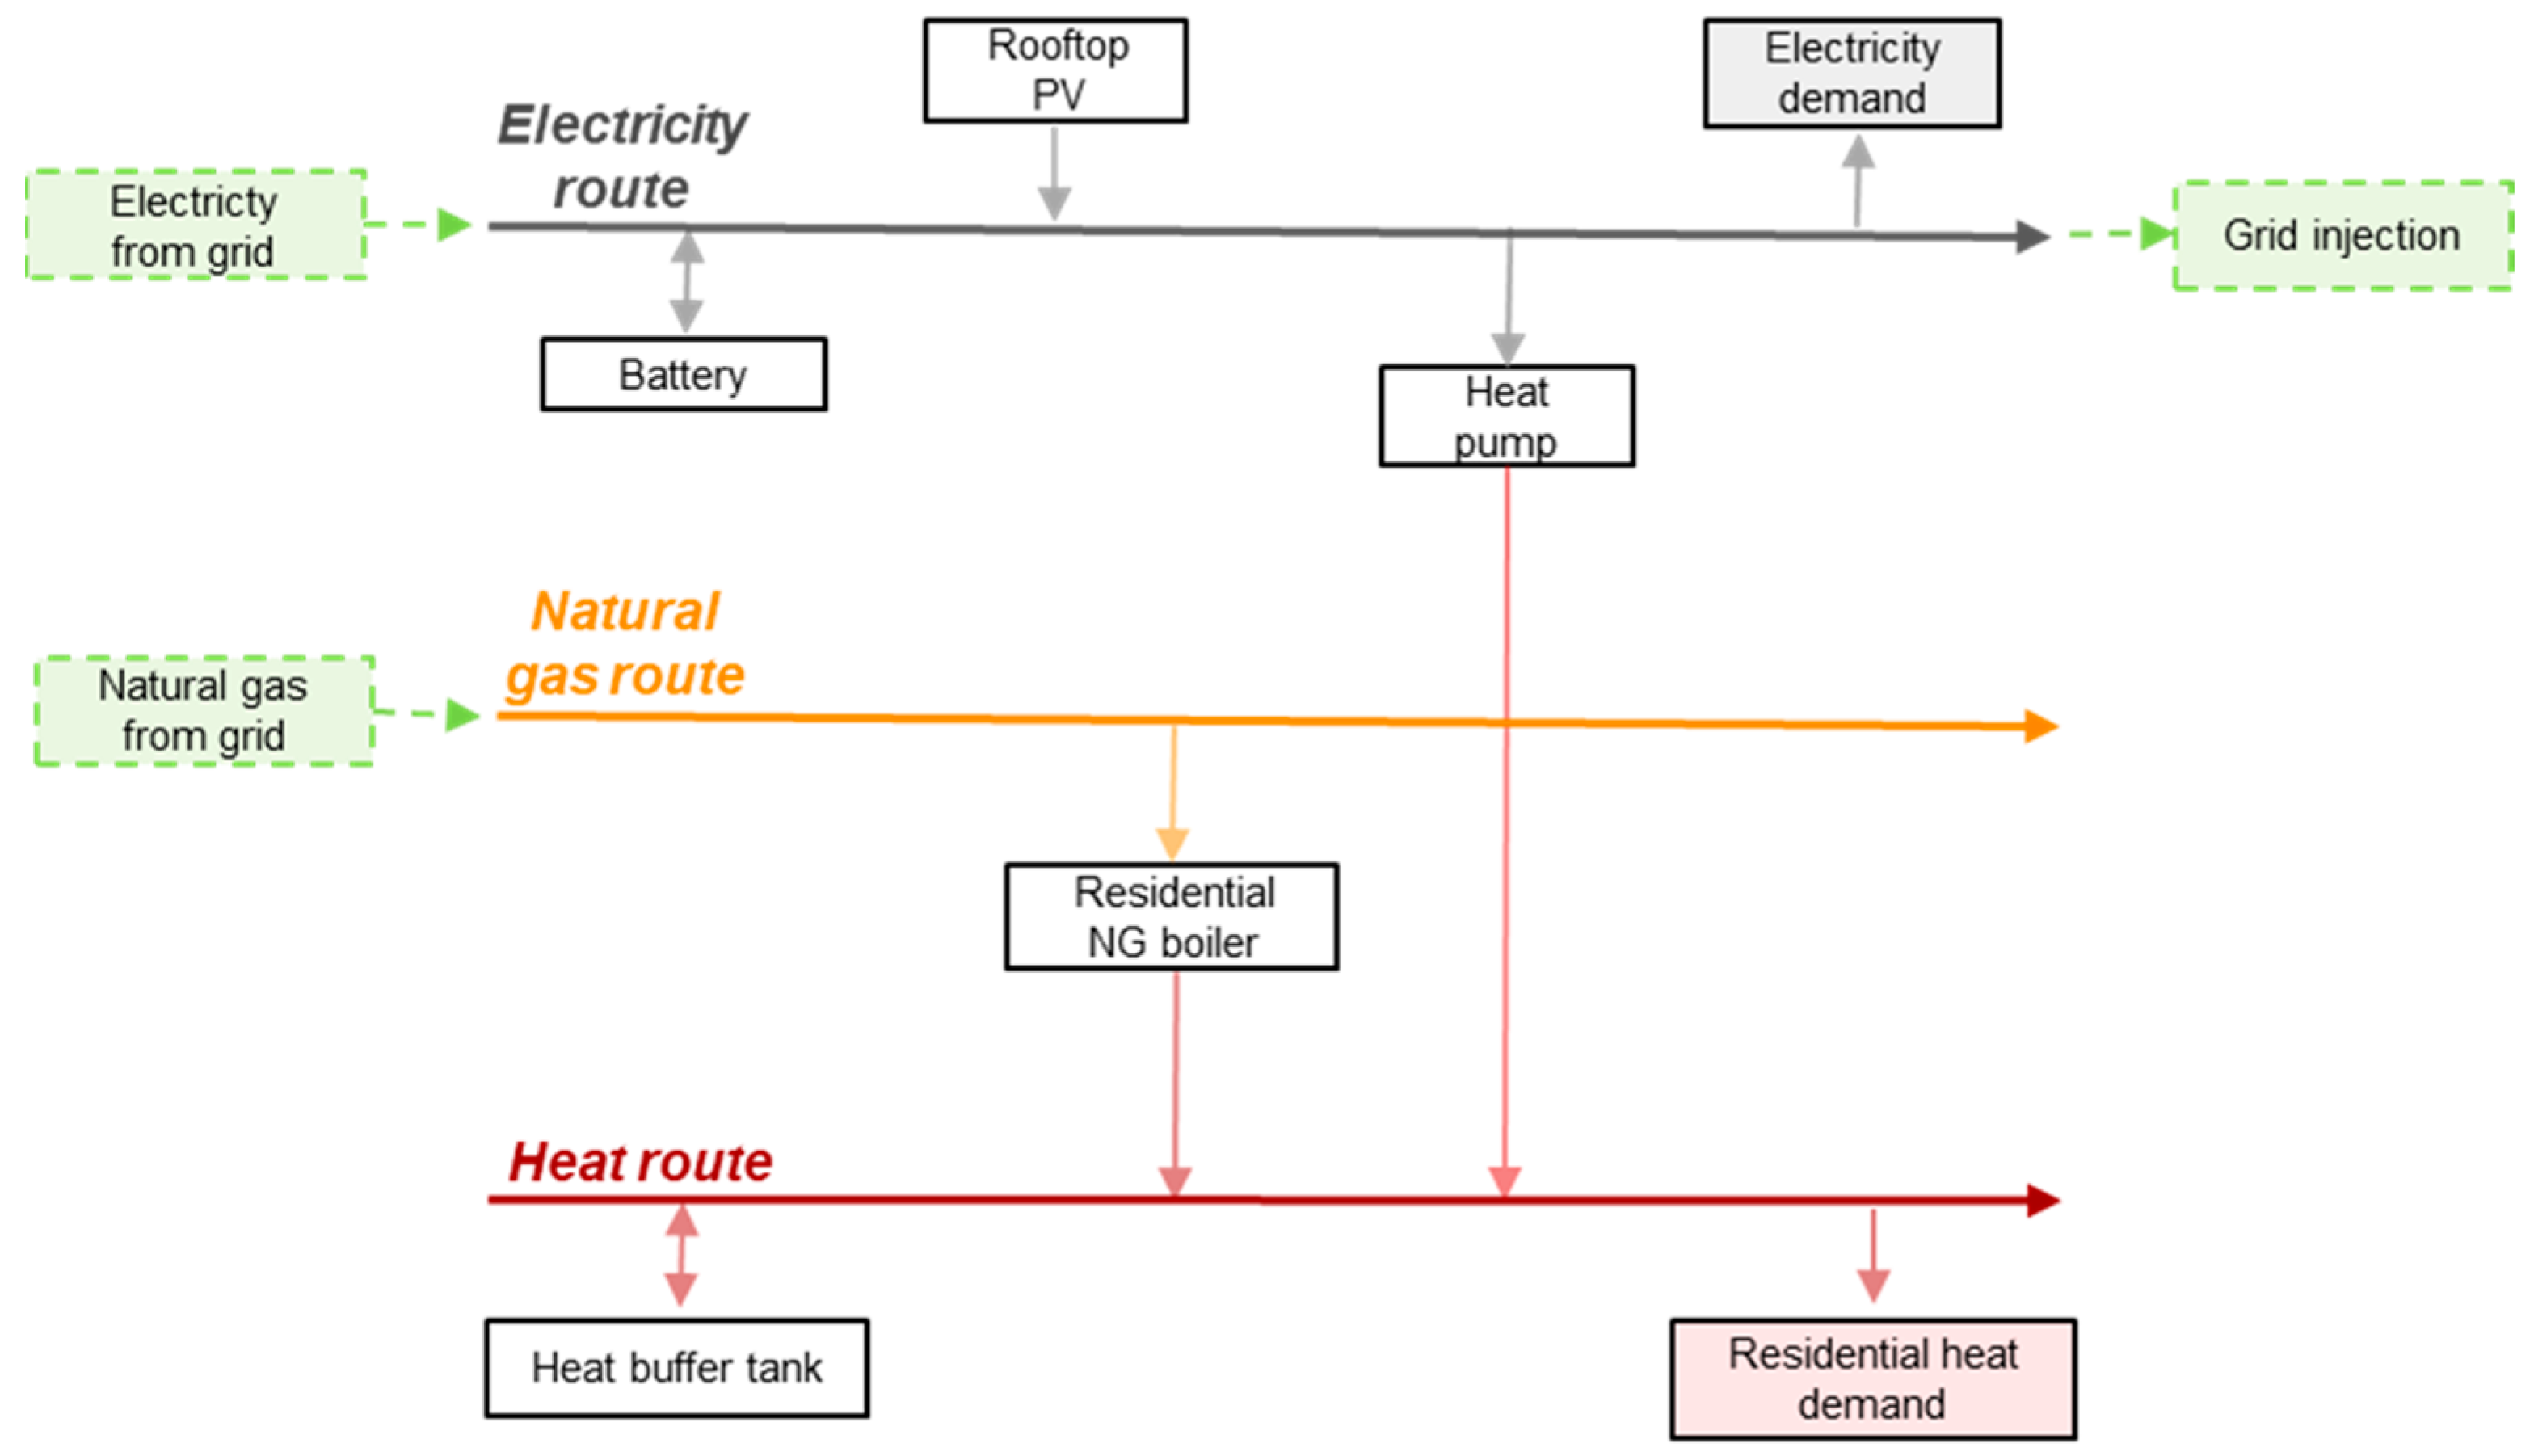
Figure 1. Hence, the HESS under study will then be described with help of a schematic view of the energy vectors and their interaction with the technologies involved given in
Figure 2.
As a second part, the modeling framework is provided with the presentation of the mathematical model. The model and its mathematical formulation are directly related to previous work [
19,
20] carried out as part of the
EPOC project, granted by the Belgian Energy Transition Fund.
The third and last part of this section relates to the time series data process to generate dwelling diversity using stochastic techniques.
2.1. Description of the Investment Model
Figure 1 provides a schematic overview of the investment model structure. It illustrates input data, encompassing energy vectors, available production (renewable and conventional), and storage technologies, along with associated technical and economic parameters, system economics, energy demands, and the optimizer’s objective function and model constraints.
The optimization yields outputs that include the selection and optimal sizing of technologies, the optimal operation of energy production and storage on a quarterly basis, the contribution of each unit to energy supply, and economic performance indicators, namely, investment and operating costs, as well as the net NPV at the end of project’s lifetime.
The multi-energy system illustrated in
Figure 2 involves three energy vectors (electricity, natural gas, heat) and three energy supply sources: grid-supplied electricity and natural gas, along with electricity generated by high-efficiency rooftop PV panels. The model incorporates two conversion technologies (air/water electric heat pump and a residential gas boiler) and two storage technologies (Li-ion battery and heat buffer tank). The energy requirements of the system include electricity consumption and SH and DHW demands.
The considered air-to-water EHP is for radiator heating purposes with an integrated DHW tank, providing heat for both SH and DHW demands. Equipped with DC inverter technology, the EHP is able to modulate its output heating power.
Complementing the EHP, a heat storage buffer tank can be installed to enhance the water volume in the radiator heating system. Acting like a thermal battery, it enables the heat pump to generate and store heat for subsequent use throughout the day. The heat buffer tank is also equipped with a spiral coil heat exchanger to facilitate the storage of domestic hot water along with space heating.
The decision-making of the optimizer for the dispatch of the energy flows is made according to the following choices [
19]: At each time step, PV production is first used to meet the electricity demand. Any excess can be stored in the battery, injected to the grid, or converted into heat with the heat pump. This heat is then used directly to cover the thermal demand or stored in the buffer tank. If electricity demand remains, it is supplied by discharging the battery or importing from the grid. Likewise, any remaining heat demand is met either by the heat pump, using electricity from the battery or the grid, or by the existing gas boiler supplied with natural gas.
2.2. Mathematical Formulation
As mentioned above, the mathematical framework is related to previous work [
19,
20] and is formulated using Equations (1)–(12).
This investment model is a linear program designed for the economic dispatch of a residential energy supply system. The program utilizes input/output equations to represent the considered energy supply system. Over a year with an hourly time step i, this mathematical program optimizes energy flows based on predefined constraints and an objective function aimed at minimizing overall costs. Consequently, this program performs the long-term scheduling of the system presented in
Figure 2, determining the optimal selection and sizing of technologies involved to achieve cost minimization. This model is deterministic and operates under the assumption of perfect forecasting of energy demands, production profiles of intermittent renewable technologies, and continuous availability of units throughout the year.
Four sets are introduced in the mathematical model: the simulation time interval I, containing the 8760 time steps of 1 h; the set of energy carriers E = {elec, CH4, heat}; the set of generating technologies G = {EHP, boiler}; and the set of storage technologies S = {battery, buffer tank}.
The objective function defined in (1) aims to minimize the total annual costs of energy supply. This total cost is the sum of the annualized investment costs, , and the total operating costs, , respectively, as described by (2) and (3). The annualization of investment costs is carried out over the project’s economic lifetime N using the discount rate D. The total investment costs are calculated based on the installed capacities of the selected set of technologies T and their respective unit costs, while the total operating costs include both fixed and variable operation and maintenance expenses (FOM and VOM) for all technologies, as well as the annual energy bill C.
The conversion of one energy e vector into another e’ is described by (4), where is the power consumption of the carrier e required by the technology to generate , the equivalent power in terms of carrier e’, with the conversion efficiency .
The dynamics of the energy storage technology are described in (5) with the update of the state-of-charge SOC(i) for each time-step, by considering (resp., ), the power flowing in (resp., out), and its associated charging efficiency (resp., discharging efficiency ). Energy losses via self-discharge of the storage technology from one time step to another are also accounted for in (5).
Moreover, (6) constrains the maximum power , with corresponding to the installed capacity of the technology g. Similarly, in (7) and (8), the installed power capacity of the storage technology s, constrains the charging power and discharging power of technology s. The installed energy capacity in (9) finally sets a maximum value on the SOC of the storage technology s. We also deemed it realistic to constrain the installed capacities of PV and TES technologies with maximum values of 10 kWp and 35 kWh for a detached house, respectively, corresponding to a 22 m2 surface area of PV panels and a 1000 L hot water tank with a 30 °C temperature elevation for storage.
Energy balance Equations (10)–(12) impose that, for each energy carrier, the amount of energy consumed or imported by the energy system at time-step
i is at least equal to the amount of energy produced or exported.
The power balance Equation (10) requires that, at each time step, the total electricity supplied by rooftop PV, imported from the grid, and discharged from the battery is equal to the sum of direct electricity demand, the electricity consumed by the EHP, the electricity used for charging the battery, and the electricity exported to the grid. In parallel, the heat balance (11) ensures that the heat produced by the boiler, the electric heat pump, and the discharge from the thermal buffer tank matches the demand for SH and DHW or is stored in the buffer tank. Finally, Equation (12) specifies that the natural gas consumed by the back-up boiler must be equal to the amount imported from the gas grid.
2.3. Input Profiles Generation
To generate high-resolution profiles for domestic electricity and SH and DHW loads, along with global solar irradiation and ambient temperature profiles, we rely on the high-resolution stochastic integrated thermal–electrical domestic demand model [
21] developed by the Centre for Renewable Energy Systems Technology (CREST). Their model uses statistics tools to stochastically generate behaviors (among others, occupancy, activities, heating, and cooling habits) and solicitation profiles (temperatures, solar radiation). These profiles are then used to generate domestic electricity, heating, and cooling demands [
21,
22,
23]. The methodology is similar to the one developed in previous work [
24] to generate an input dataset of 2000 scenarios, comprising time series for ambient temperature, global irradiation and rooftop PV production, electrical load, and SH and DHW demands with an hourly time step.
The CREST weather modeling includes two parts: radiation and ambient temperature modeling. For the radiation, the model first calculates the clear-sky solar radiation given the location and the day. Then, using a Markov chain, it estimates a clearness index profile representing the variation in the cloud cover throughout the day. Combining the clear-sky radiation with this profile gives the daily evolution of the solar radiation. For the temperature, the model picks, using an autoregressive moving-average model and weather data, a maximal and minimal temperature for the day. Then, using the daily variation in the solar radiation, it determines the temperature variation between those two values.
The electrical part of the CREST model first uses Markov chains to generate behavioral patterns (presence and sleep schedule) [
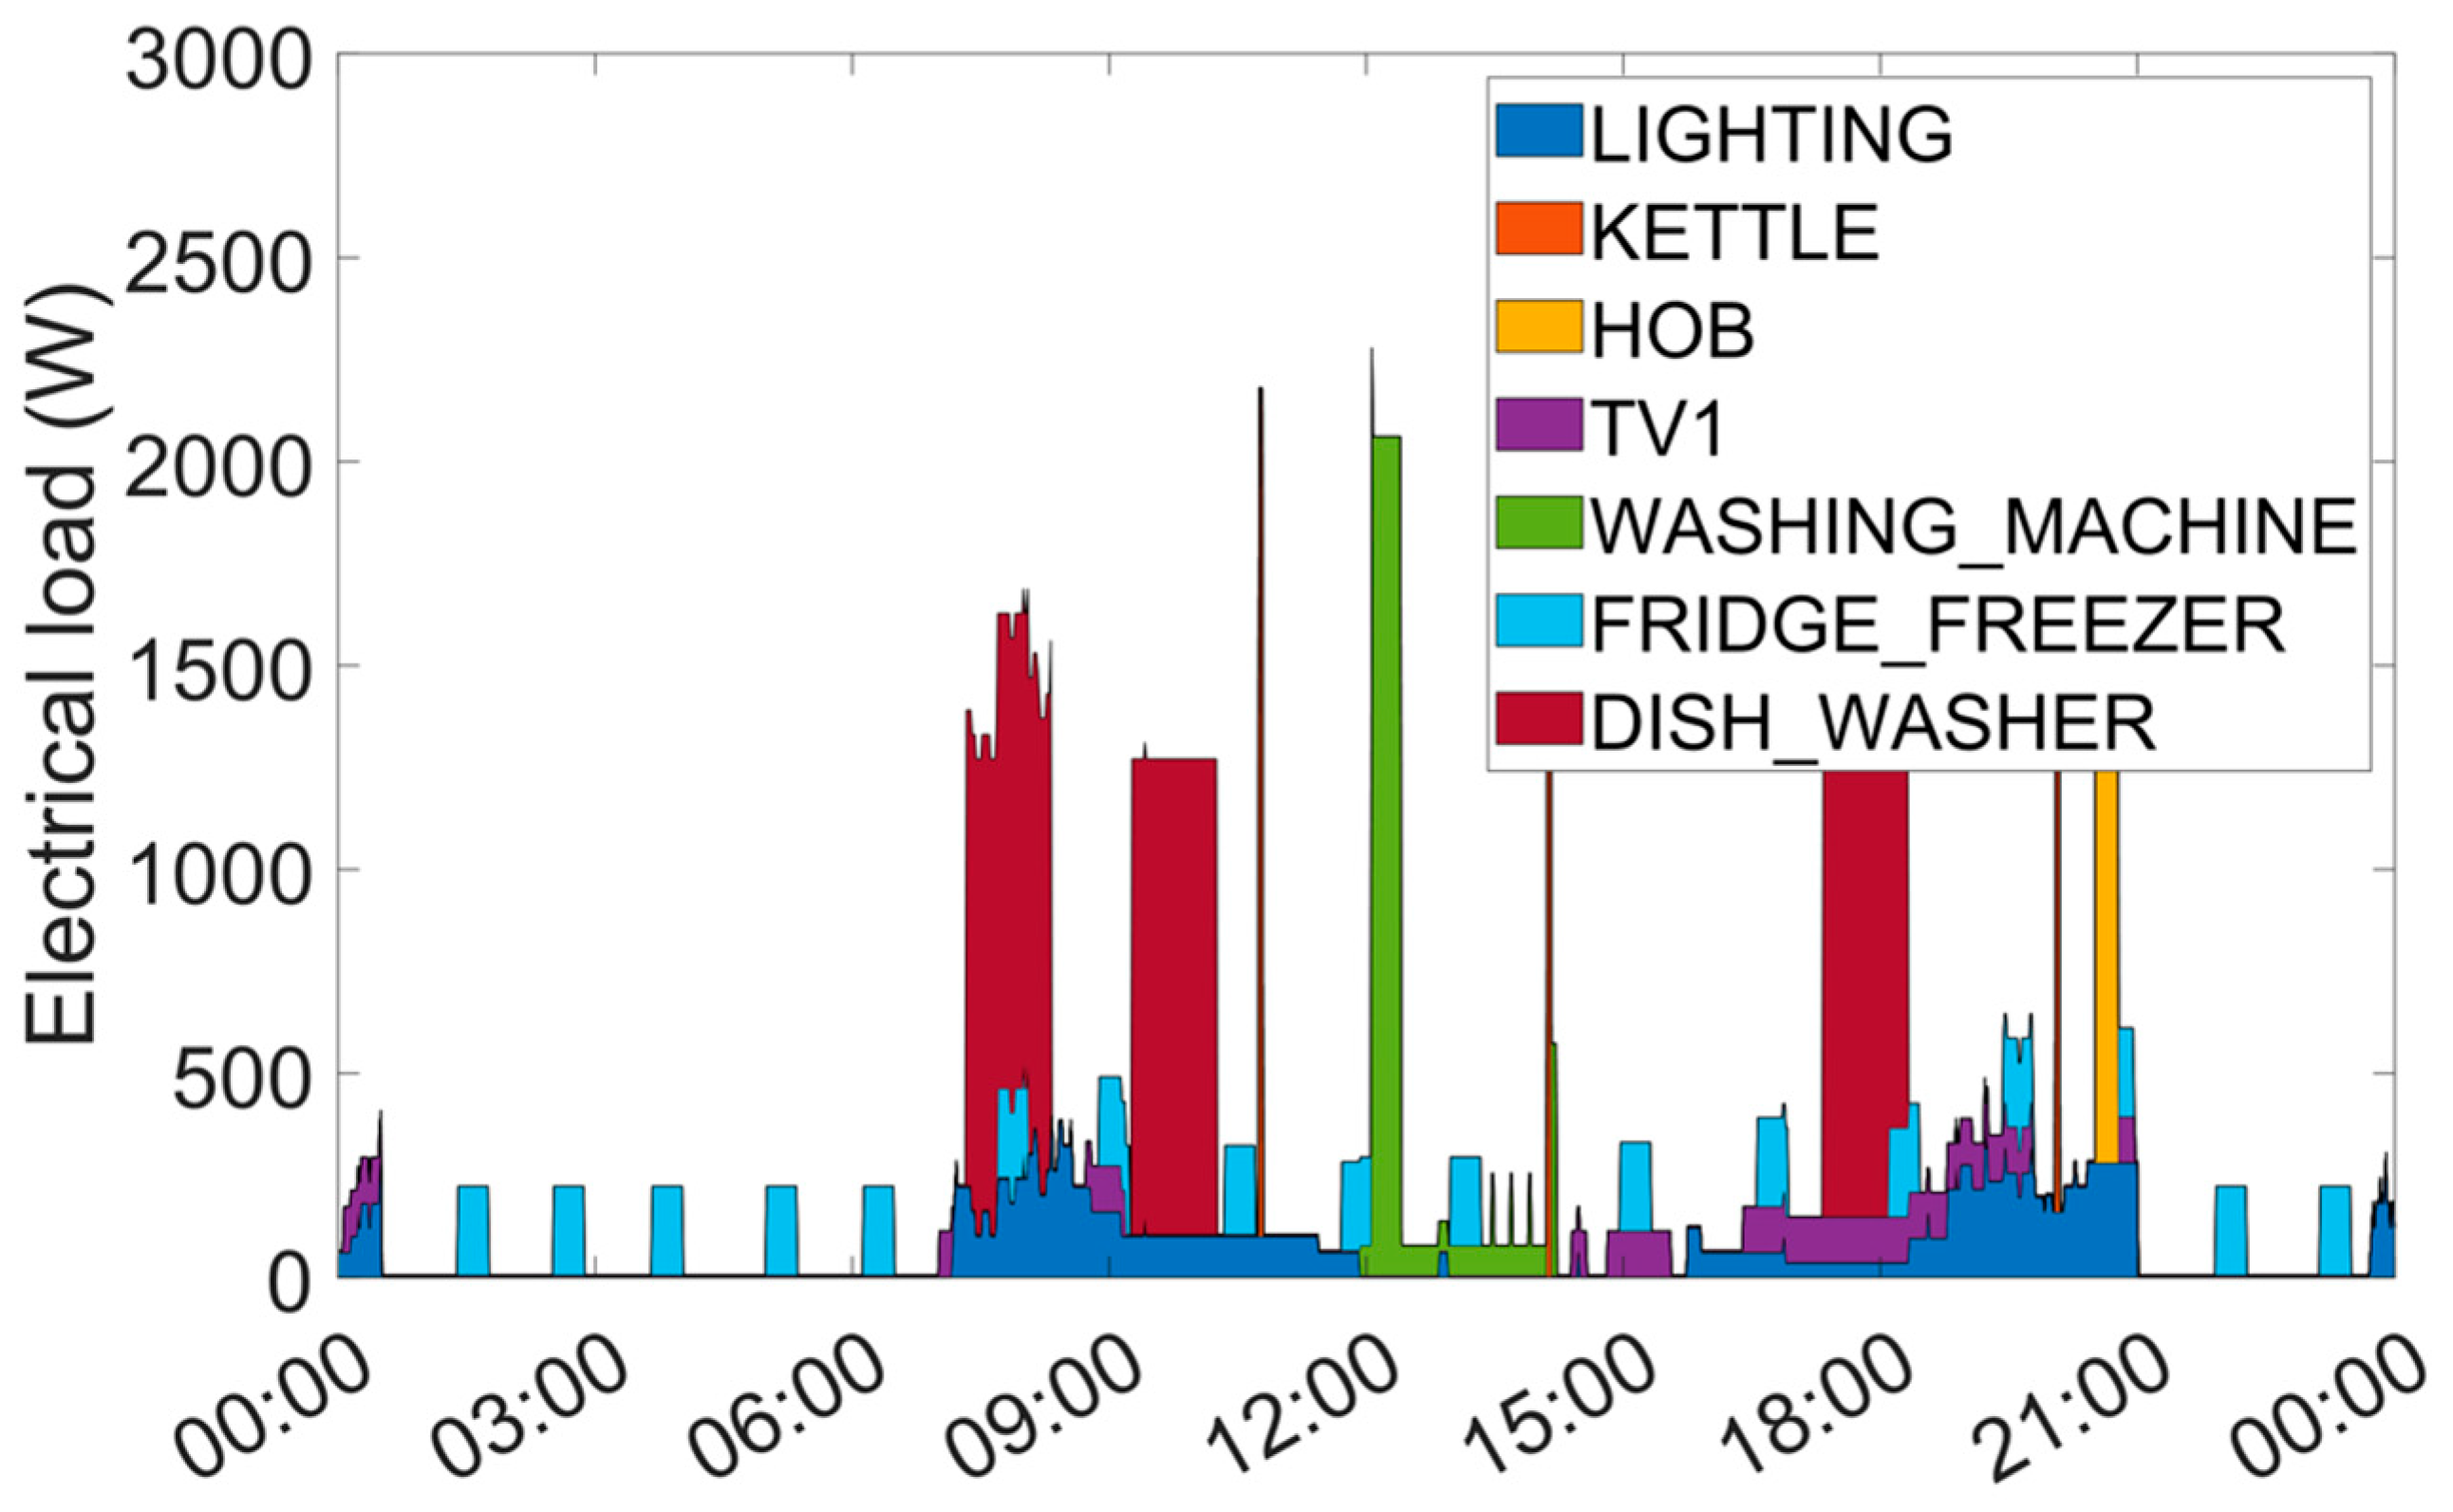
22]. Then, it stochastically assigns to each dwelling a set of appliances based on national statistics. Finally, it generates the appliances’ electricity profiles, combining these appliance sets with activity statistics, occupancy patterns, and appliances characteristics (mean power, mean running time…). For the lightning and hot water demand, the process is similar but also uses solar radiation for lighting.
Figure 3 shows the type of electricity load profile that can be obtained with the CREST model (with a reduced number of appliances for visibility).
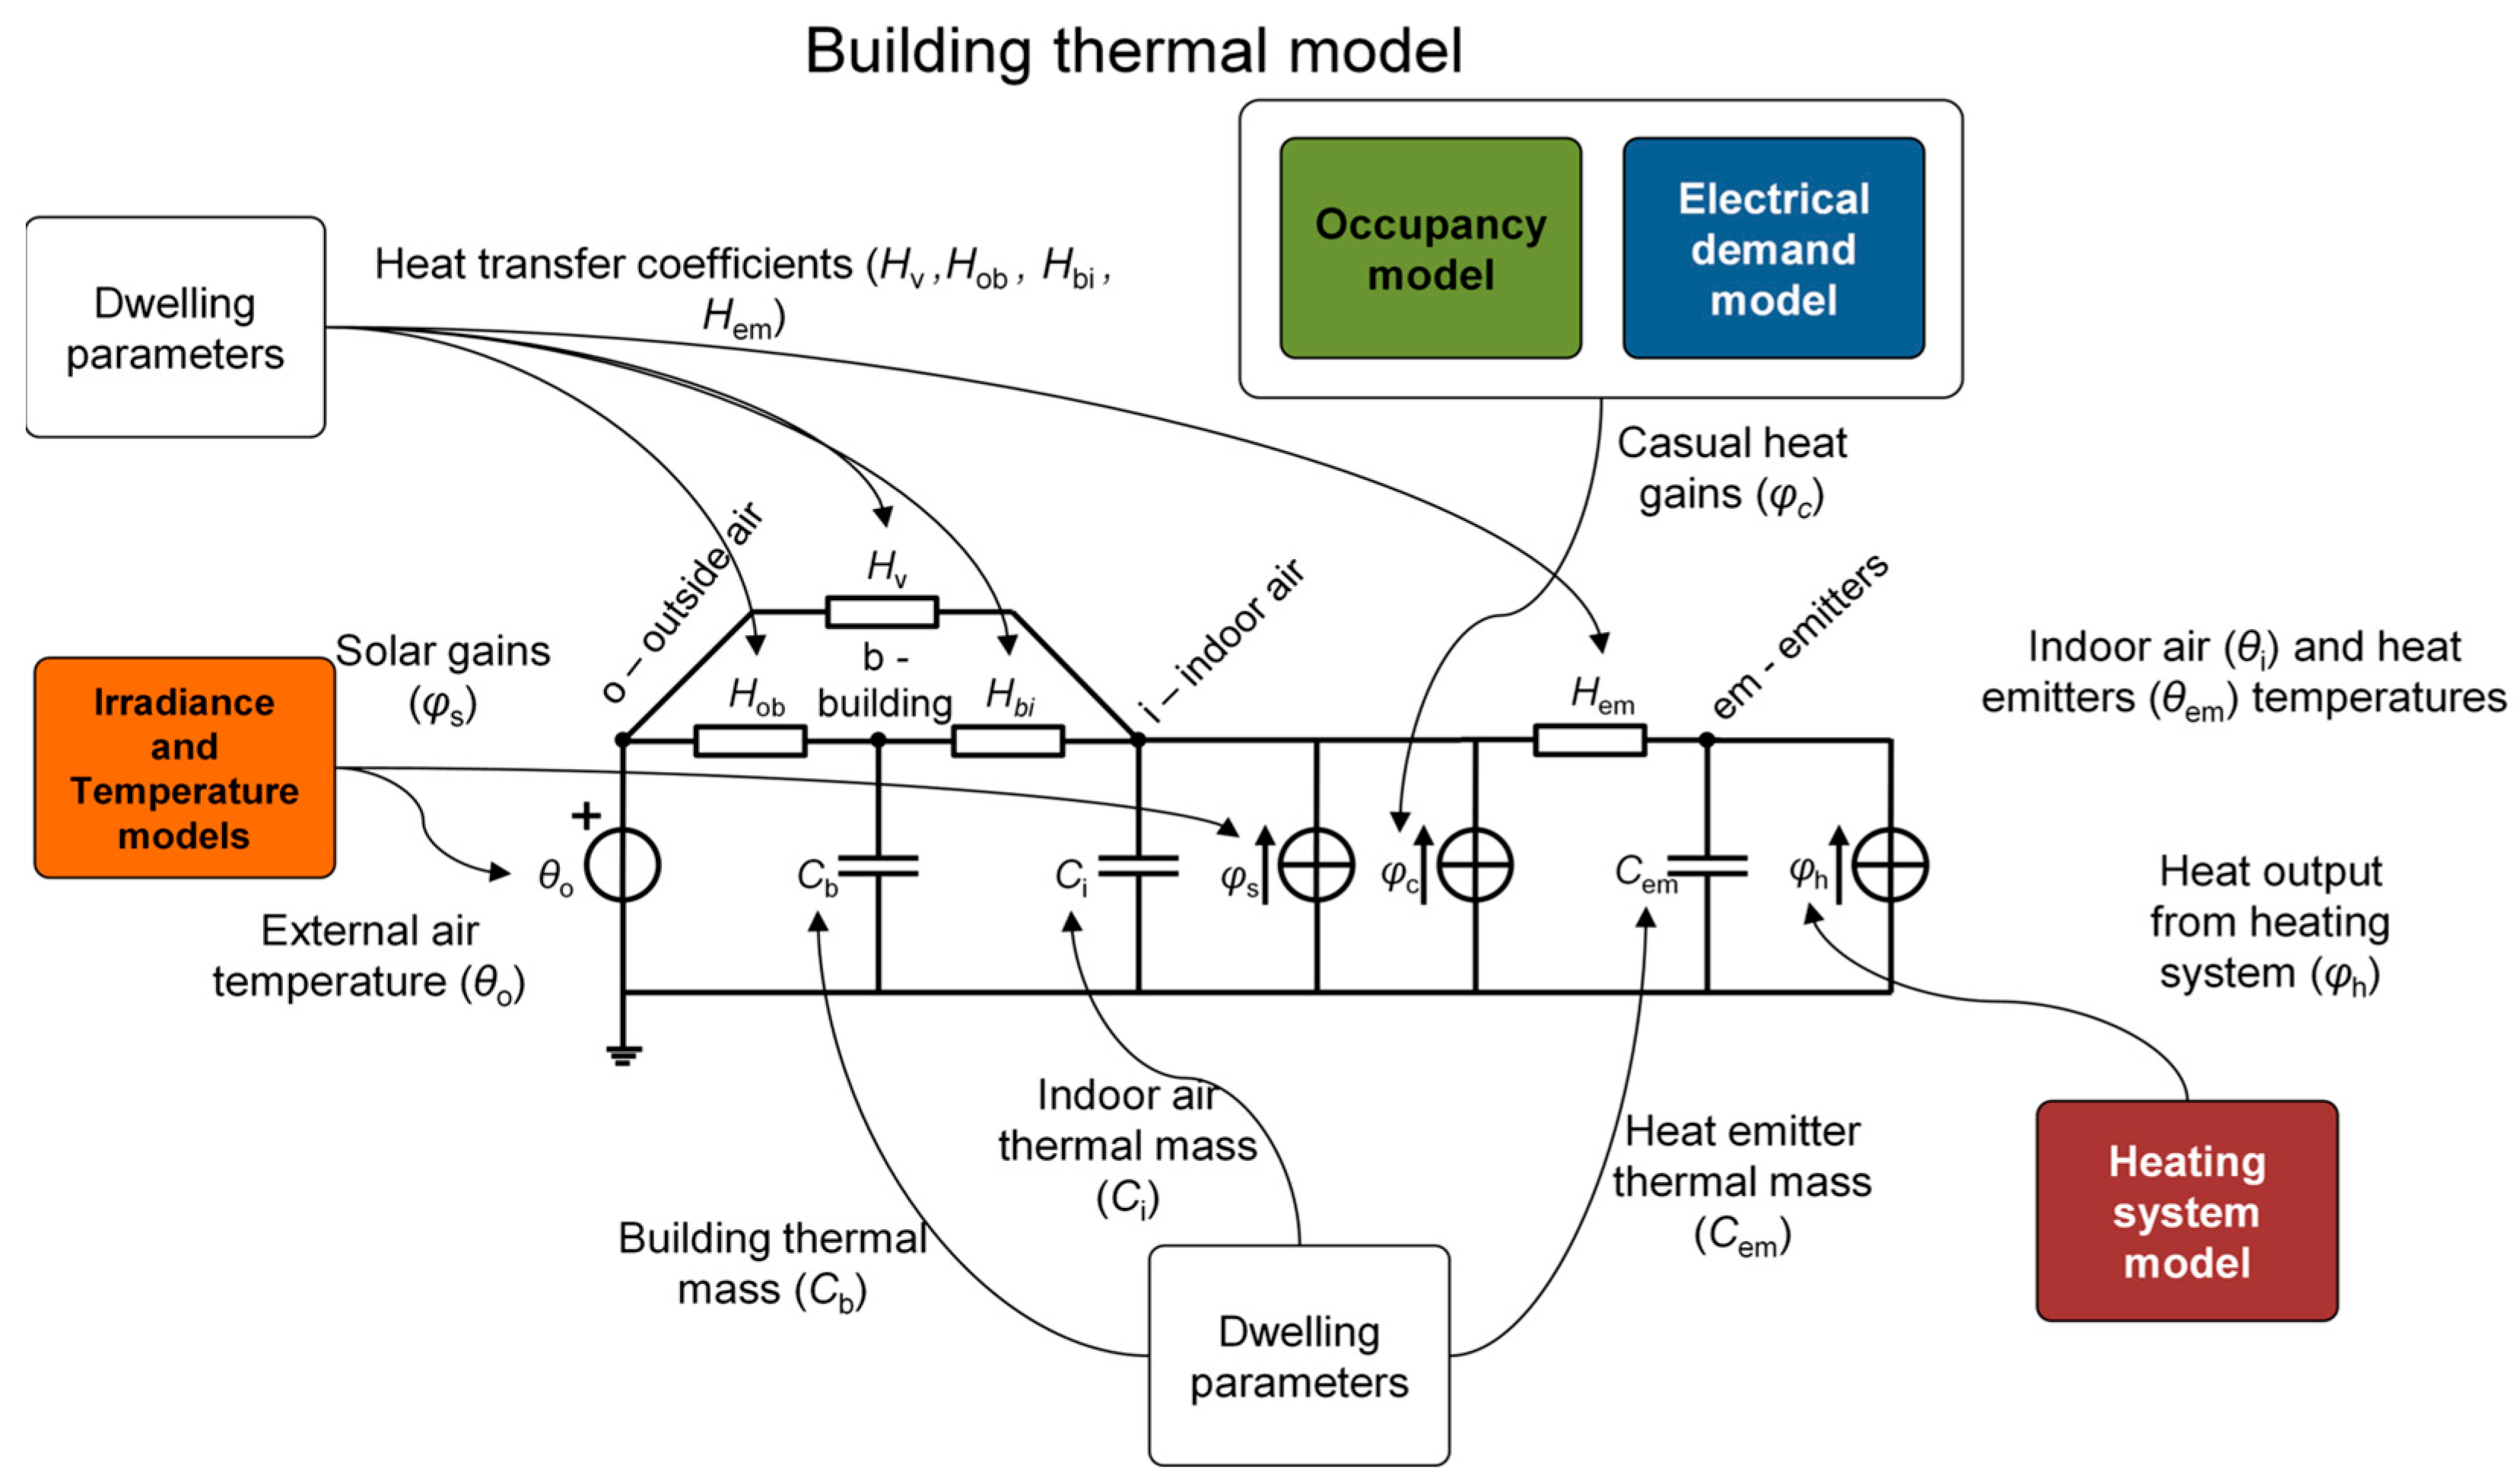
The thermal part of the CREST model, illustrated in
Figure 4, is built around a grey-box building model, simulating variations in indoor temperature and, through heating control, determining the amount of heat required to maintain the desired temperature in the building.
The grey box model is composed of 3 capacities representing the thermal inertia of the building envelope, the indoor air, and the heating/cooling appliances, respectively. It also includes 3 heat transfer coefficients to represent the transfers from the ambient air to the building envelope, then to the indoor air, and finally, to/from the heating/cooling appliances. A fourth coefficient simulates losses associated with air movement. Four heat sources/sinks account for the exterior, the solar gains, the casual heat gains (inhabitants, appliances, lighting, and hot water tank losses), and heating.
Regarding heating control, the model’s authors note that, due to limited data, simplifications were necessary [
21]: heating setpoint temperatures were assigned to buildings stochastically, and the activation of the heating system is determined using transition probabilities, resulting in daily activation for an average of 10 h. However, this distribution is not linked to the occupancy patterns defined in the electrical load model and can therefore be inconsistent with them.
Finally, for hot water demand, the model applies a similar method to the electrical component: occupancy patterns and activity statistics are used to generate hot water demand profiles. The model then calculates the thermal demand associated with the amount of hot water drawn from the hot water cylinder and the temperature difference between the tank and the cold water inlet. The hot water thermal demand also includes static consumption to maintain the tank temperature at the setpoint.
To summarize, a list of all sources of variation in the domestic model can be found in
Table 1.
The current CREST model iteration is available as an open-source Excel (version 16.82) spreadsheet [
18]. It can be used to generate profiles that are high-resolution (one minute) and coherent with each other, meaning that a decrease in solar irradiation will simultaneously increase energy demand and decrease the PV production. However, the spreadsheet only allows for simulating one day at a time and is limited by Excel’s computing speed.
To enable the generation of thousands of annual profiles, the model was reimplemented in the Matlab environment (version r2025a) and adapted to meet specific requirements of the present study. First, the gas boiler model was bypassed to obtain a generic heating demand rather than a gas-specific demand, allowing the heating load to be directly used as an input to the multi-energy system model. Second, the simulation is performed over a specified duration instead of a fixed 24 h period, which enables a more accurate analysis of continuous system behavior, mitigates the impact of initialization artifacts, and prevents abrupt shifts between consecutive days. Finally, the calculation of PV production is adjusted to account for the influence of PV module temperature on conversion efficiency.
4. Results and Discussion
For each scenario, the profitability of the investment opportunity is determined and compared against its reference for each individual scenario. The reference of the individual scenario consists of applying the same inputs to a simplified version of the investment model presented in
Section 2.1, representing the business-as-usual (BAU) situation, i.e., only using electricity and natural gas from the grid to supply the energy needs. Consequently, the annual cash flows resulting from the cost differences between an individual scenario and its reference are used to compute the NPV of the project after 25 years.
Again, two additional designs are determined using the so-called average scenario and the selected scenario 617, represented in
Figure 7 and
Figure 8, respectively, by a red cross and a green diamond. As explained in
Section 3.2, the average scenario corresponds to a subset of the “averaged” profiles, with each profile resulting from the average of the 2000 individual profiles at every time step
i. The selected profile 617 was selected as the most representative profile amongst the 2000 individual profiles according to the Sandia method based on CDF. These two scenarios are also used as inputs to the investment model, and the associated results are compared against the results of the 2000 individual scenarios.
To provide insights into the impact of policy decisions such as subsidies for renewable technologies or energy efficiency projects, this section concludes with a sensitivity analysis on system design and economic indicators for a progressive reduction in the investment costs.
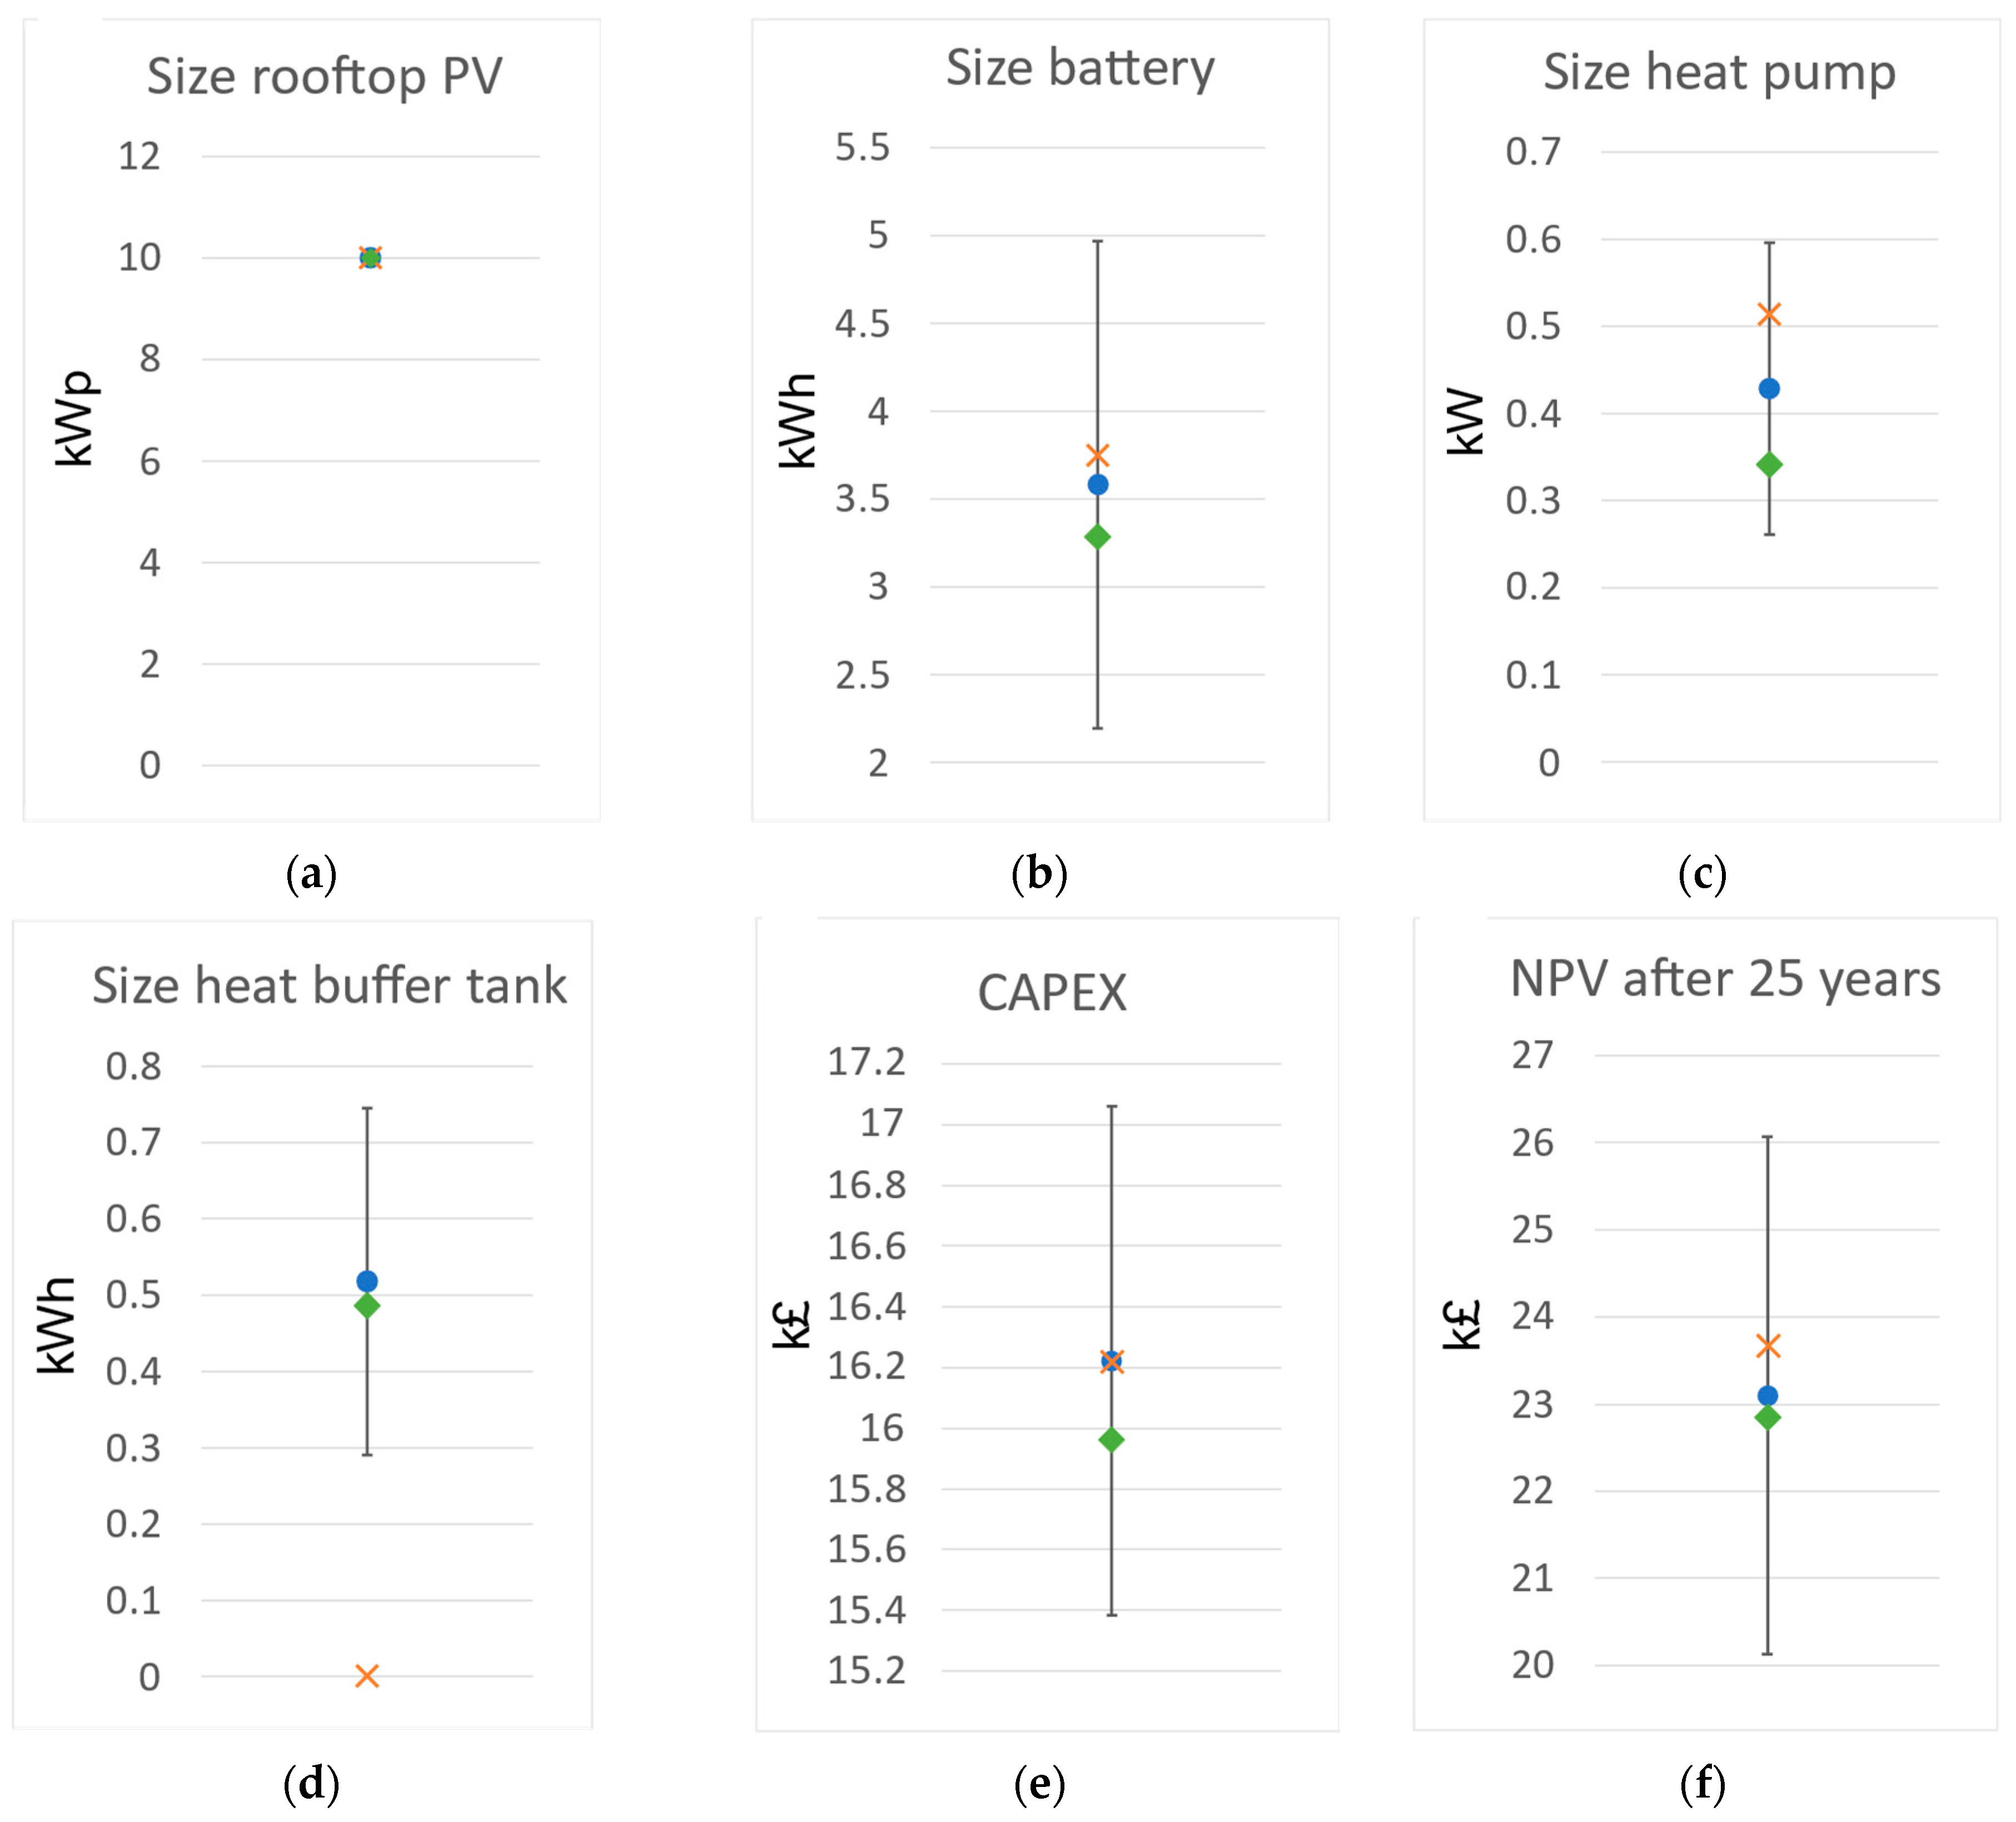
In
Figure 7, the four plots
Figure 7a–d illustrate, respectively, the sizing of the rooftop PV, battery, EHP, and TES, while
Figure 7e,f summarize the total initial investment and the NPV after 25 years.
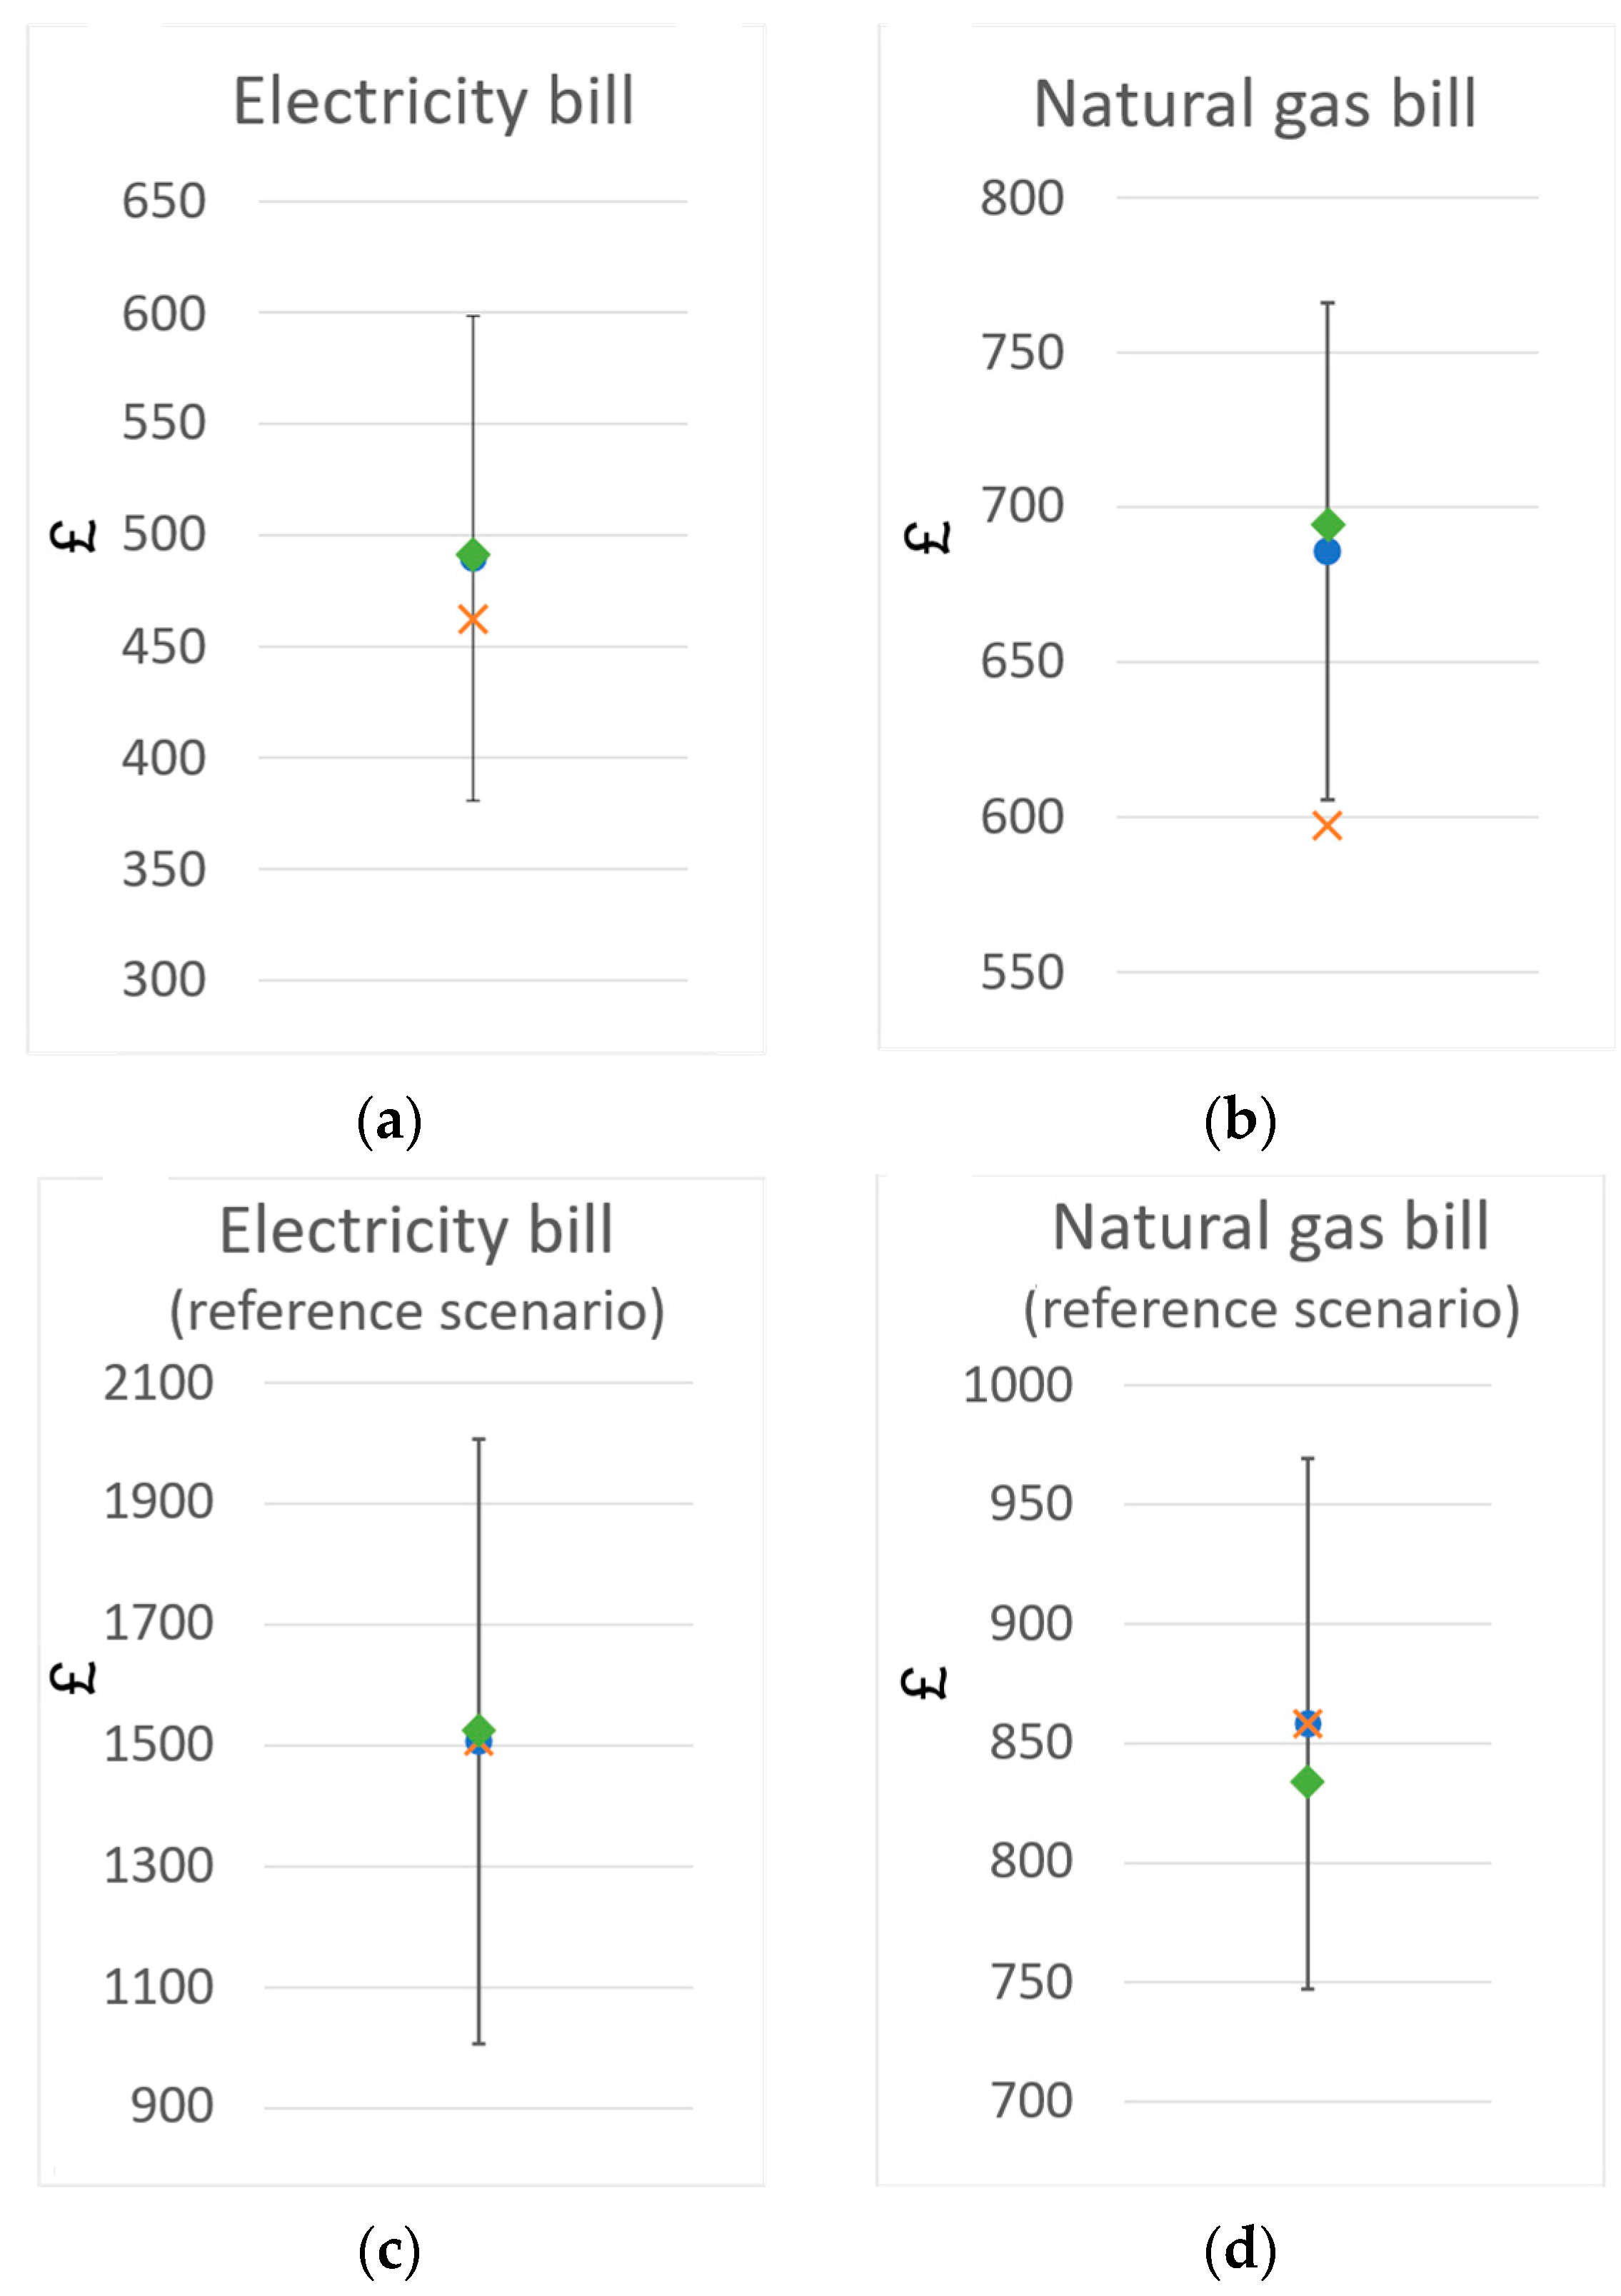
Figure 8 is used to present and compare the energy bills of the scenarios compared to their BAU counterpart: the two upper graphs in
Figure 8a,b present the electricity and natural gas bills of the optimal designs, respectively, while the bottom graphs
Figure 8c,d show the electricity and natural gas bills of the reference scenarios, respectively.
The four plots
Figure 7a–d on the sizing of the technologies show that the installed PV capacity is always maximized by the optimizer, and this is explained by the fact that the revenues generated by feed-in of PV surplus to the grid are substantial; however, the sizing of the power-to-heat and storage technologies consequently vary, mainly due to the diversity of energy demand profiles. We indeed observe the battery sizing varying between 2.2 kWh to 5 kWh, EHP size ranging from 0.27 kW to 0.6 kW, and TES sizes from 0.3 kWh to 0.75 kWh.
On the other hand, we observe in the CAPEX and NPV graphs in
Figure 7e,f that the economic performances are not subject to important variations, with CAPEX values stabilized between GBP 15,400 and GBP 17,000 and NPV values between GBP 21,000 and GBP 26,000. We particularly observe that, despite a significant initial investment requirement, investing in a PV–battery–heat pump–buffer tank system proves profitable, yielding an NPV of around GBP 23,000 after 25 years. Also, comparing the energy bills,
Figure 8a–d shows that natural gas is still largely preferred in the alternative energy system, with only a small portion of natural gas consumption being converted into electricity through power-to-heat conversion. Interestingly, even with this electrification of energy demand, the electricity bill in
Figure 8c drops substantially, by around GBP 1000, compared to the business-as-usual case in
Figure 8d.
Focusing on the results differences between the average of the 2000 individual scenarios, the average scenario, and the selected scenario 617, we observe that the output values of the selected scenario are closer to the average of the 2000 individual scenarios than ones of the average scenario are. This means that if we perform only one optimization using the selected scenario, the computational resources and associated solving time are divided by a factor 2000; employing the selected scenario therefore strikes a favorable balance between accuracy and computational efficiency.
It is also observed that the heat buffer tank capacity in
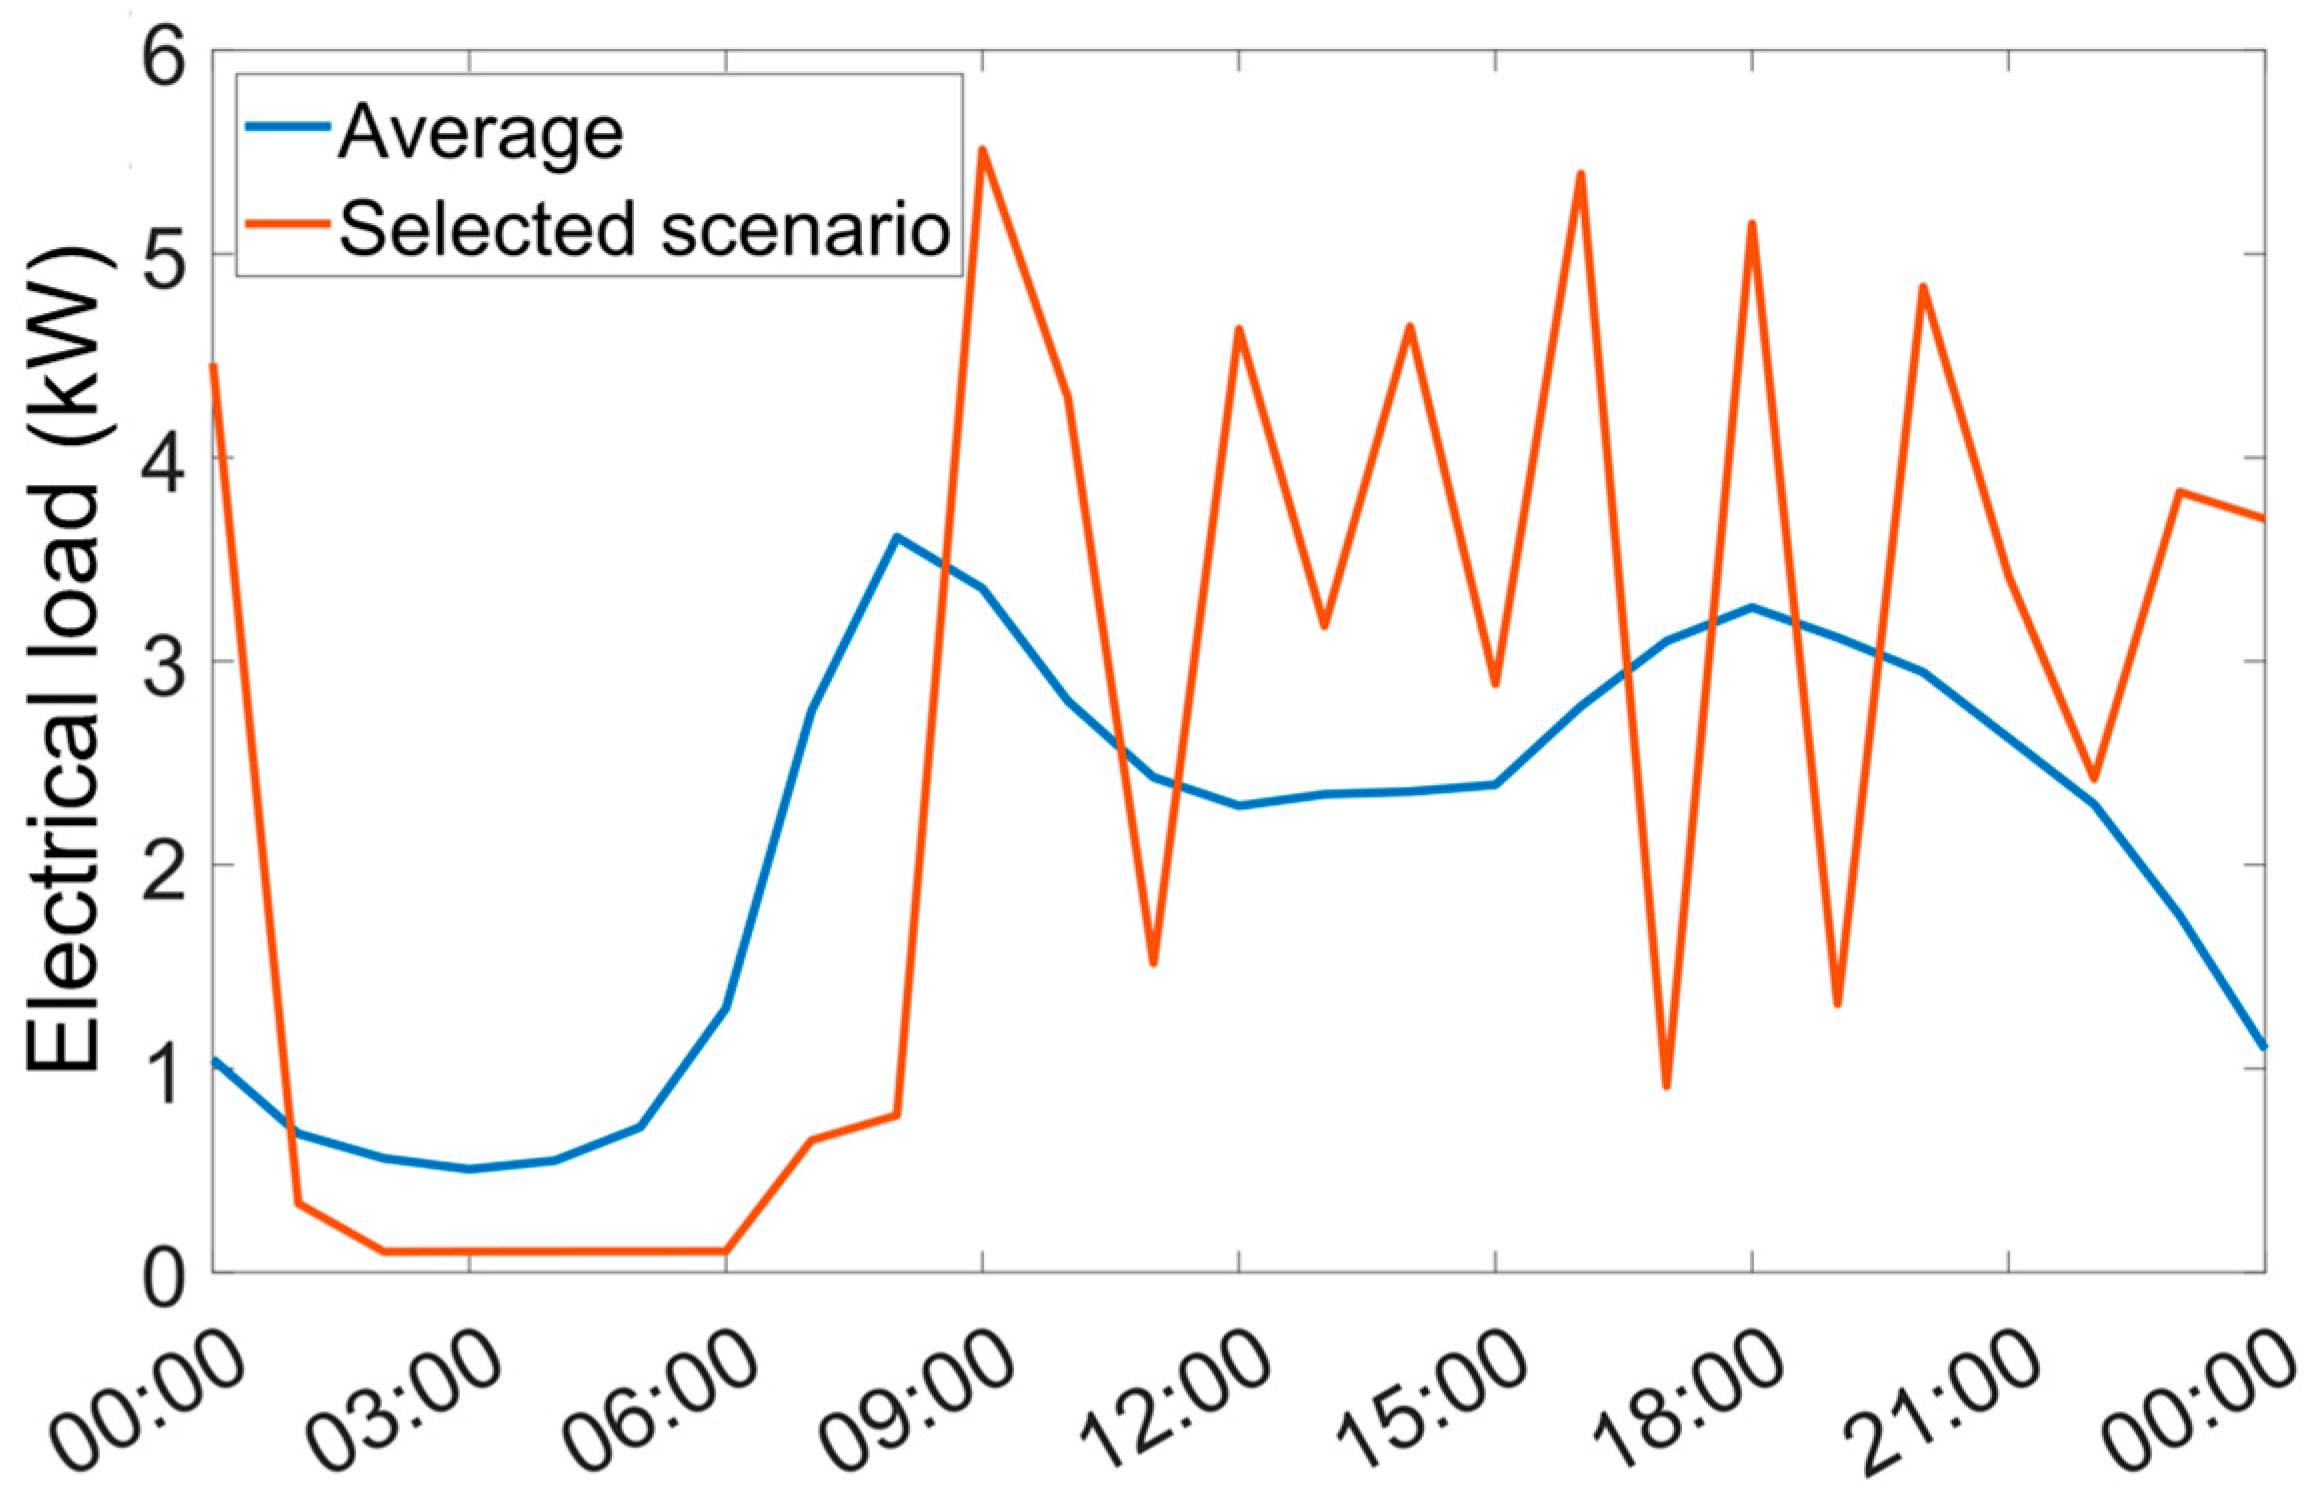
Figure 7d is set to null by the optimizer when we consider the average scenario. The energy bills are also underestimated when using the average scenario, resulting in an overestimation of the NPV. Such discrepancies between the results of the average scenarios and the selected scenario can be explained using
Figure 6: we observe that the average profile is smoothened compared to the selected one, failing to capture the typical spikes observed in individual demand profiles.
Moreover, in view of the low values observed in
Figure 7c,d for the sizing of EHP and buffer tank, it can be concluded that today, in the UK, installing an air-to-water EHP and a TES is not competitive compared to a natural gas boiler to supply heat in households; a small booster heat pump for hot water supply could be recommended instead.
Lastly, the sensitivity analysis in
Figure 9 shows how system design and economic indicators evolve when the investment costs are progressively reduced in 10% steps. Scenario 617 is used as baseline scenario.
For example, moving from 0% to a 50% CAPEX reduction, the thermal storage capacity increases from 0.5 MWh to more than 2.6 MWh (+420%) while battery storage grows from 3.3 kWh to over 6.3 kWh (+90%). In parallel, the heat pump capacity nearly quadruples, from 0.34 kW to 1.35 kW. These technological shifts are directly reflected in performance outcomes: as result of electrification of heat production, the gas bill reduces from GBP 694 to GBP 412 (−41%), and CO2 emissions fall from 57.5 to 24.3 tons (−58%). The electricity bill decreases from GBP 491 to GBP 407 (−17%), surely due to the increase in electrochemical storage capacity. At the same time, the NPV over 25 years rises steadily from GBP 22.8k to GBP 31.6k, explained not only by the investment costs but also by the improved energy efficiency resulting from a greater use of PV energy. Indeed, the sensitivity analyses showed that revenues associated with feed-in of excess PV energy steadily decreased, favouring self-consumption to optimize energy bills. These trends are confirmed with the further decrease in CAPEX. It is interesting to note that the 100% reduction case represents the ideal design of the project, purely optimizing the operational costs of the energy system, initials costs aside. The results indicate a sudden decrease in HP capacity correlated to a significant increase in energy storage, with battery capacity almost doubling and TES capacity massively increasing up to the 35 kWh threshold that was set as the realistic maximum capacity for a home energy system. This suggests that storage capacities actually help to further cut carbon emissions to almost zero, but associated technology costs compared currently represent a barrier to zero-carbon buildings.
These results underline how the system design gradually transitions towards a higher penetration of renewable and flexible assets as investment costs decline, leading to simultaneous economic and environmental benefits. In this sense, policy instruments act as enablers for cost-effective decarbonization pathways by shifting the optimal system design towards higher shares of renewable and storage technologies while limiting carbon emissions and the impact on distribution systems.
5. Conclusions
This study presents a comprehensive methodology to assess investment opportunities in residential multi-energy systems, accounting for both climate variability and household demand diversity. A high-resolution bottom-up load profile generator, adapted from the CREST model, was implemented to generate a dataset of 2000 realistic UK household scenarios over a full year with an hourly resolution. These profiles capture the variability in electricity, space heating, domestic hot water demands, PV generation, and ambient temperature.
The investment model is formulated as a linear optimization problem that determines the optimal sizing of rooftop PV, battery storage, electric heat pump, and thermal buffer technologies while satisfying energy balances and technical constraints. Economic performance is evaluated over a 25-year horizon, including initial investments, operational costs, and revenues from grid injection.
The results show that while PV capacity is systematically maximized due to favorable tariffs, the optimal sizing of storage and power-to-heat technologies varies significantly depending on the scenario. However, the investment cost and net present value remain relatively stable, suggesting economic robustness. Importantly, the use of a single selected scenario, chosen via a CDF-based method, was proven to be effective in approximating a full stochastic analysis with reduced computational burden. In contrast, the average profiles tend to smooth-out variability, leading to biased sizing decisions and overestimated financial returns.
The findings further suggest that, in the UK context simulated in this work, gas boilers remain more economically attractive for space heating compared to electric heat pumps and thermal buffers, though the latter may still be relevant for domestic hot water.
Beyond the purely technical outcomes, the sensitivity analysis on initial costs demonstrates the importance of the broader policy and regulatory framework. Incentives such as subsidies for renewable installations, grants for energy efficiency projects, or dedicated reduced-interest loans can effectively lower financial barriers and drive the adoption of larger shares of storage and electrification technologies, which, in turn, can reduce households’ energy bills, fossil fuel dependency, and carbon emissions. However, achieving net-zero energy buildings currently necessitates cost reductions that are not yet commercially viable.
This study ultimately highlights the leverage effect of political decisions: even modest policy incentives can significantly reshape the economic viability and configuration of decentralized multi-energy systems, accelerating the pathway towards low-carbon, resilient, and cost-effective energy solutions.
