1. Introduction
The energy-saving retrofit (ESR) of existing buildings is important to realize global energy savings, reach net-zero emissions, and promote the rational use of resources. It is also an essential means to facilitate the transformation of the global economy in green, low-carbon, and sustainable directions. According to the Global Status Report for Buildings and Construction (Buildings-GSR) published by the United Nations Environment Programme (UNEP), in 2022, the buildings sector accounted for 37 percent of global operational energy and process-related carbon dioxide (CO
2) emissions; buildings were responsible for 34 percent of global energy demand; and the buildings and construction sector was responsible for 21 percent of global greenhouse gas (GHG) emissions [
1]. With the improvement of science and technology levels and people’s quality of life, the proportion of energy consumption and carbon emissions of existing buildings will continue to rise. Energy-saving retrofitting has broad prospects and enormous potential.
China’s existing buildings are primarily subject to single-building ESRs. Although there has been a certain degree of success, there is still a long way to go before China can achieve its integrated energy-saving and low-carbon goals and the comprehensive benefits thereof. There are still problems, such as insufficient motivation of the retrofit subjects, low efficiency, poor benefits, etc. The reasons for this are not only due to the ideological and conceptual factors but also to the lack of institutional mechanisms and the risk constraints of the energy performance contracting (EPC) operation mode. The specificity and complexity of ESR projects for existing buildings under the EPC model determines the existence of a large number of risks, while the connotation of the EPC model adds complexity to the predicament of energy service companies (ESCOs), which bear most of the risks in ESR projects for existing buildings. Therefore, effective risk warnings of ESCOs are the key to improving the efficiency of project risk management and promoting the orderly development of ESRs of existing buildings.
Scholars have systematically researched the risks of ESR projects for existing buildings. Still, the literature on risk early warning research based on the perspective of ESCOs is scarce. Jia et al. [
2] established a risk list based on a literature review and interviews, discussed the proactive measures taken by different stakeholder groups to reduce risks, and verified the relationship between high-level risk perception and proactive risk management by analyzing and comparing the level of attention of various stakeholder groups to 21 types of risks throughout all of China’s ESR projects through data collected by a questionnaire survey. Ali et al. [
3] analyzed the current risk management practices in the Ghanaian construction industry. They proposed that risk management should be integrated into general project management to ensure timely identification, analyses, responses, and continuous monitoring when risks occur. Annalisa et al. [
4] used EEnvest technology to construct a financial risk assessment model for existing building ESR projects to provide a decision-making tool for investors to carry out ESRs. Lin et al. [
5], based on the ANP-ANN (Analytic Hierarchy Process and Artificial Neural Network) model, predicted the principal risk factors and project quality of engineering projects and helped formulate appropriate risk mitigation strategies. Alfatihanti et al. [
6] used the life cycle cost methodology and relevant regulations to identify the risk factors affecting investments in green retrofit projects for high-rise office buildings and analyze the retrofits’ risk level, feasibility, and value. Huo et al. [
7] constructed a risk-sharing model based on the TOPSIS method and a bargaining game model from the three dimensions of risk control ability, risk preference, and risk tolerance ability. They determined the optimal risk-sharing ratio between public and private parties in a retrofit project to realize a reduction in risk management costs.
As far as the results of the existing research are concerned, there are still deficiencies regarding research perspective, depth, and methodology. From the standpoint of research, most studies are based on the perspective of the government or financial institutions, and there is a lack of research from the perspective of ESCO enterprises and the entire project operation process. From the point of view of research depth, risk identification and evaluation are the areas that most scholars focus on when researching the risks of ESR projects for existing buildings, while there is a lack of in-depth research on the operational aspects of risk management. From the point of view of research methods, risk evaluation mainly relies on qualitative indicators, and it is difficult to effectively convert them to quantitative values; in terms of indicator measurement, it is common to regard the early warning level interval as a fixed value, ignoring the impact of uncertainty in the indicator measurement value and ambiguity of the level boundaries, which leads to a distortion of the results. Given that there are a large number of practical applications for the CMET, this study starts from the ESCO perspective and combines the essential characteristics of existing building ESR projects. The ESCO risk early warning indicator system explores and constructs the ESCO risk early warning model based on the CMET. It provides theoretical support and a basis for decision making for ESCO risk early warnings and maximizes the comprehensive benefits of green retrofit projects for existing buildings.
The rest of this paper is thus organized as follows.
Section 2 presents the comprehensive literature review on the risk management of green and ESR projects for existing buildings;
Section 3 constructs the ESCO risk early warning indicator system for ESR projects for existing buildings;
Section 4 constructs the ESCO risk early warning model for ESR projects for existing buildings based on the CMET;
Section 5 details an empirical analysis of the ESCO risk early warning of an existing residential building as part of an ESR project in Tianjin; and
Section 6 discusses the risk early warning level and the potential causes of risk generation, followed by the conclusion in
Section 7.
2. Literature Review
Though green retrofits and energy-saving retrofits are similar in terms of retrofit mode, green retrofits focus on environmental aspects while energy-saving retrofits focus on energy-related aspects. Therefore, both green retrofits and energy-saving retrofits should be considered. The research on the risk management of green and ESRs of existing buildings mainly focuses on risk identification, risk threshold, risk early warning monitoring, and so on.
2.1. Risk Identification
Accurate risk identification is the first step in implementing risk management for green and ESR projects in existing buildings. Ranawaka and Mallawaarachchi [
8] assessed the risk factors of a green retrofit project in Sri Lanka, established a risk response framework and identified the key risk factors: costs, inflation, energy-saving uncertainty, warranty risks, scheduling, and design changes. Javed et al. [
9] developed a specialized PRM (project risk management) framework that can identify and analyze the risks that directly affect the profit of green building projects, which are “lack of budget”, “lack of time”, and “uneconomical”, and increase the probability of project success by minimizing unexpected accidents. Through a literature review, Lee et al. [
10] identified the risk factors in the design stage of green retrofit projects for commercial buildings in Malaysia. They proposed that technical/quality risks and financial risks are the most critical risk groups in the design stage. Jia et al. [
11] explored the principal risks of residential retrofit projects in high-tech zones from the transaction cost perspective. By combining the risk factors with the retrofit subject and the project’s life cycle, it was found that retrofit awareness, cooperation performance, construction management, and safety management were the key risk factors, and reducing information costs was an essential strategy for implementing effective risk management. Huo et al. [
12] identified 30 risk factors in the life cycle of green retrofit projects for existing public buildings. They proposed an FMEA (failure mode and effect analysis) model based on the Choquet integral to analyze and rank the risk factors, aiming to identify the key risk factors.
2.2. Risk Threshold
The risk threshold is the standard for risk management in green and ESR projects for existing buildings that is used to assess the allowable range of project risks. Wang et al. [
13], based on the structural complexity perspective, pointed out that the degree of project risk is positively correlated with the risk threshold during the evolution process. Pan and Luo [
14] constructed a risk early warning indicator system, utilized a three-dimensional risk assessment model for risk evaluation, and scientifically delimited risk thresholds based on the optimal segmentation method. Malhotra and Sharma [
15] obtained sensitive and earned value information via the SRA (Schedule Risk Analysis) based on dynamic characteristics to set risk threshold criteria. Li et al. [
16] developed a self-powered vibration sensor system that can continuously monitor the structural health of buildings in real time. The vibration characteristics are detected by using a dual-mode friction electric nanogenerator. When the amplitude exceeds the risk threshold, the AC power is immediately converted to DC power, and the alarm system is triggered simultaneously. Gao and Wu [
17] constructed an engineering project risk evolution evaluation model based on system dynamics and revealed the “threshold effect” of risk evolution through a simulation. Wang et al. [
18] summarized the methods for determining early warning levels and thresholds, including the relevant standard approach, critical value approach, comprehensive judgment approach, etc., and proposed the applicable conditions of each method. Jiang et al. [
19] suggested that enhancing risk perception can improve the risk threshold and thus effectively control the risk trend by analyzing the inhibitory factors of risk evolution.
2.3. Risk Early Warning Monitoring
Risk early warning can monitor potential risks in the green and ESR projects of existing buildings in a timely manner. Baudrit et al. [
20] proposed an optimization strategy based on HPRMS (hierarchical probabilistic relational models) technology to monitor risks at different detail levels. Xie et al. [
21] proposed a risk early warning system based on the Internet of Things (IoT), which can dynamically predict, detect, monitor, and manage the risks of library retrofit projects with less data. Pan and Zhang [
22] intelligently predicted building energy consumption based on a model of a machine learning algorithm—CatBoost, differentiated energy consumption usage through outlier detection, realized the risk early warning function, and scientifically guided subjects to make ESR decisions. Li et al. [
23] constructed a comprehensive risk assessment model from the three dimensions of the building itself, the natural environment, and socioeconomic risk. They realized risk early warnings according to the comprehensive risk level. Liu [
24] combines conventional, unique, and random monitoring to identify risk information and efficiently guarantee risk early warning monitoring.
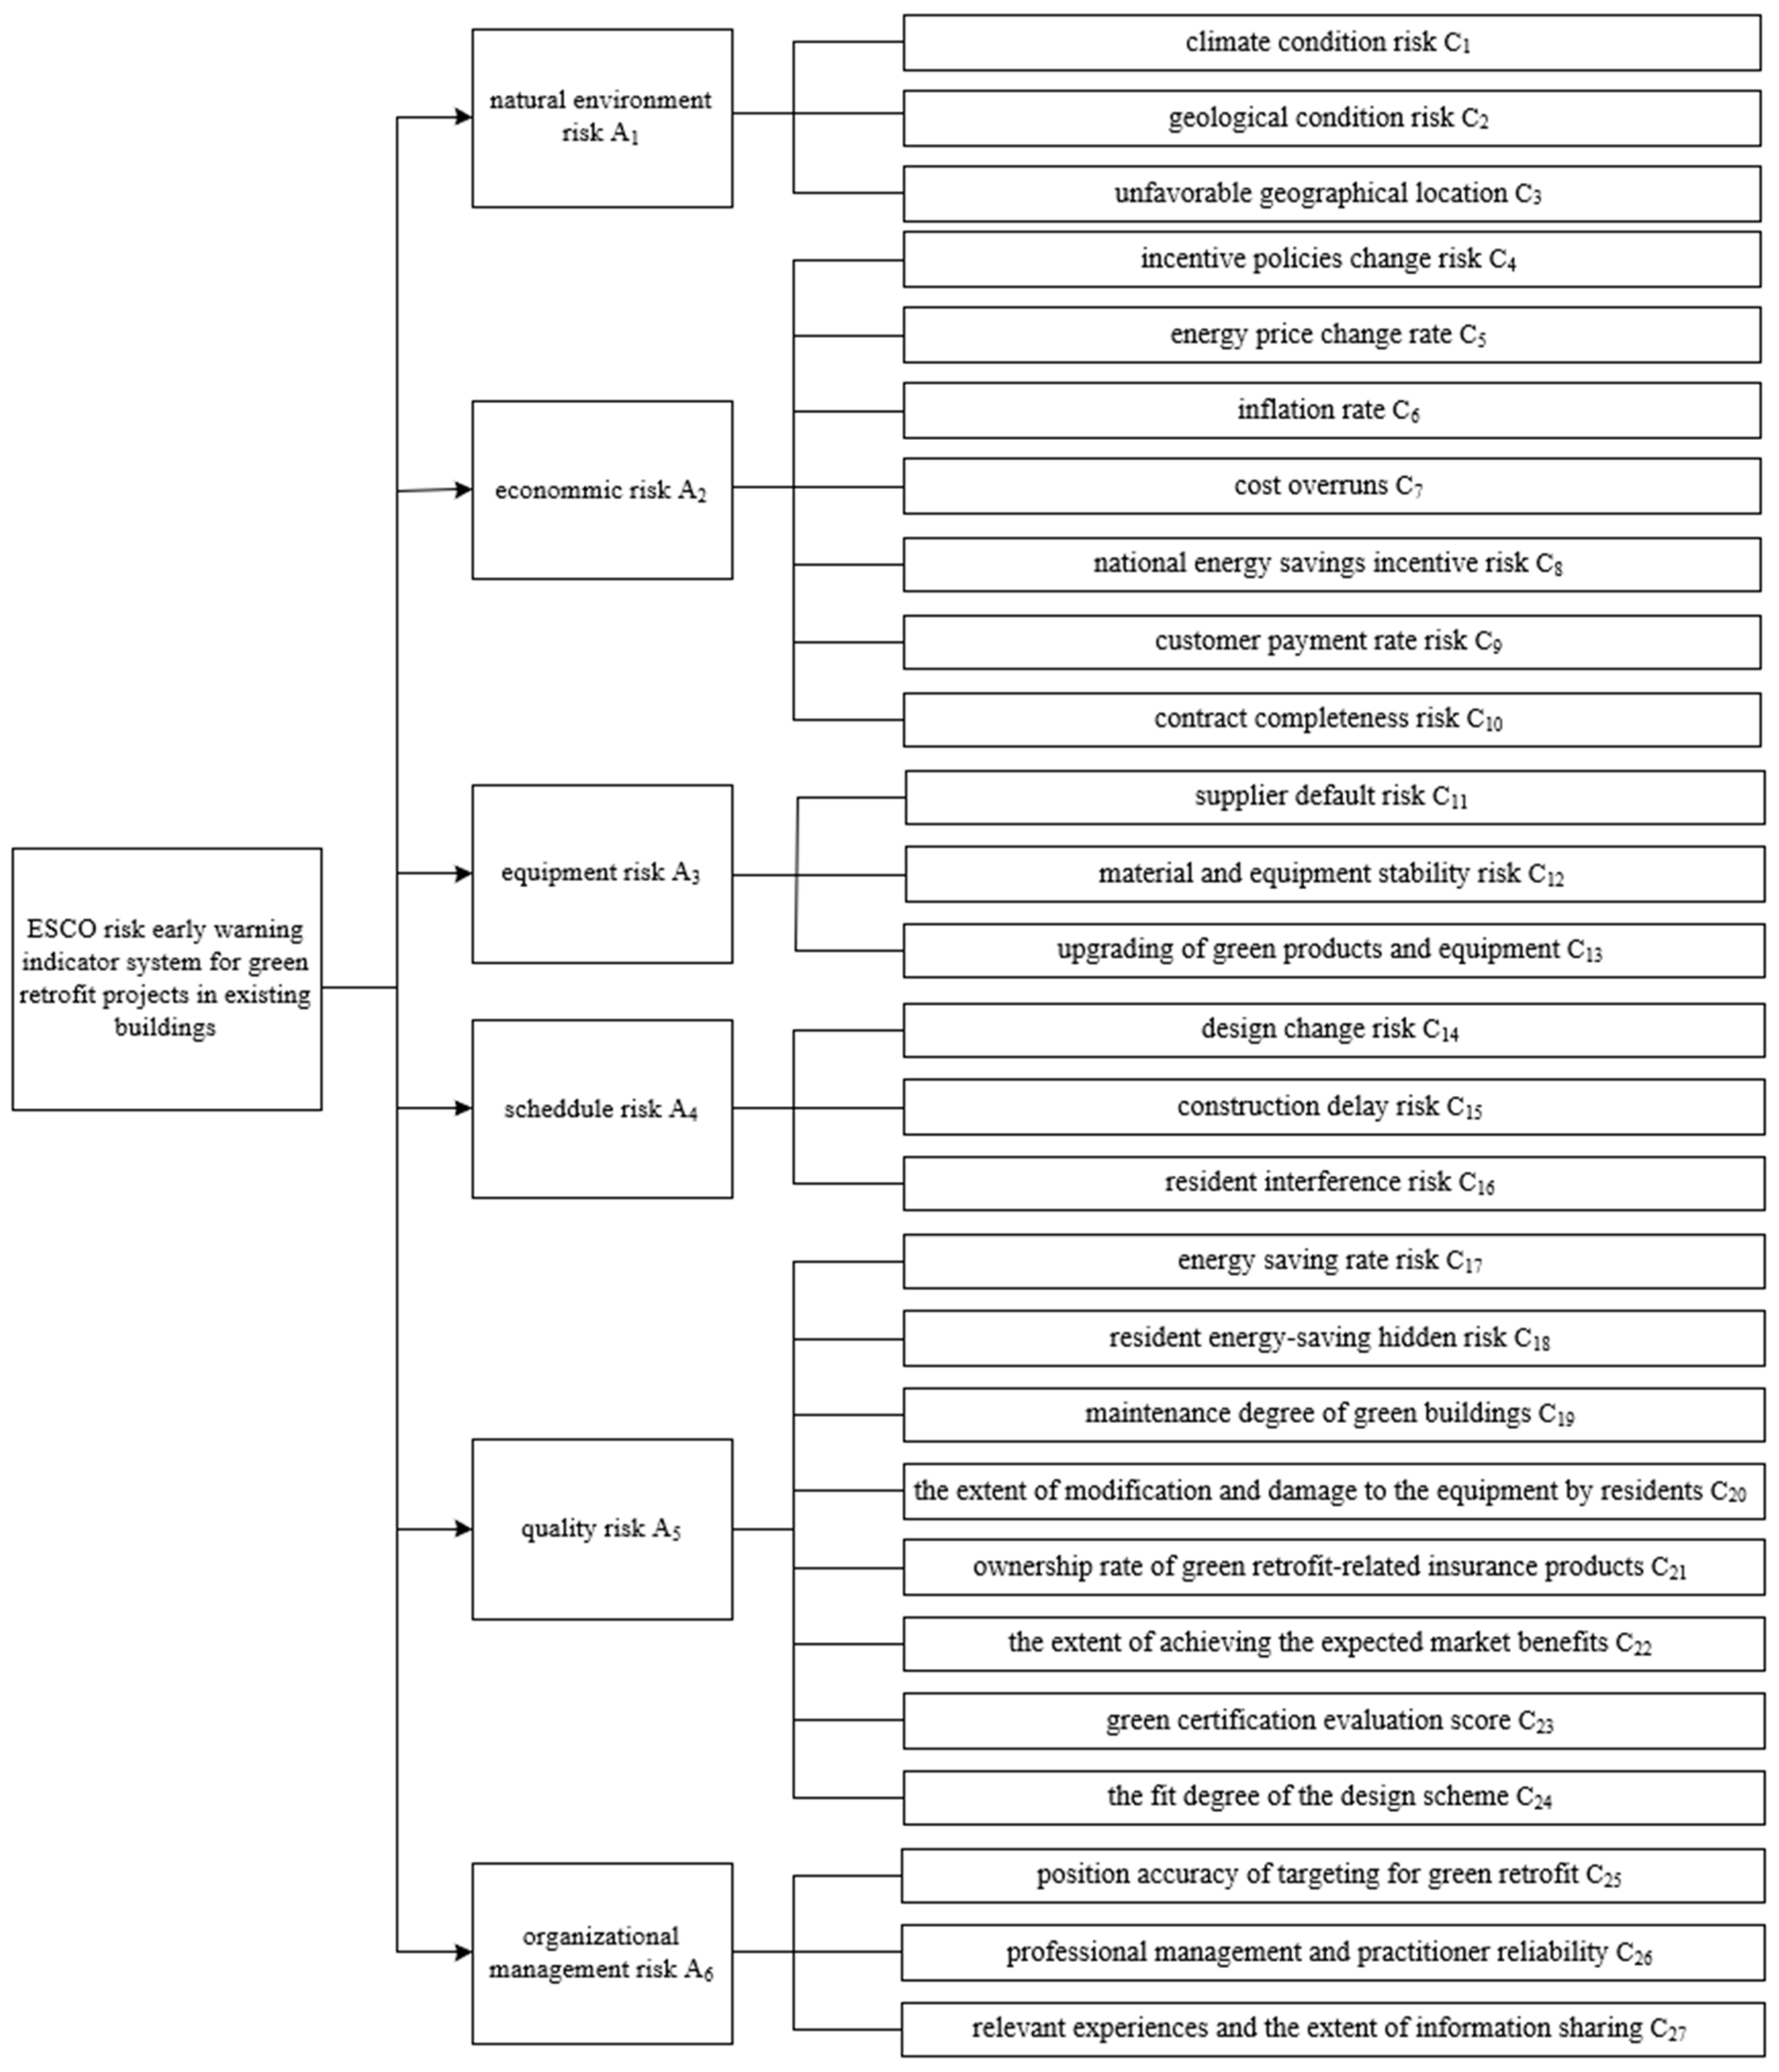
3. ESCO Risk Early Warning Indicator System for ESR Projects of Existing Buildings
ESCO risk early warning is the basis for the orderly operation of ESR projects for existing buildings under the EPC mode, and a scientific and reasonable risk early warning indicator system is the key to the accurate and effective implementation of ESCO risk early warnings for ESR projects for existing buildings. The construction of the ESCO risk early warning indicator system should take into account the complexity and specificity of the existing building ESR project, which has many comprehensive objectives, many types of content, and overlaps between the retrofit and the building’s use, maintenance, and renewal. At the same time, it should follow the principles of combining qualitative and quantitative information, systematic comprehensiveness, scientific practicability, and sensitivity. Based on the premise of the research results on the risk identification of ESR projects for existing buildings [
25], this study carries out a systematic frequency analysis of the indicators and then combines the opinions of experts to construct a system of ESCO risk early warning indicators for ESR projects for existing buildings in terms of six aspects: natural environment, economy, equipment, schedule, quality, and organizational management [
26,
27], as shown in
Figure 1.
4. ESCO Risk Early Warning Model for ESR Projects in Existing Buildings
4.1. G1–Entropy Weight Method Based on the CMET
4.1.1. Subjective Empowerment Method—G1 Method
The G1 method is a subjective empowerment method that represents the importance of indicators through subjective ranking. It originates from an improvement in the previous hierarchical analysis method, which not only can effectively reflect the decision maker’s preference but also omits the consistency test so that the calculation process is simplified [
28]. The specific steps are as follows:
Experts rank the importance of the ESCO risk warning indicator set based on their own experience and evaluation criteria. If the importance of the indicator is greater than , it is recorded as > . If indicators …, form the order of … > according to the evaluation criteria, then the evaluation indicators …, determine the order relationship “>”.
The expert selects the most important of the indicators in the indicator set , labeled , and then selects the most important risk warning indicators among the remaining indicators in turn until is selected.
The ratio of the degree of importance of experts to the early warning indicators
and
can be expressed as
, whose value is assigned as shown in
Table 1, and rational judgment is made as follows:
where
and
indicate the weight coefficients of early warning indicators
and
, respectively.
If
satisfies
,
, then the weight of the
th indicator is as follows:
4.1.2. Objective Empowerment Method—Entropy Weight Method
The entropy weight method focuses on objective data and calculates the corresponding index weights through a mathematical formula [
29], which can avoid the interference of human factors with objectivity and accuracy. The specific steps are as follows:
where
is the standard deviation,
is the mean, and
is the value obtained for the
th indicator after standardization in the
th program.
In the formula, represents the proportion of the indicator value of the th item in the th item, and is the indicator’s value.
4.1.3. Linear Combination Weighting Method
To ensure the reliability and robustness of the results of the integrated weight calculation of ESCO risk early warning indicators, the integrated calculation of subjective and objective weights by using the linear combination weighting method and the G1–entropy weight method can take into account subjective thoughts and objective facts, as well as overcome the shortcomings of the traditional average distribution. The combination weights of the indicators were found to be as follows:
In the formula, and are linear combination coefficients.
The weights determined by the linear combination weighting method are balanced between the degree of difference between the subjective and objective weights and the degree of difference between their weight adjustment coefficients to achieve a more reasonable weighting of the two for the next calculation step.
The linear combination coefficients and of subjective and objective weights are calculated using Formulas (11) to (13), which are then substituted back into Formula (10) to obtain the combined weight values of ESCO risk early warning indicators.
4.1.4. Cloud Matter Element Model
Assume that
is a quantitative domain expressed in exact numerical values and
is a qualitative concept of
. If the quantitative value
and
is a one-time random realization of the qualitative concept
, the certainty of
to
is
when the following relation is satisfied:
The distribution of
on the domain
is called a cloud, and each
is called a cloud droplet [
30].
The matter element theory [
31] is an ordered triad consisting of matter
as an object,
as a feature, and
as a measure of
concerning
, that is, the basic element describing the matter. Matter that has more than one feature is represented by an
-dimensional matter element as follows:
In the formula, is a multidimensional matter element, and is a sub-matter element of , where .
In the matter element model, the quantity value
of the matter is fixed, but for some indicators in the ESCO risk early warning system, the quantity value is often accompanied by randomness and ambiguity, which makes the final result not precise enough. Given the unique advantage of double contingency reasoning for cloud models [
32], normal cloud models are introduced into the matter element theory to compensate for this deficiency. The numerical features
will replace the
value, and the specific expression is as follows:
Treating the interval value as a dual-constraint space
for the ESCO risk early warning level boundaries of ESR projects for existing buildings, the following is obtained by comprehensively considering the randomness and ambiguity of the interval value of the level boundaries and moderately expanding them [
33] and then calculating the ESCO risk early warning level standard normal cloud matter element model parameters
by the conversion relationship between the interval boundary value and the cloud model:
In the formula, is a constant that can be adjusted by the degree of ambiguity and experience in the classification of ESCO risk early warning level.
The relational degree between the values of the ESCO risk early warning indicators to be evaluated and each level is calculated as follows:
Compute the standard cloud ;
Generate a normal random number with as expectation and as the standard deviation;
Calculate the relational degree between cloud droplet
and its corresponding level cloud using the degree of membership function;
Repeat the above steps times and take the average of the results as the relational degree.
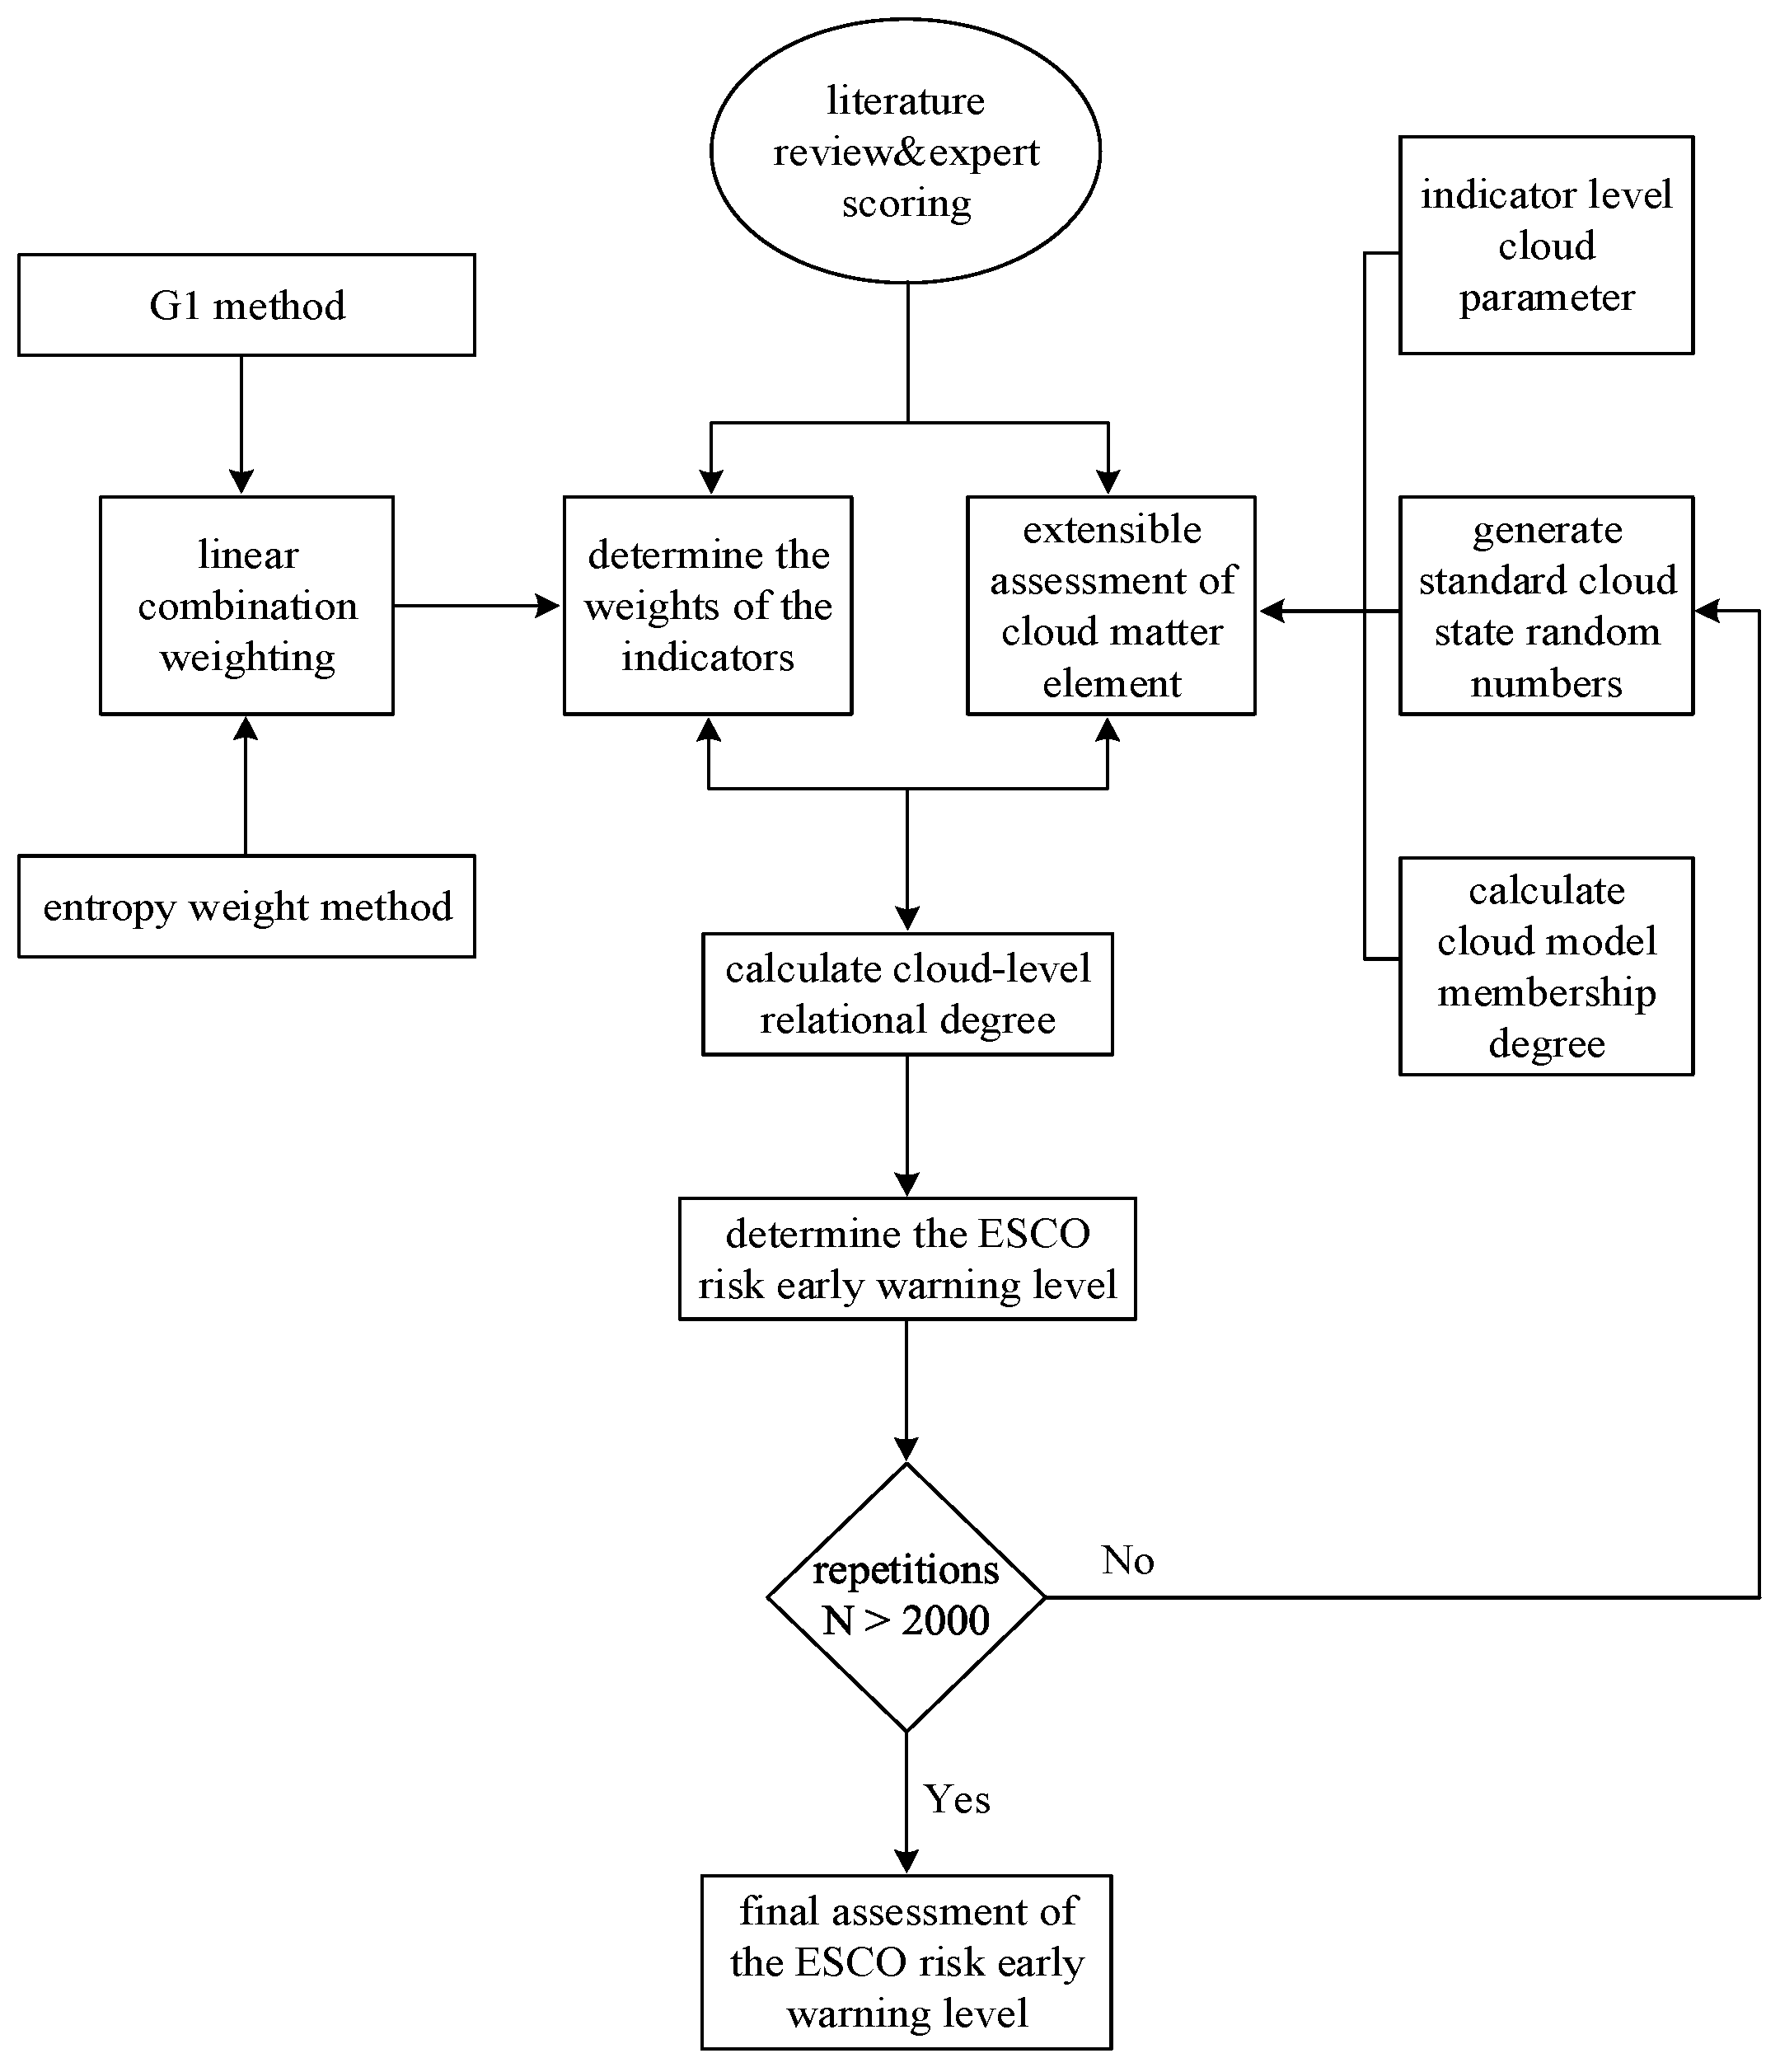
4.2. ESCO Risk Early Warning Model Based on Cloud Matter Element Model
Based on the ESCO risk early warning system for ESR projects of existing buildings, the ESCO risk early warning model based on the cloud matter element model is structured by combining it with the CMET above. The specific workflow is shown in
Figure 2.
4.2.1. Determine the Boundaries of the ESCO Risk Early Warning Level
The determination of the boundaries of the ESCO risk early warning level is a key step to ensure the effectiveness of its implementation of risk early warning. Risk early warning level boundaries that are set reasonably or not will directly affect the ESCO early warning function’s timeliness and sensitivity. Unreasonable early warning level boundaries could lead to the failure of the risk measurement benchmarks, in which the target deviation will increase the probability of misreporting or failure to report, which will affect the project’s comprehensive performance. Therefore, the reasonable setting of ESCO risk early warning level boundaries is of great significance.
The prerequisite for clarifying the boundary of its risk early warning level is determining the boundary of the early warning level for each risk early warning indicator. Based on existing research results and industry standards and norms, this information is combined with the basic characteristics of ESR projects for existing buildings by experts or decision makers, drawing on their ability to make analytical judgments and their other implicit knowledge. At the same time, this should be done according to the degree of development of China’s market for ESRs of existing buildings and take into account the risk preference and risk perception ability of ESCO enterprises. From a holistic perspective and in combination with the internal and external environment of the project, the level boundaries of ESCO risk early warning indicators are grasped, and four risk early warning levels are defined as follows: I (low), II (medium), III (high), and IV (very high).
Due to the inability to select suitable sample data to measure its early warning level boundaries, an abstract evaluation value was used as a benchmark. For ESCO risk early warning indicators, the expert percentage scoring method is used, and experts divide the risk level boundaries of early warning indicators based on project experience. The finalized ESCO risk early warning level classification for ESR projects in existing buildings is shown in
Table 2.
4.2.2. Constructing ESCO Risk Early Warning Evaluation Through Matter Element Model
According to Formulas (17) to (19) and the boundary of ESCO risk early warning indicators, the levels of cloud matter element model parameters of ESCO risk early warning indicators are obtained, as shown in
Table 3.
4.2.3. Determining the Weights of ESCO Risk Early Warning Indicators
A single subjective or objective weighting method is a commonly used method to determine the weights of indicators, in which the subjective weighting method often comes from the subjective experience of the evaluator and cannot reflect the data; on the other hand, the objective weighting method is used to weight the indicators by obtaining the data information and carrying out a rigorous mathematical deduction, but it cannot reflect the decision maker’s subjective willingness. Therefore, using subjective or objective weighting methods alone will result in the inability to obtain the optimal combination of indicator weights, which has certain limitations [
34]. Based on this, the G1 method and entropy weight method are combined to assign weights to the ESCO risk warning indicators, and linear weighting is used to specify the final comprehensive weights of each indicator.
4.2.4. Calculate the Relational Degree of ESCO Risk Early Warning Indicators
According to the parameters of the cloud matter element model in
Table 3, calculate the relational degree
between the measured value of the early warning indicator
and the normal cloud model of the early warning level standard
using Formula (20). To reduce the randomness in the calculation process of relational degree, Monte Carlo simulation is used
times, and the mean of
relational degrees
after
calculations is taken as the relational degree of the indicator.
In the formula, , is the number of early warning indicators, , is the number of early warning levels, and .
This forms a comprehensive evaluation matrix, and then the matrix is normalized for each row to obtain the standardized indicator relational degree matrix
.
4.2.5. Determining the ESCO Risk Early Warning Level
By using the calculated relational degree of the early warning levels concerning the indicator layer, combined with the indicator weights and weighting them, the relational degree of each early warning level corresponding to the criterion layer can be obtained:
In the formula,
is the relational degree of the
th risk factor to the
th early warning level in the one-level indicator layer;
is the relational degree of the indicator
to the
th early warning level in the two-level indicator layer; and
is the comprehensive weight of its corresponding indicator. According to
, the relational degree of each early warning level corresponding to the target layer can be further calculated as follows:
According to the maximum membership degree principle, determine the final risk early warning level for the ESCO of the existing building undergoing the ESR project.
5. Empirical Analysis
5.1. Overview of an ESR Project for an Existing Residential Building in Tianjin
Taking a residential quarter in Tianjin as an example, there are a total of 18 buildings, all of which are 4- to 6-storey brick concrete structures with a total building area of 186,000 square meters. They were completed in 1995. This project follows building energy-saving designs, such as the “Regulations of Tianjin Municipality on Buildings Energy” and the “Residential Building Energy Efficiency Design Standards”, and adopts the EPC model, which means that ESCOs sign contracts with owners to provide a series of ESR services and profit from the owners’ energy-saving benefits.
5.2. Determining ESCO Risk Early Warning Indicator Weights
5.2.1. Determination of G1 Method Indicator Weights
The ESCO risk early warning indicator system consists of 6 one-level indicators and 27 two-level indicators. Experts in the field of ESRs of existing buildings are invited to form a weighting group, and the ESCO risk early warning one-level indicator layer is arranged in the following ordering relation:
One-level indicator layer can be obtained:
,
,
,
, and
. The weight vector of the first level indicators can be calculated from Formulas (2) and (3) as
. Similarly, the weights of the two-level indicators are shown in
Table 4.
5.2.2. Determination of Indicator Weights for the Entropy Weight Method
Considering the ESCO risk early warning level as four items to be evaluated, structure the initial data matrix of risk early warning indicators and then calculate the entropy value
of the
th indicator according to Formula (8). The calculation result is as follows:
Then, the entropy weight of the
th indicator is calculated by Formula (9), and the result is as follows:
The sum of the weights of all of the two-level indicators included in the first level indicator layer
is the weight corresponding to
. By summarizing this, we can obtain the weight of the first level indicator layer
relative to the ESCO risk:
5.2.3. Determination of Comprehensive Indicator Weights
According to Formulas (11) to (13), the adjustment coefficients
and
of the weights of the risk early warning indicators were calculated to be 0.78 and 0.22, respectively. The specific indicator values of the ESCO risk factors of the project were determined by taking the average of expert scores. The results are shown in
Table 5.
5.3. Results of Relational Degree Calculation
According to the relational degree calculation rules, combined with the parameters of the hierarchical cloud matter element model in
Table 3, MATLAB R2024b software was used to calculate the relational degree of the ESCO risk early warning indicators in this real case, as shown in
Table 6.
5.4. Determination of the Risk Early Warning Level
According to the principle of maximum relational degree [
35], the comprehensive relational degree and ESCO risk early warning level can be obtained from
Table 6 and Formulas (23) to (24), as shown in
Table 7.
6. Discussions
According to
Table 7, the ESCO risk early warning level of the project is at level III with the highest relational degree, corresponding to a higher degree of risk, and the relational degrees of level III and level II are close to each other; that is, the ESCO risk early warning level has a decreasing trend. Specific to the relational degree of the one-level indicator layer, the economic risk
, schedule risk
, and quality risk
correspond to the risk early warning status of level III; the natural environment risk
and equipment risk
correspond to the risk early warning status of level II; and the organizational management risk
corresponds to the risk early warning status of level I, with a relatively lower degree of risk. Therefore, ESCOs should focus on economic risks
, schedule risks
, and quality risks
in the project management process to avoid greater losses caused by these risks.
Analyzing the relational degree of the two-level indicator layer in
Table 6, it can be seen that the resident interference risk
and resident energy-saving hidden risk
have level IV risk warning status, which indicates that people’s attitudes and energy-saving benefits have a significant impact on ESCOs. Therefore, these need to be paid more attention in the risk management process. In addition, risk indicators such as unfavorable geographical location
, cost overruns
, contract completeness risk
, material and equipment stability risk
, the extent of modification and damage to the equipment by residents
, ownership rate of ESR-related insurance products
, the extent of achieving the expected market benefits
, and relevant experiences and the extent of information sharing
have Level III risk early warning status, which means that the above risk factors will also have a significant adverse impact on the ESCOs of existing buildings undergoing ESR projects.
According to visits to the site and our data analysis, this project faces more significant pressure from the public. Regarding the natural environment level, it is located in an unfavorable geographical location in the downtown area, severely compressing the construction space, resulting in a narrow construction environment and creating considerable obstacles to machine entry. In terms of the construction progress level, maintaining the original structure while also considering updating the facilities can easily lead to reworking and cost overruns. In terms of the contractual relationship level, due to the dilemma of the ESCO bearing most of the risks under the EPC model, it faces risks in terms of contract completeness [
36].
7. Conclusions
Existing building ESR projects have the characteristics of many participating subjects, long operating cycles, and complex and variable risk factors. To ensure the orderly operation of existing building ESR projects under the EPC model, eliminating the potential risk factors and establishing a set of scientific and effective ESCO risk early warning systems for existing building ESR projects are significant. Based on the characteristics of ESR projects in existing buildings, this study designs a scientific, systematic, and complete ESCO risk early warning indicator system, integrates cloud model and matter element theory, constructs an ESCO risk early warning model for ESR projects in existing buildings, and determines the weights of ESCO risk early warning indicators by using subjective and objective comprehensive weighting methods, which compensate for the limitations of a single weighting method and enhances the credibility of the ESCO risk early warning results. By comparing the actual project and the risk early warning model constructed in this paper, it is concluded that the model is feasible, reasonable, and efficient, and it can provide a reference for other similar risk early warning studies of ESR projects for existing buildings. During the implementation of ESR projects for existing buildings, ESCOs can respond quickly according to the signals relayed by the risk early warning model, proactively manage ESCO risks, enhance the comprehensive benefits of the project, and assist in the successful development of ESRs for existing buildings.
According to the risk early warning model results, the ESCO risk early warning level of the energy-saving retrofit project has the highest correlation with Level III. Economic risk (A2), schedule risk (A4), and quality risk (A5) correspond to Level III risk early warning status. ESCOs should avoid losses caused by these factors in the project management process. Residential interference risk (C16) and residential energy-saving hidden risk (C18) have Level IV risk early warning status, indicating that public attitudes and energy-saving benefits significantly impact ESCOs. Therefore, these must be paid attention to in the risk management process. Thus, the following practical suggestions are proposed to ensure the smooth and stable implementation of energy-saving retrofit projects for existing buildings.
- (1)
Collaboration of resource elements to enhance risk early warning efficiency
The core goal of the ESCO risk early warning strategy for existing building energy-saving retrofit projects is to enhance the effectiveness of risk early warnings. The prerequisite for achieving risk early warning efficiency is fully utilizing internal resource elements to achieve an orderly flow and an efficient aggregation of resource elements. The key to the orderly flow and efficient aggregation of resource elements lies in the synergistic cooperation among them. Synergistic cooperation is not simply human–machine communication or a material combination but an organic combination in spatial resource allocation with a complex interaction between the environment, people, and things.
Firstly, in terms of subject attributes, the implementation subjects of risk early warning strategies include ESCO enterprises in different development stages, different departments established by ESCO enterprises, and other subject categories. It has strong mobility and requires strategically arranging resource elements by categories and spatial hierarchies according to different subject attributes. Secondly, in terms of early warning levels, it includes the correlation between different risk early warning levels and risk early warning response levels and the combination of varying risk early warning measures and risk early warning levels. Therefore, it is essential to focus on the systematic combination of the two regarding the early warning level to form an optimal solution for risk early warnings. Finally, in terms of project layout, it is necessary to optimize the overall layout of the project and crack the “isolated island style” resource distribution; investigate the distribution characteristics of different stages of geographical locations and risk demand situations; and clarify the distribution scope of risk early warning implementation subjects to construct the circulation paths.
- (2)
Improving standards and specifications to provide risk early warning guarantee
Scientifically sound standards and specifications are the institutional guarantee and objective condition for the orderly implementation of risk early warnings by ESCOs for existing building energy-saving retrofit projects. For ESCO risk early warnings for existing building energy-saving retrofit projects, it is necessary to take the central level as the main body and strengthen the top-level design. In addition, national or industry standards should be provided and unify the risk early warning level standards. It is also necessary to clarify the judgment basis of risk threshold benchmarks and risk threshold benchmarks corresponding to risk early warning levels and risk early warning response levels to ensure consistency in existing building energy-saving retrofit projects’ risk early warning standard systems. Secondly, based on the top-level design content and differentiated conditions such as the local development level, local governments should independently supplement standards to provide appropriate risk early warning response standards for different regions’ objective conditions and development demands. Thus, the risk threshold benchmarks can be adapted to the realistic needs of the development of energy-saving retrofits of existing buildings, thereby ensuring that the risk early warning process has evidence to rely on and promoting the orderly development of risk early warnings for energy-saving retrofits of existing buildings.
At the same time, as the risk information of existing building energy-saving retrofit projects involves the privacy of different subjects, it is necessary to provide information security guarantees for information exchanges, response feedback, and other processes during risk early warnings by formulating information transmission norms and technical standards in the risk early warning process, such as encryption, backing up data, and authorizing the verification of risk early warning information. This ensures the security of information transmissions and address common concerns about information security and privacy protection in risk early warnings.
Author Contributions
Conceptualization, H.G. and S.J.; methodology, H.G. and M.W.; software, S.J. and M.W.; validation, S.J., M.W. and Y.Z.; formal analysis, S.J.; data curation, M.W.; writing—original draft preparation, H.G. and S.J.; writing—review and editing, M.W. and Y.Z.; visualization, S.J.; supervision, H.G.; project administration, H.G.; funding acquisition, H.G. All authors have read and agreed to the published version of the manuscript.
Funding
This research was funded by National Natural Science Foundation of China, 71872122 and Humanities and Social Science Fund of Ministry of Education of China, 20JHQ095.
Data Availability Statement
The original contributions presented in the study are included in the article, further inquiries can be directed to the corresponding author.
Conflicts of Interest
The authors declare no conflict of interest.
References
- Tsering, D. Global Status Report for Buildings and Construction: Beyond Foundations: Mainstreaming Sustainable Solutions to Cut Emissions from the Buildings Sector; United Nations Environment Programme: Nairobi, Kenya, 2024. [Google Scholar] [CrossRef]
- Jia, L.; Qian, Q.K.; Meijer, F.; Visscher, H. Stakeholders’ Risk Perception: A Perspective for Proactive Risk Management in Residential Building Energy Retrofits in China. Sustainability 2020, 12, 2832. [Google Scholar] [CrossRef]
- Ali, B.; Collins, A.; Sarfo, M. Assessment of systematic risk management practices on building construction projects in Ghana. Int. J. Constr. Manag. 2022, 22, 3128–3136. [Google Scholar]
- Andaloro, A.; Salvalai, G.; Fregonese, G.; Tso, L.; Paoletti, G. De-Risking the Energy Efficient Renovation of Commercial Office Buildings through Technical-Financial Risk Assessment. Sustainability 2022, 14, 1011. [Google Scholar] [CrossRef]
- Lin, C.L.; Fan, C.L.; Chen, B.K. Hybrid Analytic Hierarchy Process–Artificial Neural Network Model for Predicting the Major Risks and Quality of Taiwanese Construction Projects. Appl. Sci. 2022, 12, 7790. [Google Scholar] [CrossRef]
- Alfatihanti, A.; Latief, Y.; Kussumardianadewi, B. Risk analysis and investment feasibility for green retrofits in high-rise office buildings using the life cycle cost method. Manag. Sci. Lett. 2024, 15, 11–22. [Google Scholar] [CrossRef]
- Huo, X.; Xue, H.; Xu, X.; Hao, T.; Jiao, L. A risk sharing model for old community renewal project based on bargaining game model. Sci. Rep. 2024, 14, 24316. [Google Scholar] [CrossRef]
- Ranawaka, I.; Mallawaarachchi, H. A risk-responsive framework for green retrofit projects in Sri Lanka. Built Environ. Proj. Asset Manag. 2018, 8, 477–490. [Google Scholar] [CrossRef]
- Javed, N.; Thaheem, M.J.; Bakhtawar, B.; Nasir, A.R.; Khan, K.I.A.; Gabriel, H.F. Managing risk in green building projects: Toward a dedicated framework. Smart Sustain. Built Environ. 2019, 9, 156–173. [Google Scholar] [CrossRef]
- Lee, M.S.N.; Masrom, M.A.N.; Mohamed, S.; Goh, K.C.; Sarpin, N.; Manap, N. Examining risk as guideline in design stage for green retrofits projects: A review. IOP Conf. Ser. Mater. Sci. Eng. 2020, 713, 012043. [Google Scholar] [CrossRef]
- Jia, L.; Qian, Q.K.; Meijer, F.; Visscher, H. Exploring key risks of energy retrofit of residential buildings in China with transaction cost considerations. J. Clean. Prod. 2021, 293, 126099. [Google Scholar] [CrossRef]
- Huo, X.; Hao, T.; Jiao, L. Critical risk factors of public building green retrofit projects-an empirical study in Chongqing, China. J. Asian Archit. Build. Eng. 2023, 1–13. [Google Scholar] [CrossRef]
- Jingmei, W.; Peng, G.; Jing, Z. Analysis on Portfolio Interdependency Risk of R&D Project Considering Structure Complexity. J. Technol. Econ. 2018, 37, 116–123. [Google Scholar]
- Dan, P.; Fan, L. Defining of the early-warning safety risk threshold in the civil aviation airport apron. J. Saf. Environ. 2018, 18, 853–859. [Google Scholar] [CrossRef]
- Malhotra, R.; Sharma, A. Estimating the threshold of software metrics for web applications. Int. J. Syst. Assur. Eng. Manag. 2019, 10, 110–125. [Google Scholar] [CrossRef]
- Li, S.; Liu, D.; Zhao, Z.; Zhou, L.; Yin, X.; Li, X.; Gao, Y.; Zhang, C.; Zhang, Q.; Wang, J.; et al. A Fully Self-Powered Vibration Monitoring System Driven by Dual-Mode Triboelectric Nanogenerators. ACS Nano 2020, 14, 2475–2482. [Google Scholar] [CrossRef]
- Gao, J.; Wu, X. Evaluation of risk evolution of engineering Project based on system dynamics model. Stat. Decis. 2020, 36, 185–188. [Google Scholar] [CrossRef]
- Wang, J.; Pu, S.; Hu, Y. Review on the determination methods for early warning grade and threshold of groundwater pollution risk. Hydrogeol. Eng. Geol. 2020, 47, 43–50. [Google Scholar] [CrossRef]
- Jiang, X.; Li, X.; Wu, J.; Li, W.; Luo, D.; Fei, F. SD model of social stability risk evolution for sensitive water conservancy projects. China Saf. Sci. J. 2021, 31, 18–26. [Google Scholar] [CrossRef]
- Baudrit, C.; Taillandier, F.; Tran, T.T.P.; Breysse, D. Uncertainty Processing and Risk Monitoring in Construction Projects Using Hierarchical Probabilistic Relational Models. Comput. Aided Civ. Infrastruct. Eng. 2019, 34, 97–115. [Google Scholar] [CrossRef]
- Xie, Y.; Liu, J.; Zhu, S.; Chong, D.; Shi, H.; Chen, Y. An IoT-based risk warning system for smart libraries. Libr. Hi Tech 2019, 37, 918–932. [Google Scholar] [CrossRef]
- Pan, Y.; Zhang, L. Data-driven estimation of building energy consumption with multi-source heterogeneous data. Appl. Energy 2020, 268, 114965. [Google Scholar] [CrossRef]
- Li, M.; Huang, L.; Dang, A. Building Comprehensive Risk Assessment and Optimization Strategy Based on Multi-source Data: A Case Study of Cangshan District, Fuzhou. Shanghai Urban Plan. Rev. 2022, 3, 38–45. [Google Scholar]
- Fei, L. Research on the risk management of overseas resource and environmental engineering projects. China Constr. 2021, 2, 72–73. [Google Scholar]
- Wang, L.; Peng, J.; Wang, J. A multi-criteria decision-making framework for risk ranking of energy performance contracting project under picture fuzzy environment. J. Clean. Prod. 2018, 191, 105–118. [Google Scholar] [CrossRef]
- Öncü, E.; Onaygil, S.; Cin, R. Risk assessment of energy performance contracting in Türkiye utilizing best-worst method. Energy Effic. 2024, 17, 74. [Google Scholar] [CrossRef]
- Bertoldi, P.; Boza-Kiss, B. Analysis of barriers and drivers for the development of the ESCO markets in Europe. Energy Policy 2017, 107, 345–355. [Google Scholar] [CrossRef]
- Zhao, H.; Qu, W.; Qiu, W.; Wang, Y. Study on the selection of PPP operation mode in sponge city based on combined weights method and extension matter element model. Sci. Technol. Manag. Res. 2019, 39, 200–206. [Google Scholar]
- Xiang, Y.; Yang, Y.; Lu, Q. Measurement and spatial-temporal evolution analysis of provincial high-quality development of agricultural economy in China. Resour. Dev. Mark. 2022, 38, 257–264+327. [Google Scholar]
- Li, D. Membership clouds and membership cloud generators. J. Comput. Res. Dev. 1995, 32, 15–20. [Google Scholar]
- Yang, C.; Cai, W. Topology; Science Press: Beijing, China, 2014. [Google Scholar]
- Qiao, Z.; Huang, L.; Kuang, C.; Lv, Y. Study on maritime environment risk pre-warning model of drilling platform based on cloud matter-element theory. Chem. Eng. Oil Gas 2015, 44, 130–134. [Google Scholar]
- Li, N.; Sun, H. Environmental maturity evaluation of green technology innovation in regional enterprises based on cloud model. Sci. Technol. Prog. Policy 2021, 38, 50–57. [Google Scholar]
- Wang, W.; Cai, W.; Li, R. Research on the influencing factors of enterprise organizational innovation in the era of big data: Based on combination weighting method and ISM analysis. Mod. Manag. 2020, 40, 32–35. [Google Scholar]
- Li, C.; Guo, S.; Ji, L.; Xing, X. Audit quality evaluation of PPP project based on OWA operator and cloud and matter element model. J. Civ. Eng. Manag. 2018, 35, 152–158+164. [Google Scholar]
- Chuang, Y.S.; Chang, H.L. Issues of using parametric insurance (PI) to Taiwan energy-saving performance contract (ESPC): A snapshot. Energy Effic. 2025, 18, 8. [Google Scholar] [CrossRef]
| Disclaimer/Publisher’s Note: The statements, opinions and data contained in all publications are solely those of the individual author(s) and contributor(s) and not of MDPI and/or the editor(s). MDPI and/or the editor(s) disclaim responsibility for any injury to people or property resulting from any ideas, methods, instructions or products referred to in the content. |
© 2025 by the authors. Licensee MDPI, Basel, Switzerland. This article is an open access article distributed under the terms and conditions of the Creative Commons Attribution (CC BY) license (https://creativecommons.org/licenses/by/4.0/).


