Article

Assessing Energy Poverty in Greece Using Open-Access Data: A National and Regional Analysis Based on the 10% Indicator

Decision Support Systems Laboratory, School of Electrical & Computer Engineering, National Technical University of Athens, 15773 Athens, Greece
*
Author to whom correspondence should be addressed.
Energies 2025, 18(21), 5787; https://doi.org/10.3390/en18215787
Submission received: 29 September 2025 / Revised: 20 October 2025 / Accepted: 31 October 2025 / Published: 2 November 2025

Abstract

Energy poverty remains a pressing social and policy challenge across Europe, particularly in countries like Greece, where economic disparities and climatic conditions vary significantly between regions. This paper presents a scalable and transparent methodological framework for assessing energy poverty using the 10% indicator based on the actual energy expenditure, calculated exclusively from open-access statistical data. The study estimates annual 10% metric values from 2012 to 2023 at both national and regional levels, covering all 13 administrative regions of Greece. By integrating key variables such as household energy consumption, energy prices, income, population distribution, and heating degree days, the framework enables regional comparisons without relying on costly or inaccessible household-level data. The results reveal substantial regional disparities, with northern and mountainous areas consistently exhibiting higher 10% index values due to lower incomes and greater heating needs, while southern and island regions remain less affected. Despite national values remaining below the conventional 10% threshold throughout the period, the findings highlight that significant areas of vulnerability persist. The proposed approach offers a practical tool for policymakers to identify high-risk areas, prioritize building renovation efforts, and support socially inclusive energy transition strategies across the EU.

1. Introduction

Over the next several decades, the energy landscape will undergo significant shifts driven by three core challenges: adapting to climate change, guaranteeing sufficient supplies, and tackling energy poverty (EP). While climate adaptation and the security of supply have received considerable focus, EP remains less explored, despite its severe effects on millions globally. According to the World Health Organization (WHO), indoor pollution causes about 3.2 million deaths annually in low-income countries, linked to the inefficient combustion of solid fuels and kerosene used for cooking [1]. Although EP is deeply intertwined with overall poverty, expanding access to reliable energy infrastructure could alleviate its worst impacts and promote lasting socio-economic progress. The International Energy Agency estimates that achieving universal energy access in developing regions would necessitate about USD 55 billion in annual investment by 2030—substantially less than current yearly fossil fuel subsidy expenditures [2].
EP stands among the most pressing global challenges of the 21st century. Nearly 1.6 billion people worldwide still live without electricity, and an additional 1.1 billion rely on traditional solid fuel stoves instead of modern energy sources. The majority of affected populations are concentrated in rural and urban regions across South Asia and Africa. Even within Europe, the world’s most economically developed continent, over 34 million individuals are unable to maintain sufficient indoor heating, revealing that EP is an escalating issue. Each year, millions of premature deaths are caused by indoor air contamination from burning solid fuels. Therefore, EP must be recognized as a worldwide problem with deep political, social, health, and sustainable development implications [3].
EP encompasses a variety of definitions, yet all converge on the idea that energy consumption falls short of fulfilling essential human needs. As noted by Reddy [4], it represents the lack of sufficient options for accessing affordable, reliable, high-quality, safe, and environmentally sustainable energy services that enable both economic and human growth. Although this point may appear self-evident, it is important to stress that the objective is not mere energy consumption, but the delivery of energy services derived from diverse energy sources. Recent reflections on sustainability, such as that by Lami et al. [5], emphasize that the selection and interpretation of sustainability indicators are deeply influenced by underlying values and societal priorities. This underscores that indicators are not neutral measurements but are embedded within complex policy contexts shaped by ethical considerations and cognitive frameworks. Primary energy sources, such as coal, oil, gas, and biomass, are transformed and delivered via different energy “carriers” of electricity (heating, electricity and fuels in solid, liquid, or gas form) which ultimately supply the services people depend on: cooking, heating, cooling, lighting, mobility, work, and access to information and digital connectivity. While the combination of primary sources and carriers varies according to geography and national energy policy, the underlying energy needs remain remarkably consistent across all societies.
Sen [6] argues that development should not be viewed merely as the attainment of a specific income threshold—or, in this context, a certain level of energy consumption—but rather as the ability to access and exercise choices that lead to overall well-being. The absence of adequate energy access deprives individuals not only of essential household services, such as cooking and heating, but also of broader opportunities vital to human and societal progress (education, healthcare, public awareness, and political engagement). When people lack the capacity or freedom to make such choices, they fail to satisfy the common interest and thus, real development becomes unattainable.
Despite increasing attention to energy poverty at the EU level, a major barrier to effective assessment and policymaking lies in the limited ability to evaluate energy poverty using open-access statistical data. Most existing studies [7,8,9,10,11,12,13] rely on detailed, building-specific information, such as energy consumption patterns, insulation levels, and household income data. However, these datasets are often unavailable due to privacy constraints, costly to collect due to the need for extensive surveys or specialized equipment or require expert knowledge for accurate interpretation and modeling. This reliance on granular data limits the scalability of assessments and hinders comparative analyses across diverse regions and countries. Consequently, many existing methodologies are not easily transferable or applicable at broader territorial scales.
Furthermore, the Greek context exemplifies these challenges, as there remains a lack of a comprehensive, standardized national framework for the systematic assessment of energy poverty, particularly at the regional and local levels. Most studies in the Greek context to date [14,15,16,17,18,19] have been ad hoc or limited in scope, often lacking continuity, spatial resolution, or methodological consistency. These limitations complicate the formulation of effective, targeted policies to address energy poverty, especially as geographic and socioeconomic disparities continue to evolve rapidly. Overcoming these data and methodological gaps is essential for enabling transparent, replicable, and policy-relevant energy poverty measurement that can inform social equity-driven energy transition strategies aligned with EU climate objectives.
In this context, this paper seeks to address the gap in energy poverty assessment in Greece by proposing a scalable methodological framework that enables the identification and analysis of energy-poor areas using open-access statistical data. The framework is designed to overcome the limitations of existing approaches that depend on detailed building-level inputs by leveraging publicly available socioeconomic, housing, and climatic datasets to perform regional-level assessments. By doing so, it facilitates a more inclusive and cost-effective evaluation process that supports municipalities, policymakers, and social agencies in prioritizing interventions where they are most needed. The methodology includes the exploitation of a widely used energy poverty indicator to enhance transparency and comparability across regions. This approach not only fills a critical knowledge gap but also enables the integration of energy poverty considerations into broader energy planning and climate adaptation strategies. Ultimately, the proposed framework lays the foundation for evidence-based, regionally targeted policymaking that can contribute to reducing inequalities and advancing social resilience in the face of energy and climate challenges.
The remaining part of the paper is structured as follows: Section 2 provides an overview of international and EU-level initiatives to address energy poverty, framing the issue within global and European policy contexts. Section 3 describes the main energy poverty indicators and outlines the methodological framework applied in this study, including the rationale for using the actual-expenditure 10% indicator and the approach for estimating regional values. Section 4 presents the results of the calculations, both at the national level and across Greece’s 13 regions, identifying temporal trends and spatial disparities. Section 5 discusses the implications of these findings in relation to socioeconomic and climatic factors, compares them with previous research, highlights key methodological limitations, and proposes directions for future research. Finally, Section 6 offers concluding remarks that summarize the main insights of the study.

2. International and EU Initiatives to Tackle Energy Poverty

Global initiatives to eradicate EP have taken shape through the coordinated efforts of numerous organizations worldwide. The global public health community has repeatedly called for decisive measures to reduce mortality caused by indoor air pollution [20]. In 2001, the United Nations (UN) launched the Sustainable Energy for All program, setting a framework to address worldwide energy deprivation [21]. This commitment was strengthened in 2015 with the introduction of the 17 Sustainable Development Goals (SDGs), among which SDG 7 specifically seeks to ensure universal access to affordable, reliable, and sustainable energy by 2030 [22]. The World Bank has also prioritized promoting cleaner fuels and energy-efficient cooking solutions [23]. Despite these initiatives, progress remains insufficient to completely eradicate EP worldwide. Notably, the UN’s Millennium Development Goals (MDGs) [24], which aimed to reduce extreme poverty and foster sustainable development, made no explicit reference to access to energy.
Given the multifaceted character of EP, the EU continuously formulates policies grounded in a range of guiding principles. These efforts are implemented either through strategic frameworks and directives or by allocating financial resources to support Member States in undertaking targeted national actions [25]. As defining energy poor consumers remains a complex task, research and actions for this purpose are evolving at the state level rather than at the European level. Despite the lack of an official body dedicated to EP or a structured European strategy, there is an integrated activity to address it and protect vulnerable citizens.
Directives 2003/54/EC [26] and 2003/55/EC [27], designed to regulate the markets of electrical energy and gas, made it evident that measures are necessary to shield consumers from the disconnection of electricity caused by their inability to pay bills under specific national conditions. The growing trend of the EP was further emphasized in later regulations, like the Third Energy Package [28]―which was replaced by the Electricity Market Design [29] and the legislation on internal markets for renewable gas, natural gas and hydrogen [30]―the Energy Poverty and Vulnerable Consumers Coordination Group [31], and the Energy Union [32]. Although a considerably long period of time passed between the first directives and the subsequent revision (about 6 years), within the last decade many initiatives have included the EP in the regulatory debate. For example, the European Economic and Social Committee [33] laid the groundwork for the creation of an authority responsible for coordinating the search for vulnerability and energy poverty. Further efforts comprise the Clean Energy for All Europeans Package [34] and the subsequent creation of the Energy Poverty Observatory initiative, and its successor, the Energy Poverty Advisory Hub [35], designed to serve as a user-friendly and accessible resource to support decision making on EP at local, national, and European levels.
The EU has also introduced directives aimed at transforming the building sector to enhance building energy sustainability and reduce their effect on climate transformation. The Energy Efficiency Directive (EED) (2012/27/EU) [36], and the Energy Performance of Buildings Directive (EPBD) (2010/31/EU [37], recast of 2002/91/EC [38]) are related efforts to mitigate EP, because they can act as a prominent guide to EP, for example, in the energy efficiency of buildings. The EED includes minimum performance and highlights that the building sector has the highest capacity for energy savings, being the major energy consumer in urban settings. Meanwhile, the EPBD sets energy performance criteria for new constructions and extensive renovations. Together, these directives have been instrumental in driving building upgrades and motivating stakeholders to pursue comprehensive upgrade interventions of the existing building stock.
While renovating the existing building stock is a long-term endeavor, EP remains an urgent issue impacting millions today. The first revision of the EED (2018/844/EU) [39] sought to tackle this by urging Member States to enforce minimum energy standards for rental premises and introducing tighter measures and national initiatives to support low-income households with inadequate energy performance. Subsequently, the latest EED revision (2023/1791/EU) [40] takes it one step further and marks a substantial increase in the EU’s commitment to improving energy efficiency by formally enshrining the principle of “energy efficiency first” into EU law, making it a foundational element of energy policy. In practice, this requires EU Member States to systematically prioritize energy efficiency in all relevant policies and significant investment decisions, whether in the energy sector or other areas.
Regarding EPBD, a major shift occurred with the 2018 amendment (2018/844/EU) [39], adopted as part of the Clean Energy for All Europeans package [34]. For the first time, the directive explicitly addressed energy poverty by requiring Member States to consider vulnerable households in their Long-Term Renovation Strategies, which evolved into the National Building Renovation Plans [41]. This version also promoted smart technologies, building automation, and the modernization of building systems, reflecting a broader and more inclusive approach to decarbonizing the EU building stock. The latest revision, (2024/1275/EU) [42], adopted in April 2024 under the European Green Deal [43] and Fit for 55 package [44], significantly increases ambitions regarding both energy performance and social impact. It mandates that all new buildings be Zero-Emission Buildings (ZEBs) by 2028 for public buildings and by 2030 for all others. It introduces binding Minimum Energy Performance Standards for existing buildings, upgrades Energy Performance Certificates (EPCs) with harmonized EU-wide scales and promotes digital tools such as Building Logbooks and the Smart Readiness Indicator (SRI).

3. Materials and Methods

3.1. Energy Poverty Indicators

As mentioned in the introduction of the paper, the literature has a plethora of indicators that contribute to the measurement of EP. Such indicators may be complementary to each other, and each is appropriate for different situations and different populations.
The set of these indicators is divided into two main categories, depending on how they are measured: the expenditure-based and the consensual-based. The former are measurable indicators derived from a mathematical model, while the latter are based on the EU-SILC survey [45], whose data are calculated relatively simply from the percentage of households that answered “yes”. There are also indicators that combine the two above categories and are classified as composite indicators. The main indicators from each category are listed below.
Expenditure-based indicators [46]:
  • 10% Indicator (TPI): A household is considered energy-poor if it spends more than 10% of its income on energy.
  • 2M: Households spending more than twice the national median energy expenditure-to-income ratio are classified as energy-poor.
  • M/2: A household is identified as potentially energy-poor if the share of its energy spending relative to its income is less than half the national median.
  • Low Income, High Cost (LIHC): A household is energy-poor if it has higher-than-median energy costs and its residual income falls below the poverty line.
  • Minimum Income Standard (MIS): A household is classified as energy-poor if, after covering its energy expenses, its remaining income falls below the minimum income threshold required for a decent standard of living.
Consensual-based indicators [46]:
  • Inability to keep home adequately warm: Self-reported inability to maintain adequate thermal comfort in winter.
  • Arrears on utility bills: Households reporting difficulty or inability to pay electricity, gas, or heating bills on time.
  • Severe arrears: The household reports having postponed the payment of utility bills on multiple occasions.
Composite indicators:
  • Multidimensional Energy Poverty Index (MEPI): Based on the Alkire–Foster method [47]; includes indicators across affordability, access, quality, and service use [48].
  • Compound Energy Poverty Indicator (CEPI): It is a composite indicator that includes elements such as whether the house is hot/cold/dark, whether there are leaks and arrears on bills [48].
  • Energy Poverty Vulnerability Index (EPVI): This index combines socio-economic indicators of the population with building’s characteristics and energy performance [49].

3.2. Methodological Framework

As described in the previous subsection, the TPI characterizes energy poverty as a situation in which a household must consume over 10% of its income to meet all its energy requirements (heating, hot water, cooking, electrical appliances, lighting) in order to maintain an acceptable level of thermal comfort [50].
According to the official definition adopted by the UK [51], the TPI is mathematically defined in Equation (1):
T P I m o d e l e d = M o d e l e d   e n e r g y   c o s t s   r e q u i r e d I n c o m e = M o d e l e d   e n e r g y   c o n s u m p t i o n   r e q u i r e d s · P r i c e s I n c o m e
where
  • s stands for the energy source.
Among the different methodologies used to measure energy poverty in Europe, the TPI cost-based approach has become the most prominent. However, accurately calculating the energy required to maintain adequate comfort, according to the original British definition, poses significant challenges. As a result, most researchers have adopted a similar version of the indicator: the TPI, based on actual rather than required energy consumption. This shift is largely due to the difficulties involved in modeling required energy use, since actual consumption data is more readily available from official statistics and surveys. Moreover, the detailed modeling of energy needs has only been feasible in the UK, which has developed a dedicated national system (the BREDEM-2012 model [52]) tailored to the specific characteristics of British housing and climate. No other European country has implemented a comparable system. Consequently, the use of the TPI based on actual consumption has become a widespread standard for assessing energy poverty across Europe, despite its methodological limitations [53].
Therefore, in the context of this study, the TPI based on actual energy consumption was applied. Specifically, yearly data were collected on household consumption of the four main energy sources: electricity, heating oil, natural gas, and firewood [54,55]. Each of these consumption values was multiplied by the corresponding unit price: electricity [56,57], natural gas [58], heating oil [57], and firewood [59]. The resulting total energy expenditure was then compared to the average annual net household income [60,61], in order to calculate the ratio.
The formula used to determine the actual-expenditure TPI is presented in Equation (2):
T P I t a c t u a l = ( i E i · P i ) t I t
where
  • E i stands for the household energy consumption by energy source i, for each year;
  • P i stands for the price per unit of energy source i, for each year;
  • I t stands for the household income, for the year t;
  • i stands for the energy source used for household energy needs; i = [electricity, natural gas, heating oil, firewood];
  • t stands for the reference year of the calculation; t = [2012, 2023].
The aforementioned formula was applied not only to calculate Greece’s national actual TPI measurements for the examined years, but also to estimate the corresponding values for each of the 13 regions of the country. While the computation of the national value was relatively straightforward (given that most statistical data referred to the country as a whole) the calculation of the regional values required several estimations and assumptions, given the absence of concrete data per region. These assumptions are outlined below:
  • The annual national energy prices for the four energy sources were also adopted as the reference prices for all regions.
  • The annual regional electricity consumption was allocated using a simple proportional method, based on the ratio of regional to national population (latest census [62]). The applied formula is shown in Equation (3):
    E C t r = E C t n · P O P r P O P n
    where
    • E R t n stands for the national household electricity consumption, for the year t;
    • P O P r stands for the population of region r;
    • P O P n stands for the national population of Greece;
    • r stands for the region of Greece;
    • n stands for the national (Greek) data.
3.
The annual regional consumption of natural gas, heating oil, and firewood was assumed to be primarily associated with household heating. Therefore, a multi-factor allocation model was developed, combining population weights with the Heating Degree Days (HDD) [63] of each region, as presented in Equation (4):
C t , i r = C t , i n · P O P r · H D D r , t r , t ( P O P r · H D D r , t )
where
  • C t , i n stands for the national household consumption by energy source i, for the year t; i = [natural gas, heating oil, firewood];
  • H D D r , t stands for the Heating Degree Days index of region r, for the year t.
4.
Regarding annual regional household income, comprehensive data were obtained from the related EU database [60].
It is important to highlight that the aim of this research is to enable the estimation of a country’s energy poverty situation using open-access and readily available data, without relying on extensive data collection efforts or expert consultation, processes that typically demand significant human and financial resources. Following this approach, and based on access to the aforementioned data sources, the TPI was calculated both at the national level and for the individual regions of Greece. Additionally, an annual time resolution was adopted, as reliable and complete data were available for the period from 2012 to 2023. This approach necessarily involved several assumptions; for example, estimating regional consumption, as previously explained. To ensure a continuous chronological dataset, missing values for certain years were filled in by consulting the relevant Greek literature and reputable sources. Finally, it should be noted that the calculated values do not represent the percentage of the population exceeding the 10% threshold of the TPI index, as this would require detailed, household-level data across the entire population. Instead, the results reflect the TPI ratio itself, i.e., the average percentage of income needed to cover energy expenses, calculated across all households within the population under study. The results indicate how close both the country as a whole and each individual region are to reaching the 10% threshold, providing insight into the relative severity of energy poverty across different geographic areas.
It must be underlined that this study relies on aggregated regional data, as explained in detail above. While this approach offers significant advantages for scalability and replicability, it may conceal important intra-regional disparities or extreme cases of vulnerability. As more granular datasets and, especially, household-level surveys become accessible, our methodology can be readily adapted to leverage them, enhancing both the precision and policy-targeting capabilities of future energy poverty evaluations.
Figure 1 exhibits the respective steps of the methodological framework for the actual TPI calculation:

4. Results

This section presents the results extracted from the methodological process presented in the previous section.

4.1. National Results

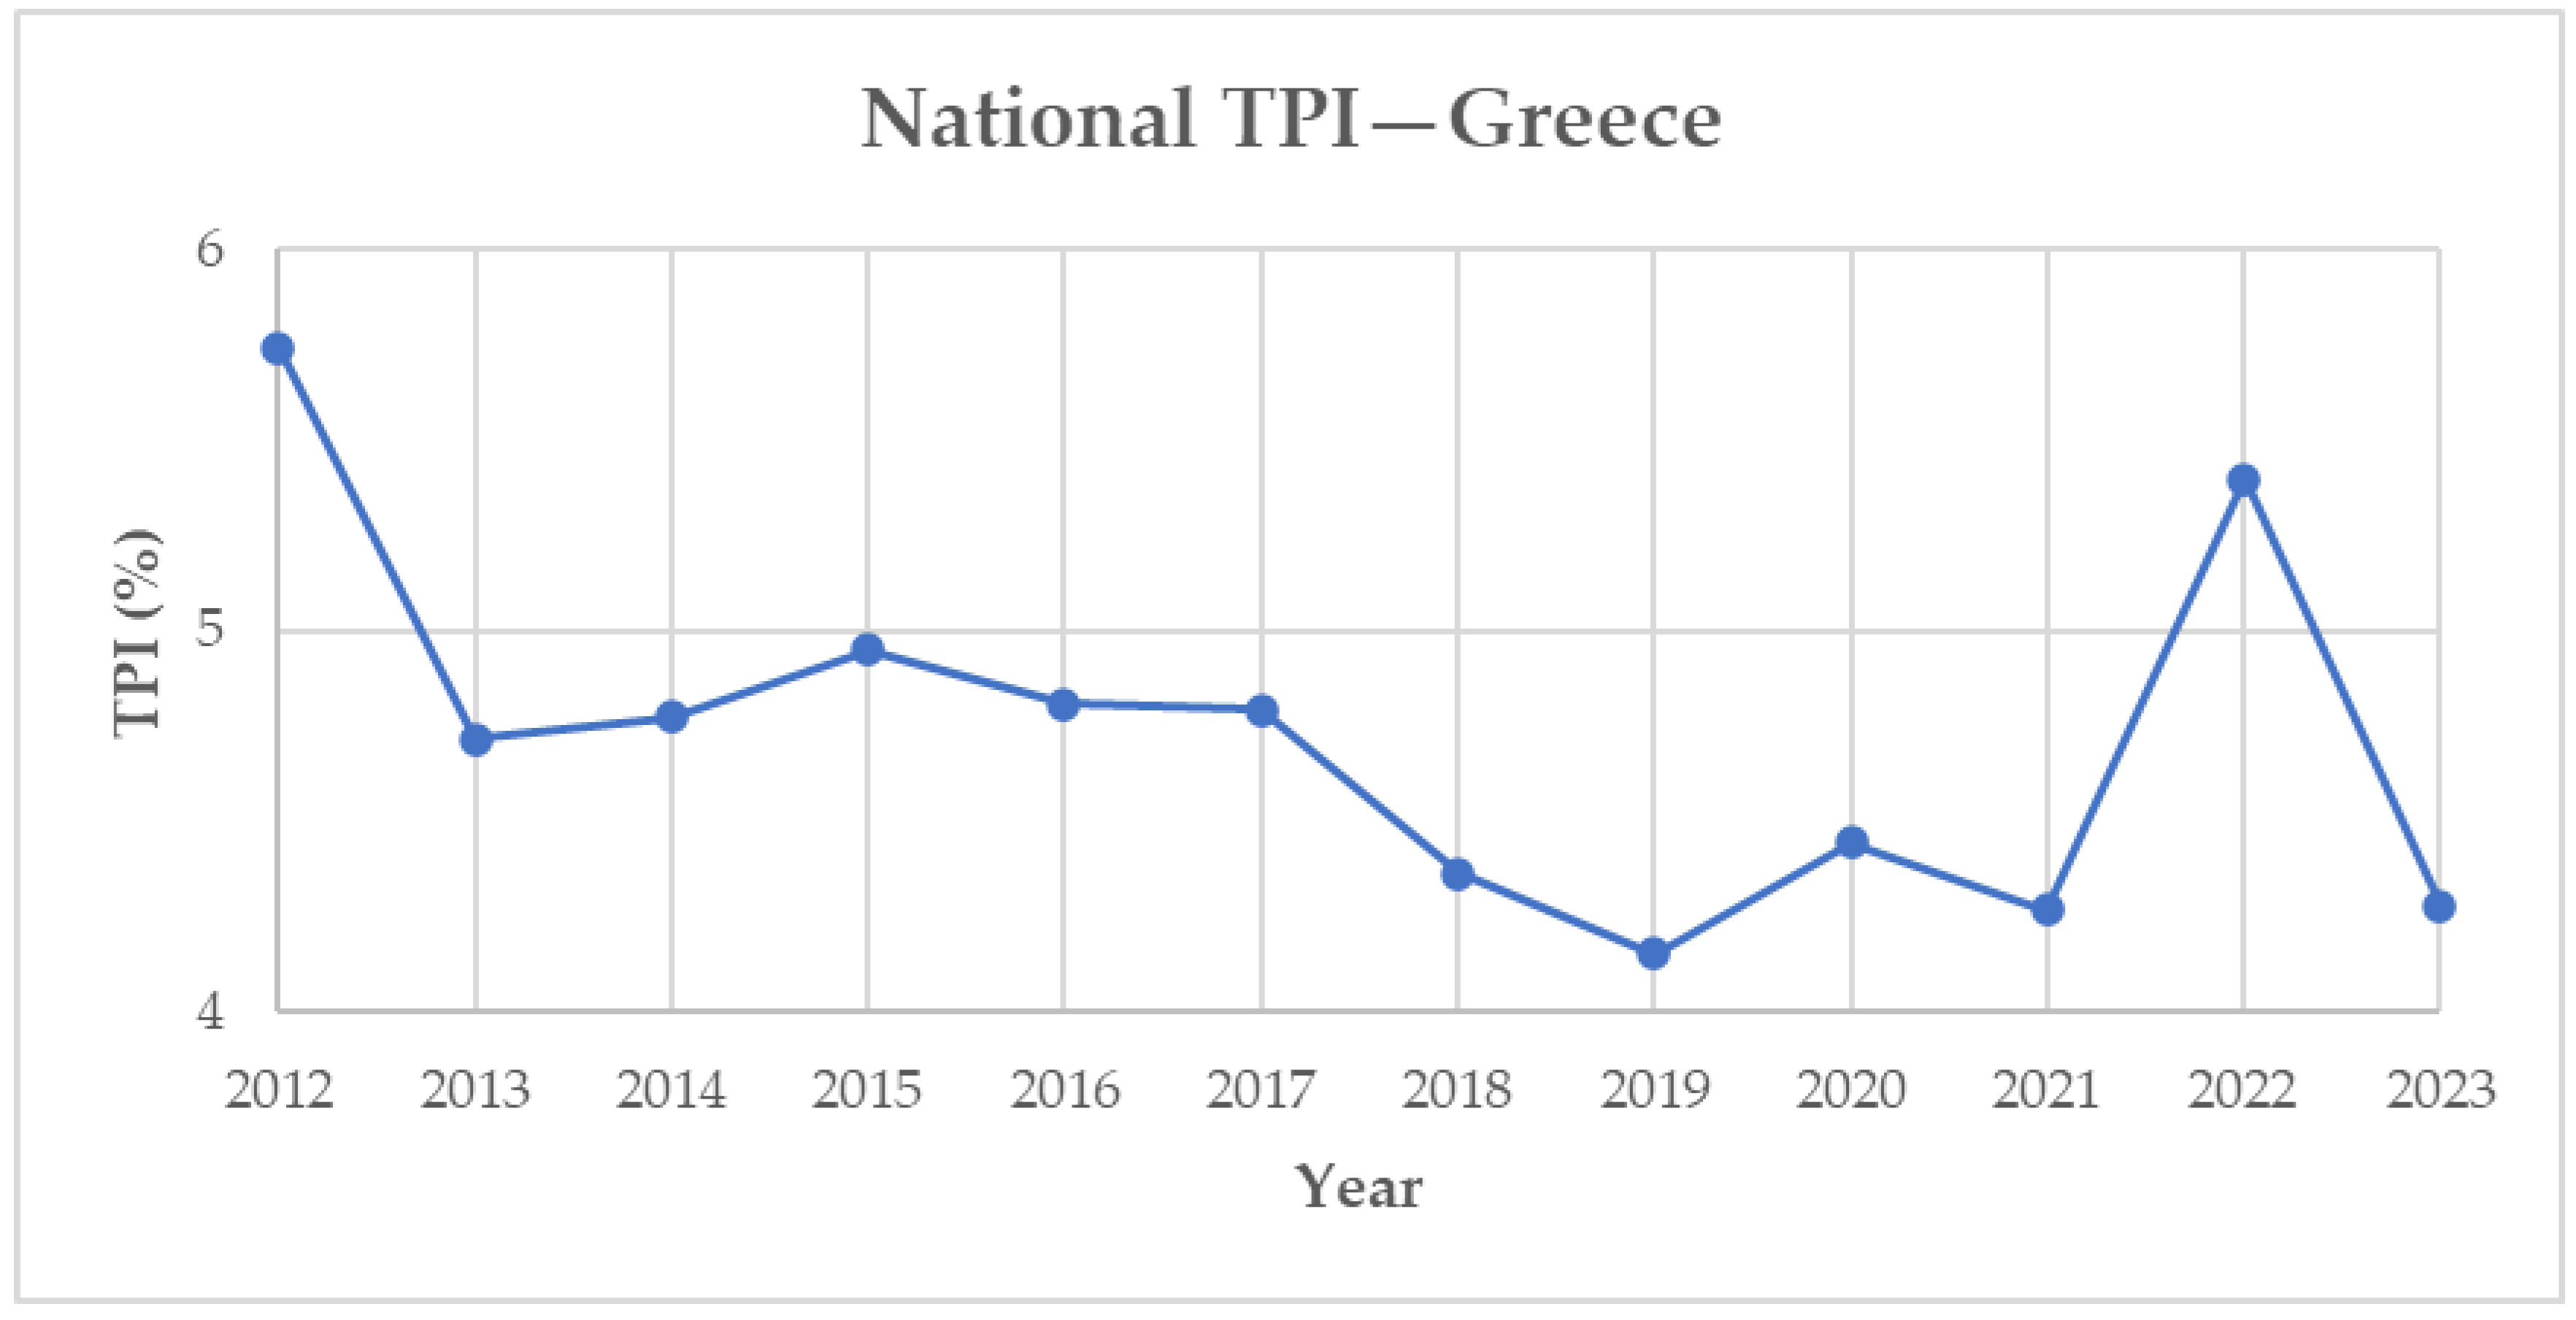
First, Figure 2 first presents the nationwide TPI values of Greece for the period 2012–2023.
The same results are exhibited in table form in Table 1, indicating the specific values per year.
The evolution of Greece’s national TPI between 2012 and 2023 highlights the sensitivity of household energy affordability to both economic conditions and energy market dynamics. While the national TPI values remain consistently below the 10% threshold (between 4% and 6%), this does not imply that many households are not experiencing energy poverty; rather, it reflects an aggregated national picture that masks regional and socio-economic disparities. The highest rate (5.74%) appears in 2012, coinciding with the financial crisis and increased heating oil taxation. A gradual decline follows until 2019 (4.15%) due to economic stabilization and lower fuel prices. A moderate rise occurs in 2020–2021 (4.44% and 4.27%, respectively), linked to the COVID-19 pandemic, while a sharp spike to 5.4% in 2022 reflects the EU-wide energy price crisis. The 2023 drop (4.28%) suggests that policy measures and energy price normalization had a positive impact.

4.2. Regional Results

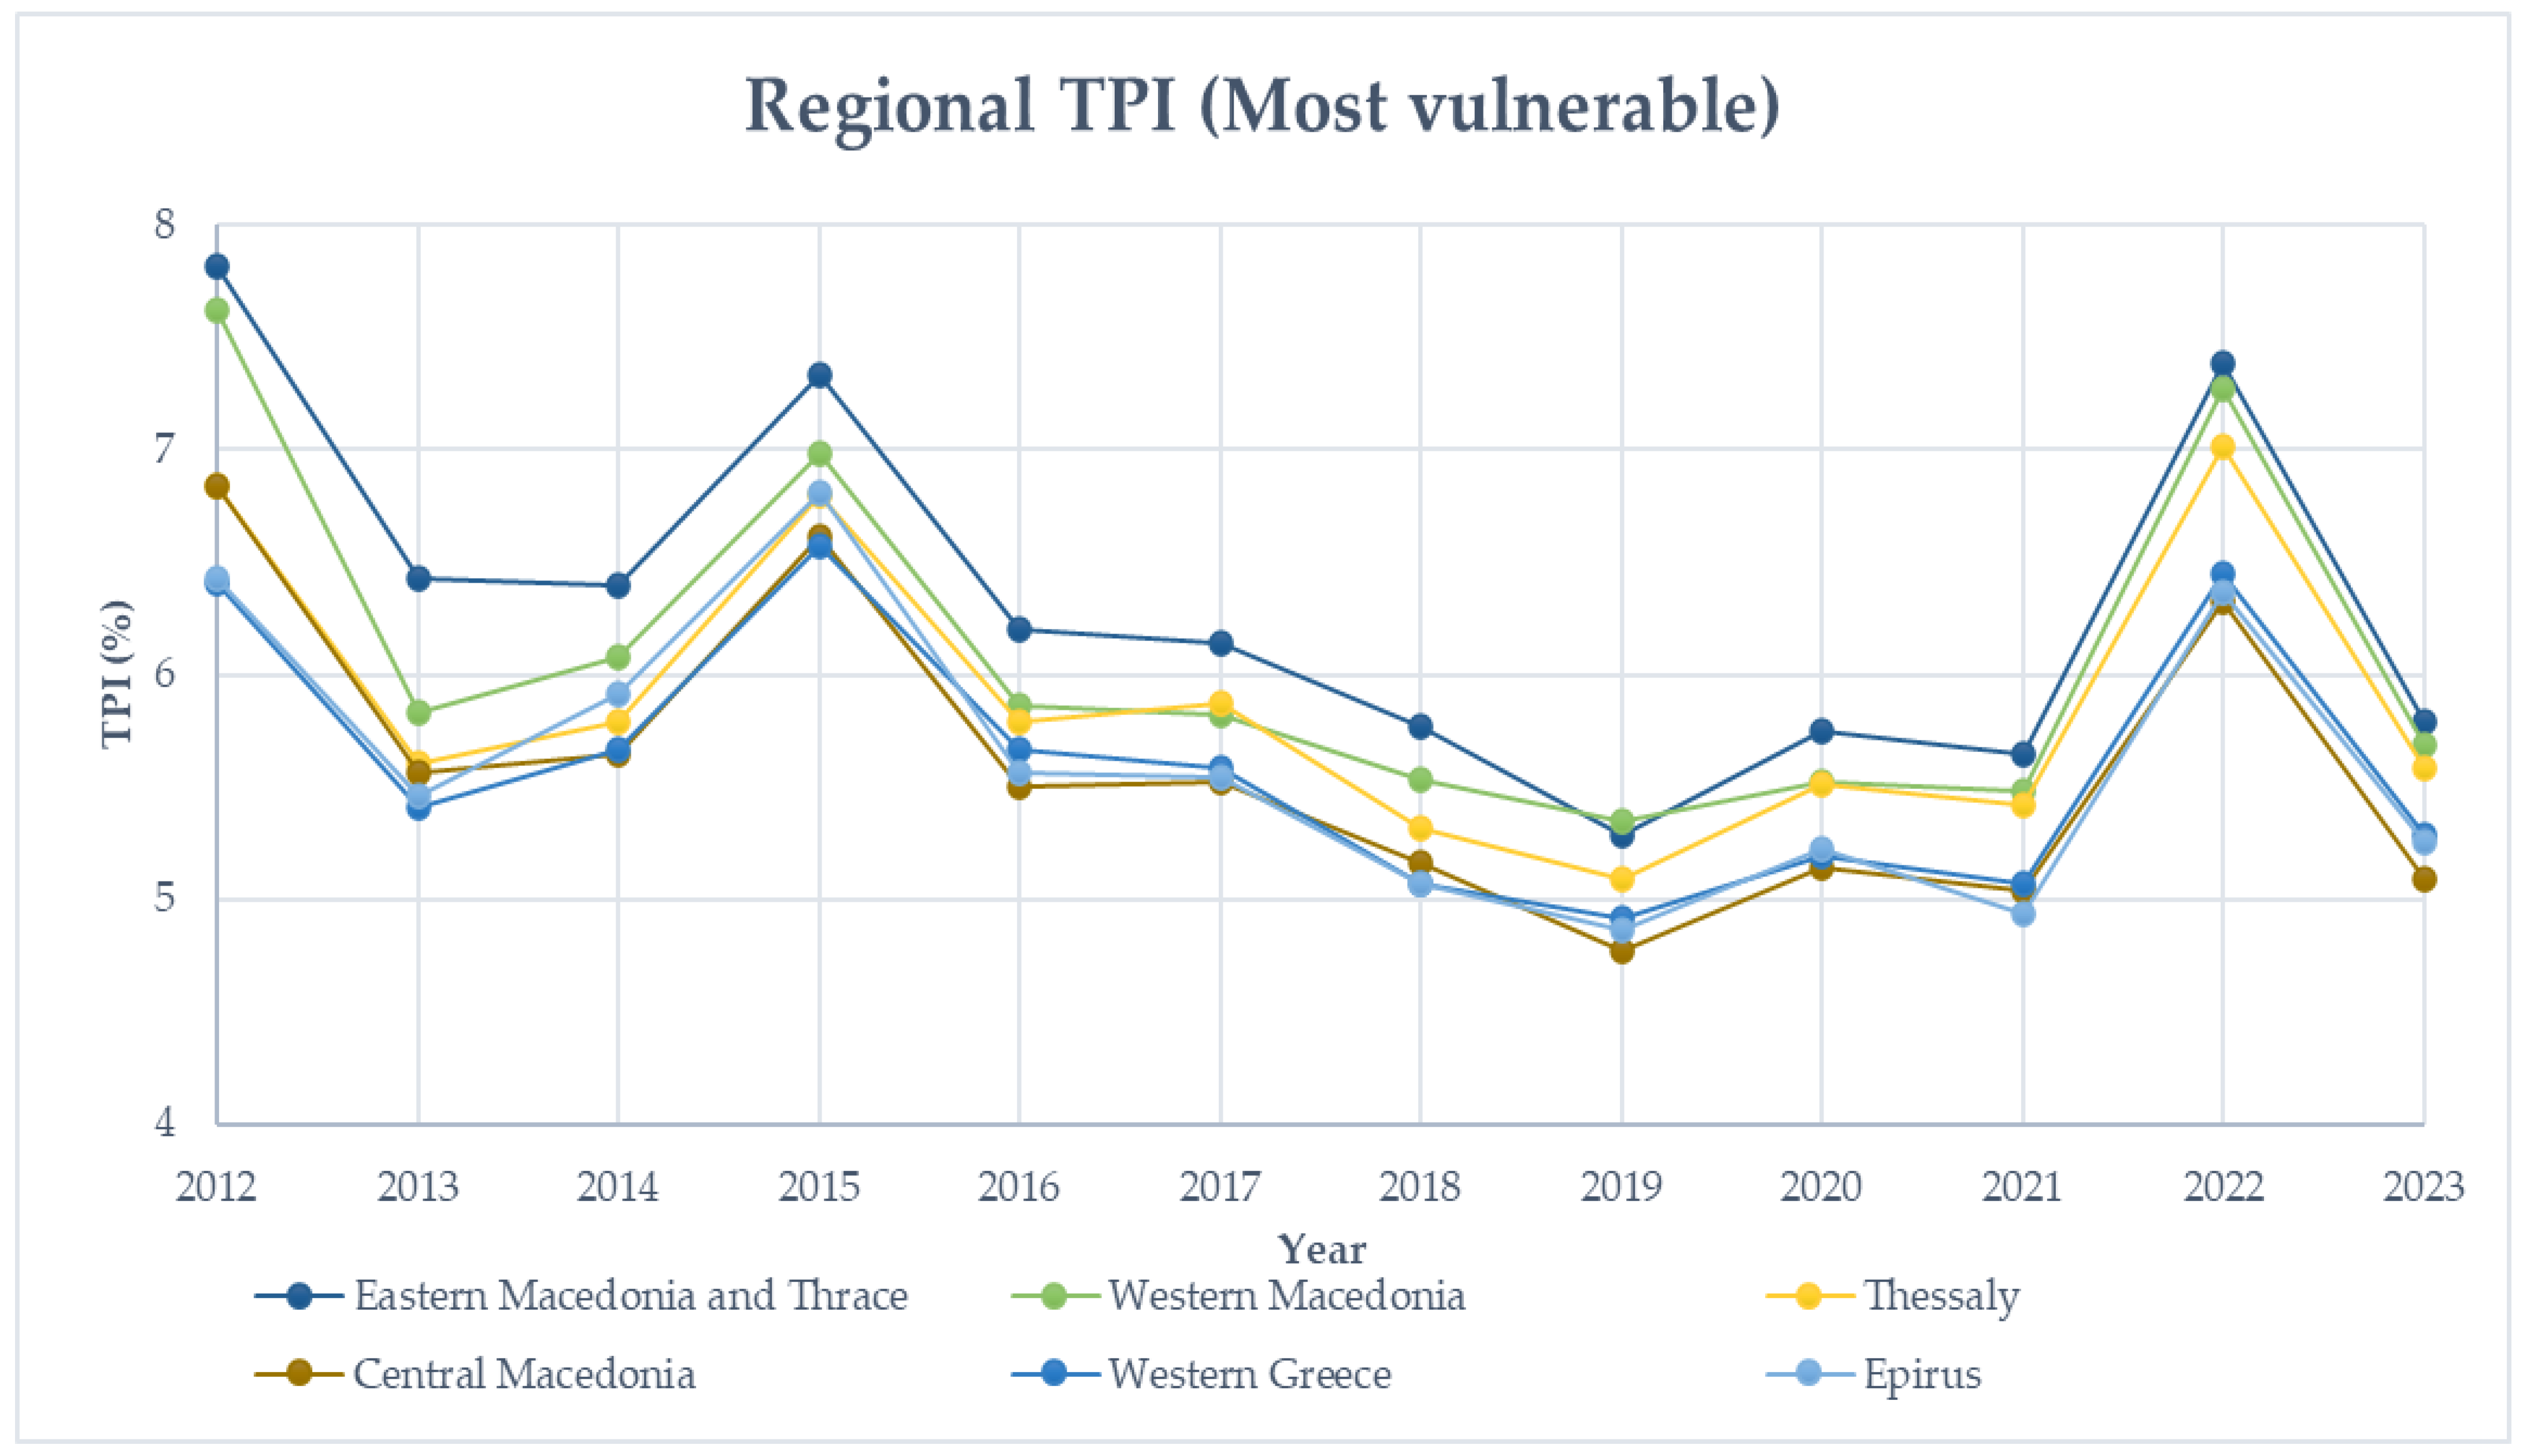
Regarding the results for the 13 Greek regions, they were categorized into two subcategories: the most vulnerable and the least vulnerable regions. The most vulnerable regions, based on the results of our study, consist of Central Macedonia, Eastern Macedonia and Thrace, Epirus, Thessaly, Western Greece, and Western Macedonia. The TPI scores for this group are shown in Figure 3.
The TPI values for the most vulnerable regions of Greece remain consistently high from 2012 to 2023, with several regions starting above 7% and rarely dropping below 5%. Eastern Macedonia and Thrace consistently rank among the most affected areas, with values peaking in 2012, 2015, and 2022, reaching up to 7.81%. Western Macedonia and Thessaly show similar trends, with sharp increases during the same years, likely reflecting broader economic hardship or energy price shocks. Although some decline is observed between 2015 and 2019, all regions experience a marked spike in 2022, coinciding with the global energy crisis, before returning to lower, but still elevated, levels in 2023. This persistent vulnerability is linked to harsher winter conditions, higher heating needs, and lower average incomes, which drive up energy-related financial pressure. Due to these average values often approaching or exceeding 7–8%, a notable portion of the population in these regions is affected by energy poverty, highlighting the need for targeted mitigation strategies.
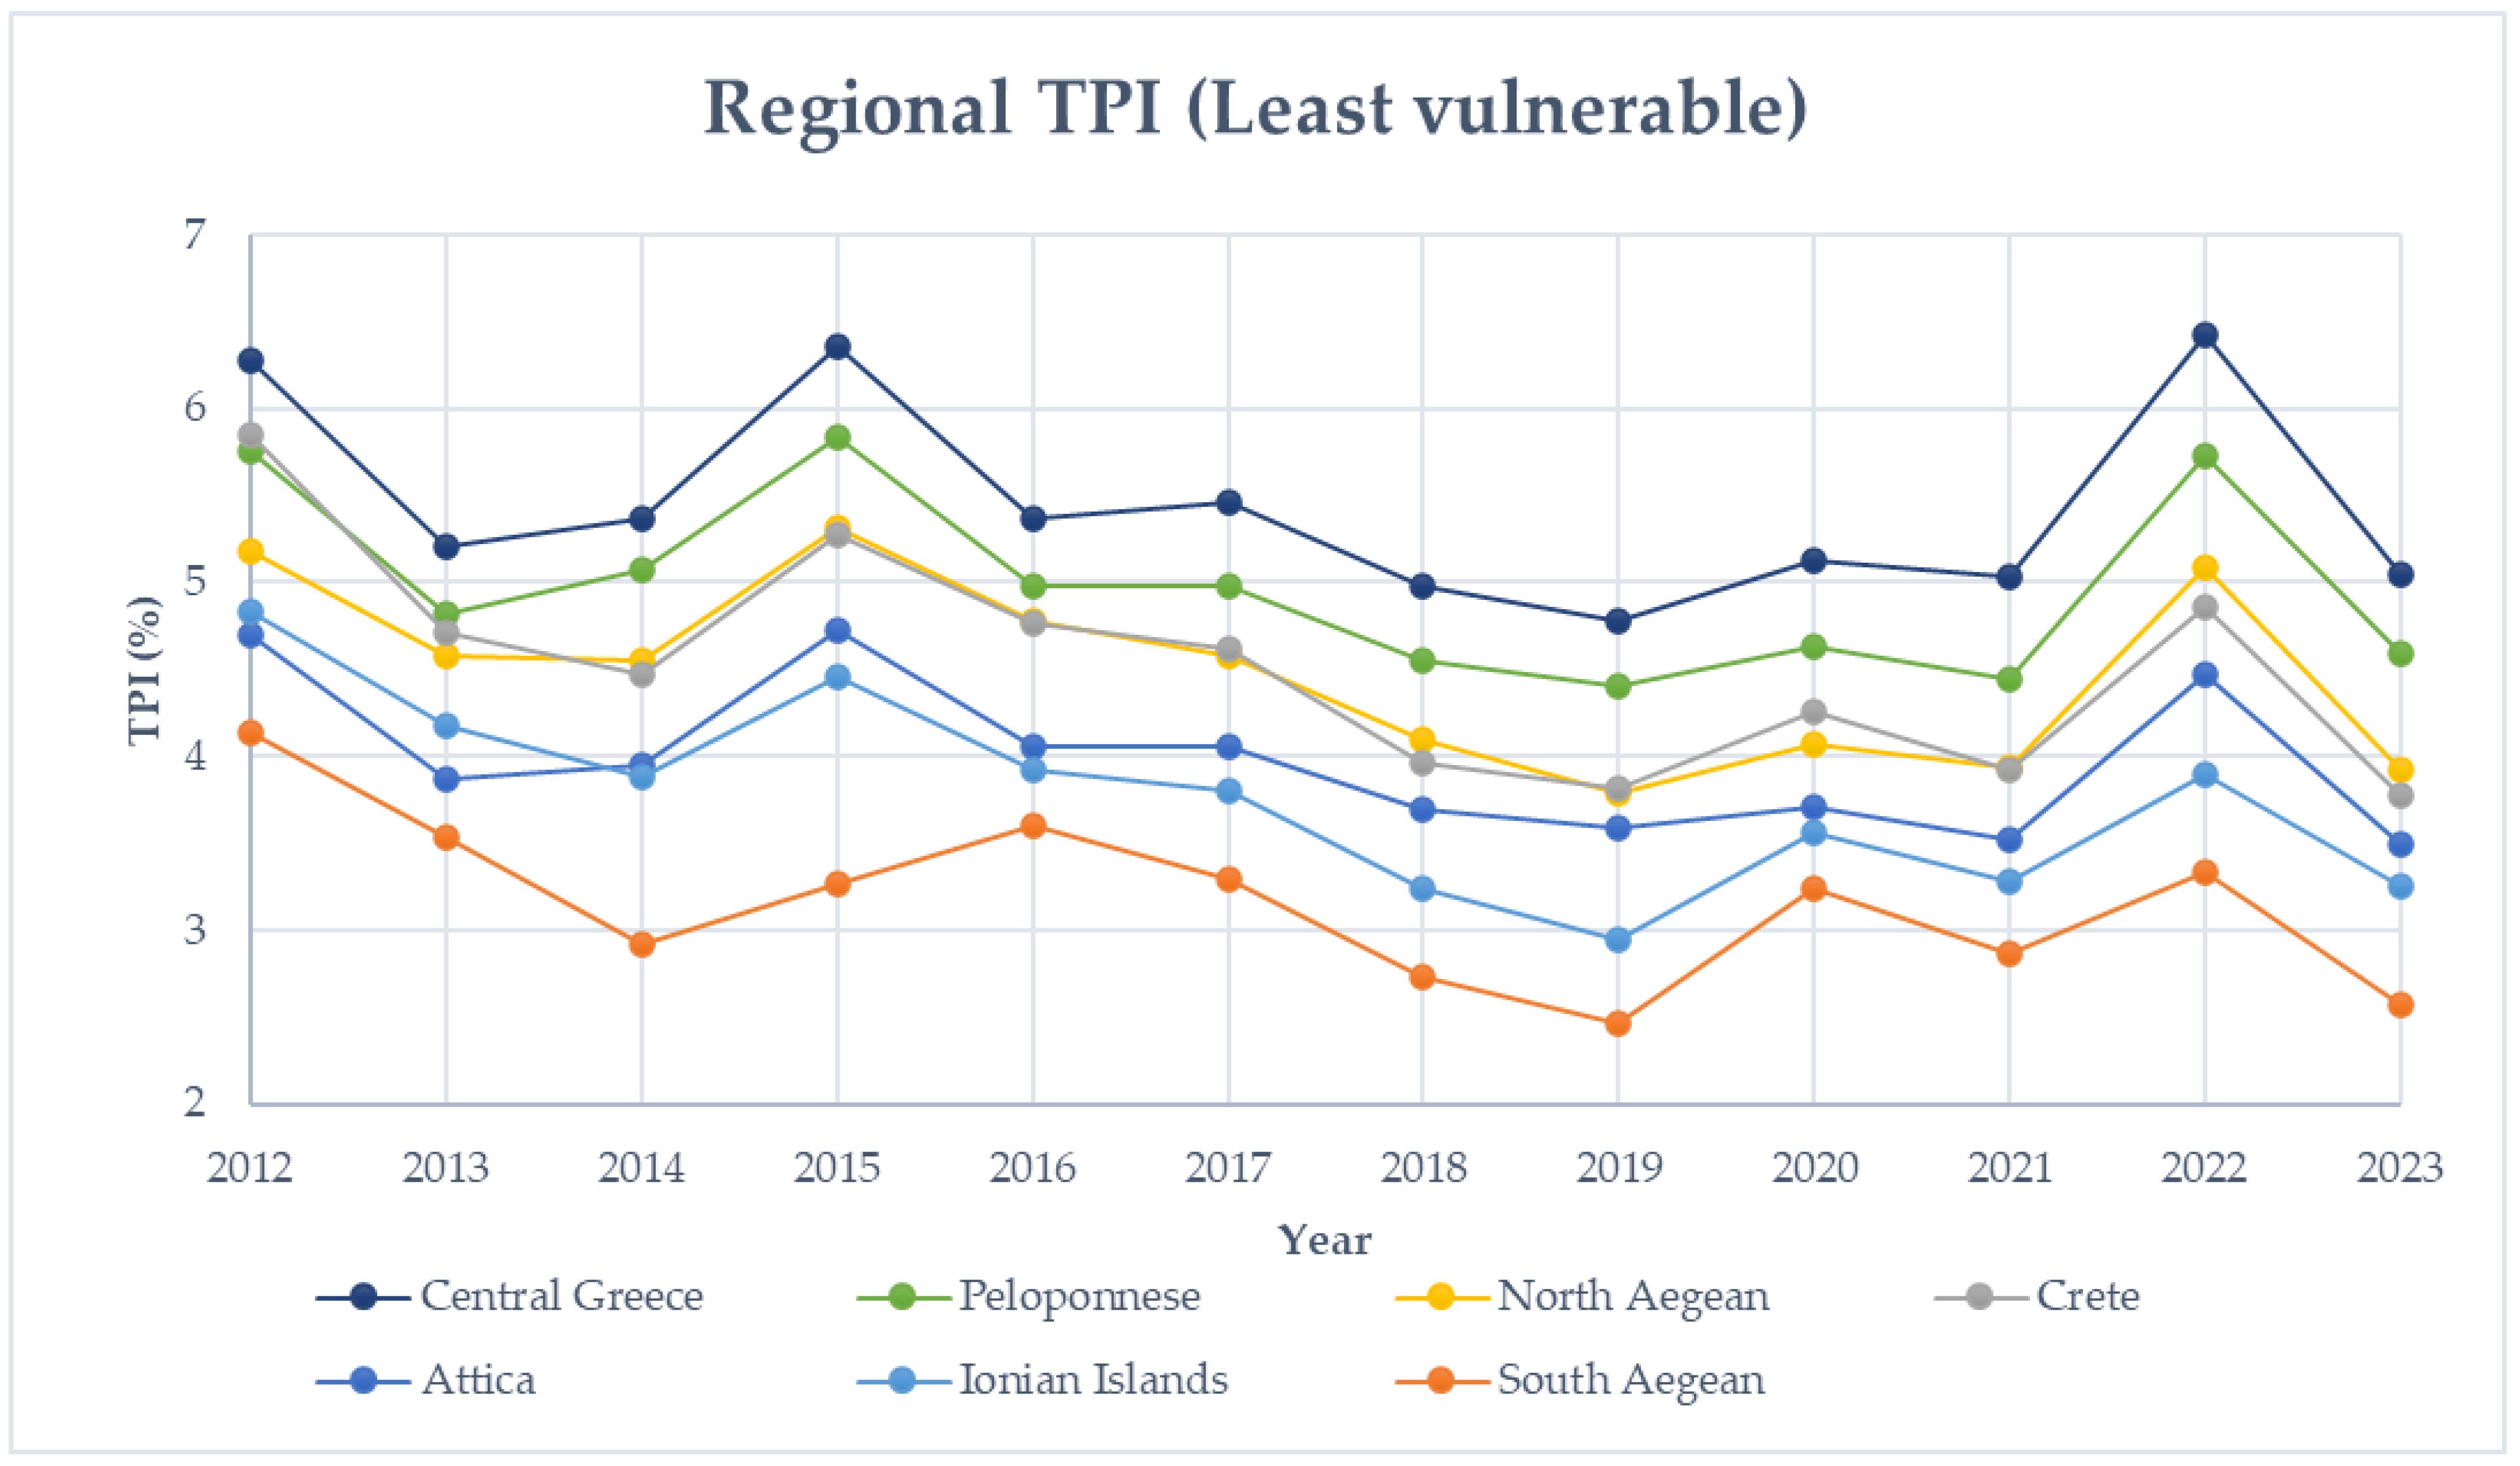
The results for the least vulnerable regions are provided in Figure 4. This category includes Attica, Central Greece, Crete, Ionian Islands, North Aegean, Peloponnese, and South Aegean.
The TPI values for the six least vulnerable regions of Greece consistently remained below 7% throughout the period 2012–2023, indicating relatively low levels of energy poverty compared to other regions. Central Greece and the Peloponnese exhibited the highest fluctuations, with noticeable peaks in 2015 and 2022, likely reflecting economic instability and rising energy prices during those years. South Aegean consistently recorded the lowest TPI values, dropping to around 2.4% in 2023. The Ionian Islands also performed strongly, ranking as the second least vulnerable region in most years, while Attica also maintained low and stable values due to its urban infrastructure and higher average incomes. Crete and the North Aegean showed moderate levels with a generally declining trend after 2022. Notably, we observed that the least vulnerable regions are generally those with milder weather conditions, which contribute to lower energy needs and costs, particularly for heating during the winter months. Finally, the TPI exceeded the 10% threshold in none of the regions, this does not preclude the existence of energy poverty at the household level, as specific vulnerable groups may still face challenges in affording adequate energy services.
The detailed results of the study for the 13 regions of Greece can be found in Table 2.

5. Discussion

The results of this study demonstrate that the proposed methodological framework, based on the actual TPI, offers a scalable, cost-effective, and transparent means to assess energy poverty at both national and regional levels using open-access data. The analysis of Greece’s TPI values between 2012 and 2023 reveals significant regional disparities in energy poverty, highlighting the influence of socioeconomic, climatic, and infrastructural factors.
The national TPI values remained below the 10% threshold throughout the period, peaking at 5.74% in 2012 and dropping to a low of 4.15% in 2019. While these values suggest that, on average, Greek households have not crossed the critical energy poverty threshold, this aggregated national figure conceals notable regional inequalities. Regions such as Eastern Macedonia and Thrace, Western Macedonia, and Thessaly exhibited consistently high TPI values, often nearing or surpassing 7–8%. These findings align with the previous literature emphasizing the vulnerability of mountainous and colder regions, where heating needs are more pronounced and average incomes remain low.
Conversely, the least affected regions, South Aegean, Ionian Islands, and Attica, recorded much lower TPI values, reflecting milder climatic conditions, higher income levels, and better energy infrastructure. This geographical pattern confirms earlier hypotheses and supports findings from prior studies which highlighted the role of both climatic severity and economic conditions in shaping energy affordability. Moreover, the regional TPI spikes observed in 2015 and 2022 correspond to macroeconomic disruptions and energy price volatility, further validating the sensitivity of the indicator to external shocks.
A critical implication of these results is that while national energy poverty trends may appear stable or to be improving, regional dynamics can differ substantially. This underscores the need for geographically targeted policy interventions and region-specific vulnerability assessments. The adopted methodology, by integrating Heating Degree Days, population distribution, and standardized energy pricing, allows policymakers to identify energy poverty “hotspots” without relying on detailed household-level data, which remains a limitation in many national statistical systems.
Beyond climatic variability and income differences, regional disparities in energy poverty may also reflect structural characteristics of the energy system. In highly centralized networks, consumers in remote areas often face higher energy costs due to distribution inefficiencies and limited diversification of supply sources. Conversely, regions with emerging off-grid renewable or community-based energy systems, such as small photovoltaic cooperatives and local bioenergy projects, exhibit improved affordability and resilience. These system-level distinctions emphasize that energy poverty in Greece is not only a function of climatic or economic conditions but also of infrastructural and governance contexts, underscoring the importance of geographically tailored energy transition policies.
The concept of energy communities as integral components of smart urban ecosystems, explored in previous studies [64], aligns closely with our findings. This body of work highlights the potential of localized, participatory energy governance to enhance resilience, affordability, and sustainability at the regional level. Our empirical evidence of spatial variation in EP supports the notion that embedding place-based, community-driven energy solutions within regional policy frameworks can effectively address inequities and improve energy access.
While the related EU directives, like the revised EPBD and EED, strengthen Europe’s decarbonization pathway, their implementation may initially burden financially constrained households due to renovation and equipment costs. Within Sen’s capability framework, equitable access to affordable, efficient energy is essential to sustain genuine freedom of choice and social participation. Therefore, policy design must include compensation mechanisms and targeted support, such as social housing renovation funds, to prevent green investments from reinforcing existing inequalities.
Despite the valuable insights that led to targeted proposals for European energy policy, the study faces several limitations. First, the use of national average prices for all regions introduces uncertainty, as localized variations in tariffs, subsidies, or fuel accessibility are not captured. Second, the assumption-based allocation of energy consumption in regions lacking disaggregated data may affect the precision of results. Furthermore, the use of average household income rather than income distribution metrics may underestimate the impact of energy costs on the lowest-income groups. Finally, the methodology captures energy poverty in terms of affordability but does not address other dimensions, such as access, quality, or thermal comfort, which are essential for a multidimensional understanding of energy poverty.
Regardless of these limitations, the framework lays the groundwork for further development. Future research should aim to incorporate additional indicators (e.g., consensual or composite) to complement expenditure-based metrics, explore temporal vulnerability trends through seasonal data, and refine regional allocation models using more granular datasets or household surveys when available. Expanding this approach to other EU countries with similar data constraints could also enable comparative assessments and support the development of a harmonized European strategy on energy poverty.

6. Conclusions

This study developed and applied a regionally scalable methodology for assessing energy poverty in Greece based on the actual TPI, using publicly available data. The findings indicate that, although the national TPI has remained below the commonly accepted energy poverty threshold across the 2012–2023 period, significant disparities exist among regions. Vulnerable regions in Northern and Western Greece consistently exhibit high TPI values, driven by climatic severity and lower average incomes, while Southern Island regions show much lower energy burdens.
These findings highlight the urgent need for geographically targeted policy actions. Policymakers should prioritize building renovation programs, subsidy schemes, and energy affordability strategies in regions identified as most vulnerable by the presented data. At the same time, the open-access approach used in this research demonstrates that the data-driven, evidence-based targeting of interventions is feasible and can contribute to a more socially equitable energy transition. Through the alignment of policy recommendations with the empirical identification of high-risk areas, our results provide actionable input to EU and national strategies on energy poverty, ensuring that support is effectively directed where most needed.
The research highlights the value of integrating simplified models with open-access datasets to support timely, cost-efficient assessments at a territorial level, especially in data-scarce contexts. The methodological choices, despite their limitations, offer a replicable template for other countries and regions aiming to monitor energy poverty and inform equitable renovation strategies in alignment with EU energy and climate goals. By linking energy poverty assessment to policy design, this work supports the broader objective of embedding social equity into energy transition. It also points to the importance of enhancing data availability and granularity at the regional level to foster more inclusive and evidence-based policymaking.

Author Contributions

Conceptualization, A.X., F.D.M. and E.K.; methodology, A.X., F.D.M. and E.K.; validation, H.D.; formal analysis, A.X.; investigation, A.X., F.D.M. and E.K.; resources, A.X., F.D.M. and E.K.; writing—original draft preparation, A.X.; writing—review and editing, A.X., F.D.M., E.K. and H.D.; supervision, F.D.M., E.K. and H.D. All authors have read and agreed to the published version of the manuscript.

Funding

Part of this research is based on the HORIZON EUROPE project ENPOWER under grant agreement No. 101096354. The sole responsibility for the content of this paper lies with the authors. The paper does not necessarily reflect the opinion of the European Commission.

Institutional Review Board Statement

Not applicable.

Informed Consent Statement

Not applicable.

Data Availability Statement

The original contributions presented in this study are included in the article. Further inquiries can be directed to the corresponding author.

Acknowledgments

We thank the academic editors and anonymous reviewers for their suggestions and valuable comments.

Conflicts of Interest

The authors declare no conflicts of interest.

References

  1. Household Air Pollution. Available online: https://www.who.int/news-room/fact-sheets/detail/household-air-pollution-and-health (accessed on 15 July 2025).
  2. Tracking SDG7: The Energy Progress Report 2025; IEA: Paris, France, 2025.
  3. Salman, M.; Zha, D.; Wang, G. Assessment of Energy Poverty Convergence: A Global Analysis. Energy 2022, 255, 124579. [Google Scholar] [CrossRef]
  4. Reddy, A.K.N. Energy and Social Issues. World Energy Assessment: Energy and the Challenge of Sustainability; United Nations Development Programme: New York, NY, USA, 2000. [Google Scholar]
  5. Lami, I.M.; De Franco, A.; Moroni, S. Values, Indicators and Policies. A Reflection Starting from Sustainability Issues and the COVID-19 Pandemic. Valori Valutazioni 2023, 2023, 5–16. [Google Scholar] [CrossRef]
  6. Sen, A. Development as a Freedom; Alfred Knopf: New York, NY, USA, 1999. [Google Scholar]
  7. Kanellou, E.; Hinsch, A.; Vorkapić, V.; Torres, A.D.; Konstantopoulos, G.; Matsagkos, N.; Doukas, H. Lessons Learnt and Policy Implications from Implementing the POWERPOOR Approach to Alleviate Energy Poverty. Sustainability 2023, 15, 8854. [Google Scholar] [CrossRef]
  8. Halkos, G.E.; Aslanidis, P.S.C. Addressing Multidimensional Energy Poverty Implications on Achieving Sustainable Development. Energies 2023, 16, 3805. [Google Scholar] [CrossRef]
  9. Grzybowska, U.; Wojewódzka-Wiewiórska, A.; Vaznonienė, G.; Dudek, H. Households Vulnerable to Energy Poverty in the Visegrad Group Countries: An Analysis of Socio-Economic Factors Using a Machine Learning Approach. Energies 2024, 17, 6310. [Google Scholar] [CrossRef]
  10. Ruiz-Rivas, U.; Martínez-Crespo, J.; Chinchilla-Sánchez, M. Assessment of Energy Poverty and Alleviation Strategies in the Global South. Energies 2024, 17, 3224. [Google Scholar] [CrossRef]
  11. Kuzior, A.; Kotowicz, J.; Lyulyov, O.; Kryk, B.; Guzowska, M.K. Assessing the Level of Energy Poverty Using a Synthetic Multidimensional Energy Poverty Index in EU Countries. Energies 2023, 16, 1333. [Google Scholar] [CrossRef]
  12. Hu, J.-L.; Damigos, D.; Mirasgedis, S.; Wojewódzka-Wiewiórska, A.; Dudek, H.; Ostasiewicz, K. Household Energy Poverty in European Union Countries: A Comparative Analysis Based on Objective and Subjective Indicators. Energies 2024, 17, 4889. [Google Scholar] [CrossRef]
  13. Arsenopoulos, A.; Marinakis, V.; Koasidis, K.; Stavrakaki, A.; Psarras, J. Assessing Resilience to Energy Poverty in Europe through a Multi-Criteria Analysis Framework. Sustainability 2020, 12, 4899. [Google Scholar] [CrossRef]
  14. Arsenopoulos, A.; Sarmas, E.; Stavrakaki, A.; Giannouli, I.; Psarras, J. A Data-Driven Decision Support Tool at the Service of Energy Suppliers and Utilities for Tackling Energy Poverty: A Case Study in Greece. In Proceedings of the IISA 2021—12th International Conference on Information, Intelligence, Systems and Applications, Crete, Greece, 12–14 July 2021. [Google Scholar] [CrossRef]
  15. Sarafidis, Y.; Mirasgedis, S.; Gakis, N.; Kalfountzou, E.; Kapetanakis, D.; Georgopoulou, E.; Tourkolias, C.; Damigos, D. Analyzing Energy Poverty and Its Determinants in Greece: Implications for Policy. Sustainability 2025, 17, 5645. [Google Scholar] [CrossRef]
  16. Fragkos, P.; Kanellou, E.; Konstantopoulos, G.; Nikas, A.; Fragkiadakis, K.; Filipidou, F.; Fotiou, T.; Doukas, H. Energy Poverty and Just Transformation in Greece. In Vulnerable Households in the Energy Transition. Studies in Energy, Resource and Environmental Economics; Springer: Cham, Switzerland, 2023; pp. 235–267. [Google Scholar] [CrossRef]
  17. Kalfountzou, E.; Papada, L.; Damigos, D.; Degiannakis, S. Predicting Energy Poverty in Greece through Statistical Data Analysis. Int. J. Sustain. Energy 2022, 41, 1605–1622. [Google Scholar] [CrossRef]
  18. Halkos, G.; Gkampoura, E.C. Assessing Fossil Fuels and Renewables’ Impact on Energy Poverty Conditions in Europe. Energies 2023, 16, 560. [Google Scholar] [CrossRef]
  19. Arsenopoulos, A.; Stavrakas, V.; Tzani, D.; Birbakos, A.; Konstantopoulos, G.; Giannouli, I.; Flamos, A.; Psarras, J. Identification of Residential Energy Poverty: Placing Utilities at the Heart of the Problem. Energy Sources Part B Econ. Plan. Policy 2025, 20. [Google Scholar] [CrossRef]
  20. Health Community Calls for Urgent Action for Clean Air Ahead of WHO Conference. Available online: https://www.who.int/news/item/27-01-2025-health-community-calls-for-urgent-action-for-clean-air-ahead-of-who-conference (accessed on 15 July 2025).
  21. Home|Sustainable Energy for All. Available online: https://www.seforall.org/ (accessed on 15 July 2025).
  22. THE 17 GOALS|Sustainable Development. Available online: https://sdgs.un.org/goals (accessed on 15 July 2025).
  23. Moving the Needle on Clean Cooking for All. Available online: https://www.worldbank.org/en/results/2023/01/19/moving-the-needle-on-clean-cooking-for-all (accessed on 15 July 2025).
  24. United Nations Millennium Development Goals. Available online: https://www.un.org/millenniumgoals/ (accessed on 15 July 2025).
  25. Lakatos, E.; Arsenopoulos, A. Investigating EU Financial Instruments to Tackle Energy Poverty in Households: A SWOT Analysis. Energy Sources Part. B Econ. Plan. Policy 2019, 14, 235–253. [Google Scholar] [CrossRef]
  26. Directive—2003/54—EN—EUR-Lex. Available online: https://eur-lex.europa.eu/eli/dir/2003/54/oj/eng (accessed on 15 July 2025).
  27. Directive—2003/55—EN—EUR-Lex. Available online: https://eur-lex.europa.eu/eli/dir/2003/55/oj/eng (accessed on 15 July 2025).
  28. Regulation-714/2009-EN-EUR-Lex. Available online: https://eur-lex.europa.eu/eli/reg/2009/714/oj/eng (accessed on 31 October 2025).
  29. Electricity Market Design. Available online: https://energy.ec.europa.eu/topics/markets-and-consumers/electricity-market-design_en (accessed on 15 July 2025).
  30. Governance of the Internal Energy Market. Available online: https://energy.ec.europa.eu/topics/markets-and-consumers/governance-internal-energy-market_en (accessed on 15 July 2025).
  31. Energy Poverty and Vulnerable Consumers Coordination Group|EUR-Lex. Available online: https://eur-lex.europa.eu/EN/legal-content/summary/energy-poverty-and-vulnerable-consumers-coordination-group.html (accessed on 15 July 2025).
  32. Energy Union—European Commission. Available online: https://energy.ec.europa.eu/strategy/energy-union_en (accessed on 15 July 2025).
  33. EESC Homepage|EESC. Available online: https://www.eesc.europa.eu/en (accessed on 15 July 2025).
  34. Clean Energy Package|Www.Acer.Europa.Eu. Available online: https://www.acer.europa.eu/electricity/about-electricity/clean-energy-package (accessed on 15 July 2025).
  35. Observatory|Energy Poverty Advisory Hub. Available online: https://energy-poverty.ec.europa.eu/observatory (accessed on 15 July 2025).
  36. Directive—2012/27—EN—EUR-Lex. Available online: https://eur-lex.europa.eu/eli/dir/2012/27/oj/eng (accessed on 16 July 2025).
  37. Directive—2010/31—EN—EUR-Lex. Available online: https://eur-lex.europa.eu/eli/dir/2010/31/oj/eng (accessed on 16 July 2025).
  38. Directive—2002/91—EN—EUR-Lex. Available online: https://eur-lex.europa.eu/eli/dir/2002/91/oj/eng (accessed on 16 July 2025).
  39. Directive—2018/844—EN—EUR-Lex. Available online: https://eur-lex.europa.eu/eli/dir/2018/844/oj/eng (accessed on 16 July 2025).
  40. Directive—2023/1791—EN—EUR-Lex. Available online: https://eur-lex.europa.eu/eli/dir/2023/1791/oj/eng (accessed on 16 July 2025).
  41. National Building Renovation Plans. Available online: https://energy.ec.europa.eu/topics/energy-efficiency/energy-performance-buildings/national-building-renovation-plans_en (accessed on 16 July 2025).
  42. Directive—EU—2024/1275—EN—EUR-Lex. Available online: https://eur-lex.europa.eu/eli/dir/2024/1275/oj/eng (accessed on 16 July 2025).
  43. The European Green Deal—European Commission. Available online: https://commission.europa.eu/strategy-and-policy/priorities-2019-2024/european-green-deal_en (accessed on 16 July 2025).
  44. Fit for 55—Consilium. Available online: https://www.consilium.europa.eu/en/policies/fit-for-55/ (accessed on 16 July 2025).
  45. EU Statistics on Income and Living Conditions—Microdata—Eurostat. Available online: https://ec.europa.eu/eurostat/web/microdata/european-union-statistics-on-income-and-living-conditions (accessed on 16 July 2025).
  46. Rademaekers, K.; Yearwood, J.; Ferreira, A.; Pye, S.; Hamilton, I.; Agnolucci, P.; Grover, D.; Karásek, J.; Anisimova, N. Selecting Indicators to Measure Energy Poverty; European Commission: Brussels, Belgium, 2016. [Google Scholar]
  47. Alkire, S.; Foster, J. Counting and Multidimensional Poverty Measurement. J. Public Econ. 2011, 95, 476–487. [Google Scholar] [CrossRef]
  48. Siksnelyte-Butkiene, I.; Streimikiene, D.; Lekavicius, V.; Balezentis, T. Energy Poverty Indicators: A Systematic Literature Review and Comprehensive Analysis of Integrity. Sustain. Cities Soc. 2021, 67, 102756. [Google Scholar] [CrossRef]
  49. Gouveia, J.P.; Palma, P.; Simoes, S.G. Energy Poverty Vulnerability Index: A Multidimensional Tool to Identify Hotspots for Local Action. Energy Rep. 2019, 5, 187–201. [Google Scholar] [CrossRef]
  50. Papada, L.; Kaliampakos, D. Being Forced to Skimp on Energy Needs: A New Look at Energy Poverty in Greece. Energy Res. Soc. Sci. 2020, 64, 101450. [Google Scholar] [CrossRef]
  51. Boardman, B. Fuel Poverty: From Cold Homes to Affordable Warmth; Belhaven Press: London, UK, 1991; p. 267. [Google Scholar]
  52. Henderson, J.; Hart, J. BREDEM 2012-A Technical Description of the BRE Domestic Energy Model; BRE: Watford, UK, 2013. [Google Scholar]
  53. An Energy Policy for Consumers [SEC(2010)1407]—European Commission. Available online: https://energy.ec.europa.eu/publications/energy-policy-consumers-sec20101407-0_en (accessed on 16 July 2025).
  54. Energy Statistics Data Browser – Data Tools—IEA. Available online: https://www.iea.org/data-and-statistics/data-tools/energy-statistics-data-browser?country=GREECE&fuel=Energy%20consumption&indicator=BiofuelConsBySector (accessed on 16 July 2025).
  55. Final Energy Consumption in Households by Type of Fuel. Available online: https://ec.europa.eu/eurostat/databrowser/view/TEN00125/default/table?lang=en&cat (accessed on 16 July 2025).
  56. Electricity Prices for Household Consumers—Bi-Annual Data (from 2007 Onwards). Available online: https://ec.europa.eu/eurostat/databrowser/view/nrg_pc_204/default/table?lang=en (accessed on 16 July 2025).
  57. Energy Prices and Costs in Europe—European Commission. Available online: https://energy.ec.europa.eu/data-and-analysis/energy-prices-and-costs-europe_en (accessed on 16 July 2025).
  58. Gas Prices for Household Consumers—Bi-Annual Data (from 2007 Onwards). Available online: https://ec.europa.eu/eurostat/databrowser/view/NRG_PC_202__custom_3373713/default/table?lang=en (accessed on 16 July 2025).
  59. Why Have Firewood Prices Skyrocketed?—Γιατί Έχουν Εκτοξευθεί Oι Τιμές Στα Καυσόξυλα—Γεγονότα. Available online: https://gegonota.news/2022/09/05/giati-echoun-ektoxefthei-oi-times-sta-kafsoxyla (accessed on 16 July 2025).
  60. Income of Households by NUTS 2 Region. Available online: https://ec.europa.eu/eurostat/databrowser/view/NAMA_10R_2HHINC/default/table?lang=EN (accessed on 16 July 2025).
  61. Non-Financial Transactions—Annual Data. Available online: https://ec.europa.eu/eurostat/databrowser/view/nasa_10_nf_tr__custom_17565375/default/table (accessed on 23 July 2025).
  62. 2021 Population-Housing Census—ELSTAT. Available online: https://www.statistics.gr/2021-census-pop-hous (accessed on 31 October 2025).
  63. Cooling and Heating Degree Days by NUTS 3 Region—Annual Data. Available online: https://ec.europa.eu/eurostat/databrowser/view/NRG_CHDDR2_A__custom_17565983/default/table (accessed on 24 July 2025).
  64. Sokołowski, M.M.; Visvizi, A. Routledge Handbook of Energy Communities and Smart Cities. In Routledge Handbook of Energy Communities and Smart Cities; Routledge: Abingdon, UK, 2023; pp. 1–314. [Google Scholar] [CrossRef]
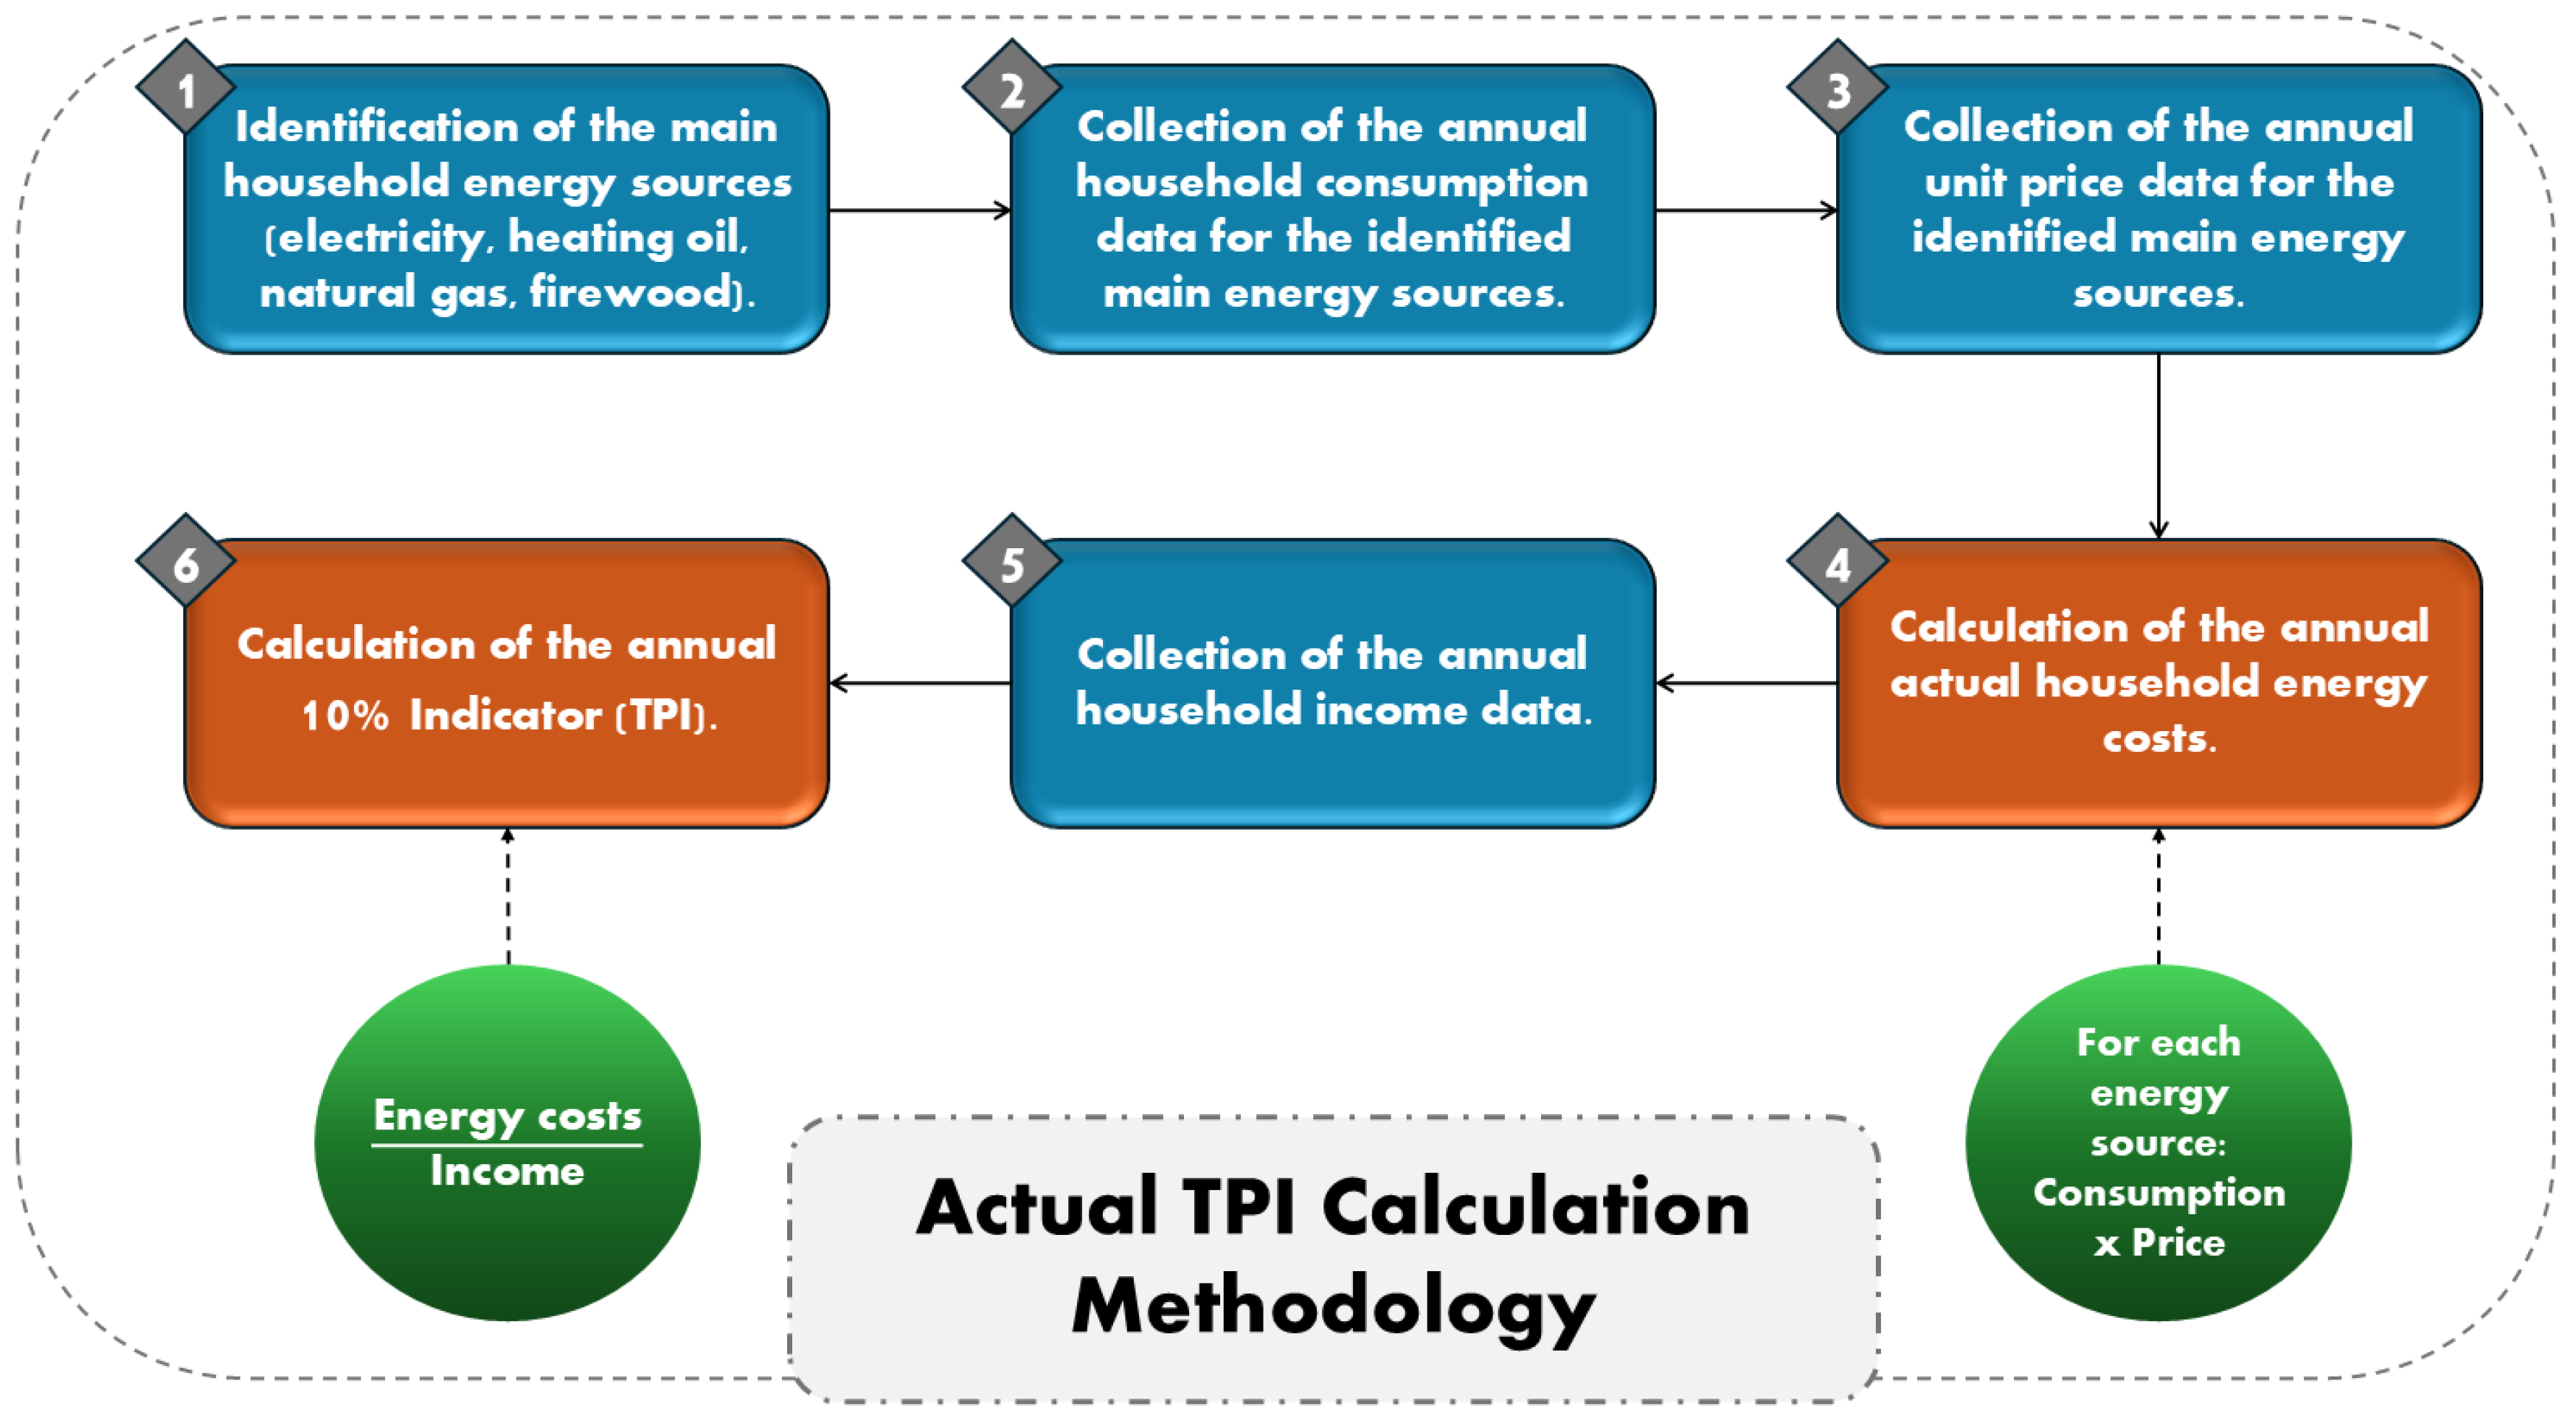
Figure 1. Actual 10% Indicator (TPI) calculation methodological framework.
Energies 18 05787 g001
Figure 2. National TPI values for the period 2012–2023.
Energies 18 05787 g002
Figure 3. Regional TPI values (most vulnerable regions) for the period 2012–2023.
Energies 18 05787 g003
Figure 4. Regional TPI values (least vulnerable regions) for the period 2012–2023.
Energies 18 05787 g004
Table 1. National TPI values for the period 2012–2023.
Year
201220132014201520162017201820192020202120222023
5.744.724.774.954.814.794.364.154.444.275.404.28
Table 2. Regional TPI values for the period 2012–2023.
Year
Region201220132014201520162017201820192020202120222023
Attica4.693.873.954.724.054.063.693.593.703.534.473.49
Central Greece6.275.215.376.355.375.464.984.785.125.036.425.05
Central Macedonia6.845.575.646.625.505.525.164.765.145.046.335.09
Crete5.854.714.485.274.764.613.963.824.263.924.863.78
Eastern Macedonia and Thrace7.816.436.407.336.206.145.775.285.755.647.395.79
Epirus6.435.455.916.815.565.545.064.865.224.946.375.25
Ionian Islands4.834.173.884.463.923.813.252.943.563.283.893.25
North Aegean5.184.584.555.324.774.584.103.794.083.945.083.93
Peloponnese5.754.815.075.834.994.984.564.404.634.455.734.59
South Aegean4.143.542.923.273.603.302.742.463.242.873.342.57
Thessaly6.845.605.796.795.795.875.325.095.515.427.025.59
Western Greece6.415.415.676.575.665.585.064.915.195.066.455.29
Western Macedonia7.625.836.086.985.865.825.535.355.525.487.275.68
Disclaimer/Publisher’s Note: The statements, opinions and data contained in all publications are solely those of the individual author(s) and contributor(s) and not of MDPI and/or the editor(s). MDPI and/or the editor(s) disclaim responsibility for any injury to people or property resulting from any ideas, methods, instructions or products referred to in the content.