1. Introduction
Due to current regulations related to the reduction of fluorinated greenhouse gas emissions [
1,
2,
3,
4], modern power grids are increasingly equipped with modern vacuum-insulated switching equipment. A physical phenomenon that significantly affects the lifespan of vacuum extinguishing chambers is the electric arc that occurs during switching operations when electric current flows through the contact system. Despite the advanced state of knowledge, the physical processes accompanying the initiation, conduction and extinction of the arc remain the subject of intensive research. Of particular importance are the dynamic parameters of the arc, its duration and the energy released during current conduction. These have a key influence on the design of effective protection systems and arc extinguishing systems.
The arc duration, defined as the time interval between its initiation (ignition) and extinction, represents a fundamental parameter for assessing the thermal and mechanical effects of the discharge. Although no general functional formula exists for calculating the arc burning time, the differential definition
is the convention adopted in technical literature [
5] and industrial standards [
6]. This duration depends on multiple factors [
7], including the following:
The type and geometry of the electrodes;
The electrode material and the spacing between them;
The magnitude and waveform of the supply voltage (AC/DC, pulsed);
The type of medium (vacuum, air, , oil, etc.);
The presence and nature of the current flow (current-sustained or self-sustained arc);
External conditions such as pressure, temperature, and gas flow.
From a physical analysis perspective, the arc can be divided into three main phases [
8]:
- 1.
Initiation (pre-breakdown phase)—Covering the ignition period (µs–ms);
- 2.
Arc burning phase—The principal stage of current conduction;
- 3.
Extinction or recovery—Transition back to the insulating state.
Closely related to the arc burning time is the energy released during the discharge, which enables a quantitative assessment of the arc’s impact on power system components. It is defined as the time integral of the instantaneous power (the product of voltage and current) over the arc duration [
9]:
where
E is arc energy, J;
is arc voltage as a function of time, V;
is arc current as a function of time, A; and
are ignition and extinction times, s.
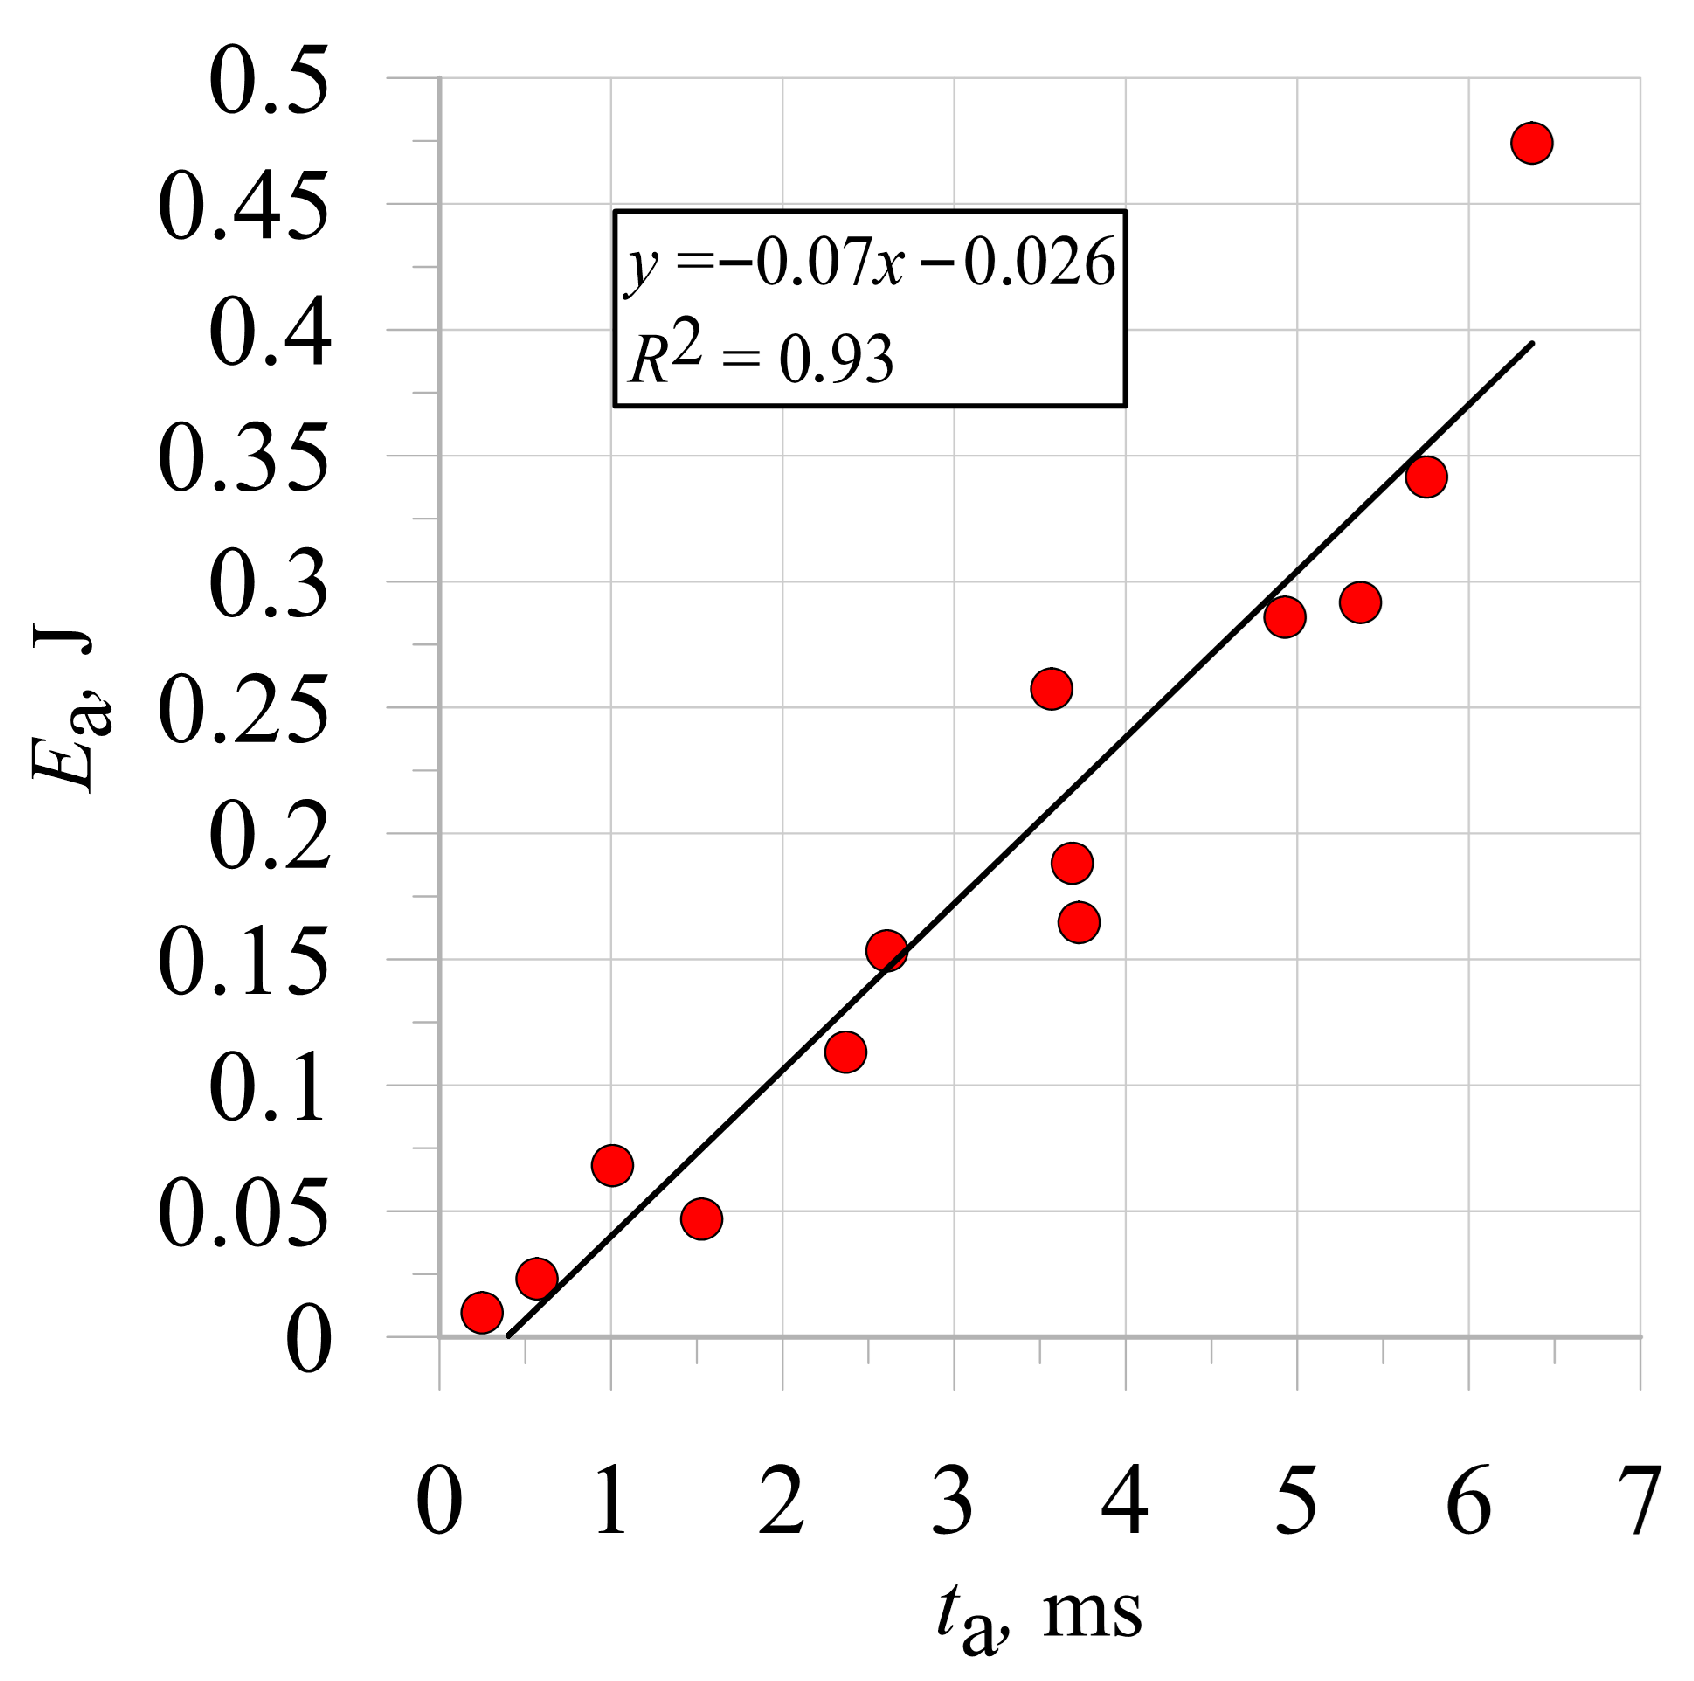
The energy of an electric arc is proportional to its duration. Accordingly, an extended arc burning time increases the total energy released [
5]. An example of the dependence of the energy of a vacuum electric arc on its burning time is shown in
Figure 1.
Conversely, the contact gap distance is inversely proportional—larger spacing reduces the incident energy due to a higher voltage drop [
7]. In practice, this implies that the longer the arc persists, the greater the amount of energy dissipated in the form of heat, light, and electromagnetic waves. High arc energy can result in severe consequences, including component damage, insulation degradation, contact melting, and risks to human safety. Therefore, reducing the arc duration, for instance, by means of fast circuit breakers or optimized arc-quenching systems, has a direct impact on limiting both the thermal and mechanical effects of the arc. Precise determination of the above quantities is essential not only in laboratory research but also in diagnostic analysis of failures occurring under real fault conditions.
The traditional approach to the analysis of arc phenomena relies on recording voltage and current waveforms using digital oscilloscopes, which enables precise determination of the arc duration and calculation of the energy released during the process [
6]. An alternative approach is the application of ultra-high-speed photography and frame-by-frame image analysis. This method allows observation of the evolution of the arc channel’s shape and position over time, making it possible to correlate visual changes with electrical parameters [
8]. Combining oscilloscope measurements with image recording has become an increasingly common strategy in arc studies, offering a more comprehensive insight into the phenomenon [
5].
In experimental research, the arc duration is most often measured from the moment current starts to flow (oscilloscope-based, e.g., when it reaches more than 10% of the peak current) until it decreases below a threshold value. In studies of gaseous discharges, arc durations range from several tens of microseconds (pulsed discharges) up to several tens of milliseconds (low-voltage circuit breakers) [
10].
Contemporary approaches to modeling and analyzing electric arcs increasingly integrate physical and geometrical parameters in order to achieve a realistic description of the phenomenon under dynamic conditions. Martell [
11] introduced the concept of “useful arc power” in EAF furnaces, pointing out that arc length and electrode voltage determine energy efficiency through the contribution of radiation and convection in the heat balance. In contrast, the model proposed by Khakpour et al. [
12] is based on a power balance equation that accounts for radiative losses, turbulence, and energy carried by mass flows. These studies demonstrated that radiative losses may account for as much as 74% of the total arc power, and that accurate representation of the arc channel diameter—made possible by ultra-high-speed imaging—significantly improves the agreement between the model and voltage/current waveforms, particularly near current zero crossings. Such approaches emphasize the importance of precise measurement of arc duration and geometry for determining its energy and predicting extinction and re-ignition behavior.
Framed photography had already been applied in the 1970s to investigate arcs in magnetically controlled channels, measuring arc duration and strength at currents up to 8000 A [
13]. Moreover, studies employing oscilloscopes in discharge pulses (e.g., 8/20 µs at 70 kV) combined with ultra-fast visual recording have made it possible to distinguish the three main phases of arc burning: initiation, steady burning, and extinction, with microsecond-scale temporal resolution [
10].
Ultra-high-speed photography enables a more physical identification of the arc, for example by analyzing the presence of a plasma channel between electrodes in successive frames. This method allows arc identification even before the full current develops, and analysis of optical and thermal phenomena accompanying arc discharges. In the study by Rehmet et al. [
14] on three-phase arc plasmas, fast cameras combined with oscilloscopes were used to investigate the dynamic features of the arc. In vacuum studies, simultaneous recording of waveforms and images was employed to distinguish the initial and final phases of the arc and to observe particle motion [
8].
In studies [
15,
16,
17,
18,
19,
20,
21], the focus was placed on analyzing the interactions between plasma and particles in the vacuum arc, with particular attention to their variable behavior such as oscillations and levitation, and the influence of microparticles on the occurrence of restrikes and the insulating properties of vacuum interrupters. Both numerical modeling and experimental investigations were conducted, addressing microparticles, erosion, and discharge development mechanisms. A special role is attributed to metallic particles, which significantly affect arc stability and the effectiveness of arc extinction. Reported effects include enhanced field emission, collisions of microparticles with electrodes, and their motion in the magnetic field. Microparticles generated during discharges may be responsible for late restrikes, causing local enhancement of the electric field and electron emission. The material properties of the contacts, such as the chromium content in CuCr, influence the number and behavior of particles, with higher chromium content reducing microparticle formation. After current interruption, continued microparticle motion has been observed, which can lead to subsequent restrikes. The conclusions from these studies enable the mitigation of the negative impact of particles by improving electrode materials or adjusting device operating parameters, which is crucial for the performance and reliability of vacuum circuit breakers. Understanding these dependencies may enhance insulation effectiveness, extend the lifetime of interrupters, and support the optimization of contact material selection and strategies for failure prevention.
In studies [
22,
23,
24], measurements and analyses of selected parameters of the vacuum arc, such as current intensity, voltage, and energy, were presented, covering both theoretical and experimental approaches. Precise control and analysis of these parameters are crucial for the development and improvement of the efficiency of vacuum circuit breakers. The results can be applied to the development of advanced diagnostic and monitoring methods, which contributes to higher reliability and durability of the equipment. Particularly noteworthy are novel diagnostic techniques and mathematical models that enable a deeper understanding of the vacuum arc burning process, allowing for more accurate investigation of its dynamics and the optimization of device design parameters.
Recent studies in plasma imaging have significantly expanded the possibilities of visual diagnostics of electrical discharges. Shoji et al. [
25] reviewed the application of visible-light cameras in long-pulse plasma discharges, showing how multi-frame image analysis can support the identification of transient and instability events. Pietrzak et al. [
26] analyzed latency and synchronization effects in high-speed imaging systems used for plasma diagnostics, indicating that acquisition accuracy directly affects the reliability of time-dependent measurements. Vincent et al. [
27] demonstrated that in magnetized plasmas, variations in light intensity depend not only on plasma density but also on electron temperature, which must be considered when interpreting optical emission images.
In contrast to these studies, the present work focuses on short-duration vacuum electric arcs and proposes a photographic method enabling precise, time-resolved determination of arc ignition and extinction. The developed approach combines optical and electrical measurements, offering higher temporal accuracy (tens of microseconds) compared with conventional imaging techniques. This integration allows quantitative assessment of arc burning time and detailed analysis of arc channel dynamics under transient conditions typical for switching devices.
The present work introduces an improved procedure for measuring arc burning time, which combines oscilloscope-based methods with advanced ultra-high-speed photographic analysis and robust statistical evaluation. Unlike previous studies, this approach ensures the precise definition of ignition and extinction moments, independent of the interpretation of current or light emission, and allows for the visualization and assessment of dynamic phenomena such as microparticle motion and arc column development. The experimental methodology and its limitations are discussed in detail.
2. Materials and Methods
2.1. Experimental Setup Description
A specialized setup designed for investigating the parameters of vacuum electric arc phenomena is located in the Faculty Laboratory of Switching and Distribution Equipment at the Faculty of Electrical Engineering and Computer Science, Lublin University of Technology.
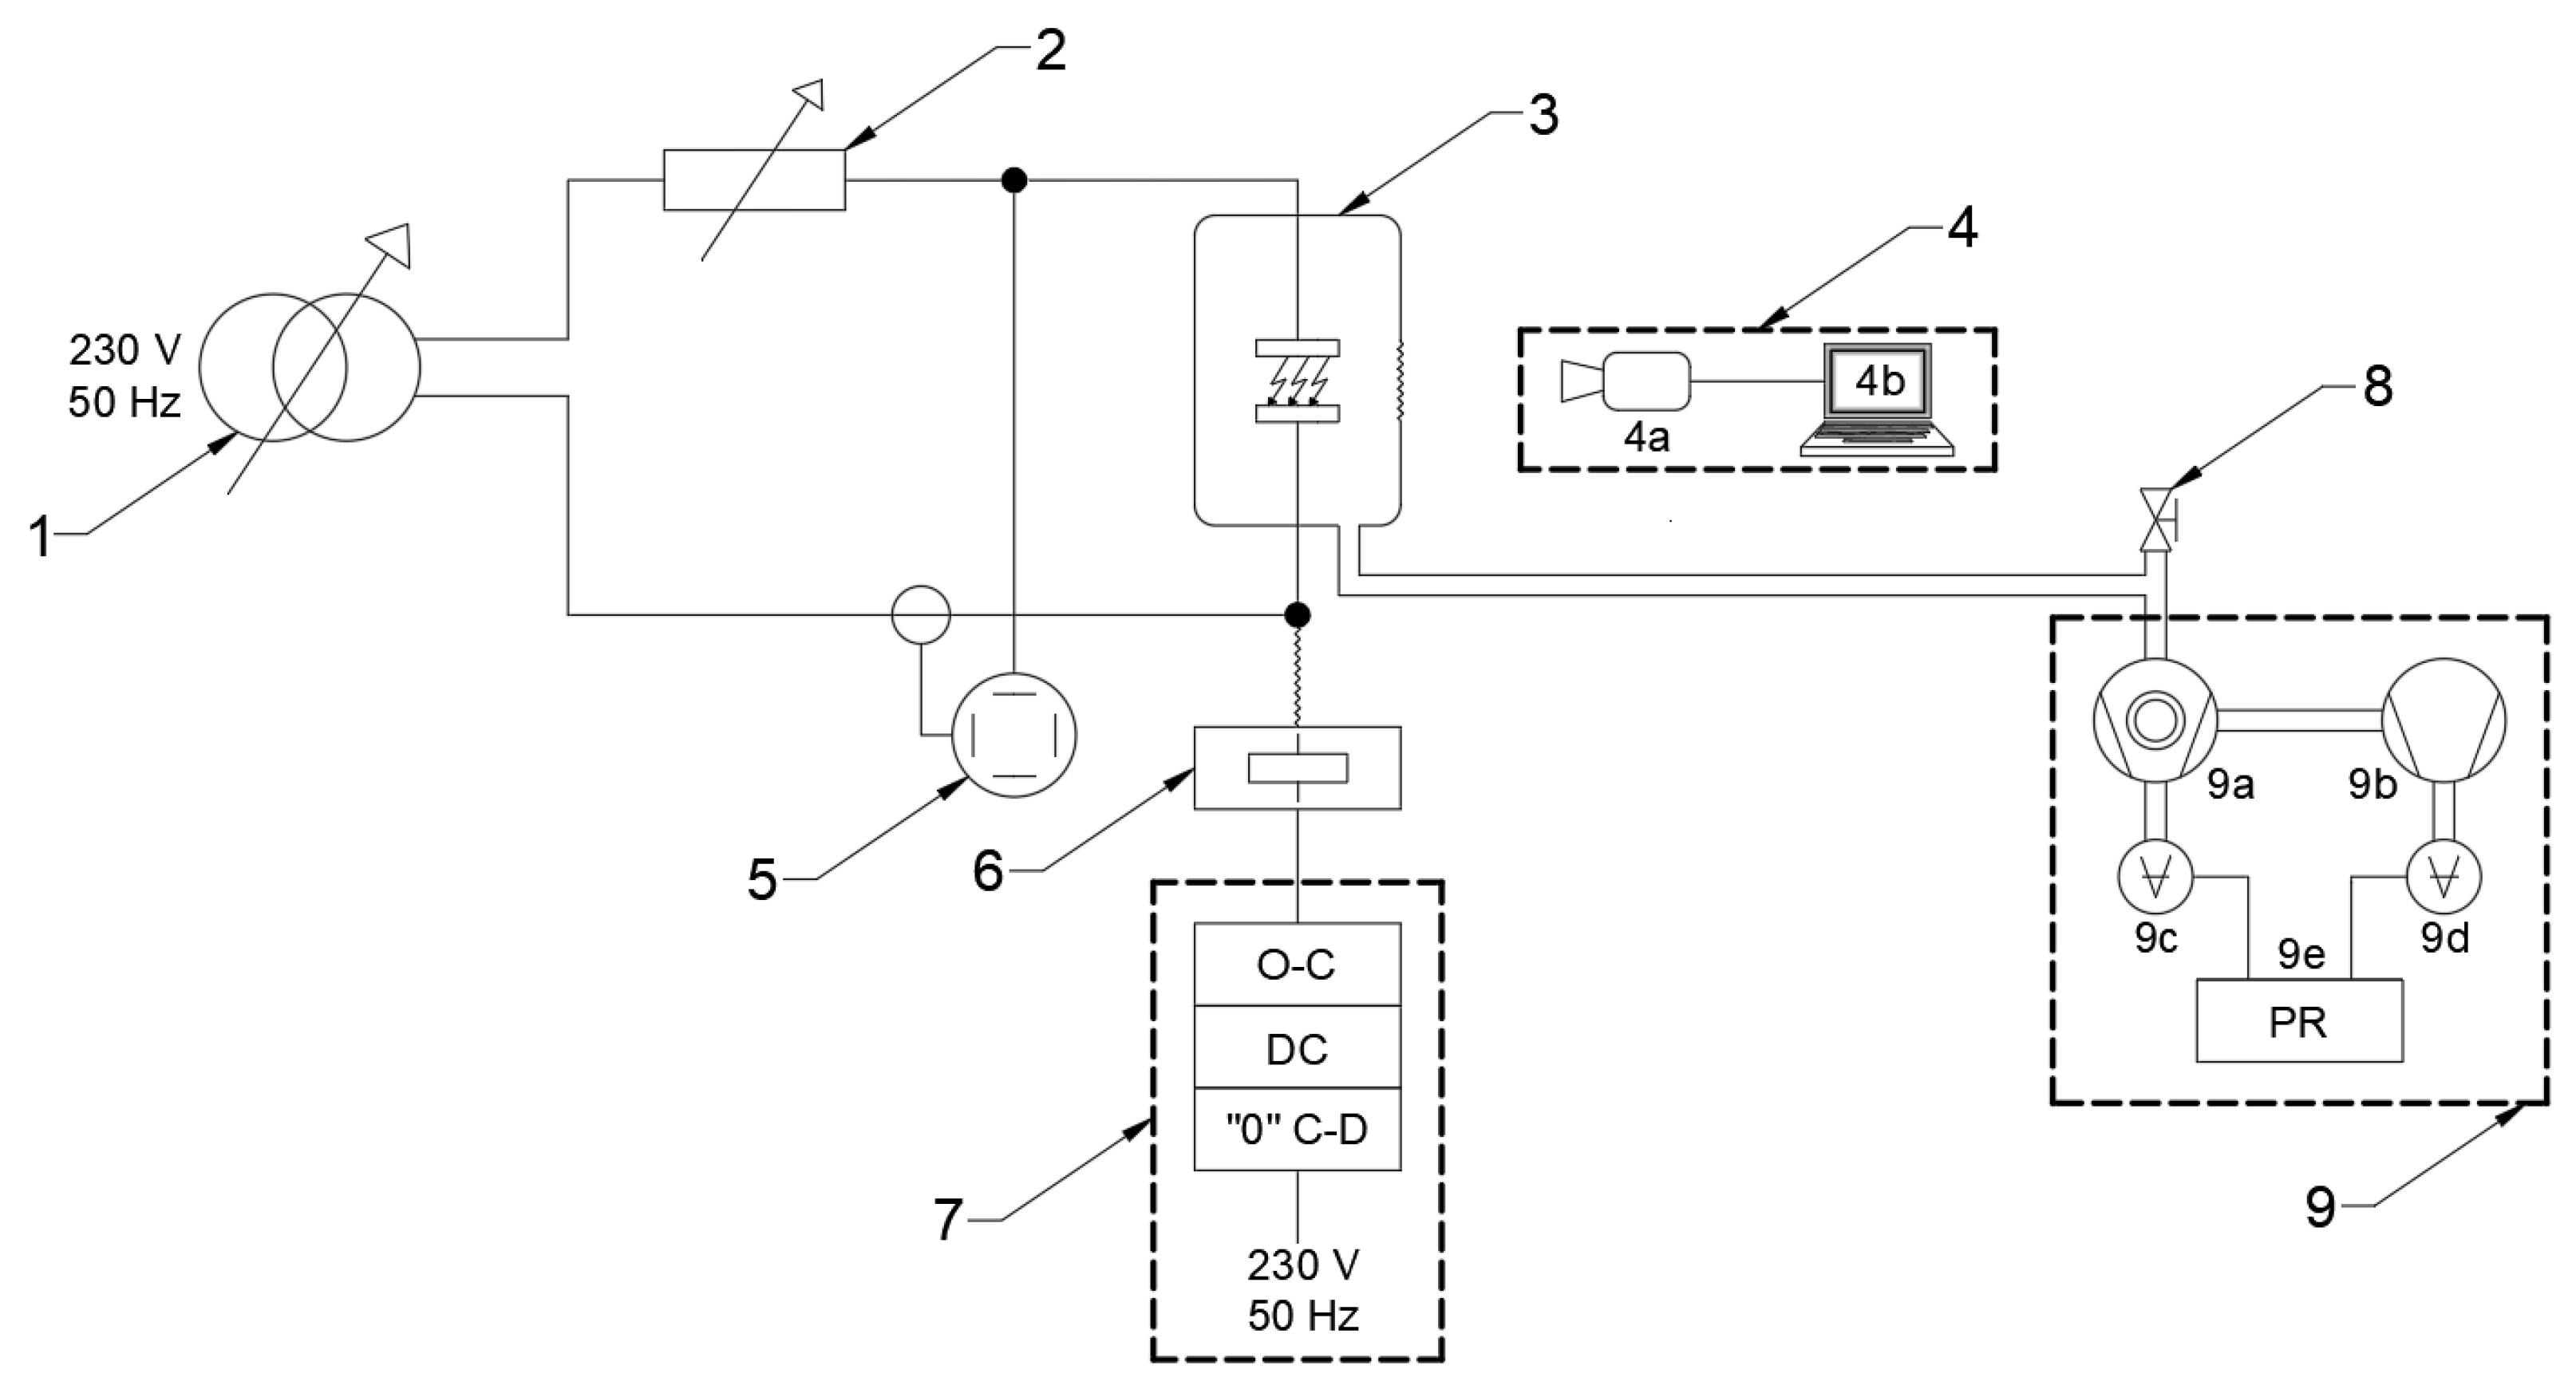
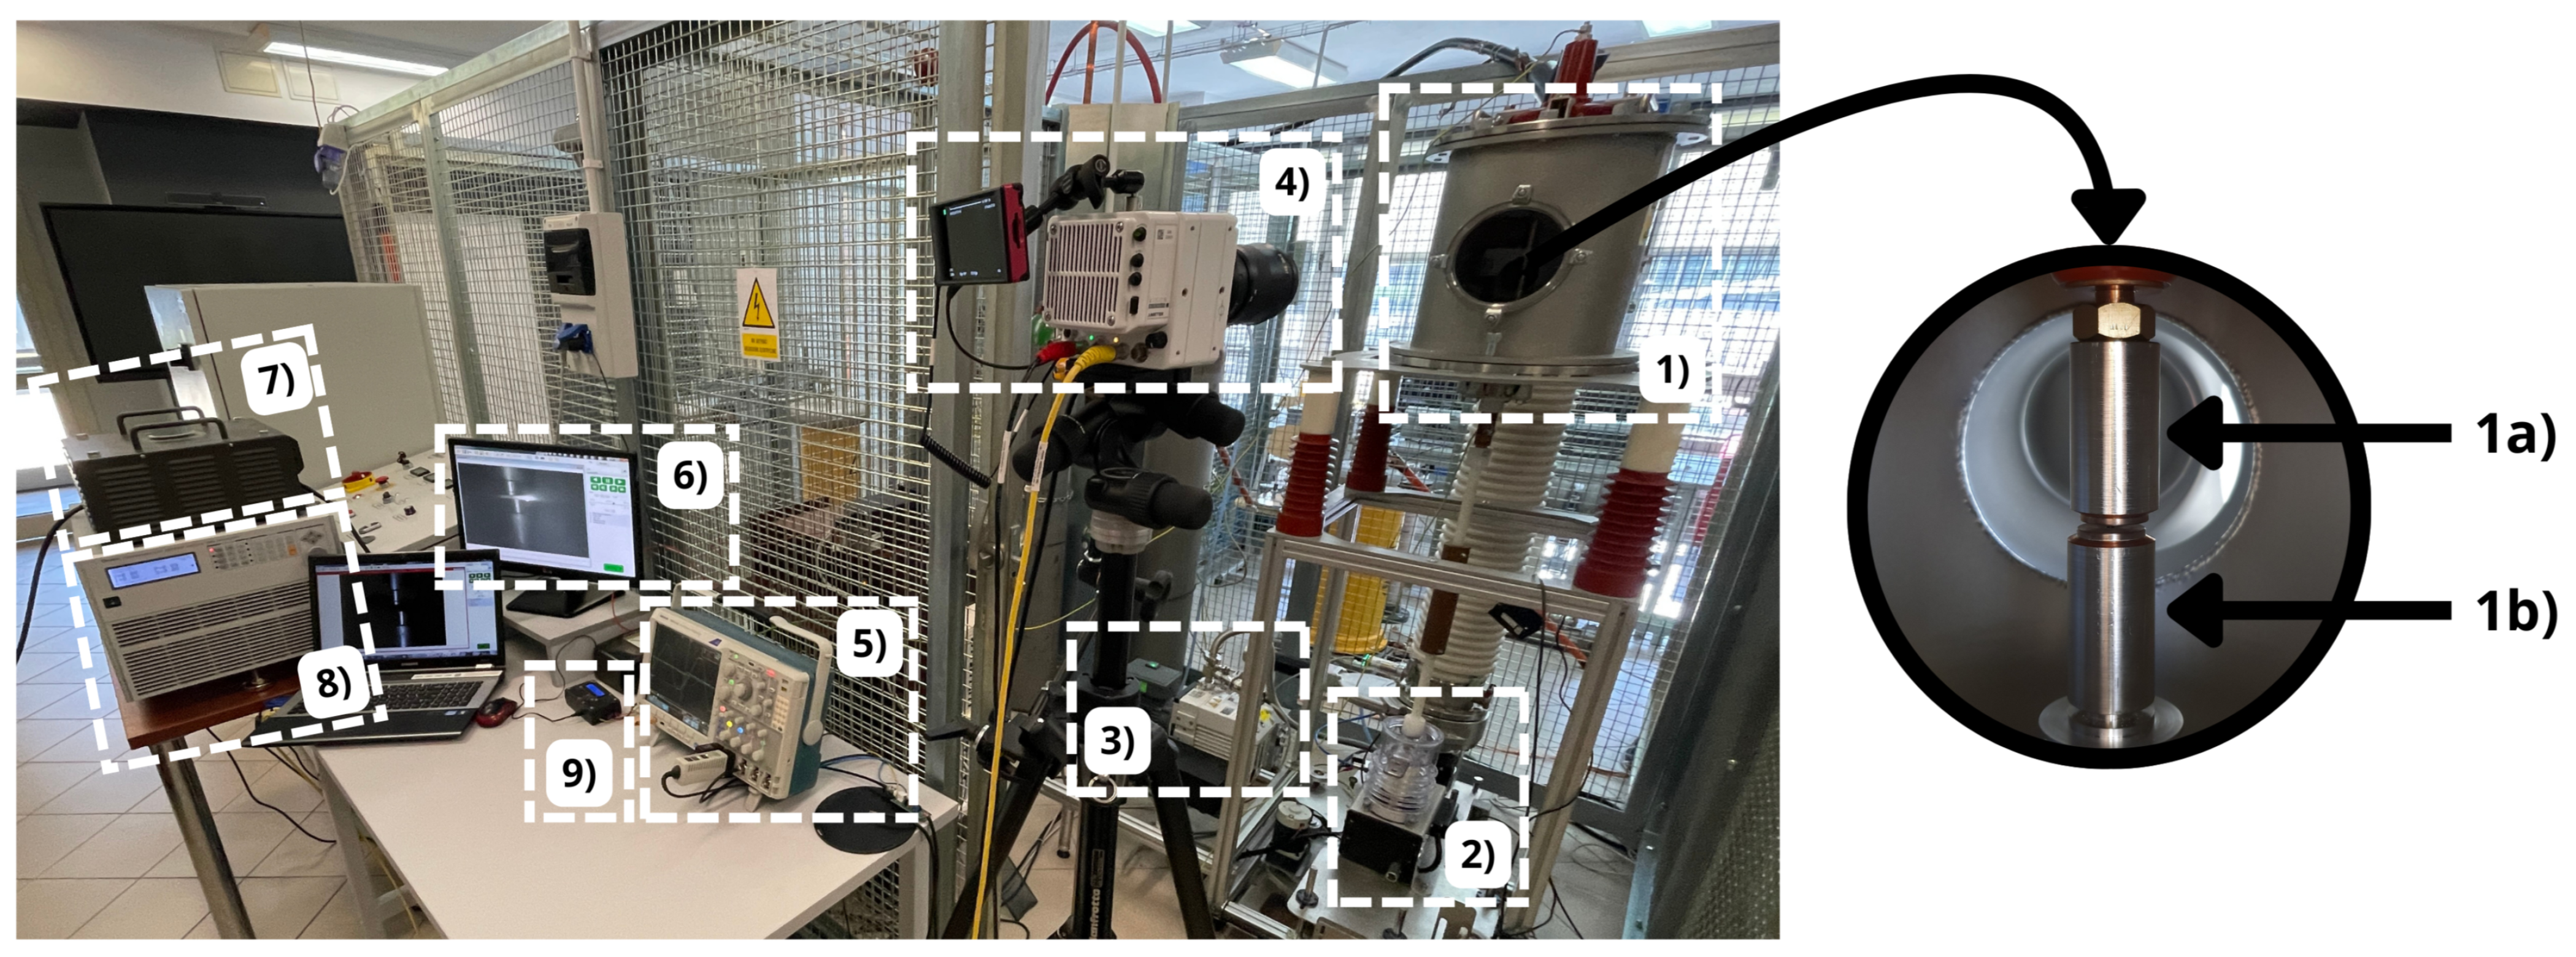
The experimental setup is based on a modular vacuum chamber, which houses a discharge chamber with an installed contact system. This arrangement allows for both electrical strength measurements at a specified contact gap and the measurement of arc parameters during switching operations. A schematic of the setup is shown in
Figure 2, while
Figure 3 presents an actual photograph of the setup components. The laboratory setup includes the following components:
Switching measurement and recording system, comprising an oscilloscope with a set of measurement probes and a photographic analysis system consisting of an ultra-high-speed camera and a computer unit equipped with software for editing and analyzing recordings of electric arc burning. The video analysis was performed using Phantom Camera Cotrol (PCC) 3.1.772.0 software supporting automated frame selection and minimizing subjective assessment of arc ignition and extinction. Image parameters such as EDR and exposure time were standardized. The camera operated at a native resolution of 512 × 384 pixels and a frame rate of 33,000 fps, ensuring repeatable detection capability for events shorter than 1 ms.
Vacuum system, consisting of two pumps: a preliminary oil pump and a turbomolecular vacuum pump, necessary to achieve the desired vacuum environment. The vacuum level was monitored using vacuum gauges connected to a controller.
Experimental setup, consisting of a contact system housed in a modular vacuum chamber. Contact opening was performed by an electromagnetic drive controlled via a dedicated field controller. A delay controller and a zero-crossing detector were used to operate the contacts after a predetermined time, counted from the zero crossing of the sinusoidal current.
Power supply system, consisting of a single-phase autotransformer with a voltage of 230 V and a rated power of 7.8 kVA, which directly supplied the tested discharge chamber in combination with an electronic load rated at 3.6 kW.
For the purpose of investigating switching parameters during open–close operations, the setup was equipped with an electromagnetic drive mounted on a movable platform. To ensure the required vacuum level inside the discharge chamber, a vacuum system was employed consisting of two pumps: an oil pump functioning as a rotary forepump and a turbomolecular pump with magnetic rotor suspension and an integrated controller.
Pressure measurement was carried out using two vacuum gauges connected to a pressure controller, which enabled continuous monitoring of the measured values. The vacuum system was connected to the discharge chamber through a dedicated pumping channel made of insulating material, ensuring safe operation of the sensitive electronic and vacuum equipment.
The delay controller and zero-crossing detector enabled triggering of the contacts from the moment the sinusoidal current in the contact system passed through zero. This system provided adjustability in the range from 0.01 to 99.99 ms.
For measuring current, voltage, and arc burning time between contacts in the chamber during switching operations, an oscilloscope with a set of measurement probes was employed.
A key component of the setup is the photographic system, which consists of a computer with dedicated software and a set comprising a camera, LED illumination, and a suitably selected lens. The camera records images at a rate of 7 Gpx/s, providing 7500 frames per second at a resolution of , up to 700,000 frames per second at a reduced resolution of , or 1 million frames per second in FAST mode. The model offers additional signal outputs, on-camera controls for both tethered and untethered recording, reinforced connectors, and compatibility with interchangeable CFast 2.0 memory media. The unit is equipped with 32 GB of RAM and is powered from a 230 VAC supply. The camera is complemented by additional LED illumination and a dedicated lens.
2.2. Measurement Process
The methodology for measuring the parameters of the vacuum electric arc began with establishing all necessary connections of the laboratory setup, which comprised the experimental system and the associated measuring equipment.
Subsequently, the contact system was mounted in the discharge chamber of the experimental setup. After preparing the setup for measurements, the vacuum system, consisting of the oil forepump and the turbomolecular pump, was used to achieve the required pressure inside the discharge chamber.
The next step involved defining the supply parameters of the setup (current and voltage) and the measurement parameters. Once the setup was prepared and the supply parameters were adjusted, measurements were carried out by performing a contact opening operation, followed by the registration of the electric arc phenomenon and its parameters. After completing the recording with the ultra-high-speed camera, the captured footage was analyzed using the computer unit associated with the system.
The process of preparing the software, whose screenshot is shown in
Figure 4, for analyzing the recording captured with the ultra-high-speed camera began with setting up the workstation, connecting the camera to the computer via an Ethernet cable, and importing the recording into the installed program. The next step involved playing the track and configuring the measurement units in the “Manager” tab to SI units, and adjusting the main parameters such as Extreme Dynamic Range (EDR), Exposure Time, and Post Trigger Frames (PTF). In the “Play” tab, where playback of the recording was possible, the desired frame skipping interval was set. The “Image Tools” tab allowed for detailed correction of image parameters, which influenced the visibility of the recorded object. After configuring the settings and playing the recording, the arc burning time could be determined based on the number of frames in which the phenomenon was registered.
2.3. Measurement Parameters
In order to ensure the repeatability of measurement conditions and to reproduce the specified operating conditions of the vacuum chamber, the operating parameters of the setup were established in accordance with the summary presented in
Table 1.
The selected resolution of pixels represented a compromise between maintaining sufficient image quality and achieving recording capability at several thousand frames per second. This enabled the registration of extremely fast phenomena, including the vacuum electric arc. The image quality was still adequate to observe essential details and changes occurring in the studied object, while the very high frame rate of the recording allowed for accurate determination of parameters such as arc burning time and precise analysis of microparticle motion.
3. Results
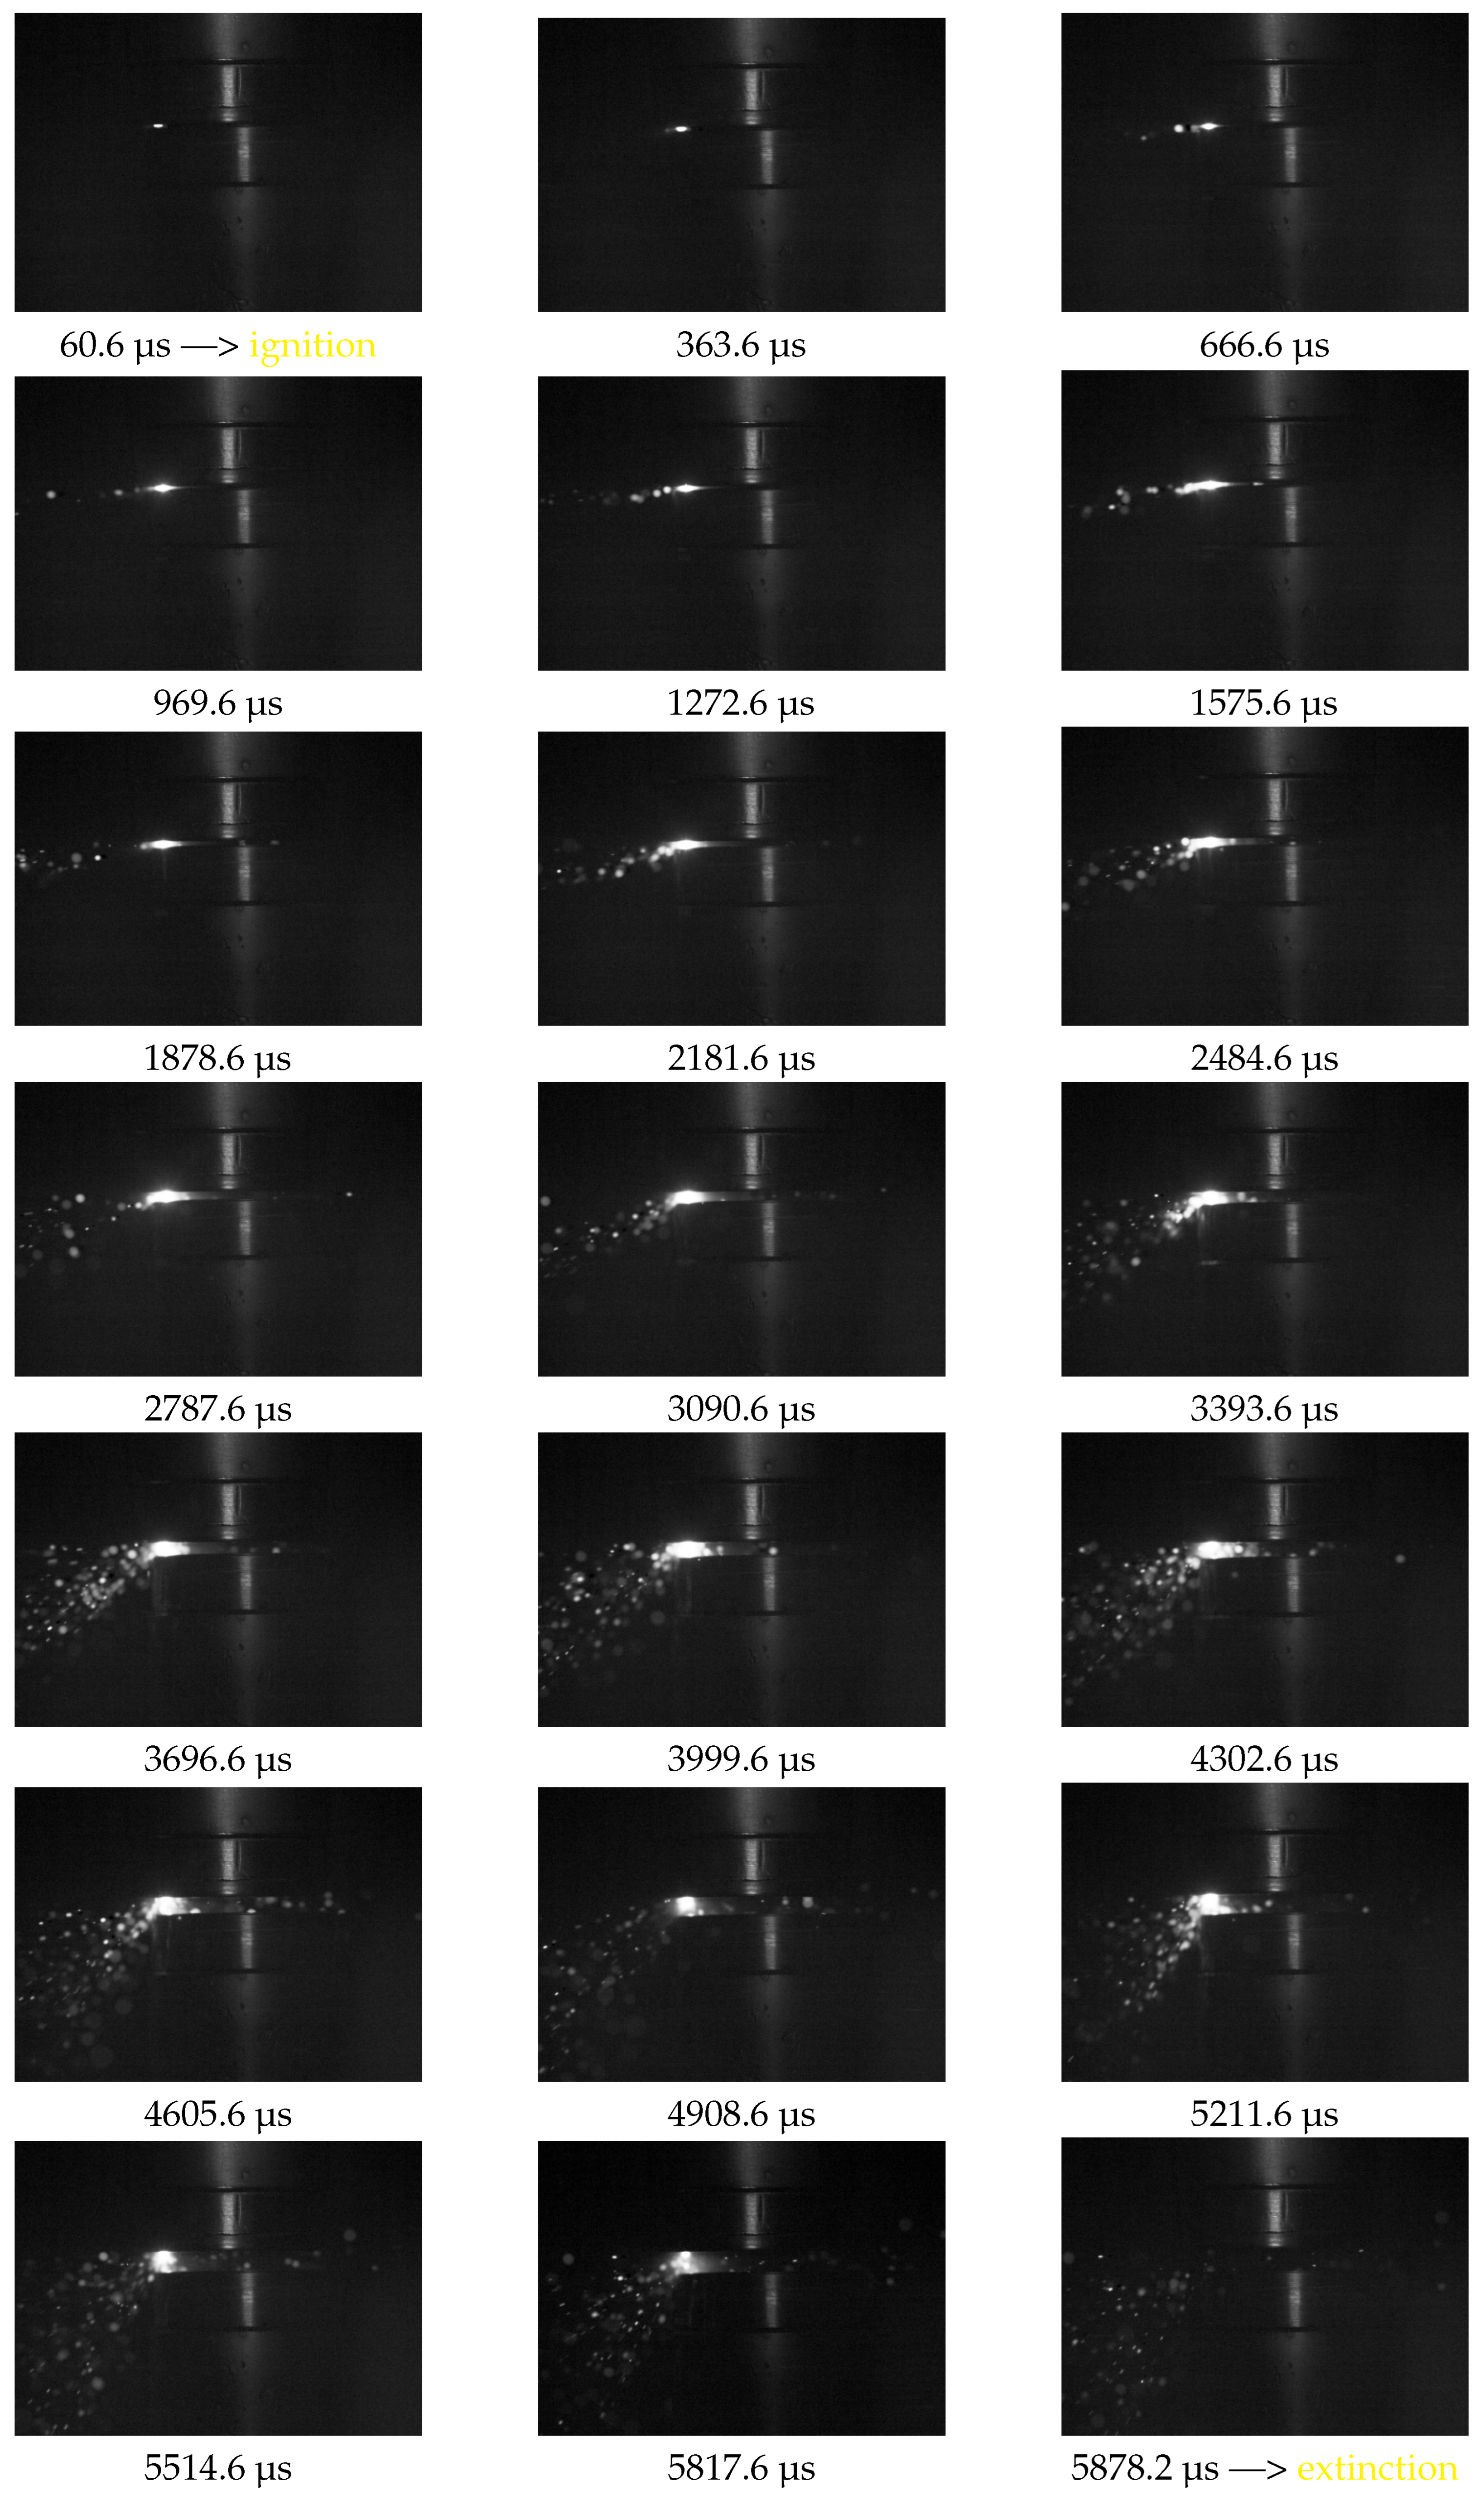
The following figure (
Figure 5) presents the arc burning process recorded using the ultra-high-speed camera for an internal discharge chamber pressure of
. The frames illustrate the progression at intervals of 12 recording frames, which were converted into the corresponding time expressed in microseconds. Video showing vacuum arc burning process has been included in
Supplementary Materials.
Based on the recordings of the contact opening process in the vacuum discharge chamber, a method was developed to calculate the arc burning time using frame-by-frame photographic analysis of the phenomenon. For these calculations, it was necessary to utilize the camera parameters that had been set for the measurements. The key parameter was the image acquisition rate of the camera
, which during the recordings was set to the following:
The duration of a single frame recorded by the ultra-high-speed camera was calculated:
Using the frame-by-frame recording of the contact opening process, the total number of frames covering the entire arc burning process
, that is, ignition, burning, and extinction of the arc, was determined using specialized computer software. Based on these data, the arc burning time
, can be calculated using the following equation:
A key step in applying this method is the accurate determination of the number of frames corresponding to the arc burning process
in the discharge chamber. It was assumed that the arc burning process begins at the moment when light emitted from the region between the contacts becomes visible. The frame in which this is observed is considered the first frame encompassing the entire arc burning process. Conversely, the last frame is defined as the one in which the arc column disappears and the light flash near the contacts vanishes. In subsequent frames, ionized particles from the contact material were still visible, moving in the inter-electrode space and beyond the contacts in the chamber. However, these frames were not included in the interval representing the arc burning process. Based on the estimated number of frames
, the arc burning time was calculated using Equation (
5).
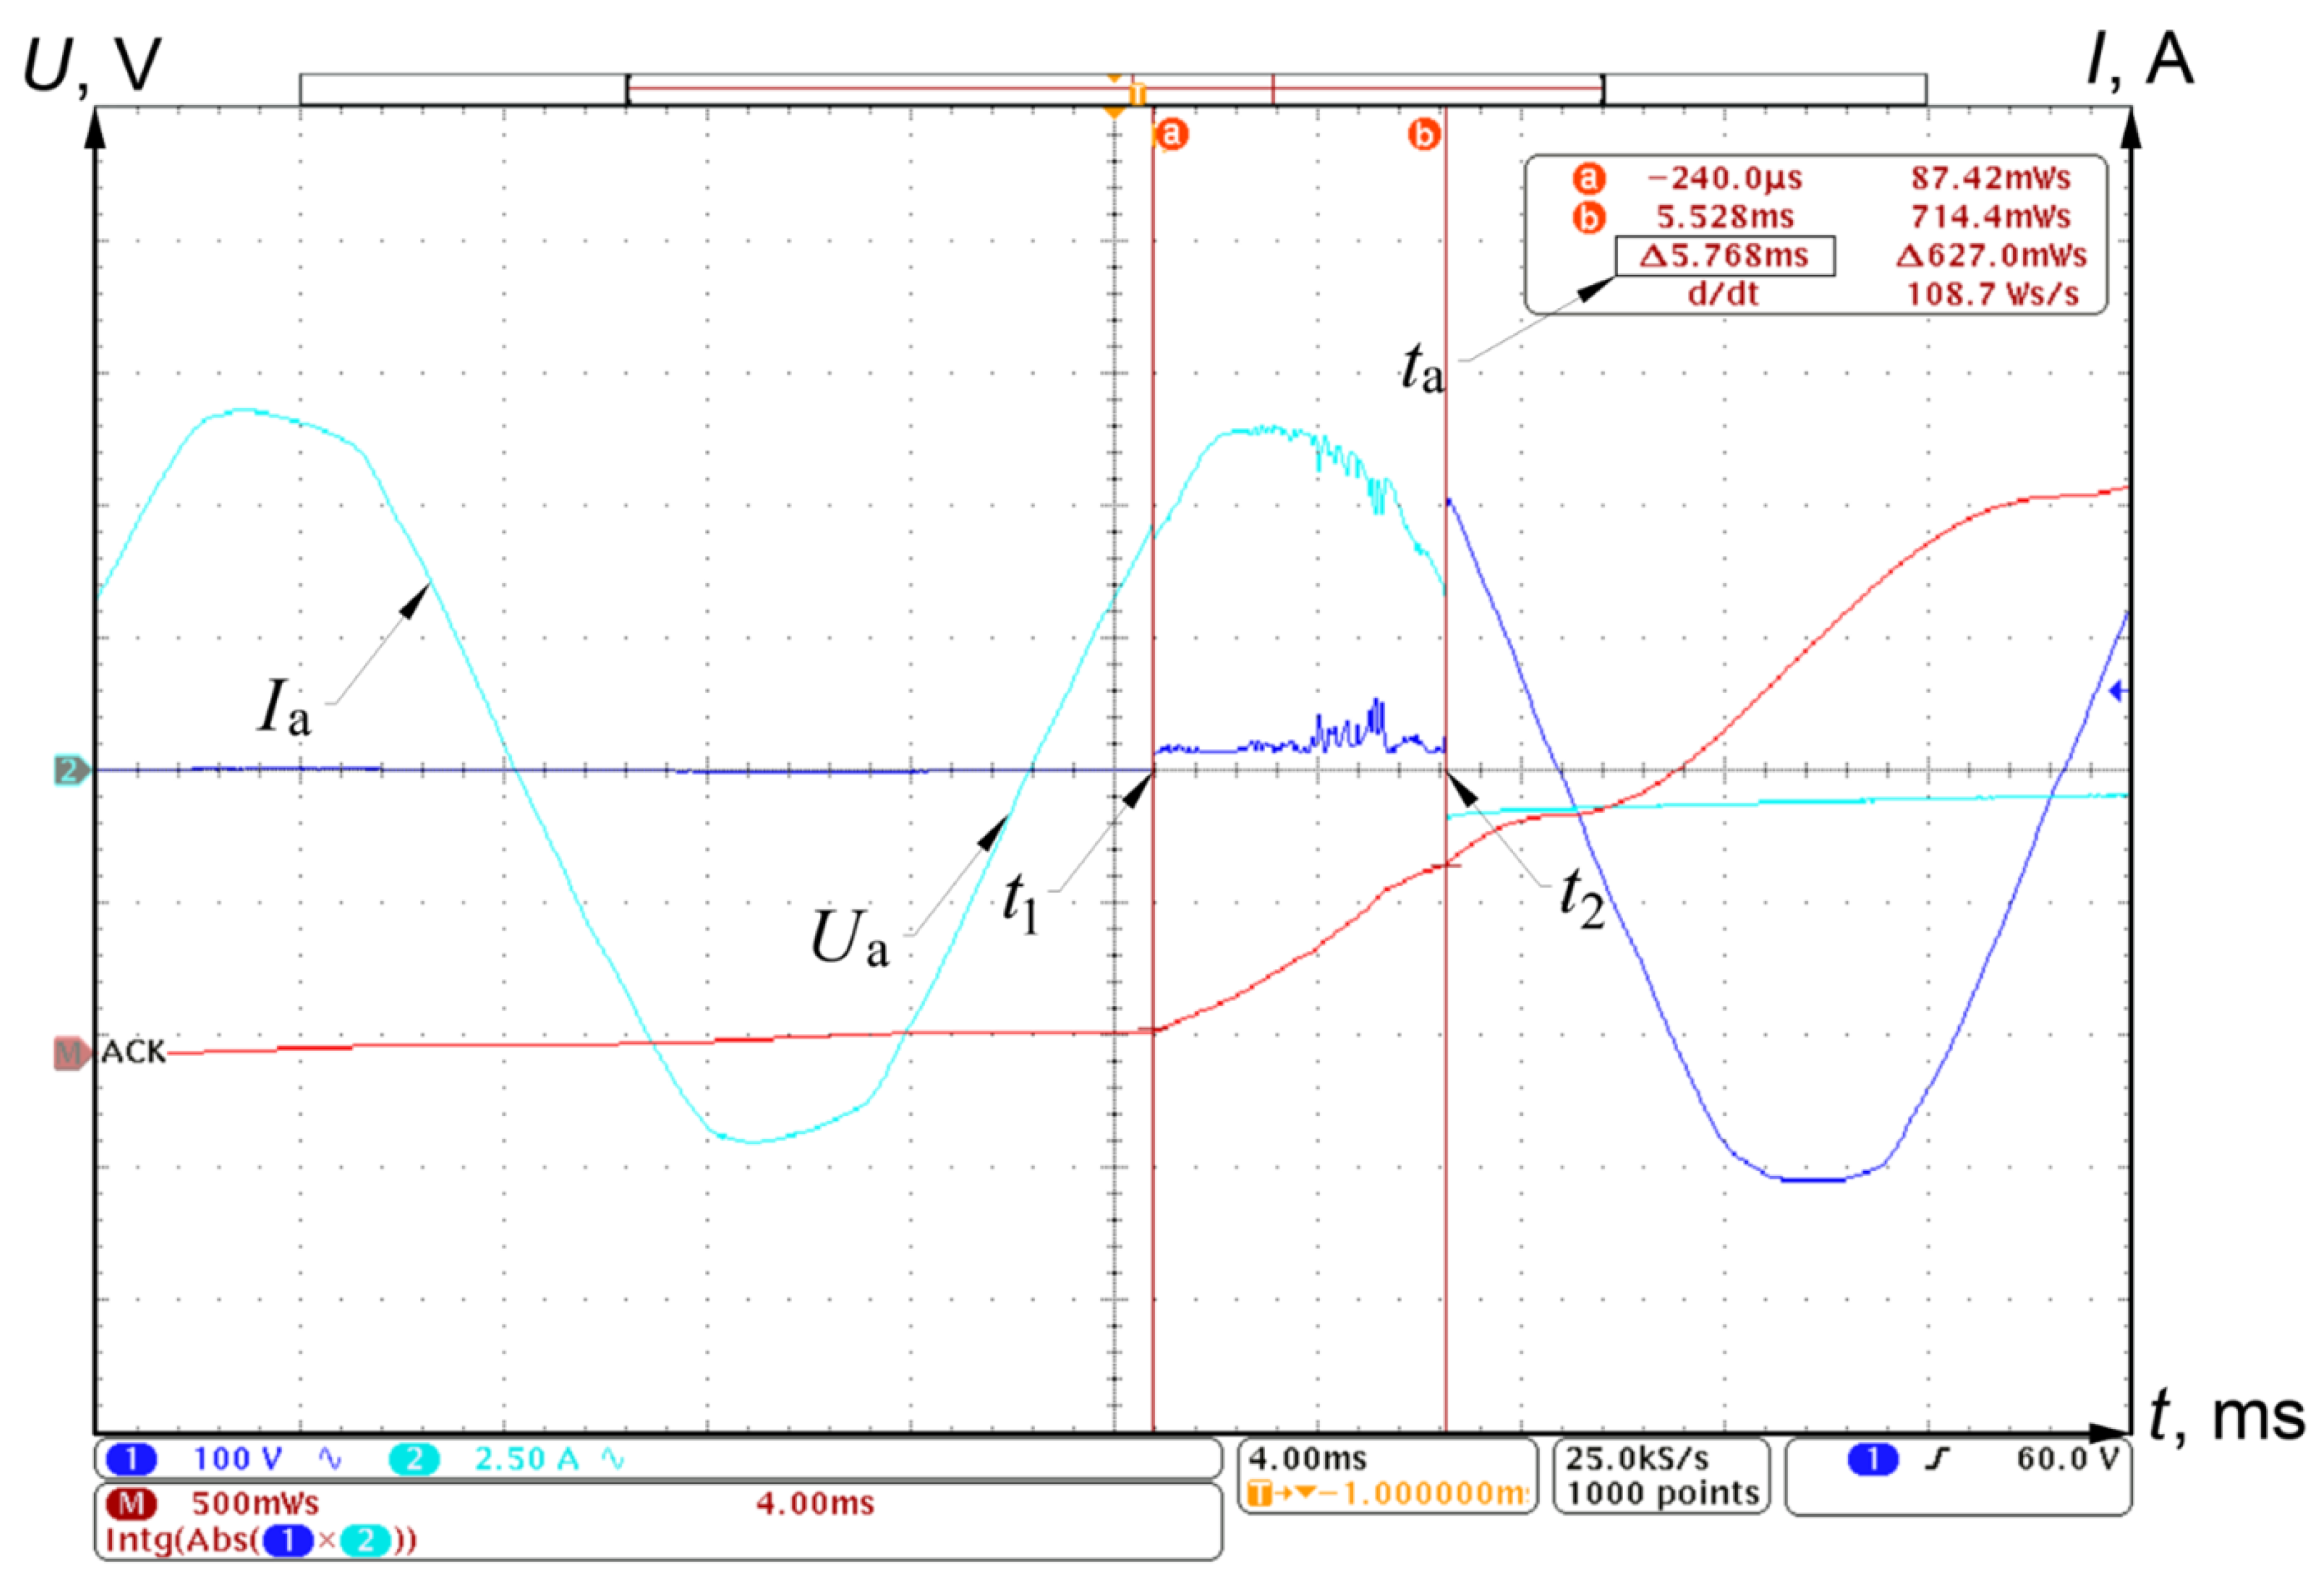
The arc burning time in the analyzed cases was also determined using mathematical functions by analyzing the arc characteristics recorded with an oscilloscope. The measurement limits, denoted by lowercase letters “a” and “b” were set at points
and
, representing the exact ignition time and the moment of arc extinction, respectively. In oscilloscope measurements, the arc ignition moment was defined as the moment at which the appearance of electric arc voltage was recorded. The extinction moment, on the other hand, was defined as the moment at which the voltage between the contacts reached a value equal to the voltage applied to the test system and took on a sinusoidal waveform.
Figure 6 presents the current and voltage characteristics during the arc burning process.
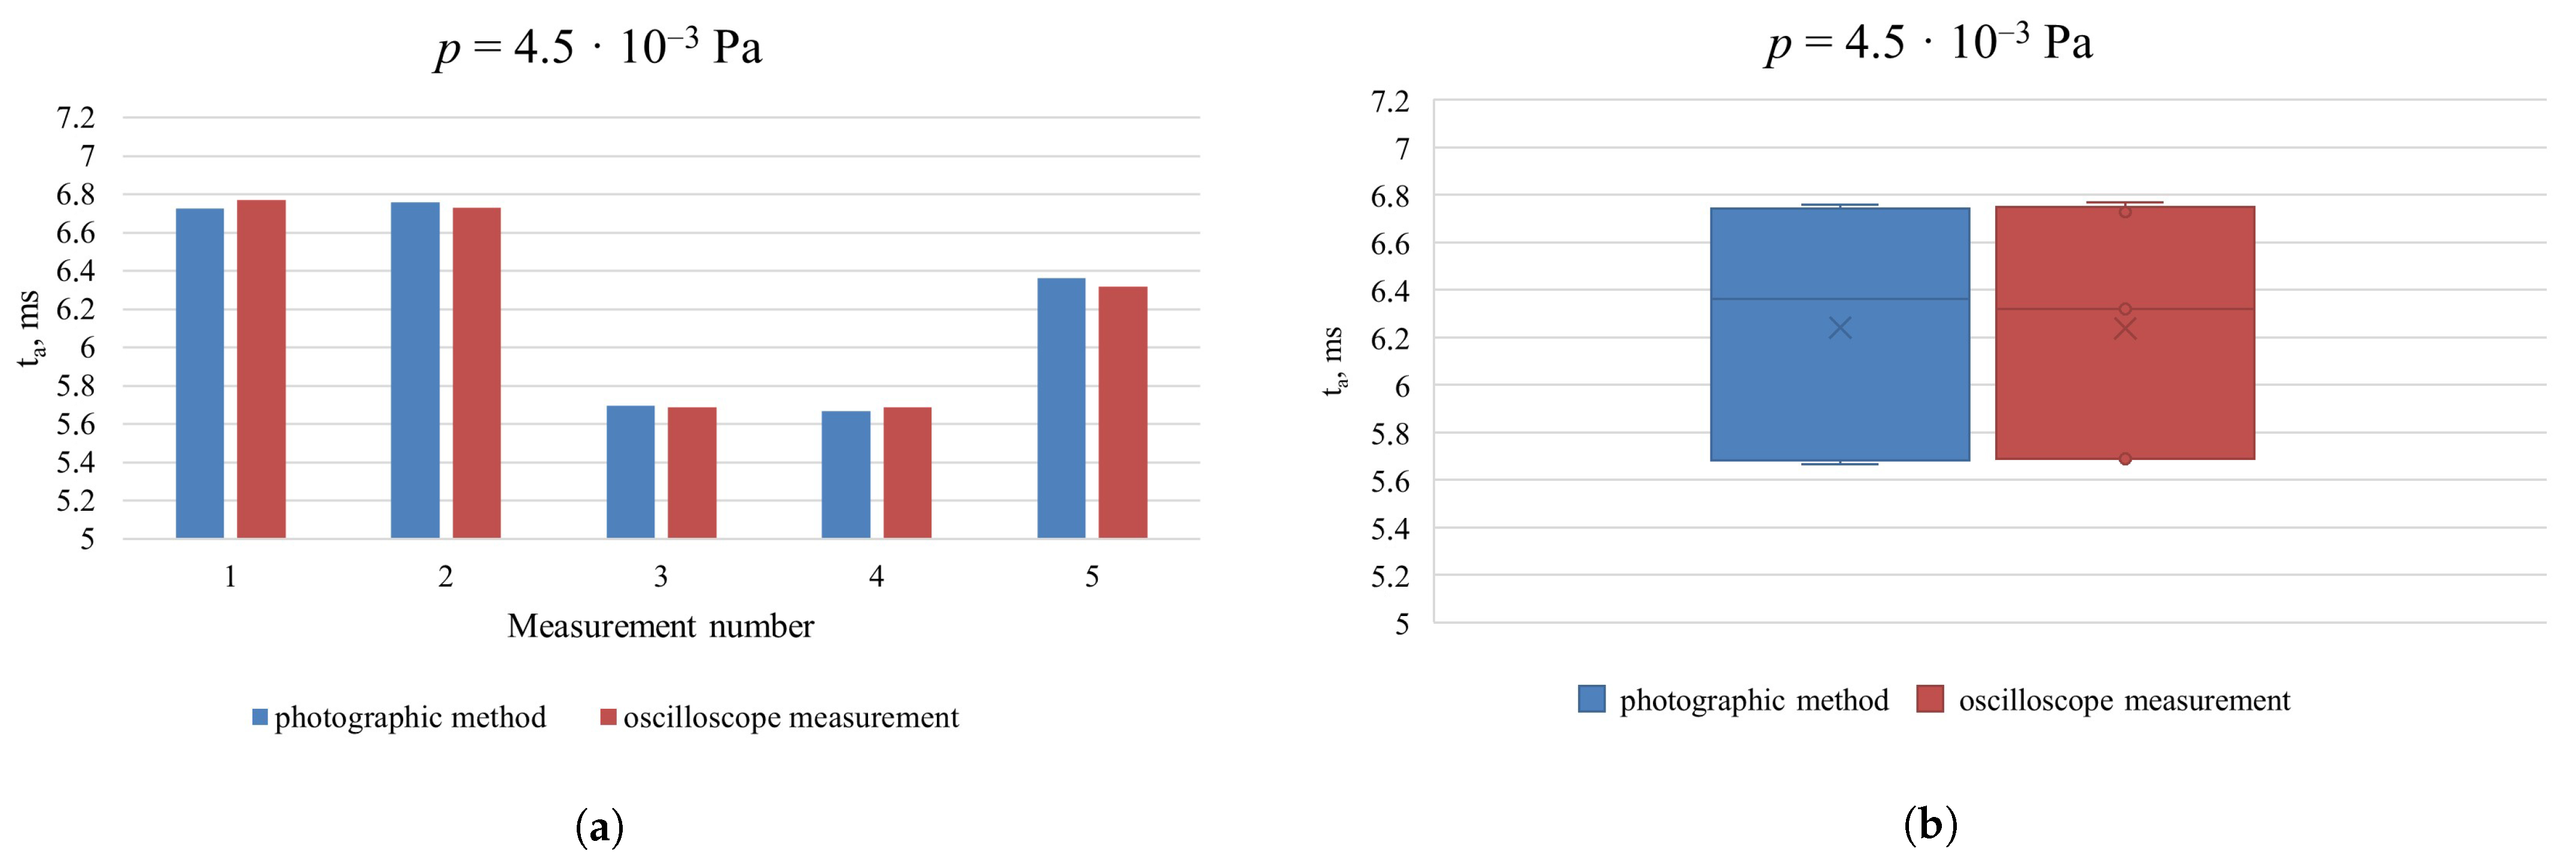
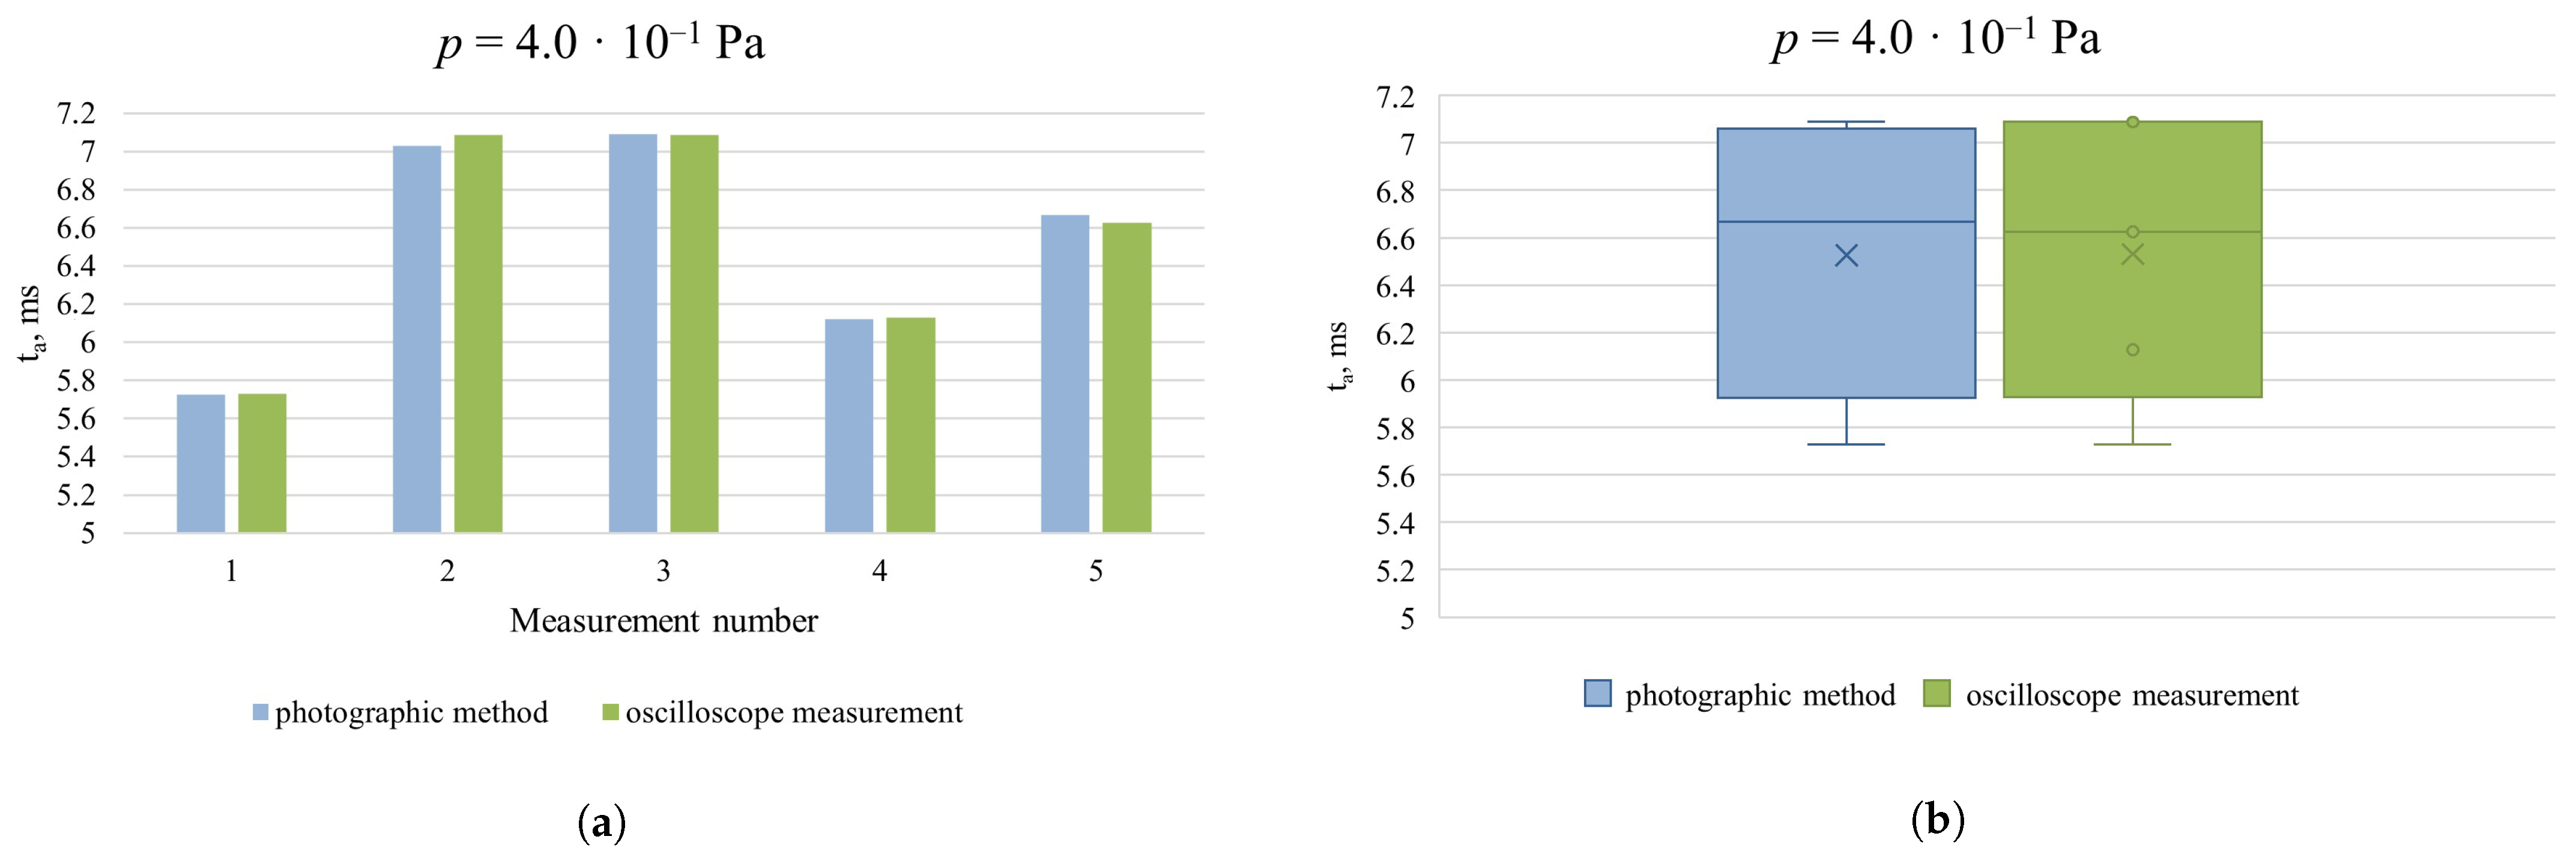
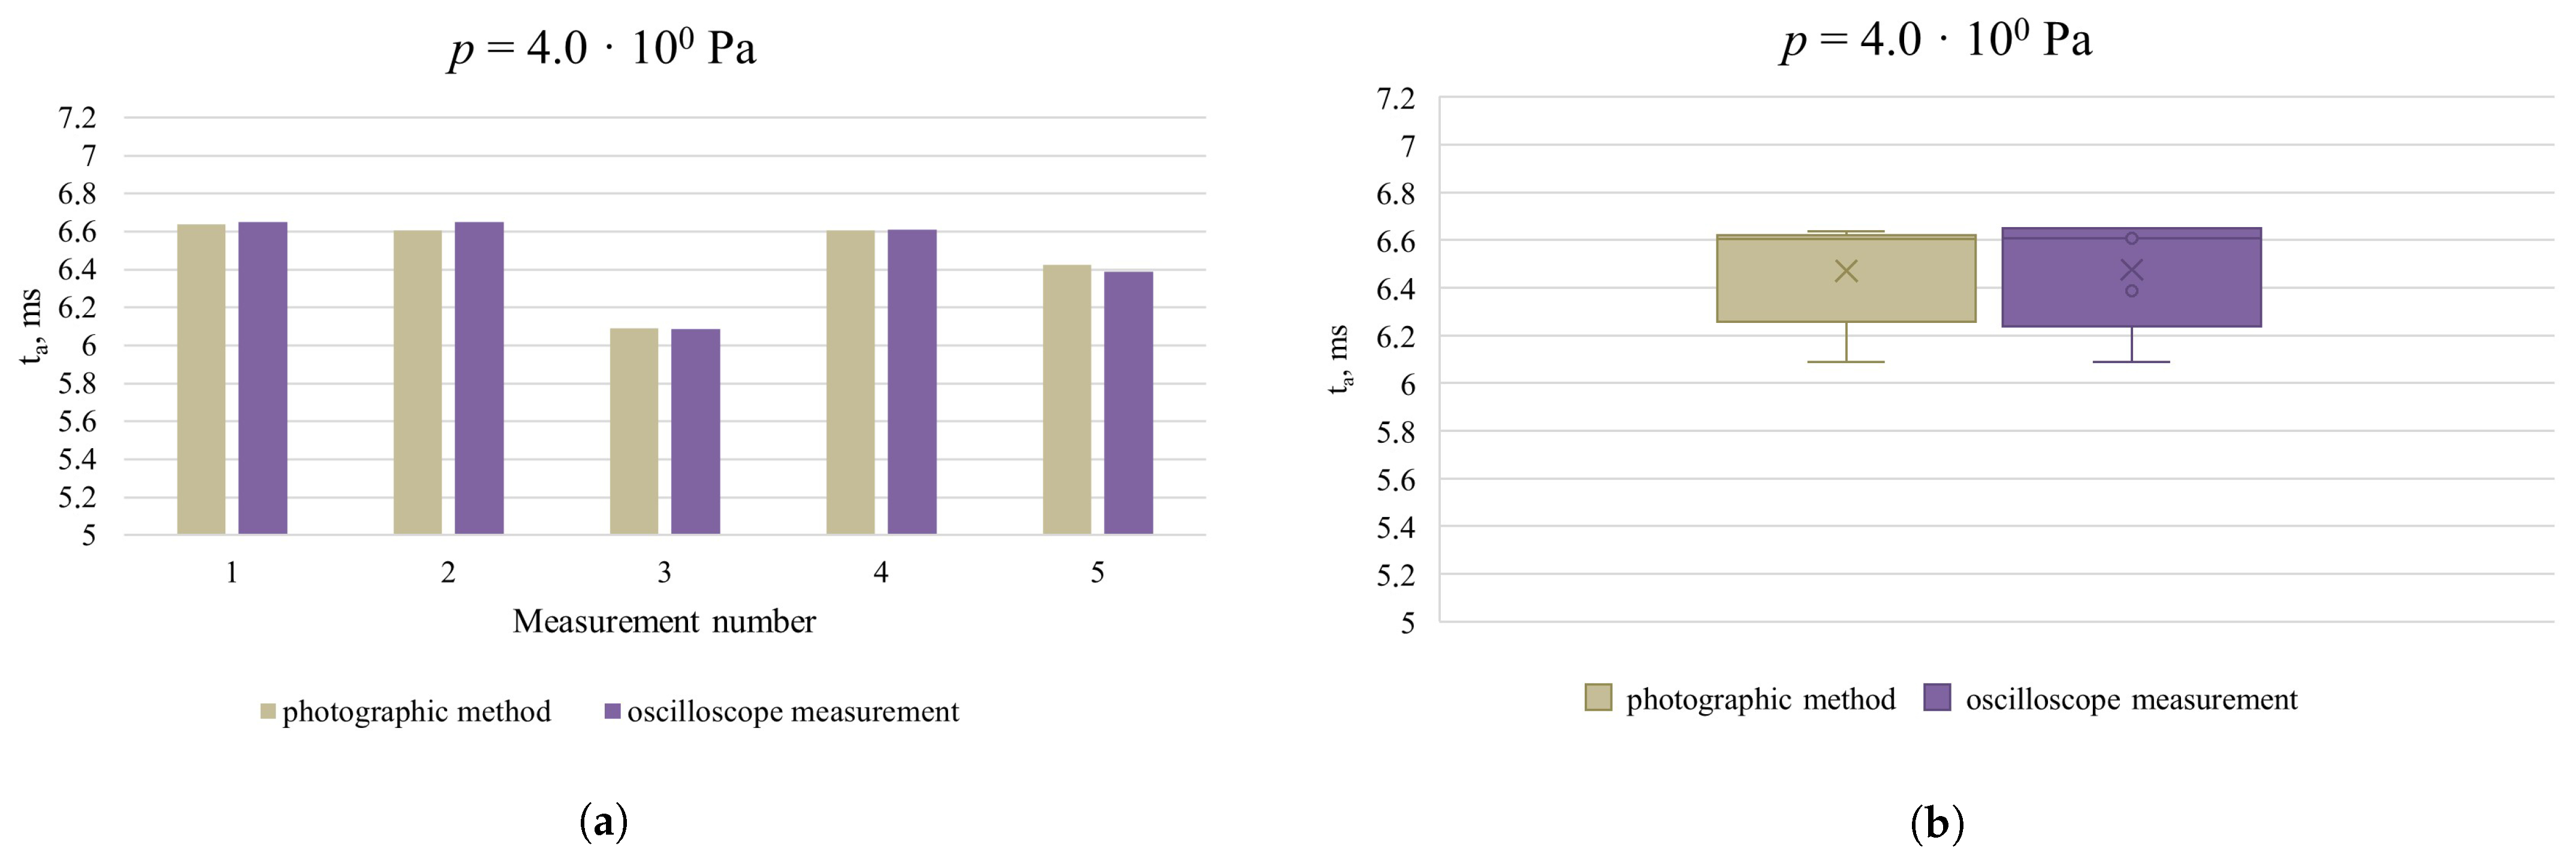
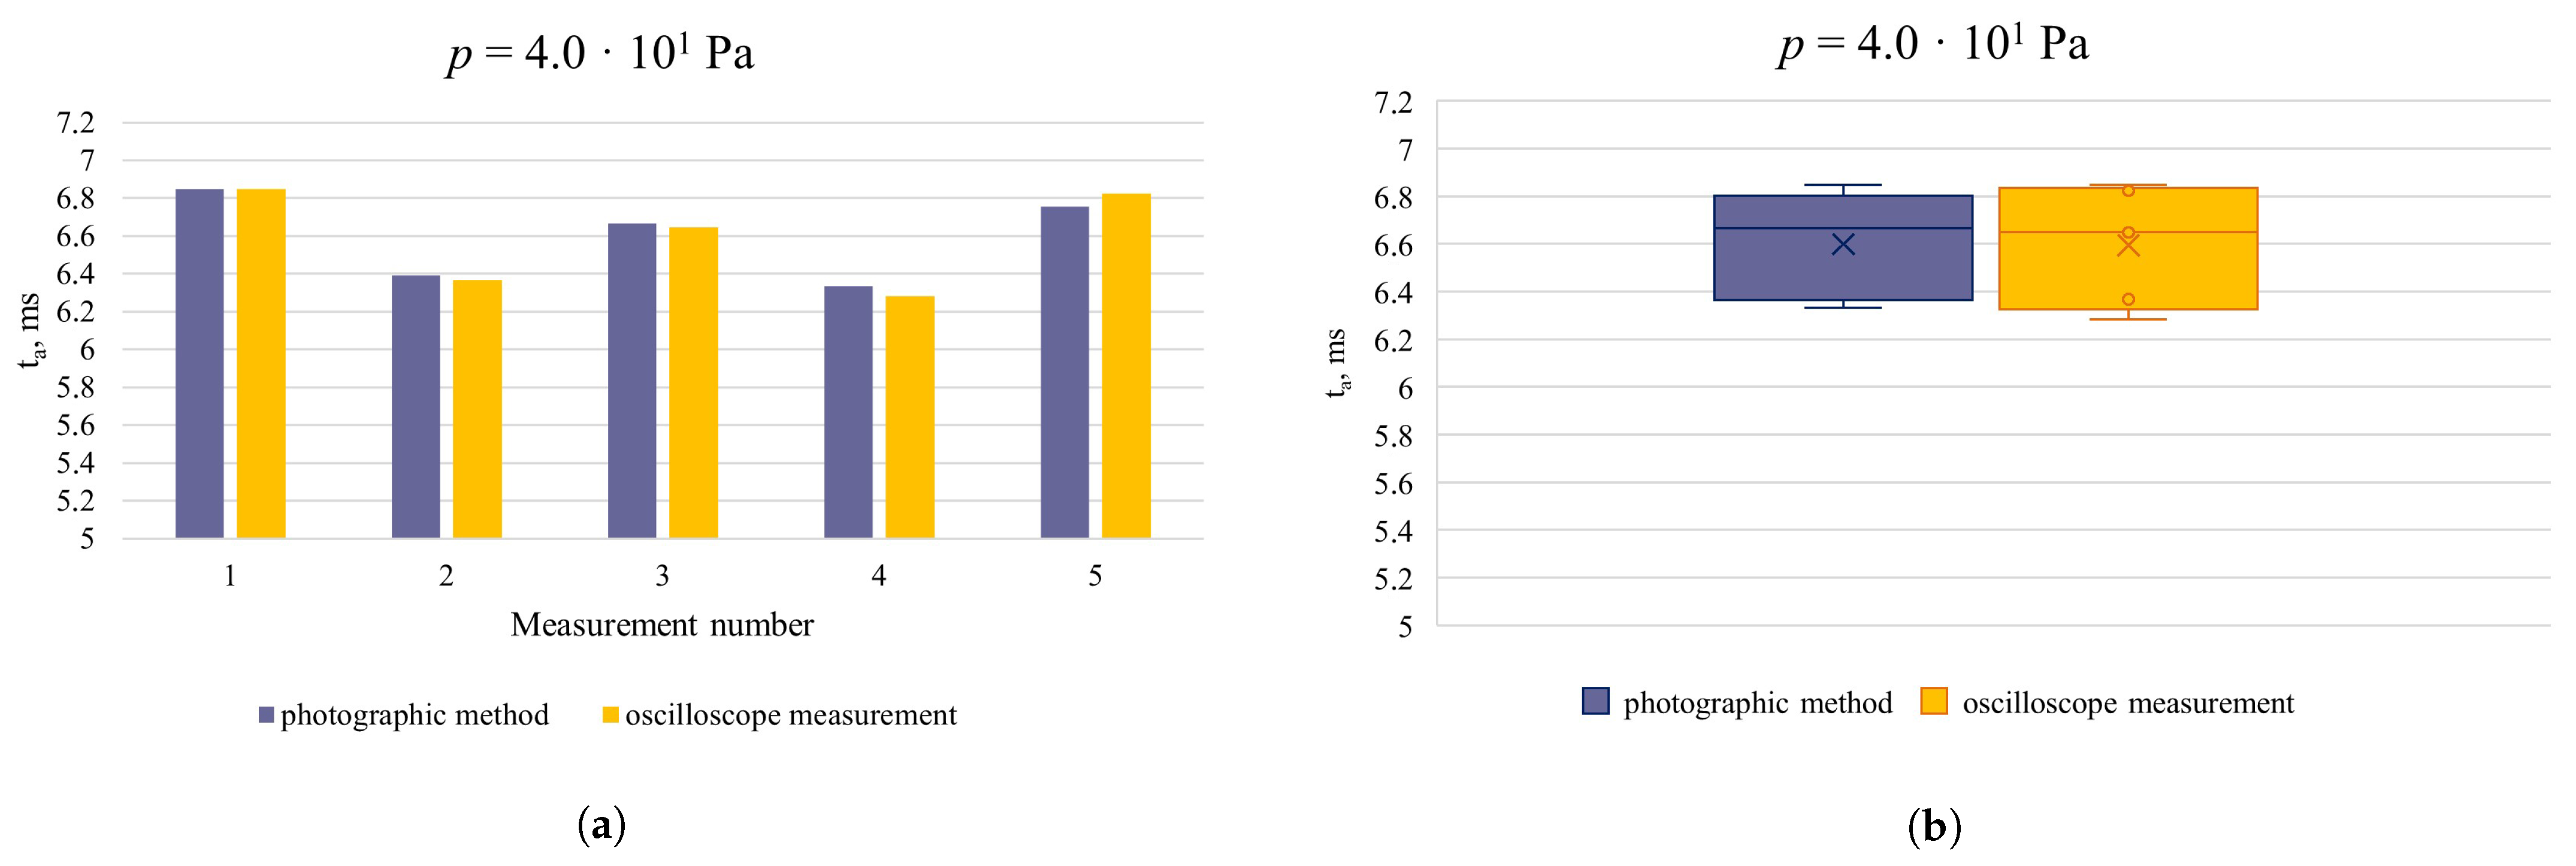
Calculations using both methods were performed for five pressure values. By analyzing all measurement trials, a comparison was made between the effectiveness of the photographic analysis and the arc burning time obtained from the oscilloscope readings. In the calculations, the analysis error was determined by computing the relative error
:
where
is the value measured using the photographic method, and
is the reference value obtained from the oscilloscope measurement. The results of all calculations are presented in
Table 2.
To better illustrate the data presented in the table, column charts were created for each pressure value, together with error bars to show the measurement uncertainties (
Figure 7,
Figure 8,
Figure 9,
Figure 10 and
Figure 11).
Comparing the presented data, it should be noted that the differences between the results obtained using the described methods for determining the arc burning time in the discharge chamber are small. Out of 25 measurements, in 16 cases the difference in arc burning time was on the order of hundredths of a millisecond, in 5 cases on the order of tenths, in 3 cases on the order of thousandths, and in one case the value determined using the developed method coincided with the value measured by the oscilloscope. Therefore, it can be concluded that the developed method allows for highly accurate determination of the arc burning time .
4. Conclusions
This article presents a detailed analysis of two approaches for determining the arc burning time under different pressure conditions: the traditional oscilloscope-based method and an innovative photographic method using an ultra-high-speed camera. The experiments were conducted on a specially designed test setup, enabling both the recording of electrical current and voltage signals via a digital oscilloscope and the analysis of arc dynamics using an optical system through the high-speed camera. The experiments covered five different pressure values in the discharge chamber, with five repeated measurements performed for each, allowing for an in-depth statistical analysis of the results.
The photographic method was based on frame-by-frame analysis of the arc burning process, where the beginning of the phenomenon was identified by the appearance of visible light in the inter-electrode gap, and the end corresponded to the complete disappearance of the arc column and the light flash in the contact area. The relevant segments of the recording were identified using dedicated software, which enabled precise determination of the number of frames corresponding to the arc burning process. Knowing the exact time interval between frames, in this study equal to 30.29 µs, the arc burning time was calculated.
Simultaneously, the arc burning time was calculated based on the recorded electrical signals, with ignition and extinction defined, respectively, by the rise and fall of the current to predetermined threshold values. A comparison of both methods showed very high agreement between the results; in the vast majority of cases, the relative measurement error did not exceed 1%, and the differences between the times obtained by the two methods were typically on the order of fractions or hundredths of a millisecond. More significant deviations were observed only in isolated cases, which may indicate important dynamic characteristics of the arc column.
The use of photographic equipment allowed not only the determination of the discharge duration, but also detailed observation of the arc channel evolution, microparticle motion, and optical and thermal changes occurring during the initiation and extinction phases. This highlights the significant diagnostic value of this method, particularly in laboratory studies of switching systems where phenomena occur very dynamically, with durations on the order of milliseconds or less.
A detailed comparison of equipment costs and method limitations is provided below: the total price of an advanced high-speed camera used in this study exceeds EUR 100,000, while a laboratory-grade oscilloscope in this study exceeds EUR 50,000. The necessity of a transparent window, significant data volume, and specialist software restrict the applicability of photographic analyses in industrial practice. Oscilloscope measurements remain preferable for rapid diagnostics and in environments where optical access is impossible.
The presented results demonstrate the high repeatability and precision of the new method, achieved through the integration of optical and electrical measurements. The developed frame-by-frame photographic analysis procedure represents an effective tool for monitoring and evaluating discharge processes, and the obtained data may serve as a basis for further optimization of design, and improving the safety and durability of power switching apparatus. Considering the diversity of operating environments and the limitations of traditional methods, the authors recommend utilizing the synergy of oscilloscope and photographic measurements in further research and practical applications. The ability to simultaneously record and analyze both electrical and optical data can contribute to a more comprehensive understanding of the complex phenomena associated with arc burning under real operating conditions.
Both measurement methods produced highly consistent results within measurement uncertainty and showed very high repeatability. The choice of method depends on the required spatial/temporal resolution and specific application: high-speed photographic analysis is recommended for laboratory studies of dynamic arc phenomena, while oscilloscope-based approaches are preferred for routine industrial measurements.
Future work will focus on direct measurement of arc energy and the extended analysis of the relationship between arc burning time and energy release, especially under dynamic transitions and the influence of particle emission.
