1. Introduction
The energy transition is currently one of the strategic priorities for all of Europe, as well as for most developed countries. Since the signing of the Paris Agreement [
1], international commitments have established, as a central objective, limiting the increase in global temperature to well below 2 °C compared to pre-industrial levels, and ideally to 1.5 °C. In parallel, the 2030 Agenda for Sustainable Development set seventeen Sustainable Development Goals (SDGs), among which SDG 7 (affordable and clean energy) and SDG 13 (climate action) are fundamental pillars of the transition towards a low-carbon model [
2] At the European level, the report The future of European competitiveness [
3] on competitiveness underlines that the future of the Union will depend on its ability to mobilize investment in clean and low-cost technologies, ensure energy sovereignty, and maintain industrial competitiveness against the United States and China [
3].
This scenario forces us to analyze energy change not only as a technological process, but also as a systemic transformation in which sustainability, security, and equity converge. The Energy Trilemma, conceptualized by the World Energy Council [
4], offers a useful framework for understanding this complexity: any decision about the energy future must simultaneously balance security of supply, environmental sustainability, and economic affordability. While renewable generation technologies such as photovoltaics, wind power, and lithium-ion energy are proving to be more competitive, they also present some limitations [
5,
6]. Within this framework, green hydrogen has positioned itself as a key vector for decarbonizing sectors that are difficult to electrify, such as heavy industry (steel, cement, and chemicals), fertilizer production, and long-distance transport. However, its viability critically depends on reducing the Levelized Cost of Hydrogen (LCOH), which currently remains well above that of conventional hydrogen.
The recent literature confirms that the main barrier to the mass deployment of green hydrogen is its high production cost. Freire Ordóñez [
7] have quantified that the global cost of a reliable supply of green hydrogen is currently between 18 and 22 USD/kg, although it could drop to the range of 8–10 USD/kg through better management of renewable intermittency and monetization of surpluses. Meanwhile, reviews by Wang et al. [
8] show that optimizing systems with multiple electrolyzers, dynamically managed to adapt to renewable variability, can significantly improve overall efficiency and extend equipment lifetime, thereby reducing the projected LCOH. Likewise, Huang et al. [
9] make a systematic review in which they highlight the importance of modeling alkaline electrolyzers in complex network scenarios, pointing out that the control and configuration of the system are as decisive as the capital or electricity costs.
Other recent studies complement this panorama. For example, van der Spek et al. [
10] analyze the competitiveness of green hydrogen in Europe and conclude that reaching parity requires between 7500 and 8500 h of electrolyzer operation per year, a figure consistent with the empirical results presented in this work. [
11] in a reference review, place hydrogen at the center of the global energy transition, although without offering detailed economic data. For its part, the JRC report [
12] collects information on European hydrogen projects and their regulatory barriers but does not incorporate technical simulations or detailed financial analyses. Finally, several articles published in Nature Energy (e.g., [
13,
14]) and Joule [
15] project significant decreases in the global cost of green hydrogen—even down to 1–3 €/kg in 2050—although these scenarios are often based on macroeconomic assumptions and lack validation in specific cases.
To show more clearly how this study contributes to overcoming the limitations of the previous literature,
Table 1 not only summarizes the most relevant approaches and findings, but also identifies how our proposal corrects or complements them.
After this comparative review, it is observed that global and macroeconomic studies—such as those published in Nature Energy, Joule, or the JRC report—concur in pointing to the need for green hydrogen as a pillar of the energy transition. However, these studies are typically based on aggregated scenarios and lack both hourly modeling and granular financial analysis. In this sense, this work fills a methodological gap by offering a replicable microeconomic approach, focused on technical simulation and the translation of results into a realistic financial framework.
On the other hand, more technical analyses, such as those by and [
8] focus on the development of control strategies to optimize the use of multiple electrolyzers or on the detailed modeling of alkaline electrolyzers in complex energy scenarios. However, these approaches tend to ignore the financial dimension, which limits their practical applicability to investment decision-making. In contrast, the present study brings together both aspects—the technical and the financial—and demonstrates how their integration can lead to a significant reduction in the Levelized Cost of Hydrogen.
In addition, benchmark European studies, such as those by van der [
10,
7], establish competitiveness thresholds and project future cost trajectories, but typically work with aggregated data that do not capture hourly variability or local conditions. This work, however, provides empirical evidence derived from a specific case in Seville, with hourly simulations and alternative configurations, which allows for the identification of design parameters that can be directly transferred to practice.
Overall, the originality of this study lies in articulating an integrative methodology that combines hourly simulation, analysis of technical configurations, and financial evaluation under project finance criteria. This directly answers the following research questions:
What is the relationship between energy costs and the electrolyzer’s annual operating hours?
What is the number of annual operating hours of the electrolyzer that minimizes the total cost of hydrogen production (energy + electrolyzer)?
What is the optimal configuration for power generation?
How will the cost of electricity supply evolve?
Throughout this work, answers will be provided to the questions posed, offering results that not only enrich the academic debate but are also applicable to investment practice and the design of green hydrogen projects in real-life contexts.
2. Overview of Green Hydrogen Production
Green hydrogen is produced through water electrolysis powered by renewable energy sources, resulting in near-zero greenhouse gas emissions throughout its life cycle [
17,
18]. Among the main production technologies—alkaline (AEL), proton exchange membrane (PEM), and solid oxide electrolyzers (SOEC)—PEM systems are the most suitable for coupling with intermittent photovoltaic generation due to their high flexibility and rapid response [
19].
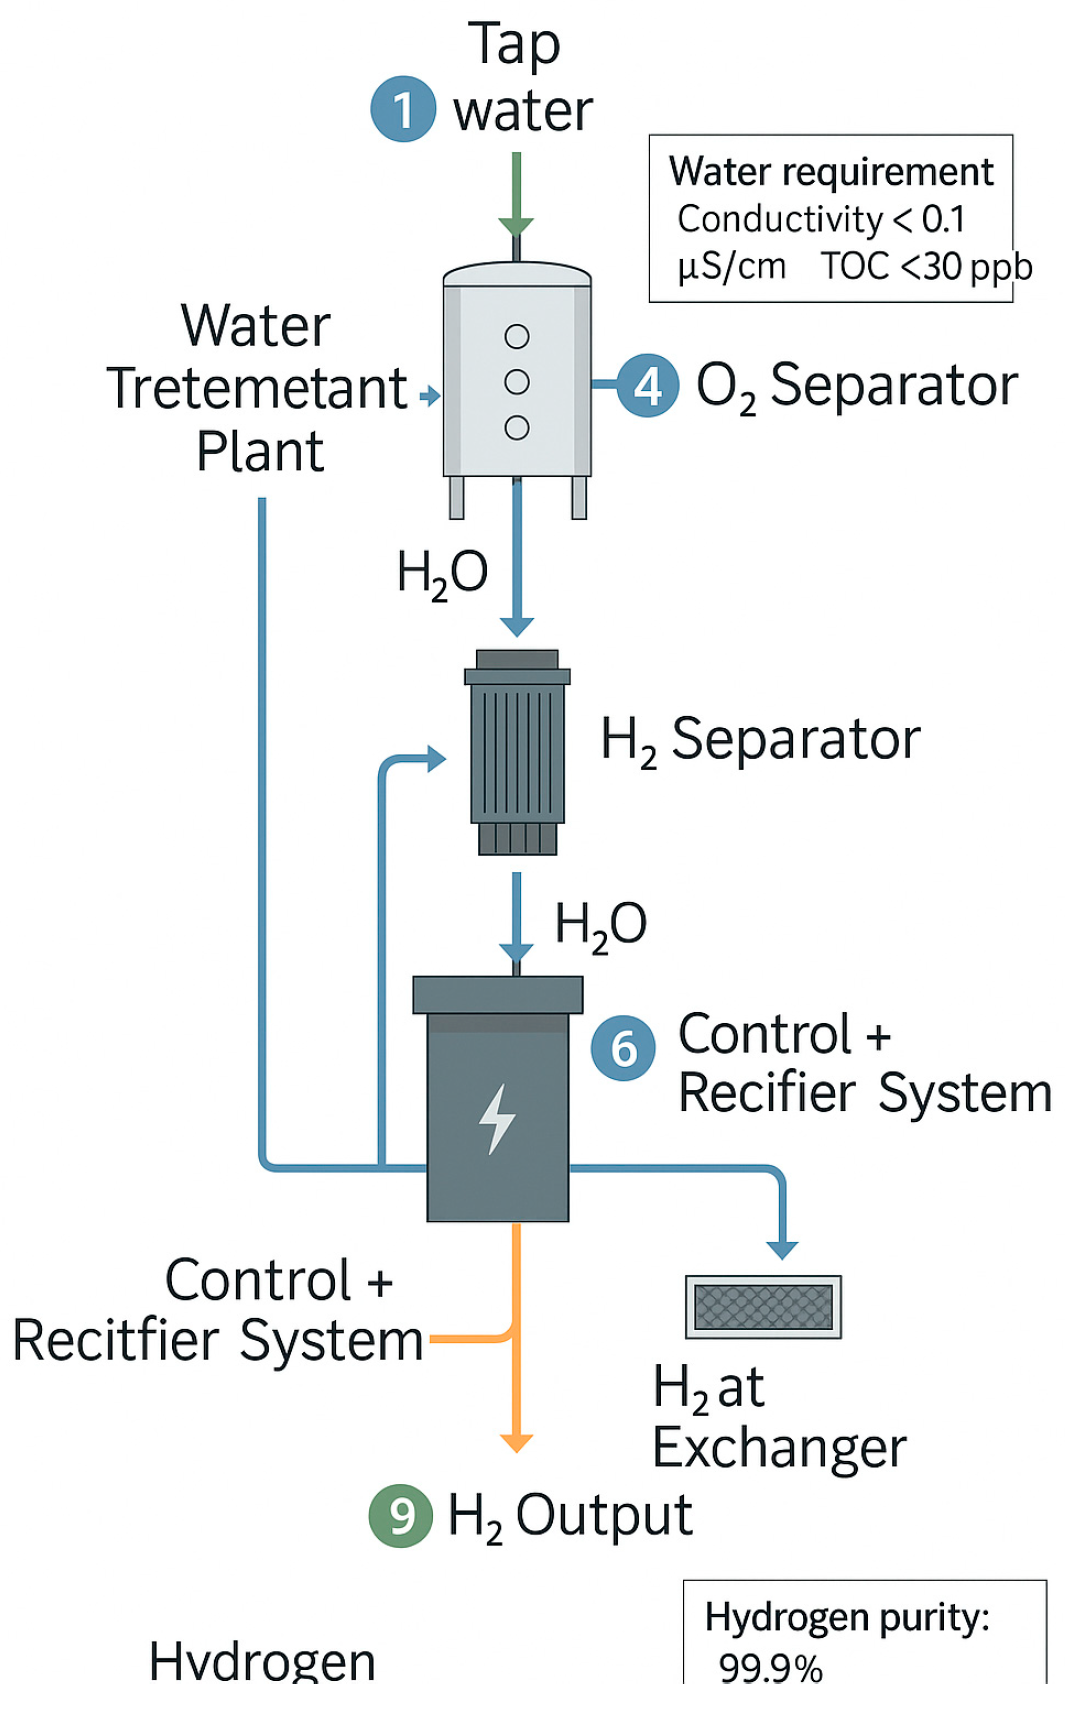
In this study, green hydrogen production is analyzed from a techno-economic perspective, focusing on the relationship between energy costs, electrolyzer efficiency, and annual operating hours. The detailed electrochemical and process descriptions, together with the typology of hydrogen sources and cost factor breakdown, are summarized in
Appendix A for reference.
3. Financial Model for Estimating the Levelized Cost of Hydrogen (LCOH)
This section presents the financial model developed for estimating the Levelized Cost of Hydrogen (LCOH), following the methodology proposed by Lazard [
20]. This approach is based on the logic of
project finance, which involves a detailed representation of the cash flows of an actual green hydrogen production project over its lifetime, as opposed to simplified approximations based solely on cost averages.
3.1. Key Parameters of the Model
The calculation is based on two fundamental parameters:
Levelized Cost of Electricity (LCOE): this is defined as the average lifetime cost per unit of renewable electricity consumed by the electrolyzer.
Annual operating hours of the electrolyzer: this determines the volume of hydrogen produced per year and allows the system capacity to be properly sized.
From these two parameters, the annual hydrogen production (kg/year) is calculated, which is then related to the total project costs to obtain the LCOH in €/kg.
The results are normalized to a reference electrolyzer capacity of 1 MW, allowing cost and performance indicators (LCOE and LCOH) to be expressed on a per-megawatt basis.
3.2. Calculation Formulas
The Levelized Cost of Electricity (LCOE) and the Levelized Cost of Hydrogen (LCOH) are calculated using standard discounted cash flow formulations, consistent with methodologies proposed by the International Energy Agency [
18], the International Renewable Energy Agency [
17,
21], and the National Renewable Energy Laboratory [
22].
The Levelized Cost of Electricity (LCOE) represents the discounted average cost of producing one megawatt-hour (MWh) of electricity over the system’s lifetime:
where
It: investment expenditures in year t (CAPEX).
Ot: operating and maintenance costs (O & M).
Mt: miscellaneous or replacement costs.
Ft: fuel or energy input costs (for PV = 0).
Et: electricity generated in year t (MWh).
r: discount rate (WACC).
n: project lifetime (years).
The Levelized Cost of Hydrogen (LCOH) extends this formulation by considering the total hydrogen produced (in kilograms) and incorporating the cost of electricity supplied to the electrolyzer:
where
Iel,t: investment in electrolyzer equipment (CAPEX).
I_en,t: investment in the renewable energy supply system (PV + storage).
Ot: operating costs (OPEX).
Mt: maintenance and replacement costs.
C_en,t: cost of energy consumed by the electrolyzer.
Ht: annual hydrogen production (kg).
3.3. Components of the Financial Model
The model integrates the most relevant financial elements of an industrial green hydrogen production project:
Initial investment (CAPEX): this includes the construction of the plant, installation of the electrolyzer and auxiliary systems.
Operating and maintenance costs (OPEX): both fixed and variable, including electricity, water, insurance, and warranties.
Project life: time horizon over which feasibility is assessed.
Financing structure: combination of equity and debt, with interest rate assumptions, amortization terms, and repayment profiles.
Tax aspects: depreciation of assets, taxes on profits, and other applicable taxes.
Replacement of the electrolyzer stack: halfway through its useful life, a one-time additional investment is incorporated to replace it.
Using these elements, the model simulates the project’s annual cash flows, allowing the calculation of free cash flow for shareholders and discounting it at the cost of equity. The LCOH is defined as the minimum hydrogen sales price that ensures investment recovery and a target return on the equity contributed.
3.4. Description of the Financial Model Parameters
The financial evaluation of the proposed models was carried out using a discounted cash flow (DCF) approach, incorporating both investment and operational costs over the system’s lifetime. The main input parameters used in the model—such as capital expenditure (CAPEX), operating expenditure (OPEX), discount rate, and system lifetime—are summarized in
Table 2. These parameters were selected based on values reported in the recent literature and industry benchmarks, particularly from Lazard’s Levelized Cost of Energy and Hydrogen analyses and adapted to reflect typical conditions for photovoltaic and electrolyzer systems.
3.5. LCOH Calculation Procedure
The procedure seeks to estimate the minimum hydrogen sales price that covers costs and generates the target profitability. To do this:
The technical and economic parameters are defined as follows: unit CAPEX, electricity consumption (kWh/kg of H2), annual operating hours, and electricity price (LCOE = f(h)).
Annual revenue is calculated as a product of estimated production and the sales price of hydrogen.
Operating costs are determined, including energy, water, insurance, and O & M.
EBITDA is obtained as the difference between income and operating costs.
The capital structure is incorporated with debt, interest, and amortization.
Depreciation, especially stack replacement, is considered.
Gross profit is calculated, followed by net profit after taxes.
The project’s cash flows are determined as the sum of net profit and amortization.
Since the energy cost will depend on the optimal configuration for each number of hours, as will be seen in the following subsection (LCOE = f(h)), a different value of LCOH will be obtained for each number of operating hours (LCOH = f(h)).
The
LCOH is the selling price at which the initial investment can be recovered, and the target return on equity can be achieved. The full model based on the Lazard report [
20] is included in
Appendix B.
4. Comparative Analysis of PV–Electrolyzer Configurations
This section evaluates three alternative configurations for coupling photovoltaic (PV) generation with electrolytic hydrogen production: Model 1—Base Case, Model 2—Oversizing, and Model 3—PV and Storage. Each model differs in system configuration, operating strategy, and associated costs. The main technical and financial assumptions are summarized in
Table 3, while the specific behavior and results for each case are described below.
4.1. Model 1—Base Case
In the base configuration, the electrolyzer operates without any storage system, consuming electricity only up to its rated power. This approach prevents surplus generation that would otherwise be injected into the grid.
Solar configuration: Two panel tilt alternatives are analyzed—one maximizing annual generation and another reducing hourly variability.
Sizing: The PV plant is dimensioned so that the electrolyzer’s nominal power is not exceeded during peak production; inverter power equals electrolyzer power.
Operation: The electrolyzer works only when renewable power is available, resulting in partial annual utilization.
LCOE calculation: The analysis includes annualized CAPEX (modules and inverters), O&M costs, and WACC, with annual production determined by available irradiation and electrolyzer startup limits.
4.2. Model 2—Oversizing
This model seeks to increase the electrolyzer’s annual operating hours by progressively expanding PV capacity in 10% increments up to +100% relative to the base case.
Rationale: Oversizing the PV plant reduces the frequency and duration of low-generation periods, allowing the electrolyzer to operate near full load more often.
Operation: The electrolyzer remains limited to its nominal power, with excess generation injected into the grid.
Economic effects:
- -
Increased PV capacity raises CAPEX,
- -
Higher utilization improves annual hydrogen output and affects OPEX (scaled to operating hours),
- -
LCOE and LCOH are recalculated for each oversizing level, considering these adjustments.
The model quantifies changes in energy use, hydrogen production, and cost performance for each oversizing scenario.
4.3. Model 3—PV and Storage
This model integrates a lithium battery to store surplus PV electricity, eliminating curtailment and extending electrolyzer operation hours.
Solar configuration: The two tilt angles from previous models are maintained.
Sizing: Battery capacity is determined based on the maximum observed State of Charge (SoC) in representative generation scenarios.
Operation: Nearly all generated energy is consumed by the electrolyzer, maximizing utilization.
LCOE with storage: This includes battery CAPEX, lifetime, and O & M costs, discounted using the same WACC applied to the PV and electrolyzer system.
Despite the higher investment, the improved utilization and higher hydrogen output significantly reduce the LCOE compared with systems without storage.
4.4. Comparison Between Models
The results of the three models enable the construction of an interpolated Levelized Cost of Electricity (LCOE) function as a function of the electrolyzer’s annual operating hours. This function explicitly illustrates the relationship between the integration of energy storage and the reduction in the specific cost of electricity.
For each value of electrolyzer operating hours, the configuration with the lowest cost is selected, thus determining the optimal combination of photovoltaic array size, storage capacity, and module tilt angle.
Based on the corresponding CAPEX and OPEX data for each configuration, the resulting function LCOE = f(h) is obtained, which serves as the input for the LCOH(h) financial model presented in the previous section.
5. Case Study
This section develops a case study applied to the Seville site (37.520, −5.651) characterized by high levels of solar irradiation and proximity to industrial hubs demanding hydrogen.
The objective is to validate the proposed methodology and demonstrate its applicability in a real-world context. The section is organized into four sections: first, the input data considered in the analysis are presented; second, the Levelized Cost of Electricity (LCOE) and Levelized Cost of Hydrogen (LCOH) calculations are presented for each of the models analyzed (Base Case, Oversizing, and Storage); third, a systematic comparison is made between the results of the different models; and finally, a sensitivity analysis is included on the critical parameters that determine the economic viability of the system. This structure aims to illustrate in a practical way how the integration of technical and financial aspects allows for the identification of optimal configurations for the competitive production of green hydrogen.
5.1. Case Study Input Data
Table 4 presents the input data to be applied in the model described in the previous section.
5.2. Calculation of LCOE and LCOH by Model
5.2.1. Model 1—Base Case
In this model, the PV plant is sized to a 20 MW electrolyzer, avoiding spills. The results show an LCOH of €7.23/kg (35°) and €8.07/kg (58°).
5.2.2. Model 2—Oversizing
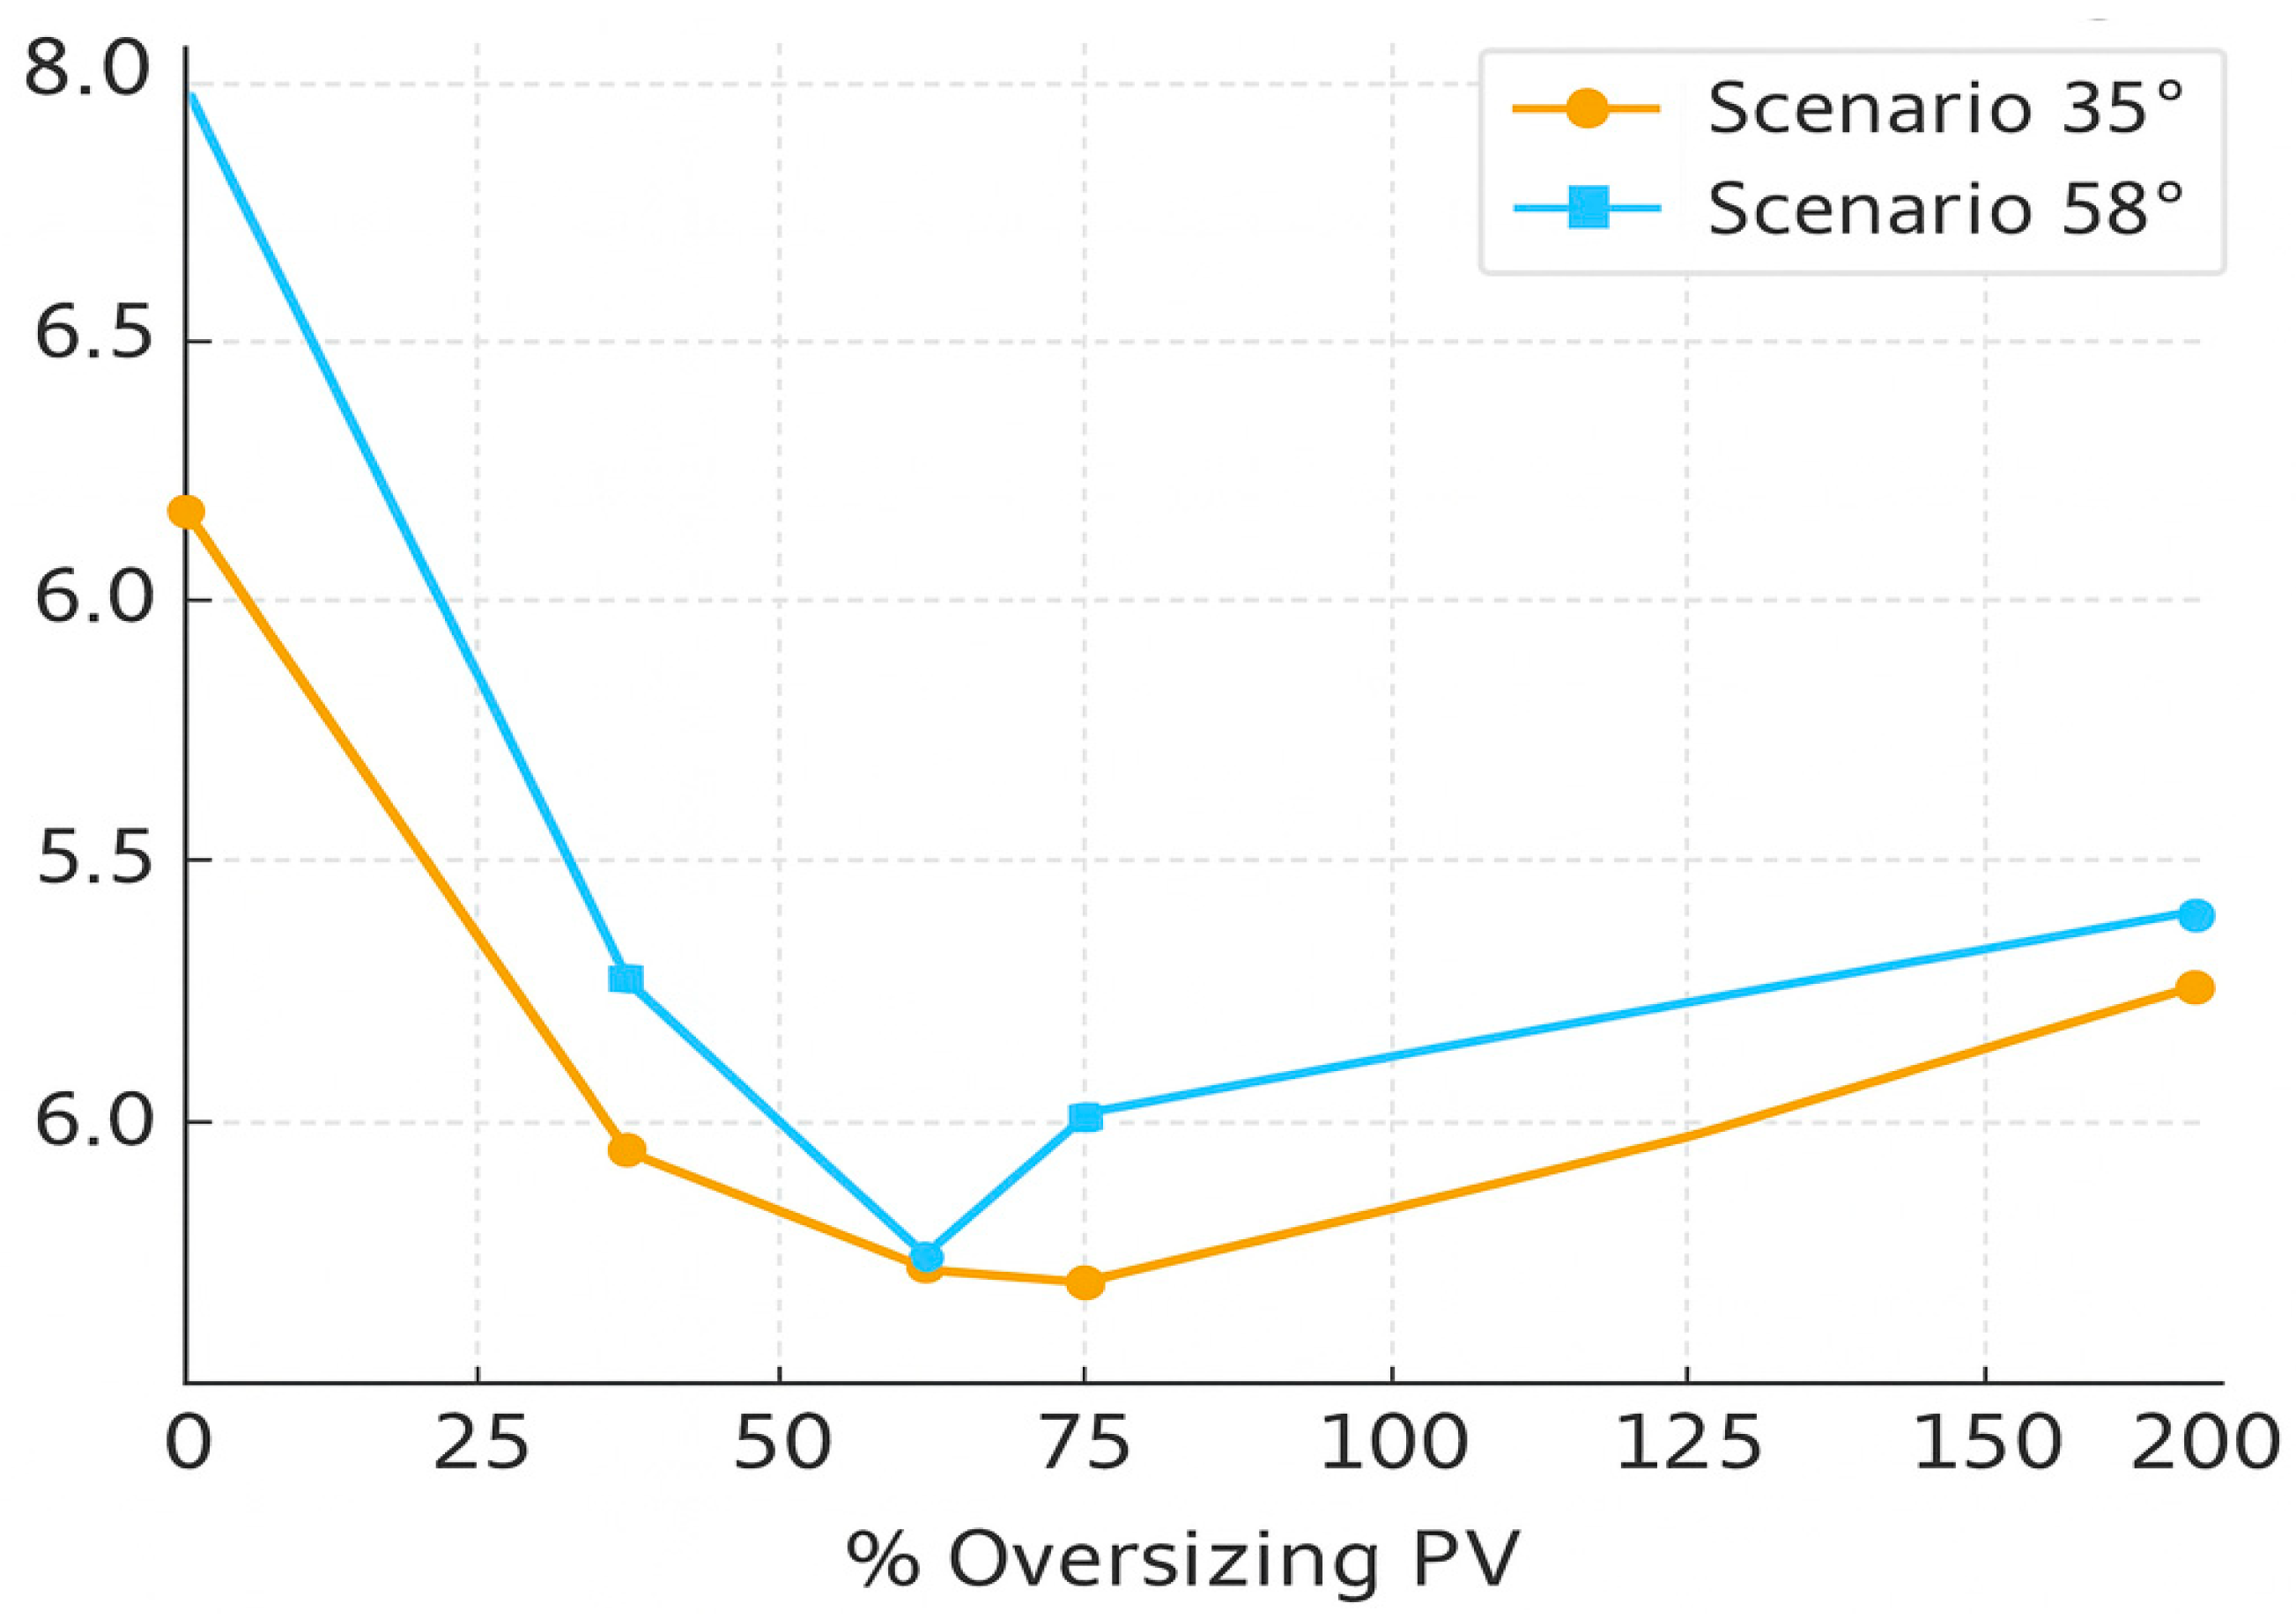
The PV power is progressively increased relative to the base case. The minimum LCOH achieved is €5.80/kg (35° with 90% oversizing).
Table 5 and
Figure 1 present the LCOE and LCOH results for each oversizing level and module inclination analyzed.
It is observed that the maximum energy inclination (35°) improves the results of the minimum variance inclination in all cases, and that a minimum LCOH value of 6.08 €/kg is obtained, with hours of use exceeding 3000.
5.2.3. Model 3—Incorporating Storage
The integration of lithium batteries allows for maximizing electrolyzer utilization. This approach makes it possible to take advantage of surplus photovoltaic production that cannot be used immediately, storing it for later use when the plant is not producing or is producing below the electrolyzer’s rated power.
Compared with the previous models, where curtailed energy limited utilization, the implementation of storage allows for continuous operation and more efficient use of installed capacity, improving both CAPEX distribution and overall system efficiency.
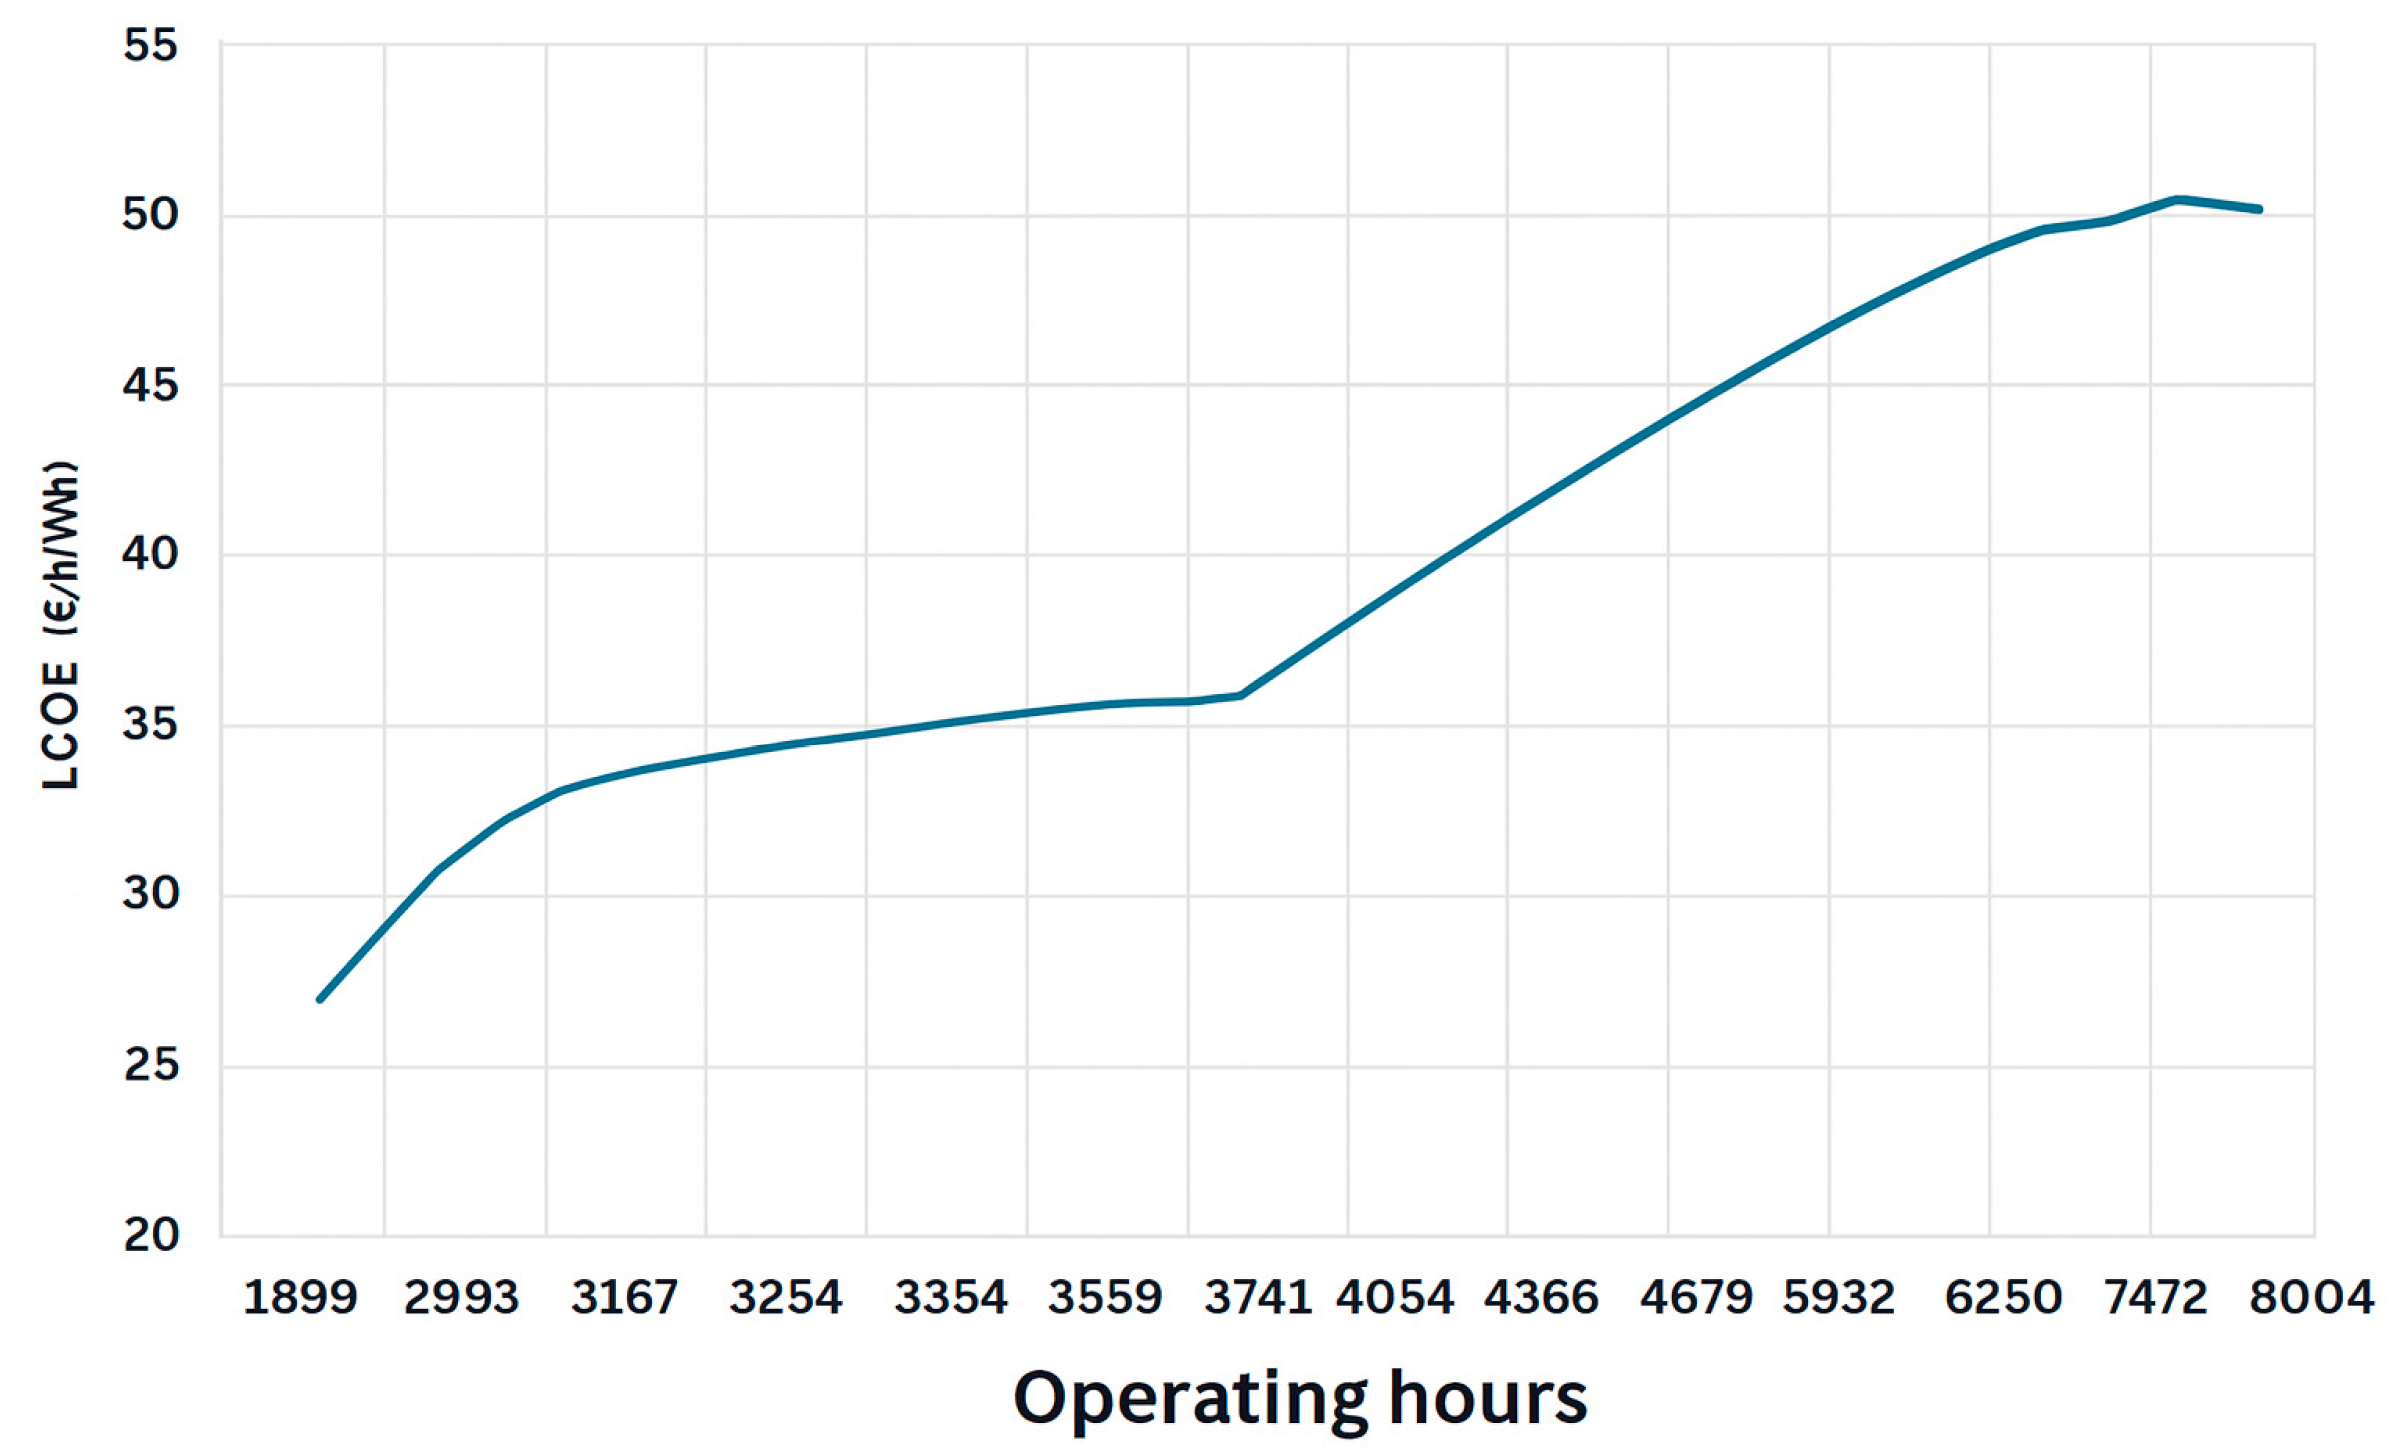
Thus, it is observed that the cost of energy (LCOE) increases with the number of operating hours, as expected.
Figure 2 presents the minimum LCOE values for each number of operating hours, after analyzing the three proposed models.
Although the function is not linear, to state a “thumb rule”, it can be approximated as the function:
Which would be equivalent to saying that for every additional 1000 h of operation, the LCOE increases by €3.85/MWh.
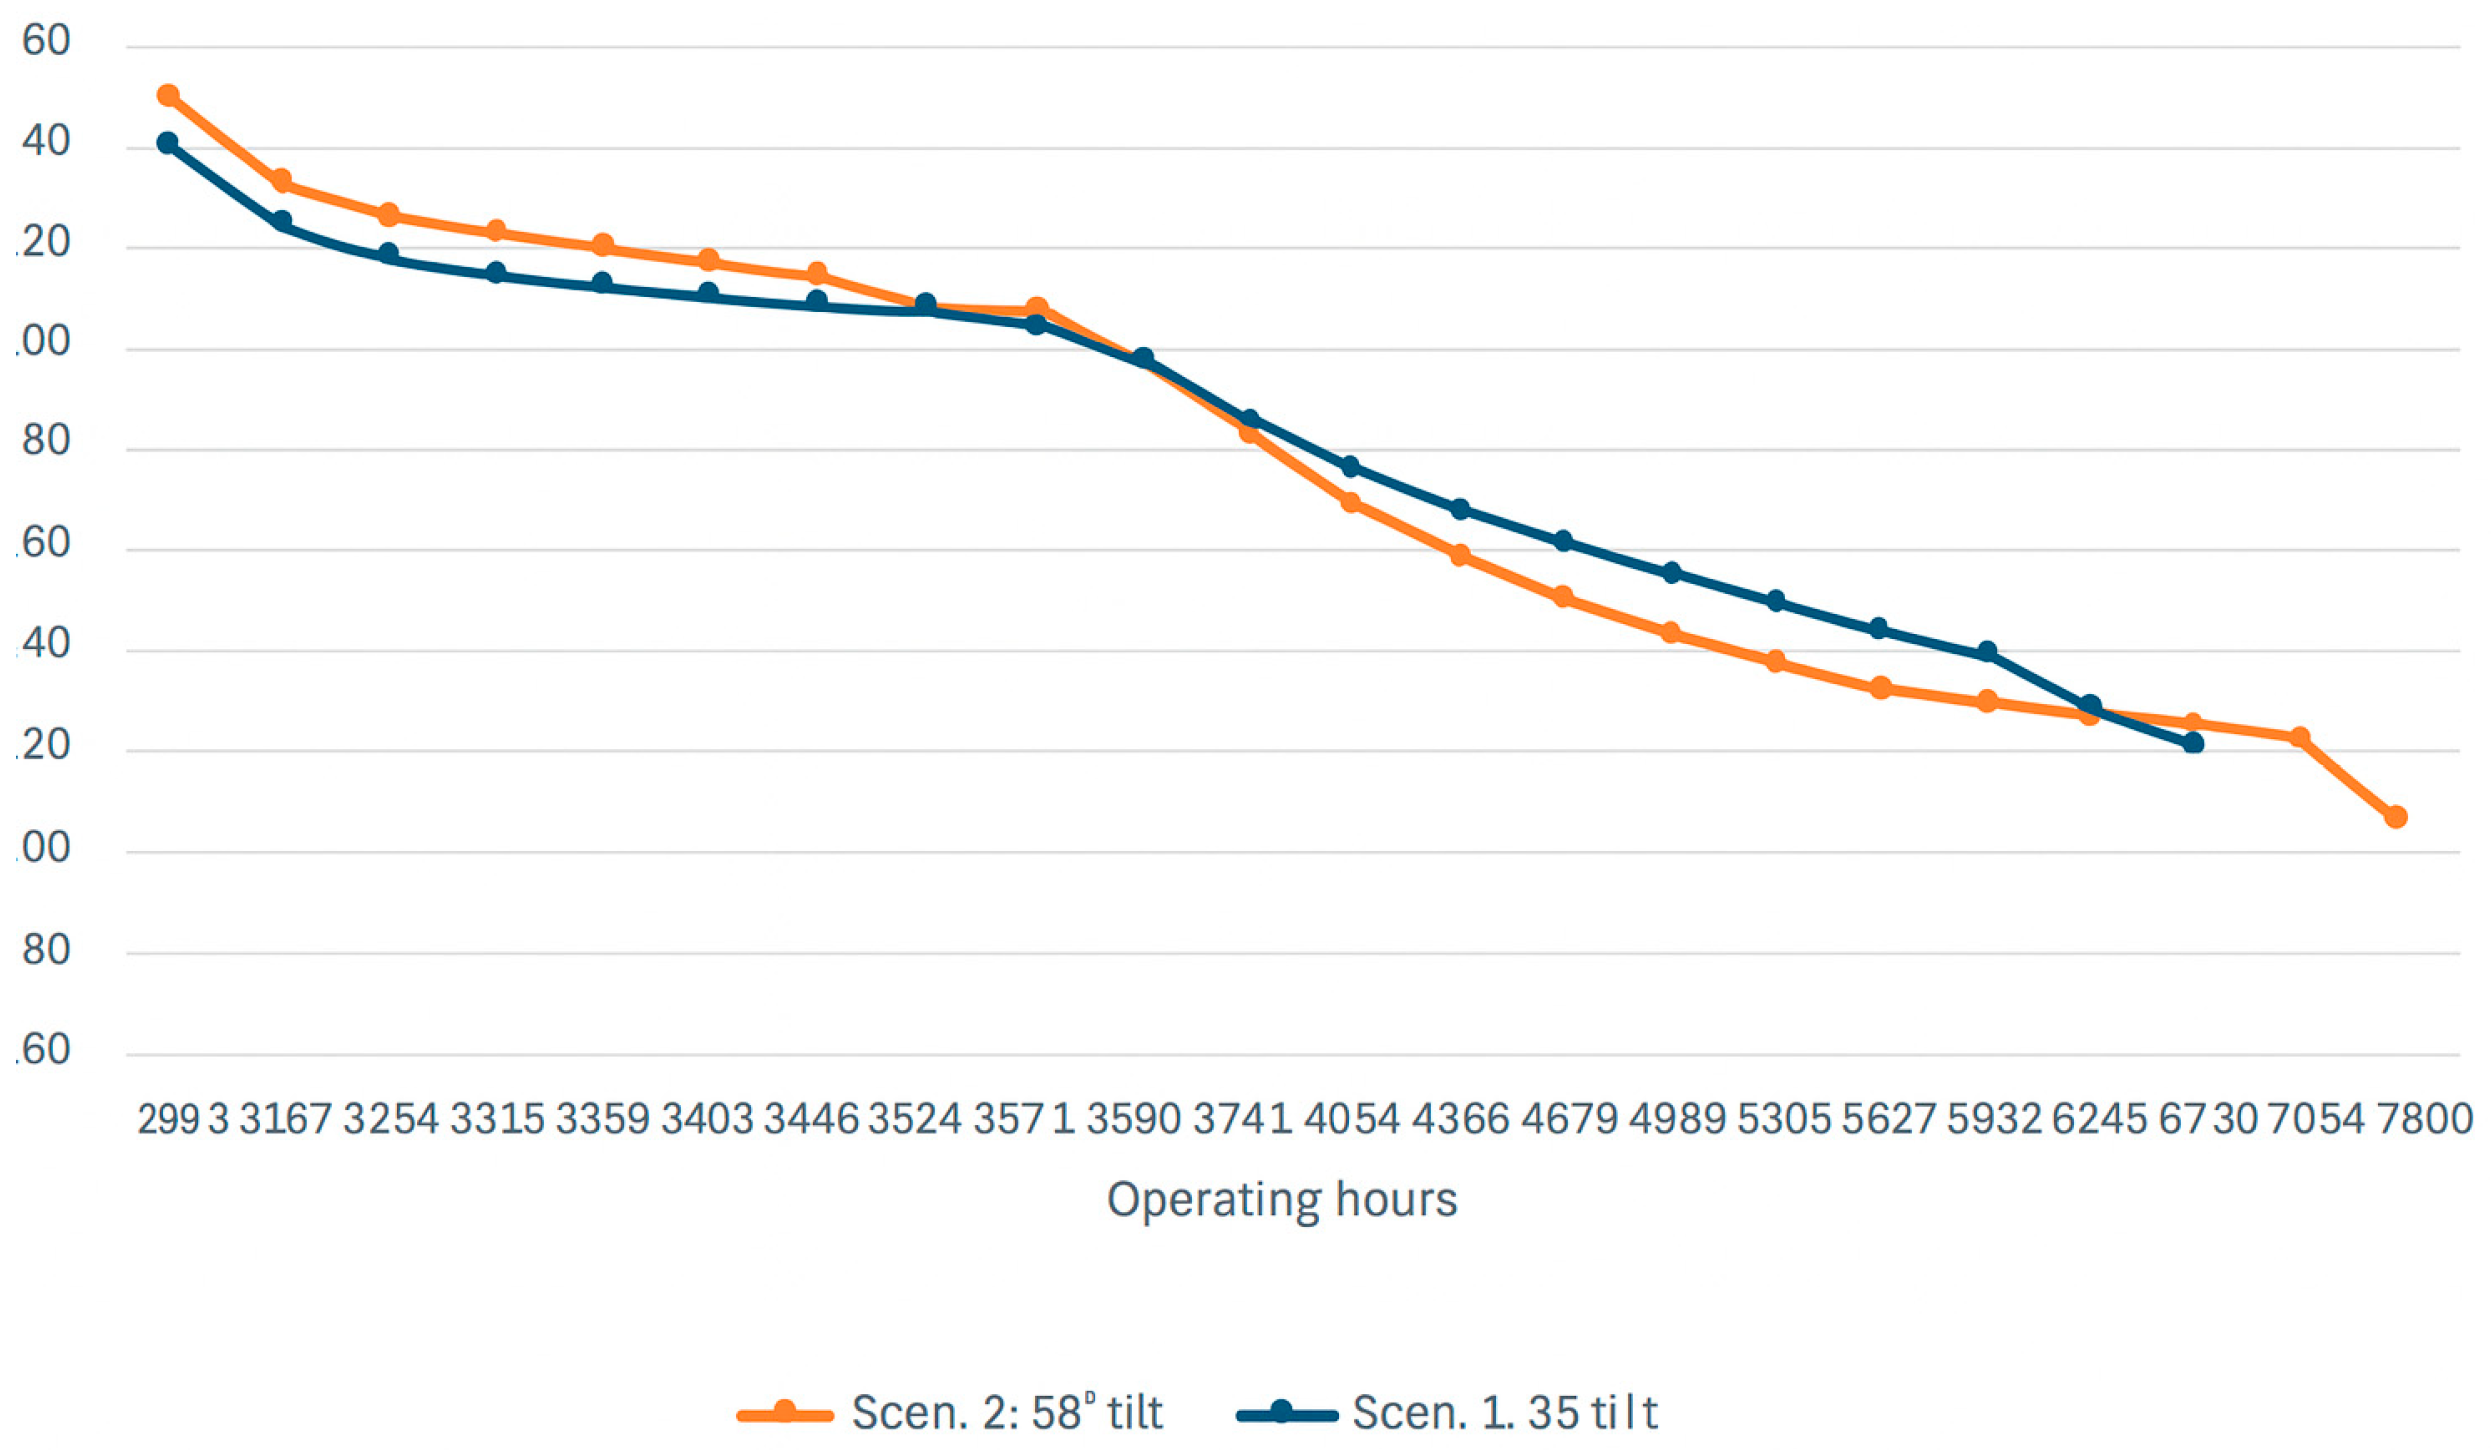
Different scenarios were evaluated based on the number of operating hours of the electrolyzer, ranging from 2893 to 8004 h per year, while maintaining a constant inverter power of 20 MW. For each case, the adjusted LCOE was calculated, and from this, the associated LCOH. The results obtained are presented in
Figure 3.
The LCOH drops to a minimum of €4.43/kg with 8004 operating hours (58 °C). This operating regime ensures virtually continuous production, leaving 10% of the year’s hours for preventive maintenance. This allows for a significant reduction in the amortization cost of the electrolyzer equipment, although the LCOE increases significantly.
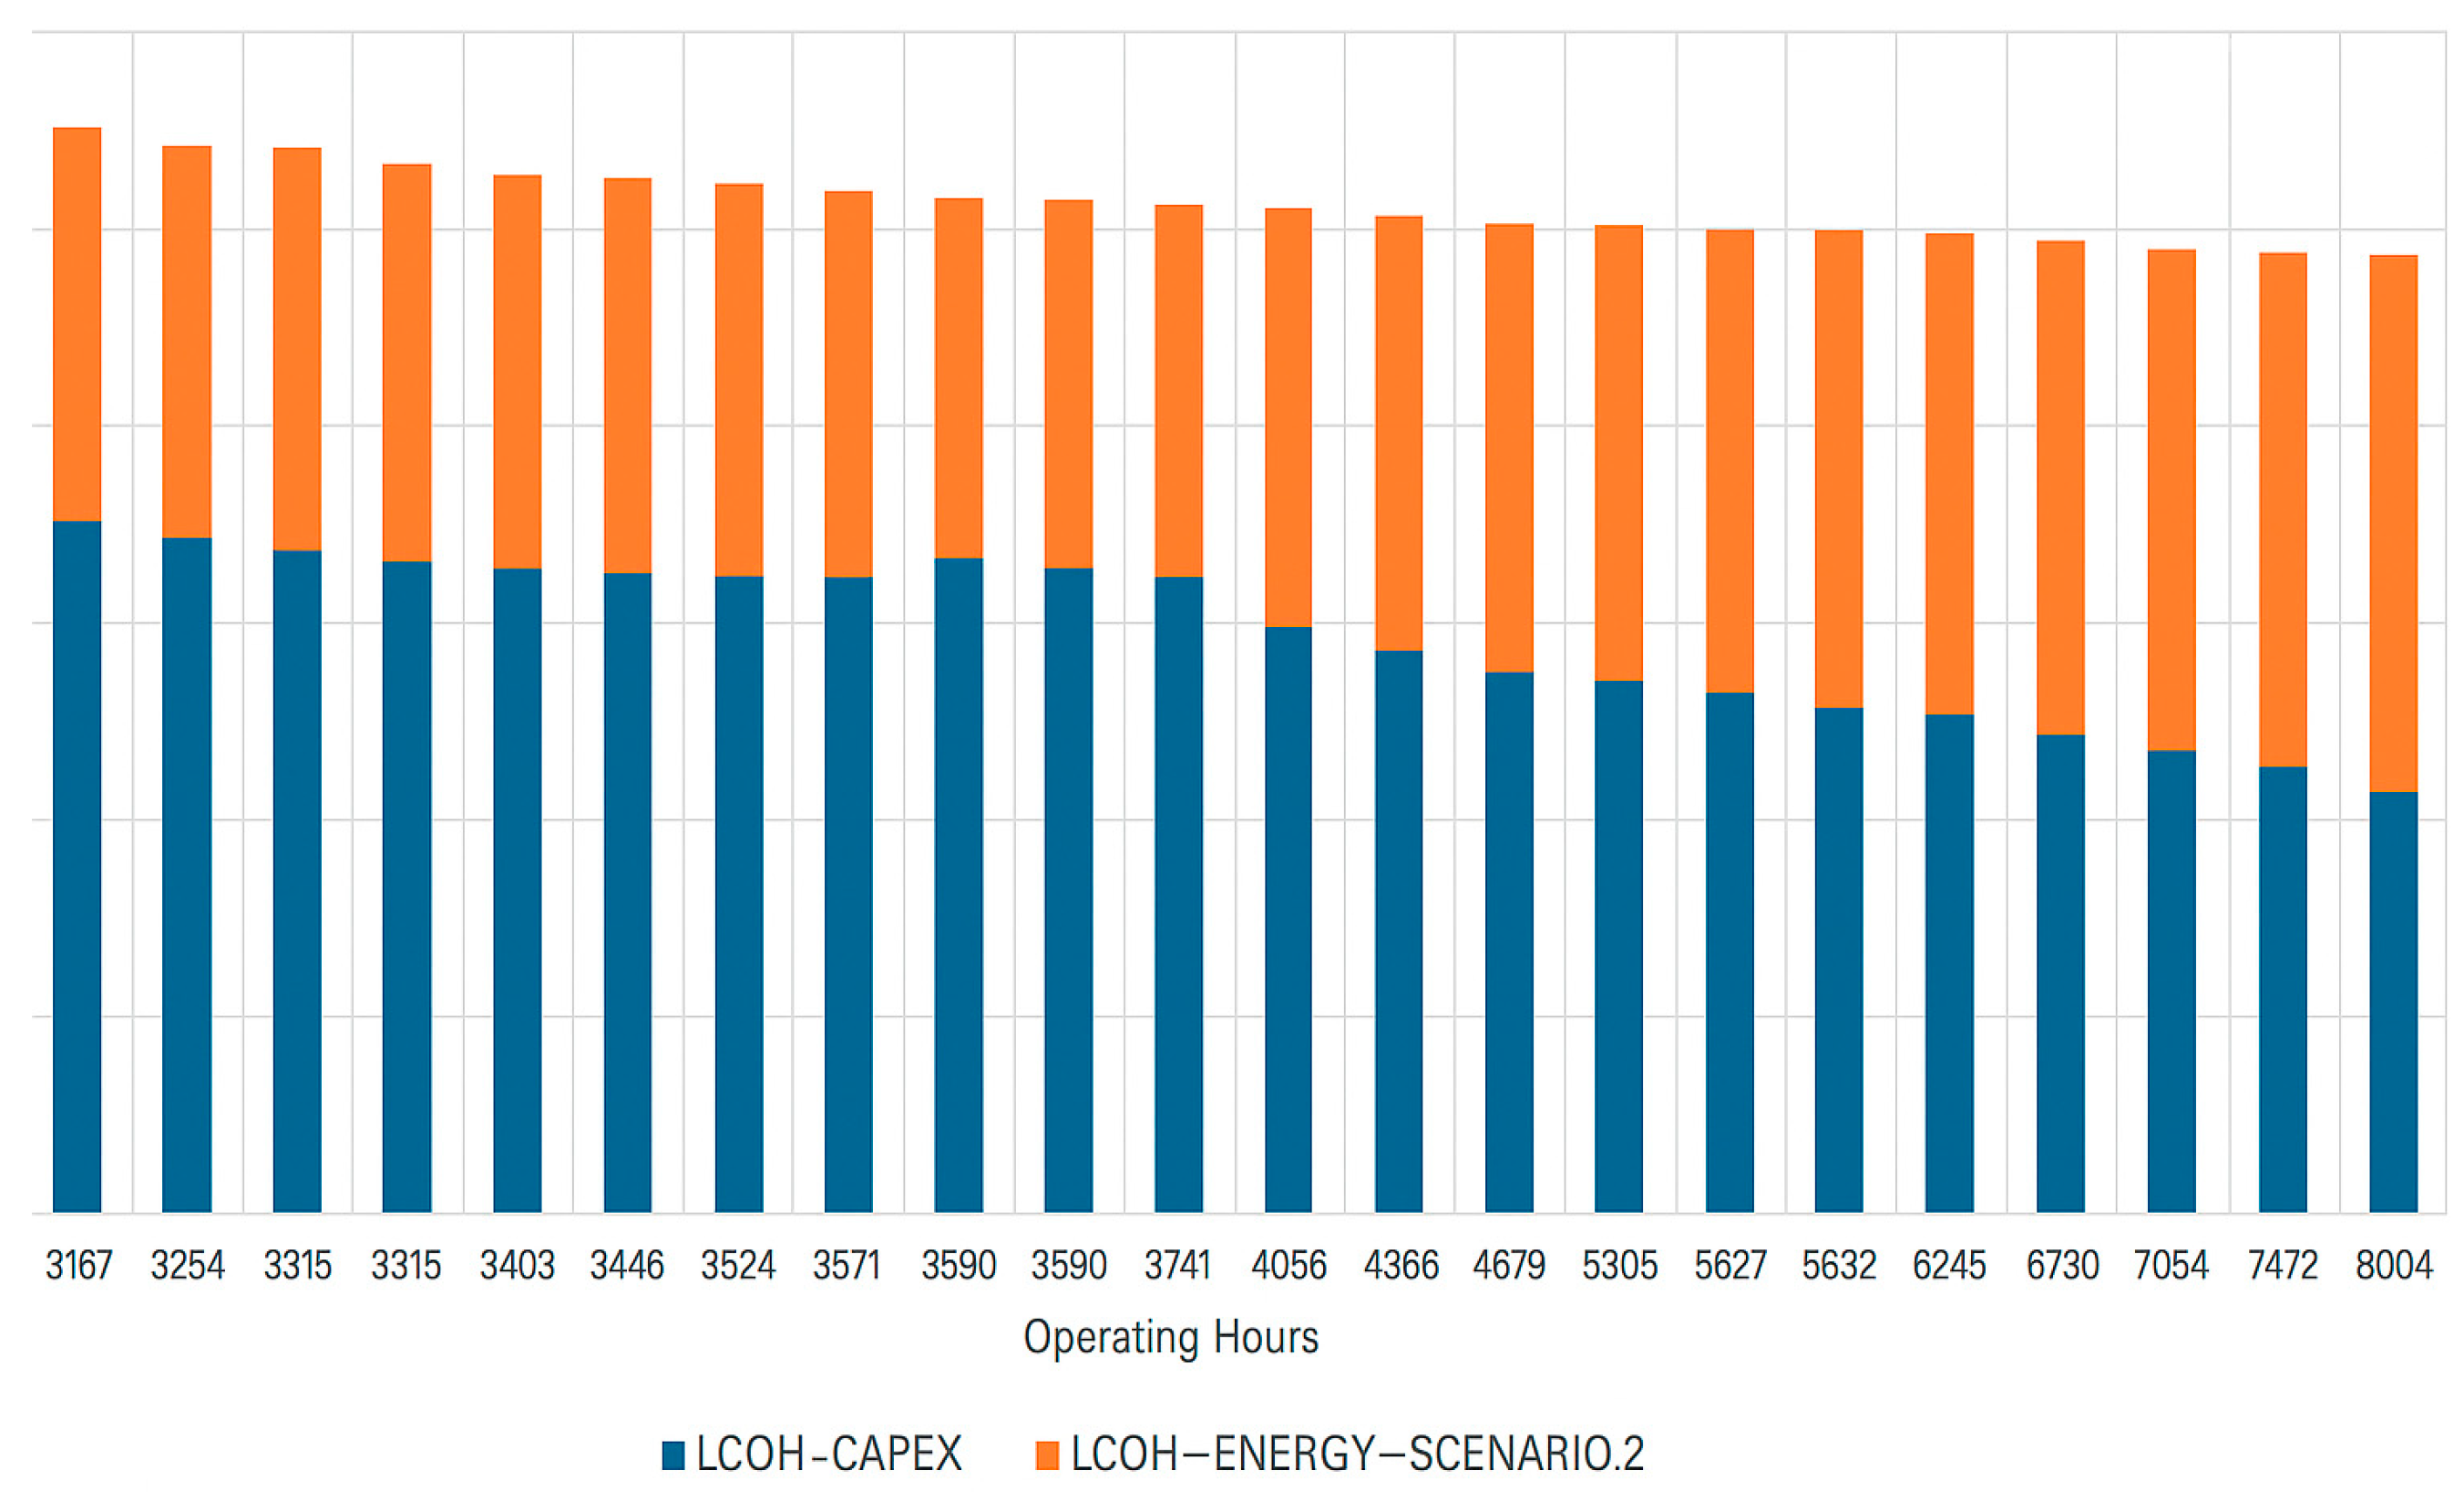
Figure 4 shows the LCOH components (electricity and electrolyzer CAPEX) as a function of operating hours.
5.3. Comparison Between Models
The comparison between the three proposed models—Base Case, Oversizing, and PV and Storage—was carried out based on their respective LCOE and LCOH values, calculated using consistent financial and operational assumptions. Each model represents a different configuration of the PV–electrolyzer system, as summarized in
Table 6, which presents the optimal operating point for each case.
The Base Case model, in which the electrolyzer operates without oversizing or storage, yields an LCOH above €7/kg, primarily due to limited annual operating hours (approximately 1900 h/year) and the underutilization of installed equipment.
In the Oversizing scenario, increasing the PV capacity by 90% significantly raises the available energy and extends the electrolyzer’s annual operation to around 2900 h/year, lowering the LCOH to €5.80/kg. However, the system is still affected by energy curtailment during periods of high irradiance, which limits further cost reductions.
The PV and Storage model achieves the most favorable results. By incorporating a lithium-ion battery system, the electrolyzer operates for more than 8000 h/year, nearly quadrupling the utilization time of the base case. This higher operating stability enables an LCOH of €4.43/kg, despite the additional investment in storage.
This value represents a 40% cost reduction compared to the base case and is below the reference market price for green hydrogen reported by MIBGAS (December 2024: €5.85/kg) according to the official bulletin of the Iberian Gas Market Operator [
23].
The comparative analysis thus demonstrates that incorporating energy storage not only enhances system utilization and efficiency but also places the LCOH of green hydrogen within a commercially competitive range relative to current market benchmarks. This finding supports the technical and economic viability of PV-powered hydrogen production systems with integrated storage under real operating conditions.
5.4. Sensitivity Analysis
The evolution of photovoltaic (PV) and energy storage costs has been decisive in the competitiveness of green hydrogen. Over the last decade, the cost of solar modules has fallen by more than 80%, reaching values of around €0.5 million/MW in the case study. This reduction has consolidated PV as the most competitive renewable technology, with an LCOE in the range of €30–35/MWh in high-irradiation sites such as Seville. In contrast, storage technologies—mainly lithium-ion batteries—are at a less mature stage but offer greater potential for future improvement, given that there remains significant room for price reduction and technical optimization.
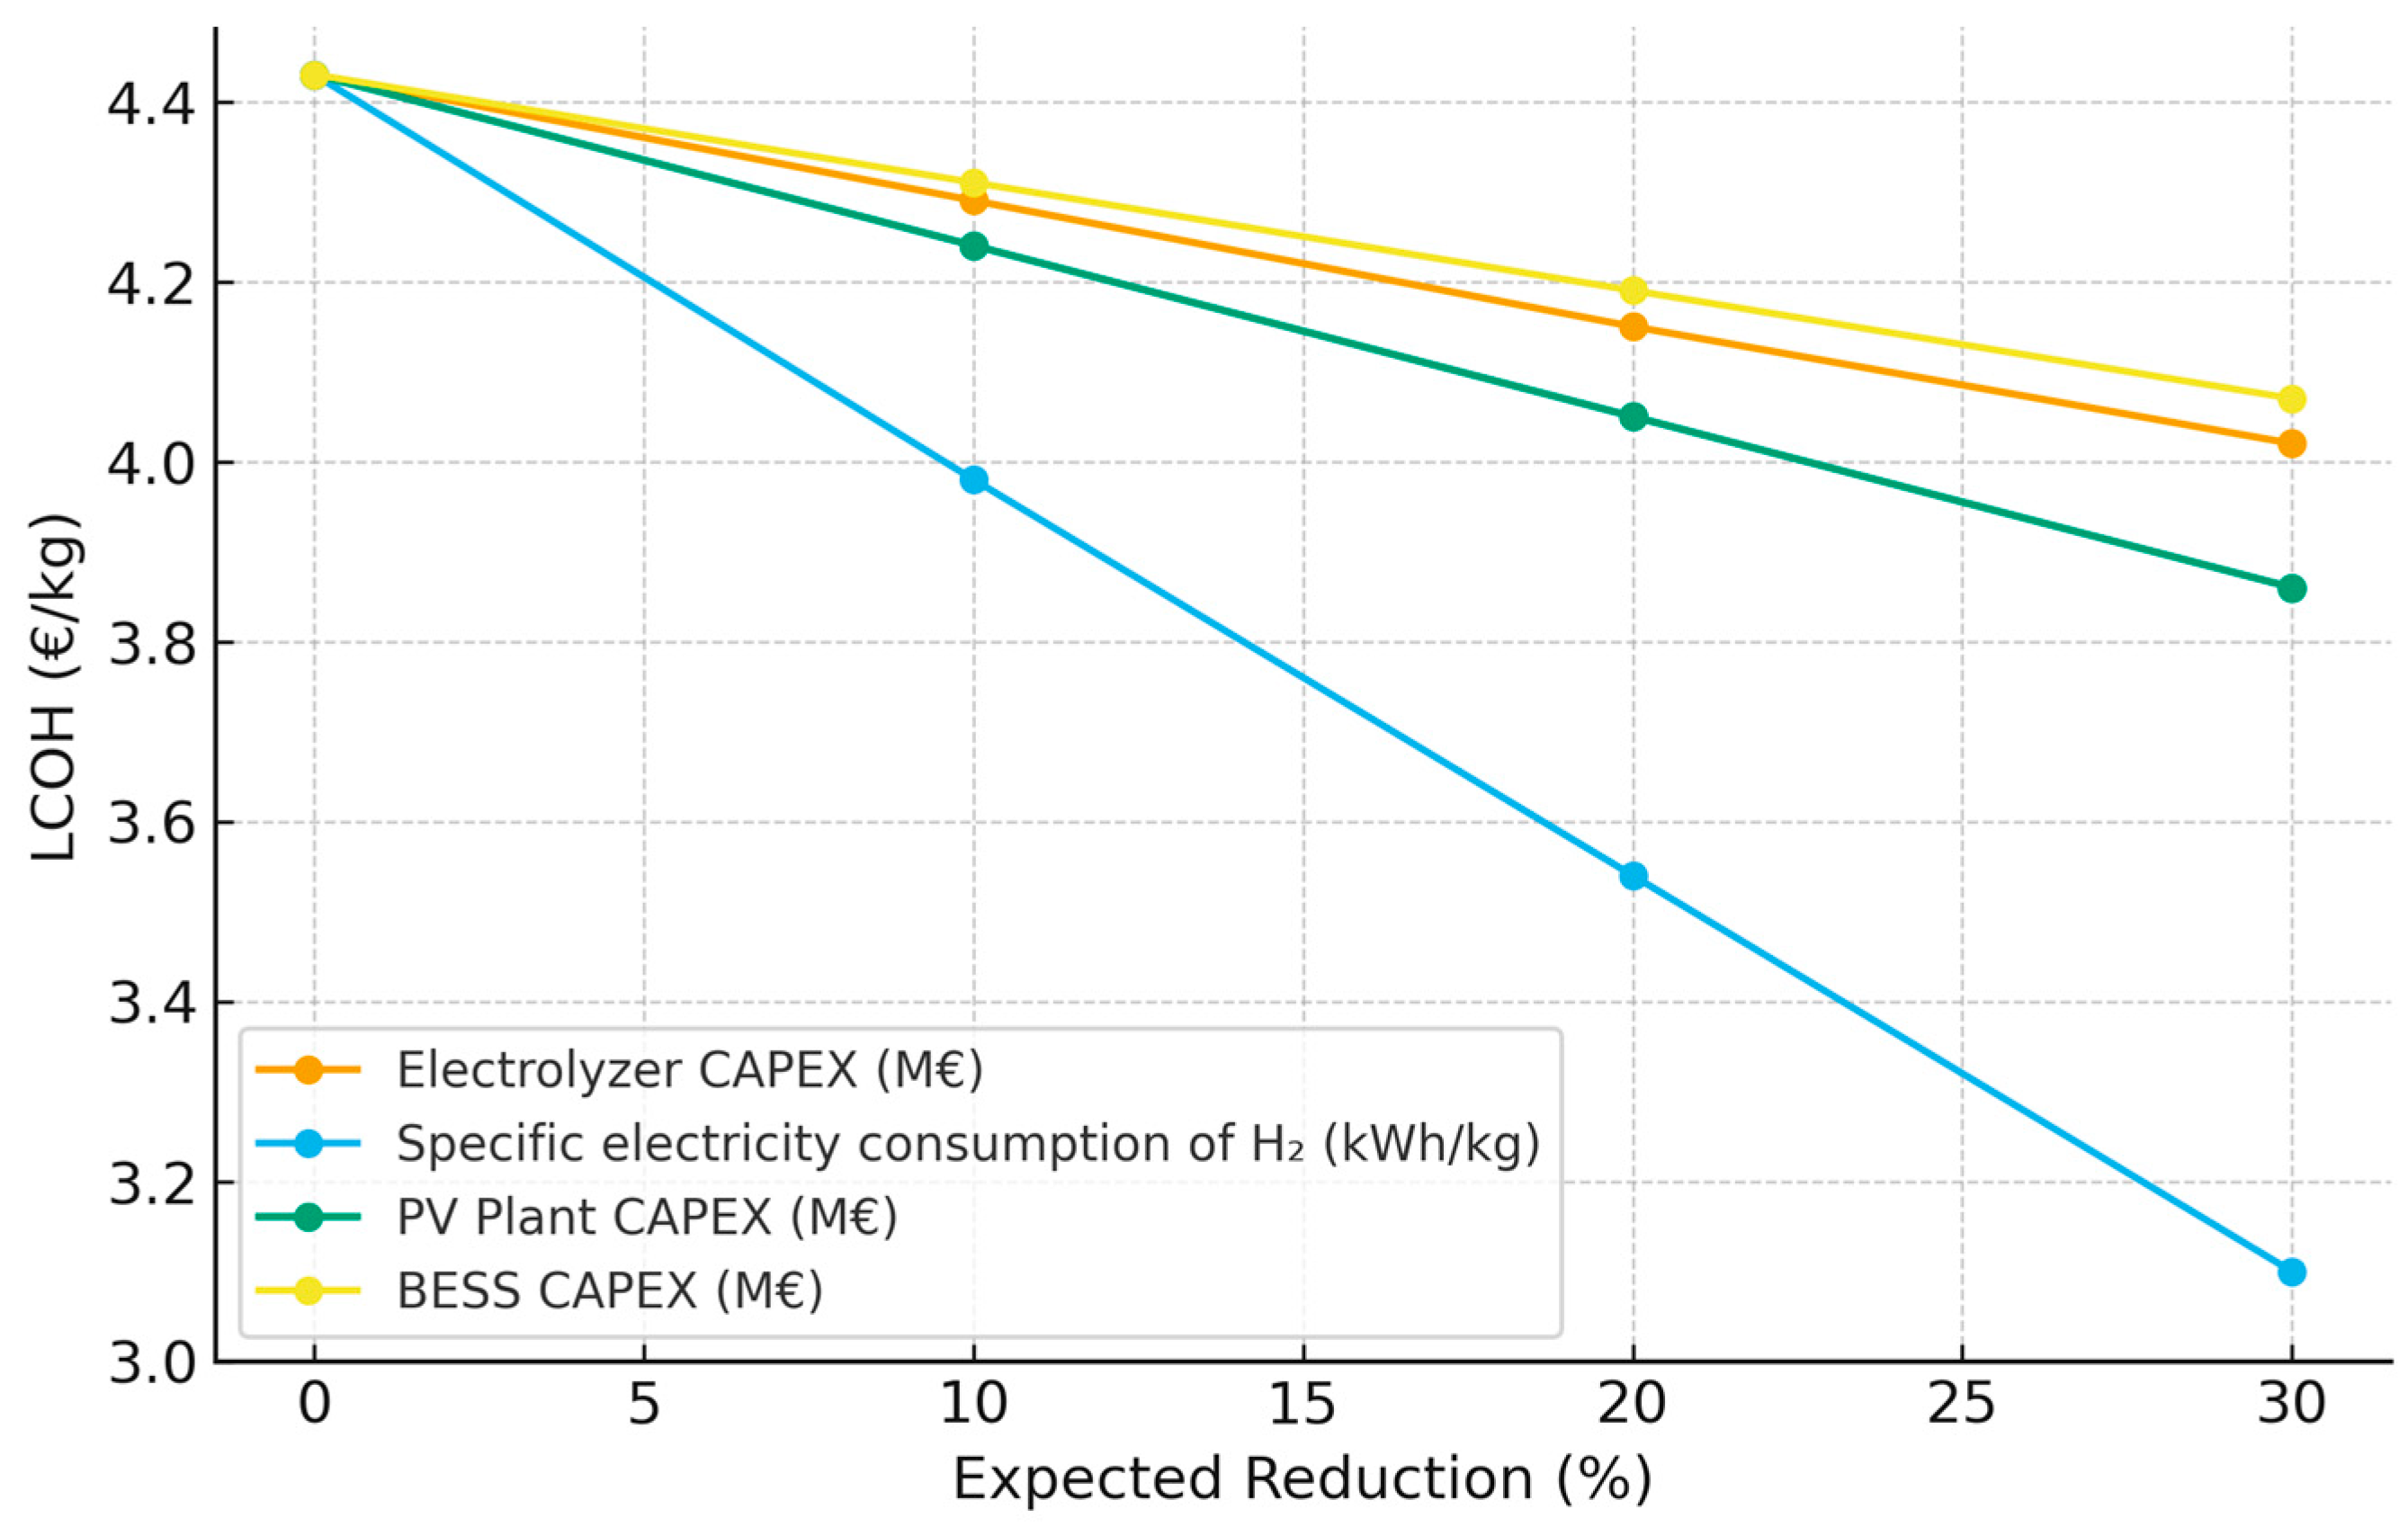
To quantify how these variations affect the Levelized Cost of Hydrogen (LCOH), a sensitivity analysis was performed based on the identified optimal case (LCOH = €4.43/kg with 8004 annual operating hours). Four key parameters were evaluated as follows:
Specific electrical consumption of the electrolyzer (kWh/kg H2).
CAPEX of the photovoltaic plant.
CAPEX of the electrolyzer.
CAPEX of the storage system.
In each of them, reductions of 10%, 20%, and 30% were simulated, representing scenarios of technological progress.
The results in
Table 7 show that the electrolyzer’s specific power consumption is the variable with the greatest impact on LCOH: a 10% improvement translates into an approximate 7.5% reduction in hydrogen costs. The PV plant’s CAPEX has an intermediate impact, with a 3.4% decrease for every 10% reduction, followed by the electrolyzer’s CAPEX (−2.9%). Finally, storage shows the smallest direct effect (−1.1%), although its strategic importance lies in the increase in electrolyzer operating hours and system stabilization.
Figure 5 represents the relative variation in LCOH versus successive reductions of 10%, 20%, and 30% in the four parameters considered. The steepest downward slope is observed in the electrolyzer’s specific power consumption, confirming its priority in reducing the final cost of green hydrogen.
Sensitivity analysis confirms that electricity price is the most critical factor. A ±20% variation in LCOE results in changes of up to ±14% in LCOH. Reducing electrolyzer CAPEX by 25% reduces LCOH by €0.6/kg. Annual operating hours show the greatest impact, drastically reducing LCOH beyond 4000 h of use.
Three main conclusions emerge from this analysis:
Electrolyzer efficiency as a key lever: Reducing specific power consumption offers the greatest cumulative impact on LCOH, with a direct and sustained effect throughout the project’s lifetime.
Storage with strategic value: Although its direct impact on costs is limited, storage enables near-continuous operating regimes, making it possible to overcome solar intermittency. Its potential for future improvement makes it a critical element in the medium term.
Progressive CAPEX reduction: In both photovoltaics and electrolyzers, cost improvements maintain a significant impact on competitiveness, although their relative weight decreases compared to operational efficiency.
Overall, the results show that the path to competitive green hydrogen depends on a delicate balance between technological improvements (more efficient electrolyzers), consolidation of low costs in photovoltaics, and the integration of flexible storage that maximizes asset utilization.
6. Discussion
The comparative analysis of the three proposed models—Base Case, Oversizing, and PV and Storage—demonstrates the strong dependence of the Levelized Cost of Hydrogen (LCOH) on the annual operating hours of the electrolyzer and the stability of the renewable energy supply.
In the Base Case, limited PV capacity and the absence of storage constrain hydrogen production to fewer than 2000 h/year, resulting in a high LCOH of €7.23/kg. This configuration highlights the fundamental challenge of direct PV–electrolyzer coupling underutilization of installed capacity due to intermittency in solar generation.
The Oversizing strategy partially mitigates this problem by increasing available power, extending operation to nearly 2900 h/year and lowering LCOH to €5.80/kg. However, this improvement is achieved at the cost of significant curtailment during peak irradiance, where part of the generated energy must be exported to the grid. While oversizing reduces idle time, it leads to diminishing returns as excess energy becomes increasingly unutilized.
In contrast, the PV and Storage configuration represents the optimal balance between energy availability and system utilization. Integrating a lithium-ion battery allows the electrolyzer to operate for more than 8000 h/year, maintaining close to full-load operation. Although the investment cost (CAPEX) of this configuration is higher due to battery installation, the overall energy utilization efficiency and specific hydrogen output increase substantially. This results in an LCOH of €4.43/kg, the lowest among all cases analyzed.
The selection of this optimal case is therefore not based solely on the minimum cost value, but on its combined technical and economic performance. The PV and Storage configuration achieves
Higher system utilization and reduced curtailment losses,
Improved amortization of fixed costs (CAPEX),
More stable and predictable hydrogen output, and
Enhanced compatibility with market-oriented operation and grid integration.
The results indicate that the LCOH is inversely correlated with electrolyzer operating hours up to a saturation point, beyond which additional capacity or storage yields limited benefit. This confirms that optimizing renewable supply and utilization is more cost-effective than merely increasing installed capacity.
From a broader perspective, these findings demonstrate that PV-powered hydrogen production can achieve market competitiveness when properly sized and combined with storage. The achieved LCOH value of €4.43/kg is below the current market reference price (€5.85/kg, [
23], suggesting near-term feasibility for industrial-scale deployment.
Furthermore, the methodology developed here—based on the integration of hourly simulation, technical optimization, and financial modeling—provides a replicable framework for future studies. It can be applied to other renewable technologies (e.g., wind or hybrid PV–wind systems) and to different locations with varying solar profiles, offering a robust decision-making tool for project developers and policymakers.
Finally,
Table 8 shows the findings of this work, as well as the differences with some of the references used.
7. Conclusions
This work has developed and validated a replicable methodology to optimize the cost of producing green hydrogen (LCOH) from solar photovoltaic energy, applying the analysis to a real-life case in Seville. The approach combines hourly generation simulations with a project-type financial model, allowing for an accurate assessment of the relationship between the cost of renewable energy, the annual operating hours of the electrolyzer, and the impact of the technical design on economic viability.
The results confirm that the low cost of renewable electricity, although necessary, is not sufficient to guarantee hydrogen’s competitiveness. The key lies in maximizing electrolyzer utilization, since the LCOH decreases as the number of annual operating hours increases. The comparative analysis of three configurations—Base Case, Oversizing, and Storage—shows that the integration of lithium-ion batteries is the optimal solution, enabling near-continuous operation.
The optimal scenario identified corresponds to the model with storage, with a 58° panel inclination, 8004 h of annual operation, and an LCOH of €4.43/kg. This value represents a 40% reduction compared to the base case and is 24% below the reference price published by MIBGAS in 2024, validating the model’s competitiveness in a real-world market context.
Sensitivity analysis showed that electrolyzer efficiency is the parameter with the greatest impact on LCOH, followed by the CAPEX of the photovoltaic plant and the electrolyzer, while storage has low elasticity but essential strategic value by increasing useful operating hours. These conclusions highlight the need to prioritize technological innovation in electrolyzers and to promote regulatory and financial schemes that reduce uncertainty and support investment in storage.
Ultimately, this study demonstrates that, through optimized technical design and rigorous financial analysis, it is possible to achieve competitive costs for green hydrogen at real-world sites with high solar irradiation. Furthermore, the proposed methodology is scalable and adaptable to other contexts, constituting a useful tool for investors, policymakers, and developers interested in accelerating the transition to a decarbonized energy system.