Article

Nodal Marginal Price Decomposition Mechanism for the Hydrogen Energy Market Considering Hydrogen Transportation Characteristics

1
School of Electrical and Information Engineering, Southwest Petroleum University, Chengdu 610500, China
2
State Grid Sichuan Electric Power Company, Research Institute, Chengdu 610041, China
*
Author to whom correspondence should be addressed.
Energies 2025, 18(21), 5681; https://doi.org/10.3390/en18215681
Submission received: 7 August 2025 / Revised: 23 October 2025 / Accepted: 27 October 2025 / Published: 29 October 2025
(This article belongs to the Special Issue New Power System Planning and Scheduling)

Abstract

With the growing significance of hydrogen in the global energy transition, research on its pricing mechanisms has become increasingly crucial. Focusing on hydrogen markets predominantly supplied by electrolytic production, this study proposes a nodal marginal hydrogen price decomposition algorithm that explicitly incorporates the time-delay dynamics inherent in hydrogen transmission. A four-dimensional price formation framework is established, comprising the energy component, network loss component, congestion component, and time-delay component. To address the nonconvex optimization challenges arising in the market-clearing model, an improved second-order cone programming method is introduced. This method effectively reduces computational complexity through the reconstruction of time-coupled constraints and reformulation of the Weymouth equation. On this basis, the analytical expression of the nodal marginal hydrogen price is rigorously derived, elucidating how transmission dynamics influence each price component. Empirical studies using a modified Belgian 20-node system demonstrate that the proposed pricing mechanism dynamically adapts to load variations, with hydrogen prices exhibiting a strong correlation with electricity cost fluctuations. The results validate the efficacy and superiority of the proposed approach in hydrogen energy market applications. This study provides a theoretical foundation for designing efficient and transparent pricing mechanisms in emerging hydrogen markets.

1. Introduction

With global industrialization and rising living standards, worldwide energy consumption continues to grow significantly [1]. Addressing climate change and reducing reliance on conventional energy sources have created a consensus to accelerate the deployment of renewable energy and establish clean, efficient, and sustainable energy systems [2,3]. It is projected that the share of renewable energy in total consumption will increase from 14.1% in 2015 to 19.7% in 2035 [4]. However, the integration of renewables faces challenges such as high initial costs, intermittency, geographical dispersion from demand centers, and output volatility [5,6]. Consequently, identifying viable and sustainable alternatives to fossil fuels remains a critical research and policy focus.
Among renewable energy alternatives, hydrogen stands out as a clean and efficient energy carrier capable of mitigating key limitations of variable renewables. Its high energy density, zero-carbon emissions during use, and storage versatility make it a critical enabler of future decarbonized energy systems [7]. In the context of China’s carbon neutrality strategy, hydrogen is poised to play an essential role in facilitating the transition to a low-carbon economy, attracting significant strategic attention globally [8,9,10]. Internationally, hydrogen energy is increasingly recognized as a pivotal component of the new energy transition, supporting climate change mitigation and energy security objectives [11,12,13]. In the construction of China’s future energy system, hydrogen energy will occupy an important position and become a strategic emerging industry. This momentum establishes hydrogen as an essential vector for achieving carbon peaking and neutrality goals [14,15,16,17].
The deep coupling between electricity and hydrogen energy systems, from both technical and socio-economic perspectives, represents a promising pathway for future energy development [18]. However, hydrogen markets remain nascent, characterized by underdeveloped trading mechanisms and insufficient integration with electricity markets. This leads to information asymmetry and transactional inefficiencies across energy flows and market structures [19,20]. The pricing mechanism, as the core of market design, is therefore paramount. Given that the cost of electrolytic hydrogen production is predominantly driven by electricity consumption, hydrogen prices are inherently correlated with power prices, reflecting the operational interdependence of integrated electricity–hydrogen markets [21,22].
This intrinsic price coupling has spurred significant research interest, which can be broadly categorized into several streams. The authors of [18] propose policy recommendations for market design, infrastructure regulation, and certification systems in the future European hydrogen market. Meanwhile, Ref. [23] evaluates three cooperative market-pricing scenarios incorporating price-sensitive demand, green production, and market penetration effects, as well as exploring the prospects for hydrogen energy pricing and demand dynamics. Ref. [24] introduces a synergy-based hydrogen pricing mechanism that capitalizes on the synergies between renewable energy power systems and hydrogen energy systems, effectively integrating infrastructure and operational improvements between the systems. Ref. [25] develops a dynamic hydrogen pricing mechanism linked to the share of renewables and incorporates it into a game-theoretic optimization. Ref. [26] proposes a time-decoupled hierarchical optimization strategy for the low-carbon operation of integrated energy-transport systems under dynamic hydrogen pricing. Ref. [27] proposes a hydrogen-energy-based dynamic pricing mechanism for hydrogen refueling stations augmented by blockchain technology. Ref. [28] formulates an electricity–hydrogen trading model based on a bi-level Stackelberg game, considering locational marginal pricing effects to maximize economic efficiency. Ref. [29] designed an integrated electricity–hydrogen market framework and proposed a two-stage market clearing model based on Shapley values. Ref. [30] develops a two-layer optimization model where the upper layer handles multi-energy microgrid bidding and the lower layer simulates pricing for electricity, heat, and hydrogen markets using a novel cost estimation method.
While the aforementioned studies have provided valuable insights into hydrogen pricing, a critical gap remains in capturing the unique physical characteristics of hydrogen transmission within the pricing mechanism. As the industry shifts from fossil-fuel-based production to electrolytic hydrogen, the pricing paradigm must evolve from a cost-plus model to one that reflects its real-time coupling with electricity markets and the transportation network. Existing models, such as those in [24,25], have made strides in linking hydrogen and power costs but largely overlook the impact of pipeline transport physics. Specifically, the time-delay characteristics and linepack dynamics of hydrogen pipelines, which fundamentally differentiate hydrogen transport from electricity transmission and introduce critical temporal constraints, are not adequately represented in current marginal price formulations. This omission can lead to price signals that fail to reflect the true marginal cost of hydrogen delivery, thereby hindering market efficiency.
The main contributions of this study are summarized as follows:
  • The study constructs a comprehensive marginal price decomposition framework for hydrogen markets, explicitly incorporating the time-delay characteristics of pipeline transport. This framework introduces the Time-Delay Component (TDC) as a fundamental price element, alongside the traditional energy component (EC), network loss component (NLC) and congestion component (CC), providing a more complete reflection of the physical realities and costs of hydrogen energy delivery. The improved second-order cone programming method is proposed to solve the non-convex problem in hydrogen market modeling. This problem arises from time-period coupling constraints and the Weymouth equation. The method significantly reduces computational complexity.
  • We propose an improved second-order cone programming algorithm to address the nonconvexities arising from the Weymouth equation and intertemporal coupling constraints. This method transforms the original problem into a tractable mixed-integer second-order cone programming problem through a series of reformulations and introduces an iterative penalty mechanism to ensure convergence, significantly reducing computational complexity while maintaining high solution accuracy.
  • The research quantifies the dominant role and dynamic coupling of each price component under various operational conditions, confirming that the nodal marginal price decomposition mechanism accurately captures the drivers of spot prices, including network congestion, transmission loss, and temporal delay effects. Experiments demonstrate that the improved second-order cone programming algorithm is computationally efficient and scalable for solving real-world problems. Furthermore, comparative analysis of pricing mechanisms reveals the superiority of nodal marginal pricing in facilitating high renewable energy integration and large-scale hydrogen development, providing theoretical and practical support for building an efficient hydrogen market.
The organization of the study is as follows. Section 2 develops the foundational hydrogen market clearing model, establishing core constraints and assumptions. Building upon this framework, Section 3 enhances the model through the improved second-order cone algorithm to resolve nonconvex optimization challenges. Section 4 subsequently establishes the theoretical basis for nodal marginal hydrogen pricing in integrated hydrogen markets. Within this pricing framework, the marginal price decomposition mechanism is implemented. Case studies and result analysis are conducted in Section 5, and Section 6 presents the conclusions.

2. Hydrogen Market Modeling

2.1. Market Structure and Assumptions

With reference to the basic form of the electricity market, this section establishes a framework for a hydrogen energy market dominated by electrolytic hydrogen production. Under this framework, hydrogen producers and consumers submit supply and demand curves to the trading center, respectively. The trading center then determines the optimal hydrogen production schedule and nodal hydrogen prices through centralized clearing, with the objective of minimizing total production costs. Similarly to electricity markets, hydrogen markets need to satisfy core constraints such as hydrogen balance, hydrogen production operation constraints, and hydrogen transmission constraints. At the same time, there are significant spatio-temporal dynamic characteristics in the hydrogen energy transmission process. Its transmission time lag leads to the persistent existence of hydrogen inventory within the pipeline network system. This provides the hydrogen transmission pipeline with a function similar to an energy storage system. This enables dynamic adjustment of hydrogen energy in the market operation. Therefore, when constructing the hydrogen energy clearing model, a spatio-temporal coupled optimization framework that incorporates the dynamic state relationship of pipelines must be established to maximize the efficiency of the spatio-temporal allocation of resources.
To establish a solvable and representative market clearing model that focuses on revealing the core impact of hydrogen transmission dynamics on node electricity prices, the following assumptions were made:
  • Market timescales: A static time-series optimization framework using a uniform day-ahead market trading cycle that ignores real-time market dynamics.
  • Load Characteristics: Hydrogen loads constitute rigid demand and do not consider demand-side elastic response mechanisms.
  • Supply-side structure: All hydrogen producers use electrolytic hydrogen plants, assuming that the electrolysis plant operates at a constant efficiency. Electricity and hydrogen conversion satisfy a linear relationship.
  • Pipe network modeling: Neglect topographic elevation differences and radial air pressure gradients, assuming that the pipe network has uniform temperatures and constant flow rates and does not require spatial discretization.
  • Market Behavior: Hydrogen producers offer at true marginal cost, no strategic gaming behavior.

2.2. Basic Hydrogen Market Clearing Model

2.2.1. Objective Function

The objective function of the hydrogen market clearing model is to minimize the total cost of hydrogen production for all hydrogen producers in the market:
min F = t = 1 T s = 1 S π s , t Q s , t H 2
where s is the index of electrolytic hydrogen production units; t is the index of the current time period; T is the collection of time slots; S is the collection of electrolytic hydrogen generation plants; π s , t is the cost factor for electrolytic hydrogen production unit s at time period t; Q s , t H 2 is the hydrogen production by electrolysis unit s at time t; and F is the cost of hydrogen production in the hydrogen market.

2.2.2. Constraints of the Hydrogen Energy Market Model

The constraints of the hydrogen energy market model are as follows:
  • Cost Factor for Hydrogen Production
π s , t = π s , t EL L HHV / 3600 η s s , t
Equation (2) is used to ensure that the cost factor for hydrogen production in electrolytic hydrogen production units. π s , t EL is the electricity price for time period t at the node where the electrolytic hydrogen production unit s is located; L HHV is the hydrogen high calorific value of hydrogen; and η s is the Energy conversion efficiency of electrolytic hydrogen production unit s.
2.
Hydrogen Market Node Hydrogen Pressure
P m , min P m , t P m , max m , t
The hydrogen market node hydrogen pressure limit is ensured by constraint (3). P m , t is the hydrogen pressure at node m at time period t; P m , min and P m , max are the boundaries of hydrogen pressure at node m.
3.
Electrolytic Hydrogen Production
Q s , min H 2 Q s , t H 2 Q s , max H 2 : ζ s , t min , ζ s , t max s , t
Constraint (4) imposes a production limit on hydrogen generation from electrolytic hydrogen production equipment. Q s , min H 2 and Q s , max H 2 are the boundaries for the amount of hydrogen produced by electrolytic hydrogen production equipment s; ζ s , t min and ζ s , t max are the Lagrange multipliers corresponding to the hydrogen production boundary of an electrolytic hydrogen production device s.
4.
Pipeline Hydrogen Transmission
Q m n , t = C m n sgn ( P m , t , P n , t ) P m , t 2 P n , t 2 sgn ( P m , t , P n , t ) = 1 P m , t > P n , t 1 P m , t < P n , t m n Φ H 2 , t
Constraint (5) is used to describe the transport constraints of a hydrogen pipeline, where the pipeline hydrogen flow is a function of the hydrogen pressure at the ends of the pipeline. C m n is the pipeline coefficient constant for hydrogen pipeline mn; Q m n , t is the hydrogen flow in hydrogen pipeline mn at time period t; Φ H 2 is the hydrogen pipeline pool; sgn ( ) is the symbolic function.
5.
Hydrogen Transportation Pipeline Flow
Q m n , t = Q m n , t IN + Q m n , t OUT / 2 m n Φ H 2 , t
Q m n , max Q m n , t IN Q m n , max : ξ m n , t min , ξ m n , t max m n Φ H 2 , t
Q m n , max Q m n , t OUT Q m n , max : ω m n , t min , ω m n , t max m n Φ H 2 , t
Q m n , max Q m n , t Q m n , max : υ m n , t min , υ m n , t max m n Φ H 2 , t
In (6), take the average of the input flow rate and output flow rate of the hydrogen transportation pipeline as the hydrogen flow rate of the pipeline. Constraints (7)–(9) are used to limit the flow limit of the hydrogen transport pipeline. Q m n , t IN and Q m n , t OUT are the input/output flow rate for hydrogen pipeline mn time slot t; Q m n , max is the boundaries for transmission capacity of pipeline mn; ξ m n , t min and ξ m n , t max are the Lagrange multipliers corresponding to the input flow constraints of the pipe mn; ω m n , t min and ω m n , t max are the Lagrange multipliers corresponding to the pipeline mn output flow constraints; υ m n , t min and υ m n , t max are the Lagrange multipliers corresponding to pipeline mn flow constraints.
6.
Delay Properties of Hydrogen Transportation
The formulations of key equations, particularly Equation (6) for hydrogen flow and Equation (11) for linepack storage, are based on deliberate simplifications that are well-established in the literature for large-scale energy system modeling These approximations are adopted to achieve computational tractability for the network-wide optimization problem while retaining the essential physical dynamics of hydrogen transmission. Specifically, Equation (6) utilizes the arithmetic mean of inlet and outlet flows to represent the pipeline segment flow, a common approach that ensures mass conservation without resorting to computationally expensive dynamic flow simulations. Similarly, Equation (11) employs a lumped-parameter model to estimate the linepack inventory from averaged pressure, which is a standard method for capturing storage dynamics in gas pipeline networks without solving full partial differential equations. It is emphasized that the primary focus of this work is the development of a nodal pricing mechanism that incorporates hydrogen-specific transmission properties; thus, these pragmatic modeling choices allow us to maintain focus on the core economic and operational insights.
V m n , t = V m n , t 1 + Q m n , t IN Q m n , t OUT m n Φ H 2 , t
V m n , t = C m n P m , t + P n , t / 2 m n Φ H 2 , t
m n Φ H 2 V m n , 0 = m n Φ H 2 V m n , T : ι
0 V m n , t V m n , max : ς m n , t min , ς m n , t max m n Φ H 2 , t
Equation (10) defines the relationship between the amount of hydrogen stored in the pipeline at intervals separated by time. The pipeline storage of hydrogen is calculated as shown in constraint (11). Constraint (12) describes that the pipeline storage of hydrogen should satisfy that the initial moment is in balance with the end moment. In (13), the upper and lower limits of the pipeline storage of hydrogen, denoted by 0 and V m n , max . V m n , t is the pipeline storage of hydrogen mn at time period t; ι is the Lagrange multipliers corresponding to hydrogen storage constraints at the initial and ending moments of the pipeline; ς m n , t min and ς m n , t max are the Lagrange multipliers corresponding to boundary constraints on pipeline hydrogen storage capacity;
7.
Nodal Hydrogen Balance Constraints
s m Q s , t H 2 ρ IN ( m n ) = m Q m n , t IN + ρ OUT ( m n ) = m Q m n , t OUT = E m , t : λ m , t m , t
Equation (14) is the nodal hydrogen balance constraint. E m , t is the hydrogen load of node m at time period t; ρ IN m n = m and ρ OUT m n = m are the set of hydrogen transport pipelines mn with node m as start/end node; λ m , t is the Lagrange multipliers corresponding to nodal hydrogen balance constraints.
However, because Equation (10) is an equality constraint, the partial derivatives with respect to the state variables are zero. Applying the LMP decomposition algorithm to the current market model fails to yield the TDC of prices, necessitating modifications to the model. This limitation stems from the time-delay nature of hydrogen transmission: due to the time-lag difference between the pipeline input and output flows, it triggers the time-order variation of the pipeline storage. Notably, the physical property that a single pipeline maintains the same flow direction during the same time period provides a theoretical basis for model modification. By reconfiguring the constraint form, the model maintains the physical rationality and meets the general form requirements, thus realizing the effective resolution of the TDC. Based on Equations (6) and (10), the expressions for hydrogen input and output in the pipeline can be modified to Equations (15) and (16). The constraints of the modified pipeline hydrogen input flow and output flow are shown in Equations (15) and (16):
Q m n , t IN = Q m n , t + V m n , t V m n , t 1 / 2 : σ m n , t IN m n Φ H 2 , t
Q m n , t OUT = Q m n , t V m n , t V m n , t 1 / 2 : σ m n , t OUT m n Φ H 2 , t
where σ m n , t IN and σ m n , t OUT are the Lagrange multipliers corresponding to constraints on pipeline hydrogen input/output flows.

3. Modified Hydrogen Market Clearing Model by Improved Second-Order Cone Algorithm

Due to the adoption of the Weymouth equation to describe the hydrogen transport process, the basic hydrogen market clearing model presents significant nonlinear and nonconvex properties, which pose substantial challenges to its solution. Although segmented linearization methods are widely used to deal with such problems in the current study, their approximate treatment inevitably introduces computational inaccuracies [31,32]. To overcome this limitation, we introduced a relaxation gap penalty term and an iterative update mechanism, drawing inspiration from Ref. [33]. This led to the development of a novel equation transformation method that effectively reduces the computational complexity of the original problem while maintaining computational accuracy, thereby achieving a balance between solution efficiency and precision.

3.1. Weymouth Equation Model Transformation

The sign function of the constraint model is removed by simultaneously squaring and introducing binary variables at both ends of constraint (5), and the transformed constraint is shown in Equation (17):
Q m n , t 2 / C m n 2 = ( Π m , t Π n , t ) ( x m n , t IN x m n , t OUT ) m n Φ H 2 , t
In Equation (17), Π m , t is the square of hydrogen pressure at node m; x m n , t IN and x m n , t OUT are the binary variable for the direction of hydrogen flow in pipe mn at time period t; The binary variables x m n , t IN and x m n , t OUT should satisfy that there can be only one flow direction of hydrogen flow in a hydrogen pipeline during the same time period, as shown in constraint (18):
x m n , t IN + x m n , t OUT = 1 m n Φ H 2 , t
With the introduction of binary variables characterizing the direction of hydrogen flow, the pipeline flow constraints (7)–(9) of the hydrogen market clearing model can be transformed into constraints (19)–(21):
1 x m n , t IN Q m n , max Q m n , t IN 1 x m n , t OUT Q m n , max m n Φ H 2 , t
1 x m n , t IN Q m n , max Q m n , t OUT 1 x m n , t OUT Q m n , max m n Φ H 2 , t
1 x m n , t IN Q m n , max Q m n , t 1 x m n , t OUT Q m n , max m n Φ H 2 , t
By transforming the Weymouth equation constraints, the square of the nodal hydrogen pressure Π m , t can replace the nodal hydrogen pressure P m , t as a new variable. Meanwhile, since both the pipe storage constraint and the nodal hydrogen pressure constraint expressions contain nodal hydrogen pressure. Therefore, the previous section constraints (3) and (5) can be transformed into Equations (22) and (23):
V m n , t = C m n Π m , t + Π n , t / 2 : θ m n , t m n Φ H 2 , t
Π m , min Π m , t Π m , max : ϑ m , t min , ϑ m , t max m , t
where θ m n , t is the Lagrange multipliers corresponding to the pressure squared constraints of the pipe mn hydrogen storage and nodes m, n; ϑ m , t min and ϑ m , t max are the Lagrange multipliers corresponding to the constraint on the square of the pressure at node m; Π m , min and Π m , max are the boundaries of the square of the pressure at node m.
The right-hand side of the transformed pipeline hydrogen transport constraint (17) is the product of discrete and continuous variables; this is a strongly nonconvex constraint, so we need to relax the constraint. From Equation (23), we can obtain the following equation:
Π m , min Π n , max Π m , t Π n , t Π m , max Π n , min Π n , min Π m , max Π n , t Π m , t Π n , max Π m , min m , n , t
The left-hand side of Equation (17) is set to X m n , t . The transformation of Equation (17) by combining Equation (24) can be obtained:
X m n , t = Q m n , t 2 / C m n 2 m n Φ H 2 , t
X m n , t x m n , t IN x m n , t OUT + 1 Π m , min Π n , max + Π n , t Π m , t m n Φ H 2 , t
X m n , t x m n , t IN x m n , t OUT 1 Π m , max Π n , min + Π m , t Π n , t m n Φ H 2 , t
X m n , t x m n , t IN x m n , t OUT + 1 Π m , max Π n , min + Π n , t Π m , t m n Φ H 2 , t
X m n , t x m n , t IN x m n , t OUT 1 Π m , min Π n , max + Π m , t Π n , t m n Φ H 2 , t
In (25), X m n , t is the auxiliary variables associated with the pipeline mn. After a relaxation transformation of the above strongly nonconvex constraints into four mixed integer linear constraints (26)–(29), the computational complexity of the original problem is reduced.

3.2. Improved Second-Order Cone Algorithm

After transforming the Weymouth equation in the hydrogen market clearing model, the original problem is reformulated as a mixed-integer quadratically constrained programming (MIQCP) problem. However, the model retains nonconvex quadratic constraints, which remain a computational challenge. To address this, an improved second-order cone algorithm is employed. Specifically, Equation (25) is converted into the following form:
X m n , t Q m n , t 2 / C m n 2 m n Φ H 2 , t
Among them, Equation (30) is a non-convex constraint that is difficult to solve and Equation (31) is a convex constraint with low computational complexity. Therefore, this study proposes an improved second-order cone algorithm for Equation (30). First, the first-order Taylor expansion of Equation (30) and the introduction of auxiliary variables ϖ m n , t k realize the relaxation of the following equation:
X m n , t Q m n , t k 1 2 + 2 Q m n , t k 1 Q m n , t k Q m n , t k 1 / C m n 2 ϖ m n , t k
where Q m n , t k is the hydrogen flow rate in the pipe in mn during time period t during the kth iteration; ϖ m n , t k is the relaxation gap after Taylor expansion of the pipe mn time slot t during the kth iteration.
In order to ensure that the auxiliary variable ϖ m n , t k can present monotonically decreasing characteristics during the iterative updating process, ϖ m n , t k is added to the objective function, and, since the objective function is cost minimization, its convexity characteristics and constraints can be constructed to ensure that the iterative sequential formulas satisfy the convergence conditions and ensure that the objective function presents strictly monotonically decreasing characteristics during the parameter updating process, so as to guarantee the monotonically decreasing tendency of the ϖ m n , t k . After the above transformation, the original problem with nonconvex characteristics is transformed into a mixed-integer second-order cone programming problem:
min Μ k = t = 1 T s = 1 S π s , t Q s , t H 2 + m n Φ H 2 ν k ϖ m n , t k
ν k = min μ ν k 1 , ν max
In (33) and (34), Μ k is the objective function of mixed-integer second-order cone planning problem in the kth iteration after transformation; ν k is the penalty factor that increases with the number of function iterations k; and μ is the incremental growth coefficient for penalty factors.
The above iterative solution process adopts the double convergence criterion; when the two convergence conditions of the following equation are satisfied at the same time, it means that the relaxation gap of the iterative process is less than the set range, and the optimization is considered converged. Otherwise, we iteratively update the penalization factor and carrying out the next iteration until the double convergence conditions are satisfied, in which the κ M , κ ϖ convergence conditions are preset thresholds:
Μ k M k 1 κ M t = 1 T m n Φ H 2 ϖ m n , t k κ ϖ
In (35), κ M and κ ϖ are the predefined thresholds for convergence conditions during iterations.
The specific flow of the improved second-order cone algorithm is shown in Figure 1 below.
Based on the constructed improved second-order cone programming solution framework, the global optimal solution of the hydrogen energy market clearing model and its corresponding nodal marginal hydrogen price parameter system can be obtained effectively. In order to deeply analyze the formation mechanism of nodal marginal hydrogen price, this study innovatively proposes a price decomposition algorithm based on a sensitivity analysis. It should be noted that this algorithm is not used to solve the original optimization problem but is based on the converged optimal solution of the market clearing model and the dual variables, and it realizes the structured decomposition of price signals through the establishment of multilevel correlation mappings.
This algorithm is chosen because it does not involve re-solving the original optimization problem and therefore effectively circumvents the computational complexity due to the nonconvexity of the model. However, it should be emphasized that, in order to realize the effective separation of the TDC of the nodal marginal hydrogen price, the temporal coupling constraints in the original model need to be structurally reconstructed, and, at the same time, an equivalent substitution mechanism for the time-varying state parameters should be introduced, which is shown in the transformation of the node barometric state variables. The detailed implementation steps for the node–edge hydrogen price decomposition algorithm are provided in Appendix A.
The nodal marginal hydrogen price not only contains EC, CC, NLC but also introduces TDC due to the time-delay characteristic of hydrogen transmission in the pipeline, whose decomposition form and mathematical expressions for each component can be expressed as follows:
λ r , t = λ r , t EC + λ r , t NLC + λ r , t CC + λ r , t TDC
λ r , t EC = 1 λ r , t
λ r , t NLC = 1 J r , t 1 Q r , t L / X t T λ r , t
λ r , t CC = S r , t U t T α t + S r , t R t T β t + J r , t 1 P / X t T δ t
λ r , t TDC = S r , t R t T β t J r , t 1 Q t L / X t T λ t
In (36)–(40), λ r , t is the hydrogen prices at non-reference nodes; λ r , t EN is the EC of hydrogen price at non-reference nodes; λ r , t NLC is the NLC of hydrogen prices at non-reference nodes; λ r , t CC is the CC of hydrogen price at non-reference nodes; λ r , t TDC is the TDC of hydrogen price at non-reference nodes.

4. Implementation of Marginal Price Decomposition in the Hydrogen Market Clearing Model

Based on the theoretical framework established in Section 3, this section applies the nodal marginal hydrogen price decomposition algorithm to the actual hydrogen market clearing model to verify the effectiveness and applicability of the proposed method. Section 3 systematically derived the global optimal solution and the corresponding parameter system for the nodal marginal hydrogen price and proposed a novel price decomposition algorithm based on sensitivity analysis. By constructing the Jacobian matrix and the hydrogen transmission sensitivity matrix, this algorithm successfully decouples the EC, CC, NLC, and TDC of the nodal marginal price. This lays a theoretical foundation for accurate marginal pricing in the hydrogen energy market. Based on the foundation of the previous theoretical results, this section decomposes the marginal price of the hydrogen market clearing model.

4.1. A Lagrangian Function for Hydrogen Market Clearing Model

Due to the time-delay characteristics of the hydrogen transmission process, the TDC is introduced into the marginal price of hydrogen, and, in order to obtain the TDC, the original temporal coupling constraints need to be transformed and the original state variable node pressure a is replaced by P m , t , a new state variable Π m , t , to obtain the following equation:
Q m n , t = C m n sgn ( Π m , t , Π n , t ) Π m , t Π n , t sgn ( Π m , t , Π n , t ) = 1 Π m , t > Π n , t 1 Π m , t < Π n , t : ε m n , t m n Φ H 2 , t
In (40), ε m n , t is the Lagrange multiplier corresponding to boundary constraints on nodal squared pressures.
By multiplying the internal constraints by their corresponding Lagrange multipliers and adding the results to the objective function, a new hydrogen market clearing model is obtained. The vector form of the Lagrange function for the hydrogen market clearing model is shown in formula (A18) of Appendix B.

4.2. KKT Conditions for Hydrogen Market Clearing Model

In this section, based on the optimality condition analysis of the hydrogen market clearing model, the KKT condition system of the model is systematically constructed, and the key Jacobian matrix is deeply studied. By taking the partial derivatives of the constructed Lagrangian function with respect to the state variable vectors in the current time period, the optimality conditions of the hydrogen market clearing model can be rigorously deduced. It should be specifically noted that, among the model optimization variables, there is no functional dependence between the hydrogen production of hydrogen producers and the state variables, so their partial derivatives are constant zero. Further analysis shows that the parameters of nodal hydrogen load, upper and lower limits of barometric pressure squares, hydrogen production constraint boundaries, pipeline transmission capacity limits, and pipeline storage constraints are all model constant terms, and their partial derivatives to the state variables are also zero. Based on the above mathematical properties, the complete KKT conditional expression for the hydrogen market clearing model is finally derived as follows:
L / Π t T = ρ OUT ( m n ) = r Q m n , t OUT ρ IN ( m n ) = r Q m n , t IN / Π t T λ r , t Q m n , t OUT Q m n , t IN / Π t T λ t ρ OUT ( m n ) = r Q m n , t OUT ρ I N ( m n ) = r Q m n , t IN / Π t T λ r , t + Π m , t / Π t T ϑ m , t max Π m , t / Π t T ϑ m , t min + Q m n , t I N / Π t T ξ m n , t max + Q m n , t IN / Π t T ξ m n , t max Q m n , t IN / Π t T ξ m n , t min Q m n , t IN / Π t T ξ m n , t min + Q m n , t OUT / Π t T ω m n , t max + Q m n , t OUT / Π t T ω m n , t max Q m n , t OUT / Π t T ω m n , t min Q m n , t OUT / Π t T ω m n , t min + Q m n , t / Π t T υ m n , t max Q m n , t / Π t T υ m n , t min + V m n , t / Π t T ς m n , t max V m n , t / Π t T ς m n , t max m n Φ H 2 V m n , T / Π t T ι = 0
Equation (42) completely describes the KKT optimality condition for the hydrogen market clearing model. Due to the time-domain coupling between the pipeline hydrogen input flow and output flow, its value depends on the hydrogen storage in the previous time period, while the hydrogen storage in the current time period is only related to the state variable in the current time period. This dynamic relationship leads to an indirect correlation between the pipeline flow rate in time period t + 1 and the state variables in the current time period, while the constraints in other time periods do not have a direct impact on the current time period. Therefore, in Equation (42), except for the current time period t, only the constraints of time period t + 1 need to be taken into account, and the coupling effects of the remaining time periods can be ignored. This conclusion not only simplifies the expression form of the KKT condition but also provides an important theoretical basis for the decomposition of the marginal hydrogen price at subsequent nodes. Based on this conclusion, the following inference can be obtained:
ρ OUT ( m n ) = m Q m n , t OUT ρ IN ( m n ) = m Q m n , t IN / Π t T λ t = ρ OUT ( m n ) = m Q m n , t OUT ρ IN ( m n ) = m Q m n , t IN / Π t T λ t + 1
Q m n , t IN / Π t T ξ m n , t min = Q m n , t + 1 IN / Π t T ξ m n , t + 1 min Q m n , t IN / Π t T ξ m n , t max = Q m n , t + 1 IN / Π t T ξ m n , t + 1 max
Q m n , t OUT / Π t T ω m n , t min = Q m n , t + 1 OUT / Π t T ω m n , t min Q m n , t OUT / Π t T ω m n , t max = Q m n , t + 1 OUT / Π t T ω m n , t + 1 max
It should be noted that the time-domain coupling relationship described by the above equation does not apply at the termination time period T. This is because, at the end point of the optimization time domain, there is no optimization variable at time period T + 1 involved in the derivation operation. This boundary property arises from the special nature of the beginning and end equilibrium constraints of the dynamic equations for hydrogen storage: this constraint produces non-zero values only in the derivation of the state variables at the termination time, while the storage at the initial time, as a known parameter, does not participate in the optimization. Therefore, the beginning and end equilibrium constraints of the equation. The hydrogen pipe inventory dynamic equation essentially constitutes a coupling component specific to the termination time.

4.3. Jacobian Matrix for Hydrogen Market Clearing Model

Based on the hydrogen market clearing model established in the previous section, the construction of the Jacobian matrix is a key link in resolving the mechanism of nodal marginal hydrogen price formation. According to the definition, the Jacobian matrix characterizes the sensitivity relationship of the non-reference node net hydrogen injection to the system state variables. In the actual hydrogen energy network modeling, the mathematical expression of the Jacobian matrix is as follows:
J r , t = ρ OUT ( m n ) = r Q m n , t OUT ρ IN ( m n ) = r Q m n , t IN / Π t T

4.4. Nodal Marginal Hydrogen Prices for Hydrogen Market Clearing Model

Based on the KKT condition and Jacobian matrix expression derived in the previous section, the analytical expression for the non-reference nodal marginal hydrogen price can be rigorously derived in this study. Based on the KKT condition and Jacobian matrix expression of the actual hydrogen market clearing model, the expression of the nodal marginal hydrogen price at non-reference points can be obtained:
λ r , t = 1 λ r , t + 1 J r , t 1 ρ OUT ( m n ) = r Q m n , t OUT ρ IN ( m n ) = r Q m n , t IN / Π t T λ r , t + J r , t 1 Π m , t / Π t T ϑ m , t max ϑ m , t min + Q m n , t IN / Π t T ξ m n , t max ξ m n , t min + Q m n , t OUT / Π t T ω m n , t max ω m n , t min + Q m n , t / Π t T υ m n , t max υ m n , t min + V m n , t / Π t T ς m n , t max ς m n , t max + J r , t 1 Q m n , t + 1 OUT Q m n , t + 1 IN T / Π t + 1 λ t + 1 + Q m n , t + 1 IN / Π t T ξ m n , t + 1 max ξ m n , t + 1 min + Q m n , t + 1 OUT / Π t T ω m n , t + 1 max ω m n , t + 1 min m n Φ H 2 V m n , T / Π t T ι

5. Case Studies

5.1. Basic Information

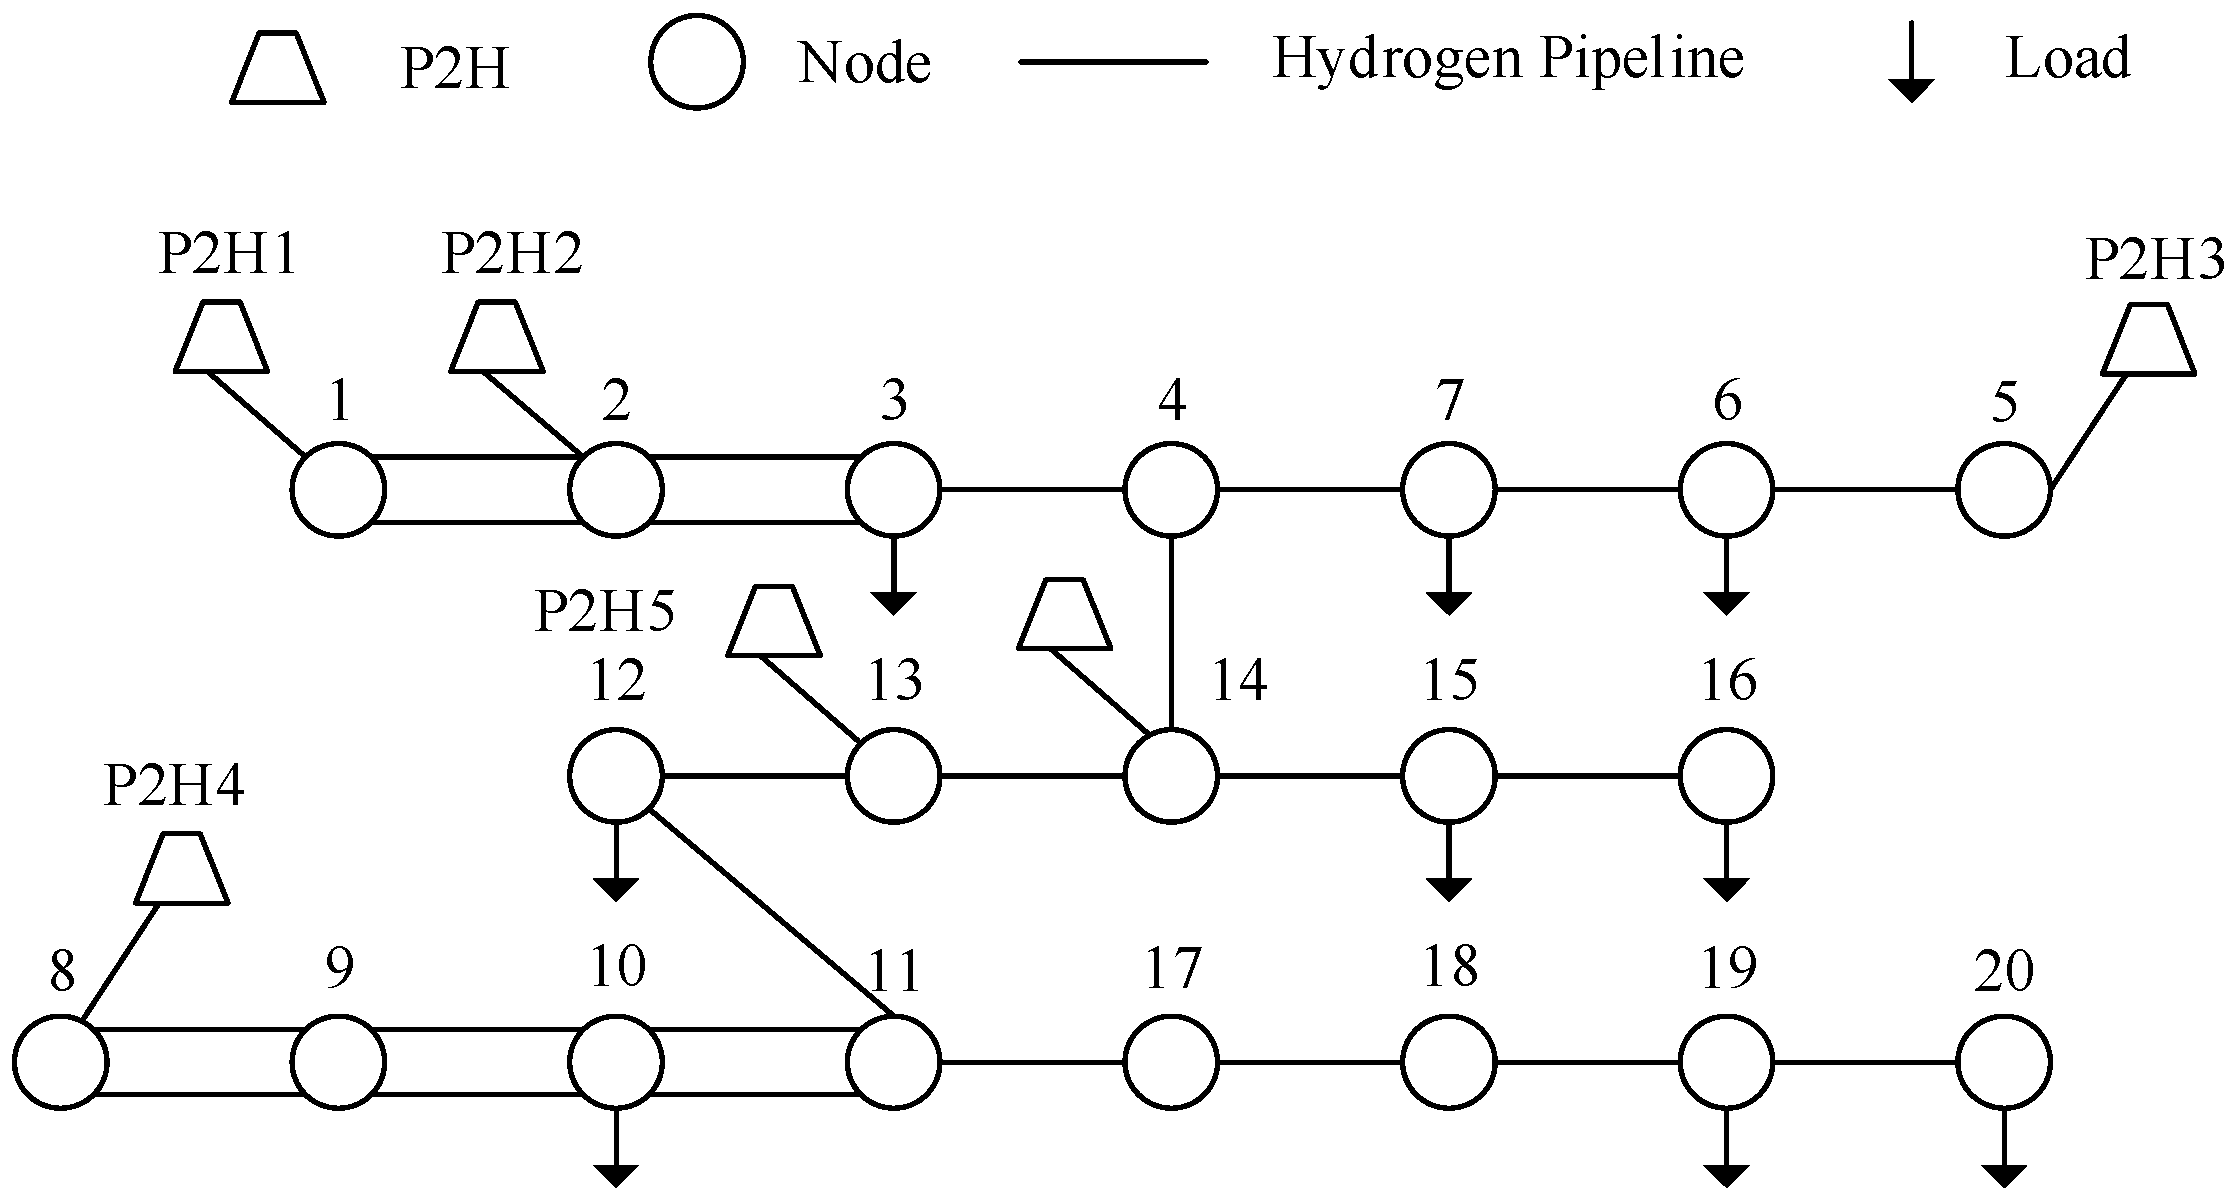
This section empirically validates the proposed nodal marginal hydrogen price decomposition algorithm based on the Belgian 20-node system. As shown in Figure 2, the test system contains six sets of electrolytic hydrogen production units, nine load nodes and 24 hydrogen transmission pipelines, constituting a typical regional-level hydrogen energy network infrastructure. The data used in this study were sourced from Connecticut (PJM) market operational data.
Currently, the primary methods for producing hydrogen through water electrolysis include alkaline water electrolysis (AWE), proton exchange membrane (PEM), and solid oxide electrolysis (SOE). AWE technology is relatively mature, featuring durable equipment and lower production costs. However, it operates at relatively low current densities and is best suited for environments with stable power supply. PEM electrolysis exhibits high current density, high efficiency, compact size, and excellent flexibility. However, its production costs remain relatively high at present. While SOE demonstrates good stability and high efficiency, it is still in the experimental stage. Therefore, as the earliest commercialized water electrolysis technology for hydrogen production, AWE is more mature compared to other methods. This chapter selects AWE as the production method for electrolytic hydrogen generation. Its equipment parameters are shown in Table 1.
The system load data are generated based on the scaled load of the PJM market, which maintains the spatial and temporal distribution characteristics of the original load curve, and the simulation period is set to be 24 trading hours to reflect the dynamic changes in the actual hydrogen demand. Under the market mechanism of centralized clearing, the optimization objective is to minimize the cost of hydrogen production in the whole system, and multiple constraints such as nodal hydrogen balance, dynamic characteristics of pipeline hydrogen transmission, and operational constraints of the hydrogen storage device are comprehensively considered. The test case is designed to ensure the typicality of the network scale and computational efficiency, and it also provides a reliable empirical basis for verifying the performance of the algorithm in terms of spatial resolution of price signals, accuracy of quantization of TDC, computational efficiency and numerical stability through the introduction of actual market data and the dynamic characteristics of the complete hydrogen system, especially the pipeline gas storage effect and the electricity–hydrogen price transmission mechanism.

5.2. Comparison of Different Pricing Mechanisms

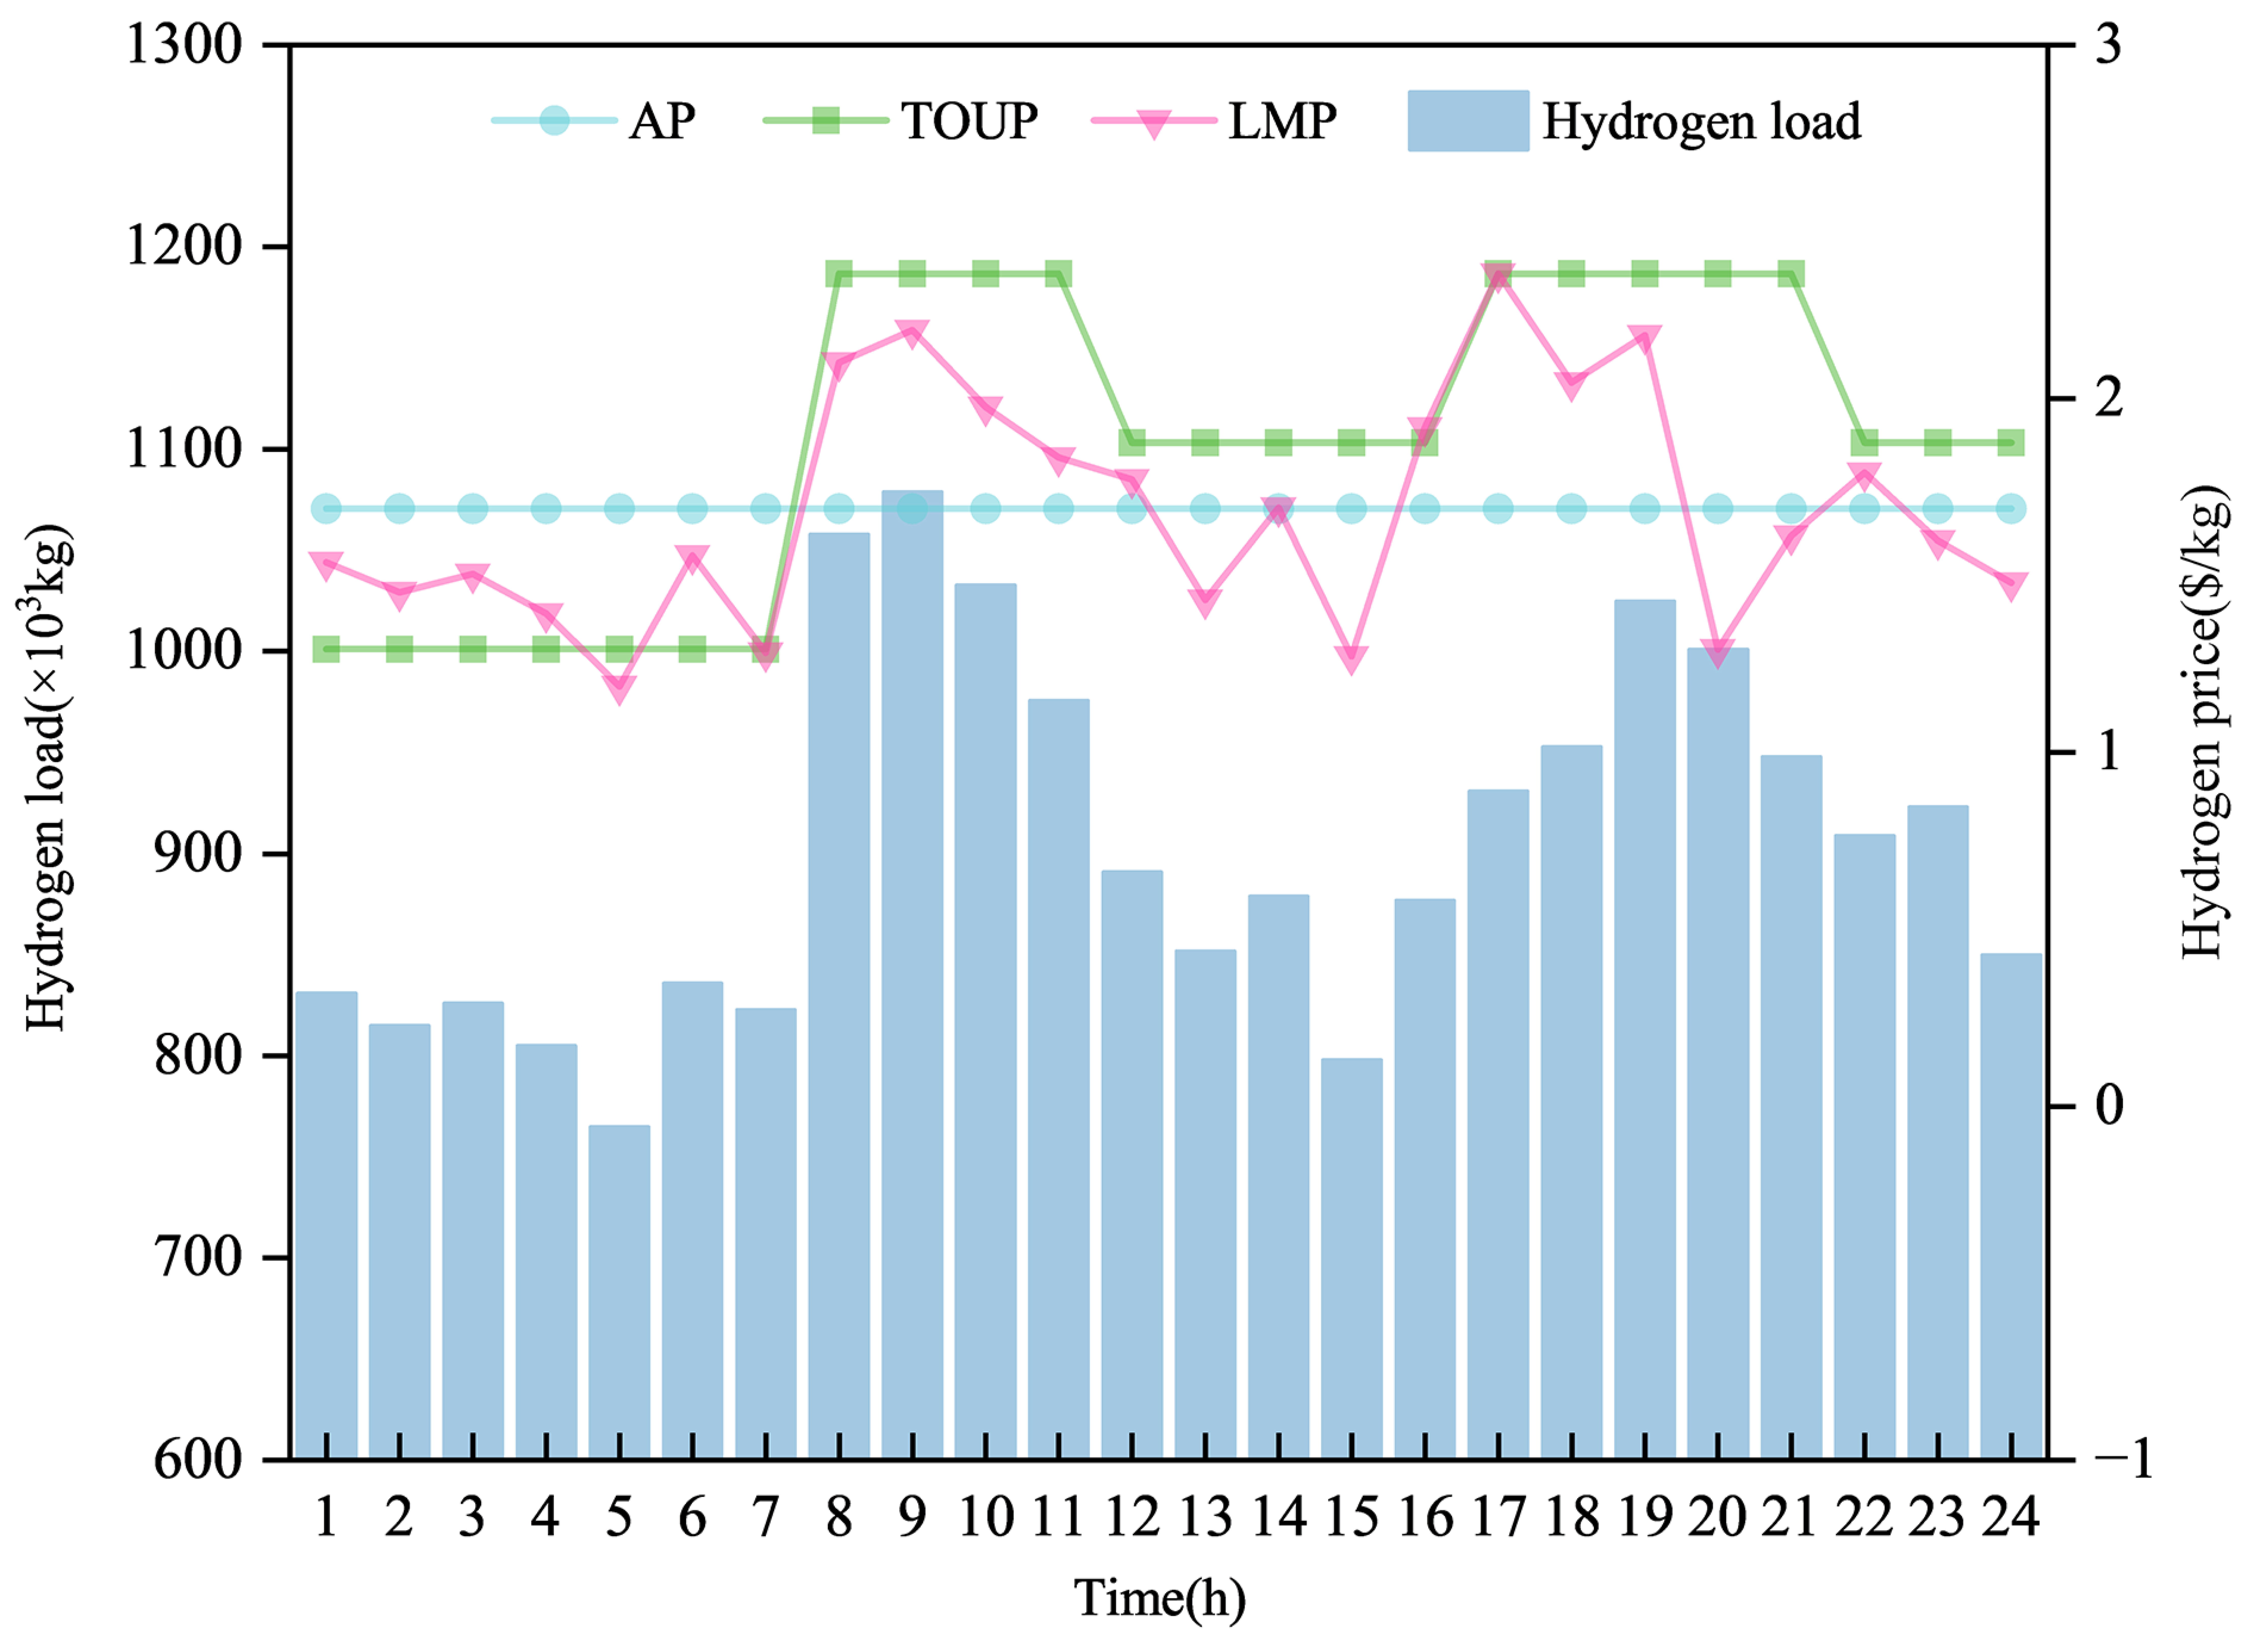
This section compares hydrogen energy prices under three pricing mechanisms, namely, the LMP (locational marginal pricing) mechanism, the AP (average pricing) mechanism, and the TOUP (time-of-use pricing) mechanism. Among them, the AP mechanism, which means that the hydrogen energy price remains constant and equal to the average of the nodal marginal hydrogen price during the trading cycle, is calculated as follows:
λ m , t AV = t = 1 T m = 1 M λ m , t E m , t / t = 1 T m = 1 M E m , t
In (66), λ m , t AV represents the hydrogen prices under the AP mechanism; M is the collection of model nodes for the hydrogen energy market.
Current hydrogen pricing is mainly based on a cost-plus approach, with hydrogen prices remaining stable over the trading cycle, so the AP mechanism represents a cost-plus pricing approach. The TOUP mechanism is based on the load curve and divides the trading day into three time periods (peak, flat and valley) and guides users to optimize their hydrogen use behavior while maintaining the predictability of the price signal through the dynamic linkage with the peak and valley spreads in the electricity market. The detailed parameters of the TOUP mechanism are shown in Table 2.
The comparison of hydrogen prices under the above three pricing mechanisms is shown in Figure 3. The experimental data show that, among the three pricing mechanisms, the AP mechanism has the highest price stability, and its price does not change with the fluctuation in the hydrogen load. This rigidity prevents the AP mechanism from reflecting actual supply–demand dynamics or electricity price variations, which is particularly problematic for electrolytic hydrogen production where electricity costs constitute the primary operational expense. The prices of both the TOUP mechanism and the LMP mechanism show a strong positive correlation with load, where the price of the TOUP mechanism rises to 1.25 times the benchmark value during peak hours and then falls to 0.69 times the benchmark value during the trough hours. The results show that the AP mechanism is unable to respond to load fluctuations due to price fixing, which leads to inefficient resource allocation, especially in scenarios where electrolytic hydrogen production is dependent on electricity prices. It is difficult for the AP mechanism to reflect the transmission effect of electricity price fluctuations on hydrogen costs. In contrast, a TOUP mechanism differentiates hydrogen prices by dividing peak, valley, and flat time periods through preset time periods. The core advantage of this mechanism is that it uses price signals to guide users to stagger their hydrogen use, suppressing non-essential demand and easing network congestion through high hydrogen prices at peak hydrogen loads, as well as stimulating consumption to improve equipment utilization by lowering prices at low load valleys. The advantages of this mechanism are transparent pricing rules and low implementation thresholds, making it suitable for the initial market or regional small-scale hydrogen energy systems. However, the TOUP mechanism struggles to respond dynamically to changes in supply and demand caused by sudden drops in renewable energy output or load surges due to extreme weather, resulting in price signals lagging behind actual supply and demand conditions. Moreover, the TOUP mechanism ignores spatial variability, and transmission losses at different nodes or regional supply-demand imbalances during the same time period are masked by homogenized pricing, which may exacerbate local resource mismatch.
On the other hand, the LMP mechanism dynamically integrates the marginal cost of the hydrogen market by quantifying transmission losses and regional supply and demand differences through the nodal marginal hydrogen price decomposition algorithm. Although the price fluctuation of the LMP mechanism is drastic, its fluctuation logic is highly synergistic with the hydrogen load. Its price change can accurately reflect the scarcity of resources in the market. This dynamic pricing mechanism incentivizes producers to increase production and consumers to adjust demand through real-time price signals, thus optimizing the balance between supply and demand in the market. The advantage of the LMP mechanism stems from its multi-dimensional dynamic pricing capabilities. On the one hand, the nodal marginal hydrogen price decomposition algorithm quantifies transmission losses and regional supply and demand differences, which solves the spatial homogenization pricing defects of the TOUP mechanism. Its price fluctuation is lower than that of the TOUP mechanism, which reflects the scarcity of the resource while maintaining the stability of the market. On the other hand, the AP mechanism is completely unable to transmit power cost fluctuations in the electrolysis hydrogen production scenario, which is dependent on the electricity price, due to the price fixation. In summary, the LMP mechanism, with its real-time sensitivity, spatial optimization capability, and electricity–hydrogen coupling efficiency, becomes the optimal pricing mechanism to support the scale development of hydrogen energy market and the high proportion of renewable energy consumption, while the time-period pricing mechanism and the AP mechanism are limited by the rigid time-period delineation and the static price characteristics, respectively, and are only applicable to a specific transition stage or local scenarios.

5.3. Decomposition of Nodal Marginal Hydrogen Valence

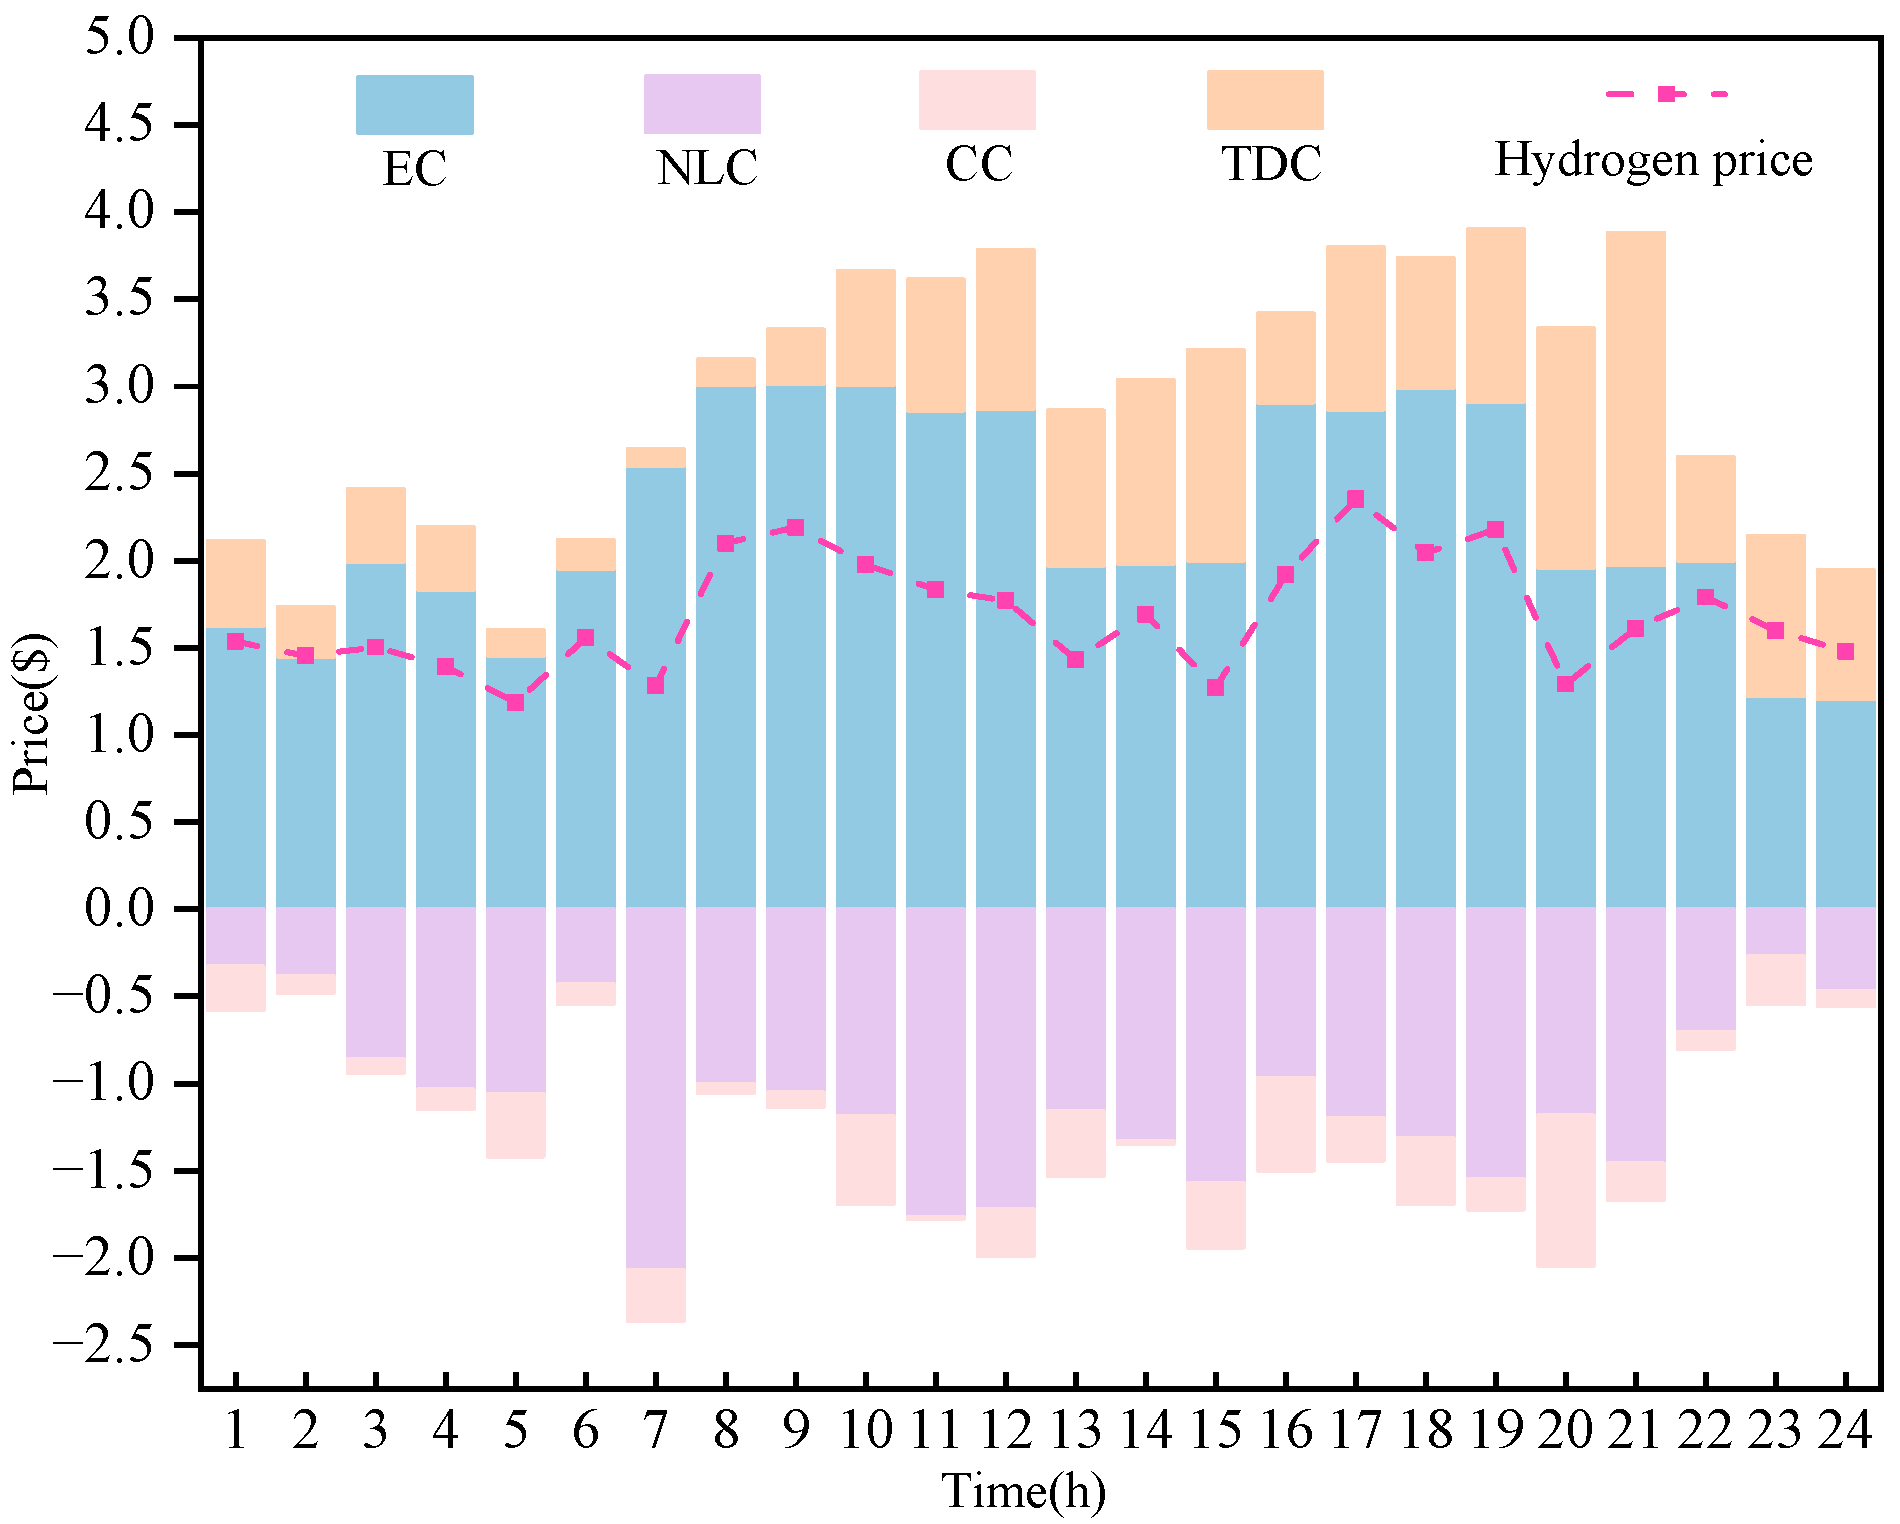
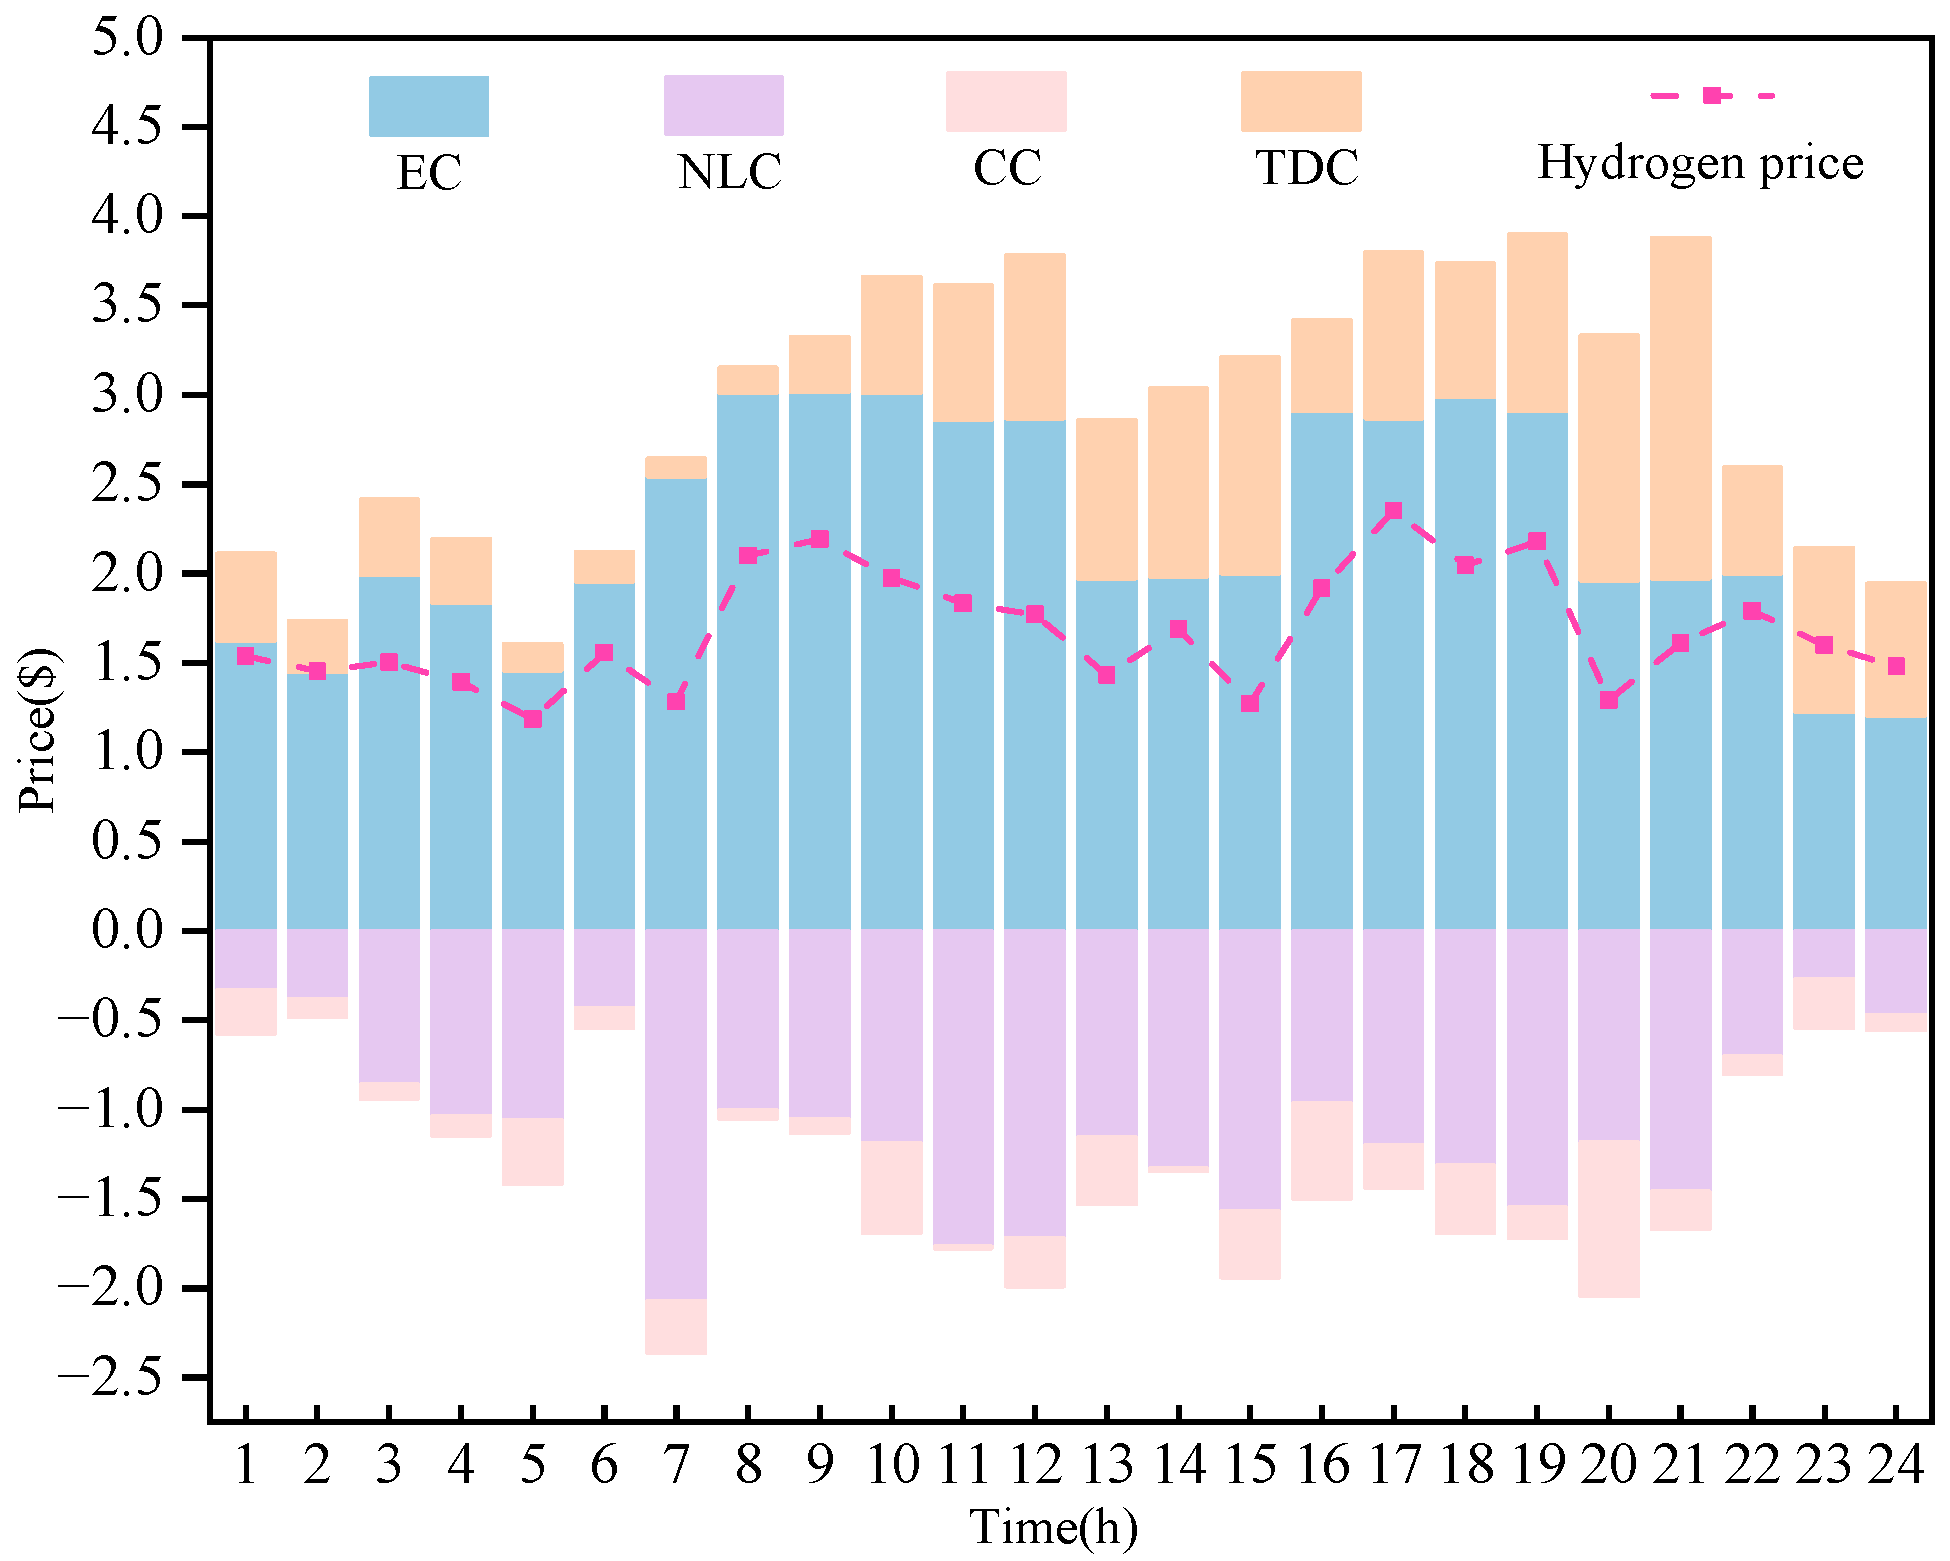
In this section, we analyze the decomposition of the node marginal hydrogen valence and select node 2 as the reference node, and the decomposition of the node marginal hydrogen valence is shown in Figure 4.
This section systematically analyzes the dynamic coupling relationship of each cost component in the price formation mechanism of the hydrogen market based on 24 h hydrogen market operation data. The experimental results show that the hydrogen price exhibits significant bimodal fluctuation characteristics, forming price peaks at 8:00–9:00 in the morning and 17:00–18:00 in the evening.
The component decomposition reveals that the dynamics of hydrogen prices are mainly dominated by the EC, which accounts for 72.4% to 93.8% of the overall price fluctuation, and its trend is highly synchronized with the cost of electricity for electrolysis hydrogen production. The NLC reaches its maximum negative value in the midday period from 11:00 to 14:00. This phenomenon is attributed to reduced pipeline pressure and consequent efficiency degradation under high-load conditions. The CC shows an extreme value at 20:00 in the evening peak. This is because the flow rate in the main pipeline reaches the maximum capacity specified in the design. The resulting congestion cost contributes to 21.4% of the price increase in that period. The performance of the TDC is particularly special, with a peak lag of 0.292–0.53 $/kg from 10:00–12:00, corresponding to the time lag of hydrogen transmission in standard pipelines, a phenomenon that provides an important basis for the dynamic pricing of the hydrogen energy market. Under the LMP mechanism, the hydrogen energy market will generate time-lag-related market surpluses, which should be reasonably allocated to market members to prevent price risks.
By modeling the dynamic response of component-price, this study reveals the differentiated mechanism of price formation in different time periods. This multi-mechanism coupled price formation feature provides a new theoretical perspective for constructing a more accurate hydrogen market clearing model and provides a scientific basis for market participants to develop differentiated trading strategies. Multi-dimensional analysis of price signals is realized through component decoupling, which can accurately identify the dominant pricing factors in different time periods. The algorithm provides market participants with a differentiated strategy formulation basis, which not only supports power producers to optimize their offer strategies based on component features but also helps regulators to identify pipeline bottlenecks and improve infrastructure planning, laying a theoretical foundation for constructing a new type of market mechanism adapted to the characteristics of hydrogen energy.

5.4. The Effect of the Choice of Different Reference Nodes on the Decomposition of Hydrogen Prices

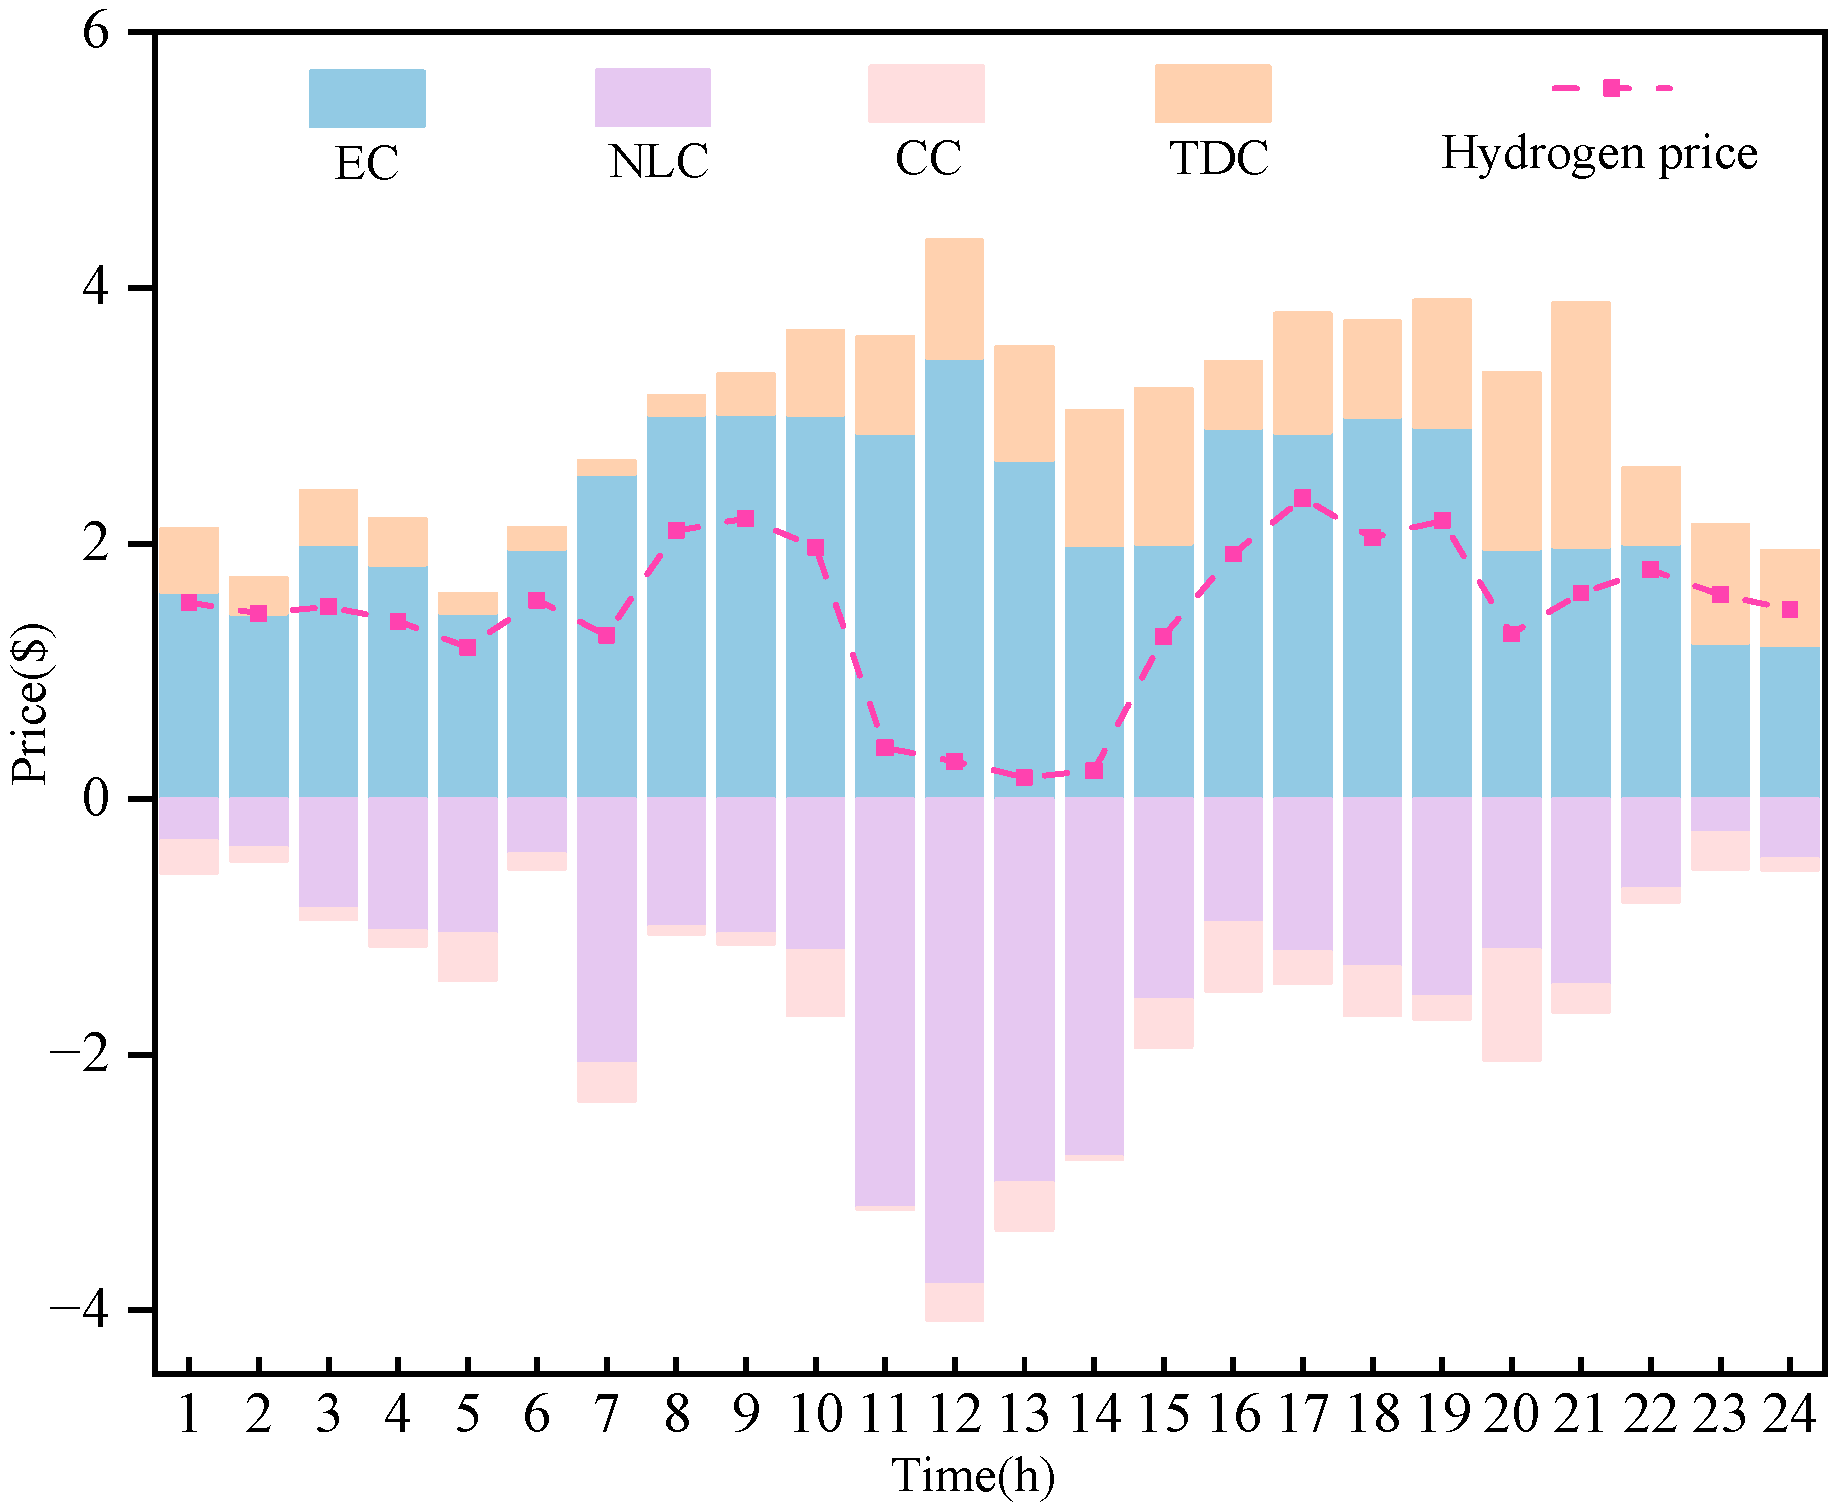
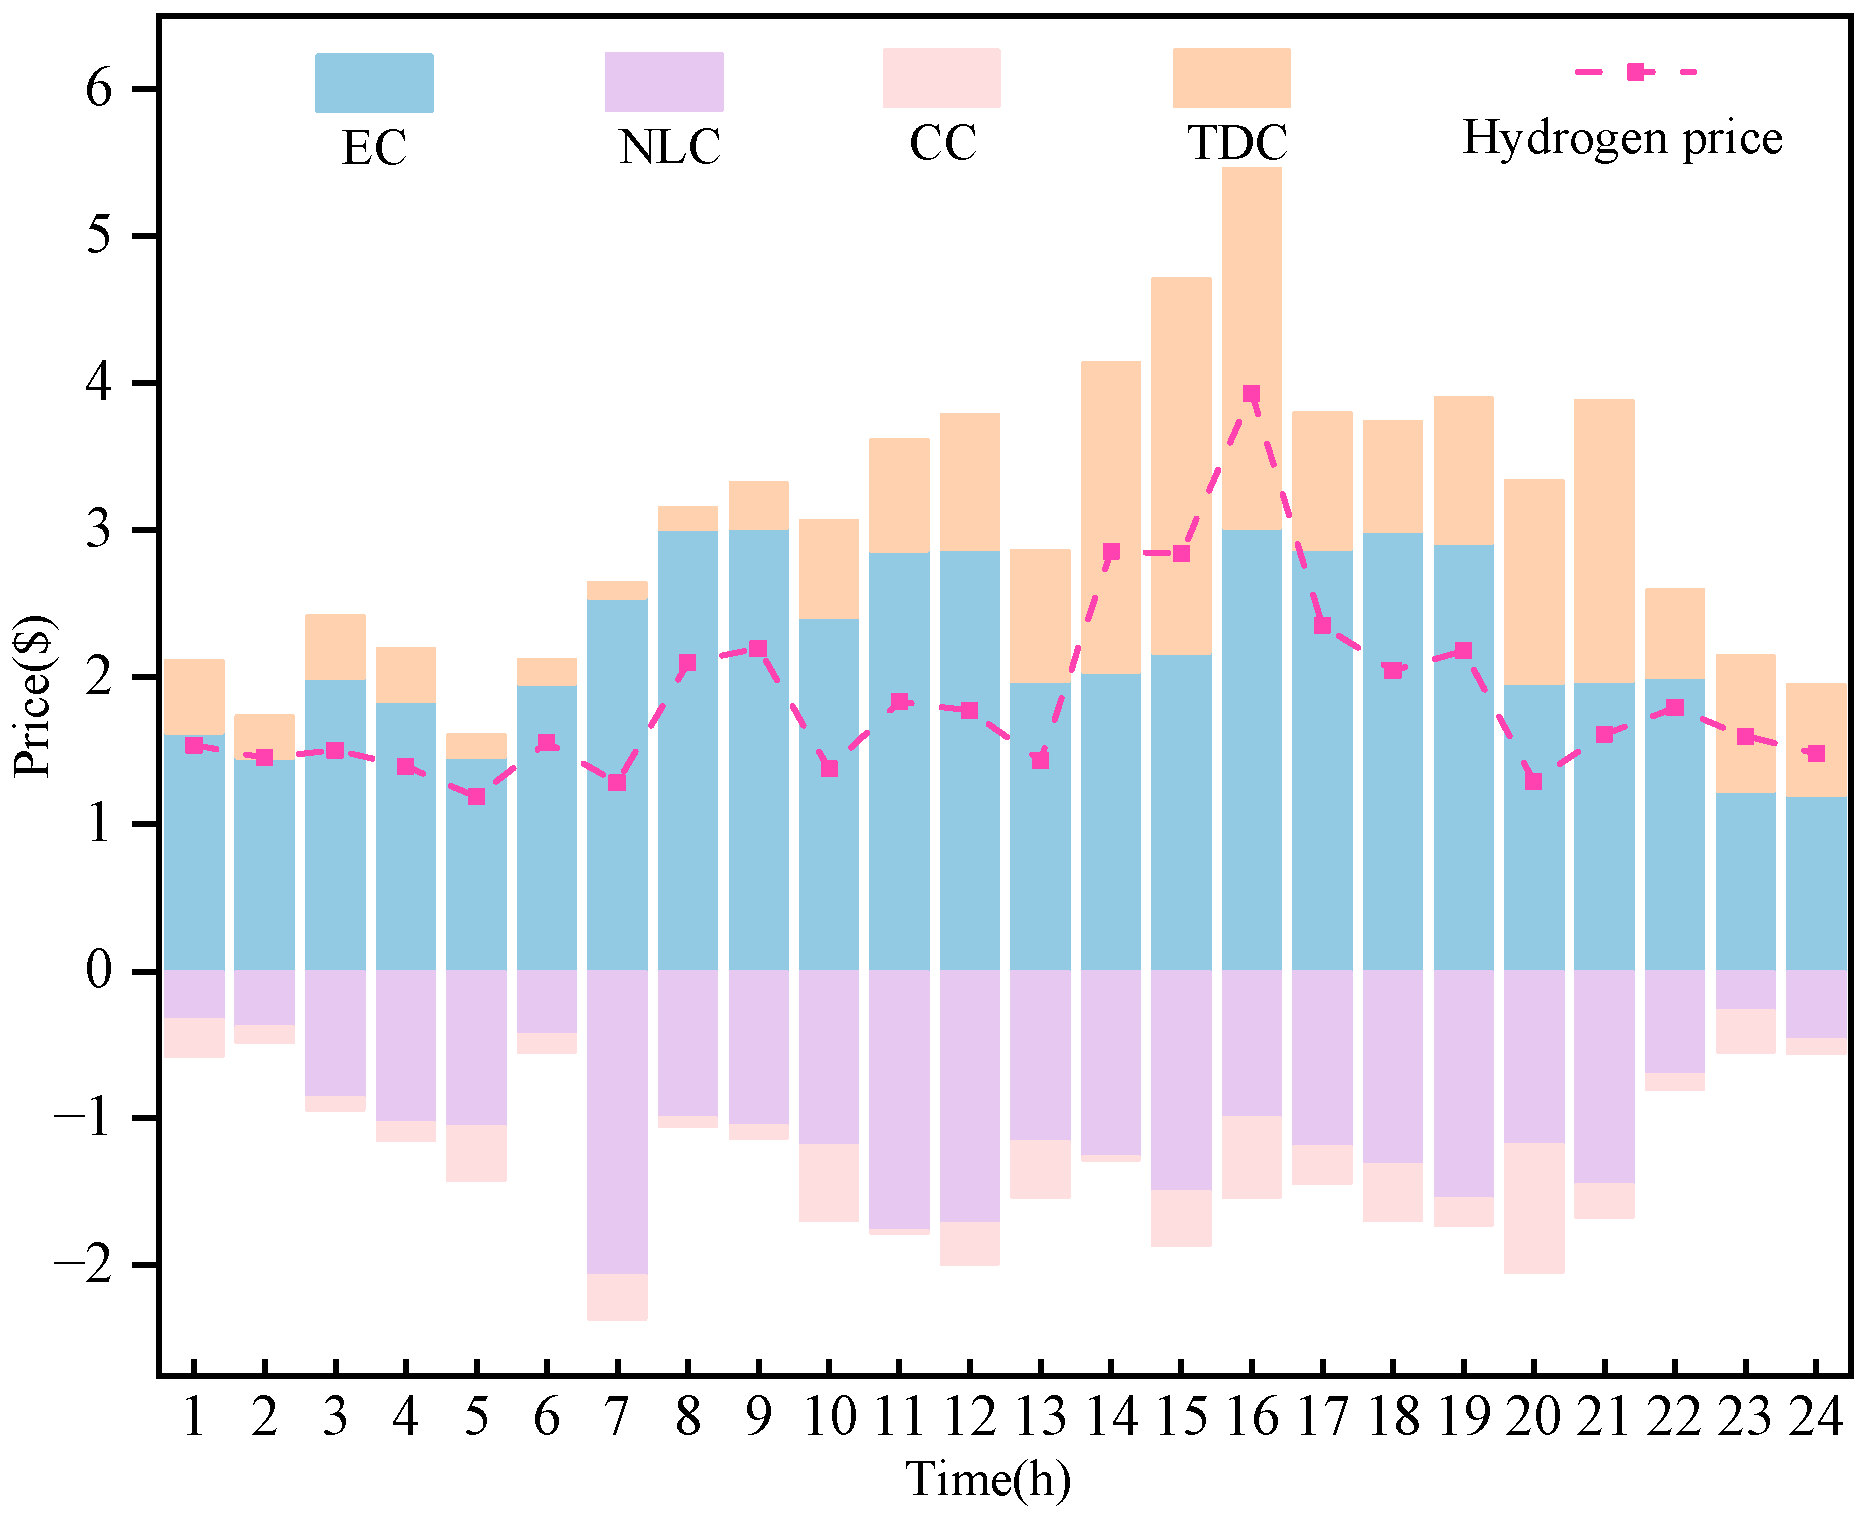
Since the topology and transmission characteristics of the hydrogen transmission network will directly affect the decomposition mechanism of the nodal marginal hydrogen price, this section aims to investigate the effect of the choice of reference node on the hydrogen price and its components, by analyzing the nodal marginal hydrogen price under different reference nodes as well as the components for comparison. Figure 5 shows a comparison of the price of hydrogen and the price results of its different components for the case of choosing different reference nodes.
By analyzing the hydrogen price decomposition data of different nodes in the system, it can be determined hat the marginal hydrogen price of each node remains consistent. All of them are 2.353 USD/kg; the price components show obvious differences. Hub node 14, which is located in the center of the network, has the smallest absolute value of both NLC and CC among the nodes, indicating that the hub node can more accurately reflect the average transmission loss and congestion condition of the whole network. In contrast, the component fluctuations of edge nodes 1, 5, and 8 are more significant: the NLC of node 8 is as high as −1.185 USD/kg, and the CC of node 1 is nearly one and a half times different from that of node 14. The performance of the intermediate position node 13 is in between that of the hub nodes and the edge nodes, with larger absolute values for its energy and NLC, but this is still better than most of the edge nodes. It is worth noting that, although node 2 belongs to the edge position topologically, the fluctuation in its price component is significantly smaller than that of other edge nodes due to its hub characteristic. This phenomenon verifies that the reference node plays a more functional role in the transmission network in determining the stability of the price component than the physical location alone. The results show that choosing the central node with hub characteristics as the reference node can minimize the pricing deviation caused by the network location, which provides an important theoretical basis and practical guidance for the optimal design of the pricing mechanism in the hydrogen energy market.

5.5. Scalability Analysis for Large-Scale Integrated Systems

To rigorously evaluate the scalability and computational efficiency of the proposed improved second-order cone programming method, a large-scale integrated electricity–hydrogen network model is developed. This model couples the original 20-node Belgian hydrogen network with the IEEE 39-bus power system, representing a more realistic regional energy infrastructure. The six electrolytic hydrogen production units in the hydrogen network are directly connected to six specific buses within the IEEE 39-bus system. The selection of these coupling points is based on a principle of electrical proximity to generation sources and load centers to simulate plausible infrastructure planning. For instance, the electrolytic hydrogen production units at Node 14 are connected to Bus 39, while the unit at Node 8 is supplied from Bus 16. Consequently, the electricity price at each hydrogen node is determined by the LMP of its corresponding electrical bus, which references the electricity market data from the Pennsylvania-New Jersey-Maryland (PJM) Interconnection. This establishes a tight price-based coupling between the two networks.
The computational performance of both cases is summarized in Table 3. Although both the number of variables and constraints in the problem have increased, the solving time for the large-scale integrated system increased by a factor of 5.33, demonstrating a sub-linear growth in computational burden. More importantly, the proposed improved second-order cone programming method algorithm successfully converged to a high-quality solution. This result confirms that the proposed method is not only accurate but also computationally tractable for realistic, large-scale applications, effectively addressing the scalability concerns for national-scale hydrogen infrastructure planning.

5.6. Distribution of Price Components Under Different Operating Conditions

Under normal operating conditions, EC primarily determines the LMP, thereby achieving the direct cost of electrolysis. However, specific physical constraints and dynamic transient events can alter this equilibrium, causing other NLC, CC, or TDC to become the primary price drivers. This section presents a systematic analysis of such scenarios, linking atypical price formations to underlying physical conditions within the hydrogen network.
As shown in Figure 6, a significant surge in the absolute value of NLC was observed between 11:00 a.m. and 2:00 p.m., accounting for 53% of the LMP. This phenomenon was caused by a system-wide pressure drop triggered by peak demand. According to the Weymouth equation, fluid flow resistance increases nonlinearly under low-pressure conditions, resulting in higher marginal energy losses per unit of hydrogen transported. The physical basis for this dominance lies in the hydraulic characteristics of pipeline flow. High mass flow rates during peak periods reduce average network pressure, thereby increasing the specific energy cost required to overcome friction losses. NLC represents the marginal cost of these transmission losses, which escalates sharply under such conditions. This indicates that system pressure management becomes a critical constraint during high-load periods, masking underlying energy costs. Consequently, NLC provides a fundamental signal for evaluating network efficiency and informing operational strategies.
Figure 7 indicates that during the evening hours from 18:00 to 20:00, the CC experienced a sharp decline, reaching −USD 2.10/kg, accounting for over 40% of the marginal cost of capacity. This was triggered by a physical bottleneck where flow on a critical pipeline exceeded its rated capacity, necessitating costly scheduling adjustments. The CC functions as the shadow price of the binding pipeline constraint. Its pronounced negative value reflects the high marginal cost of redirecting flow to alleviate congestion, often requiring dispatch from higher-cost producers or demand reduction at constrained nodes. This component’s dominance highlights tangible infrastructure limitations and provides a transparent price signal for transmission congestion. From a market design perspective, the CC not only identifies urgent infrastructure expansion needs but also offers a basis for designing financial transmission rights and congestion revenue mechanisms specific to hydrogen networks.
As shown in Figure 8, the TDC exhibits a delayed peak response, lagging by three to four hours after a sudden upstream injection change and accounting for over 40% of the nodal price. This phenomenon is attributed to the finite propagation speed of pressure waves within the pipeline network. The TDC captures the marginal cost of managing temporal transients and linepack variability. Its dominance under disturbance conditions underscores the inherent inertia of gaseous energy transport. Unlike electricity, hydrogen flow possesses substantial momentum and compressibility, resulting in time-lagged responses to supply-demand changes. The peak and decay profile of the TDC quantitatively reflects the temporal cost of restoring system equilibrium following a disruption. This component is therefore critical for valuing flexibility services, designing balancing markets, and enhancing transient stability in integrated hydrogen energy systems.
This functional decomposition enhances the interpretability of hydrogen prices, providing stakeholders with precise insights for operational decision making, infrastructure planning, and market design. It establishes a foundational framework for the development of robust and economically efficient hydrogen markets.

6. Conclusions and Discussions

In this study, based on the coupling relationship between the hydrogen market clearing model and the price formation mechanism, a nodal marginal hydrogen price decomposition algorithm considering the characteristics of hydrogen transmission delay is proposed. By reconstructing the coupling constraints of time periods, the internal constraints of the hydrogen market clearing model are fully matched with its general form, and the improved second-order cone algorithm is used to transform the nonconvex problem caused by Weymouth equation, which significantly reduces the computational complexity. On the basis of the model construction, the analytical expressions for the nodal marginal hydrogen price and each component in the actual hydrogen energy market are derived by analyzing the Lagrangian function and KKT condition. Based on the theoretical analysis and simulation verification, the following main conclusions are drawn:
  • A novel four-dimensional price decomposition framework was established to accurately reflect the full cost of hydrogen transmission. By integrating the TDC with the EC, NLC and CC, the proposed nodal marginal hydrogen price provides a more comprehensive and physically interpretable pricing signal. This framework successfully quantifies the often-overlooked temporal costs associated with the finite propagation speed of hydrogen in pipelines, offering a foundational theory for hydrogen market design.
  • The empirical analysis verified the superiority of this mechanism and provided key insights for market operations. Case studies show that the LMP mechanism is dynamically correlated with load and electricity costs and outperforms the average pricing mechanism and time-of-use pricing mechanism in terms of economic efficiency. The research results also quantified the impact of reference node selection on price components and revealed the conditions under which NLC, CC or TDC become dominant price drivers, providing valuable guidance for the future design of the hydrogen energy market and infrastructure planning.
With the development of the hydrogen energy market, it is recommended to prioritize the adoption of the LMP mechanism and establish a digital twin system of the pipeline network to accompany it to calibrate the transmission delay parameters in real time. At the same time, the rules of time-delay fractional revenue allocation should be formulated, and the price fluctuation risk should be hedged through financial contracts, so as to provide institutional guarantee for the scale development of the hydrogen energy market. This study not only provides a theoretical basis for the design of the pricing mechanism of the hydrogen energy market but also opens up a new research direction for the synergistic optimization of the multi-energy market.
Although this study provides a new framework for decomposing LMP within hydrogen networks, it is crucial to acknowledge its limitations. The current model assumes rigidity, employing this assumption to isolate and elucidate the fundamental impacts of supply-side and network dynamics on price formation. However, we recognize that demand-side elasticity will play a critical role in a fully developed hydrogen market. Future research will therefore focus on incorporating demand-side elasticity among industrial and refueling station users, which holds promise for mitigating price volatility through load shifting and reducing traffic congestion costs. Extending this model to capture such bidirectional market interactions remains a key direction for a more comprehensive understanding of hydrogen market dynamics.

Author Contributions

Conceptualization, S.L. and W.Y.; Methodology, S.L.; Software, S.L. and W.Y.; Validation, S.L.; Formal analysis, S.L., W.Y. and K.W.; Resources, K.W. and A.Z.; Data curation, K.W. and A.Z.; Writing—original draft, S.L., W.Y. and K.W.; Writing—review & editing, S.L., W.Y. and K.W.; Visualization, S.L. and W.Y.; Supervision, W.Y., K.W. and A.Z.; Project administration, W.Y. and K.W.; Funding acquisition, W.Y. All authors have read and agreed to the published version of the manuscript.

Funding

This work was supported by Sichuan Science and Technology Program, China (2024YFHZ0104).

Data Availability Statement

The data that support the findings of this study are available on request from the corresponding author.

Conflicts of Interest

Author Kangkang Wang was employed by the company State Grid Sichuan Electric Power company. The remaining authors declare that the research was conducted in the absence of any commercial or financial relationships that could be construed as a potential conflict of interest.

Appendix A

Analogous to the electricity market mechanism, the centralized hydrogen trading market adopts a dual offer system: the supply side submits a hydrogen production–cost curve and the demand side submits a hydrogen consumption–utility curve. Based on the declared information, the market operator constructs a mathematical planning model with the optimization objective of minimizing the declared cost on the supply side and obtains the optimal clearing quantity and the nodal marginal hydrogen price of each market member by solving the problem under the constraints of satisfying the dynamic characteristics of the hydrogen energy network. The general form of this market clearing model is:
min F Q H
where Q H is the vector of hydrogen production for a general form hydrogen energy market.
In the hydrogen market clearing model, Equation (A2) is the nodal hydrogen equilibrium constraint, Equations (A3)–(A5) are the hydrogen transmission constraints, and Equation (A6) is the hydrogen production constraints with the nodal air pressure constraints:
Q r , t H + Q r , t L Ψ = Q r , t D : λ r , t
U t Ψ U t ¯ 0 : α t
R t Ψ R t ¯ 0 : β t
R t Ψ R t ¯ 0 : β t
P Q H , Ψ t P ¯ 0 : δ t
where Ψ is the vector of state variables for the general form hydrogen energy market; Q r , t H is the hydrogen production by hydrogen producers in the reference node during the time period; Q r , t L is the hydrogen flow rate of the pipeline connected to the reference node in this time period; Q r , t D is the hydrogen load at the reference node for the time period; U t , R t , R t are the temporal coupling functions for hydrogen transport constraints; U t ¯ , R t ¯ , R t ¯ are the boundaries of hydrogen transport constraints; P is the temporal coupling functions for hydrogen production constraints and nodal barometric pressure constraints; P ¯ is the boundaries of hydrogen production constraints and nodal air pressure constraints; −t is the index of historical/future time periods; r is the index of the reference node; λ r , t is the Lagrange multipliers corresponding to nodal hydrogen equilibrium constraints; α t , β t , β t are the Lagrange multipliers corresponding to hydrogen transport constraints; δ t is the Lagrange multipliers corresponding to hydrogen production constraints and nodal air pressure constraints.
In particular, it should be noted that the gas transport time lag effect specific to hydrogen energy networks leads to intertemporal dynamic coupling constraints in the model. These constraints are mathematically manifested as explicit associations between the state variables in the current time period and other time periods, which in turn generate intertemporal derivative terms in the construction of the Lagrangian function. In order to accurately establish the optimality conditions, temporal coupling constraints need to be strictly categorized: temporal decoupling constraints are related to state variables in the current time period; temporal coupling constraints are related to state variables in the current time period and those in historical or future time periods.
Based on the fundamental framework of the hydrogen market clearing model, the objective function and constraints are integrated into a system of two variables by constructing a Lagrangian function. Combined with optimality conditions, this approach systematically analyzes the composition of nodal marginal hydrogen prices. The Lagrangian function can be expressed as:
L Q H , Ψ , λ , α , β , δ = F Q H λ r , t T Q r , t H + Q r , t L Ψ Q r , t D λ r , t T Q r , t H + Q r , t L Ψ Q r , t D λ r , t T Q r , t H + Q r , t L Ψ Q r , t D λ r , t T Q r , t H + Q r , t L Ψ Q r , t D + α t T U t Ψ U t ¯ + β t T R t Ψ R t ¯ + β t T R t Ψ R t ¯ + δ t T P Q H , Ψ t P ¯
In (A7), L is the Langrange functions for general form hydrogen market clearing models; −r is the index of non-reference nodes.
The global optimum of the hydrogen market clearing model satisfies the KKT conditions. These conditions correspond to the saddle point of the Lagrangian function. Specifically, the zeroing of the partial derivatives of the Lagrangian function with respect to the state variables is not only a mathematically necessary condition for the minimization of the objective function, but also a deeper reflection of the marginal equilibrium mechanism between the economics and physical constraints of the hydrogen energy system. It not only quantifies the marginal sensitivity of production costs to changes in the system state and characterizes the economic driving logic of supply-side cost minimization but also maps the rigid constraints on economic decisions imposed by the physical laws of hydrogen network transmission and hydrogen storage dynamics. The Lagrangian function of the hydrogen market clearing model can be obtained by partial derivation of the state variables to obtain a mathematical expression of the following form:
L X t T = Q r , t L X t T λ r , t Q r , t L X t T λ r , t Q r , t L X t T λ r , t Q r , t L X t T λ r , t + U t X t T α t + R t X t T β t + R t X t T β t + P X t T δ t = 0
In (A8), X t is the state variables of the Langeron function of the general form hydrogen market clearing model in the current time period.
In the hydrogen market clearing model, due to the temporal coupling characteristic of the constraints related to hydrogen transmission, the expression of the node hydrogen injection also exhibits temporal coupling. Specifically, the expression of nodal hydrogen injection in a particular time period contains state variables of other time periods. Therefore, the partial derivatives of the state variables of other time periods must be considered when solving the partial derivatives of the state variables of the current time period. For the same reason, the constraints related to time-coupled hydrogen transport at other time periods also need to be taken into account. However, for the time decoupling constraints, the state variables of the current time period are not present in the constraints of the remaining time periods. Therefore, the partial derivatives of the time decoupling constraints for the rest of the time periods are zero for the state variables of the current time period. Based on the above analysis, Equation (A8) can be simplified to the following form:
L X t T = Q r , t L X t T λ r , t Q r , t L X t T λ r , t Q t L X t T λ t + U t X t T α t + R X t T β + P X t T δ = 0
The nodal marginal hydrogen price at a node in the hydrogen market can be interpreted from an economic perspective as the minimum cost to the hydrogen system of adding one unit of hydrogen load at that node, provided that the relevant constraints of the hydrogen system are satisfied. According to this definition, the nodal marginal hydrogen price is the Lagrange multiplier of the nodal hydrogen equilibrium constraint. Equation (A8) contains the nodal marginal hydrogen price of the reference node and the non-reference node in this time period. On this basis, this study defines the Jacobian matrix of the hydrogen market as the bias transpose of the non-reference node hydrogen inflow to the state variables, which is given by the following equation:
J r , t = Q r , t L / X t T
In (A10), J r , t is the Jacoby matrix for the hydrogen energy market.
After defining the Jacobian matrix, a partial derivation of the non-reference node hydrogen load is applied as follows:
Q r , t H / Q r , t D Q r , t D / Q r , t D + Q r , t L / Q r , t D = 0
The skewness of the hydrogen production of the nodal hydrogen producer with respect to the nodal hydrogen load is zero. That means Q r , t H / Q r , t D = 0 , and the skewness of the nodal hydrogen load with respect to itself is the unit matrix I . This leads to the following corollary:
Q r , t L / Q r , t D = Q r , t L / X t X t / Q r , t D = J r , t T X t / Q r , t D = I
where I is the unit matrix. From the above derivation the hydrogen transport sensitivity matrix can be defined as follows:
S r , t U t = U t ( X t ) / Q r , t D = U t ( X t ) / X t X t / Q r , t D = U t ( X t ) / X t ( J r , t T ) 1
S r , t R = R ( X ) / Q r , t D = R ( X ) / X t X t / Q r , t D = R ( X ) / X t ( J r , t T ) 1 = R t ( X ) / X t R t ( X ) / X t ( J r , t T ) 1 = S r , t R t S r , t R t
According to Equations (A13) and (A14), the hydrogen transmission sensitivity matrix P S r , t U t and S r , t R can be defined as the partial derivative of the hydrogen transmission-related constraint function with respect to the non-reference node loads, which reflects the marginal changes in the transmission-related variables such as the pipeline hydrogen flow rate and the pipeline hydrogen storage volume caused by the changes in the node hydrogen loads. Since the hydrogen transmission-related constraints are categorized into time-coupled constraints and time-decoupled constraints, the corresponding hydrogen transmission sensitivity matrices are also categorized into time-coupled and time-decoupled types.
After the definition of the Jacobian matrix and the hydrogen transmission sensitivity matrix for the hydrogen market, this section analyzes the components of the nodal marginal hydrogen price. Substituting Equations (A10), (A13) and (A14) into Equation (A9) yields the following equation:
Q r , t L / X t T λ r , t J r , t λ r , t Q t L / X t T λ t + J r , t S r , t U t T α t + J r , t S r , t R T β + P / X t T δ t = 0
A transformation of the above Equation (A15) yields:
λ r , t = J r , t 1 Q r , t L / X t T λ r , t Q t L / X t T λ t + J r , t S r , t U t T α t + J r , t S r , t R T β + P / X t T δ t = J r , t 1 Q r , t L / X t T λ r , t J r , t 1 Q t L / X t T λ t + S r , t U t T α t + S r , t R T β + J r , t 1 P / X t T δ t
The reference node needs to be selected in the nodal marginal hydrogen price decomposition algorithm proposed in this study. The hydrogen price of the reference node is numerically equal to the EC of the nodal marginal hydrogen price in the hydrogen market, and its CC, NLC, and TDC are all zero.
Specifically, the Energy Component (EC) corresponds to the marginal generation cost associated with the electricity consumed during the electrolysis process. The Network Loss Component (NLC) refers to the pressure-drop losses occurring in pipelines during hydrogen transportation. The Congestion Component (CC) denotes the scarcity costs arising from constraints on pipeline capacity. The Time-Delay Component (TDC) represents the temporal costs induced by the finite velocity of hydrogen flow.
Based on this conclusion, the hydrogen price of the reference node is separated from the expression of the hydrogen price of the non-reference node to obtain the decomposed form of the marginal hydrogen price of the node:
λ r , t = 1 λ r , t + 1 J r , t 1 Q r , t L / X t T λ r , t + S r , t U t T α t + S r , t R t T β t + J r , t 1 P / X t T δ t + S r , t R t T β t J r , t 1 Q t L / X t T λ t

Appendix B

L = t = 1 T s = 1 S π s , t Q s , t H 2 λ r , t s r Q s , t H 2 ρ IN ( m n ) = r Q m n , t IN + ρ OUT ( m n ) = r Q m n , t OUT E r , t λ r , t T s r Q s , t H 2 ρ IN ( m n ) = r Q m n , t IN + ρ OUT ( m n ) = r Q m n , t OUT E r , t λ t T s r Q s , t H 2 ρ IN ( m n ) = r Q m n , t IN + ρ OUT ( m n ) = r Q m n , t OUT E r , t + t = 1 T ϑ r , t max T Π r , t Π r , max + t = 1 T ϑ r , t max T Π r , min Π r , t + t = 1 T ζ s , t max T Q s , t H 2 Q s , max H 2 + t = 1 T ζ s , t min T Q s , min H 2 Q s , t H 2 + ξ m n , t max T Q m n , t IN Q m n , max + ξ m n , t max T Q m n , t IN Q m n , max + ω m n , t max T Q m n , t OUT Q m n , max + ω m n , t max T Q m n , t OUT Q m n , max + υ m n , t max T Q m n , t Q m n , max + υ m n , t max T Q m n , t Q m n , max + ξ m n , t min T Q m n , max Q m n , t IN + ξ m n , t min T Q m n , max Q m n , t IN + ω m n , t min T Q m n , max Q m n , t OUT + ω m n , t min T Q m n , max Q m n , t OUT + υ m n , t min T Q m n , max Q m n , t + υ m n , t min T Q m n , max Q m n , t + σ m n , t IN T Q m n , t IN Q m n , t V m n , t V m n , t 1 / 2 + σ m n , t IN T Q m n , t IN Q m n , t V m n , t V m n , t 1 / 2 + σ m n , t OUT T Q m n , t OUT Q m n , t V m n , t V m n , t 1 / 2 + σ m n , t OUT T Q m n , t OUT Q m n , t V m n , t V m n , t 1 / 2 + ς m n , t max T V m n , t V m n , max + ς m n , t max T V m n , t V m n , max + ς m n , t min T V m n , min V m n , t + ς m n , t min T V m n , min V m n , t + ι m n Φ H 2 V m n , 0 m n Φ H 2 V m n , T + θ m n , t T V m n , t C m n Π m , t + Π n , t / 2 + θ m n , t T V m n , t C m n Π m , t + Π n , t / 2 + ε m n , t T Q m n , t C m n sgn ( Π m , t , Π n , t ) Π m , t Π n , t + ε m n , t T Q m n , t C m n sgn ( Π m , t , Π n , t ) Π m , t Π n , t

References

  1. Tian, X.; Chi, Y.; Li, L.; Liu, H. Review of the configuration and transient stability of large-scale renewable energy generation through hybrid DC transmission. CES Trans. Electr. Mach. Syst. 2024, 8, 115–126. [Google Scholar] [CrossRef]
  2. Sakib, A.N.; Mehjabin, F.; Schmidt, J.B.; Haque, M.; Saha, K.; Bhuiyan, M.H. Harnessing hydrogen: A comprehensive literature review on strategic launching initiatives in the global energy market. Int. J. Energy Res. 2024, 2024, 3265065. [Google Scholar] [CrossRef]
  3. Ge, L.; Zhang, B.; Huang, W.; Li, Y.; Hou, L.; Xiao, J.; Mao, Z.; Li, X. A review of hydrogen generation, storage, and applications in power system. J. Energy Storage 2024, 75, 109307. [Google Scholar] [CrossRef]
  4. Zhou, J.; Ji, W.; Cao, X.; He, W.; Fan, J.; Yuan, Y. A current perspective on the renewable energy hydrogen production process. J. Therm. Sci. 2023, 32, 542–596. [Google Scholar] [CrossRef]
  5. Jiayu, B.; Xingang, W.; Chaoshan, X.; Zhiyong, Y.; Shoutao, T.; He, C. Development status and measures to promote the development of renewable energy in China. In Proceedings of the 2021 3rd Asia Energy and Electrical Engineering Symposium (AEEES), Chengdu, China, 26–29 March 2021; IEEE: New York, NY, USA, 2021; pp. 1102–1107. [Google Scholar]
  6. Shang, Y.; Han, D.; Gozgor, G.; Mahalik, M.K.; Sahoo, B.K. The impact of climate policy uncertainty on renewable and non-renewable energy demand in the United States. Renew. Energy 2022, 197, 654–667. [Google Scholar] [CrossRef]
  7. Li, Y.; Suryadi, B.; Yan, J.; Feng, J.; Bhaskoro, A.G.; Suwanto. A strategic roadmap for ASEAN to develop hydrogen energy: Economic prospects and carbon emission reduction. Int. J. Hydrogen Energy 2023, 48, 11113–11130. [Google Scholar] [CrossRef]
  8. Nong, K.; Sun, W.; Shen, L.; Sun, D.; Lin, J. Future pathways for green hydrogen: Analyzing the nexus of renewable energy consumption and hydrogen development in Chinese cities. Renew. Energy 2024, 237, 121507. [Google Scholar] [CrossRef]
  9. Guo, L.; Su, J.; Wang, Z.; Shi, J.; Guan, X.; Cao, W.; Ou, Z. Hydrogen safety: An obstacle that must be overcome on the road towards future hydrogen economy. Int. J. Hydrogen Energy 2024, 51, 1055–1078. [Google Scholar] [CrossRef]
  10. Li, F.; Liu, D.; Sun, K.; Yang, S.; Peng, F.; Zhang, K.; Guo, G.; Si, Y. Towards a future hydrogen supply chain: A review of technologies and challenges. Sustainability 2024, 16, 1890. [Google Scholar] [CrossRef]
  11. Han, X.; Yan, H.; Kang, J.; Li, Y. Strategic Analysis of Hydrogen Energy Policies and Technology Layout in Major Countries. In World Hydrogen Technology Convention, Proceedings of the 10th Hydrogen Technology Convention, Foshan, China, 22–26 May 2023; Springer Nature: Singapore, 2023; pp. 435–451. [Google Scholar]
  12. Peng, D.; Chen, X.; Liu, H.; Guo, N.; Wang, H. Optimal Configuration of Long-Duration Hydrogen Energy Storage for High Proportion New Energy Power System. In Proceedings of the 2023 IEEE/IAS Industrial and Commercial Power System Asia (I&CPS Asia), Chongqing, China, 7–9 July 2023; IEEE: New York, NY, USA, 2023; pp. 1693–1698. [Google Scholar]
  13. Chen, S.; Zhang, J.; Wei, Z.; Cheng, H.; Lv, S. Towards Renewable-Dominated Energy Systems: Role of Green Hydrogen. J. Mod. Power Syst. Clean Energy 2024, 12, 1697–1709. [Google Scholar] [CrossRef]
  14. Ferrada, F.; Babonneau, F.; Homem-de-Mello, T.; Jalil-Vega, F. The role of hydrogen for deep decarbonization of energy systems: A Chilean case study. Energy Policy 2023, 177, 113536. [Google Scholar] [CrossRef]
  15. Tarhan, C.; Çil, M.A. A study on hydrogen, the clean energy of the future: Hydrogen storage methods. J. Energy Storage 2021, 40, 102676. [Google Scholar] [CrossRef]
  16. Pingkuo, L.; Xue, H. Comparative analysis on similarities and differences of hydrogen energy development in the World’s top 4 largest economies: A novel framework. Int. J. Hydrogen Energy 2022, 47, 9485–9503. [Google Scholar] [CrossRef]
  17. Han, Z.; Yuan, S.; Dong, Y.; Ma, S.; Bian, Y.; Mao, X. Research on the flexibility margin of an electric–hydrogen coupling energy block based on model predictive control. Front. Energy Res. 2022, 10, 879244. [Google Scholar] [CrossRef]
  18. Steinbach, S.A.; Bunk, N. The future European hydrogen market: Market design and policy recommendations to support market development and commodity trading. Int. J. Hydrogen Energy 2024, 70, 29–38. [Google Scholar] [CrossRef]
  19. Gu, Z.; Pan, G.; Gu, W.; Qiu, H.; Lu, S. Robust optimization of scale and revenue for integrated power-to-hydrogen systems within energy, ancillary services, and hydrogen markets. IEEE Trans. Power Syst. 2023, 39, 5008–5023. [Google Scholar] [CrossRef]
  20. Vechkinzova, E.; Steblyakova, L.P.; Roslyakova, N.; Omarova, B. Prospects for the development of hydrogen energy: Overview of global trends and the Russian market state. Energies 2022, 15, 8503. [Google Scholar] [CrossRef]
  21. Ramadasu, V.; Reiner, G. Integrated inventory and capacity management for hydrogen production under consideration of fluctuating electricity prices. Int. J. Prod. Res. 2025, 63, 4540–4562. [Google Scholar] [CrossRef]
  22. Zhao, W.; Ma, J.; Wang, Z.; Li, Y.; Zhang, W. Potential hydrogen market: Value-added services increase economic efficiency for hydrogen energy suppliers. Sustainability 2022, 14, 4804. [Google Scholar] [CrossRef]
  23. Asghari, M.; Afshari, H.; Jaber, M.Y.; Searcy, C. Strategic analysis of hydrogen market dynamics across collaboration models. Renew. Sustain. Energy Rev. 2025, 208, 115001. [Google Scholar] [CrossRef]
  24. Sahraie, E.; Kamwa, I.; Moeini, A.; Mohseni-Bonab, S.M. Synergy-based hydrogen pricing in hydrogen-integrated electric power system: Sensitivity analysis. Int. J. Hydrogen Energy 2024, 93, 948–962. [Google Scholar] [CrossRef]
  25. Guo, H.; Gong, D.; Zhang, L.; Wang, F.; Du, D. Hierarchical game for low-carbon energy and transportation systems under dynamic hydrogen pricing. IEEE Trans. Ind. Inform. 2022, 19, 2008–2018. [Google Scholar] [CrossRef]
  26. Guo, H.; Gong, D.; Zhang, L.; Mo, W.; Ding, F.; Wang, F. Time-Decoupling Layered Optimization for Energy and Transportation Systems under Dynamic Hydrogen Pricing. Energies 2022, 15, 5382. [Google Scholar] [CrossRef]
  27. Wang, L.; Jiao, S.; Xie, Y.; Xia, S.; Zhang, D.; Zhang, Y.; Li, M. Two-way dynamic pricing mechanism of hydrogen filling stations in electric-hydrogen coupling system enhanced by blockchain. Energy 2022, 239, 122194. [Google Scholar] [CrossRef]
  28. Wang, Q.; Wang, Y.; Chen, Z. Stackelberg-equilibrium-based collaborative charging management strategy for renewable fuel vehicles in regional integrated electricity-hydrogen system. Appl. Energy 2025, 377, 124617. [Google Scholar] [CrossRef]
  29. Zhu, J.; Meng, D.; Dong, X.; Fu, Z.; Yuan, Y. An integrated electricity-hydrogen market design for renewable-rich energy system considering mobile hydrogen storage. Renew. Energy 2023, 202, 961–972. [Google Scholar] [CrossRef]
  30. Wang, J.; Shao, Z.; Wu, J.; Wu, L. Day-ahead strategic bidding of multi-energy microgrids participating in electricity, thermal energy, and hydrogen markets: A stochastic bi-level approach. Int. J. Electr. Power Energy Syst. 2024, 163, 110319. [Google Scholar] [CrossRef]
  31. Chen, S.; Wei, Z.; Sun, G.; Sun, Y.; Zang, H.; Zhu, Y. Optimal power and gas flow with a limited number of control actions. IEEE Trans. Smart Grid 2017, 9, 5371–5380. [Google Scholar] [CrossRef]
  32. Gao, H.; Li, Z. A benders decomposition based algorithm for steady-state dispatch problem in an integrated electricity-gas system. IEEE Trans. Power Syst. 2021, 36, 3817–3820. [Google Scholar] [CrossRef]
  33. Kang, Z.; Ma, X.; Lv, L.; Fang, X.; Wang, Z. A PV Hosting Capacity Assessment Method in Distribution Network Based on Successive Second-Order Cone Programming. In Proceedings of the 2024 4th Power System and Green Energy Conference (PSGEC), Shanghai, China, 22–24 August 2024; IEEE: New York, NY, USA, 2024; pp. 1109–1113. [Google Scholar]
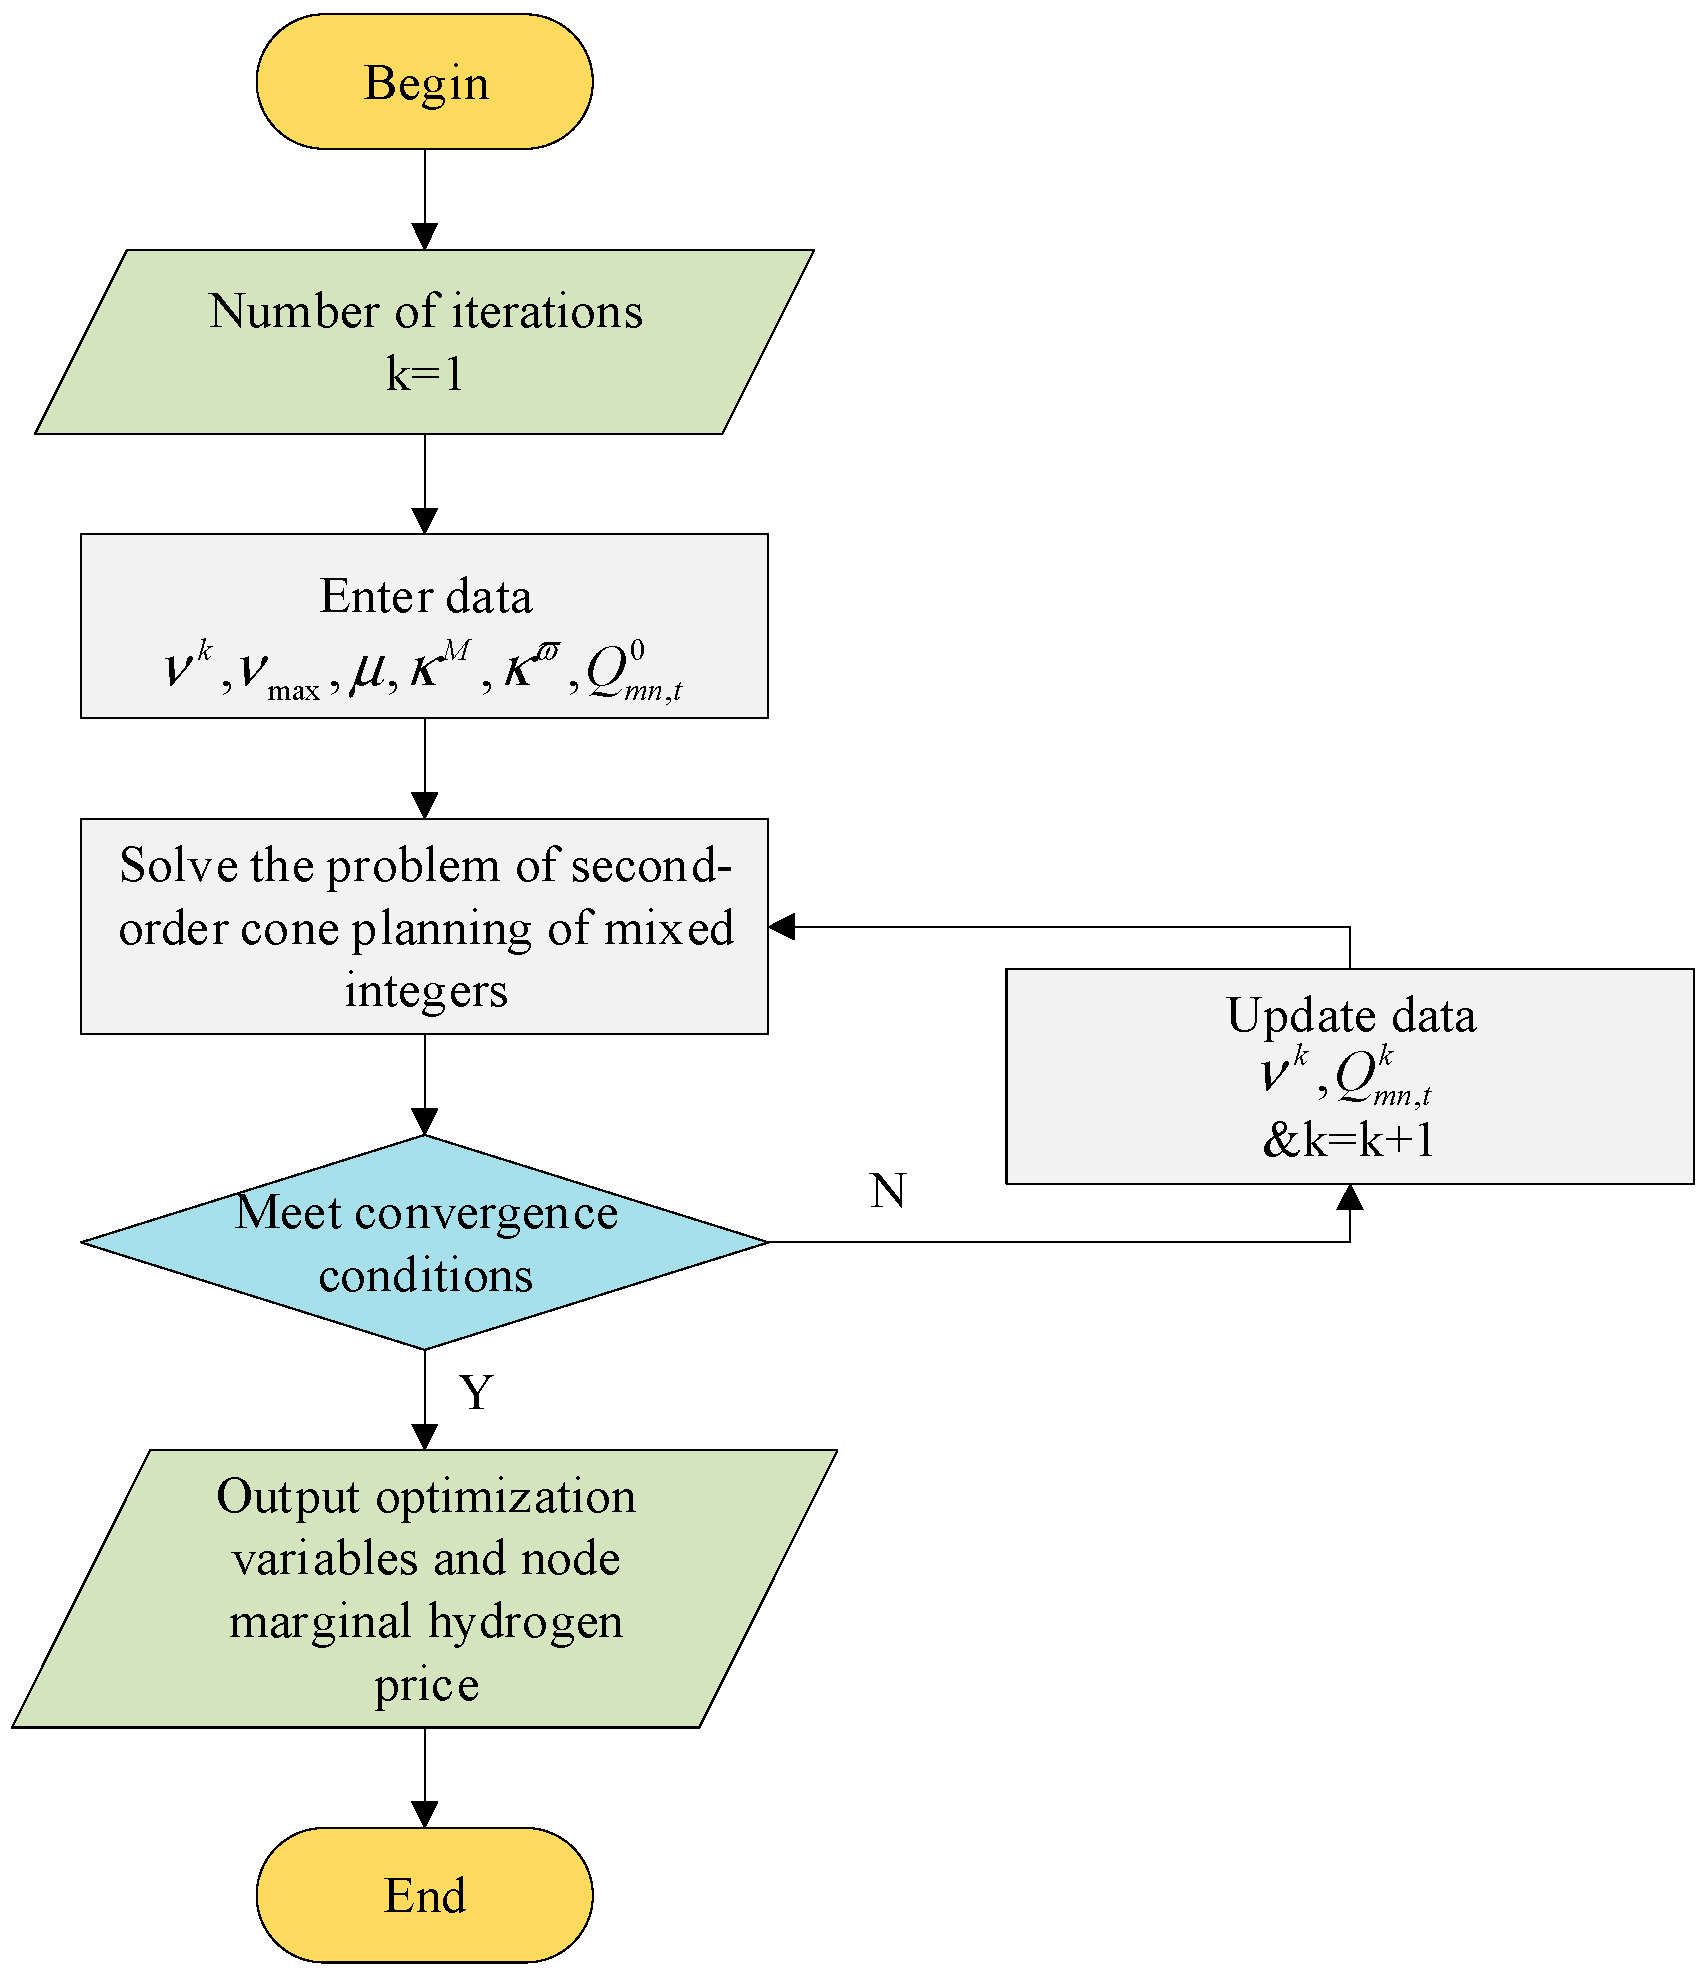
Figure 1. Flowchart of the improved second-order cone algorithm for problem solving.
Energies 18 05681 g001
Figure 2. Model diagram of the Belgian 20-node system.
Energies 18 05681 g002
Figure 3. Hydrogen price and load changes under different price mechanisms.
Energies 18 05681 g003
Figure 4. The marginal hydrogen valence of nodes and its four components.
Energies 18 05681 g004
Figure 5. Nodal marginal hydrogen prices and prices by component under different reference nodes.
Energies 18 05681 g005
Figure 6. NLC constitutes the primary component of LMP.
Energies 18 05681 g006
Figure 7. CC constitutes the primary component of LMP.
Energies 18 05681 g007
Figure 8. TDC constitutes the primary component of LMP.
Energies 18 05681 g008
Table 1. Equipment parameters of electrolytic hydrogen production equipment.
Node Location Where the Device Is LocatedEquipment Capacity (103 kg)Nodal Average Electricity Price (USD/MWh)
1120032.09
2110019.79
590026.14
8100055.75
1385038.62
14120039.83
Table 2. Hydrogen price under TOUP mechanism.
Pricing MechanismsTime PeriodPrices (USD/kg)
TOUP mechanismPeak value
(8:00–11:00, 17:00–21:00)
2.3532
Par value
(12:00–16:00, 22:00–24:00)
1.8761
Valley value
(0:00–7:00)
1.2916
Table 3. Comparison of computational data across different systems.
Performance MetricBelgian 20-Node System59-Node Integrated Electricity-Hydrogen Network
number of variables578018,654
number of constraints784425,732
solving time (seconds)63336
number of iterations1123
convergence statusconvergedconverged
Disclaimer/Publisher’s Note: The statements, opinions and data contained in all publications are solely those of the individual author(s) and contributor(s) and not of MDPI and/or the editor(s). MDPI and/or the editor(s) disclaim responsibility for any injury to people or property resulting from any ideas, methods, instructions or products referred to in the content.