Abstract
A microgrid (MG) topology combines various kinds of resources like solar photovoltaic (PV) systems, wind turbines (WTs), energy storage systems, and the conventional utility grid. These different resources need to be coordinated in an optimal way to keep the power balanced, reduce the operational cost, and make the system resilient to any kind of failures. Therefore, an efficient energy management system (EMS) is essential in an MG system to provide suitable and reliable operation under different weather and demand load conditions. In this paper, a new EMS-based multi-objective Nizar Optimization Algorithm (NOA) is proposed. The suggested EMS aims to improve the power quality problem caused by the unpredictable nature of renewable energy sources and then minimize the grid power and battery degradation costs. By leveraging the adaptability of the NOA, the applied EMS method simply optimizes the allocation and energy sharing of the resources in a grid-connected MG. The proposed EMS was verified in simulation using MATLAB software. The performance of the proposed EMS was tested under different weather conditions, and the obtained results have been compared with those obtained in the existing methods. The obtained results indicate that the proposed EMS based on the NOA is capable of adjusting the multi-source energy allocation with minimal grid costs and the battery degradation issue. The proposed NOA indicates robust performance with total cost savings varying from USD 17 to USD 34 compared to other optimizers, as well as a great reduction in degradation cost, up to 27% improvement over the conventional methods. Finally, the proposed EMS offers several advantages over the conventional methods, including the improved dynamic system, faster convergence, lower operational costs, and higher energy efficiency.
1. Introduction
1.1. Background
The world’s transition to cleaner and more sustainable forms of energy will redefine the future of energy landscapes. As solar photovoltaics (PVs) and other sources of renewable energy sources (RESs) continue to make breakthrough advances and exponential progress, recording unprecedented breakthroughs globally [1,2]. The microgrid (MG) innovative concept has been met with exuberant enthusiasm as an adaptable, robust, and sustainable successor to the central power stations-dominated power grids that have been the staple of the energy grid. The RESs have intermittent and stochastic characteristics that produce unwanted power fluctuations in the MG. Therefore, the energy storage system plays an important role in damping these fluctuations, increases the reliability of the system, providing frequency and voltage stability, and enhances the system’s operation under different weather conditions [3,4].
However, designing energy management strategies (EMSs) that simultaneously minimize electricity costs and battery degradation is critical for the economic sustainability of microgrids [5]. The traditional approaches to scheduling and control that are widely employed in this specific area typically prefer the technological suitability of a proposed solution or the important emphasis on minimizing economic expenses. Nevertheless, it is important to integrate factors that are concerned with battery health, and these are critical to ensure optimal levels of output. Rule-based approaches that are deterministic, though they are simple and relatively easy to adopt, inevitably lack the ability to capture accurately the dynamic variation that occurs in demand. Classical EMS approaches to optimization are frequently burdened by critical computational restrictions that affect their scalability and ability to learn and adapt to uncertainties that occur in real-time situations [6,7,8]. As a result, most of the solutions currently adopted prefer to make dispatch decisions that are suboptimal, and this occurs at a cost of critical amounts of energy loss or causes an undue rate of wear and tear upon the storage units involved in the process. Over the last few years, a remarkable development of modern techno-economic optimization methodologies has surfaced, presenting a wide pool of innovative methods. Amongst these myriad methodologies are heuristic algorithms, model predictive control (MPC) schemes, and numerous machine-learning (ML) methodologies, which are specially advocated to serve as efficient answers to target the existing shortcomings of the field [9,10]. Moreover, the simultaneous optimization of grid interconnection, storage solution deployment, and the effortless integration of RESs offers an optimal balance of economic viability and technical applicability of MGs. Ultimately, this equilibrium is proposed to play an important role in leading toward a more sustainable energy-intensive future [11]. However, several studies based on battery degradation models or excessively focused on paying solely to minimize electrical bills without considering the imperceptible are presented. This significant gap within current studies is proposed to trigger an urgent requirement for the creation of comprehensive schemes of optimization able to cover and cope with the complete lifecycle cost and repercussions of MG operation [12,13]. Motivated by these challenges, this paper develops a techno-economic optimization method with an EMS strategy for a grid-connected MG comprising a PV generation wind turbine (WT) and a battery energy storage system (BESS). The proposed framework explicitly incorporates both electricity tariffs and battery degradation costs into the objective function, thereby enabling a more realistic and sustainable evaluation of microgrid performance.
1.2. Literature Review
The methods involved in the optimization of EMSs are of the highest relevance in improving the efficiency, reliability, and sustainability of MGs to realize improved performance and environmental stewardship. However, various techniques and methodologies are used in this field, including artificial intelligence (AI) or optimization-based EMS methods to maximize the allocation, optimal utilization, and effective regulation of energy resources. The authors of [14] introduced a novel framework called fuzzy logic-based particle swarm optimization (FL-PSO) that is specifically tailored for the efficient management of integrated energy systems in microgrids. This strategy not only minimizes the cost of replacement of battery systems but also contributes to higher overall sustainability for the MG system. In addition, the results of their study amply demonstrate that the FL-PSO approach offers better robustness and higher economic savings compared to the conventional EMS methods that do not consider these factors. In [15], the authors aim to assess the effect of uncertain factors on the optimality of different robust energy exchange strategies. To solve the issue, the authors introduced AIROBE, which is a data-driven system that employs machine-learning-based predictions of energy supply and demand as inputs for calculating robust energy exchange schedules via a multiband robust optimization approach to guard against deviations. The used EMS is capable of successfully handling asymmetric deviations and lowering the operational cost and, at the same time, may bring about operational stability of the system.
The authors of [16] suggested flamingo swarm intelligence (FSI) to design and optimize a hybrid renewable energy system with an energy storage device. The used EMS aimed at lowering costs, increasing reliability, and being able to tackle resource uncertainty. Their study shows that FSI gives quicker convergence and better precision in finding optimal solutions than other metaheuristics. Their method is demonstrated in hybrid PV–wind–battery systems, which is proof that the new swarm algorithm can be a viable and efficient method of techno-economic optimization in renewable microgrid applications. The complexity of the FSI algorithm represents the main issue of this EMS. In [17], the authors proposed a new EMS-based BESS system for controlling the discharging and charging operations, scheduling, and minimizing the cost of energy using a PSO algorithm. The main aim is to guarantee the efficient use of storage while, at the same time, achieving a reduction in the operating costs and the battery’s lifespan. The controller comprises PSO for tuning the parameters and a fuzzy system for handling the uncertainties in the load and the renewable generation. The outcomes of the simulation attest to the substantial benefits realized in terms of energy cost savings, peak load reduction, and BESS lifetime extension; thus, the hybrid PSO–fuzzy systems are very effective in microgrid EMSs. The authors of [18] proposed mixed-integer linear programming (MILP) for managing a hybrid power system for scheduling the BESS with RES sources. Their work affirms that integrating degradation and uncertainty is a major source of monetary savings and beneficial for the battery’s longevity when compared to the traditional scheduling approach. The used MILP has a slow convergence time and low efficiency when compared with metaheuristic optimization algorithms. The research in [19] develops a multi-objective optimization framework, which aims to improve the flexibility of energy systems that are integrated with different renewable generation and storage with management on the demand side. This study’s goals involve reducing the system’s operational costs, augmenting the system’s safety against uncertainties, and achieving a proper performance of distributed resources with the optimal coordination method. Through the introduction of a fresh optimization strategy, the article outlines the give-and-take between economic efficiency and resilience. In addition, a MILP model was proposed in [20] for optimizing the residential EMS, mainly focusing on the battery cycle degradation impact. The primary goal is to reduce power costs, along with the explicit consideration of the battery aging process. This work achieves more practical energy use and planning results by combining the detailed degradation route. The major accomplishment is the modeling of an EMS that is capable of providing a trade-off between savings of a short period of time and system sustainability, thus leading the storage lifetime and local household economic development to be improved. The study in [21] aims to present the best possible scheduling plan for hybrid energy storage systems (HESSs) that fuse batteries and flywheels together with the use of a multi-stress battery degradation model. The goal of the paper is to utilize the two storage technologies that are the most suitable for the complementary features: the flywheels dealing with rapid changes and the batteries providing the energy load for the rest of the period. The paper addresses one of the benefits—the coordinated operation mode can be the cause of decreasing the stress for battery degradation, extending their lifespan, and lowering the lifecycle costs. The limitations of the study are represented by the absence of testing the system under different weather conditions. The study in [22] proposed a robust two-stage optimization model for the microgrid operation, which adjusts to indeterminacies in renewable generation and load demand in an efficient manner. This method involves the use of distributed renewable energy sources in a robust framework, which is solved by Benders decomposition to make dispatch decisions that are both cost-efficient and reliable. Nevertheless, the procedure has its drawbacks, such as computational complexity being high, dependence on fixed uncertainty sets, and solutions being conservative, which can lead to an increase in operational costs. In [23], a two-stage decision-making method was used to offer both economic RES analysis and safety of hydrogen constraints, which guarantees safe renewable integration, lowers the amount of renewables that are not used, and makes regional energy systems stable. Moreover, the multistage criterion of optimizing properties, such as sizing and energy management, for electric vehicle-based HESSs is conducted in [24]. The authors set as their goal to cut expenses, increase the lifespan of the battery, and, thus, improve the vehicle’s overall performance under a variety of driving conditions. The significant element is the multivariate optimization problem formulation that manages the trade-offs between battery wear, energy efficiency, and reliability in EVs. The research in [25] focused on the development of a first-guess model for the wear prediction of large-scale energy storage batteries used in the power grid by employing the extreme gradient boosting algorithm. Their main intention is to detect the degradation tendencies to schedule the use and the cost. Their unique idea is to apply learning machines to precisely foresee performance loss in batteries, which will lead to fewer breakdowns and longer system lifespan. Qian J. et al. [26] proposed a multi-timescale optimization framework for energy systems that deal with various energy storage technologies. The goal is to be able to perform the coordinated scheduling of different time horizons, i.e., short-term, mid-term, and long-term, while, at the same time, assuring system reliability and economic efficiency. Their research finds that the combination of different storage strategies provides the opportunity to better adjust to the uncertainty of the renewable supply and fluctuations in demand. Also, a multi-scenario planning and performance evaluation framework that is designed to improve the operation of integrated energy systems was presented in [27]. These systems are expected to manage the combined scheduling of electric vehicles (EVs) and stationary energy storage. The goal of the work is to increase the use of renewable energy, reduce the operation costs of the system, as well as provide system flexibility in different scenarios of demand and generation. The main idea is that the synchronized operation of EVs and storage batteries can bring them to load peak management. In [28], an improved EMS for prosumer buildings with the integration of RES and BESS systems has been presented. The primary goal is to reduce electricity bills and increase self-consumption with the added consideration of the battery lifecycle. One of the major aspects of the work is the development of an adaptive EMS, which would be able to optimize the charging–discharge cycles in the presence of a dynamic load and changing tariff structures. The authors in [29] investigated techno-economic analysis for minimizing energy cost trading-based demand response scenarios for a hybrid power system, including different RESs. However, the suggested analysis offers a significant study on the integration of RES-based demand response models in the smart energy markets. However, bidirectional converters (BDCs) play a vital role in increasing the power exchange capacity of hybrid AC/DC networked microgrids (NMGs). Nevertheless, their conversion efficiency varies dynamically, and the non-convex conversion direction expression of BDC models makes the problem highly non-convex, thus causing considerable computational difficulties. To address this issue, the authors in [30] present a least squares approximation method for the complex trigonometric function that describes the BDC conversion efficiency changes dynamically with power. The simplified expression changes the original non-convex relation into a computationally efficient convex one. Moreover, the authors examine and confirm the sufficient conditions for the non-simultaneous rectification and inversion behaviors of BDCs in a convex form. The examined conditions are also further developed and extended to different practical application scenarios. The findings reveal that the least squares approximation technique that facilitates the solution of the problem was computationally intractable. Furthermore, the explored conditions lead to a considerable decrease in the solution time (by more than two orders of magnitude), thus confirming the effectiveness of this method and demonstrating its feasibility in real scenarios.
1.3. Contributions of the Article
Today, different technologies, such as photovoltaic (PV) generation, battery energy storage systems (BESSs), electric vehicles (EVs), and flexible loads, are combined to create a microgrid characterized by different operational characteristics and timescales. Hence, the management of these resources implies finding the right balance between several objectives, which may be in conflict, such as minimizing electricity consumption costs, reducing battery degradation, maximizing the use of renewable energy, and increasing the robustness of the system. Typically, single-objective and rule-based strategies cannot capture such complex interdependencies, and thus, they deliver lower quality solutions. Therefore, using multi-objective optimization algorithms, which guide the system to a favorable techno-economic solution, allows it to be sustained. In this context, batteries or BESS system investments are very vulnerable to being frequently cycled; in a situation of misuse of batteries, their lifecycle may be shortened and weakened because of economic sustainability. As a result, modern BESS systems have diversified exposure to dynamic electricity tariffs, market-based energy trading, and stochastic renewable generation. Moreover, multi-objective optimization allows a better and more realistic portrayal of such complexities, which enables the decision-makers to pick the most suitable solution depending on operational or policy goals. Over the last few years, there has been tremendous progress in bio-inspired and hybrid optimization algorithms, and this has resulted in high performance in handling nonlinearities, uncertainties, and large-scale search spaces, as well as gaining speed, stability, and scalability for large-scale applications. Therefore, this paper addresses a multi-objective Nizar Optimization Algorithm (NOA)-based EMS strategy. The proposed EMS aims to optimize the power flow and operation cost of a hybrid grid-connected MG system comprising a PV system, WT, BESS, and community load. The suggested EMS aims to manage the energy generation from the RES and stored energy of the BESS units and minimize the electricity costs from the grid and battery degradation costs under constant and variable time-of-use (TOU) utility grid tariffs. The main contributions are as follows:
- For the optimal coordination of multi-energy systems in a grid-connected microgrid, a novel energy management system (EMS) framework based on the Nizar Optimization Algorithm (NOA) is proposed. The EMS is balancing power flow among PV, WT, BESS, and grid components under variable weather and load conditions.
- The authors have developed a new multi-objective formulation to minimize the cost of power exchanged with the grid and the cost of battery degradation simultaneously. Besides that, it also maintains high power quality and system stability, thus ensuring a resilient and cost-effective operation.
- Comparative performance evaluation via MATLAB simulations under various weather conditions is conducted for the proposed and well-known EMS methods. The NOA-based EMS proposed shows faster convergence, better dynamic response, and higher economic performance (total cost reduction of USD 17–34, and the degradation cost is 27% lower).
- The proposed EMS, supported by comprehensive validation and sensitivity analyses, is stable, flexible, and scalable, thus presenting a strong case for its implementation in the real world of future smart grid and hybrid microgrid architectures.
The rest of this paper is organized as follows: Section 2 presents the modeling of the proposed system. Section 3 introduces the design of the suggested EMS. Section 4 discusses the results of the simulation. Section 5 shows the limitations and future work, and Section 6 presents the conclusion of the article.
2. Modeling of the Proposed System
2.1. Microgrid Structure
The typical MG system structure is displayed in Figure 1. The suggested MG incorporates RESs (PV and WT) sources, an energy storage unit, and different loads. The battery storage provides the required load demand, stores the additional RES generation, and minimizes the cost of electricity during peak time. The PV system is connected to the DC bus via a DC/DC boost converter. The WT unit is connected to the DC bus via an AC/DC rectified converter, while a bidirectional DC/DC converter was used to link the BESS with the DC link. Then, all units are connected to the utility grid via a DC/AC bidirectional converter. The main parameters of the system are listed in Table 1.
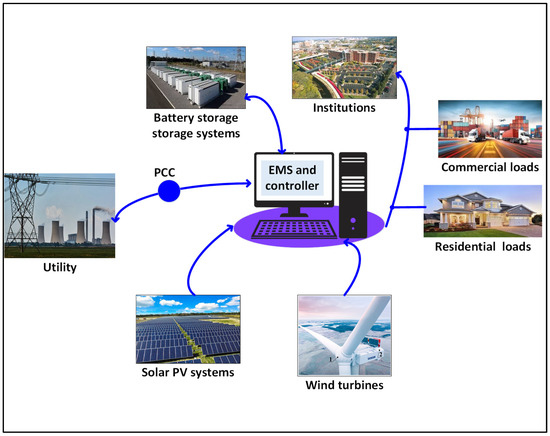
Figure 1.
Microgrid configuration.

Table 1.
Main parameters of the microgrid.
2.2. PV Solar Modeling
The modeling of the solar cell or array can be verified using a single-diode model. This model is illustrated in Figure 2. As observed, the electrical circuit of the cell consists of a photocurrent source, a parallel diode, and series and shunt resistances. The inputs of the model represent the solar irradiance and temperature. The generated current ) from the PV cell is written as follows [31]:
where and are the photo and diode saturation currents, respectively. The parameters in Figure 2 also include the diode current and the current of the shunt resistance, which are denoted by and , respectively. The terminal voltage of the cell is denoted by , and and are the series and shunt resistances, respectively; is the thermal voltage, and is the diode ideality constant.
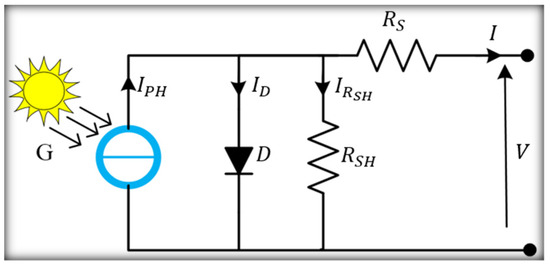
Figure 2.
PV cell model.
The PV power can be determined based on the cell’s efficiency (), the effective area of the cell (), and the global solar irradiance as presented in Equation (2) [32].
The efficiency of the cell or area can be written as follows:
where is the efficiency under standard test conditions (), is the temperature coefficient (), and is the cell temperature ().
2.3. Battery Energy Storage Modeling
The BESS provides energy or absorbs it from the microgrid system via bidirectional operation. So, the discharging/charging power of the BESS can be written as in Equation (5) [14,32].
where and represent the charging and discharging power of the BESS, respectively. The term can be defined as follows:
The state of charge of the BESS is expressed as follows [14]:
where denotes the SOC of the BESS at the current time and previous time step (). The losses during the charge and discharge modes are represented by and , respectively. The BESS currents under charge and discharge modes are represented by and , respectively.
2.4. Wind Turbine Modeling
The WT generator works to generate power output varying with respect to changes in the speed of the wind. However, the wind speed itself is highly determined by altitude, which varies with height above ground level. At the particular location that is under consideration here, there is the ability to determine the height of the axis that is used for the wind turbine, using the recorded measurements of the wind speed. In this study, the power-law model, as shown in Equation (7), was applied to compute the wind speed based on the hub height [33].
where and are the wind speeds () at the reference height and WT hub height, respectively, is the hub height of WT (), denotes the reference height, and denotes the coefficient of the friction, which is in this study.
The output power of the WT can be calculated from Equations (8) and (9).
where represents the rated power of the wind turbine in KW, is the wind speed, is the rated value of the wind speed, denotes the cut-in wind speed, and is the cut-out wind speed of the WT. Moreover, the output power of the wind generation is zero when the wind speed value is less than the cut-in value or greater than the cut-out value of the speed. As a result, the amount of power of the WT can be written as follows [33]:
where represents the efficiency of the WT.
2.5. System Constraints
In this work, the multi-objective optimization has been used to minimize the cost of the grid and degradation cost of the BESS. As a result, the equality constraint of the proposed system is derived based on the following equations:
where is the load power (), and is the grid power ().
The inequality constraints of the proposed MG can be written as Equations (12)–(16) [14]:
where and are the SOC constraints, and are the BESS energy constraints, and are the PV power constraints, and represent the WT power constraints, and and are the grid active power constraints.
2.6. Load Profile and Weather Conditions
The research case study was applied in Shuaiba village in Basra state, south of Iraq, with coordinates 30.47421° N, 47.6492° E.
The village people obtain their electricity from the traditional grid. The community load or consumption demand of this village for 24 h is shown in Figure 3. The consumption data are averaged to estimate the daily load demand. The peak load value is 630 kW.
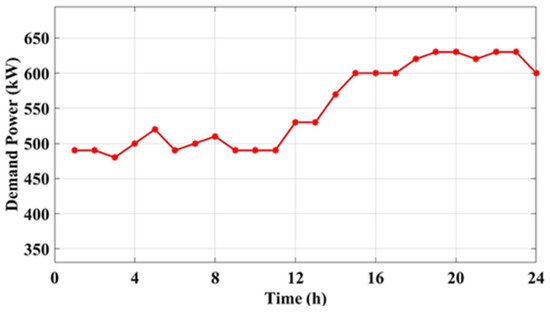
Figure 3.
Daily demand load consumption.
The solar irradiance (Global irradiance), in W/m2, of this location is displayed in Figure 4a. The GHI data are taken from the HOMER pro software for three months, which are January, April, and August 2023. The average peak values of the GHI for January, April, and August are and , respectively. The daily average temperatures for the location are presented in Figure 4b. The peak values of the temperature at mid-day for January, April, and August are , respectively. The wind speed profile for this location is shown in Figure 5. These curves are taken from reference [34].
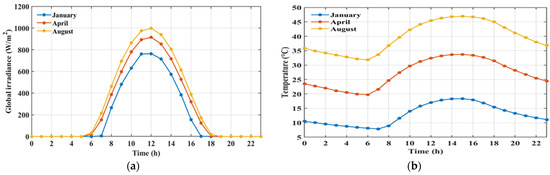
Figure 4.
(a) Daily average irradiance and (b) daily average temperature.
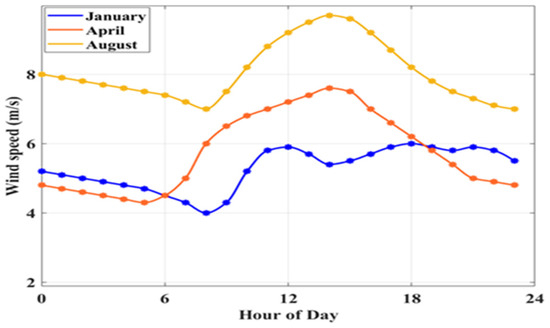
Figure 5.
Wind speed profiles.
2.7. Problem Formulation and Objective Function
In this work, a multi-objective EMS was presented to minimize the cost of the total energy in an MG by ensuring the utility grid purchase with minimal cost for battery degradation. When the grid uses time-based variable tariffs, its cost changes by the hour and according to the demand level. This has an impact on consumer behavior and how the utility function changes in the future. Essentially, the idea is to encourage the use of renewable energy that is both abundant and low cost. The objective of this study is to reduce the production cost of the electricity required to meet the demand while maintaining the grid’s reliability standards. Therefore, the grid cost function can be written as follows [14,32]:
where is the cost of the grid power, and is the generation function. However, one of the multi-objective functions that has been taken into account in the study to prolong the battery life is the battery degradation minimization. It shows a gradual reduction in the performance and capacity of a battery with time, which results from the depth of discharge () and the state of charge (). A model of the battery power cost is given by Equation (18), and the first objective function is expressed in Equation (19).
where denotes the cost of the degradation in the battery, and is the cost of the capacity in kWh. This cost was written as follows [14]:
where and are the cycle and calendar battery costs. are the number of battery lifecycles, charge rate, and temperature of the battery, respectively.
The second objective function can be written as follows:
Therefore, the main can be described as follows:
3. Proposed EMS Design
3.1. Multi-Objective Nizar Optimization Algorithm
A multi-objective Nizar Optimization Algorithm (NOA) is designed for energy scheduling in microgrid systems to plan energy use from the grid, a battery, and a renewable source in an optimized way. This paper aims to lower the grid power cost and the battery degradation cost simultaneously, while benefiting from solar PV and WT generation.
However, the NOA introduces two new concepts: effective mappings and points. Effective mappings are six vector maps that are characterized by three mixing operations, i.e., replace, shuffle, and distribute, and three transformation operations, i.e., step translation, step-dilation, and transfer [35,36]. Effective points represent six vectors that were formed by using effective mappings and the individuals of the previous generation. Both these techniques play a significant role in the working of the NOA. Furthermore, a new candidate only replaces the corresponding candidate if its fitness value is better. However, the candidate solution of the NOA optimizer can be defined in Equation (23) [35].
where is the problem dimensions, is the current, and is the population size.
3.2. Effective Mappings
The mixing mappings create the new mixed vector by combining the elements of the input vector and the target vector by using replacement or shuffling. The idea is to pick a random discrete or continuous subset of elements. In the replace map, the original order of replaced elements is maintained, as illustrated in Figure 6.
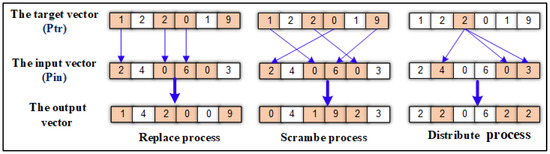
Figure 6.
Effective mixing mappings.
Moreover, the scramble map does not take into account the order of the substituted elements, thus adding more randomization. In the distribute map, the chosen elements are replaced with one randomly selected element from , thus the elements become indistinguishable.
3.3. Effect Transformation Mappings
The transformation mappings create a new vector using only one of three operations, translation, dilation, or transfer, on the given vector. When a transformation is not present, the mapping will just return the input vector. These operators can also be defined mathematically as follows [35]:
where denotes the translation map, is the translation factor, is the dimensional vector ones, and represents the selection coefficient. Moreover, the step-dilation map () can be expressed as follows:
The transfer of the map () can be written as follows:
where The four coefficients of the effective mappings have been expressed as follows:
where represent random numbers [0, 1]. Figure 7 shows a block diagram of the proposed EMS architecture. As observed, the inputs of the NOA are solar PV irradiance, demand load, and wind speed. The algorithm includes the dynamic grid cost, battery power capacity, and constraints. The suggested algorithm meets energy needs by the combination of RES generation, the battery, and the grid, so the battery schedule and the grid cost are at their optimal levels.
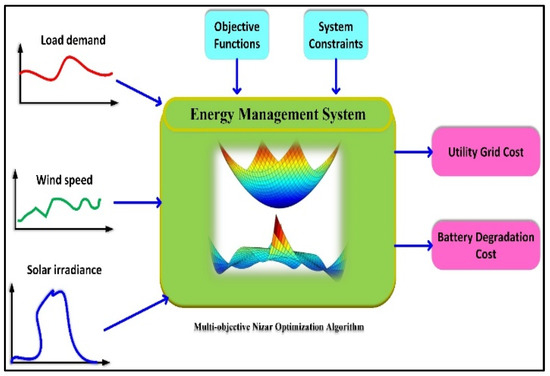
Figure 7.
Block diagram of the proposed EMS.
The entire workflow for locating a suitable solution for the NOA-based EMS is essentially dependent on the successive evaluation and improvement of candidate solutions. During every cycle (iteration), the objective function is used to rate each candidate schedule vector. The function works to minimize the total operating cost, which is a result of the sum of the grid purchase cost, battery degradation, and export revenues, while, at the same time, a violation of the constraints, e.g., SoC and grid power limits, is being penalized. To stimulate the interaction between the spaces, the newly generated candidates are combined through mixing mappings (replace, scramble, and distribute) for diversity and transformation mappings (translation, dilation, and transfer) to detail the already found promising solutions. The mechanism of greedy selection, which is instrumental in ensuring that only better solutions are kept for consideration, is always updating the global best solution, and each time a better performance is found. The process keeps on going until it converges or the maximum number of iterations is reached; therefore, Gbest is the returned optimal EMS schedule, which depicts the best idea of the most cost-effective combination of grid, RES, and BESS operations.
Figure 8 displays the flowchart of the EMS-based NOA. Basically, the algorithm ceases its operation when any of the following conditions occur:
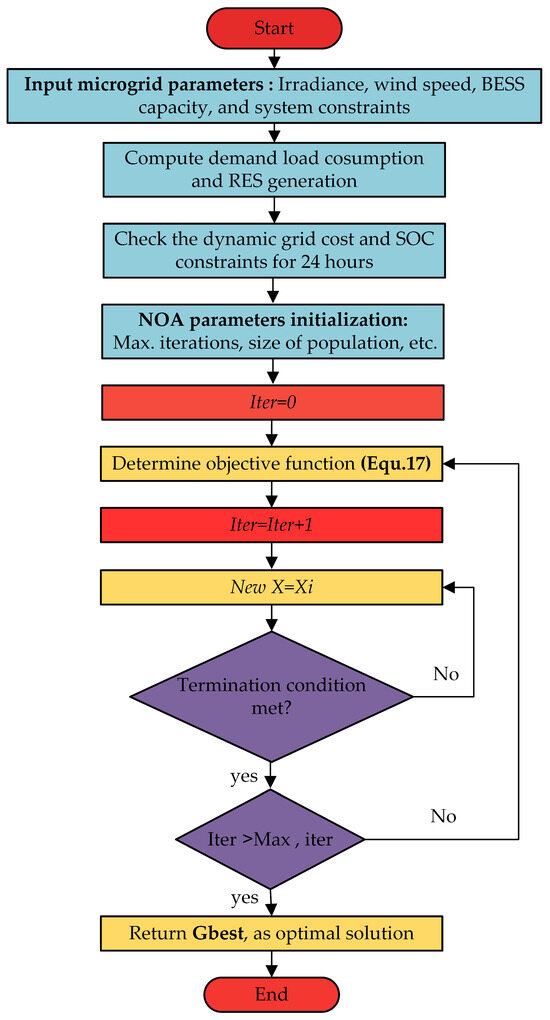
Figure 8.
Flowchart of the EMS-based NOA.
- The first condition is that the maximum number of iterations (MaxIter) is reached, thus putting a limit on the computational resources to be used.
- The second condition is the absolute difference between the best fitness values of two consecutive iterations being less than a small threshold (|F(t) − F(t−1)| < 10−6), which stands for convergence and a very slight change in the objective function.
4. Results and Discussion
The simulation results are collected using a MATLAB software 2021a-based PC, Intel(R) Core(i7) 2.60 GHz, with installed RAM 16.0 GB of installed RAM. The parameters of the MG components are listed in Table 2. The PSO and NOA are tested under different numbers of population sizes and iterations. The best results are obtained using iterations. The suggested EMS-based NOA was validated under two scenarios. The first scenario denotes the obtained results during a winter season, which include the solar irradiance, temperature, and wind speed in the month of January. The second scenario introduces the validation of the proposed EMS under summer weather conditions (August).
Table 2.
The parameters of the MG.
4.1. NOA Performance Under Scenario 1
In this section, the winter weather, based on January, is used to test the proposed EMS. This scenario offers a dynamic grid tariff for purchasing a grid energy-based demand load and limits on the BESS energy. The results that have been gathered in Figure 9 display the ability of the proposed EMS to successfully manage the supply and demand balance over the 24 h duration. The load profile depicts a steady increase from around 500 kW in the middle of the night to beyond 600 kW during the evening peaks. The power from PV has an absolute output of almost 600 kW at around noon, while the WT input stays quite low but changes, implying the sporadic character of the local wind resources. The BESS indeed is very important in this case, as it is the one that is charging in the middle of the day, when there is a surplus of PV (power values are negative), and in the morning and evening, it peaks, and it can be discharged, thus making the network less dependent on it. The grid power movement shows this coordination: during the day, when the power from the grid is less, the EMS takes the load from the system (the values that are negative represent the power that is being exported). While in early morning and late evening, the grid hands over power to the system after BESS support because the power is not enough. Figure 10 displays the supply-side energy flow under the proposed EMS. The energy from grid imports is the most dominant, and as such, the largest share of demand coverage is accounted for. This outcome reflects the very limited contribution of renewables during the hours of low irradiance and the rather small capacity of the local wind turbine. Still, solar PV is the second most important source of energy, being able to meet a significant part of the daily consumption and, thus, directly lowering the need for the grid during the middle of the day hours. The battery discharging, i.e., injection, though it is quite small compared to PV and energy from the grid, plays the most important role in peak-shaving and load-leveling, that is, during the night hours when no solar power is available. The grid interaction profile in Figure 11 shows the bidirectional energy exchange aspect of the proposed EMS. During the early morning and the late evening periods, the system is mostly dependent on grid imports (positive values), with peak imports of more than 600 kW because of the lack of renewable sources. On the other hand, during mid-day hours (10:00–15:00 h), excess solar generation along with low load demand makes it possible for the system to export energy to the grid (negative values); thus, the EMS is capable of supporting the grid flexibility through the participation of prosumers. Peak hour imports are set at USD 0.23/kWh, while off-peak transactions are at USD 0.16/kWh. The EMS, which is enhanced by the NOA, is mainly battery charging during off-peak hours and discharging during peak hours, thus giving consumers the ability to lower expensive purchases and raise arbitrage benefits.
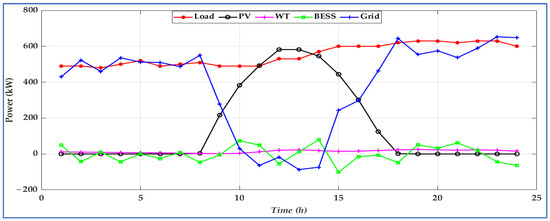
Figure 9.
Obtained power curves during January.
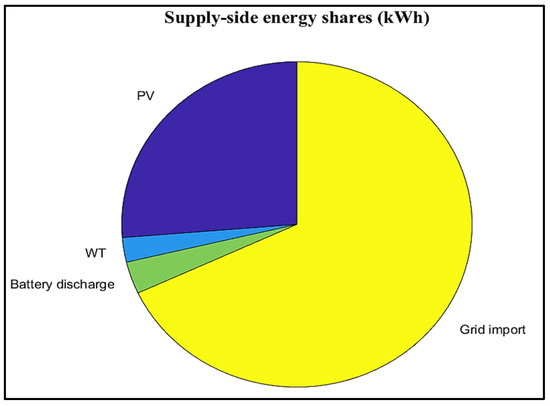
Figure 10.
Daily grid power during January.
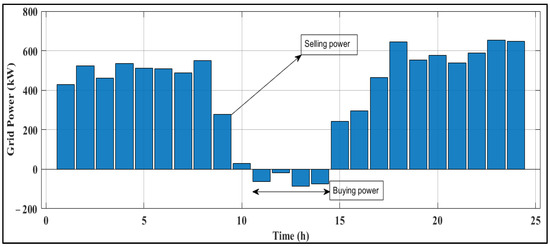
Figure 11.
Energy shares of the microgrid.
The BESS operation profile is shown in Figure 12. The effectiveness of the proposed EMS in charge–discharge scheduling is shown, as the demand, renewable availability, and time-of-use tariffs vary. Charging is mainly completed during the solar peak with the lowest electricity price conditions, while discharging (positive values) occurs in the evening and morning peaks when electricity is highest and renewable sources are few. The total stored energy shows that the BESS avoids the upper and lower limits for the most part of a cycle, thus directly reducing the degradation process and, therefore, increasing the battery lifetime, as illustrated in Figure 12a. Also, the SoC pattern in Figure 12b is very informative about good battery management.

Figure 12.
(a) BESS energy results; (b) BESS SOC.
The SoC ranges from about 30% to 70%, which is well within standard cycling procedures for lithium-ion types, where the mid-range is preferred to prevent aging. More importantly, the optimizer spotlessly deters any long-time SoC standstill at the limits, which is indicative of very good dynamic control. This optimized scheduling can be compared to the conventional EMS.
The results in Figure 13, based on the proposed objective function, are obtained for the classical PSO and NOA. This figure represents the objective total cost under PSO and the NOA. The convergence comparison of PSO and NOA is shown, thus giving a clear picture of the efficiency and the robustness of the applied optimization techniques. Both algorithms manage to converge to values close to the optimal ones within 100 iterations. The PSO algorithm converges at the first considerable reduction in the objective function, yet the convergence reaches a higher final cost of USD 8788.4 upon further iterations. This outcome presents PSO’s tendency to early convergence due to insufficient exploration, which is likely to limit the release of local minima traps. On the other hand, the NOA shows better behavior in convergence, as it achieves the lower final cost of USD 6474.32 after 80 iterations. The less abrupt and more regular convergence profile of NOA is indicative of a well-balanced trade-off between the exploration and exploitation facets of the algorithm, with the algorithm being more effective in the search of the solution space. The 26.3% reduction in operational cost achieved by the NOA directly translates to the reduced reliance on grid imports and more efficient utilization of renewable and storage resources, as can be seen from the energy flow and SoC results. Besides that, the NOA’s quicker convergence rate lessens the computational burden required for real-time or day-ahead EMS applications.
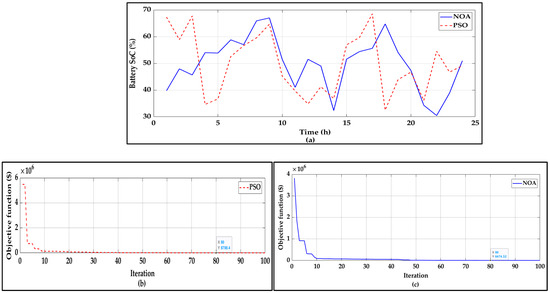
Figure 13.
(a) BESS under both PSO and NOA; (b) objective function (total cost) under PSO; (c) objective function under NO.
The graph in Figure 14 compares the hourly degradation of battery costs under the strategies of PSO and NOA. The outcome indicates that the NOA is able to maintain lower degradation costs throughout the period, with the drop and rise of values ranging mainly from USD 0.5 to USD 3.5, while PSO exhibits a high level of instability, where a number of peaks are noticeable, reaching the USD 6–6.5 range that corresponds to high charge-discharge cycles. On the other hand, the NOA ensures a better cost by matching BESS operations with solar or wind and price signals, thus avoiding cycling that is not necessary. Therefore, the life of the energy storage was extended, which consequently leads to a decrease in the LCOE of the entire hybrid microgrid system.
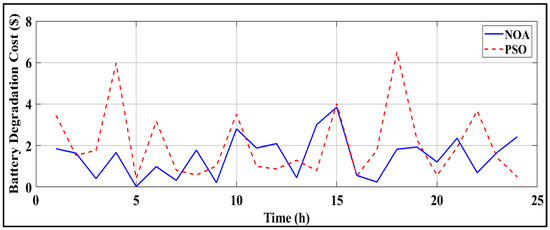
Figure 14.
Battery degradation cost under PSO and NOA.
4.2. NOA Performance Under Scenario 2
In this section, the weather conditions during the month of August in Iraq are used to test the performance of the EMS-based grid cost and battery degradation costs. The solar PV and WT generation are high due to the higher irradiance and wind speed. The high temperature in the south of Iraq affects the PV power. As shown in Figure 15, the PV power is higher than the required load at mid-day due to an increase in the GHI during this month, where the maximum PV power is at . The maximum generation of the WT is at time . The BESS charges the grid, and the peak power is at time . At time , the grid power is . In night mode, the demand load is high, and RES generation is very low. So, the power supplied the load with an active power of .
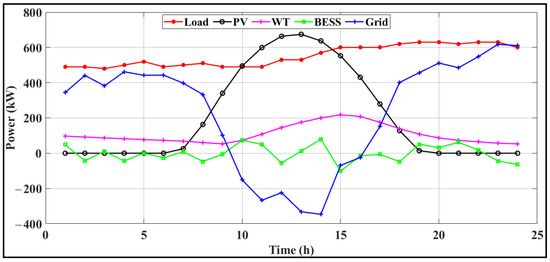
Figure 15.
Obtained power curves during August.
The energy share from the supply side that uses renewable sources (Figure 16) shows a more balanced contribution from both the renewable sources and the grid, as compared to the results in January.
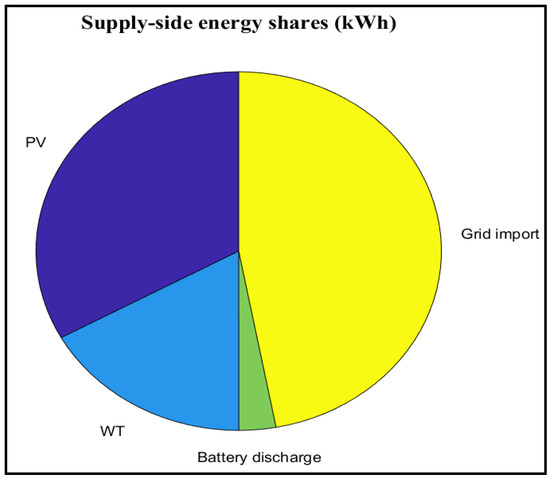
Figure 16.
Energy shares in August.
It can be shown that the grid imports are the leading source. However, grid share has been lowered to about 50%, and at the same time, PV and wind have been raised to about 32% and 15%, respectively. With the battery discharge share being around 3%, the increased penetration of renewables mirrors the change in resources over the year: more solar radiation and stronger wind compared to January. As a result, the system depends less on the grid and has managed to reach a higher degree of self-sufficiency.
Figure 17 shows the selling/buying grid power for the dynamic grid cost at 24 h. The highest power was imported in the morning and in the evening (up to approximately 600 kW), whereas a significant power was exported at mid-day (−350 kW) due to PV and wind generation that exceeded the local load. Compared to the result of January, where grid import was dominant with limited exports, this example suggests a better penetration of renewable energy and a stronger generation at mid-day. The system is now discharging more during the sun hours; thus, it is less dependent on expensive imports. Such a seasonal change indicates that the solar irradiance and wind availability have increased, which also demonstrates the EMS’s flexibility to the changes in resources while securing the economic advantage by having more opportunities to sell during the surplus periods.
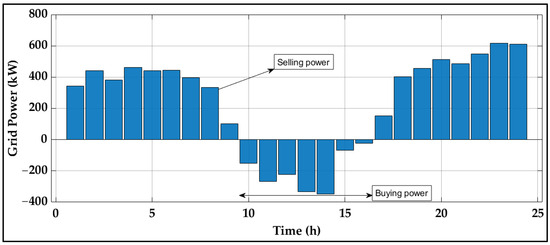
Figure 17.
Grid power selling and buying in August.
Figure 18 illustrates the BESS energy and BESS SOC in August. In Figure 18a, the BESS is charged, which is illustrated with negative power values, mainly around noon when a large PV surplus is observed, while the discharging is allowed during the morning and evening to support peak loads. The energy stored in the battery has been kept between 150 and 350 kWh, ensuring that the battery is safe. Figure 18b shows the SoC changes, with the BESS operating between 30% and 70%, where the absolute SoC increased during the day when the battery was charged from the PV. The improvement in the solar radiation season makes it possible to facilitate more charging from the PV and thus lower the system’s dependency on the grid and increase its efficiency.
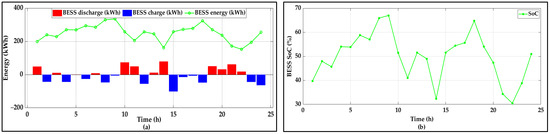
Figure 18.
(a) BESS energy; (b) BESS SOC in the August scenario.
To clear the novelty of the EMS-NOA method, the comparison with the conventional PSO algorithm is completed in terms of SOC of the battery and convergence speed, as shown in Figure 19. This illustration compares the SoC profiles of the BESS and the convergence performance of the PSO and NOA. This figure shows that the NOA has stable SOC values. On the other side, PSO shows the presence of abrupt changes, which also result in an increase in the degradation risk of the BESS. Moreover, the PSO can reach a local minimum near USD 8177.15, while the NOA descends the objective function to a value of USD 5861.72, which is approximately 28% lower. Additionally, the NOA reaches a convergent point more reliably with less fluctuation, which indicates a better balance between exploration and exploitation phases. Therefore, these findings not only support the supremacy of the NOA as a technical and economical solution but also highlight further savings and the BESS’s health improvement because of the transition from the baseline PSO approach.
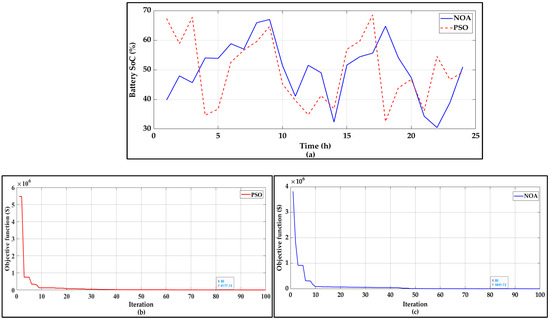
Figure 19.
(a) BESS SOC; (b) convergence of PSO; (c) convergence of the NOA.
In addition, the comparison-based grid cost is presented in Figure 20. Figure 21 presents the degradation cost of the BESS. The NOA shows USD while the classical PSO method shows a high cost of USD .
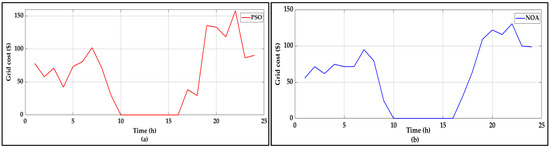
Figure 20.
Grid cost curves under (a) PSO and (b) NOA.
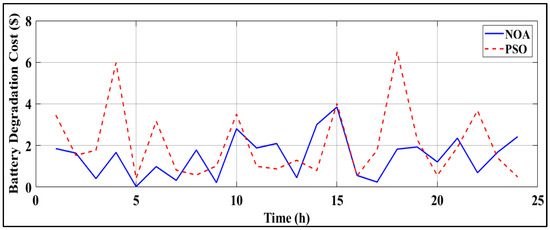
Figure 21.
Degradation cost of the BESS under PSO and NOA.
4.3. Comparison with the Existing Algorithms
The comparison of the achieved results in the suggested EMS-based NOA is displayed in Table 3. The comparison was discussed in terms of degradation battery cost, grid power purchase cost, and total cost of the system. The suggested NOA has been compared with exciting algorithms, including the grey wolf optimizer (GWO), salp swarm algorithm (SSA), PSO, and Genetic algorithm (GA). In Scenario 1, the suggested NOA presents the lowest cost of USD 1886.52, which is the sum of the USD 1850.59 grid purchase cost and the USD 35.93 degradation cost. By contrast, PSO arrives at a total cost that is USD 32.06 (1.7%) higher than the NOA, thus resulting in USD 1918.58. Moreover, GWO, SSA, and GA produce total costs of USD 1908.55, 1904, and 1919, respectively, which are all larger than the total of the NOA by 22.03 (1.2%), 17.48 (0.9%), and 32.48 (1.7%). Additionally, the NOA attains the minimum degradation cost of USD 35.93, whereas the degradation costs of all the other algorithms range from USD 42 to 49.4, a difference that accounts for a 27% reduction with respect to PSO. In Scenario 2, the dominance of the NOA is highlighted. The suggested methodology reaches a minimum total cost of USD 1411.39, which is made up of a grid purchase cost of USD 1375.46 and a degradation cost of USD 35.93. In comparison, PSO has a total cost of USD 1445.62, which results in USD 34.23 (2.4%) savings with the NOA. The results of GWO, SSA, and GA are 1437, 1438.7, and 1445, respectively, which are all greater than USD 25.61 (1.8%), USD 27.31 (1.9%), and USD 33.61 (2.4%). So, the NOA also achieves the minimum degradation cost of stress on the BESS, compared to the other competitors. The findings show that the proposed NOA method is able to reach its goal faster and takes less time for the whole process compared to the other methods because the NOA method balances adaptive exploration–exploitation and has a simplified update mechanism. Accordingly, the average execution time of the NOA was around 18 s, whereas it was 24.7 s for PSO, under the same simulation conditions in MATLAB.
Table 3.
Numerical results and comparison with the exciting methods.
Figure 22 displays the chart comparison in terms of the total cost of the system. As observed in this figure, the proposed EMS-based NOA shows robust performance, with total cost savings varying from USD 17 to 34, compared to other optimizers, as well as a great reduction in degradation cost (up to 27% improvement over PSO). Thus, it is confirmed that the NOA is capable of providing continuous financial savings, extended battery life, and increased EMS stability under different operating conditions.
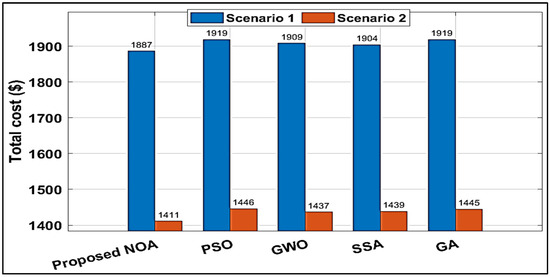
Figure 22.
Total cost of the MG comparison.
5. Limitations and Future Work
Even though the NOA-based energy management system (EMS) demonstrated in this article exhibits an effective convergence, a high robustness level, and a better cost reduction rate than traditional optimizers, it also imposes some limitations that should be acknowledged. To begin with, this work only relies on MATLAB/Simulink simulations and lacks hardware-in-loop or real-time implementation, which may limit the extent of the practical validation. Secondly, the optimization exercised in this study assumes deterministic component parameters and fixed uncertainty bounds; thus, substantially stochastic environmental or market changes that may occur are not fully considered. However, hardware-in-loop (HIL) and experimental tests will be carried out to check the controller’s real-time capability and stability in actual operating conditions in future work. Finally, the hybrid strategies that merge the NOA with reinforcement learning or model predictive control (MPC) may be designed to improve the system’s dynamic performance and the accuracy of the decisions.
6. Conclusions
This article presents a new energy management system for a hybrid grid-connected microgrid topology using the multi-objective Nizar Optimization Algorithm (NOA). The suggested system consists of a solar PV array, a wind turbine, battery energy storage, and a demand community load. The case study considers a community demand load in southern Iraq, Shuaiba village. The daily demand load of this location is considered based on summer and winter weather data. The validation of the proposed MG system is implemented under different tests using MATLAB software. The achieved results in terms of grid power cost, degradation of the battery, as well as state of charge analysis are obtained. The generation of the RES sources and grid power based on the required power demand is analyzed. The SOC of the battery based on demand and power productivity is compared. The results in January and August are extracted for the proposed EMS-based NOA and the classical PSO optimization methods. The findings show that the NOA ensures the lowest costs, a USD grid purchase cost and USD for the battery degradation cost. The PSO provides high costs for the MG, where the grid purchase cost is USD and the degradation cost is USD . Moreover, the NOA’s performance is proven by comparison with the exciting algorithms, such as the grey wolf optimizer (GWO), salp swarm algorithm (SSA), PSO, and Genetic algorithm (GA). As a result, the NOA has the ability to offer low-cost savings, longer battery life, as well as improved EMS for grid-connected MG stability.
Author Contributions
Methodology, D.M.M.; Writing—original draft, H.W.S.R. All authors have read and agreed to the published version of the manuscript.
Funding
This research received no external funding.
Data Availability Statement
The original contributions presented in the study are included in the article, further inquiries can be directed to the corresponding author.
Conflicts of Interest
The authors declare no conflict of interest.
References
- Qasim, M.A.; Yaqoob, S.J.; Bajaj, M.; Blazek, V.; Obed, A.A. Techno-economic optimization of hybrid power systems for sustainable energy in remote communities of Iraq. Results Eng. 2025, 25, 104283. [Google Scholar] [CrossRef]
- Zubair, M.; Ullah, I.; Alanazi, A.; Alanazi, M.; Hassan, I.; Jan, S.T. Energizing rural Pakistan through optimization of stand-alone hybrid systems with techno-economic, multi-criteria decision and sensitivity analysis. Environ. Dev. Sustain. 2024, 26, 1–49. [Google Scholar] [CrossRef]
- Rehmani, A.M.; Akhter, P. Techno-Economic analysis of hybrid renewable energy systems for rural area energization in Pakistan. In Proceedings of the 2019 3rd International Conference on Energy Conservation and Efficiency (ICECE), Lahore, Pakistan, 23–24 October 2019; IEEE: Piscataway Township, NJ, USA, 2019; pp. 1–6. [Google Scholar] [CrossRef]
- Jan, S.T.; Alanazi, A.; Feroz, M.; Alanazi, M. Techno-economic analysis of renewable energy sources’ potential in the rural northern region of Kalam in Pakistan. Environ. Dev. Sustain. 2024, 27, 11117–11160. [Google Scholar] [CrossRef]
- Yaqoob, S.J.; Arnoos, H.; Qasim, M.A.; Agyekum, E.B.; Alzahrani, A.; Kamel, S. An optimal energy management strategy for a photovoltaic/li-ion battery power system for DC microgrid application. Front. Energy Res. 2023, 10, 1066231. [Google Scholar] [CrossRef]
- Yaqoob, S.J.; Ferahtia, S.; Obed, A.A.; Rezk, H.; Alwan, N.T.; Zawbaa, H.M.; Kamel, S. Efficient flatness based energy management strategy for hybrid supercapacitor/lithium-ion battery power system. IEEE Access 2022, 10, 132153–132163. [Google Scholar] [CrossRef]
- Allwyn, R.G.; Al-Hinai, A.; Margaret, V. A comprehensive review on energy management strategy of microgrids. Energy Rep. 2023, 9, 5565–5591. [Google Scholar] [CrossRef]
- Sharma, P.; Mathur, H.D.; Mishra, P.; Bansal, R.C. A critical and comparative review of energy management strategies for microgrids. Appl. Energy 2022, 327, 120028. [Google Scholar] [CrossRef]
- Bruni, G.; Cordiner, S.; Mulone, V.; Rocco, V.; Spagnolo, F. A study on the energy management in domestic micro-grids based on model predictive control strategies. Energy Convers. Manag. 2015, 102, 50–58. [Google Scholar] [CrossRef]
- Joshi, A.; Capezza, S.; Alhaji, A.; Chow, M.Y. Survey on AI and machine learning techniques for microgrid energy management systems. IEEE/CAA J. Autom. Sin. 2023, 10, 1513–1529. [Google Scholar] [CrossRef]
- Ahmad, S.; Shafiullah, M.; Ahmed, C.B.; Alowaifeer, M. A review of microgrid energy management and control strategies. IEEE Access 2023, 11, 21729–21757. [Google Scholar] [CrossRef]
- Gholami, M.; Mousavi, S.A.; Muyeen, S.M. Enhanced microgrid reliability through optimal battery energy storage system type and sizing. IEEE Access 2023, 11, 62733–62743. [Google Scholar] [CrossRef]
- Dhanavath, T.; Injeti, S.K.; Busi, R. Grid-Edge Optimization for Maximizing the Utilization of Solar-Battery and Wind-Biomass Systems in Large-Scale Networked Microgrids to Minimize Annual Overall Cost. J. Act. Passiv. Electron. Devices 2025, 18, 257. [Google Scholar]
- Ibrahim, O.; Aziz, M.J.A.; Ayop, R.; Dahiru, A.T.; Low, W.Y.; Sulaiman, M.H.; Amosa, T.I. Fuzzy logic-based particle swarm optimization for integrated energy management system considering battery storage degradation. Results Eng. 2024, 24, 102816. [Google Scholar] [CrossRef]
- Nammouchi, A.; Aupke, P.; D’andreagiovanni, F.; Ghazzai, H.; Theocharis, A.; Kassler, A. Robust opportunistic optimal energy management of a mixed microgrid under asymmetrical uncertainties. Sustain. Energy Grids Netw. 2023, 36, 101184. [Google Scholar] [CrossRef]
- Raghuwanshi, S.S.; Raghuwanshi, P.; Masih, A.; Singh, P. Modeling and optimization of hybrid renewable energy with storage system using flamingo swarm intelligence algorithms. Energy Storage 2023, 5, e470. [Google Scholar] [CrossRef]
- Faisal, M.; Hannan, M.A.; Ker, P.J.; Rahman, M.A.; Begum, R.A.; Mahlia, T.M.I. Particle swarm optimised fuzzy controller for charging–discharging and scheduling of battery energy storage system in MG applications. Energy Rep. 2020, 6, 215–228. [Google Scholar] [CrossRef]
- Minh, N.Q.; Linh, N.D.; Khiem, N.T. A mixed-integer linear programming model for microgrid optimal scheduling considering BESS degradation and RES uncertainty. J. Energy Storage 2024, 104, 114663. [Google Scholar] [CrossRef]
- Shafiei, K.; Seifi, A.; Hagh, M.T. A novel multi-objective optimization approach for resilience enhancement considering integrated energy systems with renewable energy, energy storage, energy sharing, and demand-side management. J. Energy Storage 2025, 115, 115966. [Google Scholar] [CrossRef]
- de Lima, T.D.; Faria, P.; Vale, Z. Optimizing home energy management systems: A mixed integer linear programming model considering battery cycle degradation. Energy Build. 2025, 329, 115251. [Google Scholar] [CrossRef]
- Wang, J.; Lyu, C.; Bai, Y.; Yang, K.; Song, Z.; Meng, J. Optimal scheduling strategy for hybrid energy storage systems of battery and flywheel combined multi-stress battery degradation model. J. Energy Storage 2024, 99, 113208. [Google Scholar] [CrossRef]
- Khani, M.; Moghaddam, M.S.; Noori, T.; Ebrahimi, R. Integrated energy management for enhanced grid flexibility: Optimizing renewable resources and energy storage systems across transmission and distribution networks. Heliyon 2024, 10, e39585. [Google Scholar] [CrossRef]
- Li, L.; Sun, Y.; Han, Y.; Chen, W. Seasonal hydrogen energy storage sizing: Two-stage economic-safety optimization for integrated energy systems in northwest China. IScience 2024, 27, 110691. [Google Scholar] [CrossRef]
- Ankar, S.J.; Pinkymol, K.P. Optimal sizing and energy management of electric vehicle hybrid energy storage systems with multi-objective optimization criterion. IEEE Trans. Veh. Technol. 2024, 73, 11082–11096. [Google Scholar] [CrossRef]
- Apribowo, C.H.B.; Hadi, S.P.; Wijaya, F.D.; Setyonegoro, M.I.B. Early prediction of battery degradation in grid-scale battery energy storage system using extreme gradient boosting algorithm. Results Eng. 2024, 21, 101709. [Google Scholar] [CrossRef]
- Qian, J.; Guo, Y.; Wu, D.; Liu, A.; Han, Z.; Liu, Z.; Zhang, S.; Yang, X. Research on multi-time scale optimization of integrated energy system based on multiple energy storage. J. Energy Storage 2024, 102, 113892. [Google Scholar] [CrossRef]
- Zhang, X.; Liu, Y.; Zhan, Y.; Yan, R.; Mei, J.; Fu, A.; Jiao, F.; Zeng, R. Multi-scenario optimization and performance evaluation of integrated energy system considering co-scheduling of EVs and stationary energy storage. Renew. Energy 2024, 237, 121927. [Google Scholar] [CrossRef]
- Sharma, P.; Saini, K.K.; Mathur, H.D.; Mishra, P. Improved energy management strategy for prosumer buildings with renewable energy sources and battery energy storage systems. J. Mod. Power Syst. Clean Energy 2024, 12, 381–392. [Google Scholar] [CrossRef]
- Xiong, Z.; Zhang, D.; Wang, Y. Optimal operation of integrated energy systems considering energy trading and integrated demand response. Energy Rep. 2024, 11, 3307–3316. [Google Scholar] [CrossRef]
- Liang, Z.; Chung, C.Y.; Zhang, W.; Wang, Q.; Lin, W.; Wang, C. Enabling high-efficiency economic dispatch of hybrid AC/DC networked microgrids: Steady-state convex bi-directional converter models. Trans. Smart Grid 2024, 16, 45–61. [Google Scholar] [CrossRef]
- Yaqoob, S.J.; Motahhir, S.; Agyekum, E.B. A new model for a photovoltaic panel using Proteus software tool under arbitrary environmental conditions. J. Clean. Prod. 2022, 333, 130074. [Google Scholar] [CrossRef]
- Babu, V.V.; Roselyn, J.P.; Sundaravadivel, P. Multi-objective genetic algorithm based energy management system considering optimal utilization of grid and degradation of battery storage in microgrid. Electr. Eng. 2023, 9, 5992–6005. [Google Scholar] [CrossRef]
- Belboul, Z.; Toual, B.; Bensalem, A.; Ghenai, C.; Khan, B.; Kamel, S. Techno-economic optimization for isolated hybrid PV/wind/battery/diesel generator microgrid using improved salp swarm algorithm. Sci. Rep. 2024, 14, 2920. [Google Scholar] [CrossRef] [PubMed]
- Resen, A.K.; Mahmood, A.A. Data-Driven Selection of the Most Cost-Effective Turbine for Basrah Governorate Using Advanced Software Tools. Iraqi Geol. J. 2025, 58, 190–201. [Google Scholar] [CrossRef]
- Khouni, S.E.; Menacer, T. Nizar optimization algorithm: A novel metaheuristic algorithm for global optimization and engineering applications. J. Supercomput. 2024, 80, 3229–3281. [Google Scholar] [CrossRef]
- Suvitha, A.; Devi, S.R.; Arun, K.K.; Jayakumar, S.; Selvi, R.K.; Rajesha, N. Optimal Charging Control of No-Insulation HTS Magnets using Pontryagin’s Principle and Advanced Nizar Optimization Technique. In Proceedings of the 2025 5th International Conference on Trends in Material Science and Inventive Materials (ICTMIM), Kanyakumari, India, 7–9 April 2025; IEEE: Piscataway Township, NJ, USA, 2025; pp. 428–435. [Google Scholar] [CrossRef]


Disclaimer/Publisher’s Note: The statements, opinions and data contained in all publications are solely those of the individual author(s) and contributor(s) and not of MDPI and/or the editor(s). MDPI and/or the editor(s) disclaim responsibility for any injury to people or property resulting from any ideas, methods, instructions or products referred to in the content. |
© 2025 by the authors. Licensee MDPI, Basel, Switzerland. This article is an open access article distributed under the terms and conditions of the Creative Commons Attribution (CC BY) license (https://creativecommons.org/licenses/by/4.0/).