Abstract
The increasing decentralization of energy systems calls for robust frameworks to evaluate the technical and economic feasibility of hybrid renewable configurations at the community scale. This study presents an integrated methodology that combines Key Performance Indicators (KPIs), sensitivity analysis, and Multi-Criteria Decision-Making to assess hybrid systems in Castanheira de Pera, a small community in central Portugal. Fourteen configurations (C1–C14) integrating hydropower, solar PV, wind, and battery storage were simulated using HOMER Pro 3.16.2, PVsyst 8.0.16, Python 3.14.0, and Excel under both wet and dry hydrological conditions. A gate-controlled hydro-buffering model was applied to optimize short-term storage operation, increasing summer energy generation by 52–88% without additional infrastructure. Among all configurations, C8 achieved the highest Net Present Value (≈EUR 153,700) and a strong Internal Rate of Return (IRR), while maintaining a stable Levelized Cost of Electricity (LCOE) of around 0.042 EUR/kWh. Comparative decision scenarios highlight distinct stakeholder priorities: storage-intensive systems (C14, C11) maximize energy security, whereas medium-scale hybrids (C8, C7) offer superior economic performance. Overall, the results confirm that hybridization significantly improves community energy autonomy and resilience. Future work should extend this framework to include environmental and social indicators, enabling a more comprehensive techno-socio-economic assessment of hybrid renewable systems.
1. Introduction
1.1. Background Review
Throughout history, engineers have continually sought to improve the efficiency and affordability of solutions to meet fundamental human needs. Among these, energy, whether as electricity or heat, remains essential for economic growth and modern development. However, accelerating climate change and global transformations now compel us to reconsider how energy is produced.
A very recent publication by the IEA (International Energy Agency) mentioned that in 2024 global energy demand rose by 2.2%, outpacing the average growth rate of the past decade. All fuel types and technologies saw increased demand, with the power sector leading the surge due to a 4.3% rise in electricity consumption, which was significantly higher than the 3.2% global GDP growth. This spike was driven by record-breaking temperatures, ongoing electrification, and growing digitalization. Renewables contributed the most to the increase in global energy supply [1], accounting for 38% of the growth, followed by natural gas (28%), coal (15%), oil (11%), and nuclear energy (8%) (Figure 1).
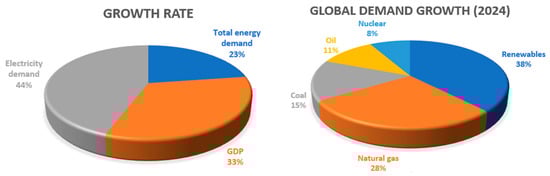
Figure 1.
Key global growth rates and the share of energy demand growth by source, 2024.
It is crucial to recognize how renewable energy (RE) has reshaped the national priorities of energy security and affordability—areas that remained relatively inflexible for decades when oil and gas were considered the most reliable energy sources. Today, RE plays a pivotal role in strengthening energy security and is increasingly vital in sectors such as industry, food production, healthcare, and other essential services. By reducing dependence on fossil fuels, RE helps shield nations from risks like natural disasters, fuel price volatility, and geopolitical tension [2]. Similarly, numerous studies suggest that renewable energy, when utilized efficiently, has the potential to deliver significantly more affordable energy than traditionally anticipated. By leveraging technological advancements and economies of scale, RE can reduce long-term energy costs and enhance economic resilience [3].
The term “efficiently” remains a subject of ongoing research when discussing the effective use of renewable energy. One key example is the decentralization of energy, particularly electricity generation, where power is produced at or near the point of consumption. This approach reduces electricity costs, minimizes transmission and distribution losses, and enhances grid stability [4]. However, when it comes to such arrangements, the key objectives are energy resilience and cheaper power. A recent electricity blackout occurred on 28 April 2025, affecting the Iberian Peninsula and nearby countries for several hours. This incident highlights the vulnerability of highly centralized power grids, where even a small fault can lead to widespread disruptions across entire regions. To reduce this risk, empowering local communities to produce their own electricity can enhance grid resilience. Local generation makes communities more self-sufficient and ensures they have access to power even during large-scale blackouts [5].
Local energy generation becomes more feasible and efficient when multiple renewable energy sources are combined—such as photovoltaic (PV) solar panels, wind turbines, small-scale hydropower, and biogas plants—especially in regions where natural resources are abundantly available. This strategic integration of diverse technologies is known as hybrid renewable energy systems (HRESs) or energy hybridization, enabling a more stable, reliable, and sustainable power supply by complementing the strengths of each source [6].
Hybridization of energy systems in rural areas can serve as a transformative approach, simultaneously supporting the expansion of renewable energy and ensuring a reliable electricity supply. Growing awareness of the disproportionate impacts of climate change on rural regions has motivated researchers, engineers, and energy planners to engage more actively in developing sustainable energy solutions tailored to isolated communities. Within this context, hybrid renewable energy systems (HRESs) have emerged in the literature as a promising framework, offering diverse configurations of distributed energy supply technologies designed to deliver both environmental and operational benefits [7].
Regarding KPI methodologies and applications, ref. [8,9] presents a comprehensive methodology for analyzing energy KPIs using smart grid data. It emphasizes the importance of KPI selection and normalization for performance benchmarking in energy systems. Ref. [10] reviews environmental and energy KPIs for renewable systems integrated with storage. It categorizes indicators into technical, environmental, and economic dimensions, highlighting their role in lifecycle assessments. Ref. [11] focuses on KPIs for energy storage in buildings, including efficiency, reliability, and environmental impact. It proposes a framework for evaluating storage technologies in urban sustainability contexts. Ref. [12] explores demand response strategies in energy communities, integrating PV generation from public buildings. KPIs include self-consumption, grid interaction, and flexibility metrics. Ref. [13] develops a KPI modeling framework for microgrid design and operation, which includes reliability, cost-effectiveness, and environmental performance, with simulation-based validation. And ref. [14] proposes a KPI definition methodology for smart grids in island systems. It integrates technical, economic, and social indicators, tailored for isolated community energy planning.
Different studies about sustainability and self-sufficiency were presented by ref. [15] to assess Ukraine’s food production and self-sufficiency against EU benchmarks. Though focused on agriculture, it introduces the SSR (Self-Sufficiency Ratio) as a transferable KPI for energy autonomy. Ref. [16] applies multi-objective optimization for 100% renewable microgrids, incorporating demand-side flexibility costs. Sensitivity analysis evaluates trade-offs between reliability, cost, and emissions, which ref. [17] used to develop models for Germany’s full transition to 100% renewable energy by 2050. It uses system-level KPIs like LCOE, emissions, and energy balance, with scenario-based sensitivity testing. Ref. [18] presents a review of renewable energy policies and electrification strategies for Ghana, highlighting the policy-driven KPIs such as access rate, affordability, and grid integration. And ref. [19] optimizes hybrid PV/wind/storage systems under demand response, using techno-economic KPIs including NPV, IRR, and LPSP, with sensitivity analysis on load profiles and cost parameters.
On the other hand, ref. [20] develops decision support research about Multi-Criteria Decision-Making (MCDM) trends in renewable energy planning. It identifies gaps in stakeholder participation and proposes participatory decision-making models using AHP and PROMETHEE. Ref. [21] evaluates policy options for increasing RES-E penetration in Greece, using MCDM to compare scenarios based on cost, emissions, and social acceptance. Ref. [22] develops a sustainability and resilience indicator framework for local energy technologies, integrating MCDM with KPIs across environmental, economic, and social dimensions. Ref. [23] applies MCDM to wave power plant site selection in Vietnam, using criteria like wave energy potential, environmental impact, and proximity to grid infrastructure. Ref. [24] develops a seminal review on MCDM in sustainable energy planning, covering AHP, ELECTRE, and fuzzy logic methods, emphasizing their role in balancing conflicting KPIs. Finally, ref. [25] presents reviews on decision-making in renewable energy investments, highlighting the integration of MCDM with financial KPIs (NPV, IRR) and environmental metrics for robust project evaluation.
Henceforth, the primary objective of this research is to develop a Multi-Criteria Decision-Making [26] model for hybrid renewable energy in small communities, defining specific Key Performance Indicators and evolving a detailed sensitivity analysis. This research allows us to evaluate the technical and economic feasibility of hybrid renewables in small communities through a comprehensive methodology, using different simulations and types of analysis. The selected site of application was chosen to ensure practicality and to ground the assessment in real-world data and operating conditions. Hereafter, this research work is structured as follows: Section 1, as previously presented, includes a recent literature review on the subject of hybrid energy solutions and KPIs related with energy communities. Section 2 presents the methodology and materials necessary for this research through an innovative flowchart definition, site characterization, data collection, hydropower buffering main support, characterization of different hybrid system configurations, selection of suitable KPIs, and economic modeling. Section 3 enhances the evaluation of results from several areas, including base-technical hydropower, PV operational optimization, wind and energy storage integration, strategic use of the hydropower buffer, Multi-Criteria Decision-Making, and key parameters under different operational conditions. In Section 4 is the discussion of results and, lastly, in Section 4 the main conclusions are drawn.
1.2. Technical and Scientific Contribution
Despite the extensive literature on hybrid renewable energy systems, few studies provide an integrated framework that simultaneously assesses technical performance, economic feasibility, and decision robustness under hydrological variability. Previous works often treat Key Performance Indicators (KPIs), sensitivity analysis, and Multi-Criteria Decision-Making (MCDM) as separate evaluations, limiting their capacity to support holistic system design. This study addresses these gaps by developing a unified methodological framework that combines techno-economic KPIs, sensitivity analysis, and the Analytical Hierarchy Process (AHP) for a comprehensive system assessment. A novel gate-controlled hydro-buffering model is proposed to enhance the performance of small-scale hydropower, improving summer generation by up to 88% without additional infrastructure. Fourteen hybrid configurations (C1–C14) integrating hydro, solar PV, wind, and storage are systematically compared using advanced simulation tools (HOMER Pro, PVsyst, Python, and Excel). Furthermore, dual operational scenarios—Community-Only and Community + Industry—are introduced to analyze the stabilizing effect of industrial demand on system profitability. Together, these contributions provide new scientific insight and a transferable method for optimizing decentralized hybrid energy systems.
2. Methodology
2.1. Brief Introduction and Definition
The methodological framework adopted in this study follows a structured sequence designed to evaluate both the technical and economic dimensions of hybrid renewable energy systems. It begins with data collection and site characterization, incorporating hydrological, solar, and wind resources together with community and industrial demand profiles. The next stage focuses on system design and simulation, where multiple hybrid configurations (C1–C14) combining hydro, solar PV, wind, and storage are modeled using HOMER Pro and PVsyst, with data processing and performance analysis conducted in Python and Excel. A dedicated hydro-buffering analysis quantifies the effect of short-term reservoir operation on seasonal energy availability, while the hybrid configurations are evaluated through a techno-economic assessment based on Key Performance Indicators (KPIs) that measure reliability, efficiency, and financial viability. Finally, a sensitivity analysis tests the robustness of the results under variable conditions, and Multi-Criteria Decision-Makin ranks the configurations according to stakeholder priorities. This integrated and traceable methodology, summarized in Figure 2, ensures coherence between technical modeling, economic evaluation, and decision analysis.
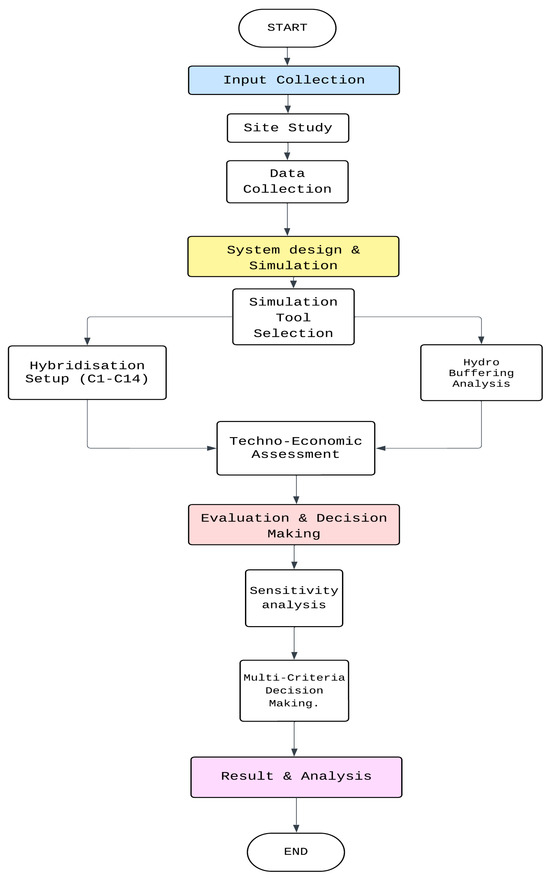
Figure 2.
Methodology flow diagram.
2.2. Case Study
The study site is located at the Castanheira de Pera weir, situated on the Ribeira de Pera in the central zone of Portugal. The reinforced concrete structure, constructed in 2005, spans approximately 35.4 m and creates a gross head of about 3.6 m between upstream and downstream water levels. The weir remains in good structural condition and is equipped with two flap gates for flood discharge and a sliding wall gate for ecological flow regulation. Upstream, the impoundment forms a small reservoir with an estimated surface area of 6160 m2, which provides some active storage capacity. This existing hydraulic infrastructure offers the potential for adaptation into a micro-hydropower facility and for integration into a broader hybrid renewable energy system.
Figure 3 represents the view of Castanheira de Pera weir and the downstream view of the flap gate. The upstream impoundment forms a small reservoir, complemented by an additional water storage area, represented in Figure 4, that can be exploited for hydro-buffering. The existing river beach, situated within the weir structure, highlights the multi-functional use of the site. The proposed hydropower turbine location is indicated downstream over the weir, where the controlled outflow from the reservoir can be harnessed for electricity generation.
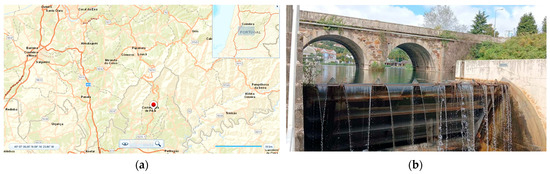
Figure 3.
Castanheira de Pera: (a) Homer Pro map; (b) downstream flap gate.
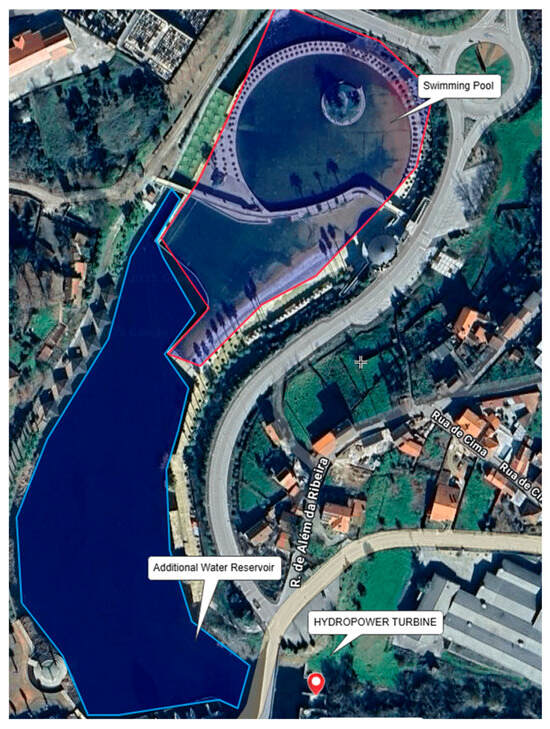
Figure 4.
Satellite view of reservoirs from Google Maps.
2.3. Data Collection
The data collection process included hydrological, solar, and wind resources relevant to the Castanheira de Pera site. Hydrological data were obtained from historical data from the site, with a representative wet year as the baseline condition, complemented by a dry year scenario to assess variability. Seasonal profiles were also extracted, with particular focus on the summer period (June–September) when inflows decline sharply. Figure 5a illustrates the monthly discharge pattern for a typical wet year as simulated in HOMER Pro, which was used to characterize baseline hydropower availability.
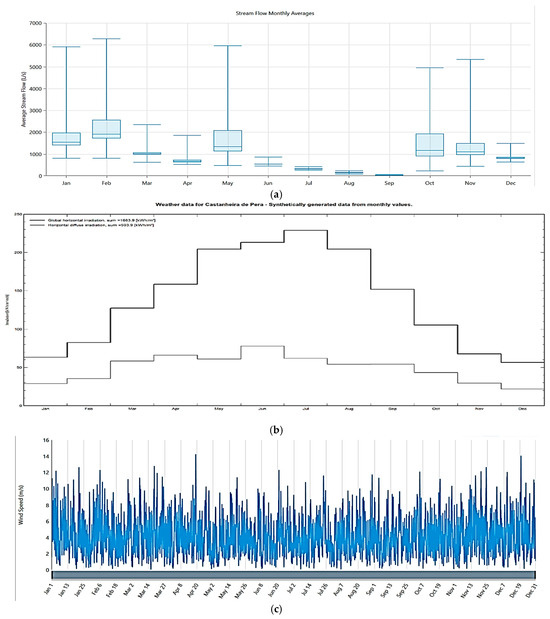
Figure 5.
RES data: (a) Monthly average discharge; (b) Monthly irradiance (kWh/m2/month) from PVsyst; (c) Annual wind speed profile from HOMER Pro.
Solar irradiation data were obtained from the NASA POWER database also integrated into HOMER Pro, with an annual average of approximately 5.1 kWh/m2/day and distinct seasonal peaks in July and troughs in December (Figure 5b). Wind speed data, also sourced from NASA POWER, indicated an annual mean of ~6 m/s at 50 m hub height, with marked seasonal variation across the year (Figure 5c). These datasets provided the foundation for simulating hydropower, photovoltaic, and wind energy contributions within HOMER Pro, and were further used to test hybrid system performance under both typical and extreme hydrological conditions.
The community’s electricity demand was modeled on an hourly basis (8760 values) for 2026, totaling 48.2 MWh annually, as presented in Figure 6. To capture long-term dynamics, demand growth was projected at 0.5% per year, reflecting the compound annual growth rate of Portuguese households [8]. In parallel, an industrial facility in Castanheira de Pera [9] was incorporated into the system model, with an estimated annual consumption of 213 MWh. Its load profile, generated in Python, follows a weekday schedule of 80 kW during working hours (09:00–17:00), reduced to 30 kW at lunch (11:00–12:00), and 8 kW idle load during nights, weekends, and holidays. Variations in future industrial demand are addressed through proportional scaling in the sensitivity analysis.
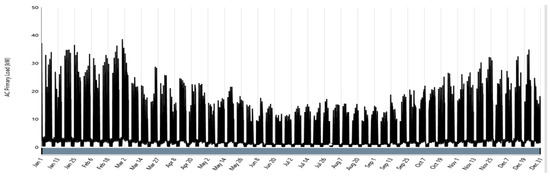
Figure 6.
Annual electricity demand from community data.
2.4. Hydro-Buffering Analysis
To complement the techno-economic evaluation, a dedicated and separate hydro-buffering analysis was undertaken to examine the potential of short-term water storage in improving the system reliability. The primary goal was to identify operational strategies that could increase electricity generation during the summer months, when inflows are critically low and hydropower alone cannot fit the demand. By assessing gate-controlled releases and reservoir management, the analysis provides insight into how modest operational adjustments can enhance seasonal energy availability without major infrastructure expansion.
This study explores the use of the small active storage capacity induced by the existing weir, which allows for a 30 cm water depth across an estimated surface area of 1800 m2 (Figure 7), resulting in an additional buffer volume of 5400 m3. This volume is analyzed as short-term water storage to support turbine operation during periods of insufficient inflow, particularly during the dry summer months of June through September when the average inflow drops to approximately 0.0722 m3/s (Figure 7).
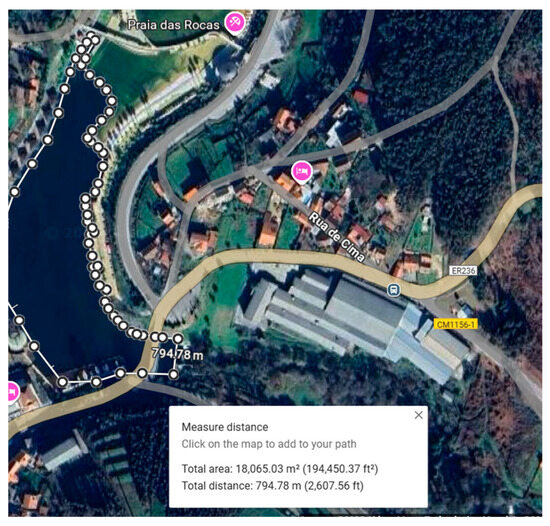
Figure 7.
Highlighted area for the reservoir from Google Maps.
To simulate and understand the hydro-buffering analysis, let us say that volume in the reservoir (m3) at time t is V(t), area of the reservoir is A (m2) and h(t) is the water depth (m) at time t. This volume is equivalent to Equation (1):
with
- Qin(t): Inflow at time t [m3/s],
- Qout(t): Outflow at time t [m3/s],
- Δt: Time step [s].
Through the continuity equation,
that also depends on the gate opening width, which restricts or allows water flow, influencing the effective discharge reaching the turbine.
where
- G(t) Є {0,1}: gate state (0 = closed, 1 = open),
- Vmin: minimum volume needed to open the gate (e.g., for 0.3 m: Vmin = 5400 m3).
Hence, Qout(t) = G(t). Qrated, where Qrated represents the design turbine flow rate, varied between a defined minimum and maximum rated capacity to simulate a partial and full-load turbine. The Qout is exported to HOMER Pro to perform final analysis of the KPI matrix.
2.5. Hybrid System Configuration
To evaluate the performance of different technology mixes, a series of hybrid energy system configurations were developed and simulated in HOMER Pro (Figure 8). Each configuration combines hydropower with varying capacities of photovoltaic (PV), wind, and battery storage, reflecting both realistic deployment options and stress-test scenarios for system robustness. In total, fourteen distinct configurations (C1–C14) were considered. Table 1 shows the hybrid configurations setup, ranging from a hydro-only baseline (C1) to a full system capacity option integrating hydro, PV, wind, and battery storage (C14). Intermediate cases include PV-optimized setups, wind-dominated scenarios, and configurations with different levels of battery integration. The hydro capacity was fixed at 24.7 kW across all cases, while PV capacity ranged between 15 and 25 kWp, wind turbine contributions varied between 5 and 20 kW, and battery storage was scaled from 10 to 20 kWh.
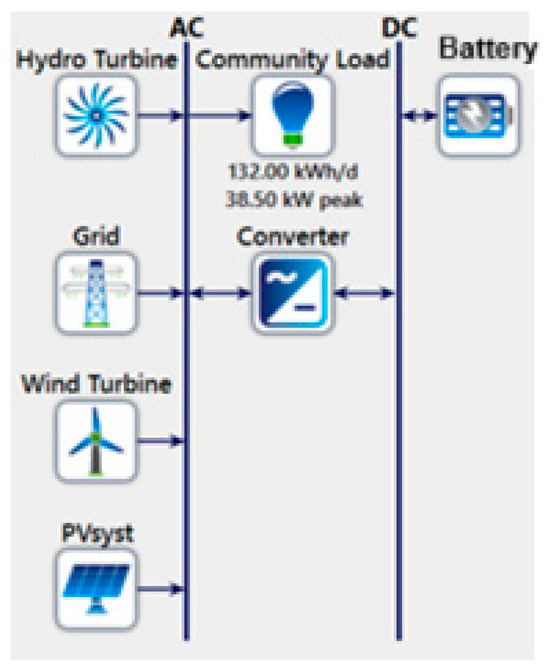
Figure 8.
Hybrid schematic configuration from HOMER Pro.

Table 1.
Hybrid configurations setup.
2.6. Tools Selection
A combination of specialized software tools was employed to carry out the modeling, simulation, and evaluation of the proposed energy system. HOMER Pro served as the core platform for hybrid system simulation and optimization, enabling the assessment of technical feasibility and economic performance across multiple configurations. PVsyst was applied for detailed photovoltaic modeling, including solar resource characterization and PV array performance estimation under site-specific conditions. Python and Microsoft Excel supported extended techno-economic calculations, data processing, sensitivity analysis, and the preparation of comparative performance indicators. Finally, Expert Choice was used to implement the Analytical Hierarchy Process (AHP) for Multi-Criteria Decision-Making, ensuring that technical, economic, and sustainability criteria could be systematically weighted and applied. The selection of these tools was based on their proven capability to handle renewable energy system design, data resolution requirements, and compatibility with the site-specific conditions of the Castanheira de Pera case study.
2.7. Key Performance Indicators (KPIs)
The selection of Key Performance Indicators (KPIs) in this study was guided by three main principles (Table 2): (1) ensuring that both technical reliability and economic feasibility of the hybrid energy system are adequately represented; (2) aligning with established indicators widely applied in previous studies on hybrid renewable systems and energy communities; and (3) maintaining quantitative consistency and comparability across all simulated configurations. Accordingly, the selected KPIs of Self-Sufficiency Ratio (SS%), Loss of Power Supply Probability (LPSP), curtailment, Net Present Value (NPV), Internal Rate of Return (IRR), and Levelized Cost of Electricity (LCOE) jointly provide a balanced basis for evaluating the performance, reliability, and cost-effectiveness of the proposed systems.
Table 2.
KPI descriptions.
2.8. Simulation Setup and Economic Modeling
Building on the system configuration, the hybrid energy model was simulated using a stepwise workflow that integrated PVsyst, HOMER Pro, Python, and Microsoft Excel. PV arrays were first designed in PVsyst based on site-specific irradiance data and imported into HOMER Pro, where the hybrid system was simulated under both dry and wet hydrological conditions with hourly resolution (8760 h/year) over a 25-year project horizon. HOMER Pro optimized inverter and battery sizing, while Python and Excel were used for post-simulation analysis, including the calculation of Key Performance Indicators (KPIs), sensitivity testing, draw system outcomes, and visualization of comparative results.
All resource datasets (solar, wind, and hydrological inflows) were pre-processed and standardized to an hourly temporal resolution (8760 data points per year) before integration. The PV generation outputs from PVsyst were imported into HOMER Pro using identical timestamps and time zones as the hydrological and wind series. Likewise, HOMER Pro’s hourly output files were exported and analyzed in Python and Excel using the same time index, ensuring complete temporal alignment and avoiding any interpolation or aggregation mismatches between tools.
The economic modeling followed a hierarchical energy distribution strategy: electricity was first used to meet community demand, then supplied to the industrial facility, and finally, any surplus was exported to the public grid. This approach ensured that community self-sufficiency was prioritized while also enhancing revenue opportunities. Tariff differentiation between residential and industrial consumers was incorporated, and sensitivity analyses were conducted on electricity prices, demand growth, and capital expenditure to evaluate their impact on Net Present Value (NPV), Internal Rate of Return (IRR), Levelized Cost of Electricity (LCOE), and Return on Investment (ROI).
Two operational scenarios (Figure 9)—Community-Only and Community + Industry—were simulated under both wet and dry hydrological conditions. This dual-scenario approach enables a clearer understanding of how economic performance indicators vary with different levels of electricity demand. By comparing outcomes with and without the industrial load, the analysis highlights how the presence of an industry not only increases total energy consumption but also alters profitability, payback dynamics, and system utilization, offering valuable insight into the role of demand structure in shaping project feasibility. To clarify the evaluation scope, technical KPIs such as self-sufficiency and reliability were only assessed for the Community-Only model, while economic KPIs were analyzed for both models under all rainfall conditions. Specifically, in wet years, both technical and economic indicators were evaluated for the Community-Only model, whereas only economic indicators were analyzed for the Community + Industry model. In dry years, technical evaluation was limited to the Community-Only model, while economic assessment was carried out for the Community + Industry model also explained in Table 3.
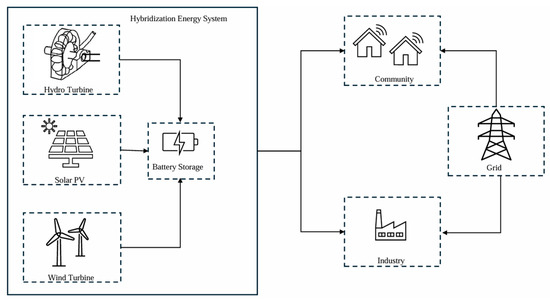
Figure 9.
Simple configuration of hybrid setup for a community of energy.
Table 3.
Summary of evaluation coverage for different operational scenarios.
3. Results and Analysis
3.1. Hydropower Generation
Annual Hydropower generation is illustrated by the monthly energy production under two different hydrological conditions—dry year and wet year. In a wet year, the total annual energy production reaches approximately 111 MWh, while in a dry year, it drops significantly to around 48 MWh (Figure 10a). The variability is clearly reflected in the monthly distribution. Notably, from June to September, there is almost zero power output from the hydropower system in both scenarios. These summer months represent a critical vulnerability period where hydropower alone cannot meet community energy demands. Therefore, this underscores the necessity of designing a robust hybrid energy system capable of compensating for hydropower shortfalls, particularly during low-flow months, by integrating alternative renewable sources like solar or wind to ensure reliability and supply continuity. Figure 10b,c depict the daily hydropower output from January to December.
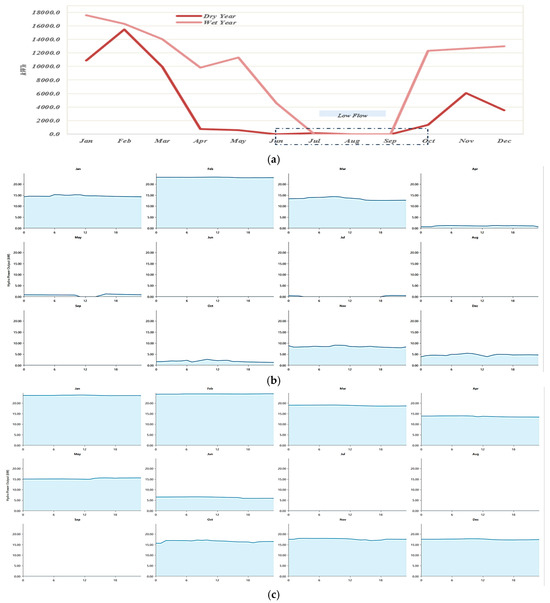
Figure 10.
Hydropower from HOMER Pro: (a) Energy production (kWh) monthly (in dot box the critical months); (b) Daily profile (dry year); (c) Daily profile (wet year).
3.2. PV Optimization
As shown in Figure 10a, the summer months (June–September) present critical limitations for hydropower generation due to near-zero water flow. This necessitates the integration of solar PV to compensate for the unmet load. To quantify the PV capacity requirement, the unmet electricity demand is calculated as .
The unmet load data for a wet year scenario was exported to PVsyst for simulation. Various PV capacities—10.5, 15, 18, 20.3, 22, 25, 30, 40.5, and 80.5 kWp—were evaluated for performance during the summer months (June, July, August). As the installed PV capacity increases, the Self-Sufficiency Ratio (SS%) also improves. However, this improvement is nonlinear—for instance, increasing capacity from 40.5 kWp to 80.5 kWp yields only a 2% gain in SS% (from 89% to 91%), indicating diminishing returns. The energy surplus also rises significantly at higher capacities, which may lead to overproduction and curtailment if storage or export mechanisms are not in place. This surplus becomes a crucial factor in optimizing PV sizing—balancing between energy autonomy and system efficiency. The configuration was also tested for annual energy curtailment, PV energy consumption, and overall Self-Sufficiency Ratio (SS%). Based on the results, the capacities of 22 kWp and 25 kWp offer an optimal trade-off, with low curtailment rate, high PV utilization, and up to 80% SS% during summer months. These values make them suitable candidates for further sensitivity analysis and financial optimization in hybrid energy system designs. Grid import refers to the electricity that the community must draw from the public grid when the available renewable energy (hydropower and solar PV) is insufficient to meet its demand. As illustrated in Figure 11d, the integration of photovoltaic (PV) capacity alongside hydropower leads to a substantial decrease in grid import, especially during the critical low-flow summer months (June to September) when hydropower alone is insufficient to meet community demand. The configuration combining hydropower with 25 kWp PV achieves the highest performance, reaching an annual Self-Sufficiency Ratio of 91.2%. In comparison, the setup with 22 kWp PV reaches 90%, while 15 kWp PV results in 85.5%.
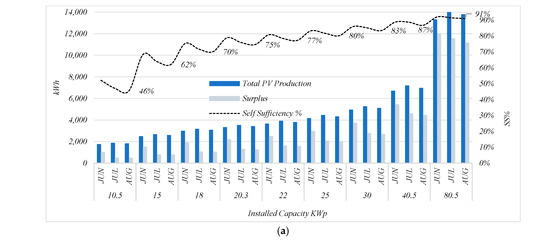
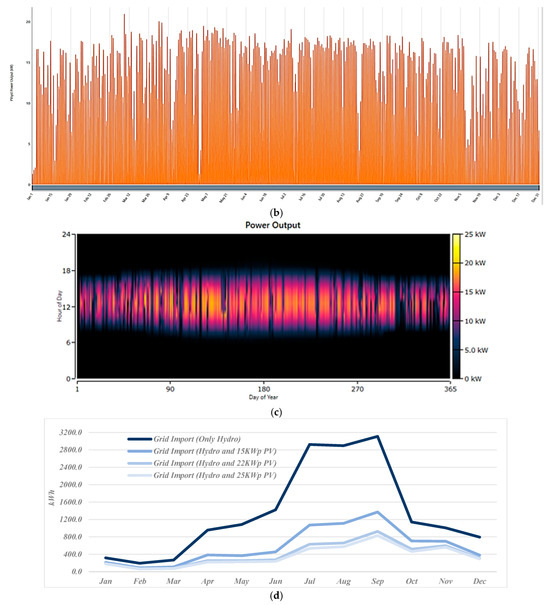
Figure 11.
PV contribution: (a) Impact of PV installed capacity on summer energy performance (JUN–AUG) exported from PVsyst; (b) Annual PV energy production (22 KWp) from Homer Pro; (c) Annual PV energy production 2D heat map (22 KWp) from Homer Pro; (d) Annual grid import exported from Homer Pro.
Figure 11 clearly demonstrates the role of increasing PV capacity in reducing external energy dependence. Reducing grid import not only enhances the self-sufficiency of the hybrid system but also leads to improved economic outcomes (lower energy costs) and strengthens the resilience of the community by ensuring a more reliable and autonomous energy supply throughout the year. Figure 11a shows the impact of PV installed capacity on summer energy performance (JUN–AUG) while in Figure 11b is the annual PV energy production (22 KWp) from Homer Pro. Figure 11c presents the annual PV energy production 2D heat map (22 KWp) obtained from Homer Pro and in Figure 11d is the annual grid import that Homer Pro exported.
3.3. Wind and Energy Storage Integration
The integration of wind energy and battery storage improved system reliability, particularly during periods of limited hydro and solar generation. Simulation results for the full-capacity configuration (C14) achieved up to 97.8% annual Self-Sufficiency Ratio, reducing the Loss of Power Supply Probability (LPSP) to 14.6%. However, these gains required higher capital investment and were constrained by the site’s modest average wind speeds (~4 m/s). The role of storage is especially evident in dry years, where batteries compensated for low hydro output, leading to deeper cycling and increased throughout compared to wet years in Figure 12 and Figure 13. Short-term operation examples further illustrate this effect: in April, renewable sources were sufficient to meet demand with minimal battery use, while in June, storage played a critical balancing role by charging during peak solar hours and discharging in the evening (Figure 14).
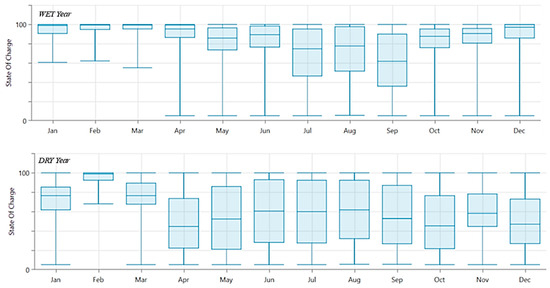
Figure 12.
State of charge box-and-whisker plot from Homer Pro.
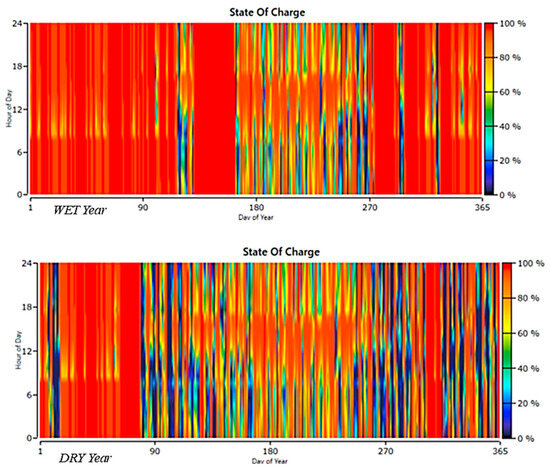
Figure 13.
State of charge (2D heat map) from Homer Pro.
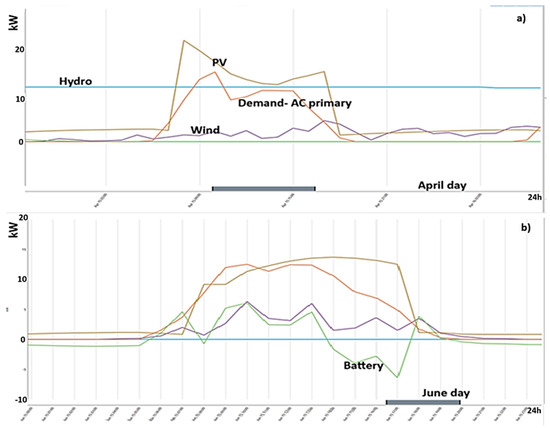
Figure 14.
C14 hybridization with battery: (a) 15 April; (b) 15 June.
3.4. Key Parameters Under Different Operational Conditions
A comparative analysis of configurations C1–C14 under wet and dry year scenarios shows clear trade-offs between technical reliability and system scaling. The addition of PV capacity (C2 onward) drastically improves self-sufficiency in dry years, with gains of up to 40% in points compared to hydro-only operation. In wet years, improvements plateaued beyond configuration C8, where further capacity additions yielded diminishing returns. Curtailment rose with increased generation capacity, particularly in Community-plus-Industry models, though the marginal increase flattened after C8 (Figure 15). Economic results highlight that while technical autonomy improved with larger systems, financial returns peaked at C8, where a balanced mix of solar and wind achieved high self-sufficiency with the highest Net Present Value (NPV) (~EUR 153,700), whereas later configurations showed declining profitability (Figure 15, Figure 16, Figure 17 and Figure 18).
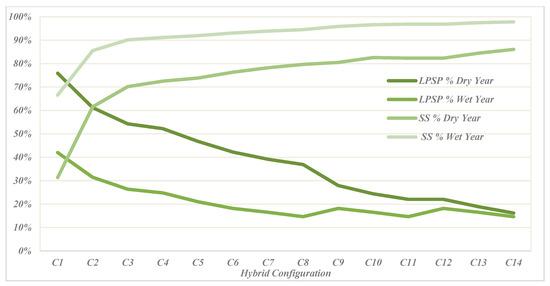
Figure 15.
LPSP% and SS% for hybrid configuration from self-compiled work.
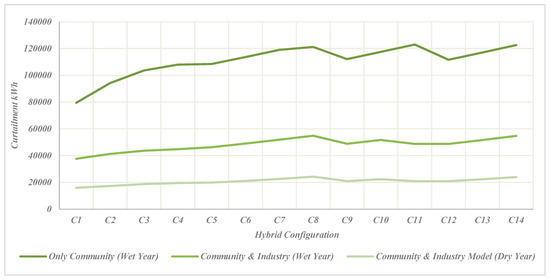
Figure 16.
Power curtailment for various hybrid configurations (kWh).
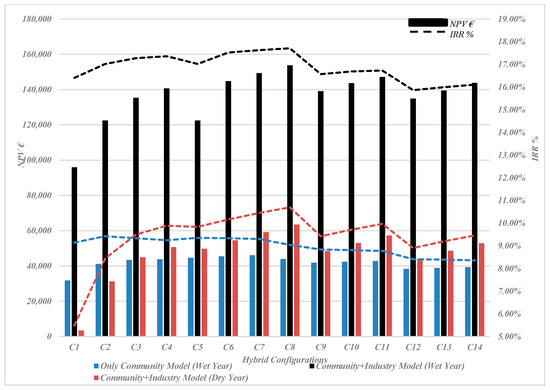
Figure 17.
NPV and IRR% for different models.
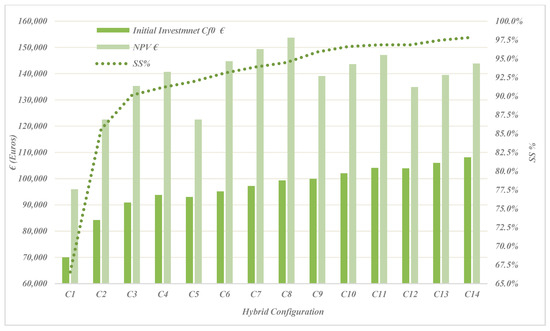
Figure 18.
Initial investment, NPV and SS% for hybrid configurations.
As shown in Figure 16, curtailment increases with the addition of renewable and storage capacities across hybrid configurations. This trend is particularly evident in the Community-Only (wet year) and Community-plus-Industry (wet year) scenarios, where higher installed capacities lead to surplus generation that cannot be fully utilized or stored. Notably, configuration C14, representing the full-capacity setup, exhibits the highest curtailment values across all models. However, starting from configuration C8, the marginal increase in curtailment begins to flatten and, in some cases, even reduces. This indicates that beyond a certain point, increasing system capacity leads to diminishing gains in self-sufficiency or demand coverage, while disproportionately increasing energy losses. This insight reinforces the economic pattern observed in C8 and suggests that further scaling of capacity may not yield proportional benefits in system efficiency.
3.5. Summary of Hybrid Configurations
The simulated power output profiles further illustrate the contribution of different technologies under varying hydrological conditions. In the dry year in Figure 19b, hydropower generation is minimal, and system demand is largely met through PV and wind, with batteries smoothing fluctuations. In contrast, the wet year profile in Figure 19a highlights the strong dominance of hydropower complemented by PV and wind, while storage remains underutilized due to frequent surplus generation. These results emphasize the role of hybridization in compensating for seasonal variability, ensuring demand coverage during resource-scarce periods while maintaining flexibility in resource-abundant conditions.
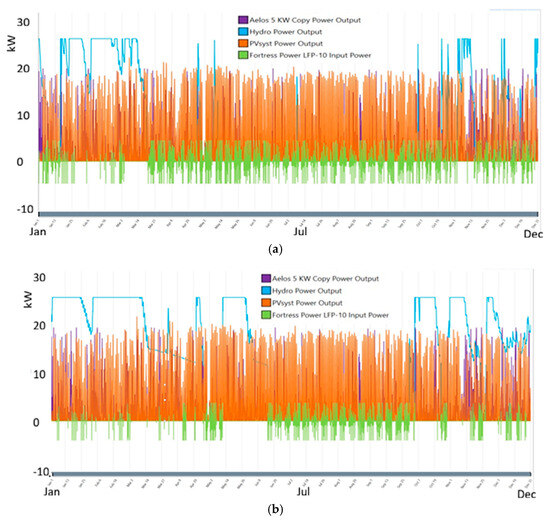
Figure 19.
Power output from hybridization: (a) dry year; (b) wet year.
The comparative assessment of configurations C1–C14 highlights the trade-offs between technical reliability, economic viability, and environmental performance. As shown in Table 4 and Table 5, hybridization substantially improves the Self-Sufficiency Ratio (SS%), with values increasing from 66.6% in the hydro-only baseline (C1) to a maximum of 97.9% in the full system capacity configuration (C14). Correspondingly, the Loss of Power Supply Probability (LPSP) decreases from over 42% in C1 to less than 15% in advanced configurations, demonstrating enhanced system reliability. Curtailment, however, rises with larger PV and wind capacities, exceeding 120 MWh in the high-capacity cases, although this trend stabilizes after C8.
Table 4.
Technical KPIs for hybrid configurations (C1–C14).
Table 5.
Economic KPIs—wet year (Community-Only vs. Community + Industry).
Economic analysis indicates that profitability peaks at configuration C8, which achieves the highest Net Present Value (NPV) while maintaining a strong balance between technical and financial performance. Cost of Electricity (LCOE) remains remarkably stable, ranging narrowly between 0.042 and 0.046 EUR/kWh, indicating that system cost-effectiveness is largely insensitive to variations in installed capacity. This stability suggests that decisions on system expansion should be guided primarily by trade-offs between maximizing self-sufficiency and curtailment management, rather than concerns over cost per unit of electricity. Overall, configuration C8 emerges as the optimal balance of technical, economic, and environmental performance, whereas C14 represents the most resilient but capital-intensive option.
3.6. Sensitivity Analysis
The analysis shows that the Net Present Value (NPV) is strongly influenced by the rate of annual demand growth, with distinct patterns for the two operational scenarios. In Scenario 1 (Community-Only), NPV increases significantly with rising demand, peaking at around 5% annual growth before gradually declining, indicating that beyond this threshold the hybrid system cannot fully keep pace with rising consumption. By contrast, Scenario 2 (Community + Industry) shows minimal sensitivity, with only slight positive gains in NPV even at higher growth rates. This difference highlights the stabilizing effect of industrial demand, where higher initial loads reduce marginal benefits from additional growth. Overall, the results underline the importance of accurate demand forecasting, as modest growth rates can substantially improve project profitability, especially in the Community-Only case, as demonstrated in Figure 20.
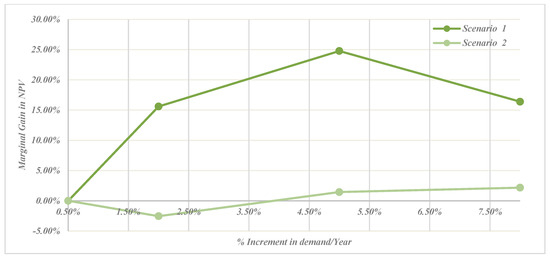
Figure 20.
Marginal gain in NPV with community electricity demand increment.
The results show a strong negative correlation between discount rate and Net Present Value (NPV), with markedly different sensitivities across the two operational models (Figure 21). In Scenario 1 (Community-Only), NPV is highly responsive, increasing by more than 100% at a low discount rate of 2% but dropping sharply into negative territory beyond 8%. By contrast, Scenario 2 (Community + Industry) demonstrates greater resilience, with NPV decreasing gradually and remaining closer to break-even, even at higher discount rates. This difference highlights that small-scale community projects are more vulnerable to financing conditions, whereas inclusion of industrial demand provides a stabilizing effect, reducing dependence on favorable loan or policy support (Figure 21).
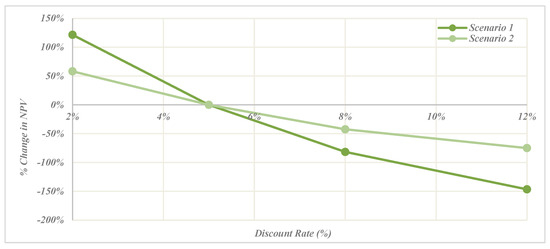
Figure 21.
% change in NPV with different discount rates.
NPV shows a nearly linear relationship with changes in average annual electricity tariffs, with both scenarios responding positively to tariff increases and negatively to reductions (Figure 22). In Scenario 1 (Community-Only), profitability is more sensitive, with a ±1% tariff variation leading to changes in NPV of roughly ±35%. Scenario 2 (Community + Industry) exhibits a more moderate response, with the same tariff swing translating into a smaller NPV variation of about ±15%. This difference reflects the stabilizing influence of industrial demand, which reduces dependence on tariff levels by providing a larger and more consistent revenue stream. Overall, the results emphasize the importance of tariff policy in shaping project viability, particularly for community-centered models.
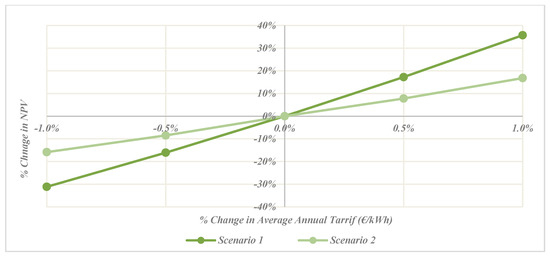
Figure 22.
% change in PV with variation in average annual tariff.
NPV decreases sharply with rising capital expenditure, particularly in Scenario 1 (Community-Only), where a 50% increase renders the project economically unviable (Figure 23). Scenario 2 (Community + Industry) shows greater resilience, maintaining positive NPV even at higher CAPEX levels due to the stabilizing effect of industrial demand. This highlights the importance of accurate cost estimation and load diversification for ensuring project feasibility (Figure 23).
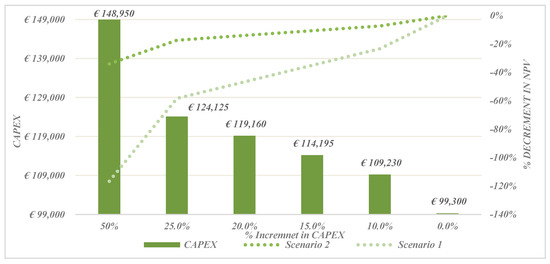
Figure 23.
NPV sensitivity analysis for CAPEX variation.
The analysis demonstrates that industrial demand has a decisive impact on project profitability. When industry load is removed (–100%), the NPV falls by more than 70%, aligning with the Community-Only scenario. Conversely, increasing industrial demand results in substantial marginal gains, with NPV improving by up to 48% at 200% load growth. Beyond this point, however, returns begin to level off, indicating diminishing benefits from additional industrial scaling. These results underline the importance of industry as a stabilizing off-taker, significantly enhancing financial resilience compared to Community-Only models (Figure 24).
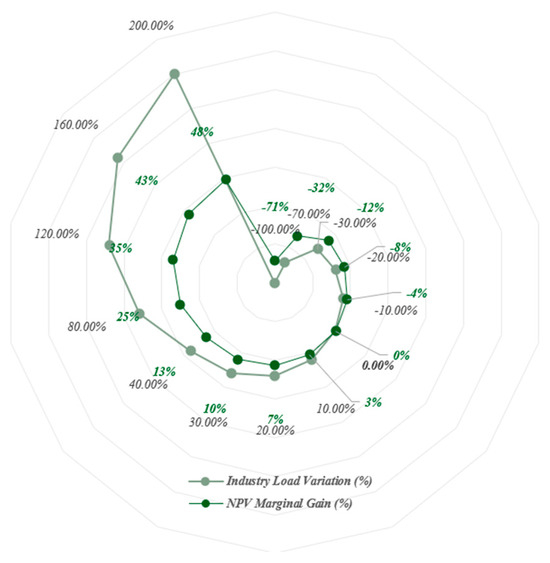
Figure 24.
NPV sensitivity for industry load variation.
Self-sufficiency is highly sensitive to long-term annual demand growth, with SS% declining steadily as consumption rises (Figure 25a). At moderate growth rates (2–5%/year), the system can maintain acceptable performance into mid-project life, but higher growth rate (8–11%/year) causes a sharp collapse, with SS% falling below 50% by 2040. By contrast, variation in the initial-year load has only a minor effect: even a 20% increase in baseline demand reduces SS% by less than 3% (Figure 25b). This shows that long-term growth rates rather than initial demand levels are the dominant factor influencing system resilience.
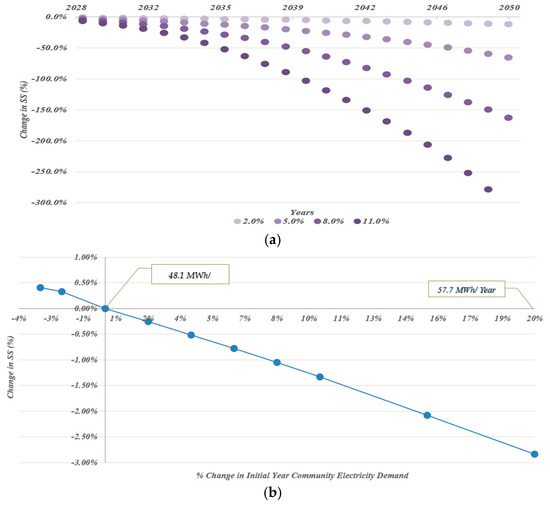
Figure 25.
SS (%) sensitivity: (a) with the % yearly community electricity increment; (b) for the initial year load level.
Table 6 shows the variation in Self-Sufficiency Ratio (SS%) under wet and dry hydrological conditions for the community, considering different battery storage capacities. It can be observed that the inclusion of a battery tends to enhance self-sufficiency, with a more significant improvement during dry years compared to wet years. This is due to the battery’s role in compensating for reduced hydropower availability. ΔSS (%) represents the marginal improvement in self-sufficiency compared to the baseline configuration (C8), which does not include battery storage.
Table 6.
Variation in SS (%) for different battery capacities.
To add, the sensitivity plots can also be interpreted quantitatively in terms of the relative response of project indicators to parameter changes. It can be seen that the electricity tariff has the highest influence on the Net Present Value (NPV), where a moderate variation in tariff results in a proportionally larger change in project profitability. The capital expenditure (CAPEX) shows a moderate but negative impact, while demand growth exerts a comparatively smaller influence. This interpretation confirms that NPV and related economic indicators are primarily driven by revenue-side factors rather than investment or demand uncertainties. The trends remain stable across both community and industry scenarios, reinforcing the robustness and internal consistency of the sensitivity analysis.
3.7. Hydro-Buffer Analysis
The hydro-buffering analysis assessed the use of the Castanheira de Pera reservoir’s active storage (~5400 m3) to enhance summer energy generation through controlled gate operation. As shown in Figure 26a, a 2 h gate opening window was found to be optimal, yielding around 6.9 MWh of electricity during the summer months. Figure 26a shows the time span for the gate to open in hours, and Figure 26b demonstrates that maximum output occurs at discharge rates between 0.7 and 0.9 m3/s, balancing peak generation with reservoir stability.
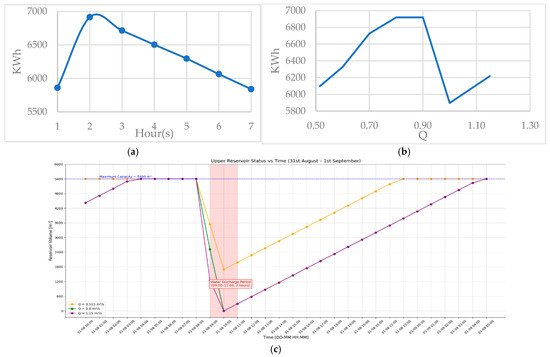
Figure 26.
Hydro-buffer: (a) time span for gate to open in hours; (b) energy production with Q; (c) upper reservoir availability.
Additionally, to verify the robustness of the hydro-buffering formulation, a simple sensitivity check was performed by varying the reservoir area (A) by ±20%. The results show a physically consistent response: in June, increasing A from 80% to 120% produced a significant rise in buffered energy from approximately 534 kWh to 4678 kWh, confirming the strong dependence of summer generation on available storage volume; in July and August, the change was moderate (about 6–7% increase in energy output); while in September, the effect became negligible due to minimal inflows. These variations follow expected hydrological behavior, showing that greater storage capacity enhances early-summer output but yields diminishing returns when inflows decline. The model thus demonstrates stable, realistic, and physically coherent behavior under parameter variation, reinforcing the robustness of equations used in buffer analysis and the reliability of the hydro-buffering representation.
Further improvements were observed when shifting from a single-slot to a two-slot daily operation (Figure 27a), where summer generation increased by approximately 25%, reaching 8.5 MWh. The comparative summary (Figure 27b) highlights that relative to the Business-as-Usual (BAU) case, a one-slot strategy improves summer generation by 51.8%, while a two-slot strategy achieves an 87.7% gain. These results demonstrate that gate-controlled buffering significantly enhances electricity availability during low-inflow summer months, improving seasonal self-sufficiency despite modest impacts on annual totals.
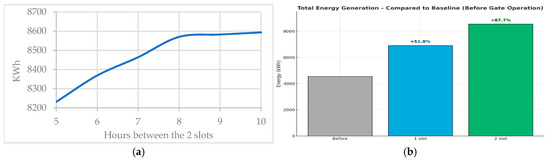
Figure 27.
(a) Energy generation for different time intervals between the slots; (b) Total energy generation during summer months vs. BAU.
3.8. Multi-Criteria Decision-Making
The Multi-Criteria Decision Comparison (MCDC) was performed using the Analytical Hierarchy Process (AHP) to evaluate configurations C1–C14 under three distinct stakeholder priorities: Power Security, Long-Term Profit, and Balanced Approach. Five Key Performance Indicators (KPIs) were used as decision criteria: Self-Sufficiency Ratio (SS%), Loss of Load Probability (LOLP%), Net Present Value (NPV), Internal Rate of Return (IRR), and Payback Period. Pairwise comparisons were carried out in Expert Choice, yielding consistency ratios (CR) below 0.1 for all scenarios, confirming coherent judgments. In the Power Security scenario (Figure 28a), reliability-oriented KPIs (SS% and LOLP%) collectively received 90% of the total weight, prioritizing configurations with strong technical resilience. As a result, C14 ranked highest, followed by C11, both characterized by large battery capacities ensuring continuous supply during low-resource periods. In the Long-Term Profit scenario, economic KPIs (NPV, IRR, and Payback) dominated with nearly 90% of the weighting, shifting preference towards configurations that deliver high financial returns at reasonable investment costs. Under this objective, C8 emerged as the top-performing configuration, with C7 closely following, reflecting their balanced economic efficiency. Finally, the Balanced Approach assigned a more even weighting between technical and economic KPIs, resulting in C8, C7, and C6 achieving the highest composite scores. These findings demonstrate how stakeholder priorities distinctly influence the ranking: storage-intensive systems (C14, C11) maximize energy security, while medium-scale hybrids (C8, C7) optimize economic performance. The balanced scenario underscores that no single configuration dominates across all objectives, but rather that optimal design depends on trade-offs between autonomy, reliability, and cost-effectiveness.
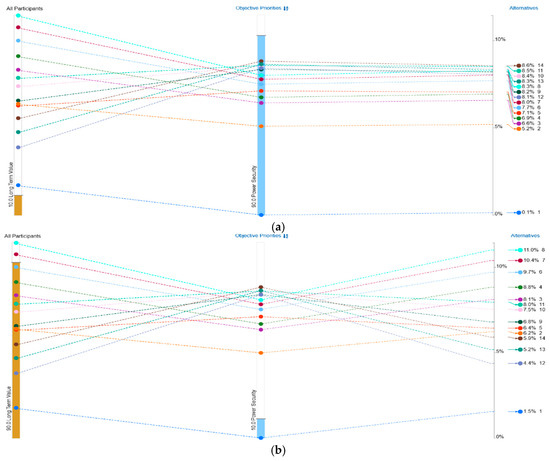
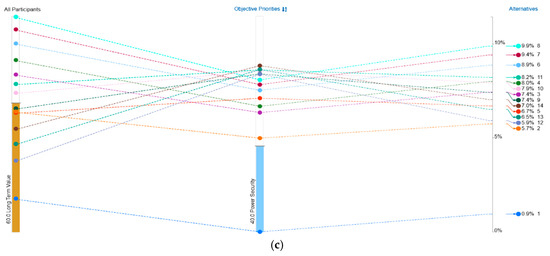
Figure 28.
Multi-Criteria Decision Comparison (MCDC) by Analytical Hierarchy Process (AHP) for all the configurations (C1-C14): (a) Power Security config ranking; (b) Long-Term Profit config ranking; (c) Balanced Approach config ranking.
To summarize, hybridizing hydropower with solar PV, wind, and storage greatly improves decentralized energy systems in areas with seasonal water variability. Hydropower alone (C1) fails to meet the summer demand, but adding PV and wind boosts self-sufficiency by 30–40%. Solar PV is the most effective complement, while wind and batteries enhance resilience during dry periods, despite higher costs. This approach strengthens both technical reliability and economic viability. From an economic perspective, configuration C8 emerges as the optimal balance, yielding the highest NPV (~EUR 153,700) and IRR while maintaining high technical performance. Larger systems such as C14 further improve reliability (SS% > 97%) but add limited financial return and increase curtailment, illustrating the principle of diminishing returns. The stability of the Levelized Cost of Electricity (LCOE), which remained in the narrow range of 0.042–0.046 EUR/kWh across all configurations, is particularly noteworthy. This low sensitivity suggests that economic decisions should focus more on trade-offs between reliability and curtailment rather than the unit cost of electricity. The hydro-buffering analysis further highlights the value of small-scale, low-cost interventions. While annual energy gains are modest, controlled gate operation increased summer generation by 52–88% compared to Business-as-Usual, strengthening supply security during the most critical demand periods. This illustrates that system reliability can be enhanced not only through new infrastructure but also through operational flexibility of existing assets. The sensitivity analysis underscores the vulnerability of Community-Only models to demand growth, discount rates, and tariffs. By contrast, including an industrial off-taker stabilizes the system, making profitability less dependent on financing conditions and external tariff variations. This finding is especially relevant for rural communities seeking to attract productive loads to support long-term energy system sustainability. The Multi-Criteria Decision Comparison (MCDC) reinforces these insights: C14 is preferred when prioritizing autonomy and security, while C8 and C7 dominate under profit and balanced objectives. This confirms that system design cannot be evaluated on technical grounds alone but must align with stakeholder priorities.
4. Conclusions
This study developed an integrated techno-economic and decision-making framework for assessing hybrid renewable energy systems in small communities, with Castanheira de Pera, Portugal, as the case study. Fourteen hybrid configurations combining hydropower, solar PV, wind, and battery storage were simulated using HOMER Pro, PVsyst, Python, and Excel under both wet and dry hydrological conditions. The proposed gate-controlled hydro-buffering model effectively improved seasonal balancing by enhancing summer generation by 52–88% without additional infrastructure. These results demonstrate the potential of hybridization to increase community energy autonomy and supply reliability while maintaining economic feasibility. Among all configurations, medium-scale systems such as C7 and C8 exhibited the best techno-economic balance, achieving a low Levelized Cost of Electricity (≈0.042 EUR/kWh) and strong Net Present Value (≈EUR 153,700) with robust Internal Rates of Return. In contrast, storage-intensive systems (C14 and C11) offered higher reliability and self-sufficiency but at higher investment costs. These results highlight the trade-offs between technical resilience and financial performance, reinforcing the importance of optimizing the mix of generation and storage assets based on stakeholder priorities. The Analytical Hierarchy Process (AHP) confirmed that configurations optimized for balanced technical and economic performance are most suitable for small energy communities.
The proposed framework offers a replicable tool for decision-makers and planners seeking to design sustainable hybrid systems that combine affordability, reliability, and environmental benefits. Future research should extend this framework to incorporate environmental and social dimensions, including life-cycle assessment, land-use optimization, and employment potential, to provide a more holistic view of sustainability. Furthermore, demand-side management strategies such as smart load control and flexible consumption should be explored to enhance self-sufficiency and reduce dependency on external energy supply. Overall, the outcomes of this study contribute to the development of resilient and cost-effective community energy systems and offer practical insights for policymakers and developers aiming to accelerate the renewable energy transition in decentralized contexts.
Author Contributions
Conceptualization, H.M.R. and P.B.; methodology, H.M.R., P.B., O.E.C.-H. and M.P.-S.; validation, H.M.R. and F.J.S.-R.; formal analysis, H.M.R. and P.B.; investigation, H.M.R., P.B., O.E.C.-H., M.P.-S. and F.J.S.-R.; data curation, O.E.C.-H., P.B., F.J.S.-R. and M.P.-S.; writing—original draft preparation, H.M.R. and P.B.; review and editing, H.M.R., O.E.C.-H. and M.P.-S.; supervision, H.M.R. and M.P.-S. All authors have read and agreed to the published version of the manuscript.
Funding
This research received no external funding.
Data Availability Statement
The original contributions presented in this study are included in the article. Further inquiries can be directed to the corresponding author.
Acknowledgments
This work was supported by FCT, UID/6438/2025 CERIS, in the Hydraulic Laboratory, for experiments on pumped storage performance, and the project HY4RES (Hybrid Solutions for Renewable Energy Systems) EAPA_0001/2022 from the INTERREG ATLANTIC AREA PROGRAMME.
Conflicts of Interest
The authors declare no conflicts of interest.
Abbreviations and Variables
| AHP | Analytical Hierarchy Process |
| BA | Battery |
| BAU | Business-as-Usual |
| BC | Benefit Cost Ratio (%) |
| C# | Configuration# |
| CMIM | Classical Multi-Index Methodology |
| EMIM | Extended Multi-Index Methodology (Maximum variation in MRA, Initial Investment) |
| GD | Grid Energy |
| HE | Hybridization |
| HY | Hydropower |
| IRR | Internal Rate of Return (%) |
| KPI | Key Performance Indicators |
| LCOE | Levelized Cost of Electricity (EUR/kWh) |
| LOLP | Loss of load Probability (%) |
| MCDC | Multi-Criteria Decision Comparison |
| MCDM | Multi-Criteria Decision-Making |
| MIM | Multi-Index Methodology |
| NPV | Net Present Value (EUR) |
| PB | Payback (years) |
| ROA | Real Option Analysis |
| ROI | Return of the Investment (%) |
| SE | Surplus Energy (kWh) |
| SO | Solar Energy |
| SS% | Self Sufficiency (%) |
| TRG | Total Renewable Generation (kWh) |
| UCC | Unit capital cost EUR/kWh |
| WT | Wind Energy |
| ΔSS | represents the marginal improvement in self-sufficiency (%) |
References
- International Energy Agency. Global Energy Review 2025. 2025. Available online: https://www.iea.org/reports/global-energy-review-2025 (accessed on 14 September 2025).
- Cox, S.; Beshilas, L.; Hotchkiss, E. Renewable Energy to Support Energy Security. 2020. Available online: https://docs.nrel.gov/docs/fy20osti/74617.pdf (accessed on 14 September 2025).
- CBS Newsroom. Study Finds Transitioning to Renewable Energy Is More Affordable than Utility Companies Are Admitting|Columbia Business School. Available online: https://business.columbia.edu/newsroom/press-releases/study-finds-transitioning-renewable-energy-more-affordable-utility (accessed on 20 May 2025).
- Greenvolt Group. What Is Decentralized Energy? Available online: https://greenvolt.com/decentralized-energy/ (accessed on 20 May 2025).
- IE University. Spain’s Blackout and Smarter Energy Systems; IE University: Madrid, Spain, 2025; Available online: https://www.ie.edu/university/news-events/news/when-grid-goes-dark-spains-blackout-urgent-need-smarter-energy-systems/ (accessed on 8 October 2025).
- Hybridisation of Renewable Energy|Endesa. Available online: https://www.endesa.com/en/the-e-face/renewable-energies/advantages-hybridisation-renewable-energy (accessed on 20 May 2025).
- Natividad, L.E.; Benalcazar, P. Hybrid Renewable Energy Systems for Sustainable Rural Development: Perspectives and Challenges in Energy Systems Modeling. Energies 2023, 16, 1328. [Google Scholar] [CrossRef]
- Odyssee Mure. Energy Efficiency Trends and Policies Overview; Odyssee Mure: Brussels, Belgium, 2025. [Google Scholar]
- Journal-Pombal. Castanheira de Pera: A Territory that Crosses Industrial and Nature Tourism-Pombal Jornal. Available online: https://www.pombaljornal.pt/castanheira-de-pera-um-territorio-que-cruza-o-turismo-industrial-e-de-natureza/ (accessed on 26 May 2025).
- Faria, P.; Lezama, F.; Vale, Z.; Khorram, M. A methodology for energy key performance indicators analysis. Energy Inf. 2021, 4, 6. [Google Scholar] [CrossRef]
- Kourkoumpas, D.-S.; Benekos, G.; Nikolopoulos, N.; Karellas, S.; Grammelis, P.; Kakaras, E. A review of key environmental and energy performance indicators for the case of renewable energy systems when integrated with storage solutions. Appl. Energy 2018, 231, 380–398. [Google Scholar] [CrossRef]
- Del Pero Aste, N.; Paksoy, H.; Haghighat, F.; Grillo, S.; Leonforte, F. Energy storage key performance indicators for building application. Sustain. Cities Soc. 2018, 40, 54–65. [Google Scholar] [CrossRef]
- Faria, P.; Barreto, R.; Vale, Z. Demand response in energy communities considering the share of photovoltaic generation from public buildings. In Proceedings of the International Conference on Smart Energy Systems and Technologies (SEST), Porto, Portugal, 9–11 September 2019; pp. 1–6. [Google Scholar] [CrossRef]
- Hossam, N.H.; Gabbar, A.; Xiaoli, M.; Abdelsalam, A. Key performance indicator modeling for micro grid design and operation evaluation. Int. J. Distrib. Energy Resour. Smart Grids 2014, 10, 219–242. [Google Scholar]
- Pramangioulis, D.; Atsonios, K.; Nikolopoulos, N.; Rakopoulos, D.; Grammelis, P.; Kakaras, E. A methodology for determination and definition of key performance indicators for smart grids development in island energy systems. Energies 2019, 12, 242. [Google Scholar] [CrossRef]
- Szajner, P.; Szczepaniak, I.; Łopaciuk, W. An Assessment of the Production Potential and Food Self-Sufficiency of Ukraine against the Background of the European Union and Poland. Sustainability 2024, 16, 7735. [Google Scholar] [CrossRef]
- Kiptoo, M.K.; Adewuyi, O.B.; Lotfy, M.E.; Senjyu, T.; Mandal, P.; Abdel-Akher, M. Multi-Objective Optimal Capacity Planning for 100% Renewable Energy-Based Microgrid Incorporating Cost of Demand-Side Flexibility Management. Appl. Sci. 2019, 9, 3855. [Google Scholar] [CrossRef]
- Hansen, K.; Mathiesen, B.V.; Skov, I.R. Full energy system transition towards 100% renewable energy in Germany in 2050. Renew. Sustain. Energy Rev. 2019, 102, 1–13. [Google Scholar] [CrossRef]
- Sakah, M.; Diawuo, F.A.; Katzenbach, R.; Gyamfi, S. Towards a sustainable electrification in Ghana: A review of renewable energy deployment policies. Renew. Sustain. Energy Rev. 2017, 79, 544–557. [Google Scholar] [CrossRef]
- Amrollahi, M.H.; Bathaee, S.M.T. Techno-economic optimisation of hybrid photovoltaic/wind generation together with energy storage system in a stand-alone micro-grid subjected to demand response. Appl. Energy 2017, 202, 66–77. [Google Scholar] [CrossRef]
- Estévez, R.A.; Espinoza, V.; Ponce Oliva, R.D.; Vásquez-Lavín, F.; Gelcich, S. Multi-Criteria Decision Analysis for Renewable Energies: Research Trends, Gaps and the Challenge of Improving Participation. Sustainability 2021, 13, 3515. [Google Scholar] [CrossRef]
- Kambezidis, H.D.; Kasselouri, B.; Konidari, P. Evaluating policy options for increasing the RES-E penetration in Greece. Energy Policy 2011, 39, 5388–5398. [Google Scholar] [CrossRef]
- Grafakos, S.; Enseñado, E.M.; Flamos, A. Developing an integrated sustainability and resilience framework of indicators for the assessment of low-carbon energy technologies at the local level. Int. J. Sustain. Energy 2017, 36, 945–971. [Google Scholar] [CrossRef]
- Wang, C.-N.; Thanh, N.V.; Su, C.-C. The Study of a Multicriteria Decision Making Model for Wave Power Plant Location Selection in Vietnam. Processes 2019, 7, 650. [Google Scholar] [CrossRef]
- Pohekar, S.D.; Ramachandran, M. Application of multi-criteria decision making to sustainable energy planning—A review. Renew. Sustain. Energy Rev. 2004, 8, 365–381. [Google Scholar] [CrossRef]
- Strantzali, E.; Aravossis, K. Decision making in renewable energy investments: A review. Renew. Sustain. Energy Rev. 2016, 55, 885–898. [Google Scholar] [CrossRef]


Disclaimer/Publisher’s Note: The statements, opinions and data contained in all publications are solely those of the individual author(s) and contributor(s) and not of MDPI and/or the editor(s). MDPI and/or the editor(s) disclaim responsibility for any injury to people or property resulting from any ideas, methods, instructions or products referred to in the content. |
© 2025 by the authors. Licensee MDPI, Basel, Switzerland. This article is an open access article distributed under the terms and conditions of the Creative Commons Attribution (CC BY) license (https://creativecommons.org/licenses/by/4.0/).