Abstract
Existing methods plan the distribution network and sub-transmission network separately. This paper proposes a collaborative renewable energy resource siting and sizing planning method for distribution and sub-transmission networks to increase the renewable energy ratio in high-load density industrial parks and promote the hosting capacity of the power grid. First, to accurately measure planning effectiveness, a renewable energy ratio calculation method is proposed, which comprehensively considers the contributions of green electricity from the power grid and renewable energy generation inside and outside the industrial park. Second, a collaborative planning model is proposed, which optimizes access points and access capacity in the distribution and sub-transmission networks for renewable energy around the park. The net load is better matched with the output of renewable energy outside the park through demand response, thereby maximizing the utilization of the park load to host more renewable energy. Finally, the proposed method is verified in a real industrial park. The method outperforms traditional planning methods in terms of renewable energy ratio in the park and renewable energy hosting capacity outside the park.
1. Introduction
Developing renewable energy (RE) is an important means to combat global warming and fossil fuel depletion and to achieve climate goals and energy transition. In 1990, the percentage of global electricity generated by photovoltaic (PV) energy was less than 0.0007%; in 2020, that number was 3.4% [1]. The “Fit for 55” (“FF55”) package provides for a European target of a reduction in net emissions of at least 55% by 2030 [2]. In the United States, wind energy is expected to provide 20 percent of the U.S. energy production portfolio by 2030 [3], while China plans to achieve an annual renewable energy penetration of more than 60% by 2050 [4].
Massive renewable energy interconnections in the grid solve the energy supply problem; at the same time, they bring challenges, including overvoltage, power harmonic distortion, and static and dynamic stability issues [5]. The hosting capacity (HC) of a system identifies the acceptable degree of renewable energy penetration under given circumstances, including operational and security constraints [6,7].
Existing research on how to improve the HC mainly focuses on the distribution network. Much research has been conducted on maximizing the HC of the distribution network. Network reconfiguration can significantly improve the HC of the distribution network through switching operations [8]. However, frequent reconfigurations can cause problems such as transient instability and increased operational costs [9]. A formulation that avoids frequent reconfigurations is adopted to improve the HC of the distribution network in Ref. [10]. Ref. [11] proposes a network reconfiguration scheme that minimizes power loss as the objective function, with ampacity violation and total harmonic distortion as major constraints; this scheme results in a 166% increase in HC. Ref. [12] aims to minimize carbon emissions through the operation of capacitor banks and voltage regulator devices, while simultaneously increasing HC. Besides on-load tap changers [13], capacitor banks [14], and static var compensators [15], customer flexibility resources are also an important means to address voltage violations. Ref. [16] proposes a demand-response (DR)-based load-shifting scheme to resolve voltage violations and improve HC. Ref. [17] applies battery energy storage systems to improve the HC of unbalanced three-phase distribution networks. Ref. [18] improves HC by modifying electric vehicle charging demand and reducing renewable energy curtailment.
Some scholars have carried out studies to improve HC from the perspective of the sub-transmission network. The sub-transmission network, as an intermediate grid between the distribution and transmission systems, receives electric energy from the transmission network and delivers it to the distribution network [19]. By connecting renewable energy to the sub-transmission network [20,21], redistribution of renewable energy among multiple distribution networks connected to it can be realized [22]. Ref. [20] suggests that renewable energy power plants with a rated power of less than 100 MW should connect to the sub-transmission network, stepping up from 36 kV. This leads to better hosting of renewable energy. Voltage issues are among the main factors that limit HC in the sub-transmission network. Ref. [21] proposes a two-stage coordinated control framework to address the negative voltage impacts caused by wind power fluctuations, thereby improving the HC of wind power. Ref. [23] proposes a reactive power planning method to mitigate voltage violations and fluctuations caused by high PV penetration with a minimum investment cost, which increases the HC of the sub-transmission network.
Despite the extensive literature on improving the HC of distribution networks or sub-transmission networks, studies on HC considering both distribution networks and sub-transmission networks are rather limited. Ref. [24] presents a sub-transmission and distribution network expansion planning method to minimize investment and reliability costs but does not involve HC. Ref. [25] proposes an optimal planning scheme for integrated transmission and distribution networks with distributed generation, but the study does not mention how to improve HC. Ref. [26] proposes a method to coordinate operations between transmission system operators and distribution system operators to increase the penetration of PV and electric vehicles; however, the resulting HC improvement is confined to the distribution network. In China, large urban power grids are typically composed of sub-transmission networks and distribution networks that are closely interconnected. If the sub-transmission networks and distribution networks are planned collaboratively to optimize the siting and sizing of distributed energy resources, it is likely to enhance the system’s HC. A summary of relevant literature on HC improvement is shown in Table 1.

Table 1.
Summary of relevant literature on HC improvement.
In addition, according to existing studies and relevant grid codes, renewable energy power plants access the grid at a single voltage level. In Ref. [27], a distributed renewable energy power plant connects to the 10 kV distribution network. In Germany, it is required that renewable energy power plants with a rated power greater than 80 MW connect to the network at 110 kV [22]. According to Chinese national grid codes, distributed renewable energy power plants with rated power of 0.4 MW~6 MW should connect to the 10 kV distribution network [28]; renewable energy power plants with a rated power of 6~30 MW connect to the 35 kV distribution network [29], and those with a rated power of 30 MW~50 MW connect to the 110 kV distribution network [30]. For renewable energy power plants with a rated capacity exceeding 50 MW can only connect to the 220 kV sub-transmission network. However, since renewable energy power plants access the network at a single voltage level, large-capacity renewable energy power plants located near high-load industrial parks must connect to a transmission network. Consequently, electricity must be transmitted through networks at multiple voltage levels, and then back to the adjacent industrial parks, leading to several inefficiencies: (1) it prevents the direct and local utilization of renewable energy; (2) it introduces additional energy losses due to multi-voltage-level transmission; (3) it is not conducive to increasing the renewable energy ratio in high-load industrial parks.
In summary, existing studies have conducted collaborative planning between the distribution and sub-transmission networks or transmission networks, but no research has been conducted on how to improve the overall HC. Moreover, in current planning codes, renewable energy power plants can only connect to a single voltage level, resulting in a lower renewable energy ratio and higher loss. To address the above two issues, this paper proposes a collaborative planning method to host distributed energy resources. The main contributions of the paper are as follows:
- (1)
- This paper proposes a collaborative renewable energy resource siting and sizing planning method for the distribution and sub-transmission networks. Both access points and access capacities in the distribution and sub-transmission networks are optimized to host more renewable energy.
- (2)
- A renewable energy ratio calculation method is proposed, which comprehensively considers the contributions of green electricity from the power grid and renewable energy generation inside and outside of the industrial park.
- (3)
- Contrary to traditional planning methods, renewable energy power plants can be connected to different voltage levels of the power grid.
- (4)
- By matching the net load of the park with the output of renewable energy power plants, the park load is better used to host more renewable energy.
2. Renewable Energy Hosting Indicators
2.1. Power Penetration Rate
The power penetration rate (λPP) represents the percentage of annual maximum output power of all distributed renewable energy (DRE) sources relative to annual maximum load [31,32], and is given as:
where is the annual maximum output power of all DRE in the industrial park; is the annual maximum load in the park.
2.2. Capacity Penetration Rate
The capacity penetration rate (λCP) represents the percentage of annual maximum hourly electricity generation of DRE relative to annual maximum hourly electricity consumption of the load [31], and is given as:
where is the annual maximum hourly electricity generation of DRE, and is the annual maximum hourly electricity consumption of the load.
2.3. Energy Penetration Rate
The energy penetration rate (λEP) represents the percentage of annual electrical energy provided by DRE relative to the annual electricity consumption of the load [31] and is given as:
where EDRE is the annual electrical energy provided by DRE, and Eload is the annual electricity consumption of the load.
λEP = EDRE/Eload × 100%
2.4. Renewable Energy Ratio
2.4.1. Definition
The renewable energy ratio (λRER) represents the percentage of annual green electricity consumption to annual electricity consumption [33,34] and is given as:
where ERE is the annual green electricity consumption, EGRE is green electricity from the power grid, and EPRE is the electricity generated by renewable energy power plants outside the industrial park and consumed by the park’s load.
λRER = ERE/Eload × 100%
ERE = EDRE + EGRE + EPRE
2.4.2. Calculation Method
The renewable energy ratio is a key metric for evaluating the performance of the proposed planning method. Ref. [32] considers both green electricity from the upper power grid and renewable energy generated locally within the park, whereas Ref. [33] only considers renewable energy power plant that connect to the local network where the park is located, disregarding green electricity from the power grid. That is, existing planning methods [33,34] lack a comprehensive framework that simultaneously considers grid-supplied green electricity, nearby renewable power plants, and distributed renewable energy within the park.
The renewable energy ratio is a key indicator for evaluating the effectiveness of planning methods. Using existing methods to calculate the renewable energy ratio fails to accurately reflect all the green electricity hosted by the park, leading to an underestimation of the renewable energy ratio. To address this issue, this paper proposes a renewable energy ratio calculation method shown in Figure 1.
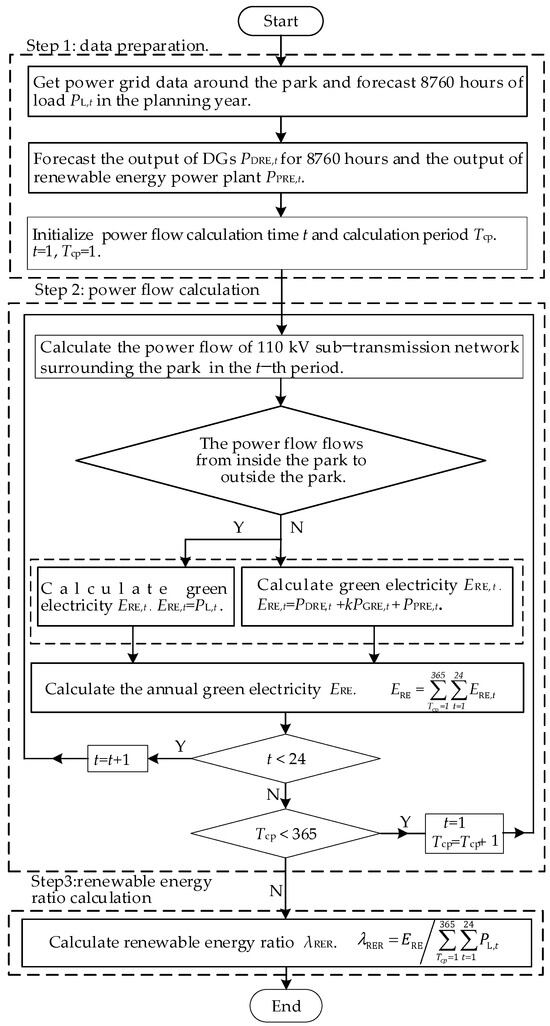
Figure 1.
Renewable energy ratio calculation process.
The method is as follows.
Step 1: Data preparation.
Obtain power grid data around the park. Then forecast 8760 h load PL,t, output of distributed renewable energy PDRE,t, and output of renewable energy power plants PPRE,t for the planning year.
Step 2: Power flow calculation.
Calculate the power flow of the sub-transmission network around the park for 8760 h with a step size of 1 h.
Green electricity hosted by the park during time t is denoted as ERE,t. ERE,t can be calculated based on the direction of the power flow:
- (a)
- When the direction is from inside to outside the park, ERE,t is equal to the load PL,t, as follows:
ERE,t = PL,t
- (b)
- When the direction is from outside to inside the park, ERE,t is the sum of PDRE,t, kPGRE,t, and PPRE,t, as follows:
ERE,t = PDRE,t + kPGRE,t + PPRE,t
Equation (9) shows that the green electricity from the power grid, the renewable energy power plants around the park, and the DRE within the park are all considered.
PPRE,t is obtained through power flow tracing; the calculation formula for power flow tracing is as follows [34]:
where PG,t,i is the power of the i-th power source at time t and M is the number of power sources.
The power flow tracing is illustrated in Figure 2. The output power of the renewable energy power plant outside the park and that of the power grid are 200 MW and 50 MW, respectively. The loads outside the park and within the park are 100 MW and 150 MW, respectively. The portion of renewable energy flowing into the park is: 150 × (200/250) = 120 MW.
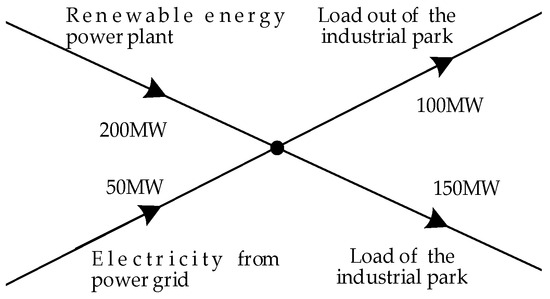
Figure 2.
Demonstration of power flow tracing.
Step 3: Renewable energy ratio calculation.
ERE is calculated as follows:
The renewable energy ratio is calculated as follows:
3. Planning Method
3.1. Collaborative Planning Model
In practical planning, the selection of access points is strictly constrained by real-world factors such as geographical boundaries, administrative jurisdictions, community acceptance, and substation space resources. The number of truly feasible access points is typically very limited, often narrowed down to a few candidate options. In response to these common real-world constraints, this paper focuses on the optimization of access points and access capacity allocation for a single renewable energy power plant with a predetermined location.
Currently, renewable energy power plants access the network at a single voltage level. The voltage level of renewable energy access to the network is determined based on the installed capacity of the power plants [21,25,26]. For instance, in China, power plants with a rated power of 50 MW are required to access the distribution network at 110 kV. This paper proposes a planning approach for renewable energy power plants connecting to the network at two voltage levels. For large-capacity renewable energy power plants located near industrial parks with heavy loads, a portion of their capacity is proposed to connect to the sub-transmission network at one voltage level, and the remaining capacity is proposed to connect to the distribution network at another voltage level.
The collaborative planning method aims at jointly optimizing RE access locations and capacity at the sub-transmission and distribution networks. In this paper, the distribution network is located inside an industrial park, and the sub-transmission network is located around the park. The collaborative planning includes the following two steps.
The first step is distribution network planning. Usually, the distribution network planning model takes HC maximization [8,9,10,15] as the objective function, and voltage, current, and thermal limits as constraints. The model in Ref. [8] is shown in Appendix A. After aggregating the load of the industrial park, the net load is obtained as an input variable for the next step.
The second step is sub-transmission network planning.
The proposed sub-transmission network planning model is as follows:
Subject to:
Equation (11) is the objective function to maximize the sub-transmission network HC, where is the power of RE connected to the sub-transmission network at time t. Zdis,ass is the electrical distance between the access point and the industrial park.
There are two key measures to maximize the sub-transmission network HC. First, choose the access point with the shortest electrical distance, as shown in Equation (13); second, match the net load with RE output, as shown in Equations (20) and (21).
The constraints of the model consist of two parts. Equations (12) and (13) calculate the electrical distance of every feasible access point and choose the one with the shortest electrical distance as the candidate access point. The remaining constraints maximize the RE capacity connected to the candidate access point, with (14)–(18) being conventional electrical constraints and (19)–(22) being matching-degree constraints.
Equation (12) is the electrical-distance calculation formula, where Zdis,n is the electrical distance from feasible access point n to the industrial park. N is the total number of feasible access points. Vn and In denote the voltage and current between feasible access point n and the industrial park, respectively.
Equation (13) denotes that feasible access points with the shortest electrical distance are chosen as candidate access points.
Equations (14) and (15) are the active and reactive power balance constraints at each node in the sub-transmission network, where PG,t and QG,t are the active and reactive power from the power grid. and are active and reactive net loads after users in the park respond to DR instructions by shifting the electricity consumption period; is the voltage of node i; and represent the branch conductance and susceptance between nodes i and j; and is the voltage-angle difference between nodes i and j.
Equation (16) indicates that the voltage at each node must be within the minimum voltage limit () and maximum voltage () limit.
Equation (17) is the thermal capacity constraint; is the max thermal capacity between nodes i and j.
Equation (18) indicates that the power from RE connected to the sub-transmission network must be within the minimum () and maximum () limits specified by grid codes.
Equation (19) is the matching-degree constraint, where λMD is the matching degree and λmin is the minimum value of λMD.
Equation (20) is the λMD calculation formula. The value range of λMD is [0,1]. The smaller the λMD, the better PL,T is matched with PNet,t.
Equation (21) is the calculation formula and is a coefficient that makes PNet,t and PRE,t of the same order of magnitude.
Equation (22) is the DR constraint: user load within a scheduling cycle remains the same before and after participating in DR.
3.2. Collaborative Planning Method
The method proposed in Section 3.1 is a discrete–continuous optimization problem. Conventional heuristic algorithms, such as the genetic algorithm and particle swarm optimization, can be employed to obtain optimal solutions; however, as introduced in Section 3.1, the scale of the solution space is significantly reduced after real-world constraints are taken into account, and the contribution of this work is not intended as a comparative study of optimization techniques. The deterministic approach ensures the feasibility of the solution while avoiding the computational overhead of heuristic algorithms.
In practical planning, the number of feasible locations for renewable energy access is limited. An appropriate access location can be selected through techno-economic comparisons based on economic efficiency and operational rationality [35]. Regarding access capacity, it can be incrementally increased within a certain range by setting a step size and verified via power-flow calculations to ensure compliance with voltage and capacity constraints. The computational procedure of the deterministic method is elaborated in detail below.
The HC model for the distribution network, as defined in Appendix A, is solved through an iterative process. This process involves adjusting the RE access capacity and verifying constraints via power-flow calculations until the optimal solution is reached.
There are three steps to solve the sub-transmission network HC model, and the flowchart is shown in Figure 3.
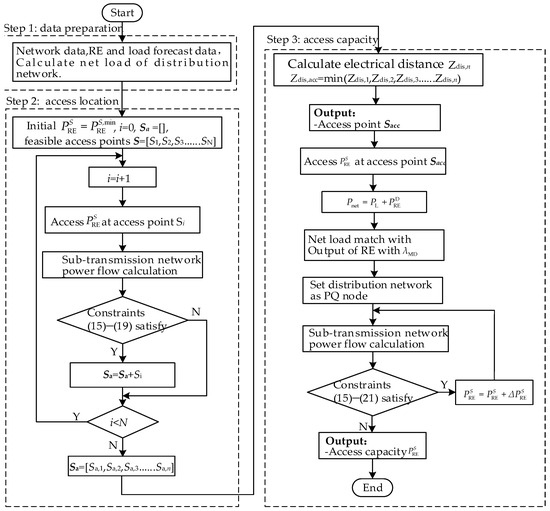
Figure 3.
Solution process of the sub-transmission network HC model.
Step 1: Data preparation.
Data preparation is implemented in Step 1, including network data, RE, and load forecast data.
Step 2: Determine RE access location in the sub-transmission network.
All buses in the sub-transmission network that can be accessed by RE constitute a feasible set, S = [S1, S2, S3, …, SN]. Perform the power-flow calculation by letting the RE resource access each bus in S sequentially. Those access points that satisfy all constraints form a candidate set Sa = [Sa,1, Sa,2, Sa,3, …, Sa,n], Sa ∈ S. The RE access capacity in the power-flow calculation is set to , which is the minimum capacity specified by grid codes. Calculate the electrical distances from Sa to the industrial park, denoted as Zdis,1, Zdis,2, Zdis,3, …, Zdis,n. The access point with the shortest electrical distance, Zdis,acc=min(Zdis,1, Zdis,2, Zdis,3, …, Zdis,n) is selected and denoted as Sacc.
Step 3: Determine RE access capacity in the sub-transmission network.
The net load of the park can be calculated by combining the amount of RE capacity connected to the distribution network with the park’s load. Users in the park participate in DR. By responding to DR instructions and shifting their electricity consumption periods, they align their load profiles with the RE output [36]. First, perform the power flow-calculation using the minimum allowable RE access capacity at the given voltage; then, increase the RE access capacity incrementally until any of the constraints (15)–(21) is violated. The capacity of renewable energy resources that connect to the power grid typically ranges from several kilowatts to several hundred megawatts. To balance solution accuracy with computational efficiency, a step size of 1 kW is adopted. For renewable energy power plants with capacities of several hundred megawatts, the step size can initially be set to 1 MW to narrow the solution space and then refined to 1 kW to ensure precise results.
4. Case Study
4.1. Case Information
In the following analysis, consider the example of an industrial park in Tianjin, China, with an area of 18.8 km2. The load is mainly industrial and commercial, with an annual electricity consumption of 353.77 million kWh in 2023. There are two 110 kV substations in the park. The current power grid structure of the park and its surrounding area is shown in Figure 4. All conductor types from substations S1 and S2 to substations A and B are LGJ-300. There is a 40 MW wind farm (WF) C, located 5 km away from the park. WF C connects to the 110 kV high-voltage distribution network outside the park.
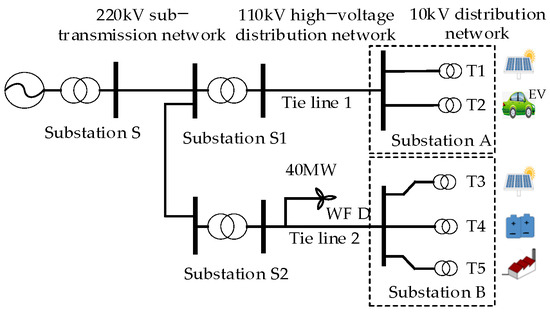
Figure 4.
Current power grid structure of the industrial park and surrounding area.
In China, distribution networks are categorized into high-voltage distribution networks (110 kV), medium-voltage distribution networks (10 kV), and low-voltage distribution networks (0.4 kV) [27]. Sub-transmission networks operate at voltages such as 220 kV.
4.1.1. Current Year Data
There are two 50 MVA transformers in substation A, three 50 MVA transformers in substation B, and 27 10 kV feeders in the industrial park. All conductor types of the main feeder are JKLYJ-240. The structure of the 10 kV distribution network in the park is shown in Figure 5.
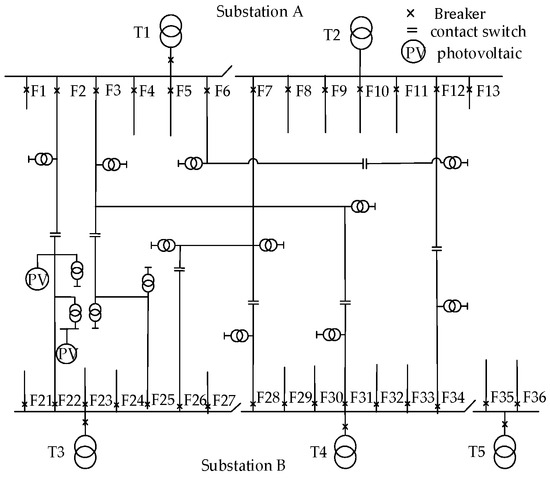
Figure 5.
Current structure of 10 kV distribution network.
The total installed capacity of DRE in the park is 1.87 MWp, and the total load is 64.41 MW.
In the current 10 kV distribution network of the industrial park, feeder 21 hosts distributed PV systems with a total capacity of 1.87 kWp. Of this, 0.4 kWp is accessed at 0.4 kV, and 1.47 kWp is accessed at 10 kV. Installed capacity of PVs in the park is shown in Table 2, and the output of the PVs on a typical day is shown in Appendix B, Figure A1.
Table 2.
Current PV parameters of the park.
Parameters of the load of each 10 kV feeder are shown in Table 3.
Table 3.
Current 10 kV load of the park.
The renewable energy ratio of the power grid is 16.07% in the current year and is expected to reach 33% in the planning year.
4.1.2. Planning Year Data
By 2030, a new 200 MVA wind farm, WF D, will be built outside the park. The typical daily output curve of WF D is shown in Appendix B, Figure A2.
The load of the park will increase to 115.89 MW in 2030, and the total load will be 180.3 MW, as shown in Table 4.
Table 4.
10 kV load of the park in the planning year.
Flexible load of the park includes air conditioners, electric vehicles, and other non-continuous production loads. The power-consuming time of the flexible load can be advanced or delayed by up to 3 h.
The total installed capacity of distributed PVs will reach 74.1 MWp, as shown in Table 5. Distributed PVs connected to the 0.4 kV network total 5 MWp, and those connected to the 10 kV network total 69.1 MWp.
Table 5.
Distributed PV of the park in the planning year.
4.2. Planning Process
The 10 kV distribution network of the industrial park is planned according to the load and PV of the park, and the result is shown in Appendix C, Figure A3. The 110 kV high-voltage distribution network is planned according to the optimal method in Ref. [10], with the 40 MW wind farm connected to , as shown in Figure 6.
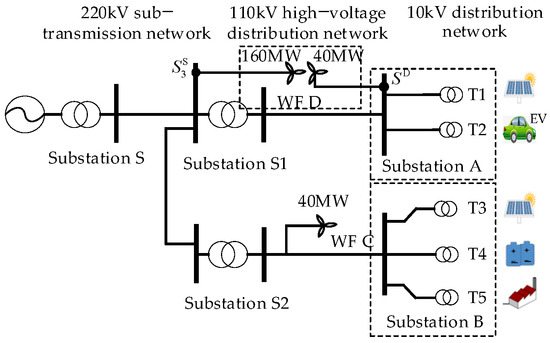
Figure 6.
Power grid structure of the park and surrounding area in the planning year.
Collaborative planning of sub-transmission network is as follows:
Step 1: Data preparation.
The grid structure is shown in Figure 4. The park load in the planning year is shown in Table 4. The annual output of WF D for 8760 h is predicted using Meteodyn WT 5.0 with longitude, latitude, and installed capacity as inputs, and the output curve of WF is shown in Figure A2.
Step 2: Determine RE access location in the the sub-transmission network.
The feasible set that RE can connect to is S = [,,,,], as the black dots in Figure 7.
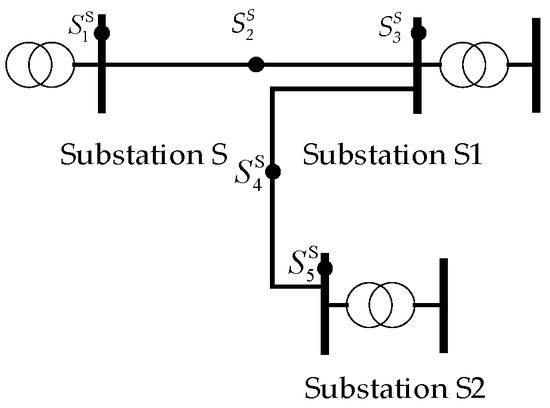
Figure 7.
Feasible access locations.
The minimum RE access capacity is 100 MW, specified by Ref. [30]. All five feasible access locations meet constraints (15)–(19) after power-flow calculation, so the candidate access location set is Sa = [,,,,]. is chosen as the optimal access location as it has the shortest electrical distance, 3.09 Ω.
Step 3: Determine RE access capacity in the sub-transmission network.
Net load calculation for a typical day is in Appendix D.2, and the net load after matching with RE is shown in Appendix D.2, Figure A4, with λMD = 0.93. Due to page limitations, data for 8760 h are not listed. starts from 100 MW and gradually increases with = 1 MW; perform power-flow calculations and check constraints (15)–(19). The remaining capacity of WF D is 160 MW, which satisfies all constraints and is the optimal capacity.
With RE access locations and capacity obtained above, the power grid structure of the park and the surrounding area in the planning year is shown in Figure 6.
4.3. Hosting Indicators Calculation
According to Section 2 and the renewable energy ratio calculation process in Figure 2, hosting indicators are calculated. The calculation process is given in Appendix D.1, and the results are shown in Table 6.
Table 6.
Renewable energy hosting indicators of the current year and the planning year.
It can be seen from Table 6 that all four hosting indicators are significantly improved in the planning year compared with the current year.
The changes in the first four indicators are due to the PV capacity in the park increasing far more than the load. For example, consider λPP. The maximum annual output of all PVs is 1.68 MW in the current year and increases by over 45 times, reaching 75.97 MW in the planning year, whereas the maximum annual load in the park is 64.41 MW in the current year, and increases by less than three times to 180.3 MW. So λPP increases by over 15 times, from 2.61% to 42.13%.
The increase in λRER is due to three reasons. First, the growth in PV capacity significantly outpaces the increase in load demand. Second, the renewable energy ratio of the power grid increases from 16.07% in the current year to 33% in the planning year. Third, WF D connects to the distribution network and sub-transmission network simultaneously, which provides additional green electricity. Taking these three reasons into consideration, λRER increases by 36.25%.
4.4. Comparison with Existing Method
The traditional method refers to renewable energy power plants connecting to the grid at a single voltage level [22,28,30,35]. The choice of voltage level is based on the installed capacity of the renewable energy plant. For example, the capacity of WF D is 200 MW; according to Ref. [30], it should be connected to the grid at the 220 kV voltage level, as shown in Figure 8. The method proposed in this paper involves connection to both the high-voltage distribution network at 110 kV and the sub-transmission network at 220 kV, as illustrated in Figure 9. The following provides a comparison of the two approaches.
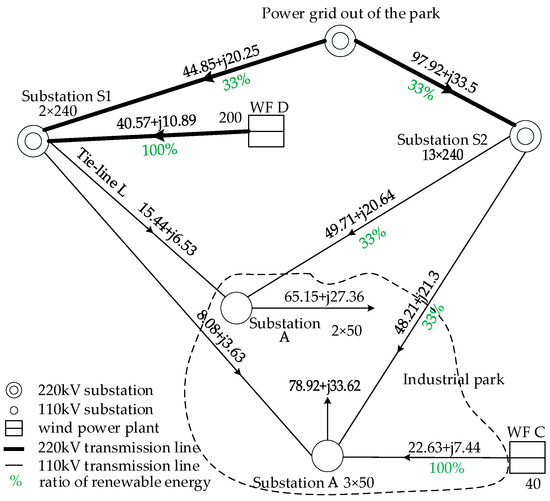
Figure 8.
Green electricity power flow at 14:00 on a typical day using the traditional planning method [30].
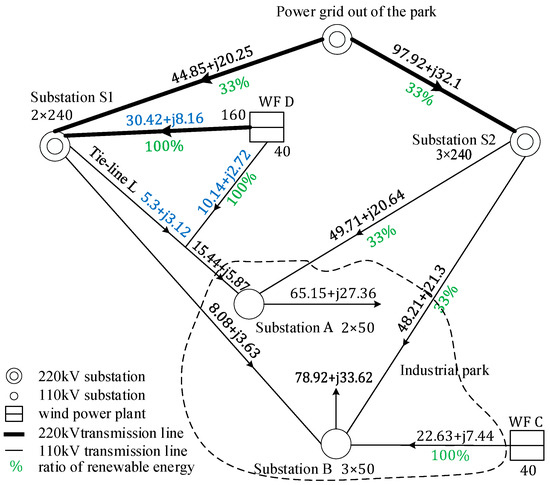
Figure 9.
Green electricity power flow at 14:00 on a typical day using the proposed planning method.
4.4.1. Comparison of Renewable Energy Hosting Indicators
The power grid structure of the park and surrounding area in the planning year using the traditional method is shown in Appendix D.3, Figure A5. The planning scheme of the traditional planning method and hosting-indicator calculation process are in Appendix D.3. The hosting-indicator calculation process of the planning method in this paper is given in Appendix D.2. The results are shown in Table 7.
Table 7.
Renewable energy hosting indicators in the traditional planning method and this method.
The first four indicators are the same because they are all about DRE in the park. However, the renewable energy ratio in this method is 5.25% higher than in the traditional planning method; the reasons are as follows:
- (1)
- Shorten the distance between the renewable energy power plant and the park. Part of WF D connects to the distribution network, with the length of the transmission line reducing from 12 km to 4 km. The electrical distance of the transmission line [37] decreases from 2.24 Ω to 0.75 Ω.
- (2)
- Shift the load of the park through the matching method to the time when the output of renewable energy is at its peak. At 15:00, when WF D is at its peak, the load is increased from 82.3 MW to 100.8 MW to match the peak output of WF D, as shown in points A and B in Figure A4.
After adopting the above planning measures, more green electricity flows towards the park.
4.4.2. Comparison of Green Electricity Power Flow
The green electricity power flows on a typical day at 14:00, as determined by the traditional planning method and the proposed method, are presented in Figure 8 and Figure 9, respectively.
The difference produced by this method is shown in blue font in Figure 9. Partial power of WF D flows directly into substation A, and the rest flows into S1, while in the traditional method, all the power of WF D flows into S1. This difference leads to different λRER values for the two methods at 14:00. The calculation process for λRER is given in Appendix E. The planning method described in this paper is detailed in Appendix E.1, while the traditional planning method is in Appendix E.2. The corresponding results are shown in Table 8.
Table 8.
Comparison of green electricity.
As can be seen from Table 8, the planning method of this paper increases the total power of green electricity at 14:00 by 2.95 MW compared to the traditional planning method. The improvement comes from the power of green electricity provided by WF D and the power grid.
The planning method of this paper provides an additional 4.4 MW of green electricity from WF D. In the traditional planning method, WF D is connected to substation S1 and provides 11.15 MW of green electricity for the park through S1. With the planning method of this paper, part of WF D is directly connected to substation A and provides 10.14 MW green electricity; part of WF D is connected to to S1 and provides 5.41 MW of green electricity through S1. These two parts result in an additional 4.4 MW of green electricity compared to the traditional method.
The power of green electricity from the power grid is reduced by 1.45 MW with the planning method of this paper. The park load minus the power provided by WF C and WF D equals the power supplied by the power grid, which is 110.29 MW in the traditional method and 105.89 in this method, respectively. The renewable energy ratio is 33%. Thus, the power of green electricity from the power grid is 36.38 in the traditional method and 34.93 in the planning method of this paper.
In this method, WF D contributes an additional 4.4 MW of green electricity compared with the traditional planning method, while the power grid supplies 1.45 MW less than the traditional method, resulting in a net increase of 2.95 MW of green electricity.
4.4.3. Comparison of Power Grid Side Fluctuations
To analyze the impact of the two planning methods on the upper power grid, the power of the tie-line between the park and the upper power grid is observed. There are multiple tie-lines in the power grid, and the difference between the two planning methods is whether WF D is partially connected to S1 or fully connected to S1. Therefore, tie-line L between S1 and substation A is selected as the observation object. The power of the tie-line L for the traditional planning method and the planning method in this paper is shown in Figure 10.
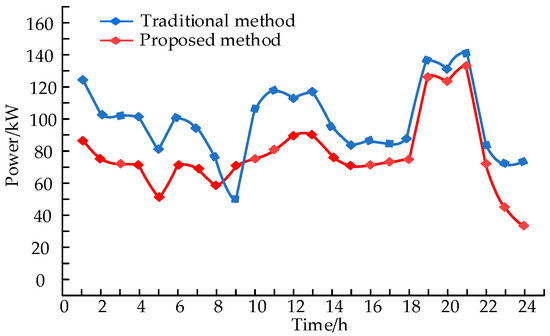
Figure 10.
Comparison of tie-line power on a typical day.
It can be seen from Figure 10 that the planning method in this paper significantly reduces the power fluctuation of the tie-line.
For example, at 9:00, the output of WF D is at its peak.
By shifting the higher load from 8:00 to 9:00, the wave trough caused by the heavy load is flattened, and the fluctuation caused by the output of WF D is stabilized at the same time. From 11:00 to 14:00, the load is at its peak. By shifting the load of 15:00–18:00 to 11:00 to 14:00, the load better matches the small-wind-farm output, and the peak on the tie-line becomes smooth.
Not all fluctuations are significantly suppressed. For example, there is no significant improvement in the peak from 18:00 to 22:00, because the output of WF D is relatively small compared to the load. Moreover, the time span of load peaks is greater than the output of WF D, and load shifting cannot offset the fluctuation.
The planning method of this paper reduces the power fluctuation of the tie-line, which helps to suppress large fluctuations propagating to the upper power grid. However, in the traditional planning method, wind farms are all connected to the transmission network, inevitably leading to fluctuations in the transmission network.
5. Conclusions
To increase the renewable energy ratio in high-load-density industrial parks and promote the hosting capacity of the power grid, a collaborative distributed energy resource siting and sizing planning method for the distribution and sub-transmission networks is proposed. The primary conclusions of this paper can be summarized as follows:
- (1)
- Compared with traditional planning methods, the proposed method improves renewable energy hosting capacity because the wind farm is connected at two voltage levels.
- (2)
- By matching the net load of the park with the output of the renewable energy power plant, the park’s load is better used to host more renewable energy.
- (3)
- A renewable energy ratio calculation method is also proposed, which comprehensively considers the contributions of green electricity from the power grid and renewable energy generation inside and outside the industrial park.
The proposed planning method is verified through the real-world planning of an industrial park in Baodi, Tianjin, China. The renewable energy ratio of the park reaches 52.85% in the planning year, which is 5.25% higher than with the traditional planning method.
The proposed method is applicable to an industrial park that has both the distribution and sub-transmission networks and features heavy load with a large renewable energy power plant in the surrounding areas. The proposed method can also bring benefits to the utilization of renewable energy outside the area, reduce power fluctuation of the tie-line, and suppress large fluctuations propagating to the upper power grid.
The proposed method presented in this paper is not suitable for planning involving numerous renewable energy plants. It is designed for a high-load industrial park surrounded by renewable energy power plants. In the future, its application could be validated in different types of areas, such as towns or commercial districts, to assess its universality and identify any required adaptations.
Author Contributions
Conceptualization, J.X. and G.H.; methodology, J.X. and G.H.; validation, J.X., G.H. and C.L.; formal analysis, G.H.; investigation, G.H. and C.L.; resources, J.X.; data curation, C.L.; writing—original draft preparation, G.H.; writing—review and editing, J.X. and G.H.; visualization, G.H. and C.L.; supervision, J.X. All authors have read and agreed to the published version of the manuscript.
Funding
This research was funded by the National Natural Science Foundation of China (No. 52177105) and the State Grid Tianjin Electric Power Company (No. Baodi-development-2023-01).
Data Availability Statement
The original contributions presented in the study are included in the article, and further inquiries can be directed to the corresponding author.
Conflicts of Interest
The authors declare no conflicts of interest.
Abbreviations
The following abbreviations are used in this manuscript:
| RE | Renewable energy |
| PV | Photovoltaic |
| HC | Hosting capacity |
| DR | Demand response |
| DRE | Distributed renewable energy |
| WF | Wind farm |
| RER | Renewable energy ratio |
Nomenclature
| Variables | |||
| λPR | Power penetration rate. | PG,t | Active power of power plant. |
| λCP | Capacity penetration rate. | Reactive power of power plant. | |
| λEP | Energy penetration rate. | Power of DRE access to distribution network at time t. | |
| λRER | Renewable energy ratio. | Power of RE plant access to sub-transmission network at time t. | |
| Annual maximum power of all DREs in industrial park. | Zdis,n | Electrical distance between feasible access point n to industrial park. | |
| Annual maximum load in industrial park. | Zdis,acc | Electrical distance between chosen access point to industrial park. | |
| Total installed capacity of DRE. | Vn | Voltage between access point n and industrial park. | |
| Annual maximum hourly electricity generation of DRE. | In | Current between access point n and industrial park. | |
| Annual maximum hourly electricity generation of DRE. | Branch conductance between nodes i and j. | ||
| EDRE | Annual electricity energy provided by DRE. | Branch susceptance between nodes i and j. | |
| Eload | Annual electricity consumption of load. | Voltage of node i in sub-transmission network. | |
| ERE | Annual green electricity consumption. | Minimum voltage of sub-transmission network. | |
| EGRE | Annual green electricity from power grid. | Maximum voltage of sub-transmission network. | |
| EPRE | Annual electricity generated by renewable energy power plant and consumed by park load. | Branch thermal capacity between nodes i and j. | |
| ERE,t | Green electricity hosted by industrial park load at time t | Minimum thermal capacity between nodes i and j. | |
| PGRE,t | Power from power grid to park at time t. | Maximum thermal capacity between nodes i and j. | |
| PPRE,t | Power of renewable energy power plant flows to the park at time t. | Minimum capacity of RE connected to sub-transmission network. | |
| PL,t | Load of park at time t in planning year. | Maximum capacity of RE connected to sub-transmission network. | |
| P’L,t | Load of park after matching with output of renewable energy power plant at time t. | λMD | Matching degree between net load and RE. |
| PDRE,t | Power of DRE in planning year at time t. | λmin | Minimum value of λMD. |
| PNet,T | Power of net load in a 24 h schedule cycle. | Coefficient makes PNet,t and PRE,t of the same order of magnitude. | |
| P’Net,T | Power of net load after participating in DR. | ||
| Sets | Others | ||
| S | Feasible set of all buses in sub-transmission network where RE can connect. | M | Number of power plants. |
| Sa | Candidate set of buses in sub-transmission network where RE can connect. | N Tcp | Number of feasible access points in the sub-transmission network. Calculation period. |
Appendix A
The maximum distribution network HC model [8] is as follows:
Subject to:
Equation (A1) is the objective function, where is the power of RE connected to the distribution network at time t.
Equations (A2) and (A3) are the active and reactive power balance constraints at each node of the distribution network, where and are the active and reactive loads of industrial park; and are active and reactive power supplied by the sub-transmission network; is the voltage of node i; and represent the branch conductance and susceptance between nodes i and j; and is voltage angle difference between nodes i and j.
Equation (A4) indicates that the voltage at each node must be within the minimum voltage limit () and maximum voltage limit ().
Equation (A5) is the thermal capacity constraint, where is the maximum thermal capacity between nodes i and j.
Equation (A6) ensures that the power flow from the sub-transmission network cannot be reversed.
Equation (A7) indicates that the power of RE must be within the minimum power () and maximum power () specified by grid codes.
Appendix B

Figure A1.
Output curve of PV on a typical day in the park.

Figure A2.
Output curve of the wind farm on a typical day outside the park.
Appendix C

Figure A3.
Structure of the 10 kV distribution network of the park in the planning year.
Appendix D
Appendix D.1
Hosting-indicator calculations for the current year are as follows:
- (1)
- Power penetration rate
The maximum annual output power of all PVs is 1.68 MW. The maximum annual load in the park is 64.41 MW. Thus, λPP is as follows:
λPP = 1.68/64.41 × 100% = 2.61%
- (2)
- Capacity penetration rate
The annual maximum hourly electricity generation of DRE is 1670 kWh. The annual maximum hourly electricity consumption of the load is 64,410 kWh. So λCP is calculated as follows:
λCP = 1670/64,410 × 100% = 2.59%
- (3)
- Energy penetration rate
The annual electricity provided by DRE is 2.244 million kWh. The annual electricity consumption of the load is 353.77 million kWh. Thus, λEP is as follows:
λEP = 224.4/35,377 × 100% = 0.63%
- (4)
- Renewable energy ratio
Electricity from the power grid is 353.77 million kWh, and the renewable energy ratio is 16.07%, so EGRE is 56.49 million kWh, and ERE is 58.73 million kWh. Thus, λRER is as follows:
λRER = 58.7342/353.77 × 100% = 16.6%
Appendix D.2
Hosting-indicator calculation of the planning method in this paper in the planning year is as follows:
- (1)
- Power penetration rate
The maximum annual output power of all PVs is 75.97 MW. The maximum annual load in the park is 180.3 MW.
λPP = 75.97/180.3 × 100% = 42.13%
- (2)
- Capacity penetration rate
The annual maximum hourly electricity generation of DRE is 74,450 kWh. The annual maximum hourly electricity consumption of the load is 178,500 kWh.
λCP = 74,450/178,500 × 100% = 41.7%
- (3)
- Energy penetration rate
The annual electricity provided by DRE is 91.164 million kWh. The annual electricity consumption of the load is 985.63 million kWh.
λEP = 91.164/985.63 × 100% = 9.25%
- (4)
- Renewable energy ratio
The renewable energy ratio is calculated as follows:
Step 1: data preparation
According to data in Section 4.1.2, the 24 h load of a typical day in the park can be obtained as follows: [117.83 98.23 97.81 95.30 98.55 95.25 97.81 97.76 91.24 143.61 160.55 159.54 154.43 135.79 144.54 145.11 139.02 144.86 134.56 122.97 127.89 130.17 128.37 119.39].
DRE output of the park on a typical day: [0 0 0 0 0 0.03 6.85 25.76 48.96 47.55 60.48 62.37 56.10 60.03 74.11 75.94 53.22 30.43 15.1 3.62 0 0 0 0].
Net load of the park on a typical day: [117.83 98.23 97.81 95.30 98.55 95.22 90.96 72.00 42.28 96.06 100.07 97.17 98.33 75.76 70.43 69.17 85.80 114.43 119.46 119.35 127.89 130.17 128.37 119.39].
Output of the renewable energy power plant on a typical day: [75.50 74.24 59.41 57.84 59.47 58.31 50.94 37.20 37.81 12.23 14.74 19.48 25.40 38.22 46.71 28.34 20.91 22.05 17.88 13.6 15.80 29.16 54.92 78.28].
Due to page limitations, only the total annual electricity consumption of the load of 985.63 million kWh is listed; the annual load will no longer be listed.
Step 2: DR to make net load match with the output of the renewable energy power plant
According to Section 3.2, match the annual net load of 8760 h with the output of the renewable energy power plant, as users in the park respond to DR instructions by shifting the electricity consumption period. In this paper, the electricity consumption period of net load can be advanced or delayed for up to 3 h. For example, when the output of the renewable energy power plant is at its peak at 9:00, users shift the heaviest load between 6:00 and 12:00 to 9:00 to participate in DR.
To visually illustrate the matching effect, a curve is drawn using the net load on a typical day before and after matching as an example, as shown in Figure A4, with matching degree λMD = 0.93.

Figure A4.
Net load curve before and after matching with renewable energy.
From Figure A4, the net load is the smallest before matching at 9:00 am, and at 10:00, the output of renewable energy outside the park is the smallest. After matching, the minimum net load is moved to 10:00. Before matching, at 15:00, the output of renewable energy reaches its peak in nearly 10 h, while the load is the valley in nearly 8 h; after matching, the net load is the maximum in nearly two hours at 15:00.
Step 3: annual time sequence power flow simulation
PSS Cloud is used to simulate the power flow of Figure 6 for 8760 h throughout the year. The annual simulation results are summarized as follows:
- (1)
- Total annual output of PVs in the park is 9116.4 MWh;
- (2)
- Total annual output of WF D connected to the sub-transmission network is 277,950 MWh, and connected to the high-voltage transmission network it is 107,474 MWh;
- (3)
- Total annual output of WF C is 108,320 MWh;
- (4)
- Substation S1 transfers 2,205,166 MWh of electricity and supplies 532,503.72 MWh of electricity for the park;
- (5)
- Substation S2 supplies 260,711.88 MWh of electricity for the park.
Calculation of λRER is as follows:
According to the power flow tracing principle, electricity supplied by WF D that connected the sub-transmission network to the park is as follows:
532,503.72 × 277,950/2,205,166 = 67,119.40 MWh
The total green electricity includes the output of the PVs in the park, the output of WF D transmitted through the sub-transmission network and transmitted through the distribution network, the output of WF C, as well as green electricity from the power grid, and is calculated as follows:
9116.4 + 67,119.40 + 107,474 + 108,320 + (985,630 − 9116.4 – 67,119.40 – 107,474 – 108,320) × 0.33 = 520,917.87 MWh
The renewable energy ratio is calculated as follows:
λRER = 520,917.87/985,630 × 100% = 52.85%
Appendix D.3
The calculation of hosting indicators using the traditional planning method in the planning year is as follows:
The power grid structure of the park and surrounding area in the planning year using the traditional method is shown in Figure A5.

Figure A5.
Power grid structure of the park and surrounding area in the traditional method.
The calculations of λPP, λCP, λEP, and λPR are the same as those in Appendix D.2. The calculation of λRER is as follows:
PSS Cloud is used to simulate the power flow of Figure A5 for 8760 h. The annual simulation results are summarized as follows:
- (1)
- Total annual output of PVs in the park is 9116.4 MWh;
- (2)
- Total annual output of WF D is 370,600 MWh;
- (3)
- Total annual output of WF C is 108,320 MWh;
- (4)
- Substation S1 transfers 2,312,640 MWh of electricity to the park and supplies 608,327.72 MWh for the park;
- (5)
- Substation S2 supplies 260,711.88 MWh of electricity for the park.
According to the power flow tracing principle, the total electricity supplied by WF D to the park is as follows:
608,327.72 × 370,600/2,312,640 = 97,484.36982 MWh
The total green electricity includes the output of PVs in the park, the output of WF D transmitted through the 220 kV sub-transmission network, the output of WF C, as well as green electricity from the power grid, and is calculated as follows:
9116.4 + 97,484.37 + 108,320 + (985,630 − 9116.41 – 97,484.37 – 108,320) × 0.33 = 469,254.81 MWh
The renewable energy ratio is calculated as follows:
λRER = 469,254.81/985,630 × 100% = 47.60%
Appendix E
Appendix E.1
The renewable energy ratio calculation of the planning method in this paper at 14:00 on a typical day is as follows:
The power of green electricity supplied by WF C to the park is 22.63 MW. The power of green electricity supplied by WF D directly to the park is 10.14 MW, and the remaining part through substation S1 is as follows:
(5.3 + 8.08) × 30.42/(30.42 + 44.85) = 5.41 MW
The power of green electricity supplied by WF D to the park is as follows:
10.14 + 5.41 = 15.55 MW
Total power of green electricity supplied by WF C and WF D is as follows:
22.63 + 15.55 = 38.18 MW
The power from the power grid to the park through substation S1 is as follows:
(5.3 + 8.08) − 5.41 = 7.97 MW
The power transmitted from the grid to the park vis substation S1 and then to substation A and B is 49.71 MW and 48.21 MW, respectively. The green electricity supplied from the power grid to the park is as follows:
(7.97 + 49.71 + 48.21) × 33% = 34.93 MW
The total power of green electricity in the park is as follows:
38.18 + 34.93 = 73.11 MW
The renewable energy ratio of the park is as follows:
λRER = 73.1/(65.15 + 78.92) = 50.73%
Appendix E.2
The calculation of the renewable energy ratio using the traditional planning method at 4:00 PM on a typical day is as follows:
The power of green electricity supplied by WF C to the park is 22.63 MW. According to the power flow tracing principle, the green electricity supplied by WF D to the park via substation S1 is as follows:
(15.4 + 8.08) × 40.57/(40.57 + 44.85) = 11.15 MW
The total power of green electricity supplied by WF C and WF D to the park is as follows:
22.63 + 11.15 = 33.78 MW
The power from the power grid to the park through substation S1 is as follows:
(15.4 + 8.08) − 11.15 = 12.33 MW
The power supplied from the power grid through substation S2 to substations A and B is 49.71 kW and 48.21 MW, respectively. The power of green electricity from the power grid to the park is as follows:
(12.33 + 49.71 + 48.21) × 33% = 36.38 MW
The total power of green electricity in the park is as follows:
33.78 + 36.38 = 70.16 MW
The renewable energy ratio of the park is as follows:
70.16/(65.15 + 78.92) = 48.69%
References
- Haegel, N.; Kurtz, S. Global Progress Toward Renewable Electricity: Tracking the Role of Solar. IEEE J. Photovolt. 2021, 11, 1335–1342. [Google Scholar] [CrossRef]
- Vierth, I.; Ek, K.; From, E.; Lind, J. The cost impacts of fit for 55 on shipping and their implications for Swedish freight transport. Transp. Res. Part A Policy Pract. 2024, 179, 103894.1–103894.13. [Google Scholar] [CrossRef]
- Hulle, F.V.; Tande, J.O.; Uhlen, K.; Warland, L.; Völker, J. Analysis of 2030 Large-Scale Wind Energy Integration in the Eastern Interconnection Using WINS. Electr. J. 2011, 24, 71–87. [Google Scholar] [CrossRef]
- Du, E.; Zhang, N.; Hodge, B.M.; Wang, Q.; Kang, C.; Kroposki, B.; Xia, Q. The Role of Concentrating Solar Power Toward High Renewable Energy Penetrated Power Systems. IEEE Trans. Power Syst. 2018, 33, 6630–6641. [Google Scholar] [CrossRef]
- Cicilio, P.; Cotilla-Sanchez, E.; Vaagensmith, B.; Gentle, J.P. Transmission Hosting Capacity of Distributed Energy Resources. IEEE Trans. Sustain. Energy 2021, 12, 794–801. [Google Scholar] [CrossRef]
- Xiao, J.; Wang, C.; She, B.; Li, F.; Bao, Z.; Zhang, X. Total supply and accommodation capability curves for active distribution networks: Concept and model. Int. J. Elec. Power 2021, 133, 107279. [Google Scholar] [CrossRef]
- Wu, H.; Yuan, Y.; Zhu, J.; Xu, Y. Assessment Model for Distributed Wind Generation Hosting Capacity Considering Complex Spatial Correlations. J. Mod. Power Syst. Clean Energy 2022, 8, 1194–1206. [Google Scholar] [CrossRef]
- Liu, J.; Chiang, H.-D. Maximizing available delivery capability of unbalanced distribution networks for high penetration of distributed generators. IEEE Trans. Power Deliv. 2017, 32, 1196–1202. [Google Scholar] [CrossRef]
- Santos, B.L.M.; Barros, L.S.; Moreira, F.A.; Barbosa, D. Hosting capacity maximization of distributed energy resources through simultaneous optimized volt–var curve and network reconfiguration. Electr. Power Syst. Res. 2024, 234, 110743. [Google Scholar] [CrossRef]
- Fu, Y.Y.; Chiang, H.D. Toward optimal multiperiod network reconfiguration for increasing the hosting capacity of distribution networks. IEEE Trans. Power Deliv. 2018, 33, 2294–2304. [Google Scholar] [CrossRef]
- Sahu, S.K.; Ghosh, D. Hosting capacity enhancement in distribution system in highly Trenchant Photo-Voltaic Environment: A Hardware in Loop Approach. IEEE Access 2020, 8, 14440–14451. [Google Scholar] [CrossRef]
- Dominguez, O.D.M.; Mantovani, J.R.S.; Kasmaei, M.P.; Lehtonen, M. Increasing distributed generation hosting capacity in distribution networks: A CO2 emission analysis. In Proceedings of the 2020 IEEE PES Innovative Smart Grid Technologies Europe (ISGT-Europe), IEEE, Hague, The Netherlands, 26–28 October 2020. [Google Scholar] [CrossRef]
- Rahman, M.; Arefi, A.; Shafiullah, G.M.; Hettiwatte, S. A new approach to voltage management in unbalanced low voltage networks using demand response and OLTC considering consumer. Int. J. Electr. Power Energy Syst. 2018, 99, 11–27. [Google Scholar] [CrossRef]
- Long, C.; Ochoa, L.F. Voltage control of PV-rich LV networks: OLTC-fitted transformer and capacitor banks. IEEE Trans. Power Syst. 2016, 31, 4016–4025. [Google Scholar] [CrossRef]
- Asano, M.; Wong, F.; Ueda, R.; Moghe, R.; Tholomier, D. On the interplay between svcs and smart inverters for managing voltage on distribution networks. In Proceedings of the 2019 IEEE Power Energy Society General Meeting (PESGM), Atlanta, GA, USA, 4–8 August 2019; pp. 1–5. [Google Scholar] [CrossRef]
- Son, Y.J.; Lim, S.H.; Yoon, S.G.; Khargonekar, P.P. Residential Demand Response-Based Load-Shifting Scheme to Increase Hosting Capacity in Distribution System. IEEE Access 2022, 10, 18544–18556. [Google Scholar] [CrossRef]
- Wang, B.; Zhang, C.; Dong, Z.; Li, X. Improving hosting capacity of unbalanced distribution networks via robust allocation of battery energy storage systems. IEEE Trans. Power Syst. 2021, 36, 2174–2185. [Google Scholar] [CrossRef]
- Park, S.W.; Cho, K.S.; Hoefter, G.; Son, S.Y. Electric vehicle charging management using location-based incentives for reducing renewable energy curtailment considering the distribution system. Appl. Energy 2022, 305, 117680. [Google Scholar] [CrossRef]
- Rad, H.K.; Moravej, Z. An approach for simultaneous distribution, sub-transmission, and transmission networks expansion planning. Int. J. Electr. Power Energy Syst. 2017, 91, 166–182. [Google Scholar] [CrossRef]
- Carlini, E.M.; Gadaleta, C.; De Cesare, A.; Migliori, M.; Giordano, C.; Moroni, S. The new 36 kV standard voltage level to increase RES penetration in sub-transmission network. In Proceedings of the 2022 AEIT International Annual Conference (AEIT), Rome, Italy, 3–5 October 2022; pp. 1–6. [Google Scholar]
- Tang, Z.; Hill, D.J.; Liu, T. Two-stage voltage control of sub-transmission networks with high penetration of wind power. Control Eng. Pract. 2017, 62, 1–10. [Google Scholar] [CrossRef]
- Cruz, M.; Adriana, Y.; Sanchez, C.; Francy, M.; Reis, L.B. Analysis of sub-transmission networks with distributed generation. In Proceedings of the 2013 International Conference on Renewable Energy Research and Applications (ICRERA), Madrid, Spain, 20–23 October 2013; p. 10721077. [Google Scholar] [CrossRef]
- Nguyen, Q.; Ke, X.; Samaan, N.; Holzer, J.; Elizondo, M.; Zhou, H.; Huang, H.R.; Vallem, M.; Vyakaranam, B. Transmission-distribution long-term volt-var planning considering reactive power support capability of distributed PV. Int. J. Electr. Power Energy Syst. 2022, 138, 107955. [Google Scholar] [CrossRef]
- Zohuratar, M.; Aghaei, J.; Niknam, T.; Nikoobakht, A. Expansion planning of automated sub-transmission and distribution networks integrated by distributed generations. Sci. Iran. 2022, 29, 645–659. [Google Scholar] [CrossRef]
- Liu, J.; Cheng, H.; Zeng, P.; Yao, L.; Shang, C.; Tian, Y. Decentralized stochastic optimization based planning of integrated transmission and distribution networks with distributed generation penetration. Appl. Energy 2018, 220, 800–813. [Google Scholar] [CrossRef]
- Rabiee, A.; Keane, A.; Soroudi, A. Enhanced transmission and distribution network coordination to host more electric vehicles and PV. IEEE Syst. J. 2022, 16, 2705–2716. [Google Scholar] [CrossRef]
- Liu, X. Research on dimension reduction for visualization of simplified security region of integrated energy system considering renewable energy access. Int. J. Electr. Power Energy Syst. 2024, 156, 109777. [Google Scholar] [CrossRef]
- DL/T 5729-2016; The Guide for Planning and Design of Distribution Network. Electric Power Press: Beijing, China, 2016.
- GB 50797-2012; Code for Design of Photovoltaic Power Station. Standards Press of China: Beijing, China, 2012.
- NB/T 31003-2011; Design Regulations for Large-Scale Wind Power Connecting to the System. China Electric Power Press: Beijing, China, 2011.
- Cheng, D.; Mather, B.A.; Seguin, R.; Hambrick, J.; Broadwater, R.P. Photovoltaic (PV) Impact Assessment for Very High Penetration Levels. IEEE J. Photovolt. 2015, 6, 295–300. [Google Scholar] [CrossRef]
- Sun, Y.; Ma, X.; Wang, Y.; Cai, W.; Dong, G.; Chen, Y. Research on Peak Shaving Strategy Based on Green Power Supply in Industrial Parks. In Proceedings of the 2023 International Conference on Power System Technology (PowerCon), Jinan, China, 21–22 September 2023; pp. 1–7. [Google Scholar] [CrossRef]
- Wang, R.; Lin, W.; Zhou, Z.; Chen, B. Feasibility verification of green-power-supplied industrial parks considering peak shaving performances. Energy Rep. 2023, 9, 368–372. [Google Scholar] [CrossRef]
- Barcia, P.; Rui, P. Tracing the flow of electricity. Int. J. Electr. Power Energy Syst. 2010, 32, 329–332. [Google Scholar] [CrossRef]
- Najafi, A.; Pourakbari Kasmaei, M.; Contreras, J.; Lehtonen, M.; Leonowicz, Z. Optimal Bilevel Operation-Planning Framework of Distributed Generation Hosting Capacity Considering Rival DISCO and EV Aggregator. IEEE Syst. J. 2022, 9, 5023–5034. [Google Scholar] [CrossRef]
- Mnatsakanyan, A.; Kennedy, S.W. A novel demand response model with an application for a virtual power plant. IEEE Trans. Smart Grid. 2014, 6, 230–237. [Google Scholar] [CrossRef]
- Cotilla-Sanchez, E.; Hines, P.D.H.; Barrows, C.; Blumsack, S.; Patel, M. Multi-attribute partitioning of power networks based on electrical distance. IEEE Trans. Power Syst. 2013, 28, 4979–4987. [Google Scholar] [CrossRef]
Disclaimer/Publisher’s Note: The statements, opinions and data contained in all publications are solely those of the individual author(s) and contributor(s) and not of MDPI and/or the editor(s). MDPI and/or the editor(s) disclaim responsibility for any injury to people or property resulting from any ideas, methods, instructions or products referred to in the content. |
© 2025 by the authors. Licensee MDPI, Basel, Switzerland. This article is an open access article distributed under the terms and conditions of the Creative Commons Attribution (CC BY) license (https://creativecommons.org/licenses/by/4.0/).