Abstract
The lithium-ion cell model is the heart of the battery management system—a more accurate model ensures operational safety, extends pack lifetime, and provides better tracking of battery charge and health. Catalyzed by the automotive industry’s shift towards electrification, optimal parameterization of the lithium-ion cell is of crucial importance. Two dominant methods of direct parameterization have emerged in the literature as the standard for parameter extraction of a lithium-ion equivalent circuit cell model. A direct comparison of their performance and suggestion as to the optimal method of cell parameterization has not yet been proposed; Thus, this paper aims to extract the optimal parameter set regarding the two dominant direct methods with an electrochemically based logic, compare the accuracy of cell parametrization over two transient load profiles, and ultimately suggest which method is preferable for electric vehicle applications. Additionally, this work will be conducted over multiple C-rates to quantify the robustness of each direct method of parameterization over a transient load profile.
1. Introduction
Over the last 40 years, carbon dioxide emissions have doubled in volume, leading to a direct increase in global warming and its associated consequences—climate shifts, poorer air quality, and sea level rise [1]. One of the primary contributors to these increased levels of emissions is the transportation industry, estimated to account for 23% of all greenhouse gas emissions, placing second in contribution to only that of the industrial sector [2]. As a result, the transportation industry is undergoing a significant transition toward electrification and renewable energy solutions, with a preference for highly efficient battery-powered electric vehicles over conventional internal combustion engines.
Of critical importance in spearheading the shift toward an electrified automotive market is the vehicle’s energy storage system, also known as the battery pack. Consumers consistently list range anxiety as one of the primary deterrents to purchasing an electric vehicle [3], underscoring the requirement for both satisfactory range performance and accurate tracking of available vehicle energy. In the present moment, the lithium-ion battery has emerged as the most suitable candidate to meet the hardware demands of the EV market—it boasts the highest energy density, negligible memory effects, low self-discharge, excellent cycle life, and exceptional thermal stability [4]. However, the lithium-ion cell is sensitive to the undervoltage and overvoltage conditions; pushing the cell to these limits is associated with enhanced degradation, damage, and even self-ignition in the worst-case scenario [5].
The importance of having accurate battery management software, more specifically an accurate cell model, is thus paramount to the success of the electric vehicle. The cell model is the basis for all BMS control algorithms and is directly responsible for the accuracy of state of charge, state of health, and remaining useful life estimation in conventional control systems [6]. At the same time, in the transient condition, the cell model has the duty of ensuring that the thermal and electrical operating limits of the cell are not violated. Thus, the safety and range reliability of the electric vehicle directly hinge upon the accuracy of the cell model parameters.
The dominant model in battery management systems is the equivalent circuit cell model (ECM), most commonly represented by the dual polarization (DP) model. It is computationally light while providing high estimation accuracy, making it the ideal candidate for real-time deployment. The dual polarization model provides an abstraction of cell behavior and is composed of a voltage source connected in series with a resistance and two parallel resistive-capacitive (RC) branches. The voltage source models the open circuit potential of the cell, the series resistance being the total resistance of the cell due to contacts, electrodes, and electrolyte, while the two RC pairs are used to model the resistance and diffusion of the cell in response to charging or discharging [7].
The standard procedure for determining the parameters of the ECM consists of perturbing the battery with a given current profile and observing the output voltage response. One-shot fitting methods attempt to find optimal parameters that minimize the error between the ECM’s prediction of the voltage and the entire measured voltage response of the cell; this can include using a particle swarm algorithm [8], a genetic algorithm [9], or some kind of filtering technique. However, this one-shot fit can be problematic—Model parameters can lose any physical relation to the underlying cell phenomena and instead are extracted to simply minimize residual error. Proper bounding of the parameters is also challenging; the entire voltage response can take any arbitrary curve, making finding a parameter range to guarantee model convergence more difficult. Furthermore, given that the parameters are extracted to minimize the fit to a given voltage profile without a necessary physical basis, parameters risk running into an area of overfitting, implying good performance for profiles similar to the fitting profile but worse performance for all others.
Thus, the dominant and preferable method in the literature for parameter extraction is a direct measurement method through the pulse discharge (PD) profile, breaking the voltage response of the cell into many digestible exponential sections rather than a one-shot approach. Commonly, the PD is performed, a curve fitting is applied, and parameters are extracted [10] using formulas derived from the DP model. Two direct methods of parameter extraction have emerged as the most utilized in the literature, one which compensates for the capacitive behavior of the cell’s voltage response, and one that does not, but a deep analysis as to their effect on model accuracy and performance is yet to be considered.
The novelty of this paper is thus to determine whether this capacitive compensation is necessary and perform the first comparison between the two dominant direct methods of parameterization—specifically, whether capacitive compensation yields superior transient performance for EV application loads, and if it is the preferred method of parameter extraction. This will be concluded by observing the resulting model accuracy and performance regarding the transient condition using multiple different load profiles. Additionally, the most current literature regarding parameter extraction considers the variance of parameters with regard to state of charge or temperature [11], but is performed at a single current rating, meaning that the effects of current on parameter extraction are somewhat overlooked. The paper will also contrast the performance of the two methods of parameterization given multiple C-rates and ultimately suggest the optimal method of parameterization for an ECM with electric vehicle applications in mind.
This will be accomplished by first introducing the fundamental equations of the ECM, reviewing the derivations from which the direct methods of parameterization obtain their basis, and clarifying existing literature. Then, the mandatory tests for parameterization and experimental data collection will be presented. Finally, transient cycle results will be displayed, prompting a comparison of the two methods performance at multiple C-rates, ultimately concluding with a suggestion as to how to obtain the optimal parameter set for the ECM and whether this capacitive compensation is necessary.
2. 3-RC Thevenin Equivalent Circuit Model
2.1. Equivalent Circuit Model Structure for Parameterization
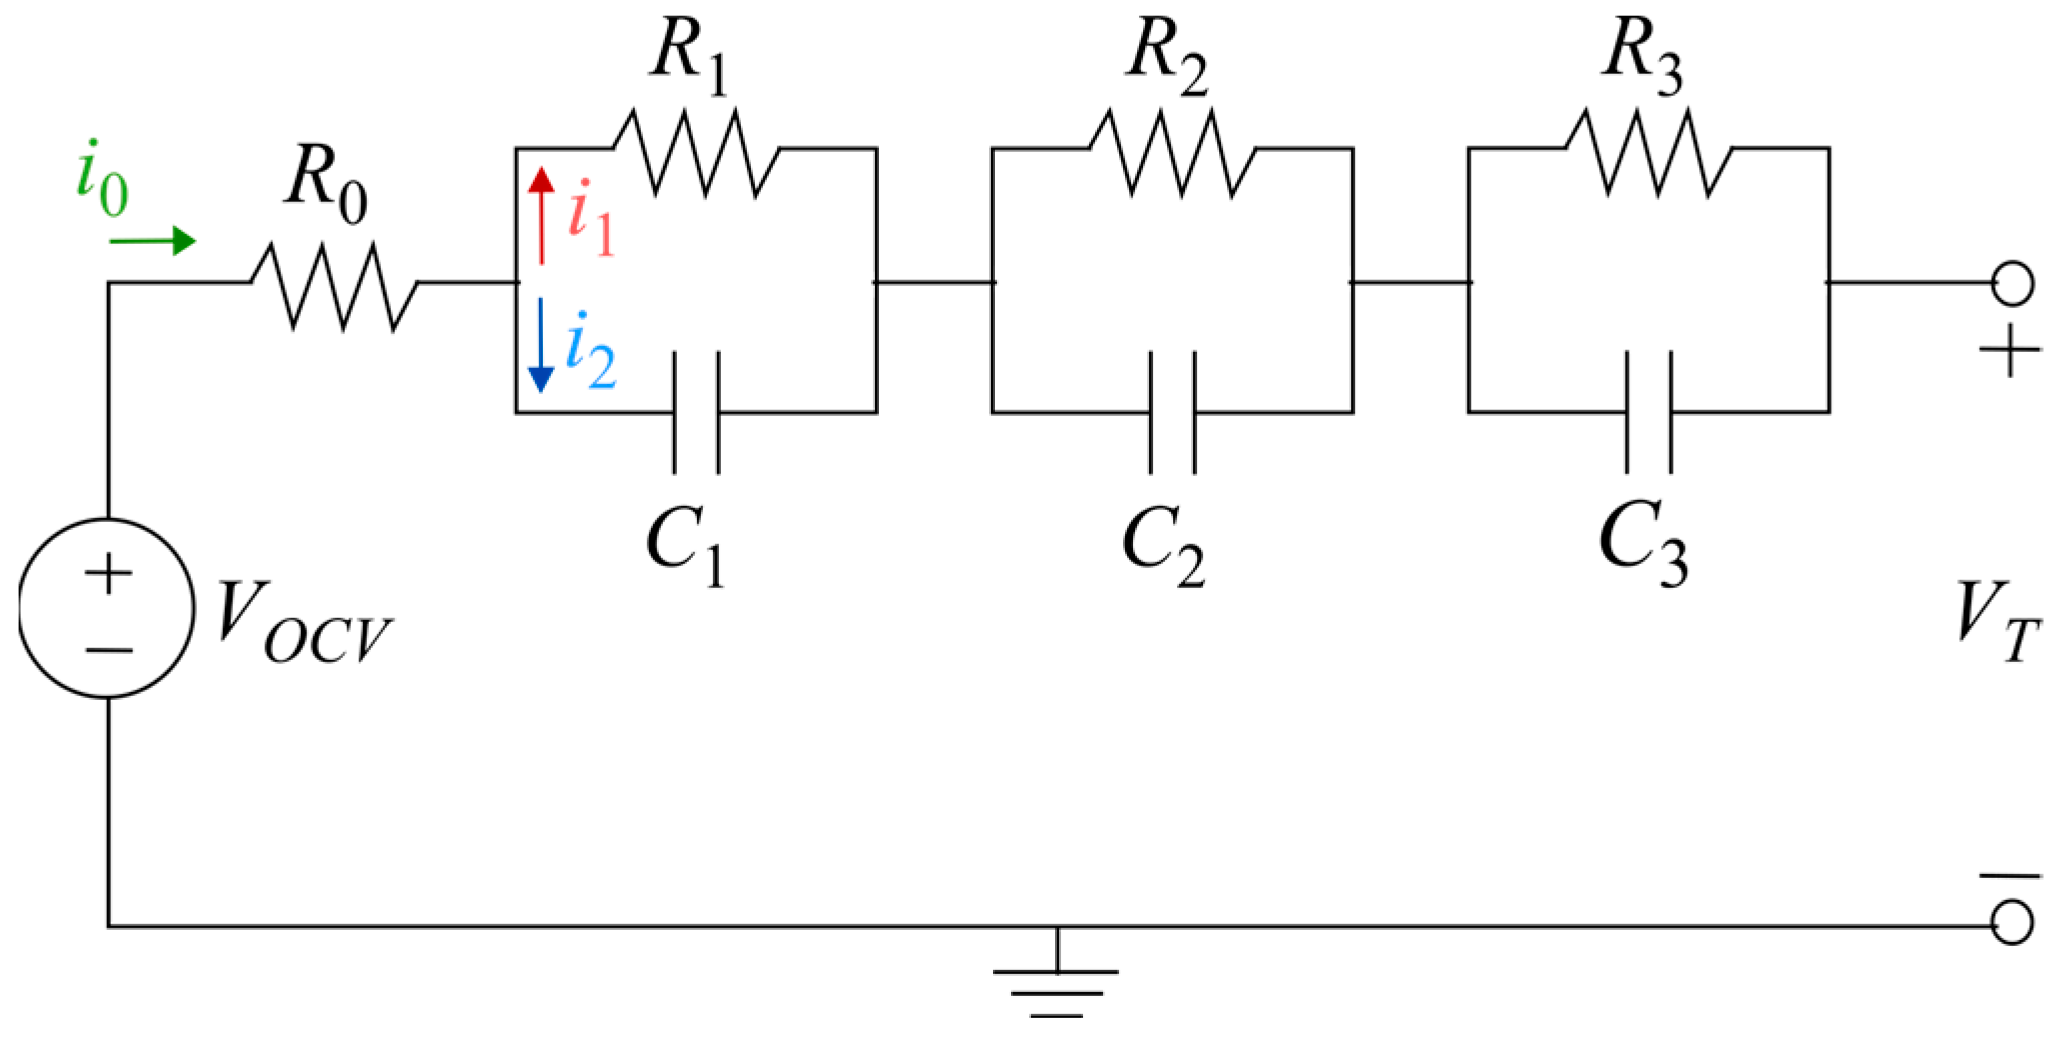
One of the most crucial elements in determining the tracking accuracy of the ECM is the number of parallel RC pairs. Generally, increasing the number of parallel pairs will increase model accuracy, as an infinite number of RC pairs better approximates the Warburg impedance of the cell, albeit at the expense of a greater computational burden [12,13,14]. The aim of the work in this paper, however, is to perform benchmarking on an ECM that produces suitable voltage tracking for both a fresh battery and an aged cell. As suggested in [15], the minimum number of RC time constants required to sufficiently describe the voltage response of an aged cell is three, increasing to as many as five as the cell deteriorates and additional interfaces are formed. Thus, the chosen model is an ECM with three parallel branches, as shown in Figure 1, with a goal of parameterizing the model in relation to key interfaces of the impedance spectrum of the cell.
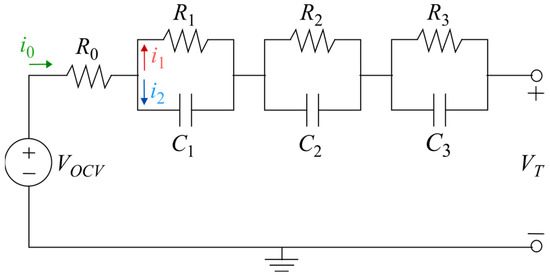
Figure 1.
3-RC-equivalent circuit cell model.
From the ECM chosen, the terminal voltage, Vt, is the subtraction of the series resistive drop, I0R0, and parallel branch voltage drops, VRnCn, from the open circuit voltage, VOCV (1).
Considering only the first parallel RC branch and the junction where the cell current I0 splits into I1 and I2:
Substituting (4) into (3) yields the differential equation in the form (5):
Solving (5) during cell discharge, but capacitive charge yields the solution (6):
where VR1C1 has replaced VC1, given that the voltage across the RC pair must be equal to the voltage across the capacitor. During moments of cell relaxation, the current I0 goes to zero, but capacitive discharge now occurs, yielding the solutions (7) to (5):
This can then be abstracted to (8) for “n” number of parallel RC branches in relaxation, with (9) describing the terminal voltage response:
Examining (7) and (8), several important conclusions can be drawn. The voltage response in relaxation is described by the exponential Equation (9), and any optimization technique can be used to fit this equation to the relaxation regions of the pulse discharge profile, which will be discussed in further detail in the next section. The parameter, an, represents the initial voltage of the capacitor when entering relaxation, while bn represents the time constant of the RC circuit.
2.2. Unscaled Parameter Set Extraction
From this point, a commonly used approach of parameter extraction is to assume that the parallel branch resistance, Rn, must be equal to the parallel branch voltage at the moment of relaxation, an, divided by the entire current magnitude that the pulse discharge test occurs at, I0 [11,16,17,18,19]. This gives rise to the following (10):
2.3. Capacitive Compensation for RC Links, Scaled Parameter Set
Method 1 of parameter extraction assumes that all the pulse discharge current, I0, is passing through the resistor the moment relaxation begins. If the ECM parallel branch capacitances are sufficiently high, then during cell discharge, the model capacitors may not fully charge, implying that a portion of the pulse discharge current should be flowing through the parallel capacitance. Thus, simply dividing (6) by the parallel branch resistance in (4) yields the hypothetically true proportion of current that would flow to the parallel branch resistance in (11) at the moment of relaxation.
where the time, tp, denotes the time pulse and represents the number of seconds spent in constant current pulse discharging, yielding the following (12):
This method of parameterization is also commonly used to relate the fitted constants of the pulse discharge curve, an and bn, to the physical parameters of the ECM [10,14,20,21]. Analyzing (12), the additional inclusion of the exponential scaling term causes the parallel resistance to increase, while causing a corresponding decrease in capacitance. The time constants in both methods, however, do not change. This means that one can expect the parameter set obtained in Method 2 to cause larger immediate voltage drops due to the dominant I0R1 term in (6), but also return to a lower voltage magnitude during relaxation at the same point in time relative to Method 1. A further observation to note is that the lower the current rating (C-rate) at which the pulse discharge test is performed, the closer the parameter set extracted from Method 2 approaches that of Method 1. The longer the constant current pulse, the smaller the exponential scaling term becomes, and the parallel branch resistor receives a larger proportion of the pulse discharge current prior to relaxation. Thus, one can expect that the deviation in transient performance is a minimum when using a parameter set extracted at a low C-rate, but higher when considering a pulse discharge test with a higher current rating.
3. ECM Parameterization
3.1. Experimental Testbench Development
A testbench was designed to control the discharge of the LG M50T NMC-811 cell. The LG M50T cell has a capacity of 5 Ah and a maximum allowable current limit of 1.5C, or 7.5 A, with a voltage between 2.5 and 4.2 V [22]. The scope of this paper focuses only on the discharge parameterization of the cell; thus, a Chroma 63204 programmable DC load was used to automate cell discharge according to the desired current profile. The Chroma 63204 has a current rating of 0–10 A at 2.5–500 V with a resolution accuracy of 0.1%. Serial commands were sent to the load from the host computer, and current and voltage values were queried back at a sampling interval of 0.25 s via RS232 communication. All data logging and serial communication were performed in MATLAB 2024b. To further ensure the accuracy of data collection, a secondary set of measurements was taken; a LEM LTS 6-NP hall sensor was used for current sensing, while a voltage divider with two high-accuracy resistors was used for voltage measurements. The measurements were again sampled at a 0.25 s interval and logged on the host computer. Post data collection, the voltage and current from both sensing sources were compared against one another, having an average deviation of 0.34% and 0.41%, respectively. This discrepancy between the two methods of data collection is negligible and ensures the collected data is representative of cell behavior. The full test bench is illustrated in Figure 2.

Figure 2.
Experimental test bench. (a) Schematic. (b) Experiment in progress.
3.2. Pulse Discharge Protocol
Lithium-ion cells exhibit a strong polarization behavior that significantly changes depending on the state of charge of the cell. The pulse discharge test is designed to capture the dynamic behavior of the cell over the entire usable discharge range, and is summarized as follows [23]:
- Charge the cell to full capacity and let it rest for voltage and current stabilization.
- Apply a pulse of current for “t” seconds to remove 2% of the SOC per pulse and let the cell rest for one hour between pulses. Repeat this process a total of 10 times. At this point, 20% of the SOC should be removed.
- Apply a pulse of current for “t” seconds to remove 5% of the SOC per pulse and let the cell rest for one hour between pulses. Repeat this process a total of 12 times. At this point, 80% of the SOC should be removed.
- Repeat step (2) until the remaining 20% of the SOC is discharged.
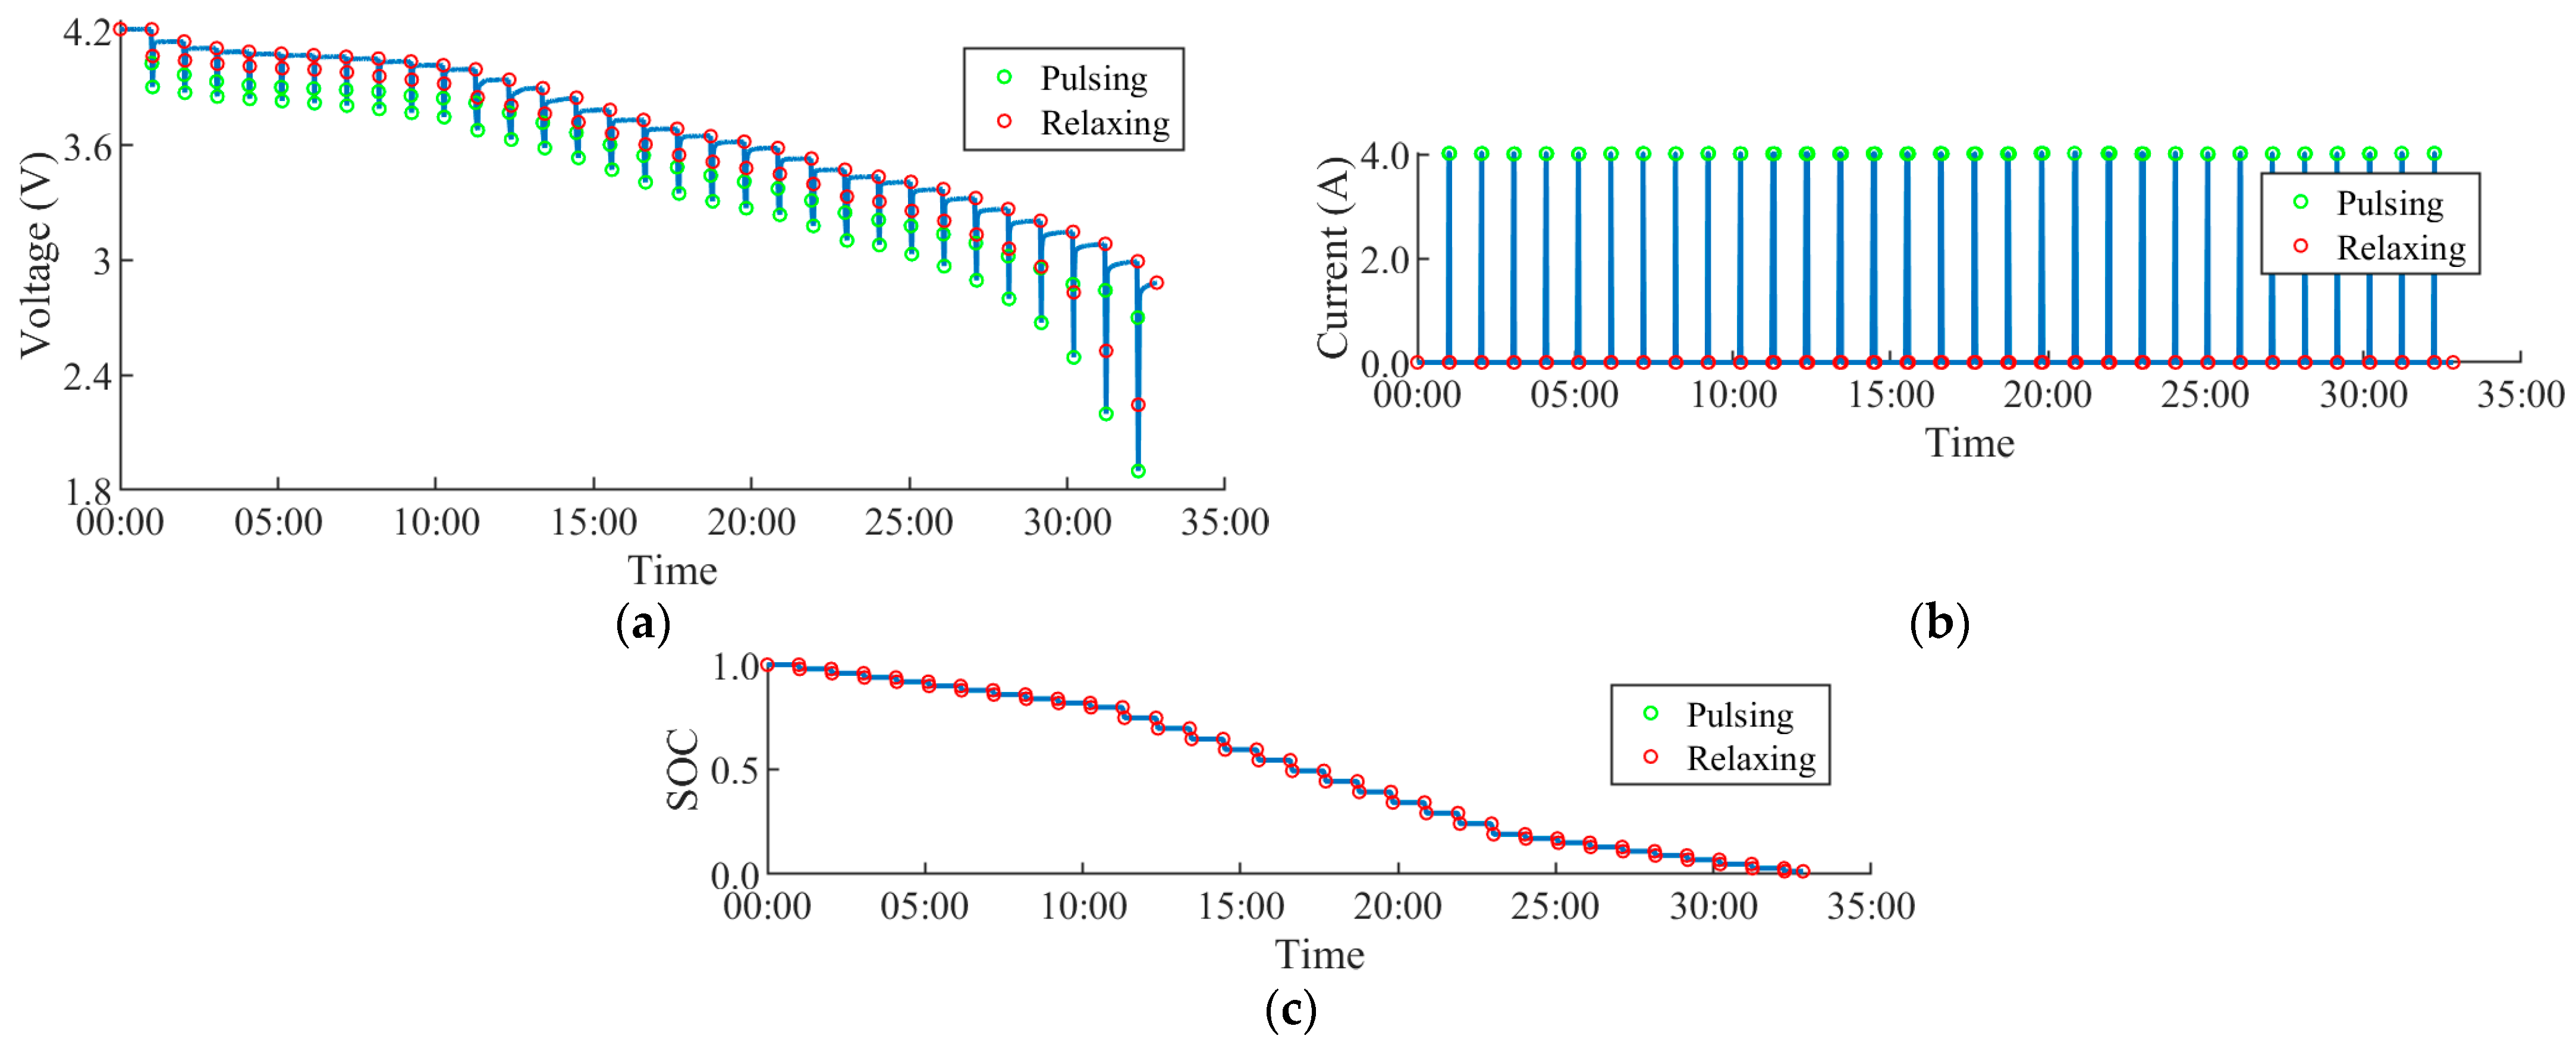
The pulse discharge protocol was applied to the LGM 50T cell, with the full response of the cell captured in Figure 3. One of the additional objectives of this paper is to investigate the degree to which the C-rate of characterization affects the transient performance of the cell. As such, the pulse discharge test was performed at 3 different C-rates: 0.5C, 0.8C, and 1C. Table 1 summarizes relevant information about the testing protocols.
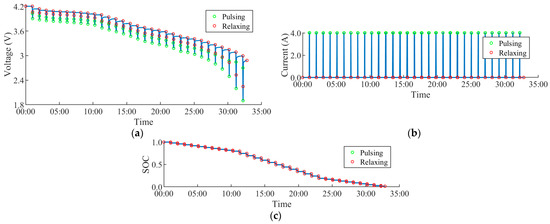
Figure 3.
Pulse discharge of LGM-50T cell. (a) Voltage. (b) Current. (c) SOC.

Table 1.
Time spent in pulse discharge per C-Rate and SOC step size.
4. Parameter Extraction and Model Development
4.1. Parameter Set Development
To produce a suitable model parameterization, the moments of cell relaxation must be extracted from the PD profile. During relaxation, the SOC of the cell remains constant, and the internal dynamics inside the cell cause an observable voltage response. This can primarily be attributed to the gradient in lithium-ion concentration during discharge—the lithium ions begin to diffuse from the lithium-carbon anode to the lithium metal cathode and intercalate into the cathode. The rate of intercalation, however, is often slower than the rate of deintercalation, and a dense region of lithium ions builds up between the separator and cathode. At the same time, the ion-rich anode also has a dense region of lithium ions being emitted, resulting in an ion gradient within the cell. When the load current is removed, some of the lithium ions intercalate into the cathode, some react with the electrolyte to form unwanted byproducts, and some undergo back diffusion to restore the cell to its natural state [24]. This is associated with a corresponding slow exponential increase in voltage, allowing cell dynamics over a short or long period to be accurately modeled with a fitted curve to the relaxation response.
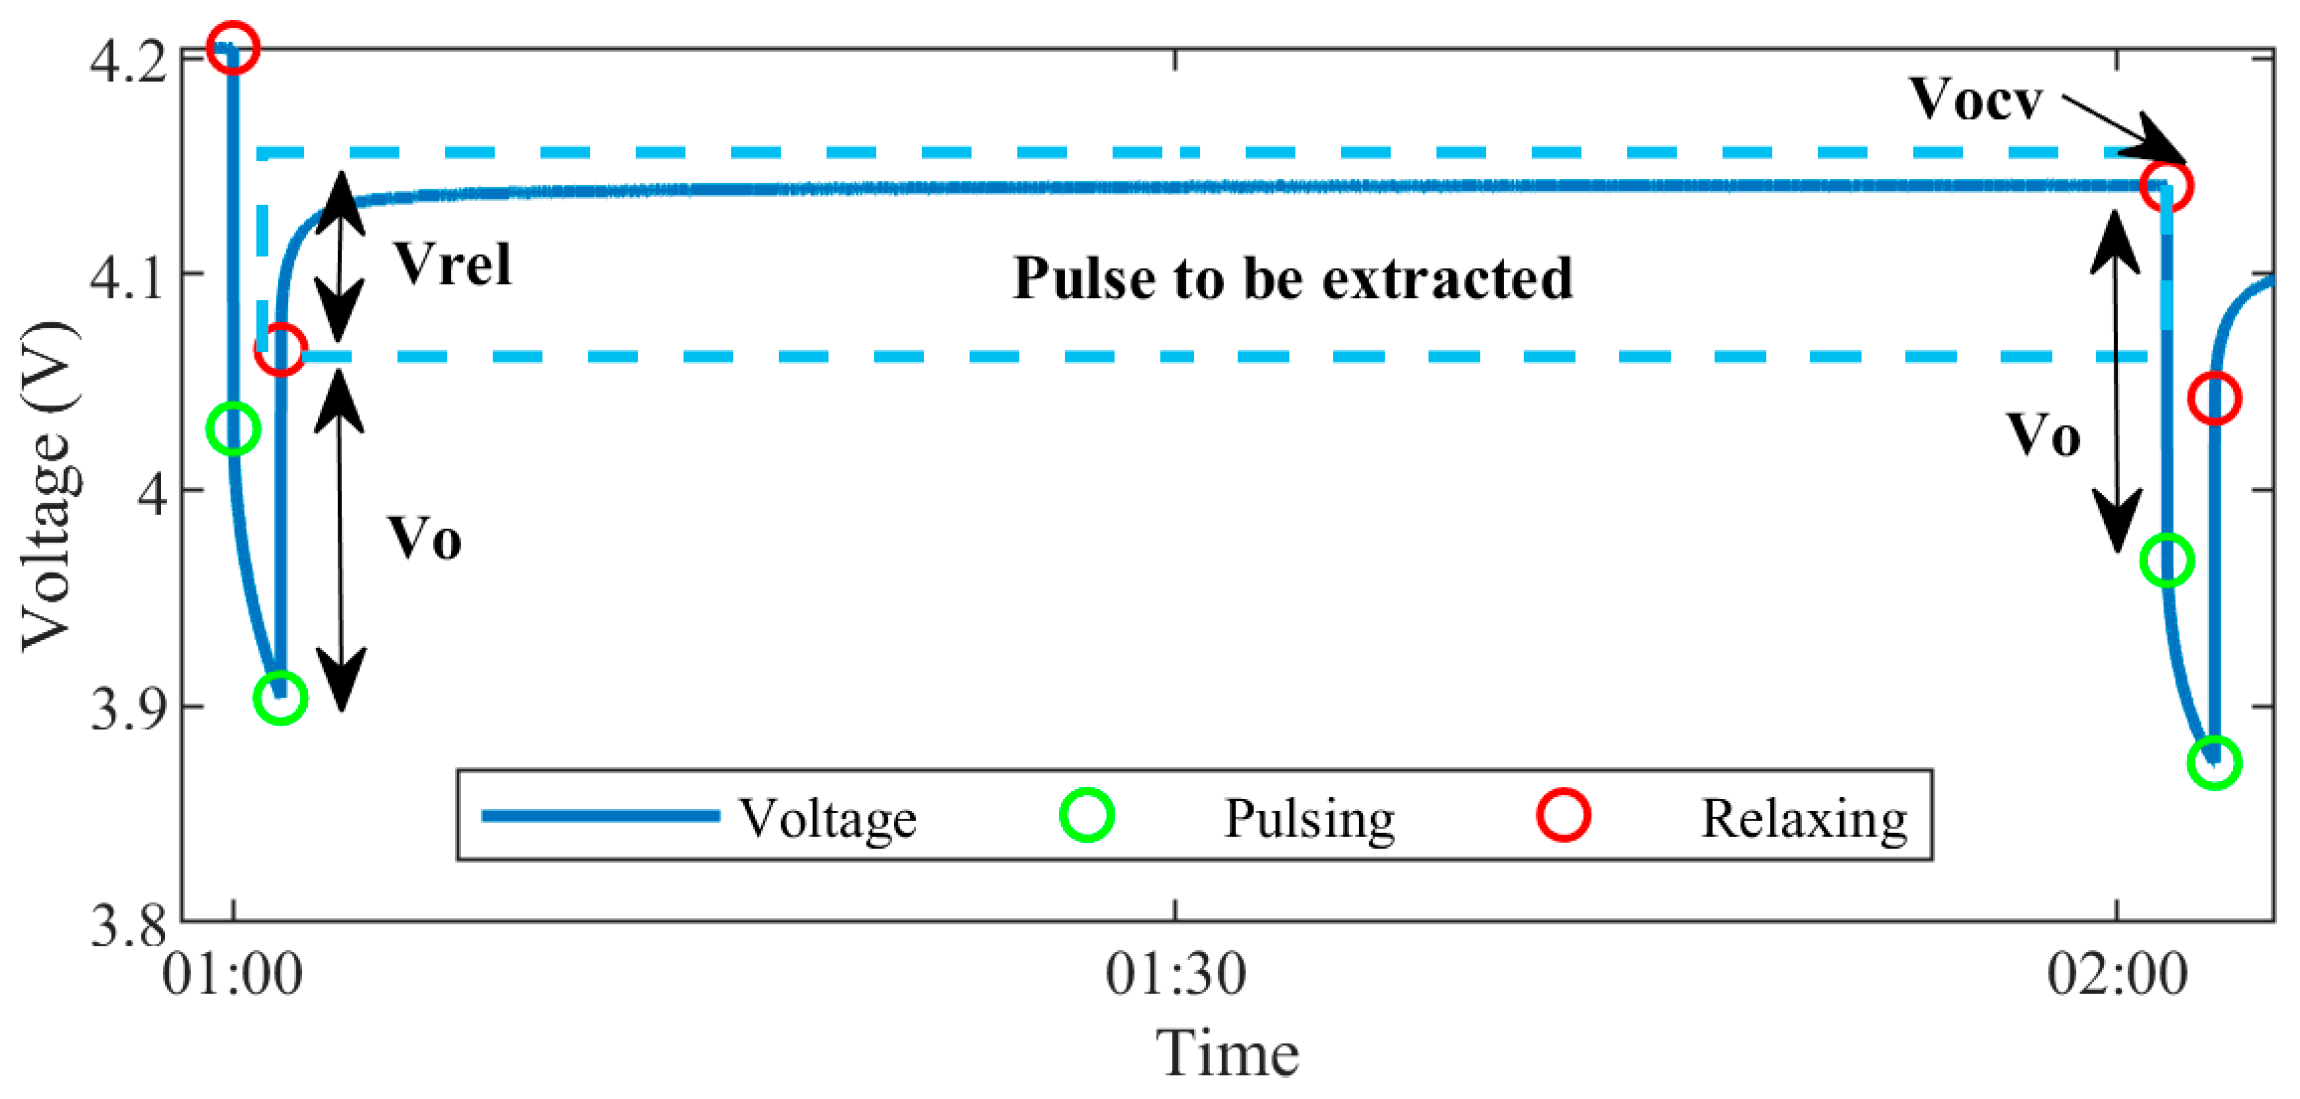
Cell dynamics are most volatile at the upper and lower end of the SOC, where the lithium ions first begin diffusion or are near depletion—thus, the pulse discharge protocol proceeds in smaller SOC steps towards the upper and lower end of the range. Decreasing the step size further would increase model accuracy, at the expense of greatly increasing testing time. Hence, 2% and 5% steps are chosen as a comfortable compromise, giving 32 total SOC breakpoints. The load profile was used to identify points where the current transitioned from low to high, and high to low, being designated as pulsing points. Relaxing points were identified in between these pulsing regions, and each region of relaxation with voltage magnitude, Vrel, was parsed as in Figure 4.
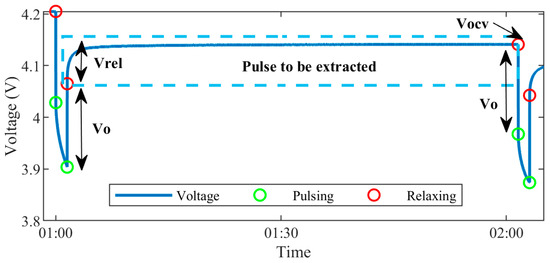
Figure 4.
First voltage pulse extracted for parameterization.
The ECM parameters were extracted in the following manner: The open circuit voltage, VOCV, was taken as the second relaxing point per pulse, the moment at which the cell voltage had stabilized. The series resistive drop of the cell was approximated by the instantaneous voltage drop, V0, divided by the magnitude of the pulse discharge current, I0 in (13).
Finally, as per Figure 4, the region between the two relaxation points was extracted, and (14) was fit to the curve using a nonlinear least squares optimization (15) and (16). The results of the fitting relative to the extracted pulse are shown in Figure 5.
where c is the open circuit voltage per relaxation pulse, Vt* is the predicted terminal voltage at a particular instance in time, k, Vt is the true terminal voltage from the PD, Ψ is the cost function to minimize, and m is the number of datapoints in a single voltage relaxation.

Figure 5.
Fitting produced given system constraints. (a) First voltage pulse. (b) Mid-range voltage pulse. (c) End of test voltage pulse.
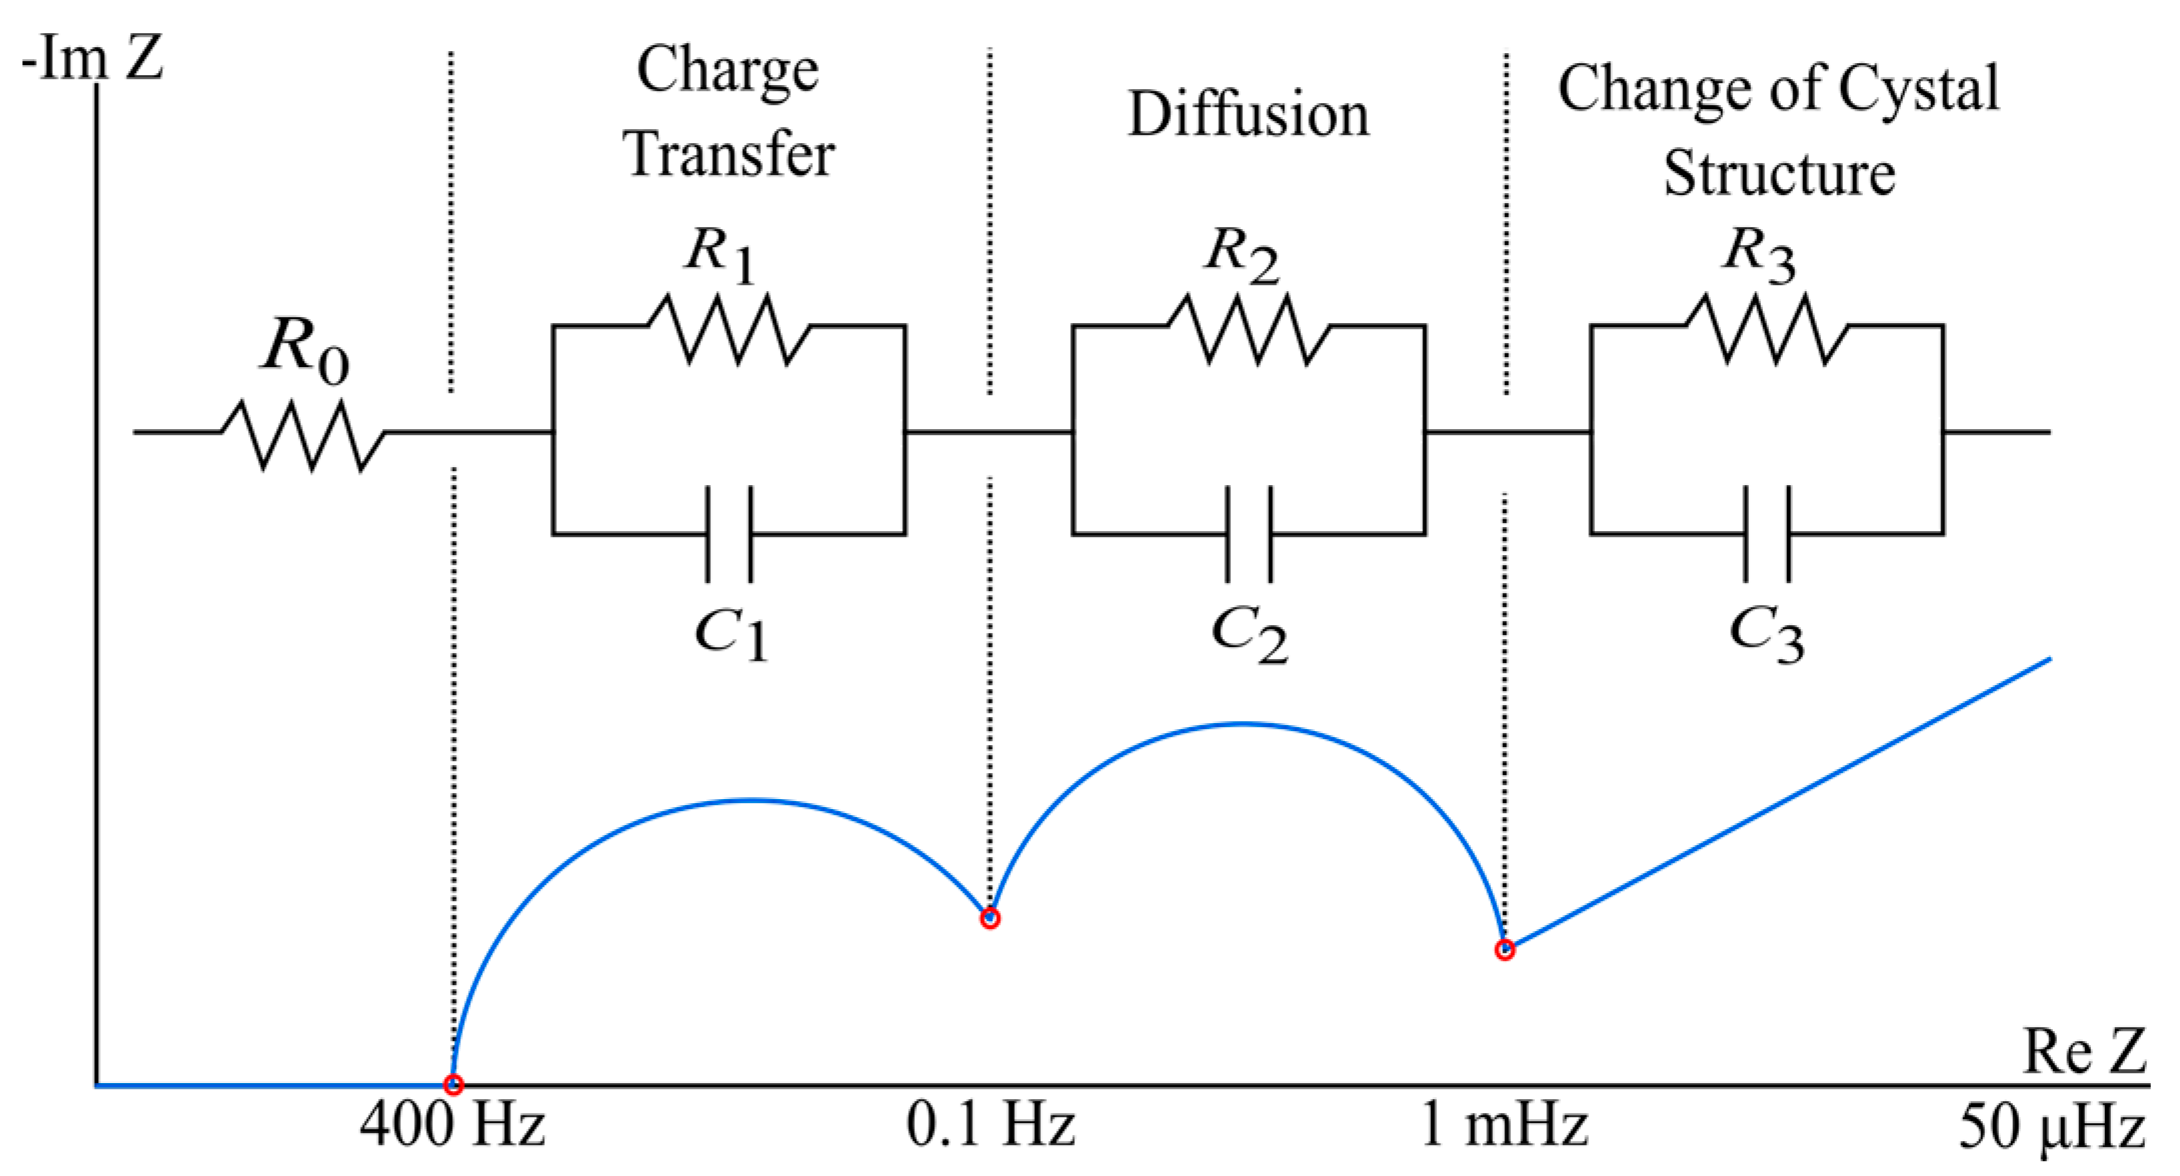
Of particular importance when performing the curve fitting is to ensure proper bounding of the parallel branch time constants. Many sources in the literature overlook this but relating the curve fit to the impedance spectrum of the cell can assist in proper bounding of parameters—delivering a model that more accurately portrays the dynamics of the cell. This approach is often employed when calculation-based extraction of time constants is performed [10,21,25] but has not yet been used for a curve fitting approach and will be applied in this paper for optimal parameter set extraction.
As seen in Figure 6, the frequency of the charge transfer, diffusion, and change in crystalline structure occurs within distinct regions [25]. Knowing (17), the bounds on the first time-constant τ1 can be established to be roughly between 0.0004 and 1.592 s, τ2 between 1.592 and 159.235 s, and τ3 between 159.235 and 3184.71 s. It should be explicitly noted that these are rough bounds for the impedance spectrum of the NMC chemistry, and in no way entirely representative of the exact impedance spectrum bounds for each cell. The goal here is to both minimize the cost function and ensure that the bounding remains generally tied to the physical phenomena inside the cell. Furthermore, if an alternative chemistry is used, the respective impedance spectrum of the given chemistry should be referenced for proper bounding. Thus, given the approximation, time constants will be aimed to be constrained between these bounds during optimization, with minimal degrees to overshoot or undershoot.
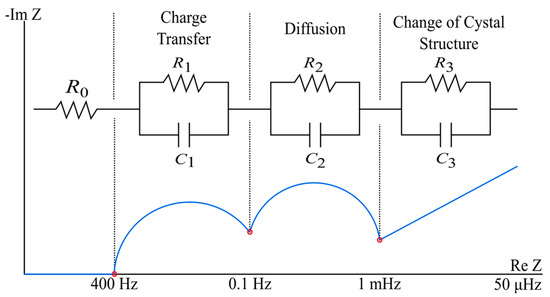
Figure 6.
Common impedance spectrum of a lithium-ion cell.
Furthermore, the sum of the initial RC branch voltages, a1, a2, and a3, should be roughly equal to the voltage drop observed in relaxation, Vrel, as seen in Figure 4. To guarantee the time constants are placed in three distinct frequency regions it was decided that a1 would be responsible for 50% of Vrel, a2 for 30% of Vrel, and a3 for the remaining 20%. Finally, c represents the additive open circuit voltage of the cell and was easily bounded according to the OCV curve. The resulting time constant extraction from the nonlinear least squares curve fit can be observed in Figure 7, with Table 2 summarizing essential information related to the fitting applied.

Figure 7.
Time constraints bound by impedance spectra. (a) τ1. (b) τ2. (c) τ3.

Table 2.
Fitting information and parameter bounding.
Model time constants generally lie within the desired range, as evidenced above, while still producing an optimal fit of the cell relaxation. From the later validation work conducted in this paper, placement of these time constants in the correct region does, in fact, yield a more accurate model in the transient condition. Many parameter sets can be fitted to the voltage relaxation with varying magnitudes of time constants while still delivering an equally optimal fit relative to the relaxation curve. However, the best transient performance was achieved when the time constants were generally bound according to the impedance spectrum of the cell.
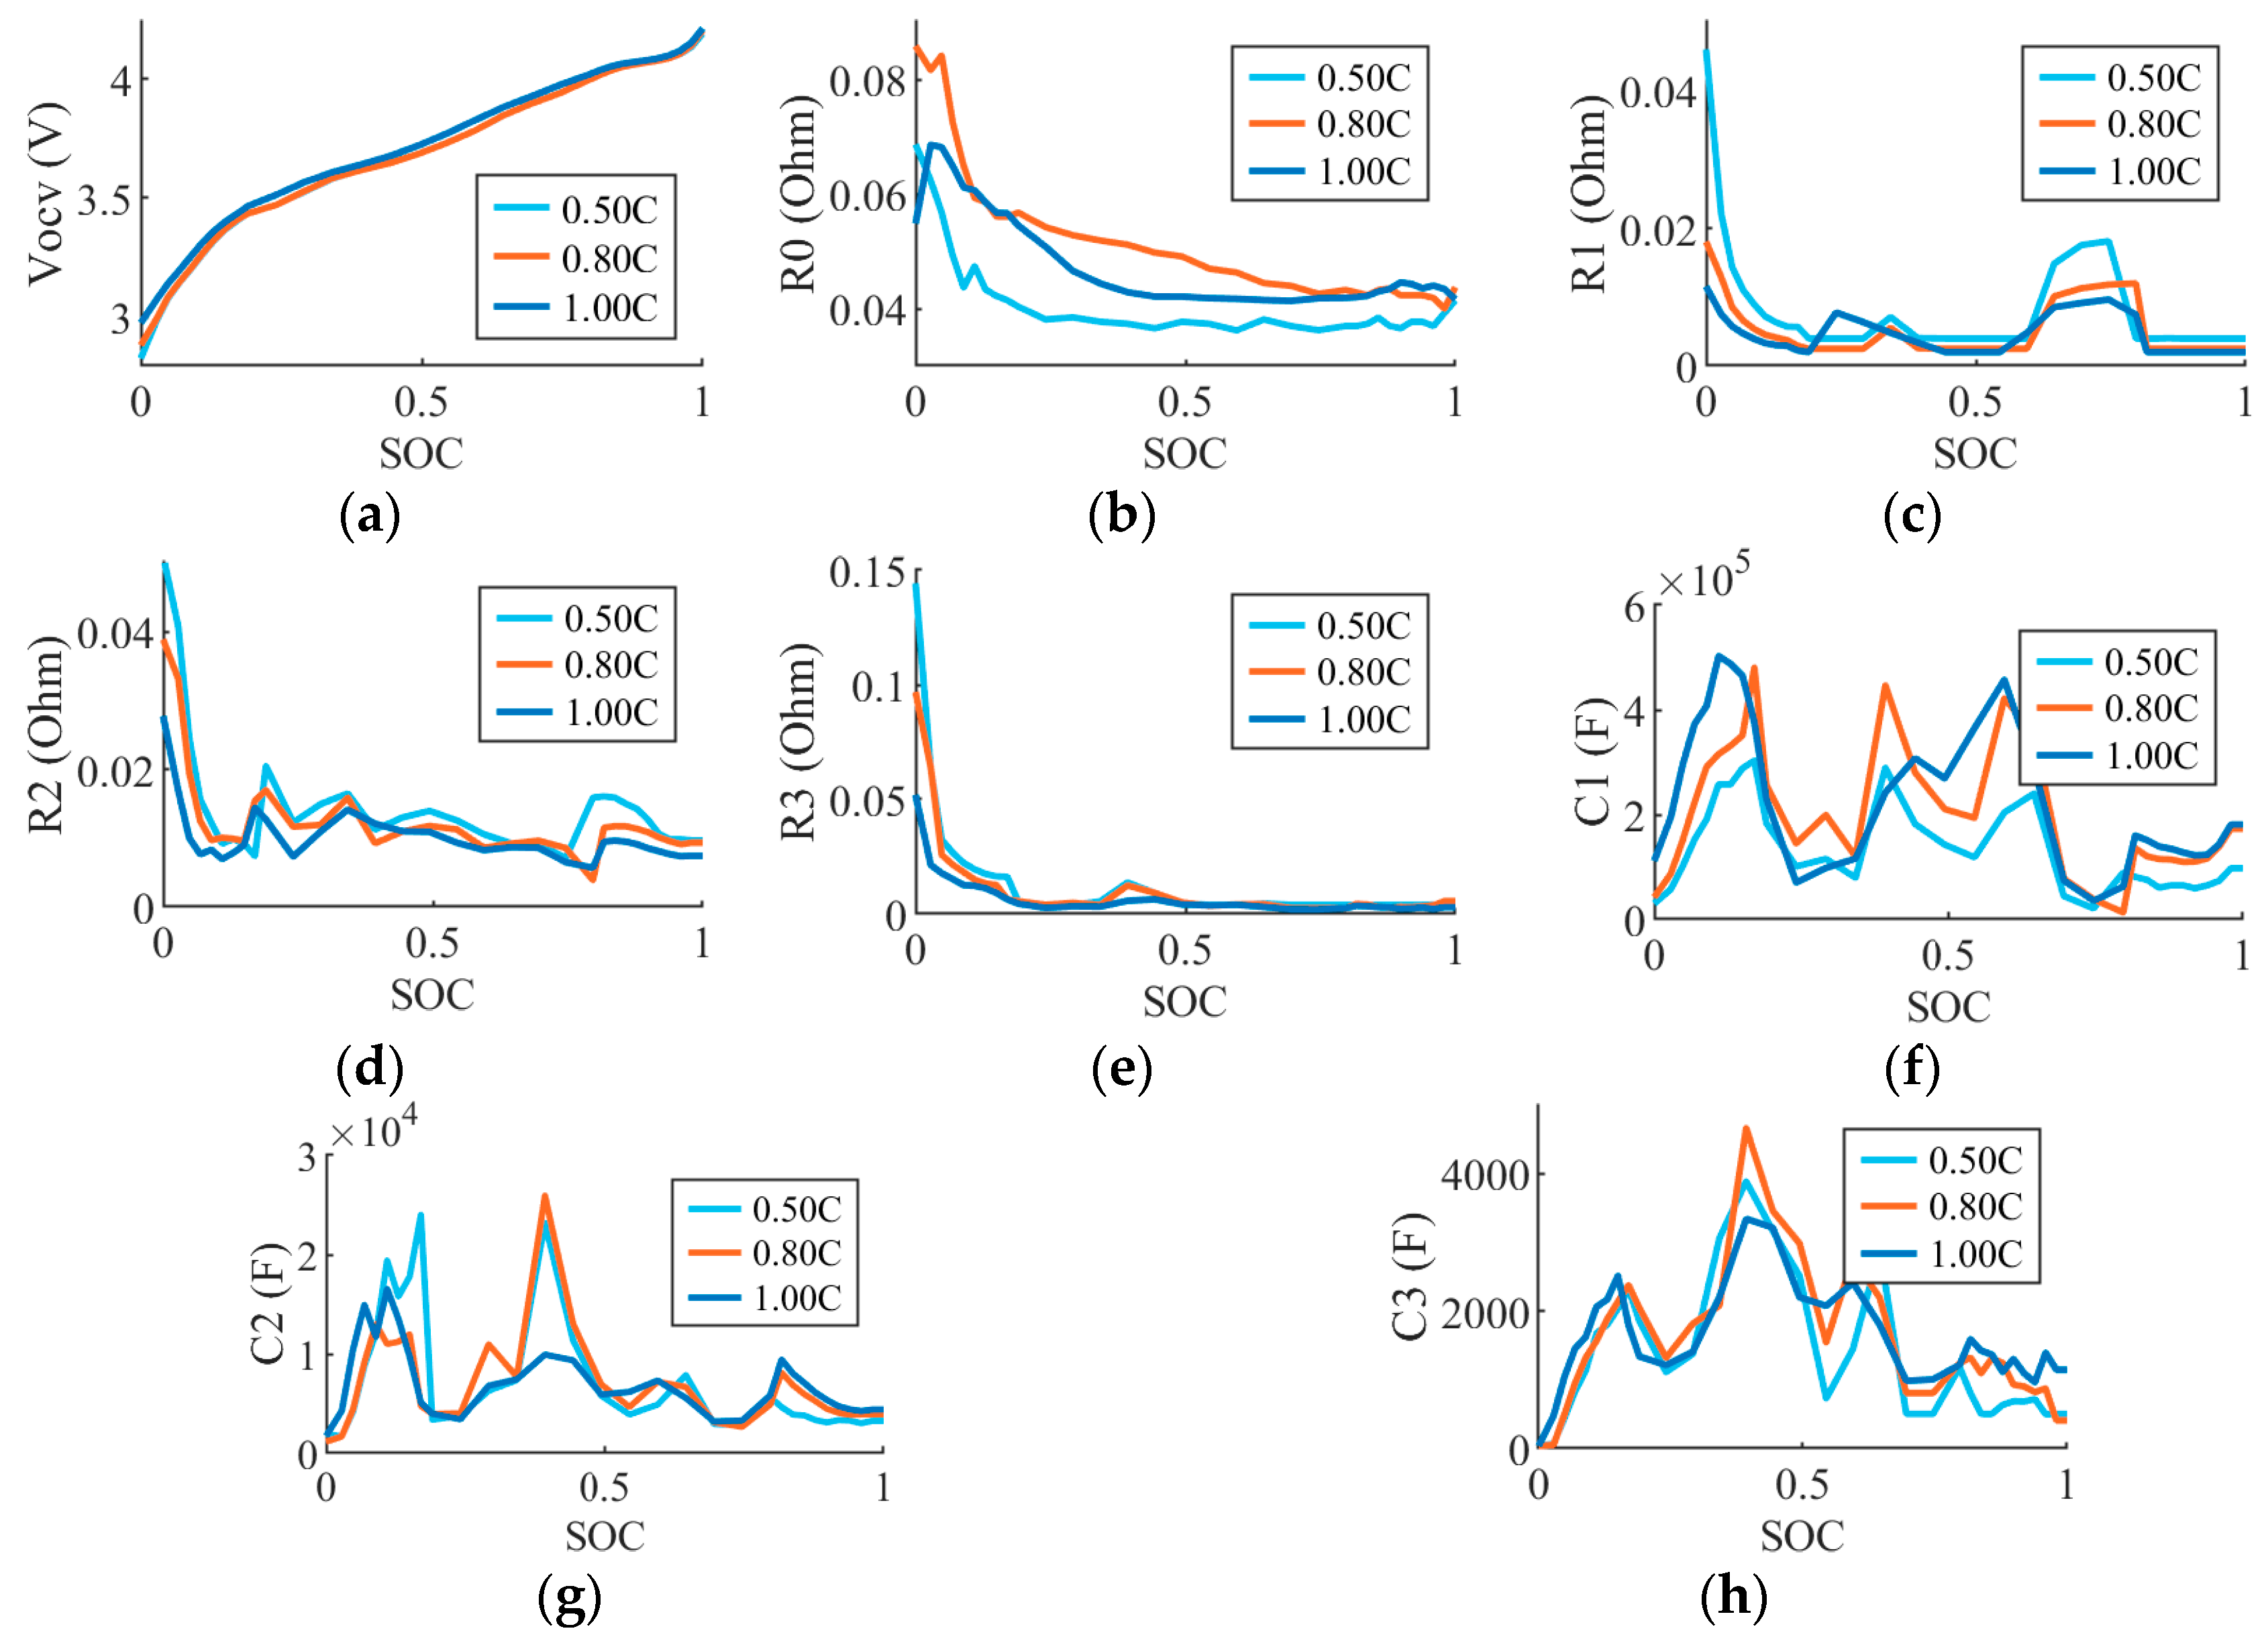
Parallel branch parameters for both Method 1 and Method 2 are extracted from (10) and (12), respectively, yielding the full parameter set for the model with a dependency on the state of charge. Figure 8 exhibits a sample of the full parameter set for Method 1.
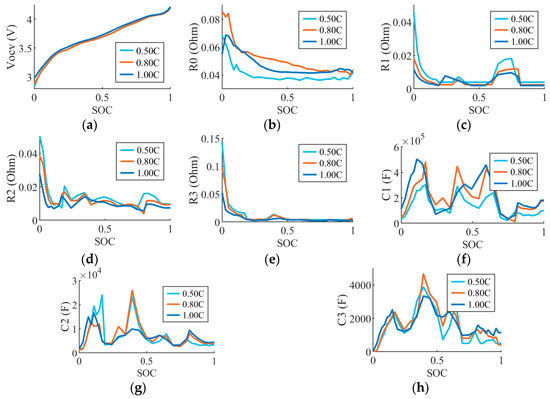
Figure 8.
Decreasing transient resistance and capacitance with increased C-rate, Method 1: (a) VOCV; (b) R0; (c) R1; (d) R2; (e) R3; (f) C1; (g) C2; (h) C3.
As one of the major goals of this paper, examining the extracted parameter set can yield some insights about the behavior of the cell at increasing C-rates. Noting the transient RC parameters, generally as the C-rate increases, the parallel branch resistance and capacitance have the tendency to decrease, a result confirmed in [10]. This implies that the higher the C-rate, the faster the cell will return to a stable voltage. At lower C-rates, the cell experiences a decreased self-heating effect, leading to lower temperatures of operation. This directly causes slower chemical reaction activity, as well as decreased charge transfer velocity [26]. Hence, at higher C-rates, the cell has a greater rate of intercalation and deintercalation, as well as the ability to diffuse the ion gradients left in the cell during relaxation. This leads to the potential of introducing a scaling term that decreases the transient parameters with increasing current if a multi-C-rate ECM is desired.
The series resistive drop appears to generally increase as the C-rate increases. Notably, the series resistance extracted at 1C is generally smaller than the series resistance at 0.8C.
4.2. Implementing the Thevenin 3-RC Circuit in Simulation
As previously noted, the parameter set developed is dependent on SOC. The model will use Coulomb counting to track the state of charge during simulation, as shown in Equation (18):
where Ts is the sampling time of the model and Qnom is the nominal capacity of the cell, 5 Ah. The model is then implemented in Simulink by converting (5) to the Laplace form, following the approach in [17].
5. Model Validation and Results
5.1. Error Quantification and Model Pulse Discharge Tracking
Maximum error, root mean squared error (RMSE) in (19), mean absolute error (MAE) in (20), and the coefficient of determination (RSQ) in (21) will be used to evaluate model and method performance:
where yi is the true cell voltage from experiment, ŷ is the model-predicted voltage, N is the number of data points, and is the mean value of the experimental voltage.
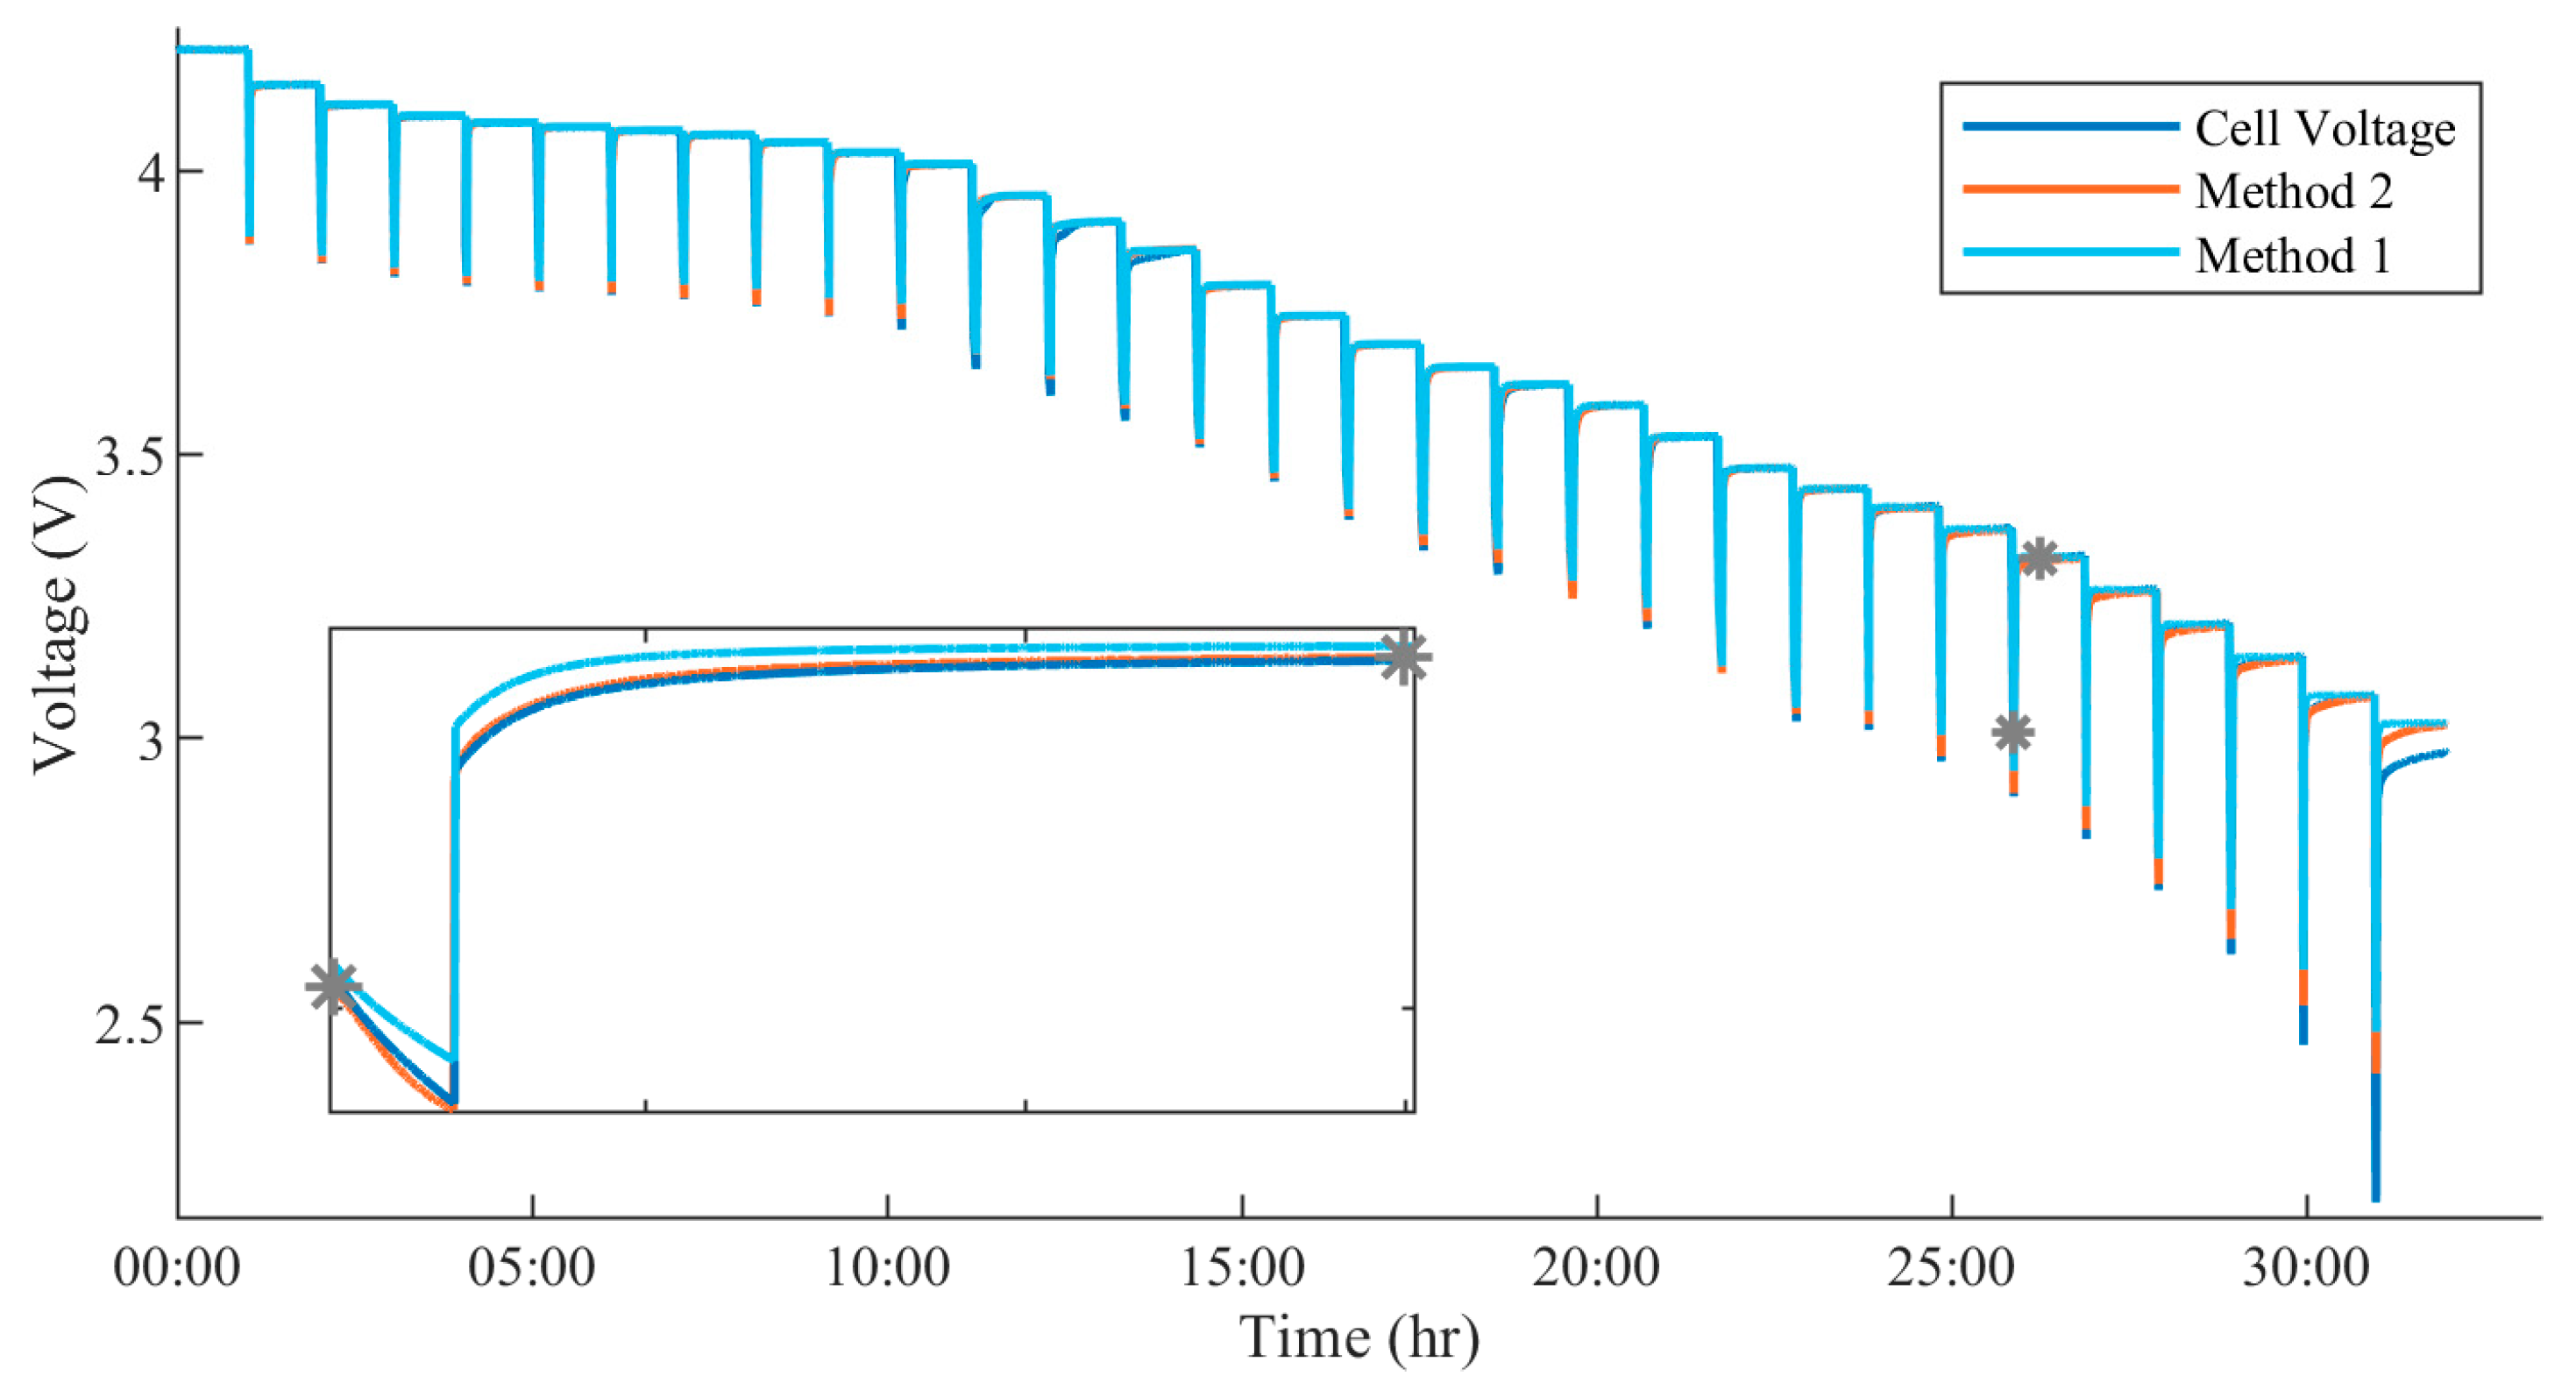
Prior to running any transient profile validation, the model was run with the current load of the PD at 1C. The full response for both Methods 1 and 2 is shown in Figure 9. Method 1 tracks with an RMSE of 15.78 milli-volts, while Method 2 has a lower error of 9.99 mV, confirming both methods provide accurate tracking. Method 2, however, does deliver much better tracking of the PD profile. As analyzed in (12), Method 2 imposes a larger RC resistive drop, enabling better tracking during the current pulse. At the same time, given that the parallel resistance is smaller in Method 1, it shows a flatter response during relaxation as it causes a smaller voltage delta during the discharge of the capacitor. Hence, in long relaxation at the same point in time, Method 2 will be tracking a lower voltage, despite having the same settling time as Method 1. The implication of this could be an undershoot of cell voltage in the EV condition. In a highly transient scenario, the cell only has brief moments of relaxation, and its behavior more closely approaches that of a pure resistor, where the cell series resistance is the dominant factor. Conversely, Method 1 would produce an initial overshoot of cell voltage in the same scenario. However, with regard to the two methods of parameter extraction, it is clear that Method 2 is the valid approach for extracting parameters and matching cell dynamics relative to the pulse PD profile- the current flowing through the capacitors must be compensated for sufficient tracking during long relaxation.
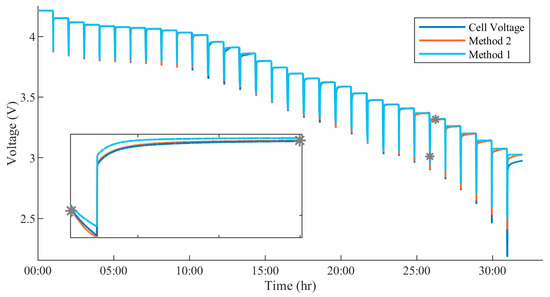
Figure 9.
Difference in pulse tracking due to capacitive compensation during relaxation (1C).
5.2. Transient Profile Testing and Performance Quantification
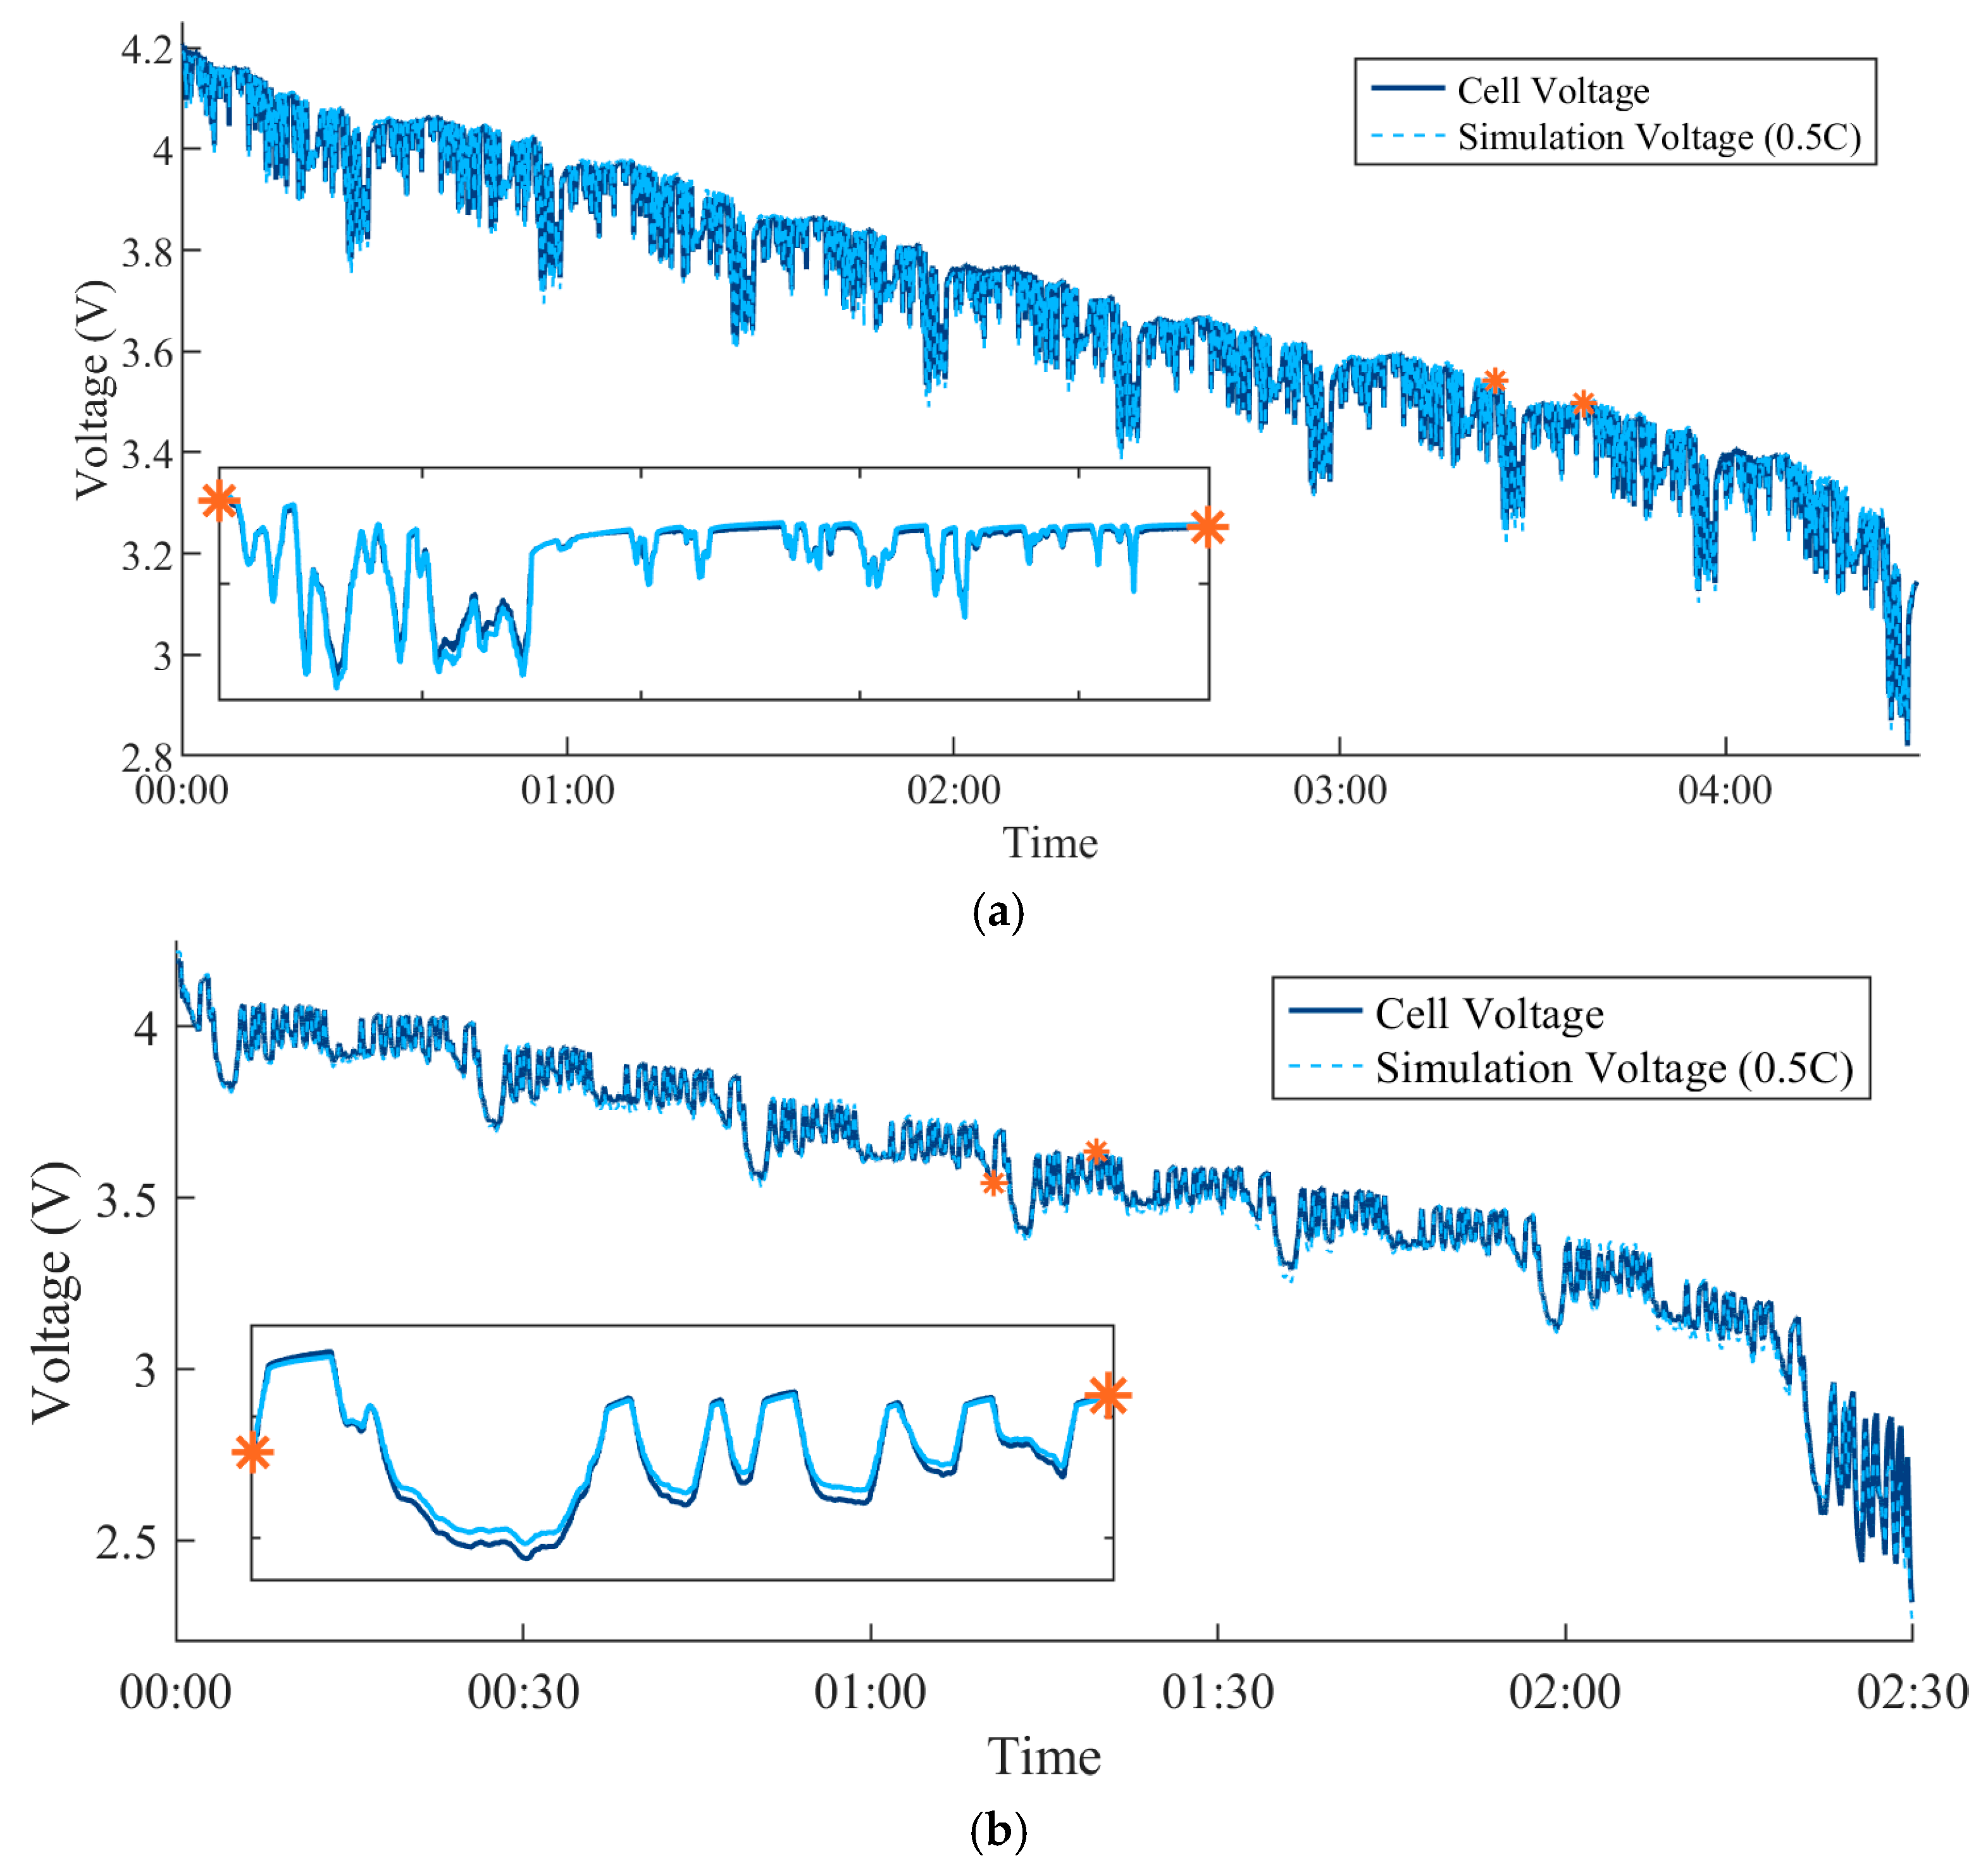
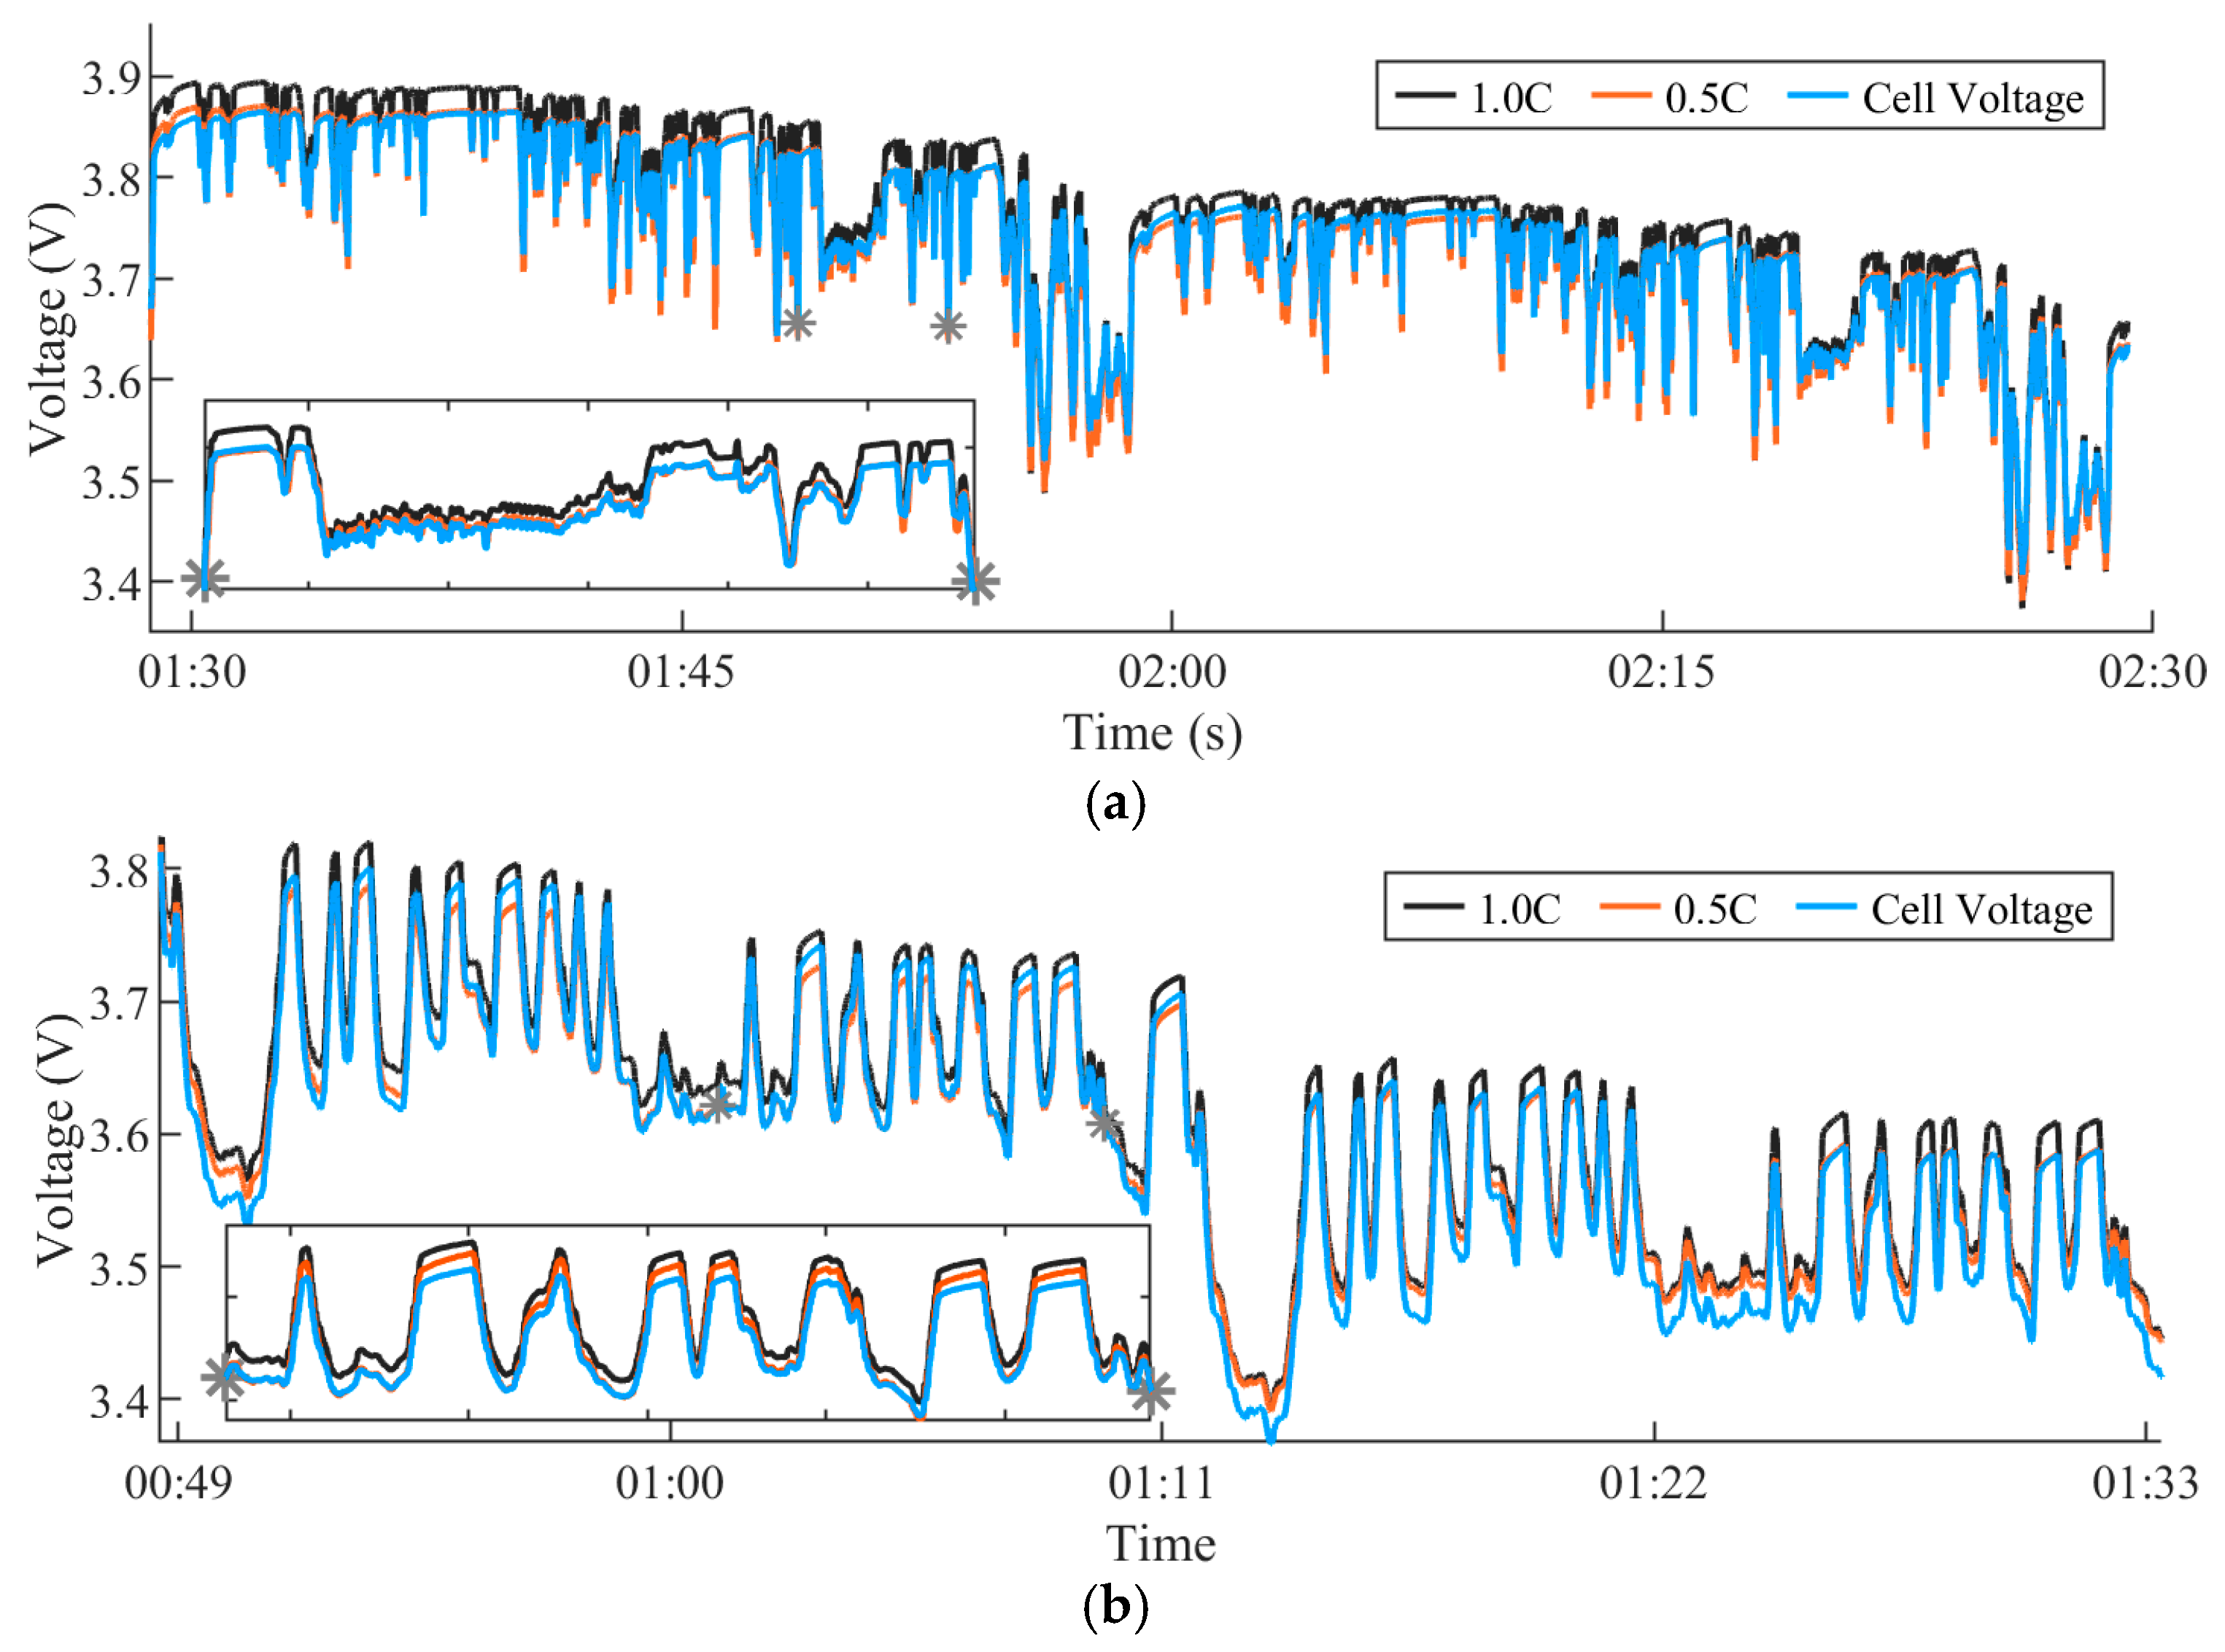
Two load profiles are chosen to validate the model’s behavior under transient conditions. Test profile #1 is the Worldwide Harmonized Light Vehicles Test cycle (WLTC), generated for a battery pack with a capacity of 52 kWh, DC bus voltage of 360 V, and 28 cells in parallel. This profile was chosen as it is a realistic load for EV applications. Test profile #2 is an arbitrary high current load (HC), purposefully selected to stimulate the cell under longer durations of current pulses and relaxation. The average current for profile #1 is 1.014 A, while the average current for profile #2 is 1.9742 A. The full current profile for one complete cycle is presented in Figure 10. The two load profiles were concatenated to sweep the cell from a full SOC to approximately 0%. Profile #1 sweeps the cell from 100% to 8.83% SOC, while profile #2 from 100% to 1.34% SOC. The full voltage response of the cell, along with the tracking produced by the model, is exhibited in Figure 11 (Method 1 parameter set, 0.5C PD characterization). Noting Figure 11, the model delivers highly accurate voltage tracking across the SOC range of the cell for both test profiles, confirming the validity of the parameter set extraction.

Figure 10.
Current profiles for discharge cells. (a) WLTC. (b) HC load.
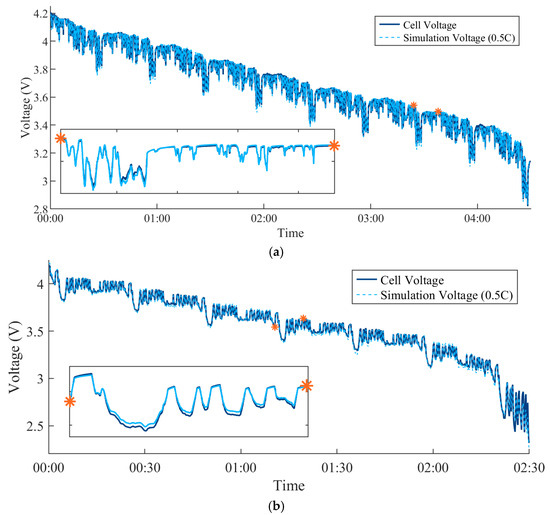
Figure 11.
Voltage response of the cell and model tracking. (a) Cell and model voltage response to WLTC. (b) Cell and model voltage response to HC.
To quantify model performance using both methods of parameter extraction, the model was loaded with the parameter set for a given method (Method 1 or Method 2) at a particular C-rate (0.5C, 0.8C, 1C). At each test condition, the model was simulated with the PD profile, WLTC, and HC load. The full error metrics for each simulation can be found in Table 3. The motivation here is to determine whether capacitive compensation in parameter extraction yields superior performance in transient scenarios, particularly in terms of model accuracy. The accuracy of voltage prediction is naturally paramount to the success of the BMS—more accurate prediction of cell behavior to a given load ensures voltage and current limits are not violated in a real-time driving scenario. At the same time, predictive algorithms for monitoring the state of charge rely almost entirely on the accuracy of the battery model that has been developed. A better model equates to better prediction of available charge and faster algorithm convergence, enhancing the BMS’s reliability [27,28]. At this point, it is clear that capacitive compensation is required for tracking profiles with longer periods of relaxation, as per Figure 9; however, superior performance may not hold for the EV load profiles demonstrated in Figure 10.

Table 3.
RMSE and maximum errors for pulse discharge, WLTC, and HC profile.
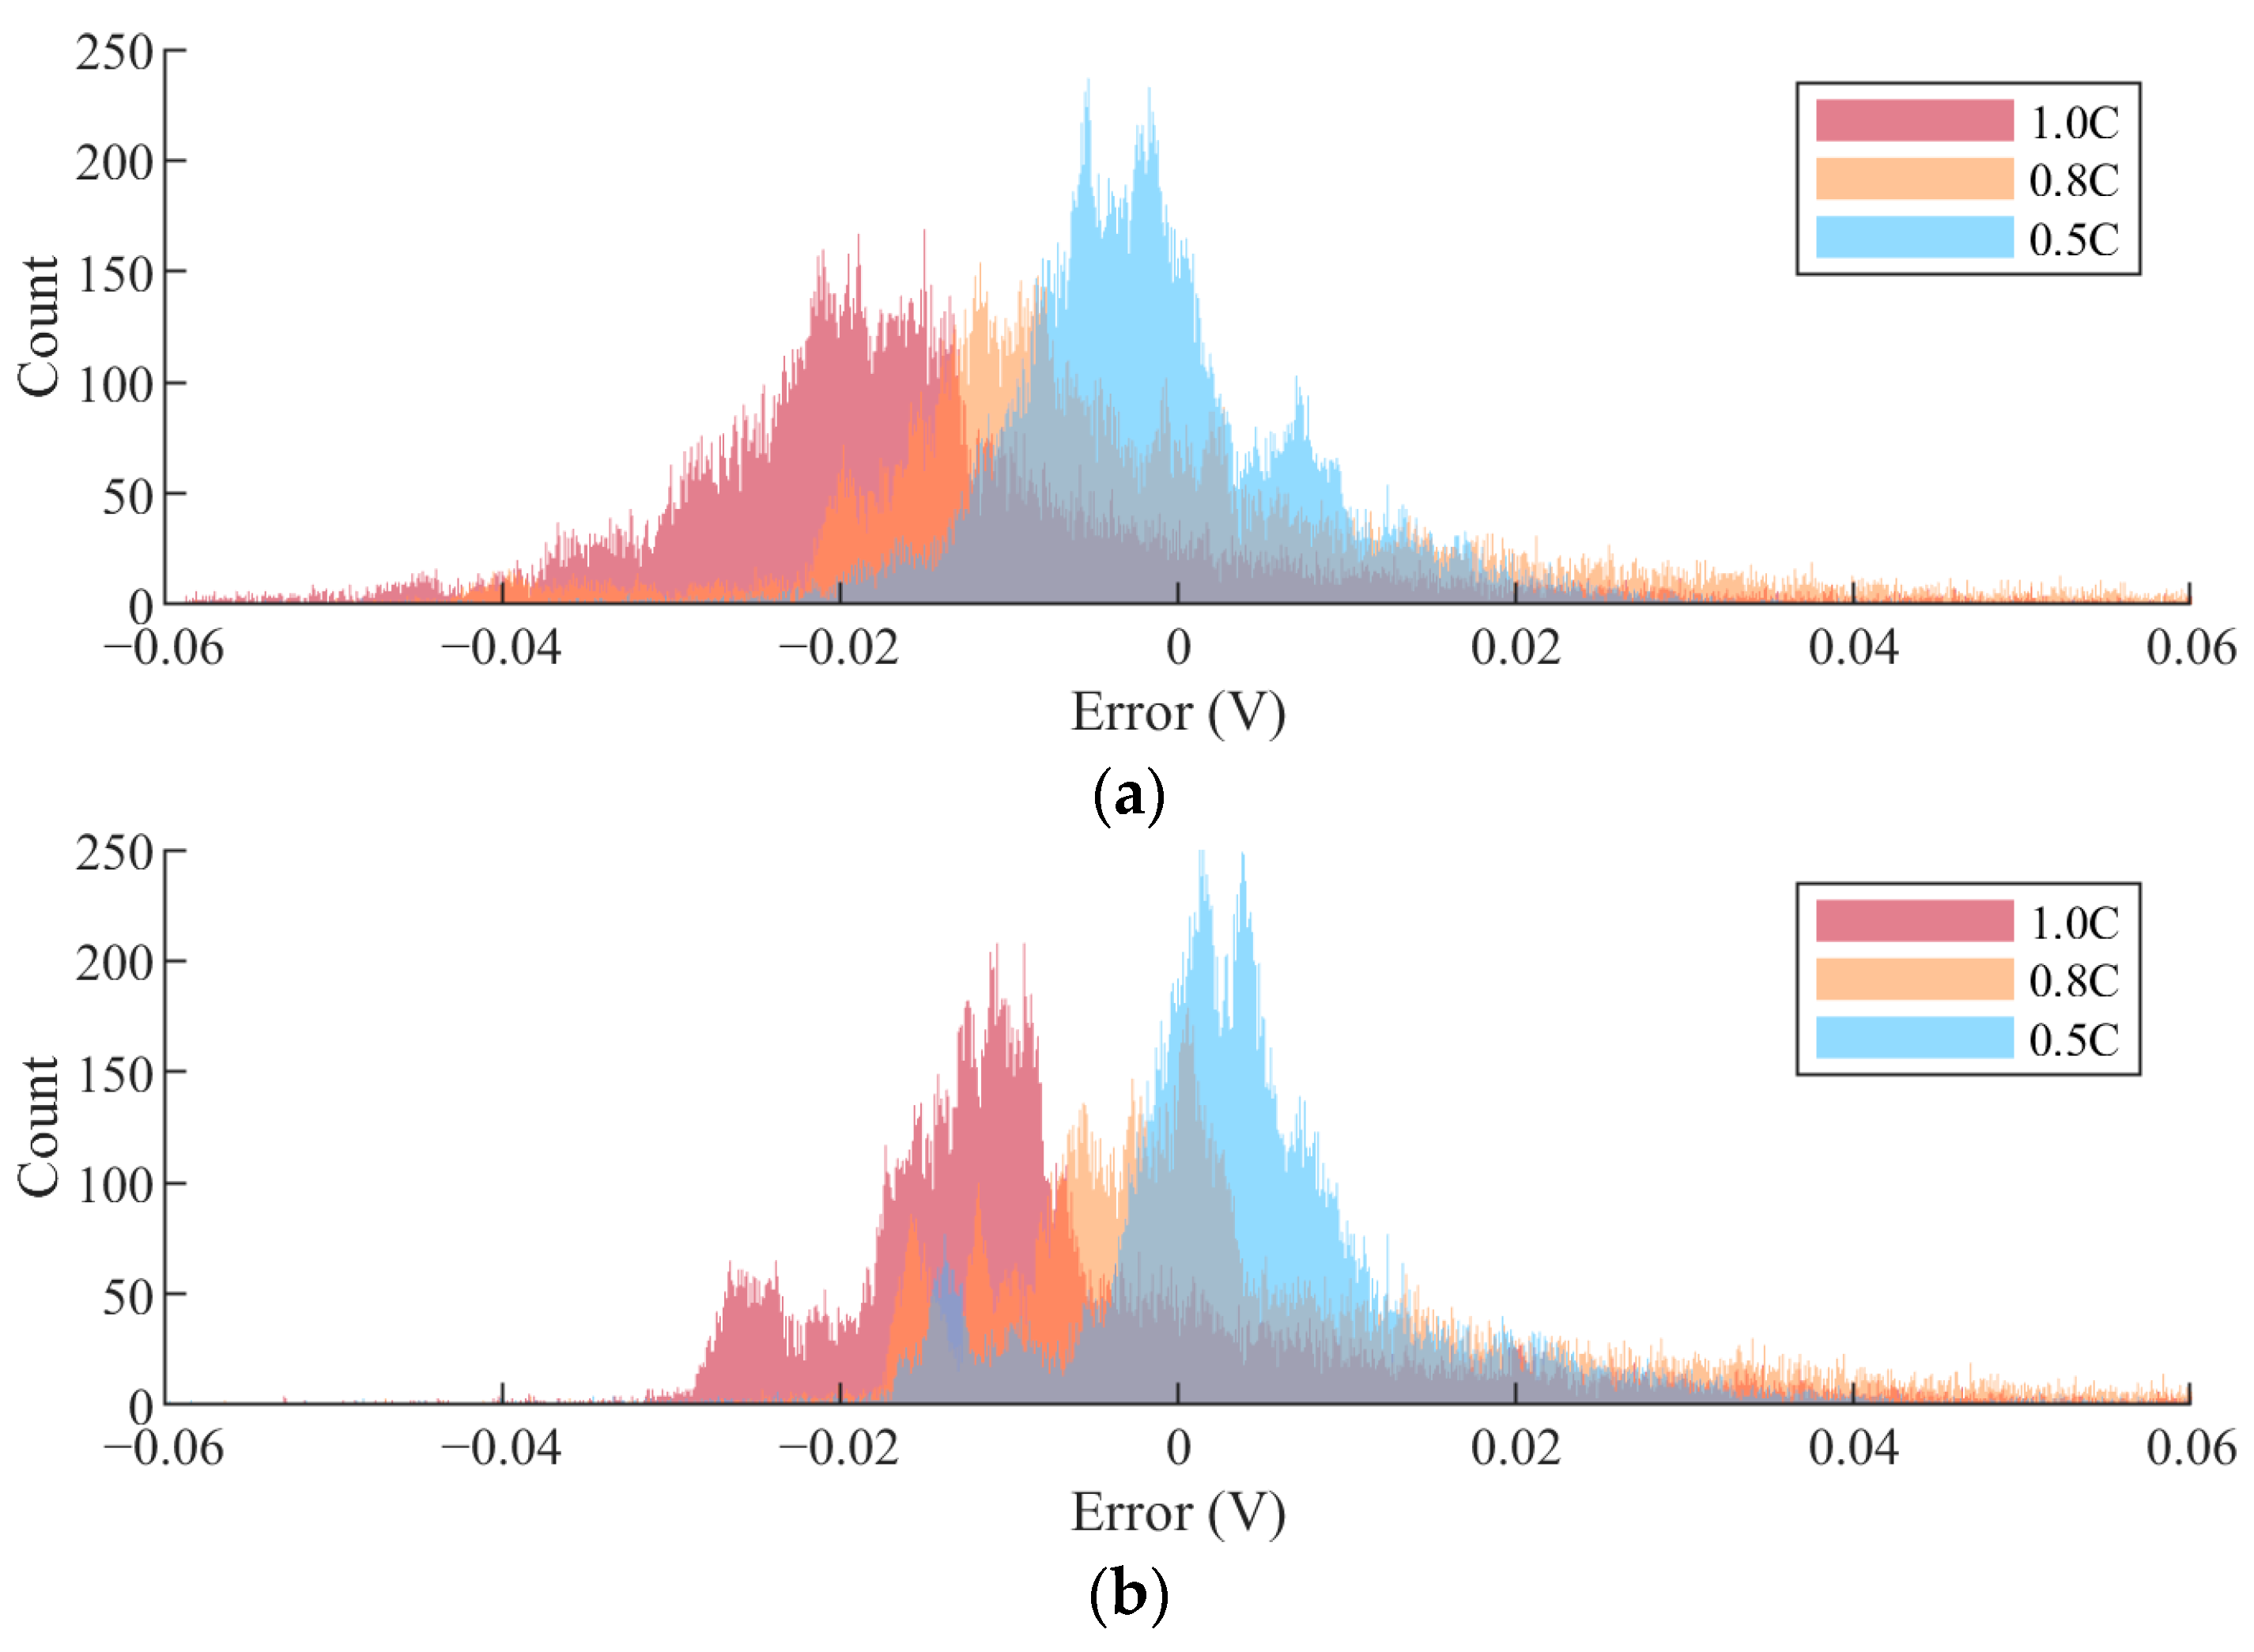
To further aid in visualizing the difference in performance between methods, Figure 12 displays the RSQ for all load profiles, while Figure 13 exhibits the residual error spectrum of both methods for the WLTC and HC profiles. Method 1 clearly has better transient performance than Method 2 for parameterization at a lower C-rate; however, as the C-rate of parameterization increases, Method 2 produces a more accurate parameter set relative to Method 1. Examining the error spectrum of both methods for the WLTC in Figure 13, where the error is defined as the simulated cell voltage subtracted from the experimental cell voltage, the two methods have a clear trend—as the C-rate of parameterization increases, the degree to which the model overshoots accordingly rises. Further evidence of this effect can be seen in Figure 14a, where the model overshooting substantially increases from the parameter set extracted at 0.5C to 1C.

Figure 12.
Model RSQ for all profiles considering both methods.
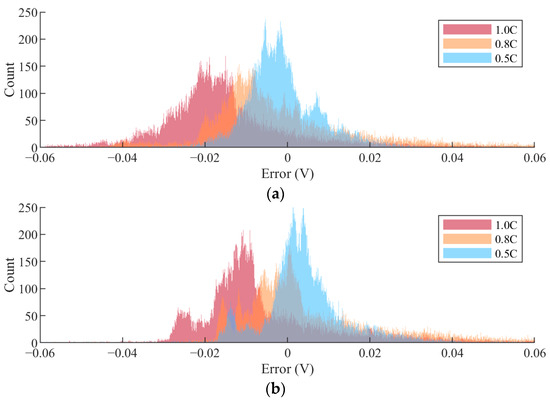
Figure 13.
Observed left shifting of the error spectrum, where plots being further left imply greater model overshoot. (a) Method 1. (b) Method 2.
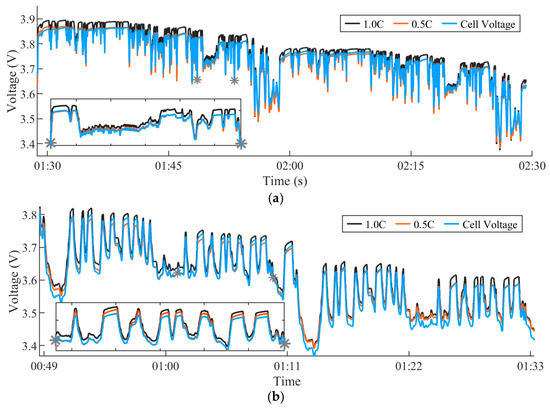
Figure 14.
Increasing model overshoot as the C-rate of parameterization increases, Method one. (a) WLTC response. (b) HC response.
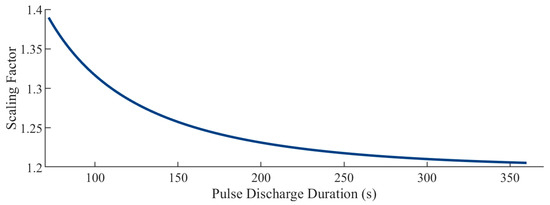
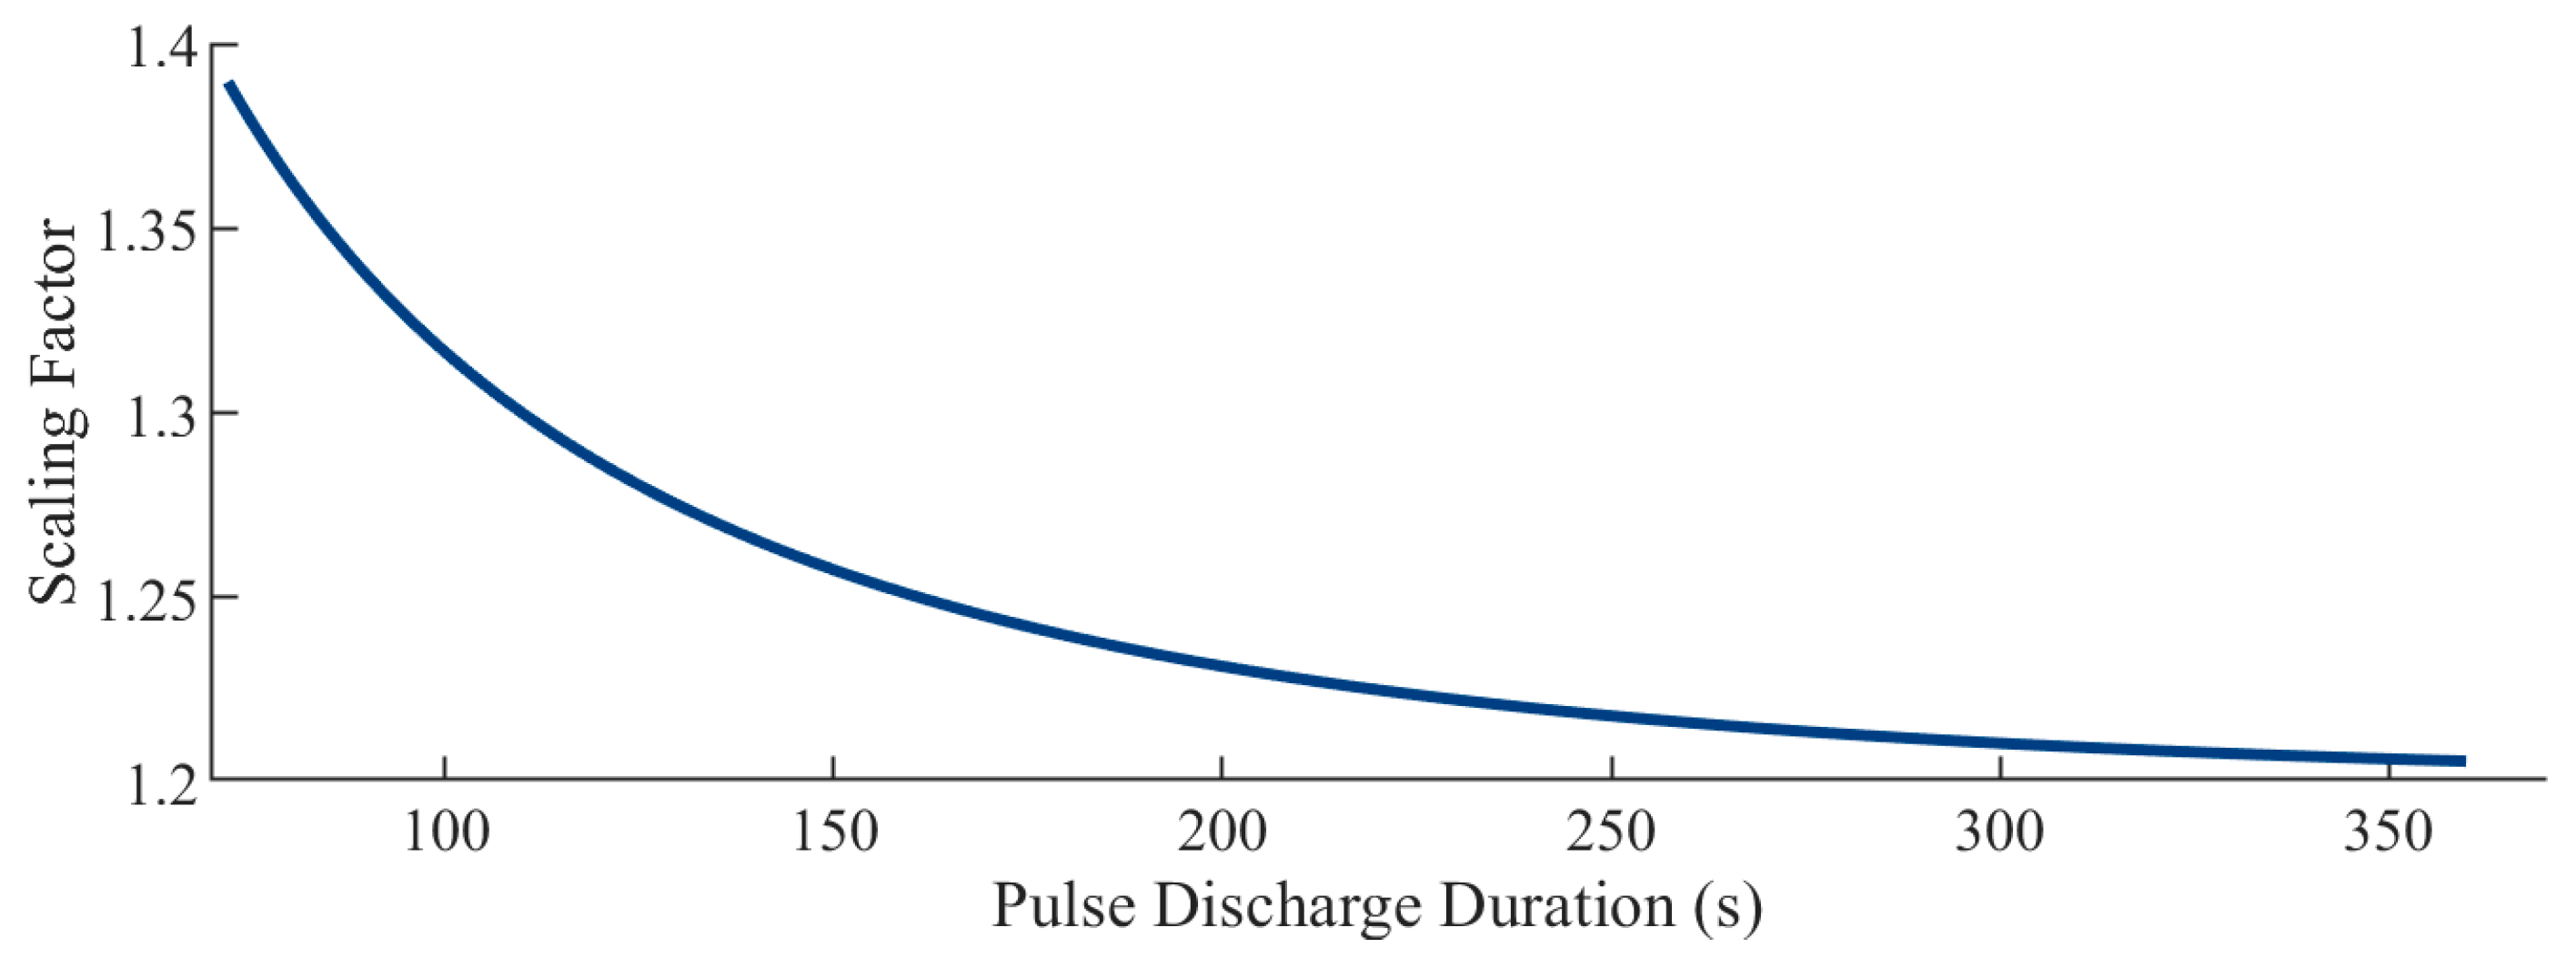
The behavior of both methods in the transient condition relates back to the scaling term introduced in (12). An important finding established from the work completed is that the larger the parallel branch resistance, and conversely, the smaller the parallel branch capacitance, the more the model will undershoot predictions in the transient scenario. During parameterization, however, as the pulse duration decreases, the parallel branch resistance exponentially increases, insinuating an exponential increase in the tendency to undershoot. To illustrate this point, Figure 15 presents the degree to which the parallel branch resistance parameters extracted via Method 2 are greater than those of Method 1.
5.3. Optimal Method of Parameterization for Thevenin Equivalent Circuit Cell Model with 3-RC Pairs
Several conclusions can be drawn from Figure 15: For the parameterization of a pulse discharge test performed at a low C-rate, and thus with a long pulse duration, the degree of undershooting using Method 2 will be small, as the scaling factor is at a minimum. Thus, as observed in Figure 13b, the error spectrum for Method 2 initially starts right-shifted relative to Method 1, underpredicting the correct voltage values. This allows Method 1 to perform better in the transient scenario, despite the obviously worse tracking of the PD profile it produces. As the C-rate of parameterization increases, meaning smaller PD durations, the degree to which Method 2 undershoots voltage predictions exponentially increases. In reference to Figure 15, smaller PD durations equate to an increase in the scaling term applied to the parallel resistances. Both error spectrums tend to shift left with higher C-rates, increasing overshoot. However, Method 2’s exponential capacitive compensation offsets this effect, pushing the spectrum rightward.
Therefore, this left shifting effect due to the increased C-rate of parameterization for Method 2 is considerably less than that observed with Method 1, resulting in improved performance at higher C-rates of parameterization. This poses the following implication—demonstrated in Figure 12, the best overall tracking for both transient profiles is obtained using Method 1 at a C-rate of parameterization close to the intended application load. The drawback of this, however, is that if the intended application has a wide range of potential loads and is thus parameterized at the upper current limit, Method 1 will struggle to accurately predict on any profile significantly lower than the C-rate of parameterization. Conversely, Method 2, if parameterized at the upper end of the load spectrum, will produce better performance on any lower C-rate profiles than Method 1. It, however, will perform slightly worse than Method 1 at the actual C-rate of parameterization. Given that most HEV load profiles are highly transient in nature, it appears that the best performance for parameterization would be achieved using Method 1, where the C-rate of parameterization is close to the expected current load.
A solution commonly explored in the literature is to perform a second optimization on the pulse discharge curve after parameter set extraction. This should rectify any errors in the parameterization method chosen and ensure a better match to the PD profile. This introduces its own host of issues; better PD profile tracking does not necessarily mean better transient performance. In fact, when using several fitting techniques to perform a second optimization, the new parameter set produces much better PD tracking, but consistently worse transient performance. This appears to skew the model parameters to a place of overfitting the PD profile. Future work will explore how to extract an optimal parameter set for tracking across a wide range of HEV profiles.
6. Conclusions
The presented paper produced the first comparison of the two most dominant methods of direct parameterization of an equivalent circuit model with respect to multiple C-rates. It clarifies whether capacitive compensation is necessary when producing an ECM and the effect varying degrees of capacitive compensation will have on model transient performance—Method 1 delivers the best transient load performance when characterized at a C-rate of the average current of the load profile- having an average RMSE of 18.176 mV for the WLTC and 34.09 mV for the HC profile, relative to Method 2’s 19.896 mV and 35.77 mV. The second method, however, appears to have better tracking accuracy over longer durations of rest, due to capacitive compensation, and for load profiles lower than the C-rate of parameterization. Method 2 delivered an average RMSE of 11.47 mV for the PD profile, compared to 18.18 mV for Method 1, and had an average lower RMSE of 10.29 mV for characterization at the highest C-rate of 1C. In both cases, however, increasing the C-rate parameterization will introduce more overshoot into the model on transient profiles if attempting to predict on a lower C-rate current load.
Future work will examine how to incorporate multiple C-rates of parameterization into the ECM to produce a singular model capable of accurately predicting the voltage response across a wide range of input loads.
Author Contributions
Conceptualization, P.L.; Methodology, P.L.; Software, P.L.; Validation, P.L. and P.K.; Formal analysis, P.L.; Resources, N.C.K. and L.V.I.; Supervision, P.K., L.V.I. and N.C.K.; Project administration, L.V.I. and N.C.K. All authors have read and agreed to the published version of the manuscript.
Funding
Authors thank the Canada Research Chair program (Award no. CRC-2019-00319), Magna International and Mitacs (Project no. IT40371) for funding support of this work.
Data Availability Statement
The original contributions presented in this study are included in the article. Further inquiries can be directed to the corresponding author.
Conflicts of Interest
Lakshmi Varaha Iyer was employed by Magna International. The funding sponsors Magna International had a role in providing research grants that enabled the design and collection of data in the study. The remaining authors declare that the research was conducted in the absence of any commercial or financial relationships that could be construed as a potential conflict of interest.
Abbreviations
The following abbreviations are used in this manuscript:
| EV | Electric Vehicle |
| BMS | Battery Management System |
| ECM | Equivalent Circuit Cell Model |
| DP | Dual Polarization |
| RC | Resistive Capacitive |
| PD | Pulse Discharge |
| DC | Direct Current |
| SOC | State of Charge |
| RMSE | Root Mean Squared Error |
| MAE | Mean Absolute Error |
| RSQ | Coefficient of Determination |
| WLTC | Worldwide Harmonized Light Vehicles Test Cycle |
| HC | High Current |
| HEV | Hybrid Electric Vehicle |
References
- Scrosati, B.; Garche, J. Lithium batteries: Status, prospects and future. J. Power Sources 2010, 195, 2419–2430. [Google Scholar] [CrossRef]
- Iclodean, C.; Varga, B.; Burnete, N.; Cimerdean, D.; Jurchiş, B. Comparison of different battery types for electric vehicles. IOP Conf. Ser. Mater. Sci. Eng. 2017, 252, 012058. [Google Scholar] [CrossRef]
- Hidrue, M.K.; Parsons, G.R.; Kempton, W.; Gardner, M.P. Willingness to pay for electric vehicles and their attributes. Resour. Energy Econ. 2011, 33, 686–705. [Google Scholar] [CrossRef]
- Hannan, M.A.; Hoque, M.M.; Hussain, A.; Yusof, Y.; Ker, P.J. State-of-the-art and energy management system of lithium-ion batteries in electric vehicle applications: Issues and recommendations. IEEE Access 2018, 6, 19362–19378. [Google Scholar] [CrossRef]
- Jeevarajan, J.A. Hazards associated with high voltage high-capacity lithium-ion batteries. ECS Trans. 2011, 33, 22. [Google Scholar] [CrossRef]
- Pillai, P.; Sundaresan, S.; Pattipati, K.R.; Balasingam, B. Optimizing current profiles for efficient online estimation of battery equivalent circuit model parameters based on Cramer–Rao lower bound. Energies 2022, 15, 8441. [Google Scholar] [CrossRef]
- Nikolian, A.; De Hoog, J.; Fleurbay, K.; Timmermans, J.M.; Van De Bossche, P.; Van Mierlo, J. Classification of electric modeling and characterization methods of lithium-ion batteries for vehicle applications. In Proceedings of the European Electric Vehicle Congress, Brussels, Belgium, 2–5 December 2014. [Google Scholar]
- Lai, X.; Wang, S.; Ma, S.; Xie, J.; Zheng, Y. Parameter sensitivity analysis and simplification of equivalent circuit model for the state of charge of lithium-ion batteries. Electrochim. Acta 2020, 330, 135239. [Google Scholar]
- Ahmed, R.; Rahimifard, S.; Habibi, S. Offline parameter identification and SOC estimation for new and aged electric vehicles batteries. In Proceedings of the 2019 IEEE Transportation Electrification Conference and Expo (ITEC), Detroit, MI, USA, 19–21 June 2019. [Google Scholar]
- Peng, J.; Meng, J.; Wu, J.; Deng, Z.; Lin, M.; Mao, S.; Stroe, D.-I. A comprehensive overview and comparison of parameter benchmark methods for lithium-ion battery application. J. Energy Storage 2023, 71, 108197. [Google Scholar] [CrossRef]
- Chen, M.; Rincon-Mora, G.A. Accurate electrical battery model capable of predicting runtime and I-V performance. IEEE Trans. Energy Convers. 2006, 21, 504–511. [Google Scholar] [CrossRef]
- Tekin, M.; Karamangil, M.İ. Comparative analysis of equivalent circuit battery models for electric vehicle battery management systems. J. Energy Storage 2024, 86, 111327. [Google Scholar] [CrossRef]
- Hu, X.; Li, S.; Peng, H. A comparative study of equivalent circuit models for Li-ion batteries. J. Power Sources 2012, 198, 359–367. [Google Scholar] [CrossRef]
- Skoog, S. Parameterization of equivalent circuit models for high power lithium-ion batteries in HEV applications. In Proceedings of the 18th European Conference on Power Electronics and Applications, Karlsruhe, Germany, 5–9 September 2016; pp. 1–10. [Google Scholar]
- Ahmed, R.; Gazzarri, J.; Onori, S.; Habibi, S.; Jackey, R.; Rzemien, K.; Tjong, J.; LeSage, J. Model-based parameter identification of healthy and aged Li-ion batteries for electric vehicle applications. SAE Int. J. Altern. Powertrains 2015, 4, 233–247. [Google Scholar] [CrossRef]
- Cittanti, D.; Ferraris, A.; Airale, A.; Fiorot, S.; Scavuzzo, S.; Carello, M. Modeling Li-ion batteries for automotive application: A trade-off between accuracy and complexity. In Proceedings of the International Conference of Electrical and Electronic Technologies for Automotive, Turin, Italy, 15–16 June 2017. [Google Scholar]
- Yao, L.W.; Aziz, J.A.; Kong, P.Y.; Idris, N.R.N. Modeling of lithium-ion battery using MATLAB/Simulink. In Proceedings of the Annual Conference of the IEEE Industrial Electronics Society, Vienna, Austria, 10–13 November 2013; pp. 1729–1734. [Google Scholar]
- Schweighofer, B.; Raab, K.M.; Brasseur, G. Modeling of high-power automotive batteries by the use of an automated test system. IEEE Trans. Instrum. Meas. 2003, 52, 1087–1091. [Google Scholar] [CrossRef]
- Haghjoo, Y.; Khaburi, D.A. Modeling, simulation, and parameters identification of a lithium-ion battery used in electric vehicles. In Proceedings of the 9th Iranian Conference on Renewable Energy & Distributed Generation (ICREDG), Mashhad, Iran, 23–24 February 2022; pp. 1–7. [Google Scholar]
- Liao, C.; Li, H.; Wang, L. A dynamic equivalent circuit model of LiFePO4 cathode material for lithium-ion batteries on hybrid electric vehicles. In Proceedings of the IEEE Vehicle Power and Propulsion Conference, Dearborn, MI, USA, 7–10 September 2009; pp. 1662–1665. [Google Scholar]
- Hentunen, A.; Lehmuspelto, T.; Suomela, J. Time-domain parameter extraction method for Thévenin-equivalent circuit battery models. IEEE Trans. Energy Convers. 2014, 29, 558–566. [Google Scholar] [CrossRef]
- LG Chem. Lithium Ion INR21700 M50 18.20Wh. LRB-PS-CY18.2Wh-M50 Datasheet. August 2016. Available online: https://www.dnkpower.com/wp-content/uploads/2019/02/LG-INR21700-M50-Datasheet.pdf (accessed on 14 March 2024).
- Belt, J. Battery Test Manual for Plug-In Hybrid Electric Vehicles. The INL is a U.S. Department of Energy National Laboratory Operated by Battelle Energy Alliance. September 2010. Available online: https://inldigitallibrary.inl.gov/sites/sti/sti/4655291.pdf (accessed on 14 March 2024).
- O’Kane, S.E.; Ai, W.; Madabattula, G.; Alonso-Alvarez, D.; Timms, R.; Sulzer, V.; Edge, J.S.; Wu, B.; Offer, G.J.; Marinescu, M. Lithium-ion battery degradation: How to model it. Phys. Chem. 2022, 24, 7909–7922. [Google Scholar] [CrossRef] [PubMed]
- Hu, Y.; Wang, Y.-Y. Two time-scaled battery model identification with application to battery state estimation. IEEE Trans. Control. Syst. Technol. 2015, 23, 1180–1188. [Google Scholar]
- Ma, S.; Jiang, M.; Tao, P.; Song, C.; Wu, J.; Wang, J.; Deng, T.; Shang, W. Temperature effect and thermal impact in lithium-ion batteries: A review. Prog. Nat. Sci. 2018, 28, 653–666. [Google Scholar] [CrossRef]
- Xiao, T.; Shi, X.; Zhou, B.; Wang, X. Comparative Study of EKF and UKF for SOC Estimation of Lithium-ion Batteries. In Proceedings of the IEEE Innovative Smart Grid Technologies-Asia (ISGT Asia), Chengdu, China, 21–24 May 2019; pp. 1570–1575. [Google Scholar]
- Yun, J.; Choi, Y.; Lee, J.; Choi, S.; Shin, C. State-of-Charge Estimation Method for Lithium-Ion Batteries Using Extended Kalman Filter with Adaptive Battery Parameters. IEEE Access 2023, 11, 90901–90915. [Google Scholar] [CrossRef]
Disclaimer/Publisher’s Note: The statements, opinions and data contained in all publications are solely those of the individual author(s) and contributor(s) and not of MDPI and/or the editor(s). MDPI and/or the editor(s) disclaim responsibility for any injury to people or property resulting from any ideas, methods, instructions or products referred to in the content. |
© 2025 by the authors. Licensee MDPI, Basel, Switzerland. This article is an open access article distributed under the terms and conditions of the Creative Commons Attribution (CC BY) license (https://creativecommons.org/licenses/by/4.0/).

