Article

Comparative Analysis of DCIR and SOH in Field-Deployed ESS Considering Thermal Non-Uniformity Using Linear Regression

KEPCO Research Institute, Korea Electric Power Corporation, 105 Munji-ro Yuseong-gu, Daejeon 34056, Republic of Korea
*
Author to whom correspondence should be addressed.
Energies 2025, 18(21), 5640; https://doi.org/10.3390/en18215640 (registering DOI)
Submission received: 4 September 2025 / Revised: 21 October 2025 / Accepted: 24 October 2025 / Published: 27 October 2025

Abstract

Large-scale lithium-ion energy storage systems (ESSs) are indispensable for renewable energy integration and grid support, yet ensuring long-term reliability under field conditions remains challenging. This study investigates degradation trends in a 50 MW-class ESS deployed on Jeju Island, South Korea, focusing on two indicators: direct current internal resistance (DCIR) and state-of-health (SOH). Annual round-trip (capacity) and hybrid pulse power characterization (HPPC) tests conducted from 2023 to 2025 quantified capacity fade and resistance growth. A polynomial-regression-based temperature compensation was applied—compensating DCIR to 23 °C and SOH to 30 °C—which reduced environmental scatter and clarified year-to-year degradation trends. Beyond mean shifts, intra-bank variability increased over time, indicating rising internal imbalance. A focused case study (Bank 03-01) revealed concurrent SOH decline and DCIR escalation localized near specific racks; spatial maps linked this hotspot to heating, ventilation, and air conditioning (HVAC)-driven airflow asymmetry and episodic fan operation. These findings underscore the importance of combining temperature compensation, variability-based diagnostics, and spatial visualization in field ESS monitoring. The proposed methodology provides practical insights for the early detection of abnormal degradation and supports lifecycle management of utility-scale ESSs under real-world conditions.

1. Introduction

Energy storage systems (ESSs) are indispensable infrastructure for modern power grids, enabling large-scale renewable integration and enhancing grid reliability through ancillary services such as frequency regulation (FR), peak shaving, and reserve provision [1]. Among available technologies, lithium-ion batteries (LIBs) dominate utility-scale deployments due to high round-trip efficiency, energy density, and scalability [2]. Despite the rapid growth of multi-megawatt installations, ensuring long-term reliability under heterogeneous field conditions remains challenging [3]. Battery degradation directly affects safety and economics—resistance growth increases thermal and efficiency losses and capacity fade reduces usable energy within the same state-of-charge (SOC) window, constraining dispatchability. Localized abnormal degradation, if undetected, can also jeopardize system-level stability [4]. Accordingly, accurate, field-robust diagnosis and monitoring are essential for reliable operation of large-scale ESSs.
Extensive investigations into battery aging have been conducted in controlled laboratory environments. Standardized protocols—hybrid pulse power characterization (HPPC), incremental capacity analysis (ICA), and electrochemical impedance spectroscopy (EIS)—quantify capacity fading and resistance growth and have clarified mechanisms such as loss of lithium inventory (LLI), loss of active material (LAM), and interfacial-resistance growth [5,6,7]. However, laboratory studies typically assume uniform conditions [8]: temperature and current profiles are tightly regulated and cell-to-cell variability is minimized [9]. In contrast, utility-scale ESSs operate with non-uniform airflow, ambient fluctuations, and dynamic grid-driven duty cycles that produce complex, spatially and temporally non-uniform aging patterns [10]. In particular, direct current internal resistance (DCIR) exhibits strong temperature dependence; without temperature compensation (i.e., compensated to a reference condition), field comparisons can be confounded by environmental variability.
Field investigations at multi-megawatt scale remain comparatively sparse. Recent reports highlight pronounced spatial and temporal non-uniformities within large racks and banks—largely attributed to uneven cooling and heterogeneous current distributions [11]. Because DCIR increases at lower temperatures irrespective of true aging state [12], inter-year comparisons can be misleading unless scalable temperature-compensation methods are applied. Although prior studies acknowledged thermal/current non-uniformities, many relied on simplified models or small-scale setups that do not translate to multi-MW, real-world ESSs [13], and thus often failed to capture system-level interactions and degradation patterns [14]. Comparable field investigations have been reported internationally, but most are constrained by either system scale or observation duration. For example, digital-twin models of MWh-scale ESSs have been used to analyze efficiency and degradation under grid-connected duty [15], while other works discuss opportunities and pitfalls of lifetime prediction from field datasets [10]. Recent studies further show that models calibrated solely on controlled laboratory tests can misestimate field degradation unless temperature non-uniformity and load dynamics are explicitly considered [16]. Complementary research on thermal management indicates that non-uniform cooling and airflow can induce spatially inhomogeneous degradation under FR cycling profiles [11]. Collectively, these contributions confirm the relevance of field-scale effects but also reveal a persistent gap as few continuous, multi-year datasets at utility scale quantify how temperature-dependent resistance and capacity evolve under real operating conditions.
This study addresses these gaps through a three-year (2023–2025) field investigation of a 50-MW-class LIB ESS deployed on Jeju Island, South Korea Two standardized field tests—round-trip test (capacity) and HPPC test (DCIR)—were conducted annually. Using a 50-MW-class field dataset, rigorous temperature-compensated year-over-year comparisons and in-depth analyses of progressive intra-bank variability and localized hotspots were conducted. The main contributions are:
  • Temperature-Compensated Degradation Inference. A polynomial regression methodology was developed and validated to compensate state-of-health (SOH) and DCIR to 30 °C and 23 °C, respectively. Compensation reduced dispersion and clarified inter-year trends in both DCIR and SOH under heterogeneous field conditions while remaining practical with sparse temperature sensing, yielding per-year compensation tables.
  • Quantification of Intra-Bank Heterogeneity. Beyond mean shifts, bank-level dispersion metrics (e.g., DCIR standard deviation and upper-tail fractions such as top 25%/top 5% cells) increased monotonically with aging. These variability indicators provided early-warning signals complementary to average SOH/DCIR, revealing progressive imbalances across cells, racks, and banks.
  • Spatial Diagnostics and Structural Effects (Bank 03-01). Rack–module heatmaps of DCIR and temperature identified a localized hotspot near Racks 14–15, where SOH decline and DCIR growth intensified concurrently. The hotspot aligned with heating, ventilation, and air conditioning (HVAC)-driven airflow asymmetry and episodic fan operation; uncompensated DCIR distributions broadened during fan activity, whereas temperature-compensated maps isolated degradation-driven changes—motivating HVAC co-design and targeted monitoring.
By combining large-scale field data with regression-based temperature compensation and spatial diagnostics, this study proposes a scalable framework for diagnosing and managing degradation in utility-scale ESSs. The findings provide academic insight into spatial non-uniformity and thermally driven imbalance and practical guidance for operators—prioritizing hotspot surveillance, HVAC set-point/airflow co-optimization, and data-driven maintenance planning.

2. Operation of the ESS and Data Acquisition

2.1. System Architecture and Field Data Acquisition

This study analyzes operational data from a 50 MW-class FR ESS located in Geumak, Jeju Island, South Korea, collected from 2023 to 2025. The overall system architecture is shown in Figure 1. The site comprises thirteen 4 MW-class containers; each container generally includes two banks, with the last container comprising a single bank (total: 25 banks). Each bank consists of 19 racks, each rack contains 12 modules, and each module integrates 22 series-connected cells of 112 Ah nominal capacity.
At the system level, cells are grouped into modules via busbars, modules form racks, racks form banks, and banks are integrated into containerized units. Each container is equipped with HVAC to maintain thermal stability under outdoor operation. A site-wide battery management system (BMS) supervises safety and controls while an ESS delivers FR and peak-shaving services [17].
Unlike laboratory studies that rely on small samples under tightly controlled conditions, this work utilizes large-scale field data acquired during real operation, enabling evaluation under varying ambient temperatures, non-uniform airflow, and dynamic grid-driven duty cycles. Such conditions introduce spatial and temporal non-uniformity that is rarely observable in chamber-based tests but is essential for understanding system-scale behavior. Consequently, the field dataset supports like-for-like comparisons across years and scalable diagnostics of degradation (e.g., capacity-based SOH and DCIR) under actual operating environments [18].
To ensure comparability while preserving field realism, two standardized assessments were performed annually under operating conditions: the round-trip test (capacity/SOH) and the HPPC test (DCIR). These tests provide site-consistent references without departing from real-world constraints, thereby enabling year-to-year tracking of capacity fade and resistance growth across banks and racks.

2.2. SOH and DCIR Evaluation

2.2.1. SOH Estimation Using the Coulomb Counting Approach

Capacity fade is a primary indicator of LIBs degradation. As aging progresses, the usable capacity within a specified SOC window declines relative to the initial condition. Consequently, the charge required to traverse the same SOC interval decreases over time [19].
Figure 2 outlines the ESS-level degradation evaluation. During testing, the system follows a constant power load profile. Unlike cell- or module-level tests that typically use constant current, utility-scale ESSs operate with power conversion and grid interface constraints, making constant power operation more representative of field conditions [20]. In practical service, full charge–discharge across the entire SOC range is rarely feasible due to upper/lower SOC limits and safety margins [21]. Therefore, SOH is estimated from partial charge–discharge segments using Coulomb counting on 1 s sampled current/voltage/time signals.
SOC definition (for Equations (2) and (3)), with discharge current defined as negative:
S O C t % = S O C t 0 % + 100   % N o m i n a l   c a p a c i t y   A h t 0 t I τ 3600 d τ [ A h ]
where S O C t 0 is taken from the BMS at the window start, I ( τ ) is rack current, and the factor 1 / 3600 converts A·s to Ah.
The depth-of-discharge (DOD) for the segments indicated in Figure 2 is as follows:
D O D   % = S O C t 3   % S O C t 4 [ % ]   ( d i s c h a r g e )
D O D   % = S O C t 1   % S O C t 2   [ % ] ( c h a r g e )
Equations (2) and (3) use the SOC definition above; discharge current is negative by convention, and DOD is evaluated within the observed SOC interval.
Coulomb counting (Ah) over a discharge interval t 3 , t 4 is as follows:
C o u l o m b   c o u n t i n g   A h = t 3 t 4 I t 3600 d t
where I t is the current at time t , with discharge current negative, the leading minus sign. SOH is computed as follows from partial cycles over the available SOC window:
S O H   [ % ] = C o u l o m b   c o u n t i n g   [ A h ] N o m i n a l   c a p a c i t y   [ A h ] × ( D O D   % / 100 ) × 100
Equations (2) and (3) define DOD over the specified charge/discharge intervals. Equation (4) computes the transferred charge; Equations (1)–(5) use the same 1 s sampled current/time base for consistency. All quantities are evaluated within the available SOC window imposed by system operation, and no extrapolation beyond observed ranges is performed.

2.2.2. DCIR Evaluation Using the HPPC Test

As batteries age, DCIR typically increases; consequently, DCIR is widely used as a key indicator of degradation. In combination with capacity measurements, it enables a more comprehensive assessment of system-level SOH trends [22].
Figure 3 illustrates the charge–discharge procedure employed to determine DCIR. The test is performed at SOC-70%, during which a rated current is applied for approximately 10 s in both charge and discharge, while per-cell voltages are sampled at 1 s resolution. Accounting for the number of instrumented cells across the site (the last container comprises a single bank), this yields approximately 125,400 valid per-cell DCIR measurements per year. This procedure corresponds to the HPPC test, which is widely adopted for DCIR evaluation.
The 10 s pulse duration is chosen to capture not only ohmic resistance but also a portion of polarization resistance, thereby mitigating errors from instantaneous voltage fluctuations. During field operation of the target ESS, 1 s pulses introduced notable uncertainty in DCIR estimation, primarily due to communication bandwidth constraints and limited storage resolution that impeded reliable recording of fast transients. The 10 s duration therefore offers a practical balance between accuracy and robustness under field conditions [23].
Unlike capacity measurements—which rely on current integration—DCIR evaluation is fundamentally voltage based. In capacity analysis, the same current flows through all cells in a series-connected rack, so estimates are naturally aggregated at the rack level. In contrast, DCIR depends on each cell’s instantaneous voltage response, enabling per-cell estimation. In the studied site, this granularity permits extraction of DCIR values from up to 125,400 individual cell records per year, supporting finer-grained degradation assessment than capacity-based summaries.
Equation (6) is DCIR from the discharge pulse in Figure 3:
D C I R   [ m ] = v 1 v 2 [ m V ] I [ A ]
where v 1 denotes the open-circuit voltage (OCV) immediately before the current pulse, v 2 the terminal voltage after the pulse is applied, and I the current-step amplitude during the pulse. Absolute values ensure DCIR is reported as a positive quantity regardless of pulse direction. With voltage in mV and current in A, the ratio yields mΩ.
Operating conditions and validity domain. All HPPC-based DCIR estimates in this study were obtained at SOC = 70%, using 10 s charge/discharge pulses and 1 s sampling of per-cell voltage (and rack current). For each year’s HPPC, the module-average temperature included 23 °C. Temperature compensation is not extrapolated beyond each year’s observed range. DCIR results and year-to-year comparisons therefore apply to this operating point (SOC-70%, 10 s pulse, 1 s sampling) and within the temperature domains observed in the corresponding year.

2.3. Thermal Non-Uniformity Across Different Scales

Both SOH- and DCIR-based degradation evaluations are inherently influenced by temperature, which is a critical limitation under field conditions. In large-scale ESSs, system architecture further exacerbates spatial thermal non-uniformities. In contrast, most prior studies were conducted in uniformly controlled laboratory environments (e.g., temperature chambers) that do not adequately reflect real-world variability [17].
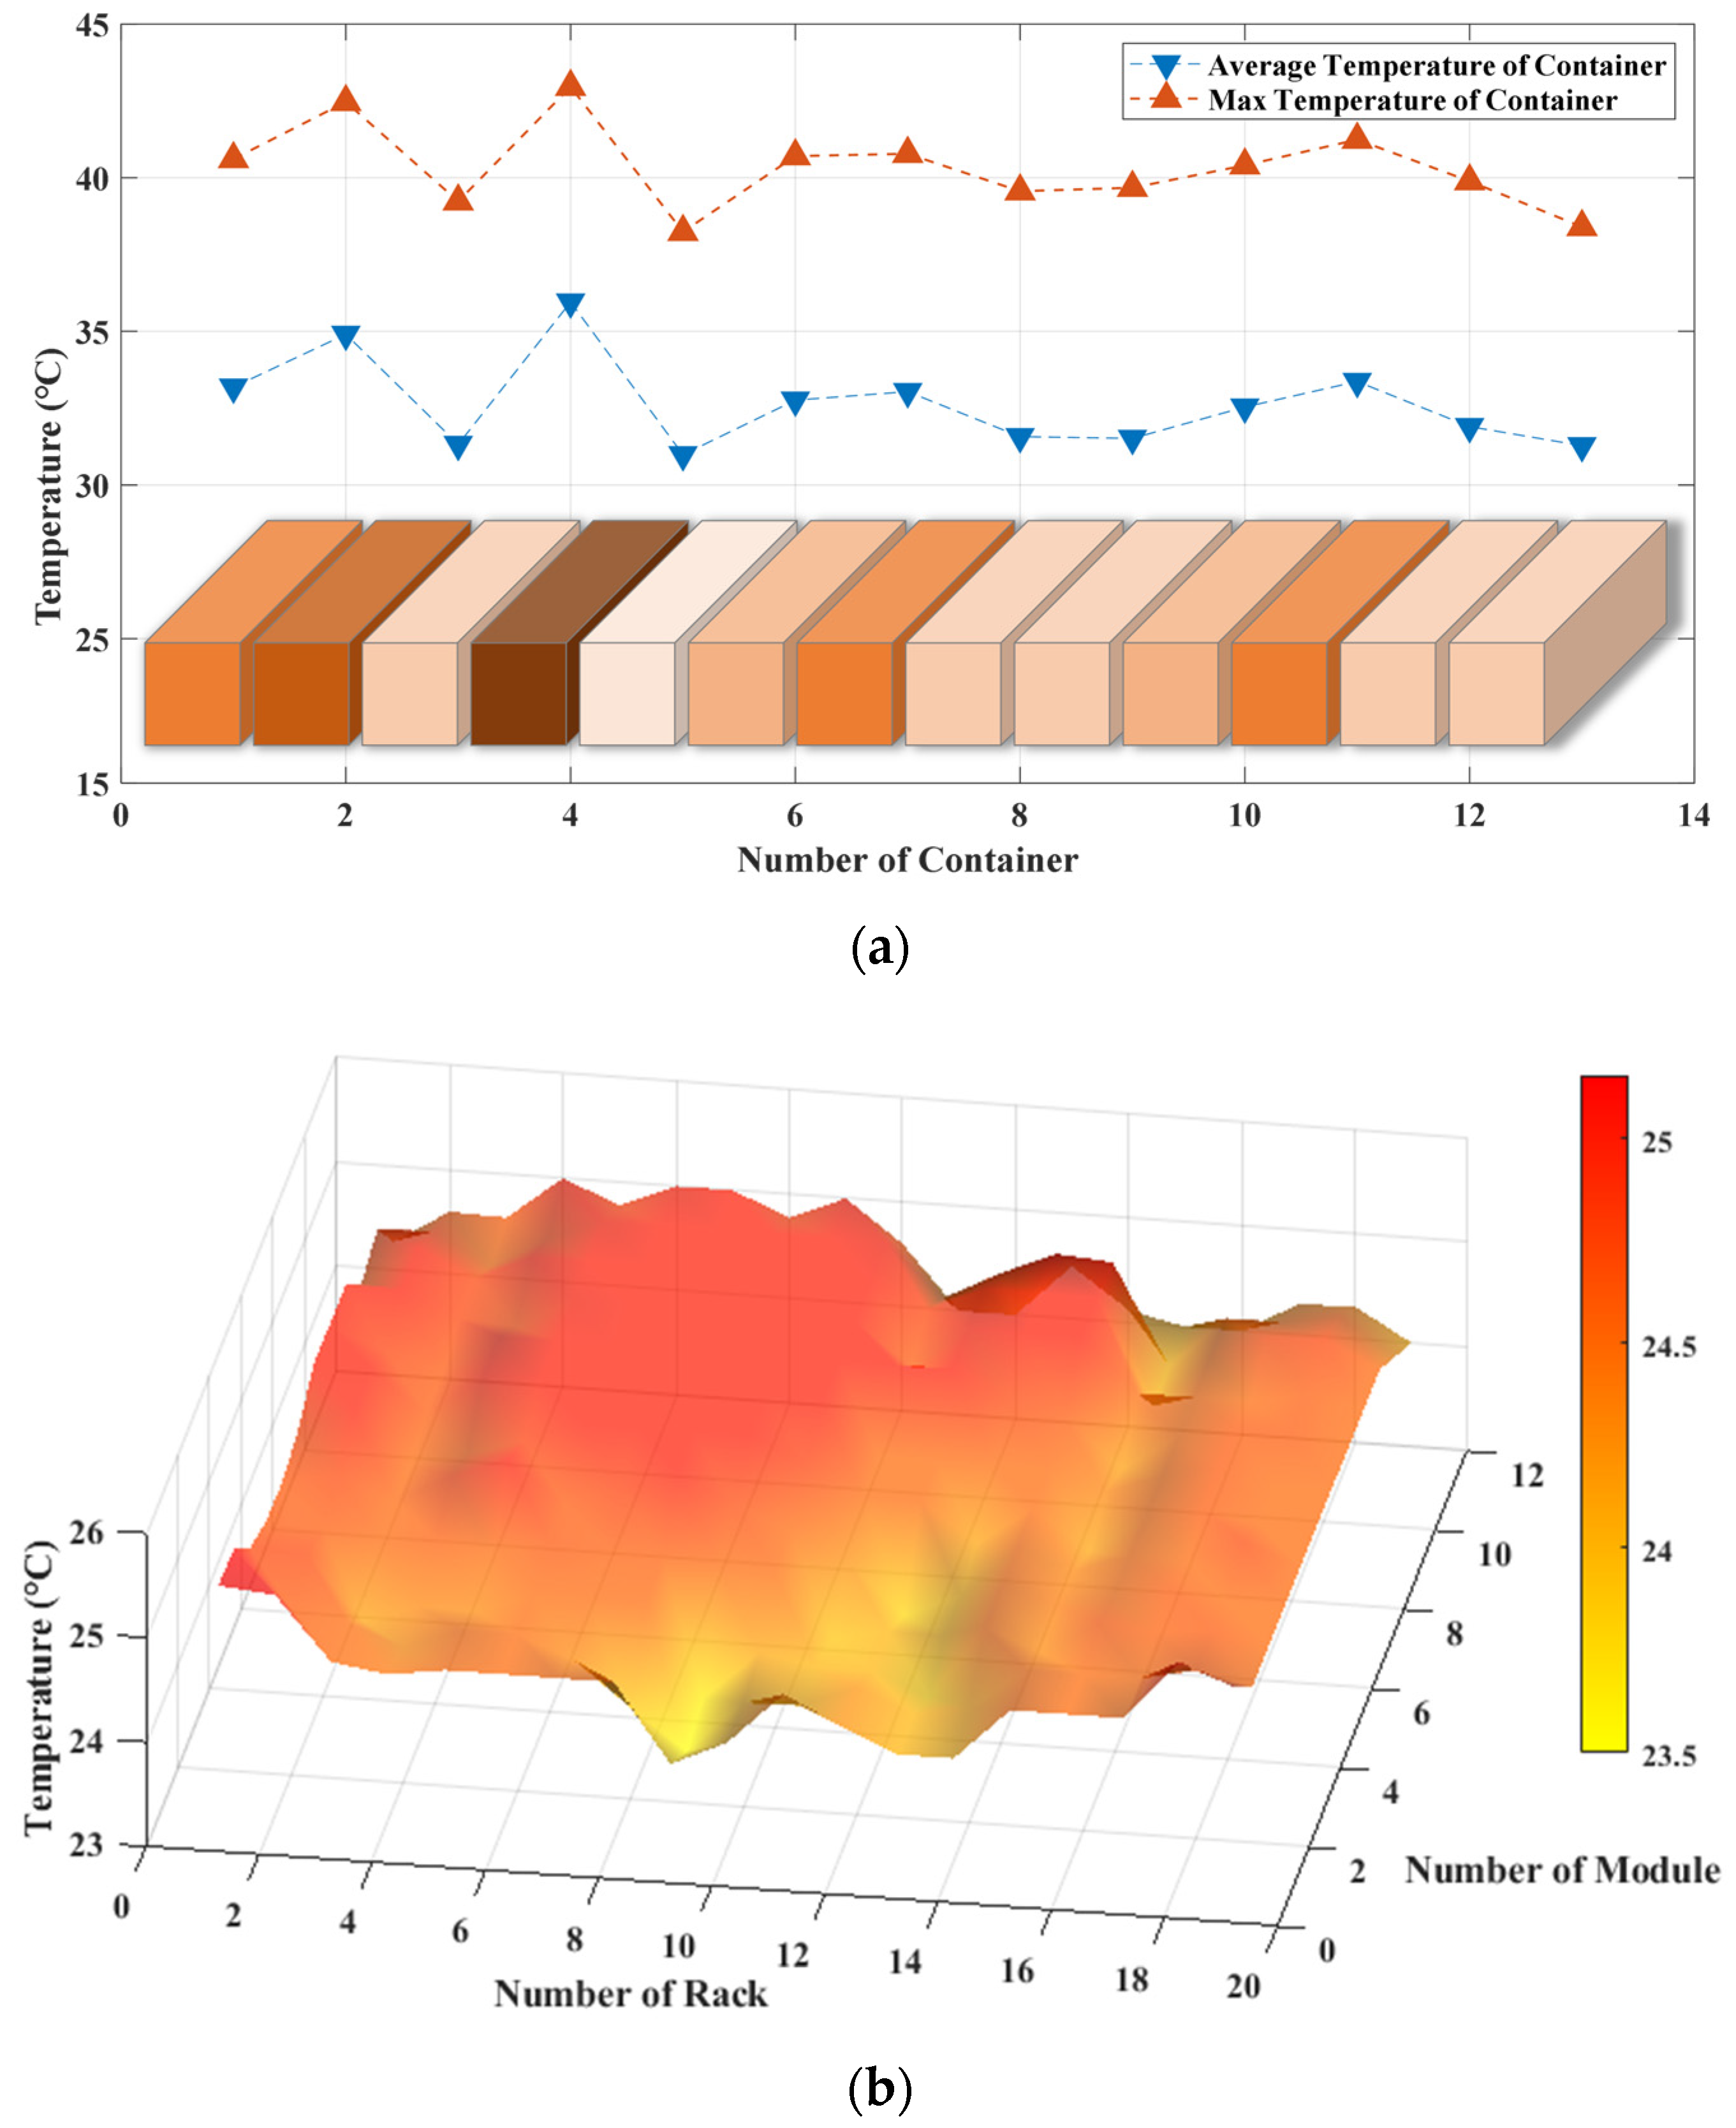
Figure 4a presents simultaneous temperature measurements from 13 operating containers. The schematic colors indicate relative temperature levels; “Max temperature of container” and “Average temperature of container” denote, respectively, the highest and mean module temperatures within each container. Even under the same evaluation procedure, the average temperatures of Containers 4 and 5 differed by more than 5–6 °C, and, within a single container, the gap between the maximum and average module temperatures reached approximately 7 °C. These observations confirm substantial thermal non-uniformity at the container level, with clear implications for degradation indicators such as capacity fade and resistance growth, thereby underscoring the need for temperature compensation in field analyses.
Figure 4b shows the module-level temperature distribution within Bank 1 of Container 1, highlighting spatial standard deviation due to module positioning. This non-uniformity arises from the container’s HVAC and cooling layout as well as structural factors. In this case, roughly 2 °C differences were observed among modules owing to airflow paths and fan placements, and such disparities can intensify under certain seasonal ambient conditions. Although no anemometry or computational fluid dynamics (CFD) was performed, container-level fan relay on/off flags recorded in the BMS logs were used as a qualitative proxy for airflow state. These flags were used to tag HPPC windows as “fan-off” or “fan-on” for the descriptive analyses in Section 4.3 and Section 5.
Assessing degradation without accounting for temperature therefore presents a considerable challenge. For multi-MW ESSs comprising thousands of cells, a compensation methodology is required that balances computational efficiency with accuracy. A robust yet practical temperature compensation approach should suppress thermal biases, enable like-for-like comparison across heterogeneous conditions, and reliably track outlier cells away from the temperature “centerline,” while remaining simple enough for direct deployment in real-world ESS operations [24].

3. Derivation of Temperature-Compensated DCIR Using Linear Regression Analysis

3.1. Thermal Dependence of DCIR

The internal resistance of LIBs is highly sensitive to temperature. At lower temperatures, DCIR typically increases due to reduced electrochemical reaction rates and ion mobility. In field-deployed, utility-scale ESSs, thermal conditions are neither uniform nor stationary: temperature fluctuations can significantly distort resistance-based indicators of degradation. This variability complicates direct comparison of DCIRs measured under different environments and motivates a practical, effective temperature compensation method.
As detailed in Section 2.2.2, DCIR was measured via HPPC at 70% SOC using 10 s current pulses: temperature was averaged over each pulse window. Given sparse temperature sensing at the bank/module level in utility-scale systems, a dataset-wide compensation method that scales to all cells is required.
To address this, the research analyzed the relationship between measured temperature and DCIR. A fourth-order polynomial regression was employed to capture the nonlinear temperature–DCIR behavior, balancing model flexibility and goodness-of-fit. The fitted regression curve was then used to estimate the expected DCIR at any temperature. A reference temperature of 23 °C, representative of typical ambient conditions, was chosen as the baseline. For each measurement, a compensation factor was computed as the ratio of the estimated DCIR at 23 °C to that at the actual measured temperature, and this factor was applied to compensate raw DCIR values to the reference. Unlike laboratory experiments on small, tightly controlled samples, these compensation factors were derived from a large-scale field dataset spanning diverse ambient temperatures and operational dynamics, yielding a more realistic and robust compensation.
Candidate polynomial orders were evaluated as follows. Table 1 compares degrees 1–8 fitted to identical temperature–DCIR datasets (2023–2025). The coefficient of determination R 2 served as the sole model selection metric for fit quality. In addition, the Vandermonde condition number ( C o n d N u m ) and an operation count surrogate Ops m n 2 were computed to indicate computational burden. For C o n d N u m , the evaluation grid was down-sampled to 2000 temperature points to keep the diagnostic memory bounded when the sample size far exceeds 2000. Definitions for R 2 , C o n d N u m , and O p s are given in Equations (7)–(9) as follows:
R 2 = 1 i = 1 m y i y ^ i 2 i = 1 m y i y ¯ i 2
where y i denotes the measured DCIR at sample i , y ^ i = R T i is the model-predicted DCIR from the polynomial R T defined in Equation (11), y ¯ is the sample mean of y i i = 1 m , m is the number of samples, and k is the selected polynomial degree ( k = 4 in this study).
C o n d N u m = k ( V )
where T j j = 1 G is a uniform temperature grid over the observed range (grid size G = 2000 used only for this diagnostic). T ~ j is the centered-and-scaled temperature consistent with the fitting procedure. V R G × n + 1 is the Vandermonde (polynomial-basis) matrix with entries V j , k = T ~ j k ( j = 1 , , G ; k = 0 , , n ) and k ( V ) is its two-norm condition number.
O p s = m n 2
where O p s an operation count surrogate indicating computational burden; m is the sample size; and n is the polynomial degree (larger n increases basis size and typical linear algebra costs roughly proportional to m n 2 ).
As the polynomial degree increases, R 2 rises monotonically, whereas C o n d N u m and O p s also increase, implying higher computational cost and potential numerical instability. An empirical is therefore required. In the least-correlated year (2023), R 2 plateaus beyond degree 4 (only marginal gains at higher orders), while C o n d N u m and O p s continue to escalate. Based on this worst-case fit, degree 4 was adopted as a parsimonious and sufficiently accurate specification for generating temperature-compensated factors.
To complement R 2 , the research reports mean absolute percentage error (MAPE) (e.g., Equation (10)) for degrees 1–8 (Table 1). These metrics are used not to maximize absolute predictive accuracy, but to identify where incremental gains begin to plateau while numerical burden (CondNum) and computational cost (Ops) escalate. For 2024–2025, errors decrease through degree 4 and show only marginal additional reductions thereafter, indicating convergence at or shortly after degree 4. For 2023, overall correlation is weaker—the campaign was the first post-installation DCIR run, and some measurements were not co-timed on the same dates which dilutes temperature–DCIR coupling—but the same practical pattern holds that beyond degree 4 improvements are minimal while CondNum/Ops grow by orders of magnitude. This research therefore adopts degree 4 as a parsimonious and numerically stable specification for deriving temperature-compensation factors. Equation (10) is as follows:
M A P E   % = 100 m i = 1 m y i y i ^ y i ,   y i > 0
with y i the measured DCIR (mΩ) and y ^ i the model prediction. Samples are 1 s discrete points within HPPC windows; year-specific values are listed in Table 1.
The algorithm was implemented in MATLAB R2023b environment using built-in polynomial routines and compiled into a stand-alone executable via MATLAB Compiler. In operation, the executable is not inserted in the communication path; it is executed offline on daily database snapshots that store telemetry collected during operation, enabling reproducible automated processing without interfering with communications.
Applicability and limits: The polynomial fits used to derive compensation factors are year-specific regressions trained on field data within each year’s observed temperature range. Compensation anchors are fixed at 23 °C for DCIR and 30 °C for SOH, reflecting the reference conditions used in Section 3.2 and Section 3.3. Accordingly, the reported dispersion reductions and clarified inter-year trends are valid for measurements acquired at SOC-70% under 10 s HPPC pulses with 1 s sampling, and for temperatures within the observed domain. Applying the method at different SOC setpoints, pulse durations, or outside the observed temperature range would require re-identification of regression coefficients from data gathered under those conditions.

3.1.1. Polynomial Regression for Temperature Compensation

Polynomial regression was used to model the nonlinear dependence of DCIR on temperature. By including higher-order terms, the model captures curvature that a purely linear fit would miss, which is common in electrochemical systems [25].
The general kth-order form is as follows:
R T =   β 0 + β 1 T + β 2 T 2 + + β k T k + ϵ
where R T is DCIR at temperature T ; β k are coefficients estimated by least-squares; and ϵ is the residual.
A fourth-order model was adopted to balance flexibility and overfitting: empirical comparisons (Section 3.1) showed negligible gains beyond degree 4 relative to the increased numerical/compute cost. Fitting used the full field dataset (not a small training subset), which is appropriate for robust temperature–DCIR characterization at scale.
The fitted function was then used to compensate measurements to a 23 °C reference (i.e., temperature compensation). For each observation, a compensation factor was computed as the ratio of the predicted DCIR at 23 °C to the prediction at the measured temperature, and this factor was applied to the raw per-cell DCIR. This compensation enables consistent comparison across heterogeneous thermal conditions and supports reliable degradation assessment from module to container level in utility-scale ESSs. Compensation and evaluation are restricted to the observed temperature range (no extrapolation).

3.1.2. Temperature Compensation of DCIR

By applying this methodology, DCIR acquired under diverse operating conditions can be compared on a common temperature basis, enabling more reliable identification of long-term trends and abnormal degradation across the ESS. Accordingly, this subsection presents an illustrative example in which the procedure is applied to temperature-resolved DCIR from the HPPC test, using the relationship in Equation (6).
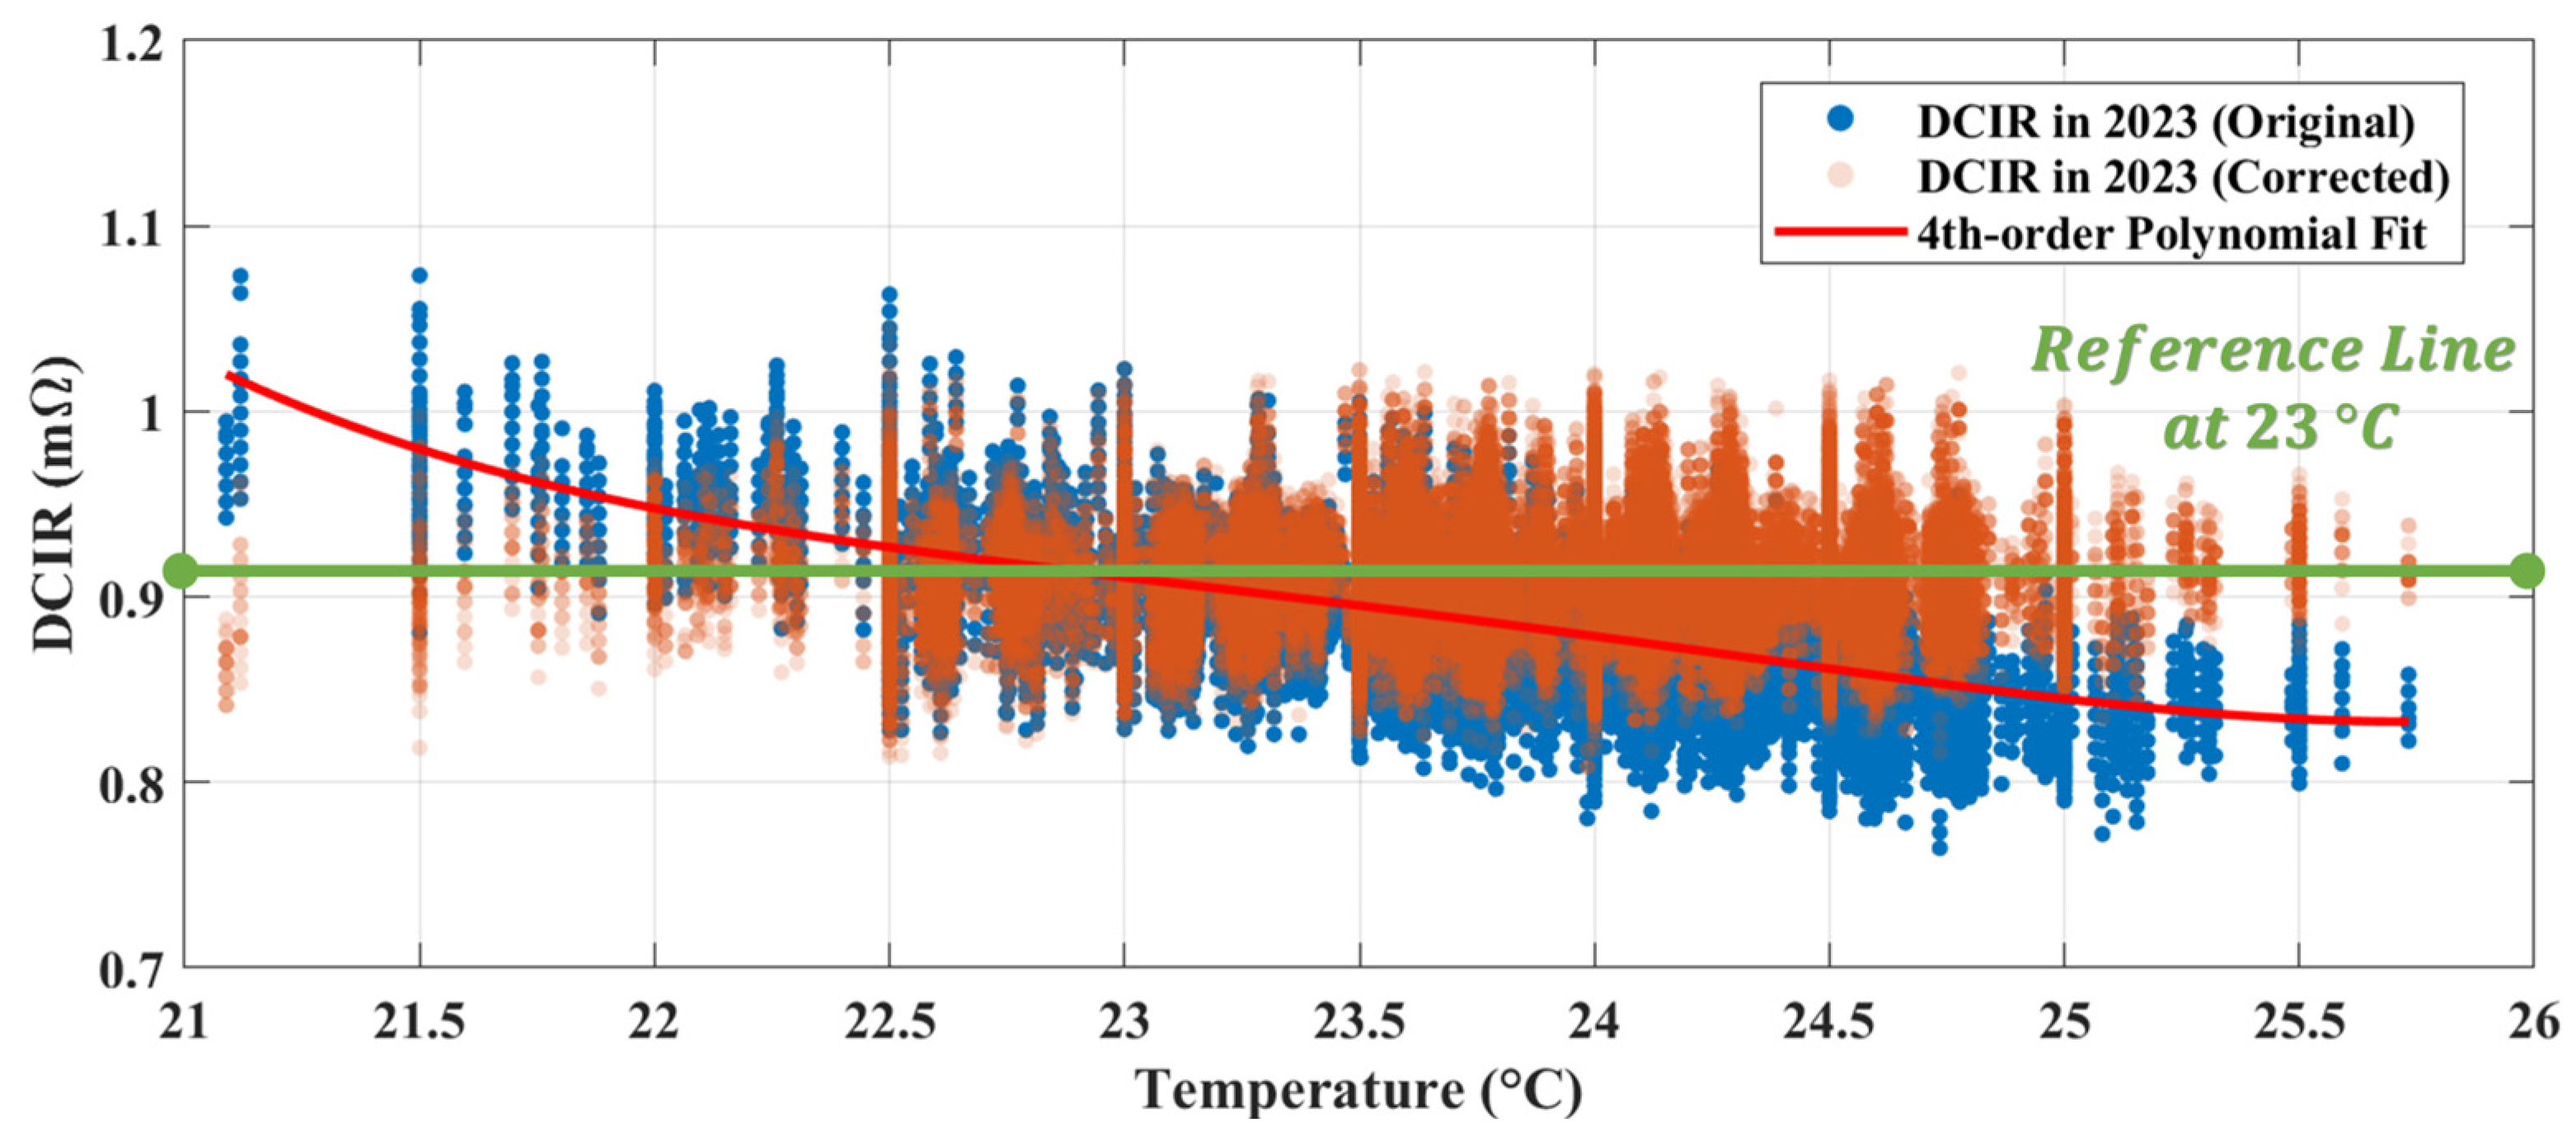
Figure 5 summarizes the workflow using DCIR obtained during HPPC measurements at the Geumak ESS in 2023, where Equation (6) is used to compute per-cell DCIR and the regression model provides the temperature compensation table. The blue scatter shows discharge resistance values measured at various temperatures (SOC = 70%). A fourth-order polynomial regression is fitted to capture the negative temperature–DCIR correlation: the red curve is the fitted regression and the green vertical line marks the 23 °C reference used for compensation. For each temperature, a compensation factor is defined as the ratio of the predicted DCIR at 23 °C to the prediction at the measured temperature. Applying these temperature-specific factors to all blue points yields the red (compensated) scatter. In short, the regression (e.g., Equation (12)) is fitted to the blue scatter; then, as summarized in Table 2, compensation factors equal to the offset relative to the 23 °C reference are derived and applied. Through this regression-based approach, DCIR values are compensated to a consistent temperature, enabling fair comparisons across heterogeneous thermal conditions [26]. Over the full 2023 dataset, compensation reduced the year-level standard deviation from 0.030 to 0.024, improving the reliability of inter-year comparisons.
Equation (12) represents the polynomial regression curve used in Figure 5:
y = 1.392 × 10 3 x 4 +   1.320 × 10 1 x 3 +   4.694 × 10 0 x 2 +   7.416 × 10 1 x 1 +   4.403 × 10 2
where x is temperature (°C) and y the DCIR (mΩ). Coefficients were estimated by least-squares using 125,400 temperature–resistance sample pairs from a single-year field dataset (year-specific fit). Samples are discrete, acquired at 1 s resolution within HPPC windows; evaluation is restricted to the observed temperature range. Because the regression is fitted on the full dataset, a compensation factor can be computed at any observed temperature by comparing the regression prediction at that temperature with the predicted DCIR at 23 °C.
Table 2 lists the per-temperature factors derived from the polynomial fit and the 23 °C reference DCIR. Multiplying the measured (uncompensated) DCIR by the corresponding factor yields the compensated DCIR at 23 °C. The same procedure was applied consistently in subsequent years to construct year-specific compensation tables.

3.2. Degradation Assessment Based on DCIR Measurements with Temperature Compensation

Figure 6 summarizes the distribution of discharge resistance (DCIR) across three operational years and the temperature dependence underlying those distributions.
Figure 6a shows raw (uncompensated) DCIR. Because DCIR is strongly temperature-dependent, the uncompensated histograms are wide and their standard deviations are large, implying that thermal effects inflate the apparent spread relative to intrinsic resistance standard deviation. This broadening obscures year-to-year degradation and can mask near-outlier cells.
Figure 6b presents DCIR after temperature compensation to 23 °C. The compensated histograms for 2023, 2024, and 2025 exhibit markedly smaller standard deviations, and the year-to-year increases in the mean DCIR become clearly distinguishable. Quantitatively, compensation reduced the annual standard deviation of DCIR by approximately 20%, 50%, and 64.51% in 2023, 2024, and 2025, respectively, thereby clarifying trends that were obscured in the uncompensated results and enabling reliable inter-year comparison on a like-for-like thermal basis.
Figure 6c depicts DCIR versus temperature prior to compensation and shows a strong negative correlation across all three years [27], reinforcing the need for compensation to remove thermal bias from resistance-based diagnostics.
In summary, temperature compensation not only sharpens year-to-year shifts in central tendency (mean DCIR) but also contracts dispersion, allowing large-scale tracking of cells at the distribution tails and improving sensitivity to emerging abnormal degradation.

3.3. Degradation Assessment Based on Capacity-Based SOH Measurements with Temperature Compensation

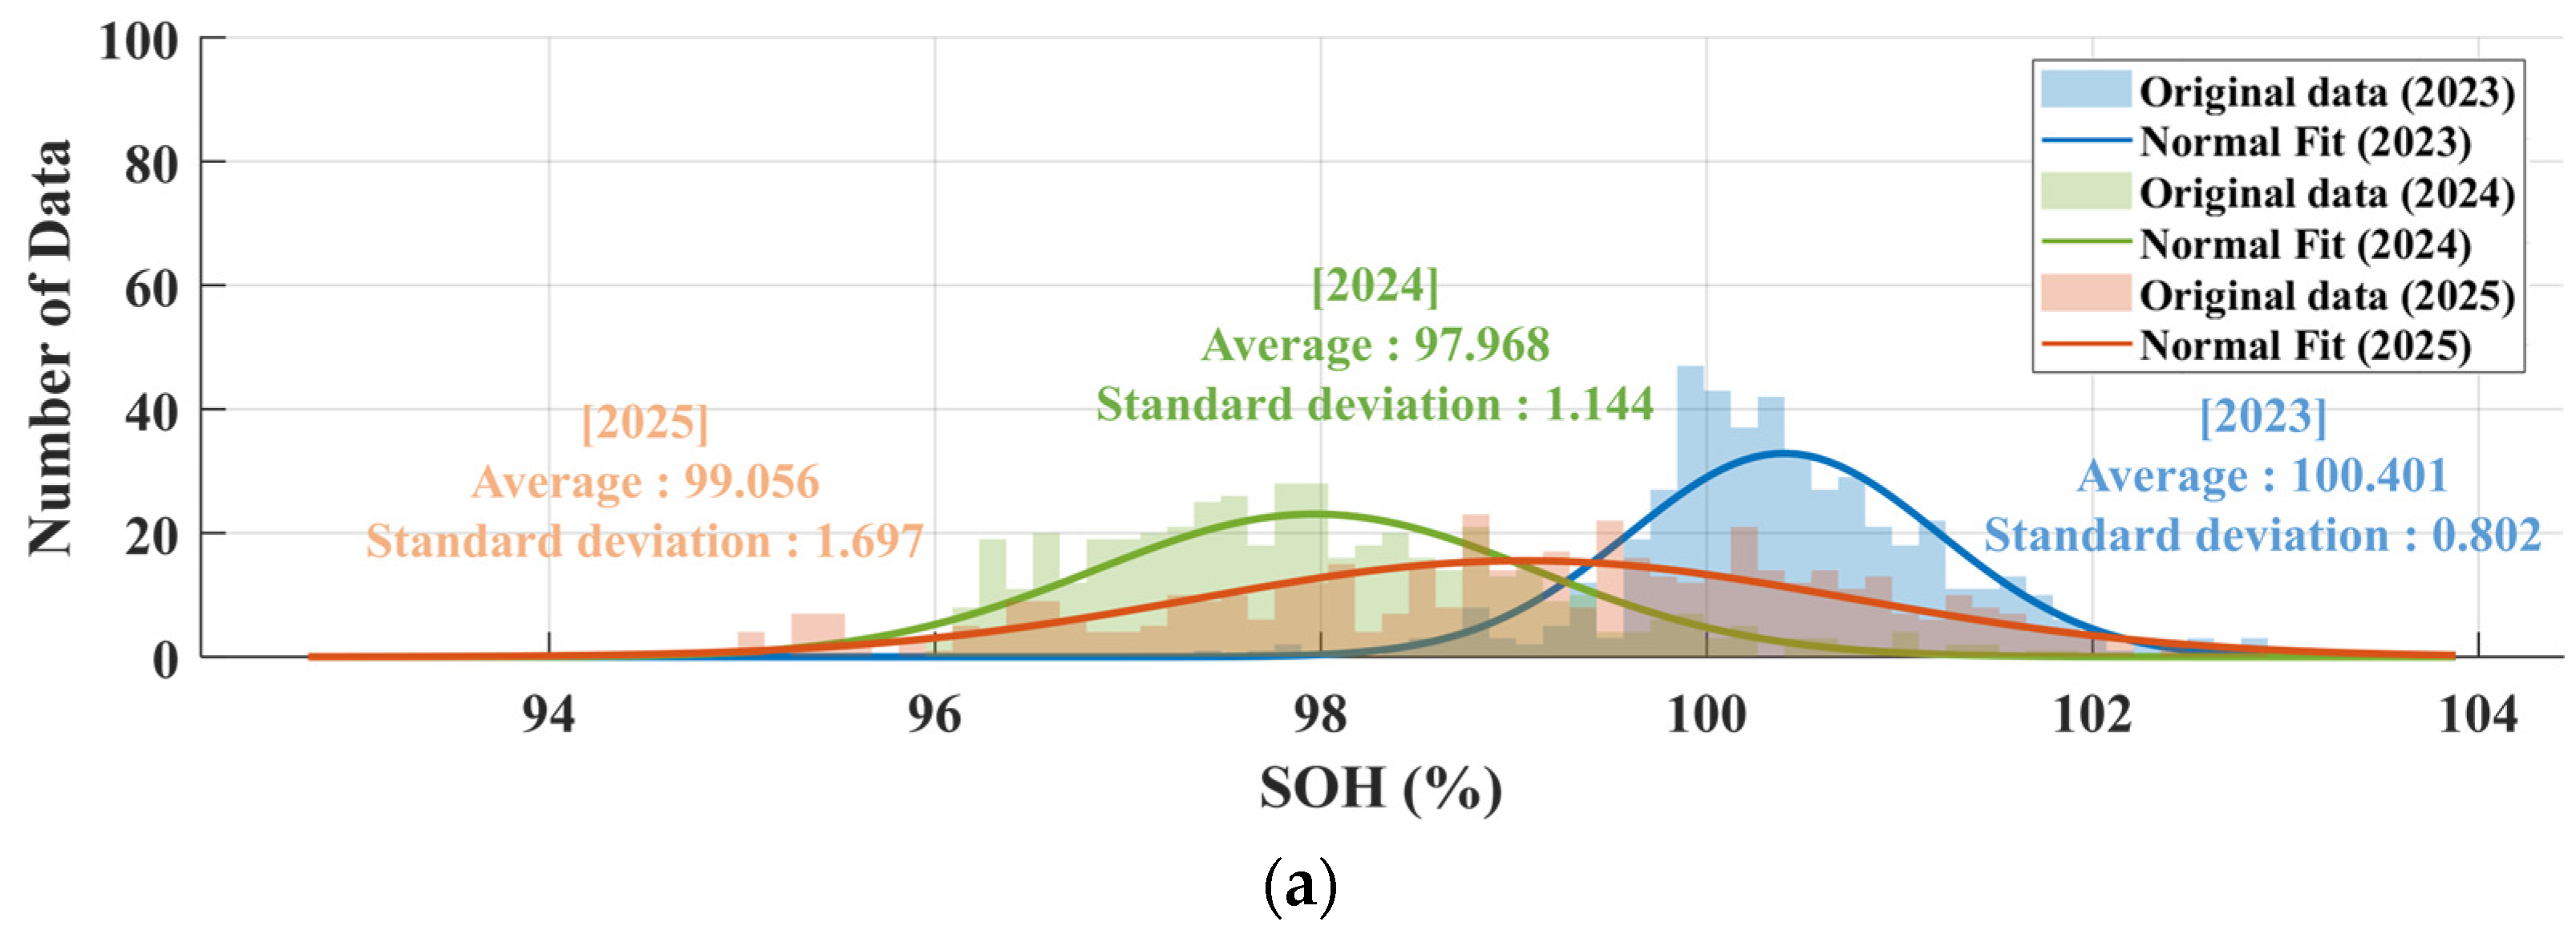
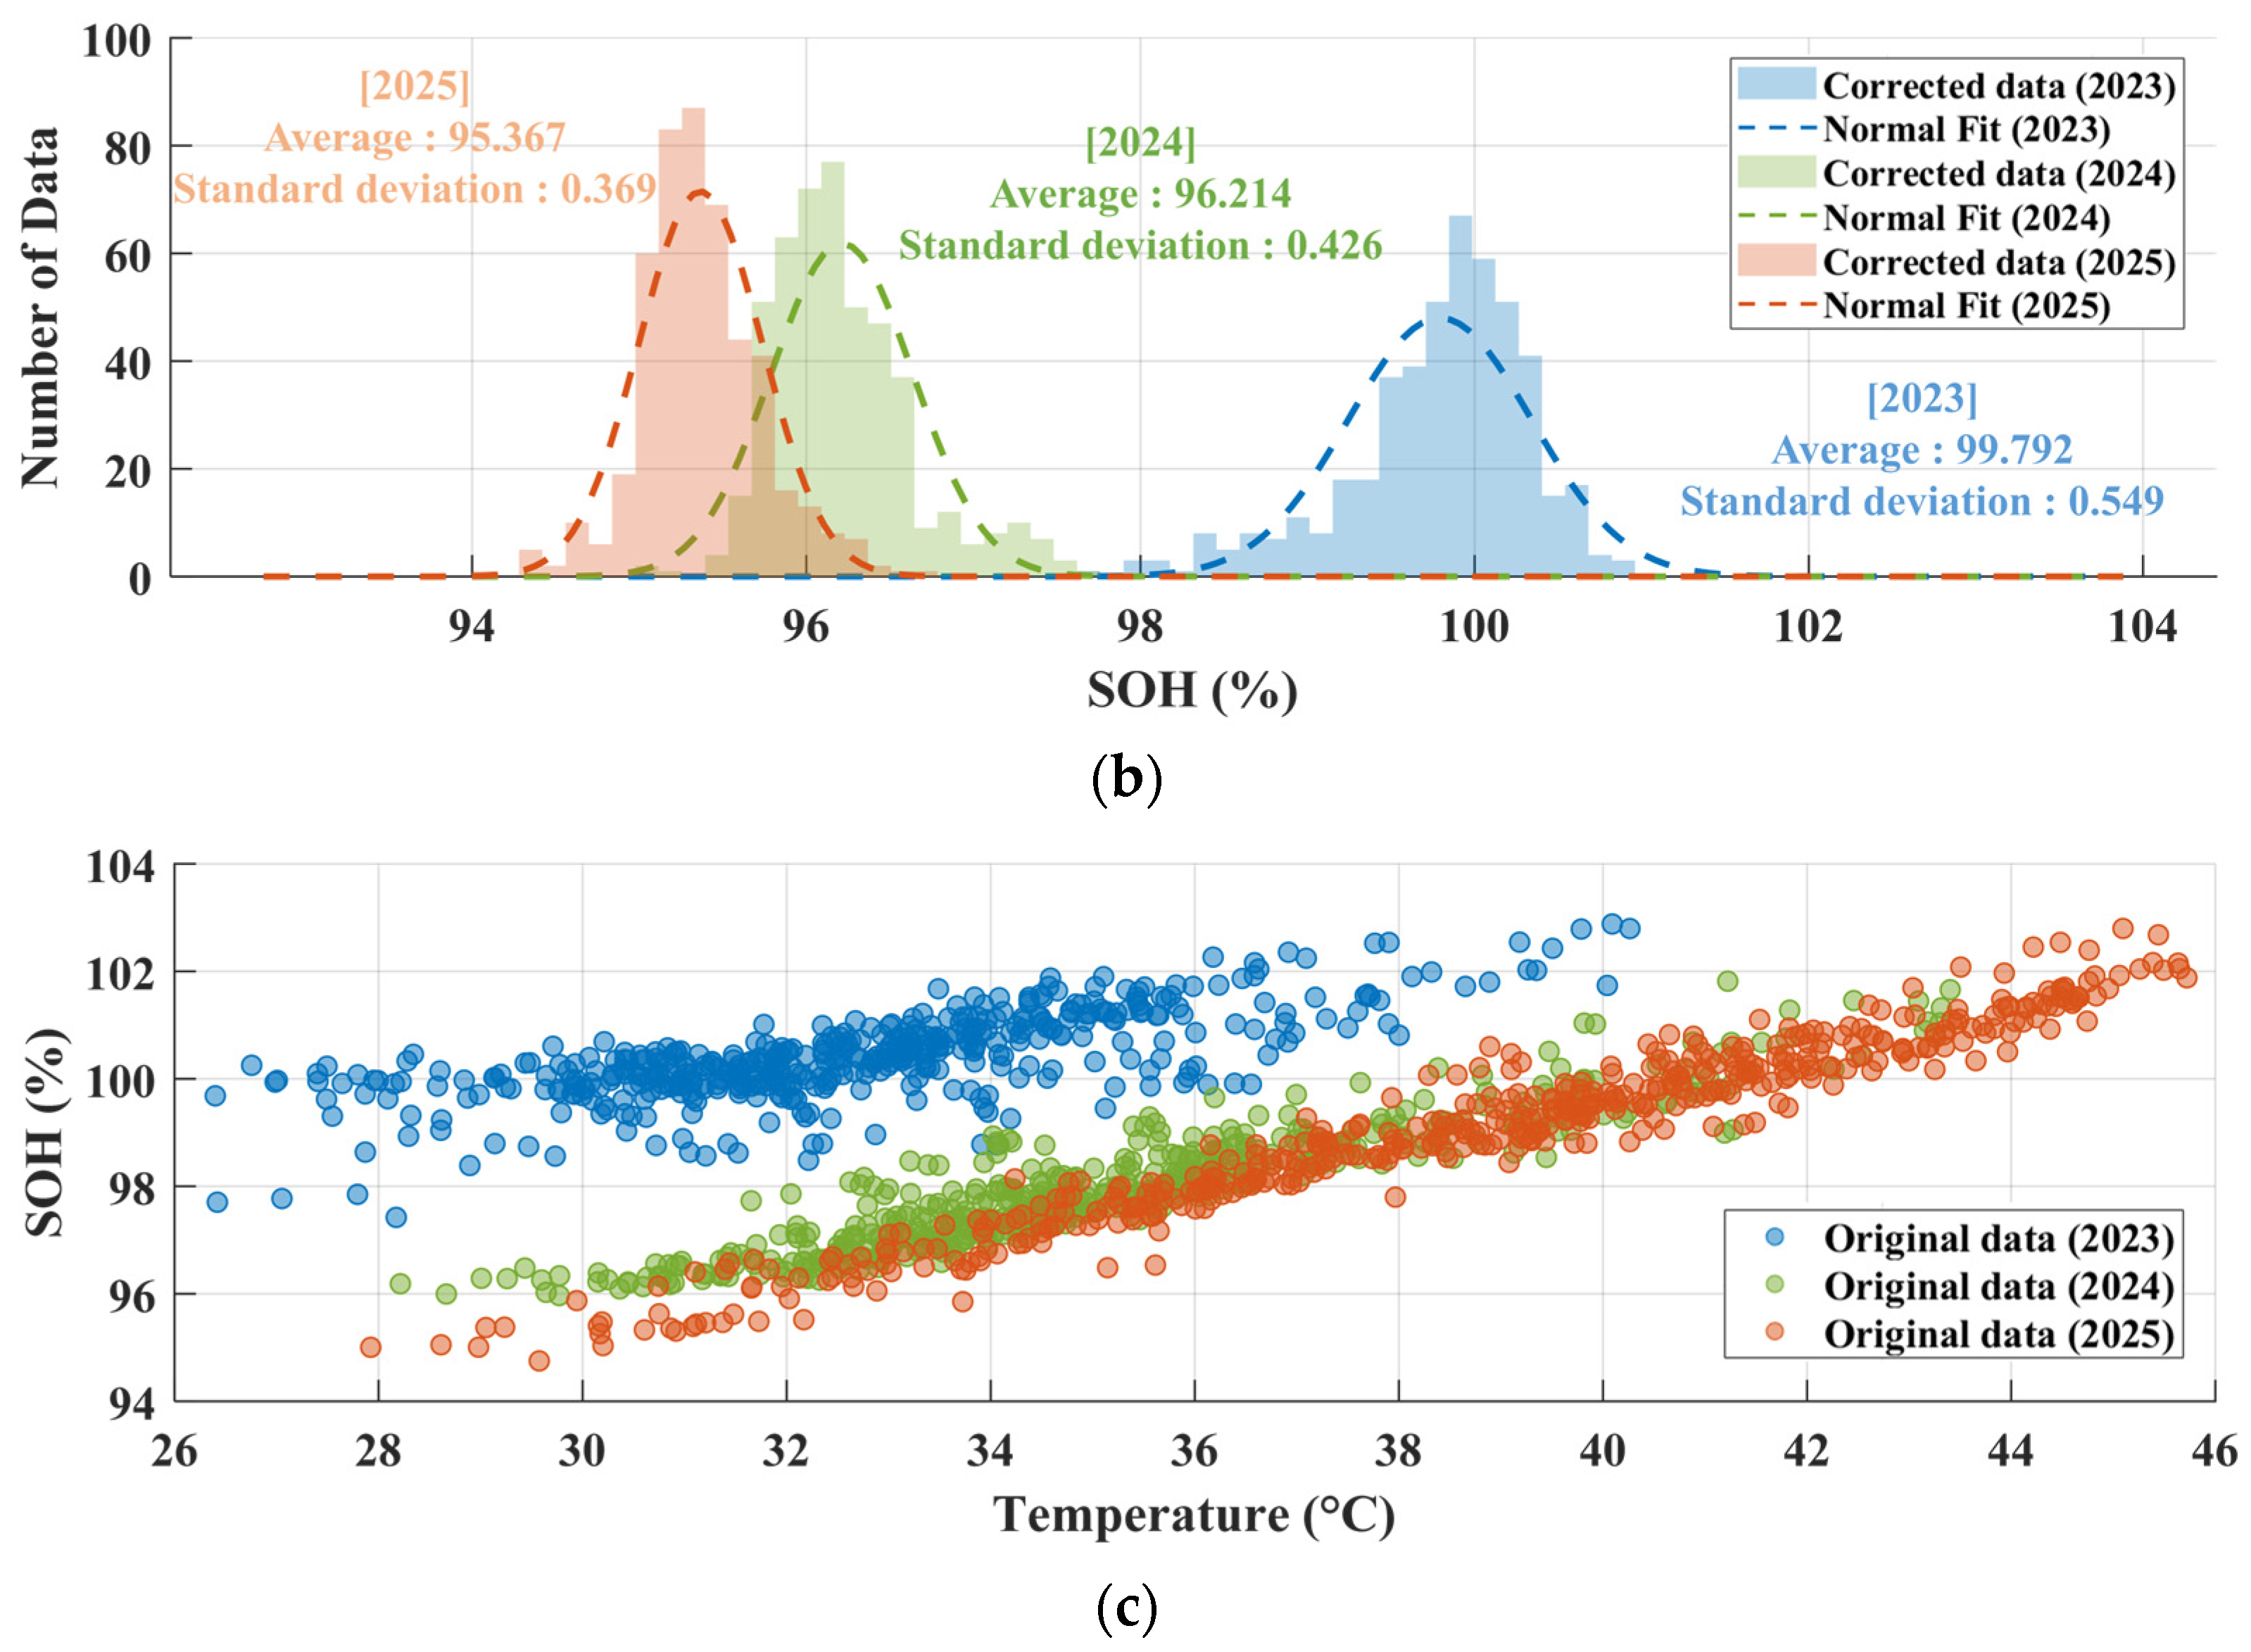
In this section, discharge capacity data from the annual round-trip tests were used to compute SOH via Equation (5). Temperature compensation was then applied using the same polynomial-regression approach as in Section 3.2, but with a 30 °C reference (reflecting the typical starting temperature of the round-trip tests). Figure 7 summarizes the SOH distributions and their temperature dependence for 2023–2025, before and after compensation.
Figure 7a shows uncompensated SOH. Without removing thermal influence, the standard deviations are relatively large—0.802, 1.144, and 1.697 for 2023, 2024, and 2025—indicating widespread standard deviation driven by temperature and making degradation trends difficult to discern.
Figure 7b presents SOH after compensation to 30 °C. The standard deviations shrink to 0.549, 0.426, and 0.369, enabling much more precise inter-year comparisons. Quantitatively, this corresponds to reductions of approximately 31.5%, 62.8%, and 78.3% in 2023, 2024, and 2025, respectively (average reduction ≈ 63%). The tighter dispersion yields more consistent year-over-year SOH trajectories across banks, while the compensated means exhibit clearer inter-year shifts, allowing more reliable identification of actual degradation trends. Overall, the compensation effectively mitigates ambiguity from temperature non-uniformities and supports meaningful system-scale SOH assessment.
Figure 7c shows SOH versus temperature prior to compensation, revealing a distinct positive correlation—higher temperature enhances reaction kinetics and can transiently increase discharge capacity [28], so more charge is accumulated over the same SOC interval, inflating SOH computed via Equation (5). Without compensation, this temperature-driven effect may be misread as improved health. The results underscore the necessity of quantitative compensation for credible SOH evaluation in large-scale field data.

4. Temperature-Compensated Degradation Analysis: Bank-Level Correlations and Structural Effects

4.1. Bank-Level Analysis of Correlated Trends in SOH Degradation and DCIR Growth

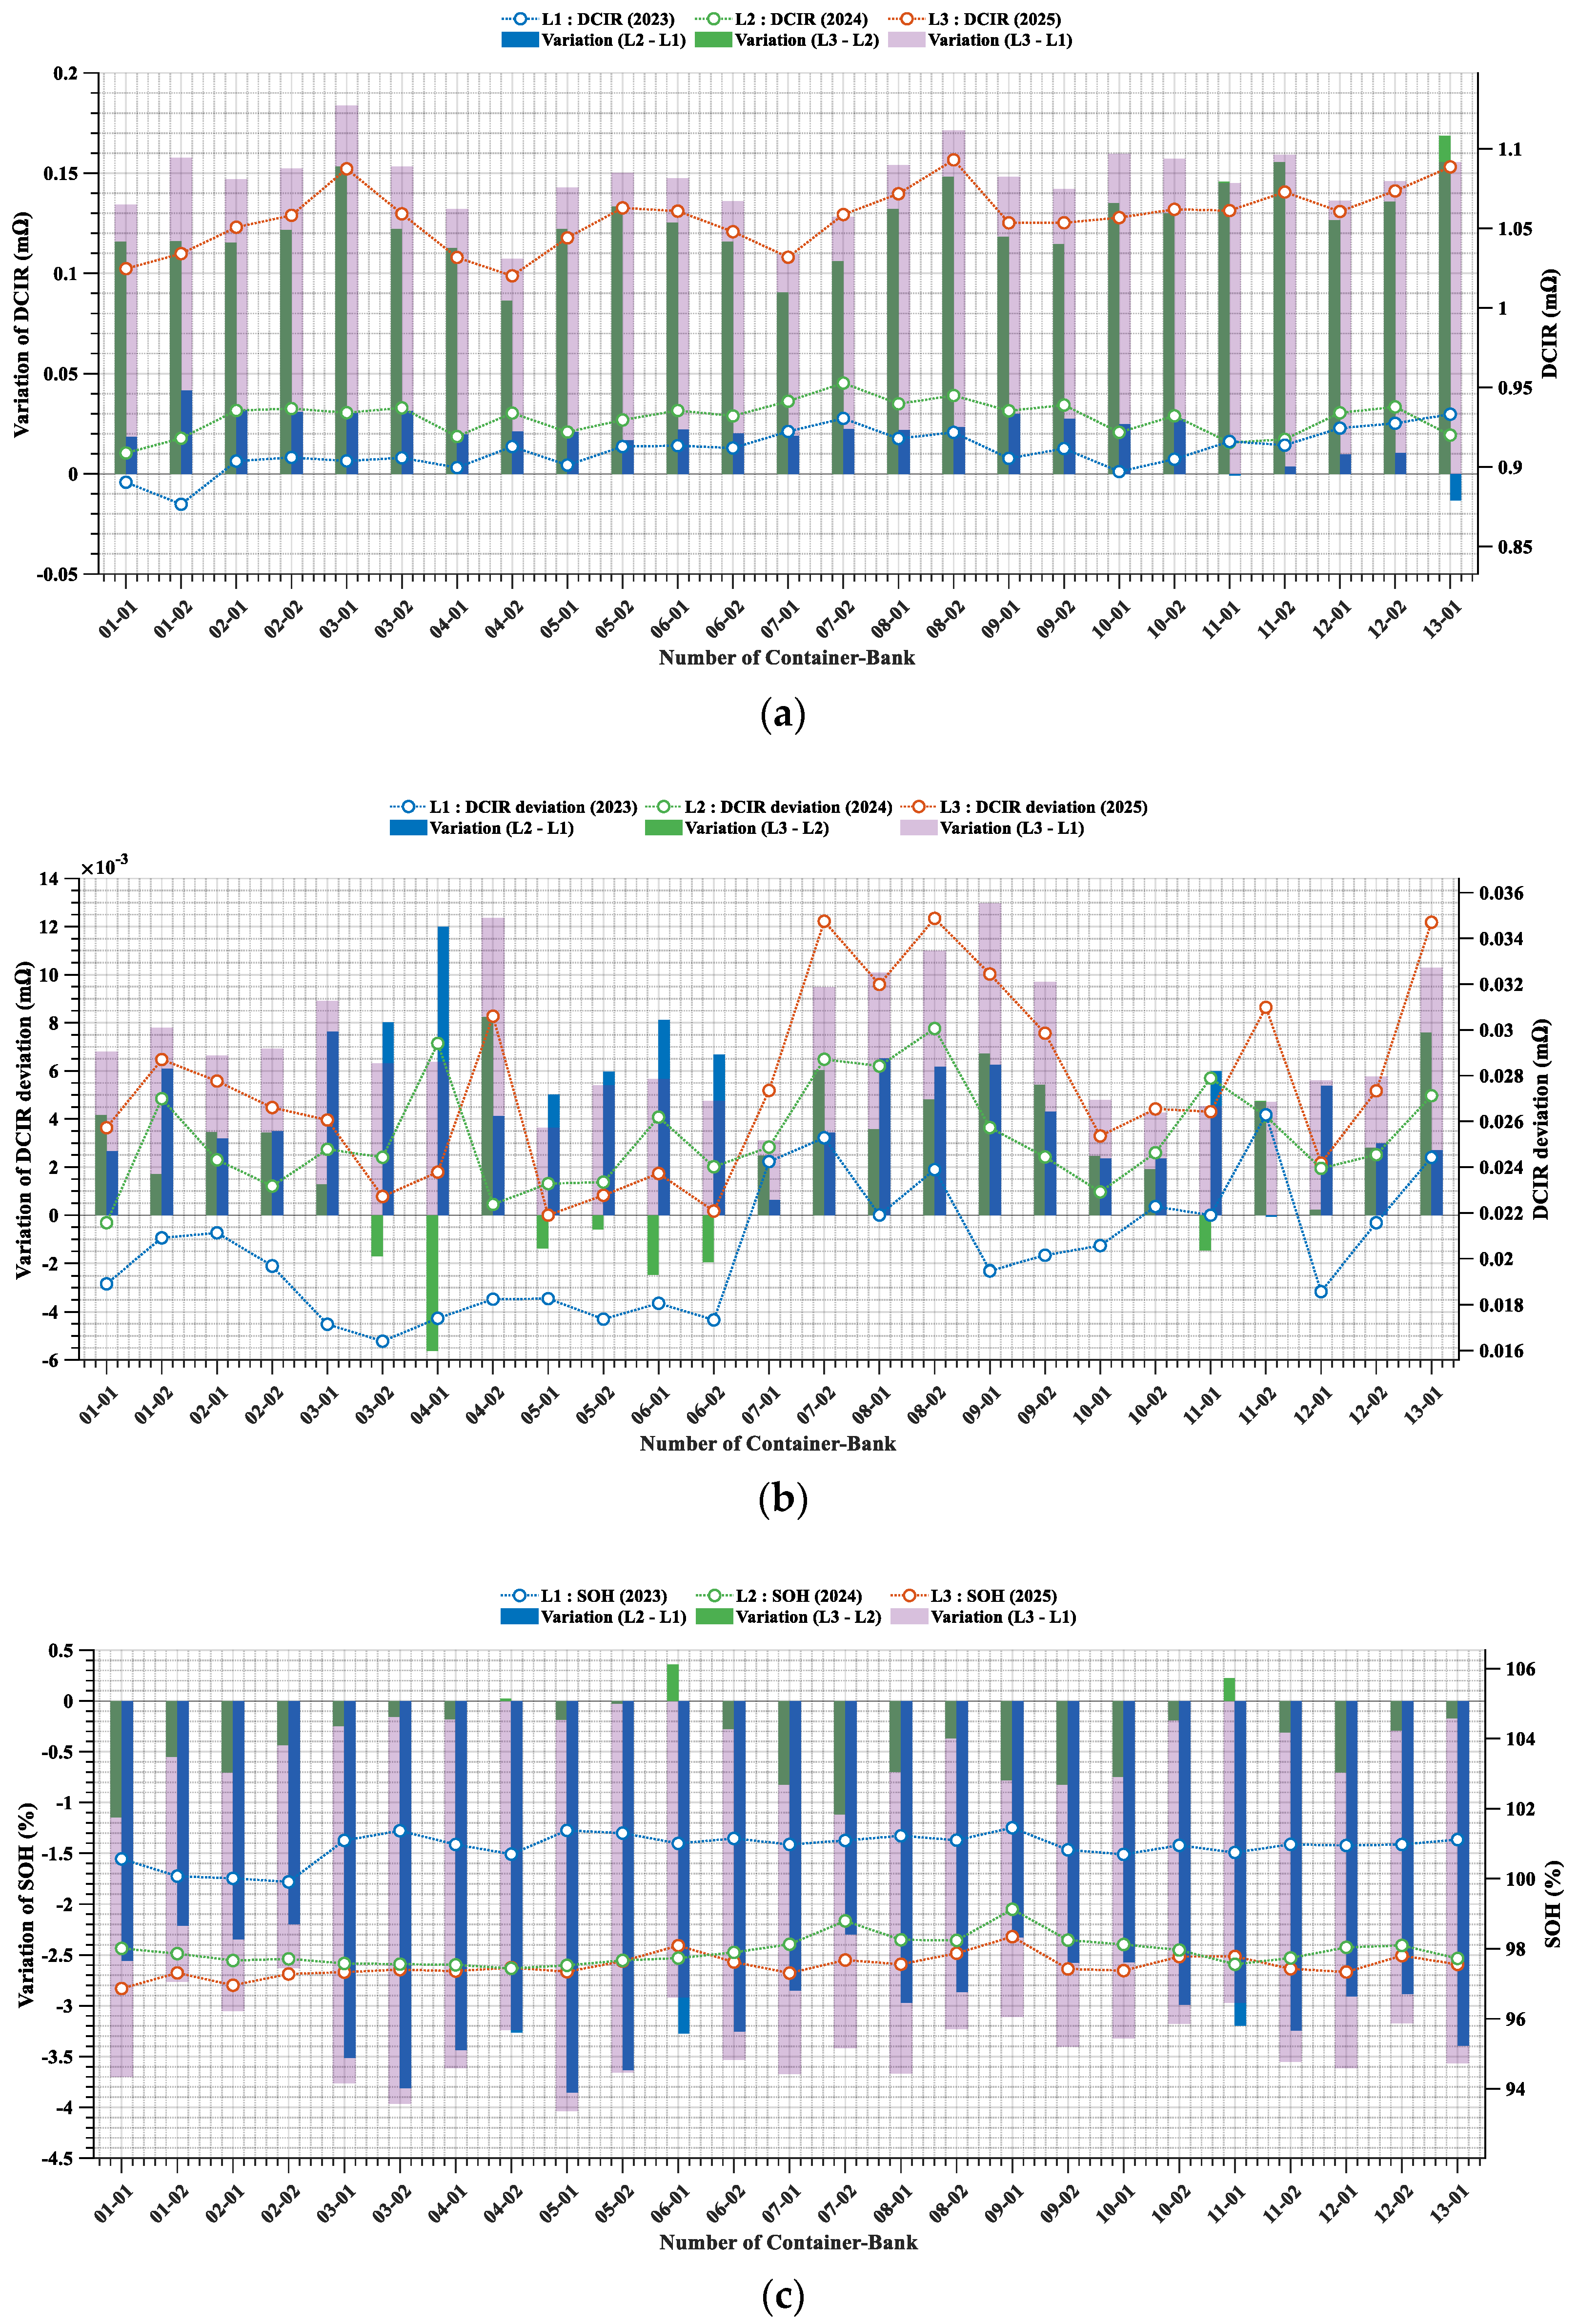
In this section, degradation-related anomalies are examined at the bank scale using the full system dataset summarized in Figure 8. Figure 8a and Figure 8c show, respectively, bank-level DCIR and SOH along with year-to-year changes (bars: increments; lines: absolute values). From 2023 to 2025, banks generally exhibited a near-linear increase in DCIR together with a decrease in SOH. In Figure 8a, the bank median DCIR increased from 0.9106 mΩ (2023) to 1.0568 mΩ (2025), a +0.1462 mΩ change (+16.05%). In Figure 8c, the bank median SOH decreased from 99.7924% (2023) to 95.3669% (2025), a −4.4255% change. Among all banks, Bank 01 of Container 03 (03-01) exhibited one of the steepest DCIR increases, rising by 0.1836 mΩ between 2023 and 2025.
Figure 8b presents the bank-wise standard deviation of DCIR. The across-bank median standard deviation (DCIR) rose from 0.0205 mΩ (2023) to 0.0276 mΩ (2025), i.e., +0.0071 mΩ (+34.63%). All banks showed an upward trend from 2023 to 2025. A larger dispersion indicates that cell DCIRs within a bank deviate further from the bank mean, evidencing intensifying internal imbalance. Beyond mean value indicators (DCIR and SOH), this widening dispersion is a critical field observation for utility-scale systems: degradation intensifies and amplifies intra-bank heterogeneity as the system ages [15,29]. Although SOH likely exhibits a similar tendency, direct verification is more difficult because SOH is measured at the rack level.
The progressive increase in intra-bank DCIR dispersion implies non-uniform aging, with localized hotspots becoming more pronounced over time. These insights are enabled by regression-based temperature compensation to a 23 °C reference, which compensates DCIR and permits precise quantification of intra-bank variability under real-world conditions [30]. Notably, the bank exhibiting the largest increase in dispersion is not necessarily the bank with the greatest mean-level degradation; therefore, both means and deviations should be considered for a faithful diagnosis of evolving imbalance in large-scale battery systems.

4.2. Case Study of Bank 03-01: Escalation of Abnormal Degradation

Figure 9 analyzes Bank 01 in Container 03 (03-01), identified as the most critical case where DCIR increase and SOH decline are most pronounced. (For reference, Bank 01 in Container 05—showing the largest capacity fade—was excluded because a brief communication error during the 2025 round-trip discharge test could bias the trend and correlation analysis.)
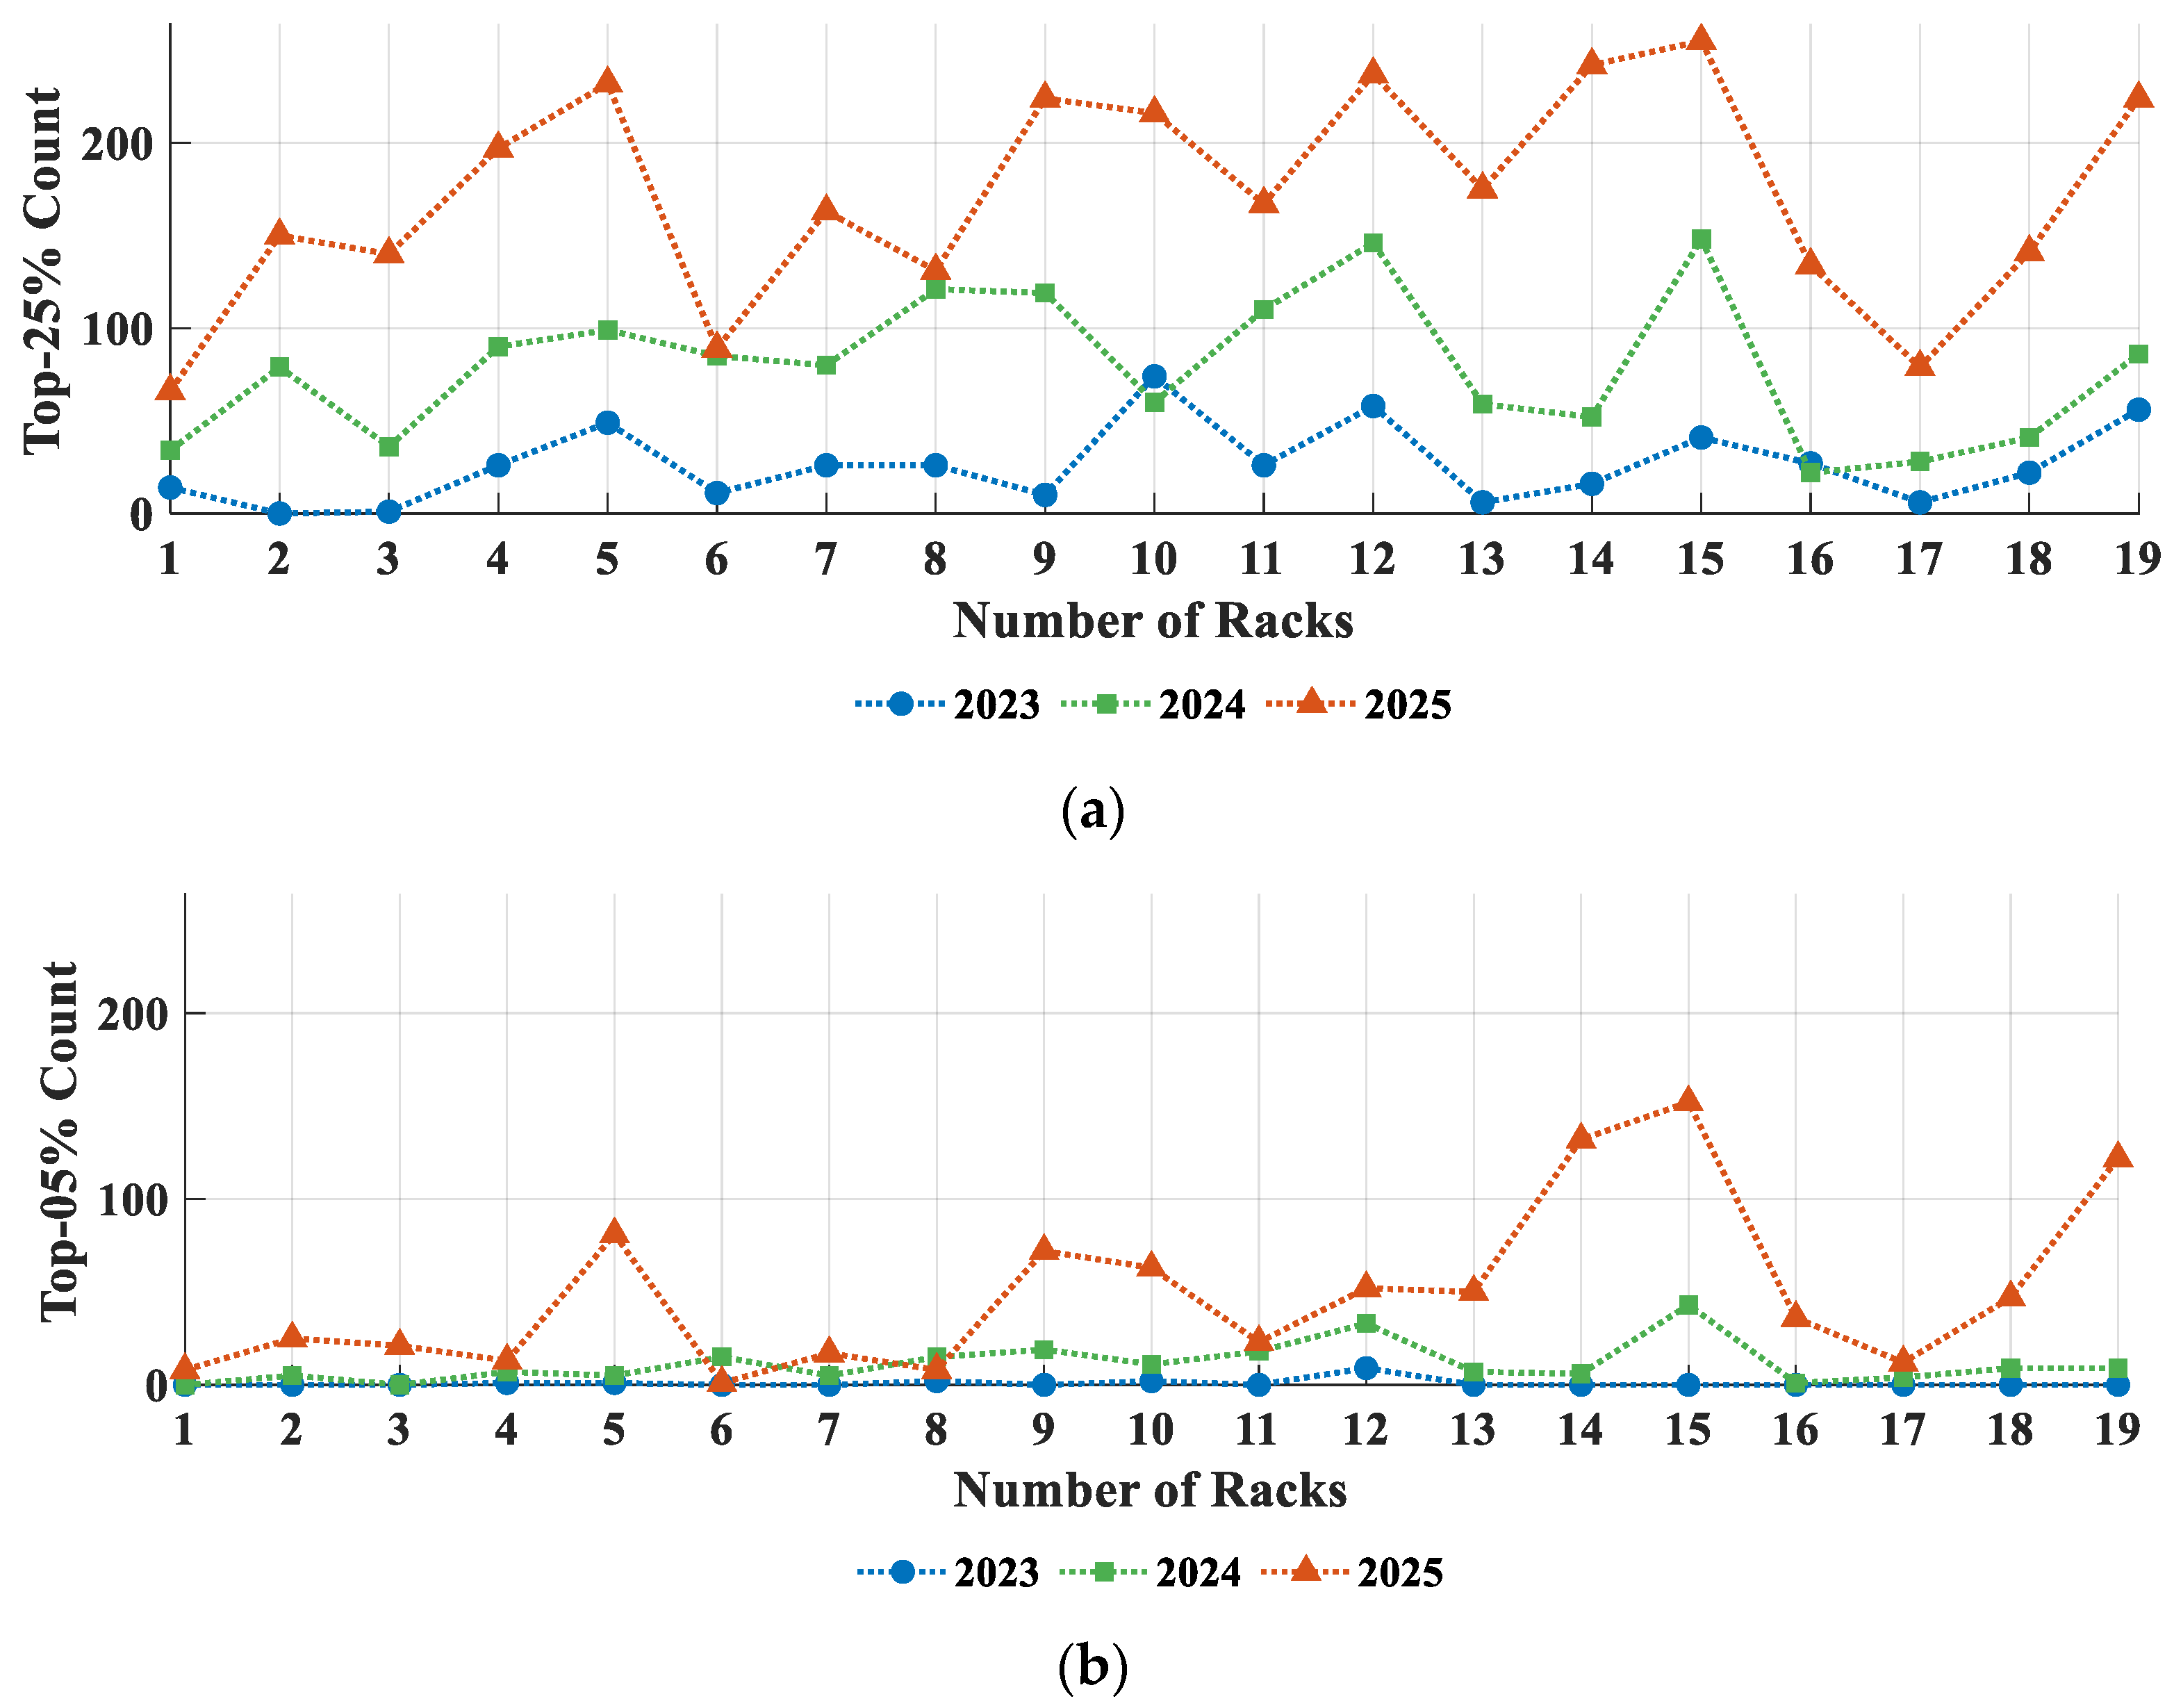
In Figure 9a, bars indicate, for each rack, the count of cells whose DCIR falls within the site-wide top 25% based on annual rankings across all cells in the 19 racks. Figure 9b presents the same metric for the site-wide top 5%. The trajectories demonstrate that, as degradation progresses, the proportion of high-resistance (abnormal) cells in 03-01 grows, indicating deepening internal imbalance. Quantitatively, in 2025, Racks 14–15 contained 132 and 152 cells, respectively, within the site-wide top 5% DCIR—up from 0 and 0 in 2023—confirming a concentrated cluster of high-resistance outliers.

4.3. Case Study of Bank 03-01: Analysis of Structural Effects and Temperature Compensation

Section 4.3 focuses on Bank 01 of Container 03, previously identified in Section 4.2 as a critical degradation hotspot. The objectives are twofold: (i) to validate the effect of temperature compensation on DCIR evaluation; (ii) to investigate structural factors that influence degradation. Figure 10 visualizes spatial distributions of DCIR and temperature using a standardized colormap, enabling direct comparison across years and positions. Structurally, lower module indices correspond to physically upper positions in the container.
Compensated DCIR (Figure 10a–c): Across all three years, modules in regions with both lower rack and lower module indices persistently show relatively low DCIR, and the spatial pattern is stable year-to-year. Progressive degradation is evident near Racks 14–15, where DCIR steadily increases over time. As summarized in Table 3, after compensation to 23 °C the year-specific DCIR spreads remain relatively narrow—0.0586 mΩ (2023), 0.0680 mΩ (2024), and 0.0916 mΩ (2025)—supporting like-for-like comparisons, while the means increase from 0.9039 mΩ (2023) to 1.0875 mΩ (2025).
Uncompensated DCIR (Figure 10d–f): In 2023 and 2024, uncompensated DCIR lies within narrower ranges, with upper-region modules (low module indices) showing relatively higher values. In 2025, the upper modules around Racks 14–15 become distinctly elevated, while lower-rack regions are comparatively lower. The 2025 uncompensated spread broadens to 0.2952 mΩ, approximately 3.2× the compensated spread in the same year (0.0916 mΩ), highlighting substantial thermal distortion without compensation (Table 3).
Temperature distributions (Figure 10g–i): Cooling fans are located at the upper-right of the container and activated once thermal thresholds are exceeded. Figure 10g,h capture non-operating-fan conditions, whereas Figure 10i reflects post-activation conditions. A top-to-bottom gradient of up to ≈5.5 °C (2025) is observed as cooler air flows downward, lowering temperatures in modules below. Table 3 shows that gradients increase from 2.00 °C (2023) to 2.18 °C (2024) and 5.50 °C (2025), while yearly means remain similar (23.94 °C, 24.29 °C, and 23.39 °C), indicating that positional non-uniformity can rise substantially even when annual means change little.
Using BMS fan on/off tags, research qualitatively contrasted HPPC windows under fan-off versus fan-on conditions. Consistent with Figure 10 and Table 3, fan-on windows exhibited broader uncorrected DCIR spreads, whereas 23 °C compensation restored narrow spreads and preserved the year-over-year rise in the mean—supporting airflow asymmetry as the driver of raw broadening and validating compensation as a reliable bias remover.
Two implications follow: First, temperature compensation to 23 °C is essential for reliable degradation assessment; without compensation, localized cooling effects (e.g., fan operation) introduce significant variability that obscures aging trends, whereas compensated maps accentuate degradation-driven DCIR changes. Second, frequent fan operation imposes non-uniform thermal cycling on specific modules—particularly around Racks 14–15—accelerating localized aging. Although direct airflow velocity or CFD data were not collected, the fan on/off states and vertical gradients in Figure 10g–i qualitatively evidence airflow asymmetry; with the cooling unit in the upper-right, the resultant downward cold-air stream aligns with elevated DCIRs near Racks 14–15. Accordingly, the localized degradation is interpreted as being driven primarily by non-uniform convective cooling rather than uniform ambient changes.
In summary, compensation narrows the 2025 DCIR spread from 0.2952 mΩ (uncompensated) to 0.0916 mΩ (compensated), while the mean DCIR still rises by ≈20.3% from 2023 to 2025, confirming genuine aging progression after removing thermal bias (Table 3).

5. Discussion

Field results provide insight into degradation mechanisms under real operating conditions. Temperature compensation via polynomial regression—to 23 °C for DCIR and 30 °C for SOH—substantially reduced dispersion and enabled clearer inter-year trends in both metrics, even under heterogeneous environments (see Table 3 for a bank-level example). Interpreted alongside laboratory literature that assumes uniform conditions, these findings highlight additional variability introduced at system scale by thermal non-uniformity and operational dynamics.
Comparative positioning and scope: Relative to prior laboratory and pilot-scale field studies, the present work specifies how much and under what conditions field indicators become more comparable. Under the compensated references (23 °C for DCIR at SOC = 70%, 10 s HPPC pulses; 30 °C for SOH at round-trip starts), dispersion contracts substantially (DCIR: ≈20%, 50%, and 64.51% in 2023–2025; SOH: 31.5%, 62.8%, and 78.3%), while mean shifts remain monotonic (bank-median DCIR +16.05%, SOH −4.4255%). This shows that compensation removes thermal bias rather than attenuating true aging signals. Furthermore, hotspot detectability improves at utility scale; in Bank 03-01, Racks 14–15 accumulated 132/152 top 5% DCIR cells in 2025 (vs. 0/0 in 2023), revealing localized aging masked without compensation.
Unlike laboratory studies with uniform temperature and controlled cycling, utility-scale ESSs operate under fluctuating ambient conditions, non-uniform airflow, and dynamic grid-driven duty cycles. The field dataset revealed progressive intra-bank heterogeneity and localized hotspots—phenomena rarely observable in chamber-based or module-level experiments [31,32]. These results indicate that utility-scale degradation pathways cannot be fully inferred from laboratory protocols, underscoring the need for long-term field investigations.
Qualitative corroboration under field conditions: The spatial co-location of (i) increasing temperature-compensated DCIR at Racks 14–15 over 2023–2025 (Figure 10a–c) and (ii) a stable positional pattern consistent with the known fan placement in the upper-right (Figure 10g–i), non-operating vs. operating) supports structural airflow asymmetry as a primary driver of the observed hotspot. Even when yearly mean temperature was similar (Table 3), the positional temperature gradient expanded markedly in 2025, and the uncompensated DCIR spread widened in parallel (Figure 10f), consistent with localized cooling and re-heating cycles. Taken together, these observations indicate that the hotspot at Racks 14–15 reflects genuine, location-specific aging pressure under real HVAC duty cycles.
Crucially, considering not only mean indicators (SOH, DCIR) but also their statistical deviations exposed a progressive increase in intra-bank heterogeneity. This interpretation is reinforced by the 03-01 case study; spatial maps show a stable structural pattern across years, while a localized DCIR increase emerges near Racks 14–15, coincident with HVAC-driven airflow asymmetry and episodic fan operation. Uncompensated DCIR distributions broaden markedly when fans are active, whereas compensated maps isolate degradation-driven changes. Practically, the ability to detect localized abnormal cells suggests applications for predictive maintenance and early fault diagnosis. Future studies should investigate coupling effects among temperature, load dynamics, and operational strategies on degradation, and validate the methodology across chemistries and deployment scales.

6. Conclusions

This study conducted a three-year, utility-scale assessment of a 50 MW-class lithium-ion ESS, integrating annual round-trip (capacity) and HPPC (DCIR) tests with temperature compensation—to 30 °C for SOH and 23 °C for DCIR. The approach enabled reliable inter-year comparisons, revealed progressive capacity fade and resistance growth, and—importantly—exposed increasing intra-bank variability indicative of deepening internal imbalance. A focused spatial analysis (Bank 03-01) linked a localized hotspot to HVAC-driven airflow asymmetry, illustrating how environmental controls shape degradation patterns at scale. Consistently rising compensated DCIR at Racks 14–15 across years, widening positional temperature gradients under fan operation, and increasing intra-bank dispersion support a mechanistic interpretation: structural airflow asymmetry accelerates localized aging. These field-observable patterns, together with the quantitative tables and maps, strengthen the reliability of the conclusions beyond figure inspection alone.
These findings underscore the importance of integrating temperature compensation, spatial mapping, and deviation-based diagnostics into field ESS monitoring frameworks. The proposed methodology offers a practical, scalable route for the early detection of abnormal degradation, providing both academic insight into spatially non-uniform aging and actionable guidance for operators seeking to enhance the reliability and lifecycle management of large-scale ESSs. Future work will incorporate direct airflow measurements or CFDs to validate and generalize these qualitative insights across sites and system designs and extend the methodology to additional chemistries and duty profiles.

Author Contributions

Conceptualization, T.M. and S.-E.L.; methodology, T.M.; software, T.M.; validation, T.M. and S.-E.L.; formal analysis, T.M.; investigation, T.M. and C.N.; resources, T.M., C.N. and S.-E.L.; data curation, T.M. and C.N.; writing—original draft preparation, T.M.; writing—review and editing, T.M. and S.-E.L.; visualization, T.M. All authors have read and agreed to the published version of the manuscript.

Funding

This work was supported by the Republic of Korea Electric Power Corporation’s main research and development project. [Task name: Development of LIB Degradation Management System for Grid-ESS/task number: R24TA10].

Data Availability Statement

The original contributions presented in this study are included in the article. Further inquiries can be directed to the corresponding author.

Conflicts of Interest

Authors T.M., C.N., and S.-E.L. are employed by the Korea Electric Power Corporation (KEPCO), Korea Electric Power Research Institute. The patent used in this study (Patent No. 2025-0130025) is owned by KEPCO. Authors T.M., C.N., and S.-E.L. have received research funding from KEPCO and are also the inventors of the aforementioned patent.

Abbreviations

The following abbreviations are used in this manuscript:
ESSEnergy Storage System
DCIRDirect Current Internal Resistance
SOHState-of-health
SOCState-of-charge
HPPCHybrid Pulse Power Characterization
FRFrequency Regulation
LIBsLithium-Ion Batteries
ICAIncremental Capacity Analysis
EISElectrochemical impedance spectroscopy
LAMLoss of Active Material
LLILoss of Lithium Inventory
HVACHeating, Ventilation, and Air Conditioning
BMSBattery Management System
DODDepth-of-discharge
OCVOpen-circuit Voltage
CFDComputational Fluid Dynamics
MAPEMean Absolute Percentage Error

References

  1. Luo, X.; Wang, J.; Dooner, M.; Clarke, J. Overview of current development in electrical energy storage technologies and the application potential in power system operation. Appl. Energy 2015, 137, 511–536. [Google Scholar] [CrossRef]
  2. Tasneem, O.; Tasneem, H.; Xian, X. Lithium-Ion Battery Technologies for Grid-Scale Renewable Energy Storage. Next Res. 2025, 2, 100297. [Google Scholar] [CrossRef]
  3. Gräf, D.; Marschewski, J.; Ibing, L.; Huckebrink, D.; Fiebrandt, M.; Hanau, G.; Bertsch, V. What drives capacity degradation in utility-scale battery energy storage systems? The impact of operating strategy and temperature in different grid applications. J. Energy Storage 2022, 47, 103533. [Google Scholar] [CrossRef]
  4. Wei, Y.; Wang, M.; Zhang, M.; Cai, T.; Huang, Y.; Xu, M. Advancements, Challenges, and Future Trajectories in Advanced Battery Safety Detection. Electrochem. Energy Rev. 2025, 8, 10. [Google Scholar] [CrossRef]
  5. Pillai, P.; Desai, S.; Pattipati, K.R.; Balasingam, B. An Improved Approach to Estimate the Internal Resistance of a Battery During the HPPC Test. arXiv 2025, arXiv:2505.06410. [Google Scholar]
  6. Krupp, A.; Ferg, E.; Schuldt, F.; Derendorf, K.; Agert, C. Incremental capacity analysis as a state of health estimation method for lithium-ion battery modules with series-connected cells. Batteries 2020, 7, 2. [Google Scholar] [CrossRef]
  7. Iurilli, P.; Brivio, C.; Wood, V. On the use of electrochemical impedance spectroscopy to characterize and model the aging phenomena of lithium-ion batteries: A critical review. J. Power Sources 2021, 505, 229860. [Google Scholar] [CrossRef]
  8. Schreiber, M.; Lin, Y.; Sommer, A.; Wassiliadis, N.; Torricos, P.M.; Rogge, M.; Lewerenz, M.; Grosu, C.; Endisch, C.; Jossen, A.; et al. Apparent vs. true battery aging: Impact of various load characteristics on accelerated aging tests. J. Energy Storage 2025, 127, 116924. [Google Scholar] [CrossRef]
  9. Che, Y.; Stroe, D.I.; Sui, X.; Vilsen, S.B.; Hu, X.; Teodorescu, R. Battery aging behavior evaluation under variable and constant temperatures with real loading profiles. In Proceedings of the 2023 IEEE Applied Power Electronics Conference and Exposition (APEC), Houston, TX, USA, 20–24 March 2022; IEEE: Piscataway, NJ, USA, 2023. [Google Scholar]
  10. Sulzer, V.; Mohtat, P.; Aitio, A.; Lee, S.; Yeh, Y.T.; Steinbacher, F.; Khan, M.U.; Lee, J.W.; Siegel, J.B.; Stefanopoulou, A.G.; et al. The challenge and opportunity of battery lifetime prediction from field data. Joule 2021, 5, 1934–1955. [Google Scholar] [CrossRef]
  11. Cao, W.; Zhou, Y.; Kuang, Z.; Sun, W.; Wu, H.; Dong, T. Multi-scale modelling of battery cooling systems for grid frequency regulation with high C-rate amplitude and non-uniform cell heat generation. Sci. Rep. 2025, 15, 6508. [Google Scholar] [CrossRef]
  12. Hossain Ahmed, S.; Kang, X.; Bade Shrestha, S.O. Effects of temperature on internal resistances of lithium-ion batteries. J. Energy Resour. Technol. 2015, 137, 031901. [Google Scholar] [CrossRef]
  13. Cavalheiro, G.M.; Iriyama, T.; Nelson, G.J.; Huang, S.; Zhang, G. Effects of nonuniform temperature distribution on degradation of lithium-ion batteries. J. Electrochem. Energy Convers. Storage 2020, 17, 021101. [Google Scholar] [CrossRef]
  14. Li, S.; Zhang, C.; Zhao, Y.; Offer, G.J.; Marinescu, M. Effect of thermal gradients on inhomogeneous degradation in lithium-ion batteries. Commun. Eng. 2023, 2, 74. [Google Scholar] [CrossRef]
  15. Reniers, J.M.; Howey, D.A. Digital twin of a MWh-scale grid battery system for efficiency and degradation analysis. Appl. Energy 2023, 336, 120774. [Google Scholar] [CrossRef]
  16. Lyu, D.; Zhang, B.; Zio, E.; Xiang, J. Battery cumulative lifetime prognostics to bridge laboratory and real-life scenarios. Cell Rep. Phys. Sci. 2024, 5, 102164. [Google Scholar] [CrossRef]
  17. Shi, Y.; Xu, B.; Wang, D.; Zhang, B. Using battery storage for peak shaving and frequency regulation: Joint optimization for superlinear gains. IEEE Trans. Power Syst. 2017, 33, 2882–2894. [Google Scholar] [CrossRef]
  18. Edge, J.S.; O’Kane, S.; Prosser, R.; Kirkaldy, N.D.; Patel, A.N.; Hales, A.; Ghosh, A.; Ai, W.; Chen, J.; Yang, J.; et al. Lithium ion battery degradation: What you need to know. Phys. Chem. Chem. Phys. 2021, 23, 8200–8221. [Google Scholar] [CrossRef]
  19. Kirkaldy, N.; Samieian, M.A.; Offer, G.J.; Marinescu, M.; Patel, Y. Lithium-ion battery degradation: Comprehensive cycle ageing data and analysis for commercial 21,700 cells. J. Power Sources 2024, 603, 234185. [Google Scholar] [CrossRef]
  20. Rosewater, D.; Ferreira, S. Development of a frequency regulation duty-cycle for standardized energy storage performance testing. J. Energy Storage 2016, 7, 286–294. [Google Scholar] [CrossRef]
  21. Edison, C. Considerations for ESS Fire Safety; DNV GL: Oslo, Norway, 2017. [Google Scholar]
  22. Sun, Z.; He, W.; Wang, J.; He, X. State of Health Estimation for Lithium-Ion Batteries with Deep Learning Approach and Direct Current Internal Resistance. Energies 2024, 17, 2487. [Google Scholar] [CrossRef]
  23. Kim, J.H.; Lee, S.J.; Lee, J.M.; Cho, B.H. A new direct current internal resistance and state of charge relationship for the Li-ion battery pulse power estimation. In Proceedings of the 2007 7th Internatonal Conference on Power Electronics, Daegu, South Korea, 22–26 October 2007; IEEE: Piscataway, NJ, USA, 2007. [Google Scholar]
  24. Bayoumi, E.; Hassan, E.; El-Khattam, W.; Ibrahim, A.M. Implications of lithium-ion cell temperature estimation methods for intelligent battery management and fast charging systems. Bull. Pol. Acad. Sci. Tech. Sci. 2024, 72, e149171. [Google Scholar] [CrossRef]
  25. Montgomery, D.C.; Peck, E.A.; Vining, G.G. Introduction to Linear Regression Analysis; John Wiley & Sons: Hoboken, NJ, USA, 2021. [Google Scholar]
  26. Ebenezer, K.; Wang, S.; Li, X.; Tao, J.; Fernandez, C.; Blaabjerg, F. Enhancing State of Charge Prediction of Lithium-Ion Batteries Through Linear Polynomial Regression–Support Vector Machine Modeling with Temperature Varying and Open Circuit Voltage Compensation; Elsevier: Amsterdam, The Netherlands, 2025. [Google Scholar]
  27. Razi, M.F.I.M.; Daud, Z.H.C.; Asus, Z.; Mazali, I.I.; Ardani, M.I.; Hamid, M.K.A. Li-NMC Battery Internal Resistance at Wide Range of Temperature. J. Adv. Res. Fluid. Mech. Therm. Sci. 2022, 99, 9–16. [Google Scholar]
  28. Lv, S.; Wang, X.; Lu, W.; Zhang, J.; Ni, H. The influence of temperature on the capacity of lithium ion batteries with different anodes. Energies 2021, 15, 60. [Google Scholar] [CrossRef]
  29. Dechent, P.; Greenbank, S.; Hildenbrand, F.; Jbabdi, S.; Sauer, D.U.; Howey, D.A. Estimation of Li-Ion Degradation Test Sample Sizes Required to Understand Cell-to-Cell Variability. Batter. Supercaps 2021, 4, 1821–1829. [Google Scholar] [CrossRef]
  30. Barré, A.; Deguilhem, B.; Grolleau, S.; Gérard, M.; Suard, F.; Riu, D. A review on lithium-ion battery ageing mechanisms and estimations for automotive applications. J. Power Sources 2013, 241, 680–689. [Google Scholar] [CrossRef]
  31. Zhou, J.; Dong, J.; Lu, Y.; Yan, K.; Guan, Y.; Zhao, F.; Tang, R.; Shen, W.; Li, N.; Su, Y.; et al. Spatially heterogeneous degradation in LiFePO 4//graphite pouch batteries under temperature accelerated aging process. EES Batter. 2025, 1, 1279–1290. [Google Scholar] [CrossRef]
  32. Zhao, J.; Feng, X.; Tran, M.K.; Fowler, M.; Ouyang, M.; Burke, A.F. Battery safety: Fault diagnosis from laboratory to real world. J. Power Sources 2024, 598, 10–1016. [Google Scholar] [CrossRef]
Figure 1. Overall configuration of a 50 MW-class ESS.
Energies 18 05640 g001
Figure 2. SOH evaluation using the Coulomb counting approach between annual round-trip tests.
Energies 18 05640 g002
Figure 3. Charging and discharging procedure for deriving DCIR.
Energies 18 05640 g003
Figure 4. Spatial imbalance in temperature distribution during operation. (a) Temperature distribution across containers during normal operation; (b) temperature distribution observed during the round-trip test of Bank 1 in Container 1.
Energies 18 05640 g004
Figure 5. Derivation of temperature-dependent compensation factors from DCIR measured under real operating conditions.
Energies 18 05640 g005
Figure 6. DCIR distributions and their temperature dependence extracted from a 50 MW-class ESS over three years. (a) Histograms of DCIR before temperature compensation, including annual means and standard deviations. (b) Histograms of DCIR after temperature compensation, showing reduced variability along with annual means and standard deviations. (c) Scatter plot of DCIR versus temperature, illustrating the cross-year correlation.
Energies 18 05640 g006
Figure 7. SOH distributions and their temperature dependence extracted from a 50 MW-class ESS over three years. (a) Histograms of SOH before temperature compensation, including annual means and standard deviations. (b) Histograms of SOH after temperature compensation, showing reduced variability along with annual means and standard deviations. (c) Scatter plot of SOH versus temperature, illustrating the cross-year correlation.
Energies 18 05640 g007aEnergies 18 05640 g007b
Figure 8. Bank-level analysis of DCIR and SOH over three years of ESS operation. (a) Annual DCIR values and year-to-year standard deviations at the bank level. (b) Standard deviations of DCIR for each bank and their inter-annual changes, reflecting intra-bank variability. (c) Annual SOH values and year-to-year standard deviations at the bank level.
Energies 18 05640 g008
Figure 9. Detailed analysis of intra-bank DCIR distribution for Bank 01 in Container 03. (a) Number of cells within each rack falling in the site-wide top 25% of DCIR. (b) Number of cells within each rack falling in the site-wide top 5% of DCIR.
Energies 18 05640 g009
Figure 10. Year-to-year analysis of DCIR and temperature distributions for Bank 01 in Container 03, before and after temperature compensation; compensated DCIR for (a) 2023, (b) 2024, and (c) 2025; uncompensated DCIR for (d) 2023, (e) 2024, and (f) 2025; temperature for (g) 2023, (h) 2024, and (i) 2025.
Energies 18 05640 g010
Table 1. Degree-wise comparison (2023–2025) of polynomial regression for temperature–DCIR.
Number of YearDegree R 2 MAPE C o n d N u m O p s
202310.39562.0476 4.1069   ×   10 2 1.254   ×   10 5
20.39572.0475 1.8898   ×   10 5 5.016   ×   10 5
30.39612.0474 8.9360   ×   10 7 1.1286   ×   10 6
40.39912.0448 4.2855   ×   10 10 2.0064   ×   10 6
50.39932.0415 2.0765   ×   10 13 3.1350   ×   10 6
60.39952.0411 1.0148   ×   10 16 4.5144   ×   10 6
70.39972.0408 4.9963   ×   10 18 6.1446   ×   10 6
80.39982.0408 2.4764   ×   10 21 8.0256   ×   10 6
202410.77552.3187 2.3840   ×   10 2 1.254   ×   10 5
20.78042.2858 6.3838   ×   10 4 5.016   ×   10 5
30.78042.2855 1.7841   ×   10 7 1.1286   ×   10 6
40.78042.2843 5.1151   ×   10 9 2.0064   ×   10 6
50.78072.2840 1.4947   ×   10 12 3.1350   ×   10 6
60.78072.2837 4.4339   ×   10 14 4.5144   ×   10 6
70.78082.2833 1.3314   ×   10 17 6.1446   ×   10 6
80.78082.2827 4.0376   ×   10 19 8.0256   ×   10 6
202510.86792.4738 1.9457   ×   10 2 1.254   ×   10 5
20.87162.4355 4.2556   ×   10 4 5.016   ×   10 5
30.87162.4358 9.7575   ×   10 6 1.1286   ×   10 6
40.87182.4343 2.3020   ×   10 9 2.0064   ×   10 6
50.87192.4346 5.5465   ×   10 11 3.1350   ×   10 6
60.87192.4344 1.3585   ×   10 14 4.5144   ×   10 6
70.87232.4319 3.3713   ×   10 16 6.1446   ×   10 6
80.87232.4315 8.4552   ×   10 18 8.0256   ×   10 6
Table 2. Temperature-specific compensation factors from Equation (12) (2023 dataset).
Temperature
(°C)
Uncompensated DCIR (mΩ)Compensation FactorCompensated DCIR at 23 °C (mΩ)
21.01.03090.88330.9106
22.00.94780.96080.9106
23.00.91061.00000.9106
24.00.87881.03620.9106
25.00.84491.07770.9106
26.00.83531.09020.9106
Table 3. Statistics corresponding to Figure 10 for Bank 03-01: DCIR (temperature-compensated vs. uncompensated) and temperature by year.
Figure 10Max (mΩ)Min (mΩ)Average (mΩ)Range (mΩ)
(a)0.93250.87390.90390.0586
(b)0.96710.89910.93420.0680
(c)1.12941.03781.08750.0916
(d)0.90960.84370.87420.0659
(e)0.93350.85570.88590.0778
(f)1.22200.92681.07130.2952
Figure 10Max (°C)Min (°C)Average (°C)Range (°C)
(g)24.616222.616223.93712.0000
(h)24.933022.756424.29062.1766
(i)26.670921.168023.39355.5029
Disclaimer/Publisher’s Note: The statements, opinions and data contained in all publications are solely those of the individual author(s) and contributor(s) and not of MDPI and/or the editor(s). MDPI and/or the editor(s) disclaim responsibility for any injury to people or property resulting from any ideas, methods, instructions or products referred to in the content.