Article

Design Optimisation of Legacy Francis Turbine Using Inverse Design and CFD: A Case Study of Bérchules Hydropower Plant

by
Israel Enema Ohiemi
1,2 and
Aonghus McNabola
3,*
1
Department of Civil, Structural and Environmental Engineering, Trinity College Dublin, D02 PN40 Dublin, Ireland
2
Department of Mechanical Engineering, University of Nigeria, Nsukka 410001, Nigeria
3
School of Engineering, RMIT University, 124 La Trobe Street, Melbourne, VIC 3000, Australia
*
Author to whom correspondence should be addressed.
Energies 2025, 18(21), 5602; https://doi.org/10.3390/en18215602 (registering DOI)
Submission received: 19 September 2025 / Revised: 8 October 2025 / Accepted: 15 October 2025 / Published: 24 October 2025
(This article belongs to the Special Issue Energy Security, Transition, and Sustainable Development)

Abstract

The lack of detailed design information in legacy hydropower plants creates challenges for modernising their ageing turbine components. This research advances a digitalisation approach which combines inverse design methodology (IDM) with multi-objective genetic algorithms (MOGA) and computational fluid dynamics (CFD) to digitally reconstruct and optimise the Bérchules Francis turbine runner and guide vane geometries using limited available legacy data, avoiding invasive techniques. A two-stage optimisation process was conducted. The first stage of runner blade optimisation achieved a 22.7% reduction in profile loss and a 16.8% decrease in secondary flow factor while raising minimum pressure from −877,325.5 Pa to −132,703.4 Pa. Guide vane optimisation during Stage 2 produced additional performance gains through a 9.3% reduction in profile loss and a 20% decrease in secondary flow factor and a minimum pressure increase to +247,452.1 Pa which represented an 183% improvement. The CFD validation results showed that the final turbine efficiency reached 93.7% while producing more power than the plant’s rated 942 kW. The sensitivity analysis revealed that leading edge loading at mid-span and normal chord proved to be the most significant design parameters affecting pressure loss and flow behaviour metrics. The research proves that legacy turbines can be digitally restored through hybrid optimisation and CFD workflows, which enables data-driven refurbishment design without needing complete component replacement.

1. Introduction

Hydropower stands as the leading renewable energy source in global electricity generation, since it supplies 16–17% of worldwide power output and generates over half of all renewable electricity [1,2]. The energy storage capabilities combined with affordable and adaptable power generation characteristics of hydropower systems make it essential for power grids which increasingly depend on intermittent renewable sources like wind and solar power. The Francis turbine dominates hydropower technology applications because it works effectively across different head and discharge ranges. Energy system evolution demands that existing older hydropower facilities must perform flexible operations beyond their original design parameters and run in off-design and transient conditions.
The digitalisation of ageing hydropower facilities is essential to meet these new operational requirements. The traditional turbine design optimisation process requires extensive designer expertise and time-consuming results through repeated CFD simulations [3]. The conventional direct design approach that changes blade geometry offers restricted control over the internal flow field patterns. The process of making small geometric changes leads to substantial unpredictable alterations in flow patterns both upstream and downstream which slows down the process while increasing computational expenses and requiring extensive trial-and-error testing.
The inverse design method (IDM) presents a transformative alternative. The IDM technique modifies blade loading distribution as its primary design variables instead of modifying the blade geometry directly [4,5]. Through this approach designers achieve better control of the flow field during design and need fewer iterations for optimisation. The IDM provides superior three-dimensional flow management and improved secondary flow control along with the potential to create hydrodynamically optimised blades at reduced computational expense.
The IDM concept has undergone substantial growth since its first deployment. The IDM method appeared as a design tool for hydrofoils before its development for hydraulic pumps in the 1980s and 1990s and remained limited to two-dimensional incompressible potential flow modelling. Borges [6] achieved notable progress in IDM development through his work on radial and mixed-flow machine design which produced superior performance compared to traditional approaches. Zangeneh et al. [7,8] developed IDM through their work on three-dimensional compressible potential flow models that produced precise blade geometries for radial and mixed-flow turbomachinery.
IDM proved successful for minimising flow instabilities while minimising secondary losses in diverse types of machines throughout time. Zangeneh et al. [8,9] showed that IDM eliminated secondary flows in pumps and compressors. Goto et al. [10] applied IDM to redesign diffuser vanes that eliminated flow separation. Demeulenaere et al. [11] and Dang et al. [12] achieved design improvements by integrating prescribed pressure distributions into inverse design processes which expanded the method’s applicability for turbine and compressor blades. IDM researchers later extended the design approach to handle three-dimensional viscous flows [13,14], which eliminated the difference between theoretical design assumptions and actual turbomachinery operational performance.
The IDM approach has proven its effectiveness as a design methodology throughout various turbomachinery applications including inducers [15,16], pumps [17], diffusers [10,18], and compressors [8,19,20]. IDM has proven effective in enhancing critical performance metrics like hydraulic efficiency and shock control and flow stability by incorporating viscosity and blade thickness effects in later models [21].
The IDM method continues to depend on steady idealised flow models and faces difficulties in directly managing fully three-dimensional turbulent and unsteady flow phenomena that matter for actual operating conditions. The open-source IDM framework developed by Leguizamón and Avellan [3] for Francis turbines marks an important step toward enhancing IDM usability and adaptability in hydraulic turbine design. Ohiemi and McNabola [22], recently applied the IDM in combination with computational fluid dynamics (CFD) techniques and optimisation methods to create a digital model of a large scale 110 MW hydropower plant using Francis turbines and a limited set of historic design parameters and operation data available.
The continuous progress of CFD has produced increasingly precise simulations of turbomachinery flows that cost less computationally. The potential of IDM integration with CFD is still largely untapped when it comes to optimising ageing hydropower turbines. This study further confirms IDM as a solution to optimise hydropower turbines through MOGA optimisation methods that show promising potential for this limitation. The complex performance objectives in turbine design, which include maximising efficiency while reducing cavitation and structural loads, make MOGA an optimal choice for addressing these challenges.
Modern hydropower machinery benefits from IDM as a powerful framework for optimisation in pump turbines and Francis turbines. Design optimisation of pump turbine equipment has received extensive research to enhance operational efficiency while expanding stable operation boundaries and reducing flow instabilities and cavitation effects. The low-head pump turbine received IDM optimisation by Kerschberger and Gehrer [23] which resulted in improved runner performance with higher instability onset heads and increased efficiency and extended cavitation-free operation.
Yang and Xiao [24] introduced a multi-objective optimisation framework combining IDM, CFD, design of experiments (DoE), response surface methodology (RSM), and multi-objective genetic algorithms (MOGA). The optimisation of blade loading distributions and stacking angles through their research led to major efficiency improvements and minimised crossflow occurrences in pump-turbine operations.
Yin et al. [25] analysed methods to eliminate the S-shaped curve which triggers hydraulic instability at low load conditions. The study showed that making the meridional passage wider helped decrease the negative slope of the performance curve to improve stability but did not investigate pump mode implications.
Wang et al. [26] and Xuhe et al. [27] used blade loading distributions with fore-loaded designs to enhance turbine-mode performance without significant pump-mode efficiency reduction.
Zhu et al. [28] introduced extensive negative blade lean angles and optimised meridional channels to enhance cavitation resistance while improving part-load operations in both turbine and pump modes [29].
Liu et al. [30] implemented MOGA with IDM, RSM, and CFD to optimise blade lean angles and loading distributions for ultra-high-head turbines. They achieved a 0.7% efficiency increase while improving the cavitation performance of their system.
Wang et al. [31] presented a trade-off optimisation method that optimises both secondary flow reduction and profile loss minimisation without changing the meridional channel configuration. The authors supported the use of moderate aft-loaded hub distributions to minimise secondary flows and recommended strong fore-loaded hub distributions to decrease profile losses.
The optimisation framework developed by Hu et al. [32] now supports pump turbines with splitter blades. The multi-objective optimisation strategy evaluated 17 design variables to show that boosting the splitter work ratio resulted in a 2.07% efficiency boost for turbine-mode operation. Hu et al. [33] optimised the runner design to achieve maximum performance in both deep-part load conditions and cavitation resistance by determining the best combination of fore-loaded shroud and aft-loaded hub configurations.
Renewable energy adoption worldwide depends on hydropower systems to support power grid stability while achieving sustainability goals. Many ageing hydropower plants that operate in Europe and America date back more than several decades. Performance degradation, inefficient operation, and structural fatigue risks, together with cavitation issues, affect ageing plants under part-load or off-design conditions. The absence of comprehensive design documentation and detailed drawings in numerous plants creates major obstacles during refurbishment and performance optimisation efforts.
While IDM-CFD-MOGA methodologies have been successfully applied to turbomachinery optimisation in prior studies, their scope has predominantly focused on large-scale turbines or pump turbines and has often been limited to runner-only designs. For instance, Ohiemi and McNabola [22] applied IDM in combination with CFD and multi-objective genetic algorithms to optimise the runner of a 110 MW Francis turbine, using a limited set of historic design and operational data. Similarly, Yang and Xiao [24], Liu et al. [30], and Hu et al. [32,33] showed the effectiveness of IDM-CFD-MOGA for pump turbine systems, achieving improvements in hydraulic efficiency, cavitation performance, and secondary flow reduction. However, these studies did not extend the optimisation framework to guide vanes, nor did they target small-legacy hydropower plants where design documentation is often incomplete or absent.
In contrast, the present study advances the application of IDM-CFD-MOGA by optimising both the runner and guide vane configurations of a small-legacy Francis turbine (Bérchules case study) using limited historical information. This approach enables the reconstruction of hydraulically efficient blade geometries in a digital environment, effectively creating a digital twin of the turbine without the need for original blueprints or intrusive measurements. By extending optimisation to guide vanes and applying it to a small-legacy plant, this work shows a novel methodology for the refurbishment and performance enhancement of ageing hydropower facilities, addressing limitations of previous studies and providing a practical framework for modernising legacy turbines.
The Bérchules hydropower facility located in southern Spain illustrates this situation. The 70-year-old turbines are still undigitised, since their original designs while physical alterations since construction have caused their dimensions to drift from the original blueprints. The modernisation process meets two main difficulties because it needs to restore hydraulic components from limited historical information and achieve enhanced performance for current energy market flexibility requirements.
IDM enables hydraulically efficient blade geometries to be systematically reconstructed through performance target-based generation instead of fixed shape definitions. CFD integration with this method delivers complete understanding of internal flow patterns and MOGA searches for optimal trade-offs between efficiency and cavitation resistance and flow uniformity.
This integrated framework enables digital twin development of existing turbines without needing original drawings or intrusive physical measurement data. Designers can use this method to duplicate old turbines in a digital environment before performing assessments and modern performance improvements. The method delivers exceptional value for hydropower refurbishment because CFD models with accurate precision become essential for developing solutions to plant issues.
The following structure explains the remaining sections of this paper. Section 2 describes the numerical modelling procedure, followed by CFD validation protocols. Section 3 describes the IDM and MOGA-based optimisation strategy. The paper demonstrates sensitivity analysis, followed by optimisation results and performance validation using the Bérchules Francis turbine case study in Section 4. The final part discusses conclusions while proposing future research paths for IDM-based approaches to hydropower turbine refurbishment and optimisation.

2. Numerical Methods

2.1. Model Description

The inverse design and advanced optimisation methods applied in this paper were developed using a case study approach, building on the approach of Ohiemi and McNabola [22]. An ongoing Bérchules Hydroelectric Power Plant (HPP) digitalisation project in Spain enabled testing and validation of these methods through operational data analysis without extended power plant shutdowns. A horizontal-axis Francis turbine at 1500 rpm operates as the main component in this power plant. The Bérchules run-of-river facility serves the Alpujarra region of Granada, Andalusia, through water supply from the Sierra Nevada River Grande de los Bérchules. The plant operates at a gross head of 136 m while handling flow rates between 0.2 and 0.8 m3/s to produce 942 kW of power that meets EU standards for small hydro generation. The hydropower station serves multiple functions in the local water network by providing water for irrigation and drinking purposes.
The TURBOdesign suite was used to enable developers to create a 3D model for the computational domain at a speed of 3.49 (dimensionless) that resulted from Equation (1).
The Francis turbine flow domain consists of five separate hydraulic stages which proceed in sequence from Volute → Stay Vanes → Guide Vanes → Runner → Draft Tube. The Francis turbine features 10 twisted blades that have been optimised for use in small hydro applications with high-head conditions.
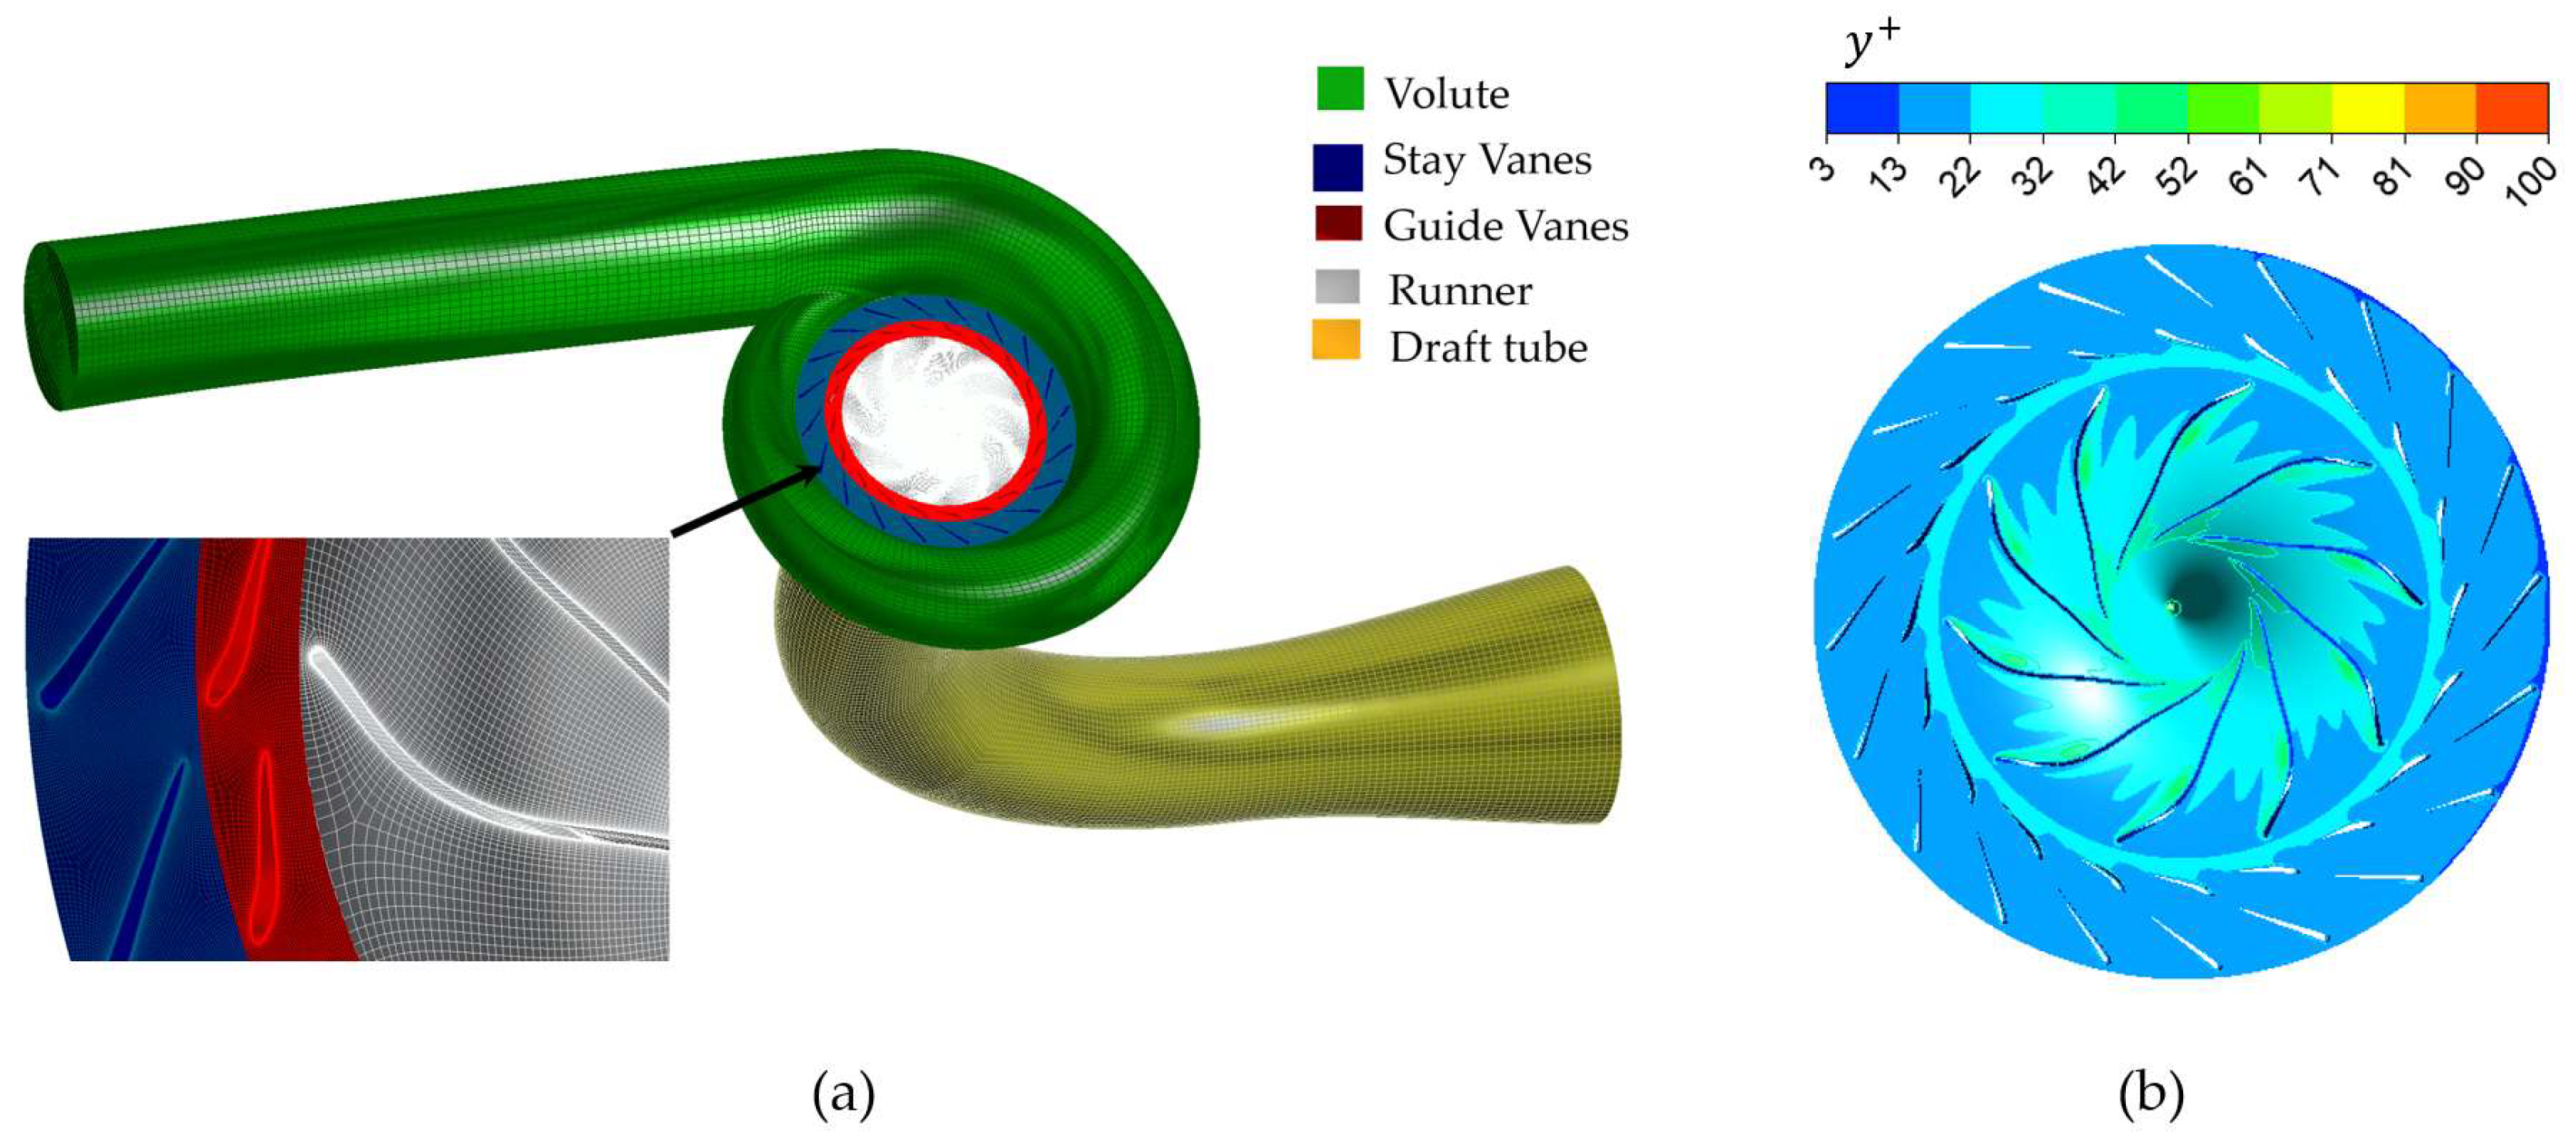
The radial-flow configuration of the runner includes shrouding which produces significant hydraulic energy recovery. The reference diameter of the runner measures 0.495 m while the reference velocity reaches 38.9 m/s. The hub and shroud of the turbine have LE and TE radii that range between 0.255 m and 0.105 m to facilitate smooth energy transfer from the leading edge (LE) to the trailing edge (TE) across the blade span. The volute starts at a casing radius of 0.82 m before decreasing to 0.38 m to create an optimal pressure distribution before the stay vane section. The simulation model domain and components are illustrated in Figure 1, while Table 1 contains the essential hydraulic and design information about the Bérchules turbine stage.
n s = N P h p H 5 / 4 ,
where
  • ns: Specific speed of the turbine.
  • N : Rotating speed, rpm.
  • Php: Power Output, watt.
  • H d : Head at design point, m.
Figure 1. Computational domain.
Energies 18 05602 g001
Table 1. Design specifications of the turbine.
Design ParametersValue
Flow rate, Qd (m3/s)0.8
Head, H (m)136.5
Rotational speed, N (rpm)1500
Number of runner blades, z10
Runner reference diameter, Dr (m)0.495
Volute inlet diameter, Dv1 (m)1.64
Volute outlet diameter, Dv2 (m)0.76
Power output, P (kW)942
Efficiency, η84
Specific speed (ns)3.49

2.2. Computational Grid and Mesh Sensitivity

The flow passage for the turbine was meshed with a ANSYS ICEM 24.1 mesh tool. A hexahedral grid system was generated in the computational domain using O-type grids near the blade and H/C type grids near the leading with trailing edge. The computational domain received its hexahedral grid system through O-type grids near the blade and H/C type grids near the leading and the trailing edge. The grid size and blocking method was used and the grids for the stay vanes, guide vanes, and runner were refined with large numbers for higher precision. The meshing process began with a single-blade passage before transforming it into a 10-blade full set. The volute tongue region received concentrated grid distribution because it represents a complex area. The computational accuracy improved through additional mesh refinement at the runner’s leading and trailing edges. The boundary layer mesh received its density and thickness settings through the grid growth parameters. The computational mesh is presented in Figure 2.
To speed up the calculation process while ensuring precision during iterations, it is important to conduct a grid independence assessment for the numerical simulation task at hand. Drawing insights from previous studies [34,35,36,37], five distinct quality structural hexahedral meshes were developed and subjected to a grid sensitivity analysis. The simulations were conducted under steady state conditions at the designated flow rate of Qd = 0.8 m3/s to assess how the mesh configuration impacts turbine performance in terms of head and efficiency.
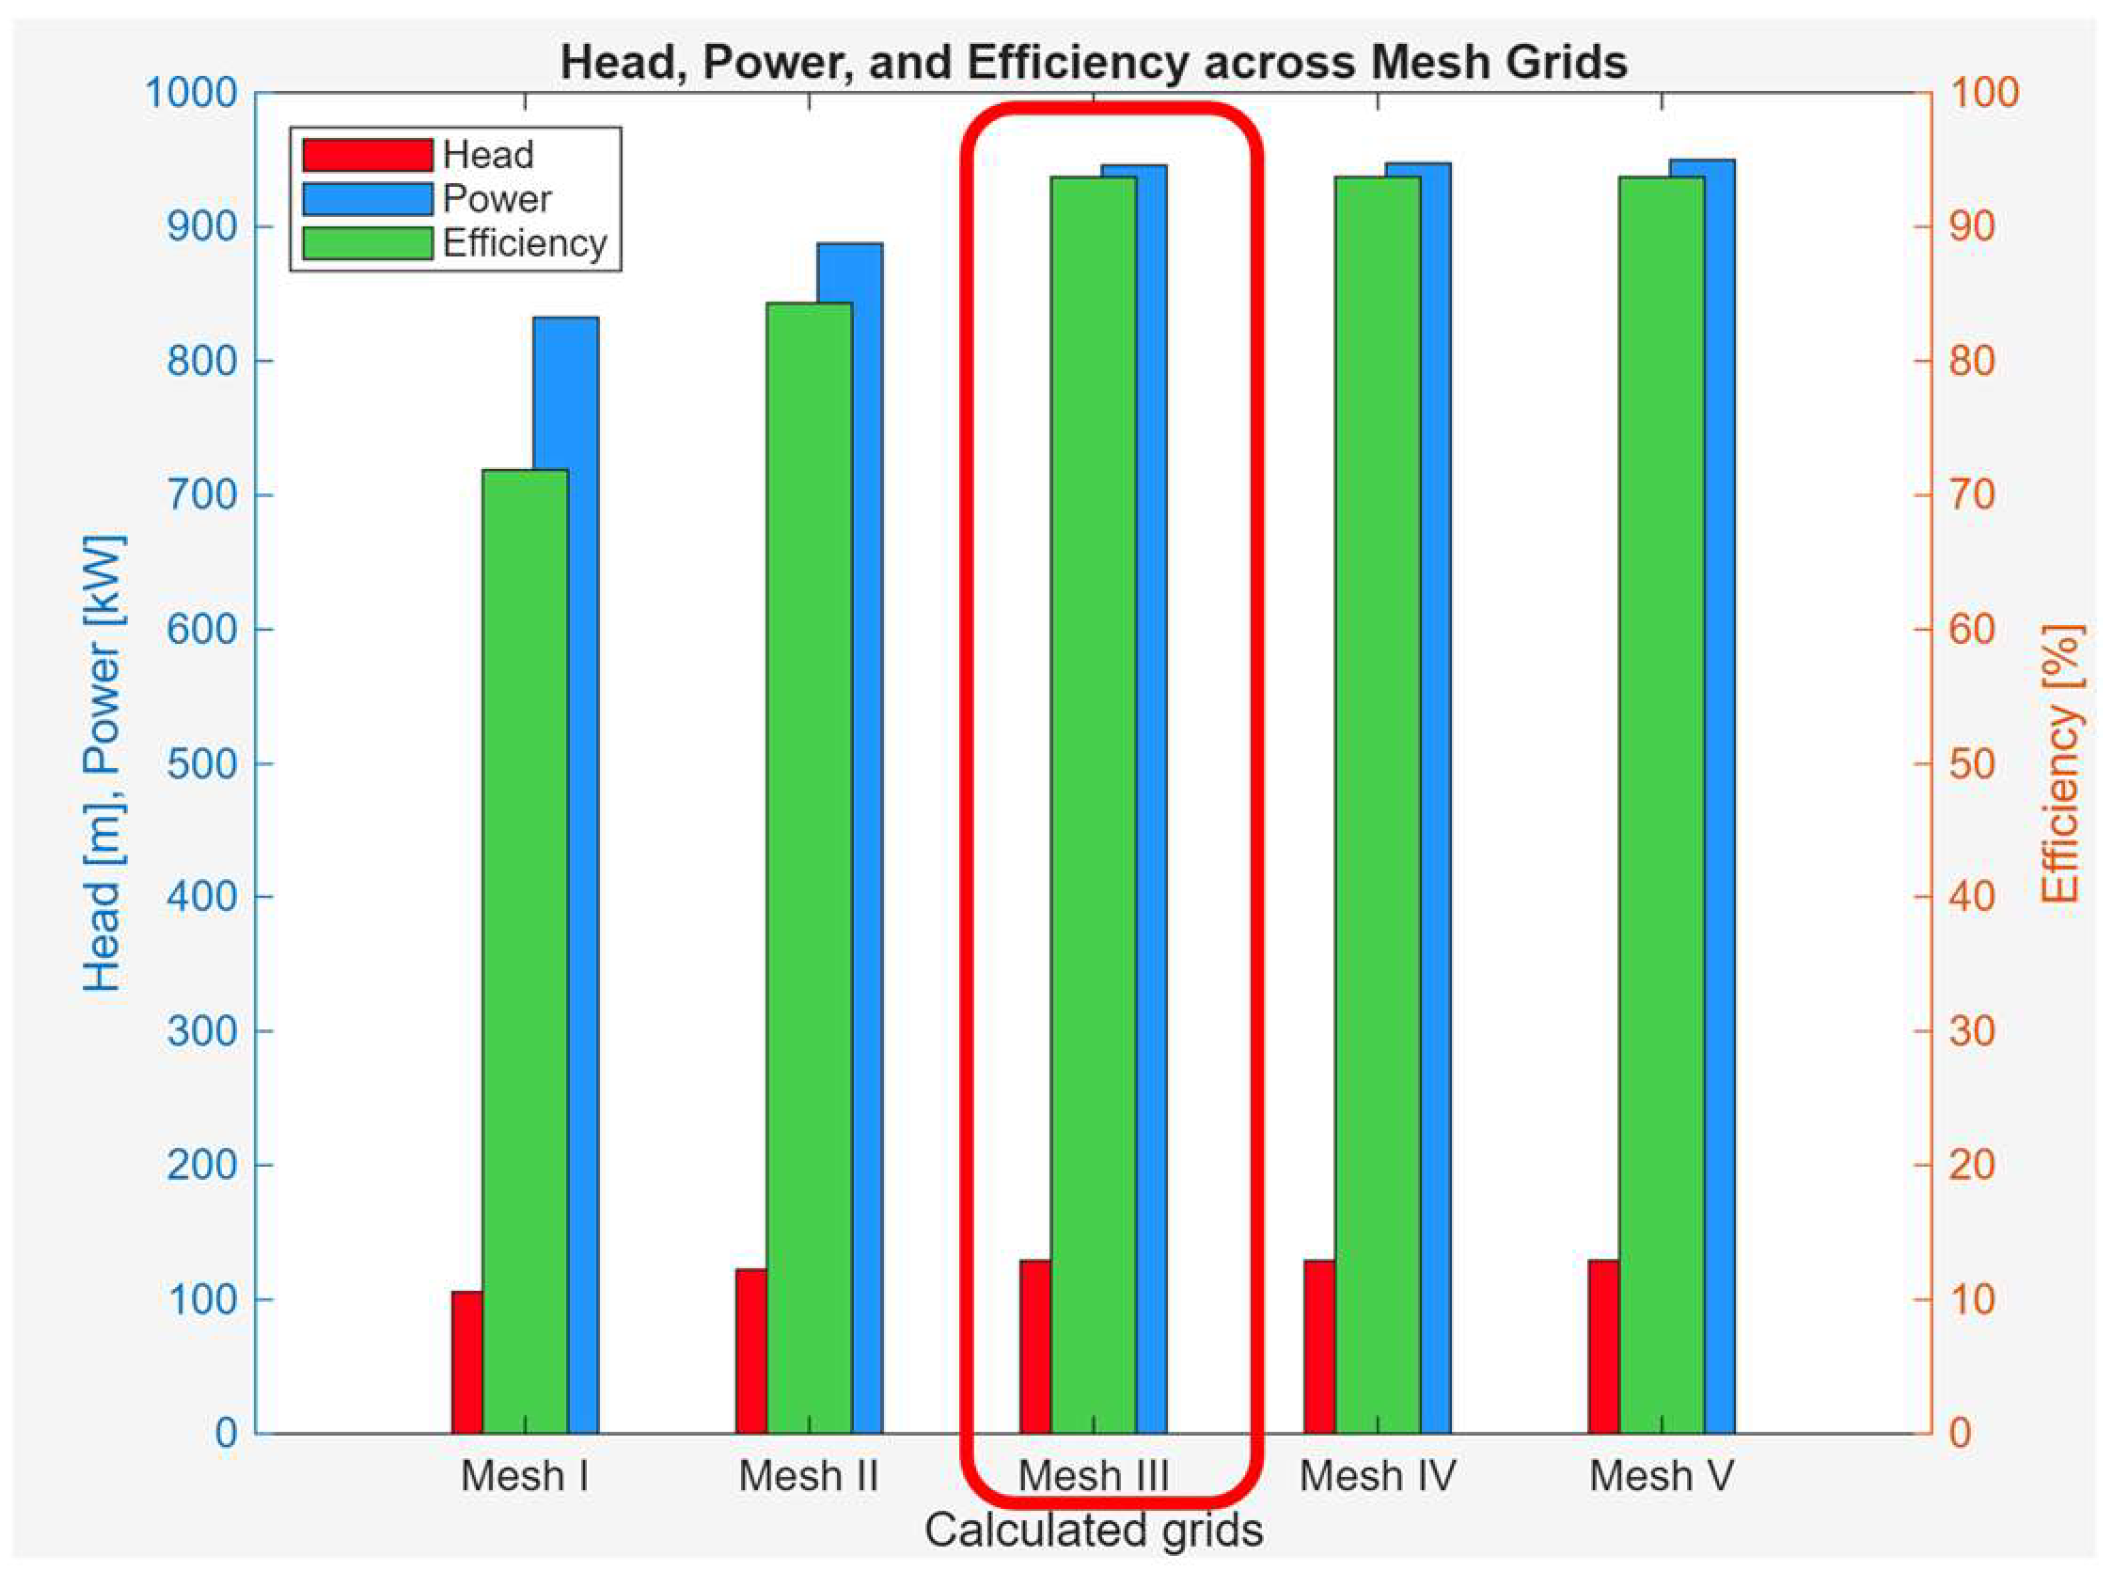
The comparison of performance among the five grids is detailed in Figure 3. The performance indicators for Mesh I and II were found to be lower than the turbines design performance characteristics. The head, efficiency, and power values aligned with design specifications when the mesh size was expanded to 6,466,284 elements. Subsequent meshes with increased grid numbers exhibited effects of mesh density on performance. Mesh III, Mesh IV, and Mesh V were compared because they all met the design requirements, for the turbine. The impact of mesh numbers on turbine performance was marginal, with changes of 0.025%, 0.01%, and 0.075% observed for head, efficiency, and power. This shows that numerical precision remained consistent as the grid size expanded to 6,466,284 elements. As a result, Mesh III was chosen for calculations to streamline the workload and save time during computation. The statistical data for the grids can be found in Table 2. The mesh concentration needed for the specific mesh used in numerical simulations is detailed in Table 3.

2.3. Governing Equations

The continuity equation, which is the basic equation governing the flow is adopted from the Navier–Stokes equations, which is time dependent, is given as
𝜕 ρ m 𝜕 t + 𝜕 𝜕 x j ρ m u j = 0 ,
𝜕 ρ m u i u j 𝜕 x j + 𝜕 𝜕 t ρ m u i = 𝜕 p d x i + 𝜕 d x j μ + μ t 𝜕 u i 𝜕 x j + 𝜕 u j 𝜕 x i + 2 3 𝜕 u k 𝜕 x k δ i j .
Density and dynamic viscosity mixtures are represented by ρ and μ, respectively. Velocity is denoted by u, p stands for pressure, and turbulent viscosity is μt. Variables i and j are axis directions. In this study, the SST k–ω turbulence model was employed owing to its proven robustness in turbomachinery applications. This model combines the near-wall accuracy of the k–ω formulation with the free-stream stability of the k–ε model [38], enabling reliable prediction of boundary layer separation, adverse pressure gradients, and secondary flow structures that are characteristic of Francis turbines. Such capability is essential when assessing optimisation effects on both runner and guide vane geometries. The SST k–ω model has been widely applied to hydropower and rotating machinery flows where curvature, rotation, and complex near-wall behaviour are dominant, and it offers an effective balance between accuracy and computational efficiency. The model’s suitability for complex flows with strong curvature and rotating components has been demonstrated in numerous studies [22,34,35,36,39,40], which aligns with the requirements of the present work. Transport equations for k and ω are expressed follows:
𝜕 ρ m k 𝜕 t + 𝜕 ρ m u j k 𝜕 x j = P k β ρ m k ω + 𝜕 d x j μ + μ t σ k 3 𝜕 k 𝜕 x j ,
𝜕 ρ m ω 𝜕 t + 𝜕 ρ m u j ω 𝜕 x j = a 3 ω k P k β 3 ρ m ω 2 + 𝜕 d x j μ + μ t σ ϖ 3 𝜕 ω 𝜕 x j + 2 1 F 1 ρ m 1 ω σ ω 2 𝜕 k 𝜕 x j 𝜕 ω 𝜕 x j ,
P k = μ t 𝜕 u i 𝜕 x j + 𝜕 u j 𝜕 x i 𝜕 u i 𝜕 x j 2 3 ρ m k + 3 u t 𝜕 u k 𝜕 x k 𝜕 u k d x k .
The turbulence viscosity equations are
μ t = ρ m a 1 k max a 1 ω , S F 2 ,
s = 𝜕 u i 𝜕 x j + 𝜕 u j 𝜕 x i 𝜕 u i 𝜕 x j .
The blending functions F1 and F2 are
F 1 = tanh min max k β ω y , 500 v y 2 ω , 4 ρ m k C D k ω σ ω 2 y 2 4 ,
C D k ω = max 2 ρ m 1 σ ω 2 𝜕 k 𝜕 x j 𝜕 w 𝜕 x j , 1.0 E 10 ,
F 2 = tanh max 2 k β ω y , 500 v y 2 ω 2 .
The SST k–ω turbulence model incorporates an automatic near-wall treatment that adapts between resolving the viscous sub-layer directly or applying wall functions, depending on the local flow conditions. In this study, the wall function approach was adopted to balance accuracy with computational efficiency. Wall functions, based on empirically derived relations, approximate the near-wall region without explicitly resolving the viscous sub-layer, thereby reducing mesh requirements and significantly lowering computational cost [34]. This approach is particularly advantageous for complex hydro turbine simulations, as illustrated in Figure 2b. The resulting y+ distribution shows that most of the near-wall region lies within the recommended range of 30 < y+ < 300 for valid wall-function application, consistent with the guidelines of Gileva [41].
The boundary conditions for the simulation are depicted in Table 4.

3. Optimisation Method

3.1. Genetic Algorithms and Multi-Objective Genetic Optimisation

Genetic algorithms (GA), pioneered by Holland in the 1970s and later made known by Goldberg [42], represent stochastic search techniques influenced by the concepts of natural selection and evolution principles. Unlike methods based on gradients that need derivative inputs and frequently settle for optimal solutions, GAs delves into a wider range of potential solutions and excel in tackling intricate non-linear challenges, with multiple peaks often faced in the design of turbomachinery systems.
A typical GA optimisation process starts by creating a group of potential designs which are then assessed based on specific criteria and adjusted using genetic mechanisms, such as selection and mutation, to move closer to the best solutions possible.
Traditional GAs typically merge objectives into one weighted sum function; however, this method has its drawbacks—especially when it comes to determining the best weights without a prior understanding of the trade-offs between objectives. The result often leans towards a solution that might not capture the diversity or adaptability sought after in engineering design.
To address these constraints effectively and expand possibilities to offer solutions to problems with objectives in mind, MOGA—which make use of the Pareto optimality principle and can provide more than one answer to a problem—were considered. MOGA produce Pareto fronts, a series of solutions that are not dominated by any other solution. This collection offers a variety of choices where trade-offs between conflicting objectives are considered optimal. This feature enables designers to examine options and make decisions based on specific performance standards or engineering expertise.
Among MOGA, the Non-Dominated Sorting Genetic Algorithm II (NSGA II) stands out as a popular choice, as it is known for its effectiveness and reliability in various applications. Proposed by Deb et al. [43], NSGA II integrates dominated sorting techniques, along with crowding distance comparison and elitism strategies to preserve diversity and guide convergence towards the Pareto front. In the field of turbomachinery, the use of NSGA II proves helpful due to the computational resources required for conducting detailed evaluations of each design using CFD.

3.2. NSGA-II-Based Multi-Objective Genetic Algorithm

In turbomachinery design, the process of optimisation must often account for competing objectives such as efficiency, flow uniformity, and cavitation resistance. These objectives are fundamentally non-linear and co-dependent, resulting in insufficient conventional gradient-based optimisation techniques. As an alternative, population-based metaheuristic approaches such as GAs offer robust global search capabilities across complex design landscapes.

3.2.1. Problem Formulation

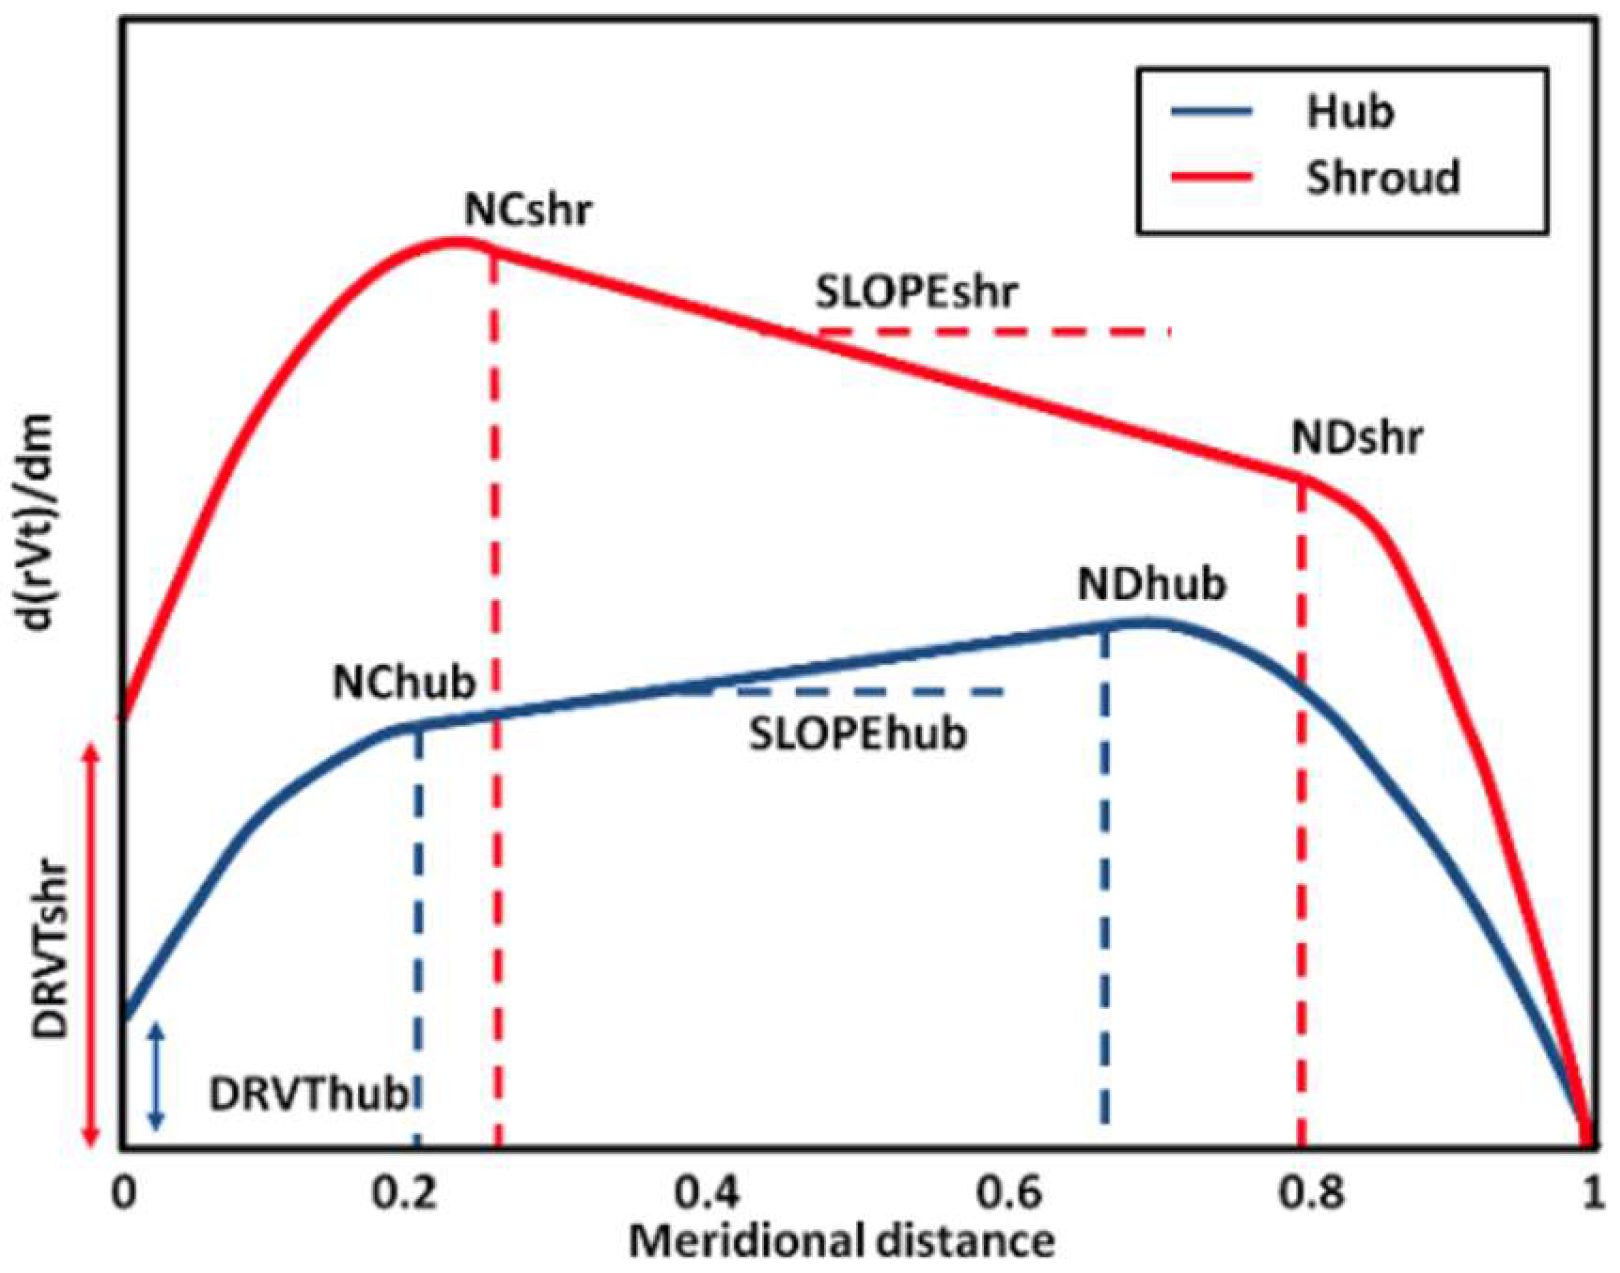
The hydraulic turbine runners and guide vane design optimisation were conducted by using MOGA on a runner shape derived from inverse design, with TURBOdesign1 software version 24. TurboDesign1 software version 24 includes extended functionality not available in earlier versions which allowed us to perform a simultaneous optimisation of both runner and guide vane geometries, whereas previous studies (e.g., Ohiemi & McNabola, [22]) focused primarily on the runner. The main objective was to improve the hydraulic performance by adjusting the blade structure in a way that reduces complexity effectively. A key aspect of this process involved choosing a meaningful set of design variables to govern the 3D blade geometry across different sections within the turbine. The optimisation problem is framed as a multi-objective problem, with constraints where the goals directly impact enhancing flow dynamics and resistance to cavitation within the runner system design variables are represented by x ∈ ℝ14 encompassing parameters for wrap angle and blade loading at three radial positions (hub, mid, and shroud) for the primary and secondary optimisation stages. The design variables for the stage of optimisation are denoted by x ∈ ℝ12, focusing on blade loading variables (refer to Figure 4 and Table 5).
The design optimisation task is framed as a multi-objective optimisation problem:
min x f x = f 1 x , f 2 x , , f n x ,
where
  • x ∈ ℝn is the vector of design variables listed in Table 4;
  • f i x represents the ith objective function;
  • denotes the feasible domain defined by physical constraints.
The ranges for the 14 design variables and the constraints were established from the baseline design generated by the IDM, supported by a custom machine learning tool embedded in the optimisation software, which ensured that the search space remained both physically realistic and hydraulically meaningful for the site-specific turbine.
In this study, the optimisation objective is to
  • Minimise profile loss f 1 x = P r o f i l e L o s s t ;
  • Minimise secondary flow factor f 2 x = S F a c t o r ;
  • Maximise minimum pressure, achieved by minimising f 3 x = P m i n .
The above objectives are subject to geometric and hydraulic constraints, including
  • Throat area bounds: 0.0344511   m 2 A T h r o a t x 0.0421069   m 2 ;
  • Euler head limits: 122.8495 m   H E u l e r x 150.1493 m ;
  • Diffusion ratio control: 2.06096 D x 2.51896 .

3.2.2. Multi-Objective Optimisation Framework

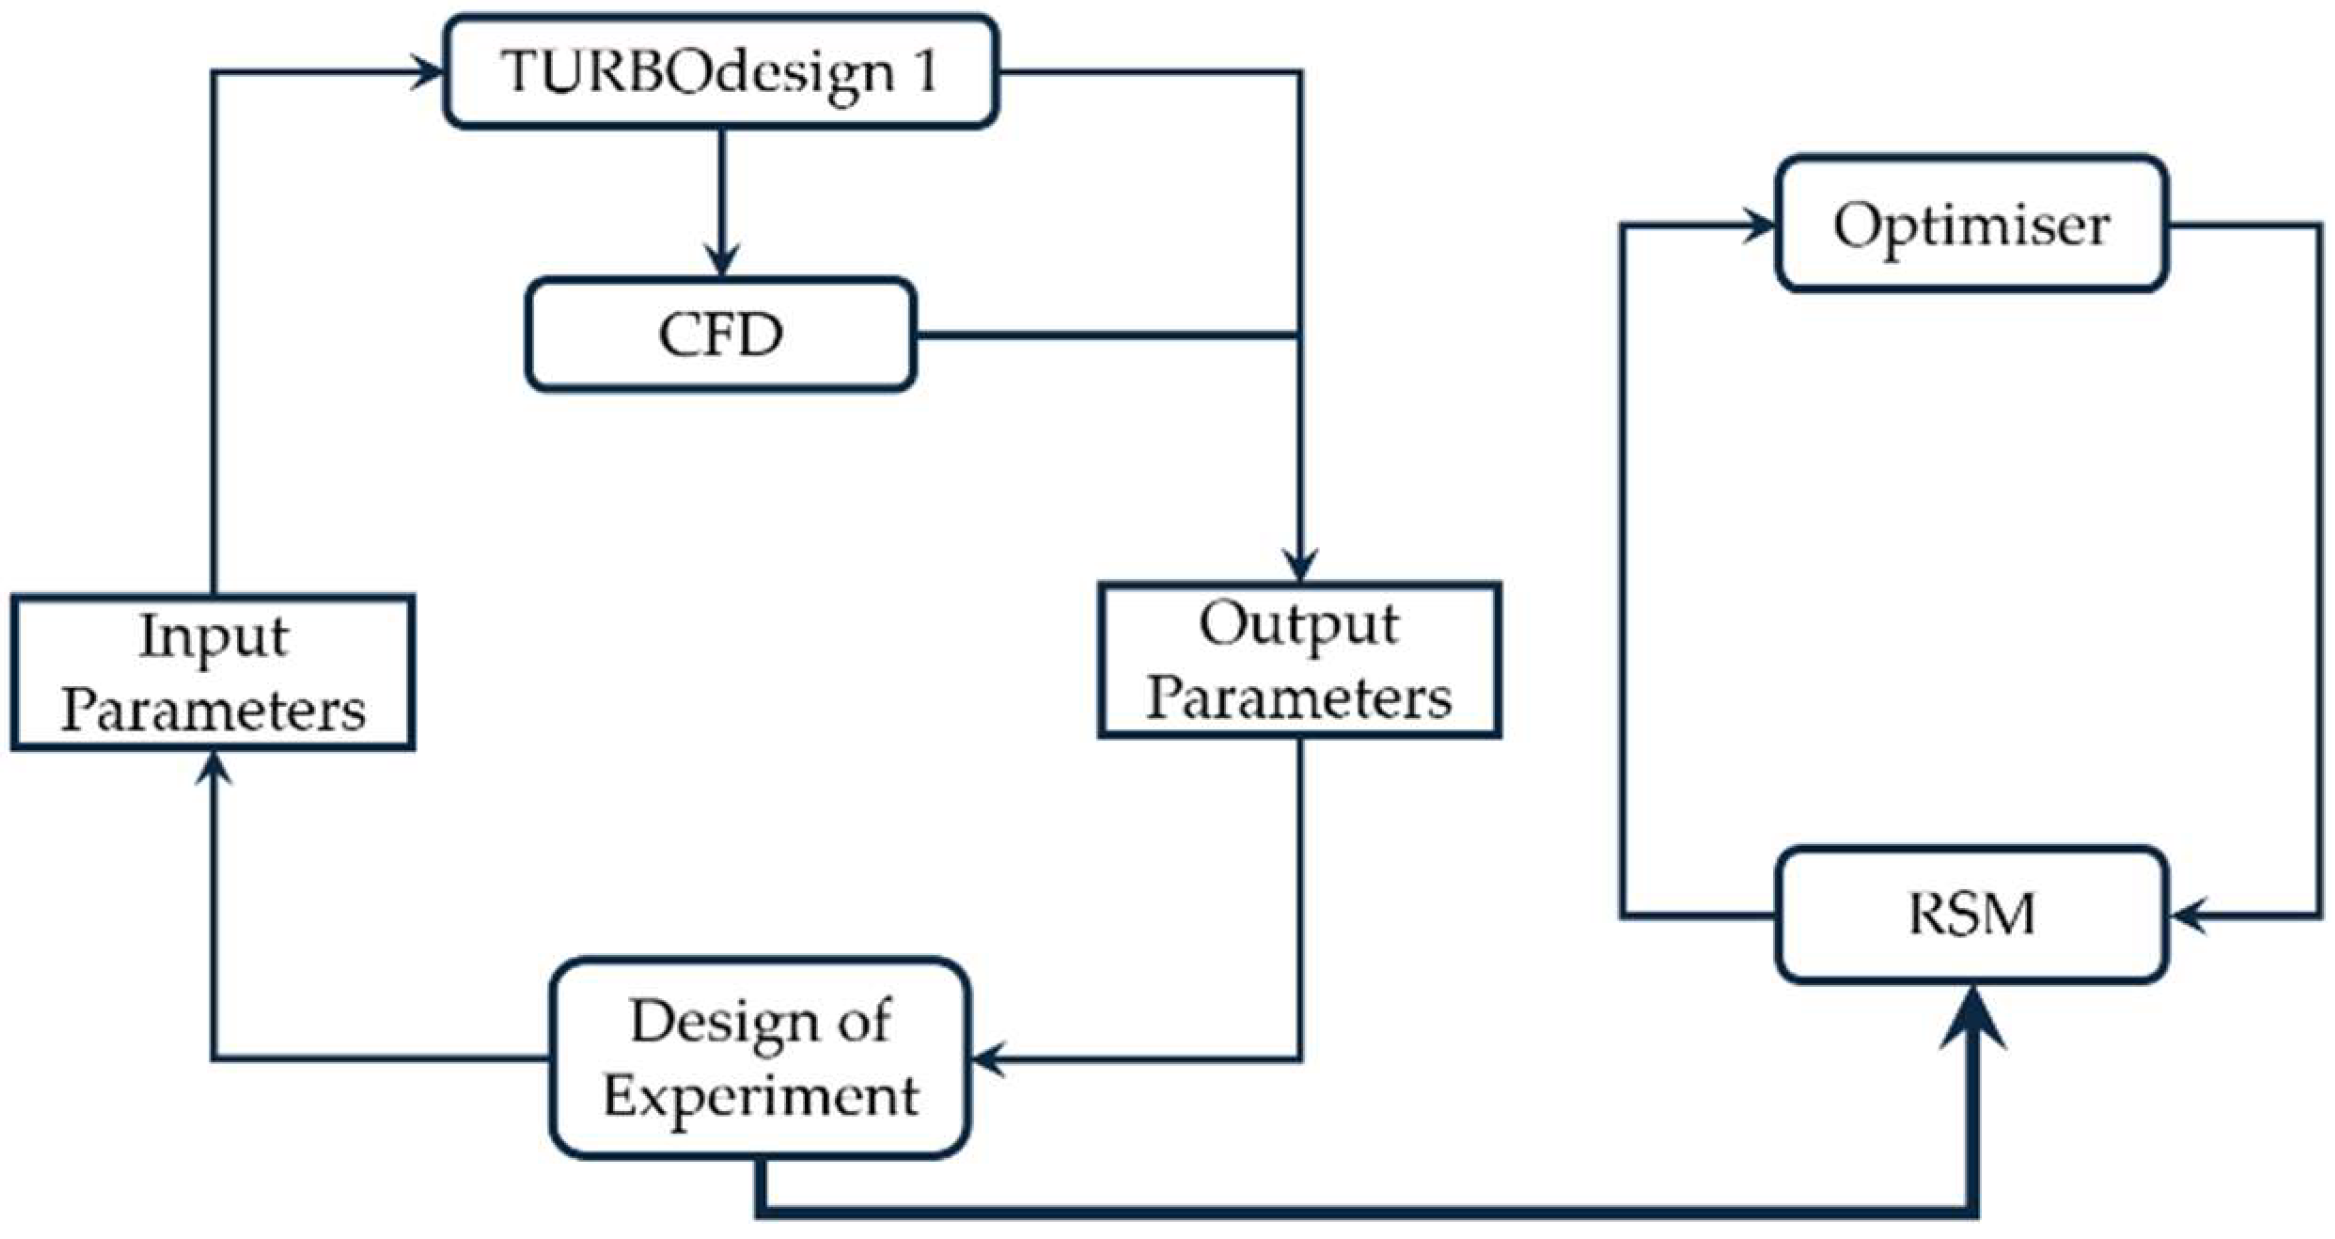
The multi-objective optimisation framework employed in this study is illustrated in Figure 5.
The process starts with the design of experiments (DoE), which methodically explores the design space by altering a predefined set of input parameters. The inputs in the form of blade parameters are fed into TURBOdesign1 to produce related 3D models. Every design is subsequently assessed through CFD simulations to calculate performance metrics that act as output parameters.
The data set that shows how inputs relate to outputs is used to create a Response Surface Model (RSM). This model represents the connection between design factors and goals, which allow for streamlined assessments in the optimisation process. The RSM works alongside an optimiser to pinpoint the blade designs considering various competing objectives.
The optimisation process starts by setting up a pool of solutions that each reflect a different blade design shape uniquely. These options undergo evaluation using either the RSM technique or through CFD in the phases to guarantee precise results. Next comes the non-dominated sorting step that categorises individuals into Pareto fronts according to dominance relationships. To maintain variety in solutions, effectively and fairly distribute them within each front across the space based on density metrics.
A binary tournament approach is employed, considering Pareto rank and crowding distance, for selection purposes in the algorithm process. Genetic diversity is enhanced through the implementation of simulated binary crossover (SBX) and polynomial mutation techniques. Elitist replacement strategy is used to create the succeeding generation by combining parent and offspring groups focusing on selecting performing individuals using criteria, such as dominance and diversity metrics.
The genetic algorithm parameters used in this study are summarised as follows: a population size of 30 and a total of 30 generations were used. The crossover probability was set at 0.9, with a distribution index of 10, while mutation was controlled by a distribution index of 20. The initialisation of the population was performed randomly to encourage broad exploration of the design space. This configuration supports a balanced search strategy that ensures convergence towards a well-distributed Pareto-optimal front.

4. Result and Discussion

4.1. Sensitivity Analysis

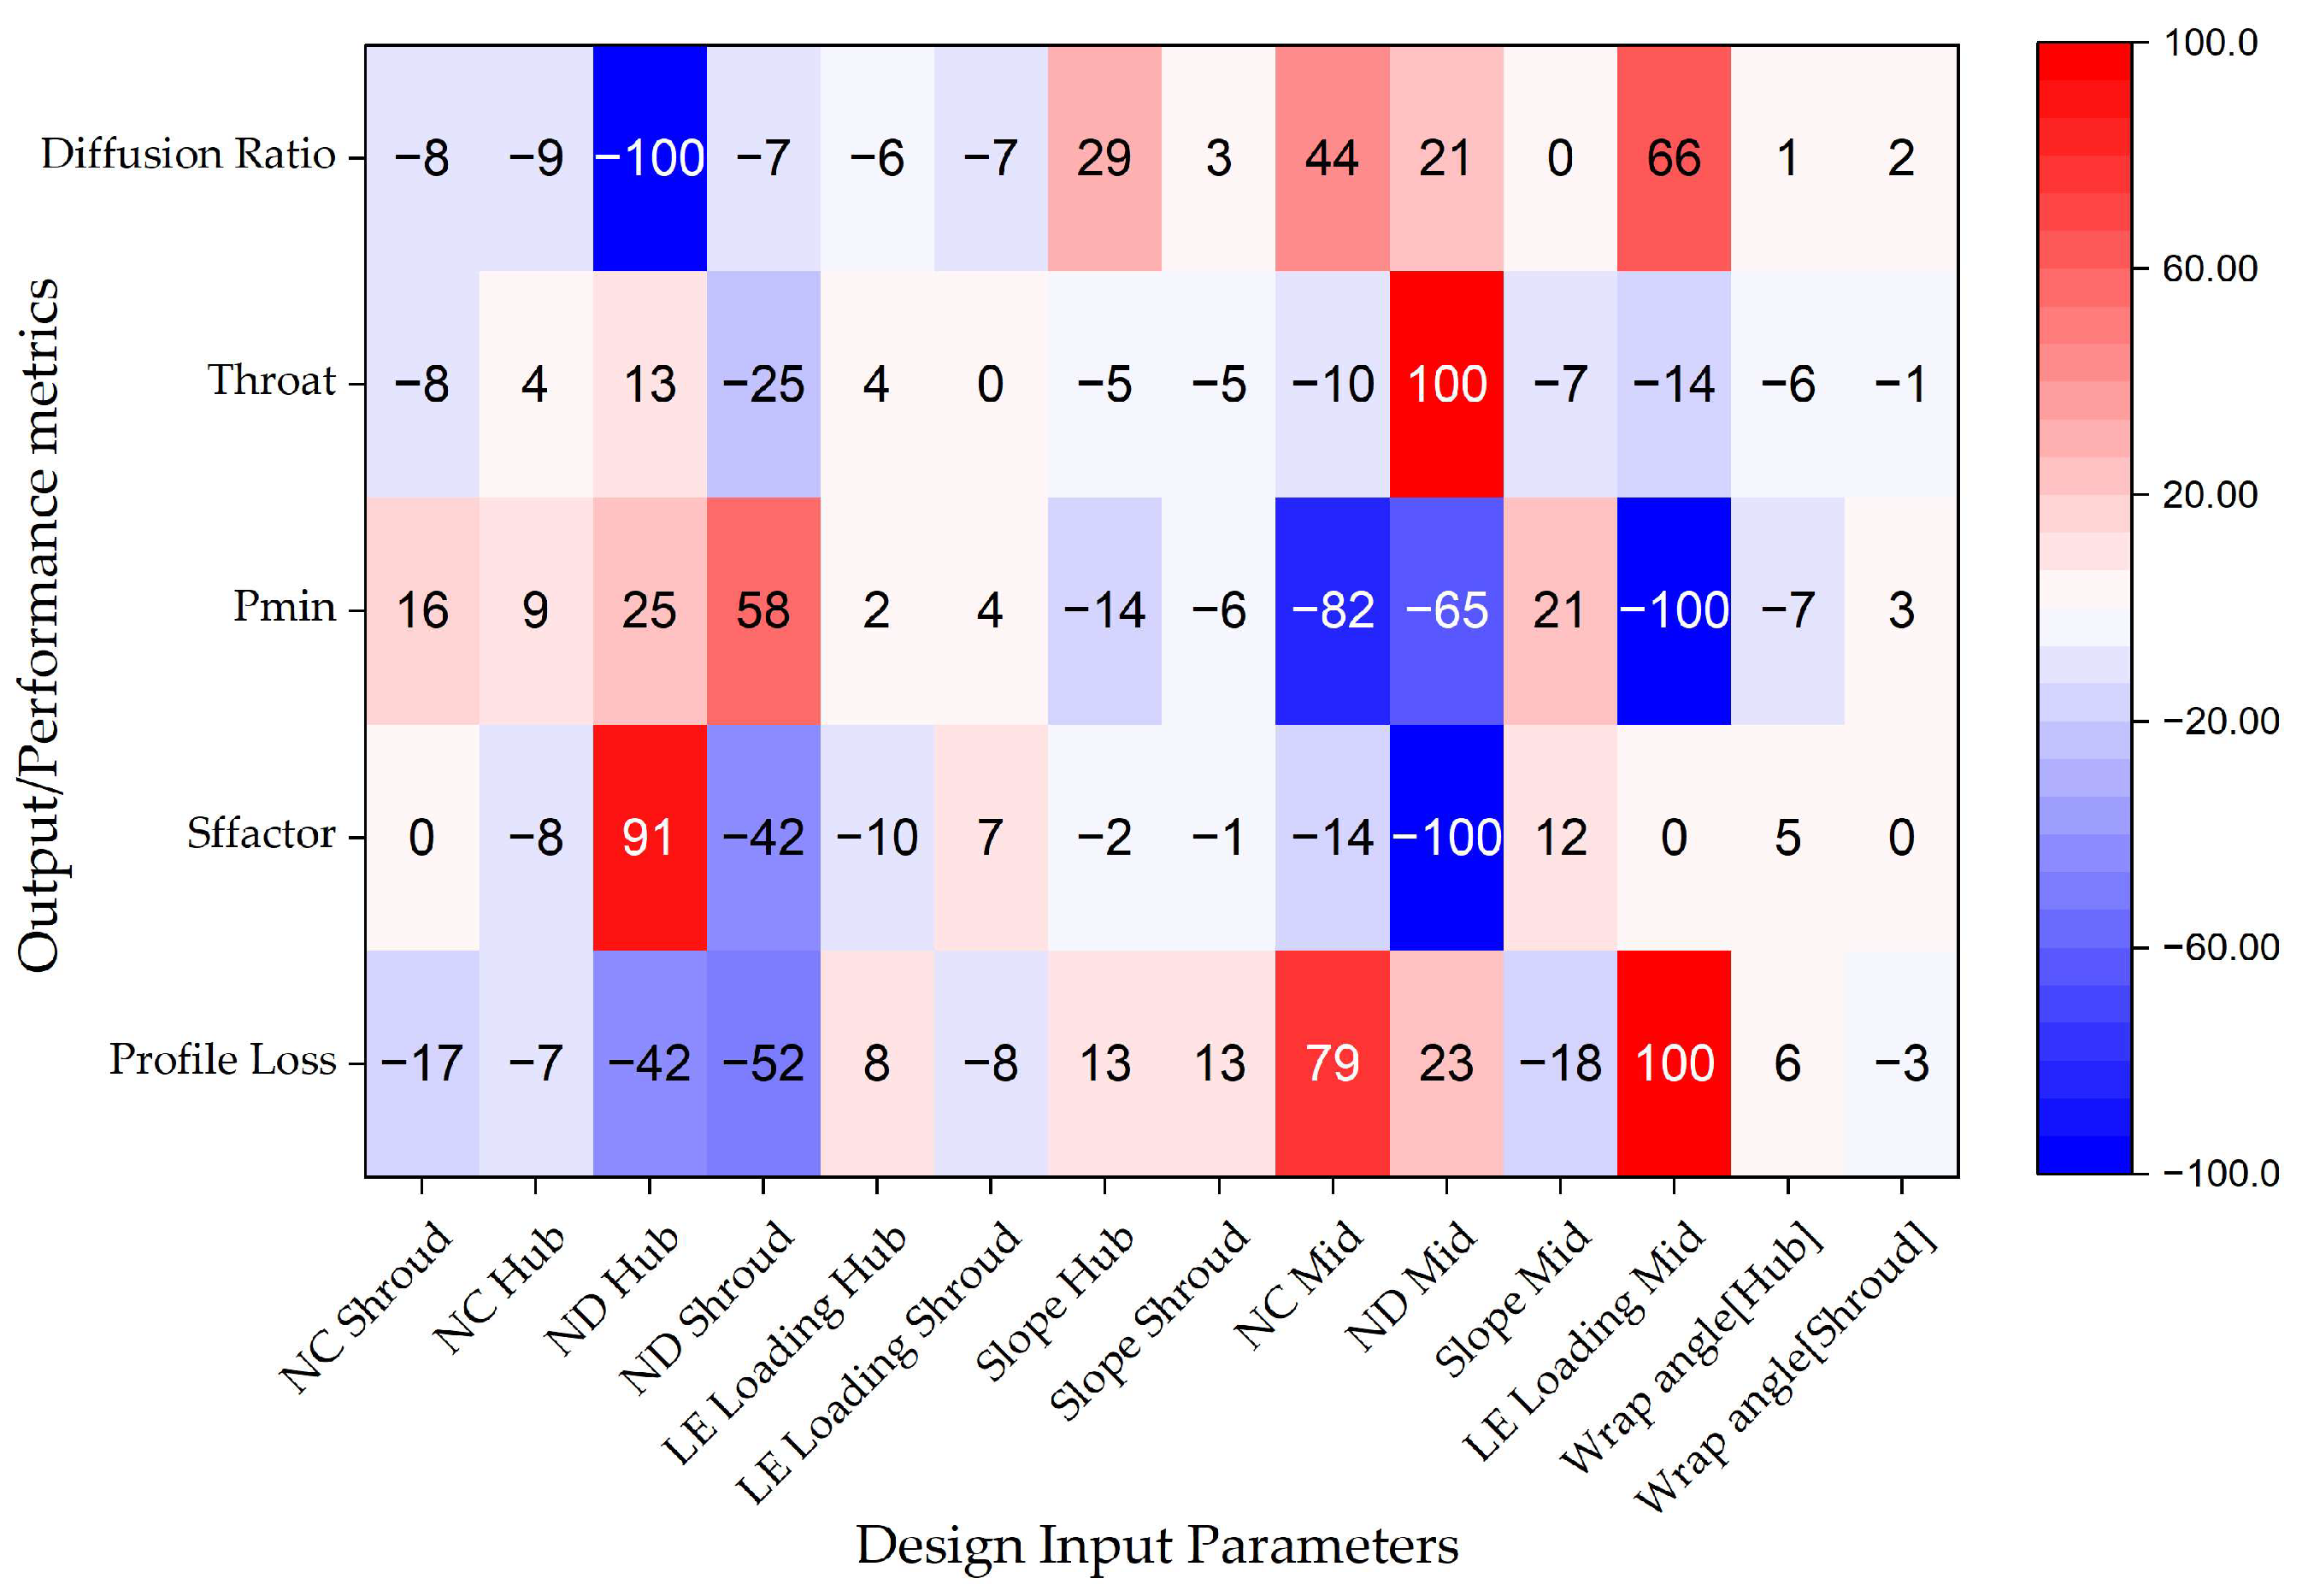
A minimum–maximum sensitivity analysis was conducted to identify the most significant design input parameters with respect to key fluid performance metrics. This method pinpoints the parameters that either greatly improve or hinder performance outcomes and directs optimisation efforts effectively, as illustrated in Figure 6. Among the design variables considered, LE Loading Mid had the most substantial influence across different metrics.
It notably boosted profile loss, showing that adjusting this aspect enhances flow attachment and energy recuperation significantly. Conversely, the LE Loading Mid adversely affected the minimum pressure, showing a high tendency for cavitation when aggressive loading is applied. Furthermore, the diffusion ratio is extremely sensitive to the LE Loading Mid. These extremes demonstrate the crucial role of mid-span loading in determining both performance and operational risk.
NC Mid also showed a sensitivity to profile loss while affecting minimum pressure and throat area negatively at the time. This suggests that a reduction in camber at the midspan can enhance velocity gradients to lessen losses but might also disrupt pressure fields and decrease the passage area, potentially resulting in flow separation and pressure drops. The SF factor analysis revealed that ND Hub and ND Mid had an impact on sensitivity levels within the spectrum of variables studied concerning axial momentum recovery in the turbine system.
Increasing the ND at the hub was found to enhance axial momentum recovery efficiency. On the other hand, excessive diffusion in ND Mid had a negative impact, likely leading to flow deceleration or boundary layer detachment within the mid-span zone. These findings underscored how optimising blade count is spatially dependent and can significantly affect uniformity across the turbine system.
Elevated loading, at mid span was shown to have an impact on pressure margins and cavitation risk in comparison to other parameters, such as ND Shroud and ND Hub. These improved minimum pressure by helping in stabilising flow and reducing pressure troughs through blade count adjustments at end walls.
In the examination of the throat region of the blade design study, ND Mid showed an impact, hinting that adding more blades at the midsection widens the flow path and lowers the risk of choking. Conversely, NC Mid resulted in a reduction, implying that heightened camber contraction around the midsection might overly constrict the throat and potentially cause choking or separation issues.
The diffusion ratio was significantly affected by the LE Loading Mid in a manner which highlighted its ability to effectively control velocity gradients and diffusion behaviour. On the hand, ND Hub showed a negative impact, suggesting that high diffusion near the hub can worsen local adverse pressure gradients and decrease pressure recovery.
Other factors such as Slope Hub, Slope Shroud, Wrap angle at the Hub, and Wrap angle at the Shroud seem to have minimum impact on the performance values. This suggests that these aspects play a role towards minor performance adjustments rather than being key factors driving major performance changes.
In conclusion, this min–max sensitivity analysis shows that LE Loading Mid, ND Mid, and NC Mid are the most significant design parameters, each employing maximum effects—either negative or positive —for multiple metrics. These outcomes show that the blade design at the mid-span accounts for the greatest leverage for performance improvement but is also susceptible to the highest risk of cavitation or flow instability if not optimally standardised. The ND Hub and ND Shroud are critical for harmonising pressure fields and mitigating secondary flows. Optimisation efforts should therefore deliberately rank these dominant variables to accomplish elevated efficiency without compromising hydraulic stability.

4.2. Optimisation Results

This section demonstrates the results of the two-stage optimisation work on hydraulic turbomachine systems compared to the baseline design obtained from the inverse design. The research focuses on boosting performance through blade runner geometry optimisation (Stage 1) and guide vane geometry optimisation (Stage 2). The main goals included minimising Profile Loss and Secondary Flow Factor (SF factor) while maximising the Minimum Pressure (Pmin) to decrease cavitation risk. TURBOdesign Suite was used to performed design optimisation evaluations to generate Pareto fronts for each stage. A total of 900 design variants were generated for each optimisation stage, which resulted in the 3D plots signifying the relationships and trade-offs between the optimisation objectives.

4.2.1. Stage 1 Optimisation-Runner Blades

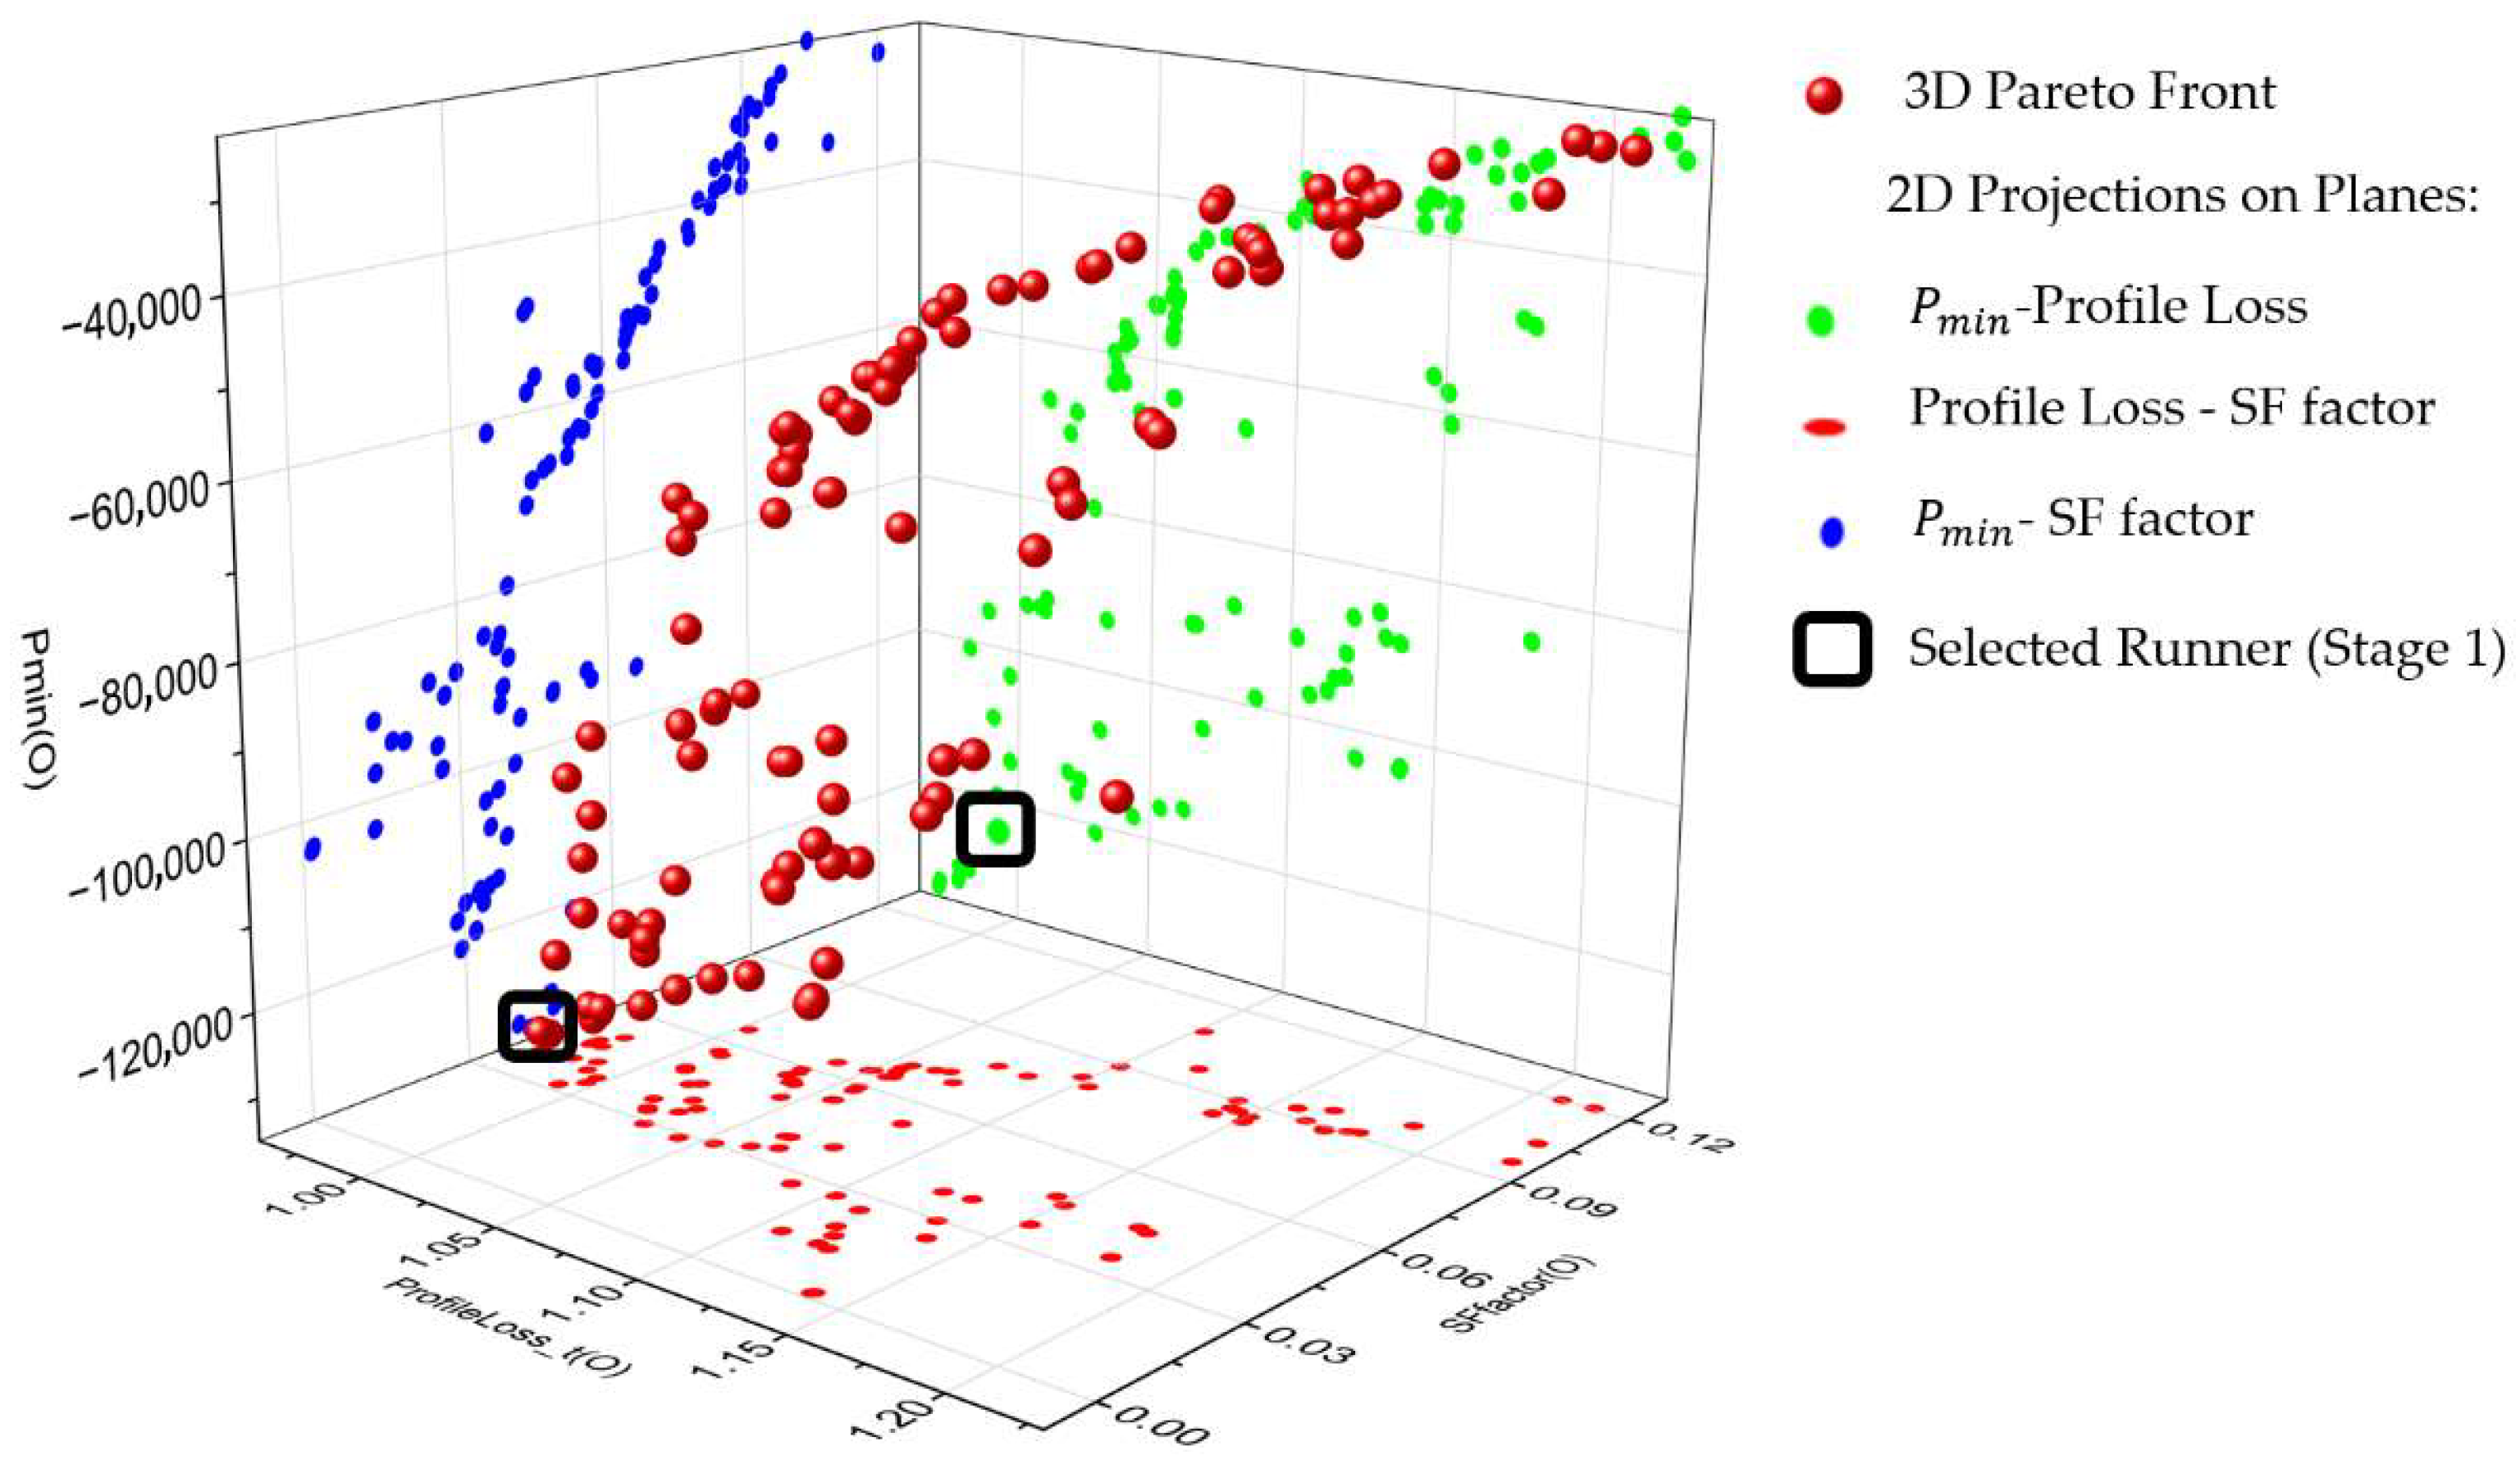
The first-stage optimisation results in Figure 7 show the Pareto front when only runner blade geometry was varied. The design space consists of three dimensions, including Profile Loss, SF factor, and Minimum Pressure (Pmin). The plot demonstrates obvious trade-offs between the optimisation objectives. The combination of low Profile Loss and low SF factor values directly correlates with higher values because these configurations minimise both viscous and secondary flow losses, which results in better pressure recovery and reduced cavitation onset. Profile Loss increases rapidly when the SF factor also rises, which leads to a significant decrease in Pmin values, which shows increased cavitation risk. The Pareto-optimal set shows that lowering viscous losses plays a major role in achieving higher pressure at the blade surface, which is essential for safe operation under different flow conditions.
The destabilising effects of secondary flows, which produce swirling motions and crossflows, result in significant pressure distribution disturbances that produce suboptimal designs with low Pmin values. The design selected in Figure 7 stands for a compromise between all the objectives, as shown in Table 6.
The Profile Loss decreased by ~22.7%, and SF factor dropped by ~16.8% compared to the baseline runner, signifying improved aerodynamic performance and reduced secondary flow effects. The pressure minimum value Pmin shows a substantial improvement from −877,325.5 Pa to −132,703.4 Pa, which shows a significant reduction in cavitation risk. The 3D Pareto front shows that the area with low Profile Loss and SF factor values produces the least negative pressures, thus confirming the effectiveness of the runner blade redesign. The optimisation of runner blades at this stage proves essential for reducing internal energy losses while maximising the pressure field.

4.2.2. Stage 2 Optimisation: Guide Vane

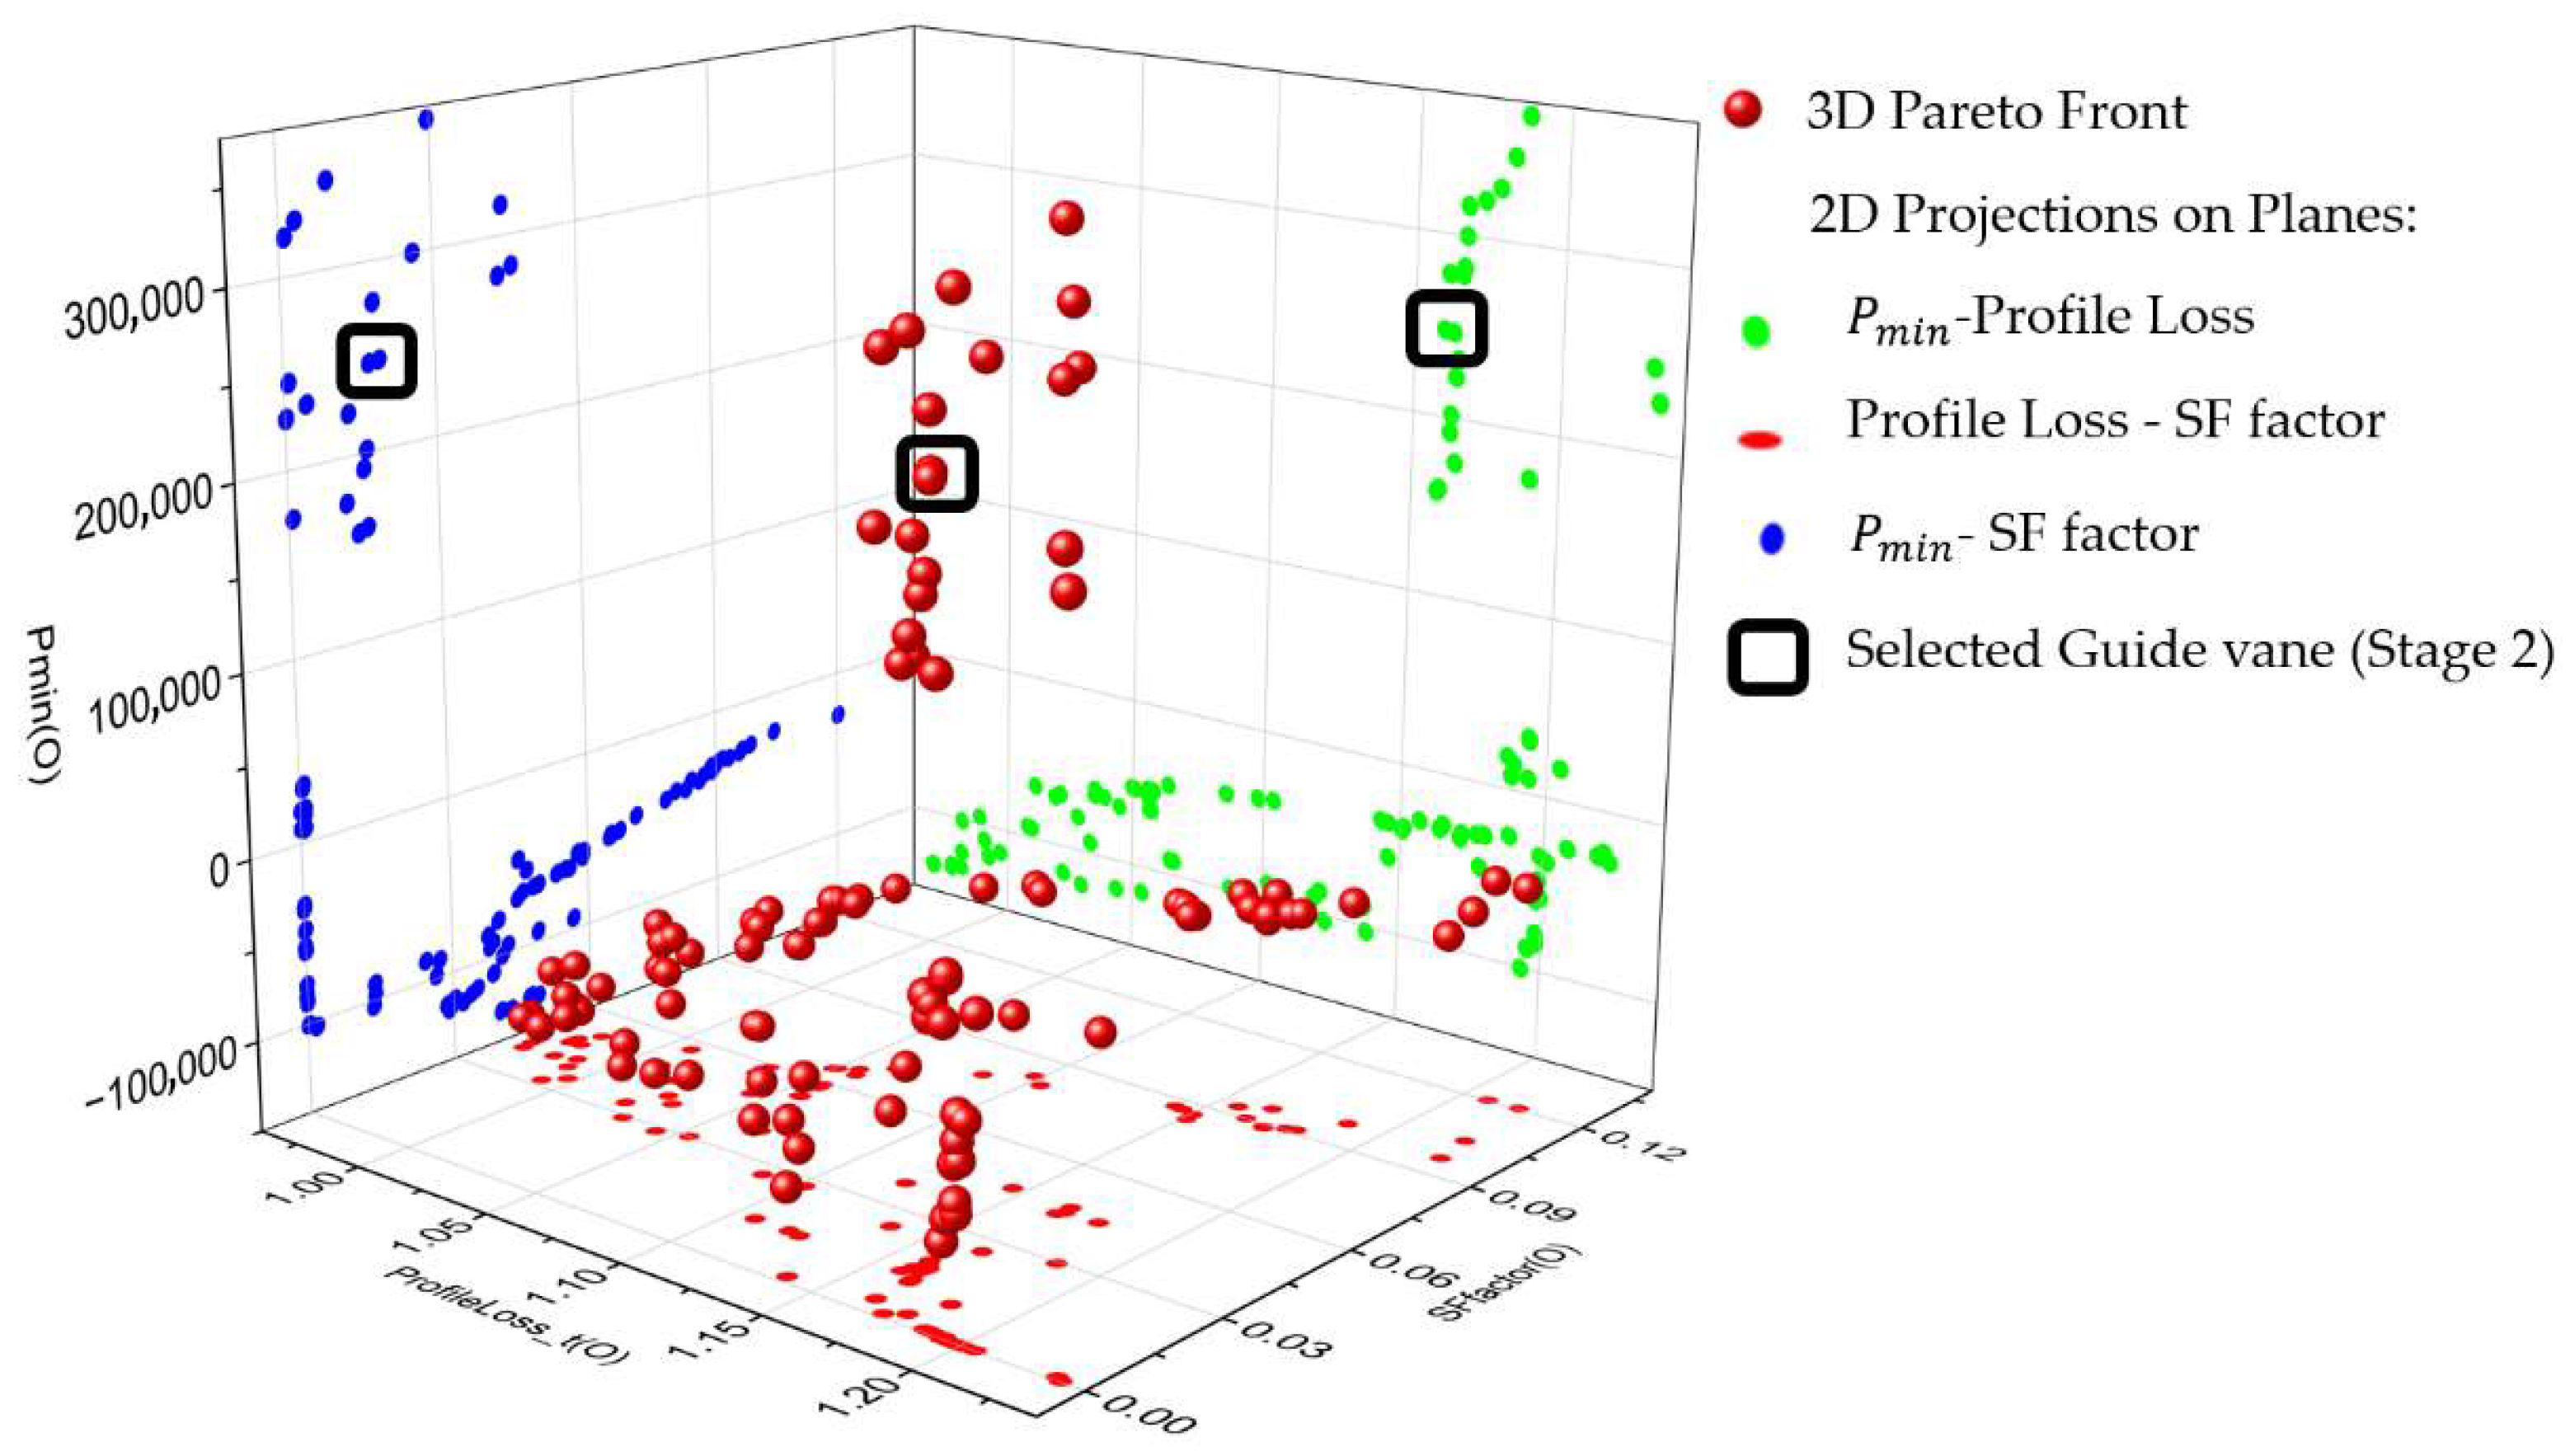
The second-stage optimisation integrated guide vane geometry as contemporary design variables while keeping the results of the optimised runner from Stage 1. The Pareto front presented in Figure 8 displays a wider range of performance response, primarily through its Pmin values. The guide vane design plays a crucial role in pre-conditioning the flow entering the runner, because this stage shows a new high-performance region with Profile Loss in the middle range, while the SF factor is lower and the Pmin values exceed those of the baseline design. The guide vane design stands out as the essential factor that determines how flow enters the runner.
The proper design of guide vanes enables effective alignment of inlet velocity vectors while reducing separation and vortex formation and creating smooth flow profiles, which reduces local pressure drops and enhances cavitation resistance. The chosen design in Figure 8 represents the optimal balance of all objectives as listed in Table 7.
The Profile Loss of the guide vane decreased by 9.3% in the optimised version compared to its baseline, while the SF factor showed a 20% improvement. The most significant gain comes from Pmin, which rose from 87.6 kPa to 247.5 kPa, standing for a 183% boost in cavitation resistance. The optimisation process shows that properly shaped guide vanes realign the incoming velocity vector and decrease flow separation to produce enhanced stability before the flow reaches the runner.

4.2.3. Synergistic Effects and Design Implications

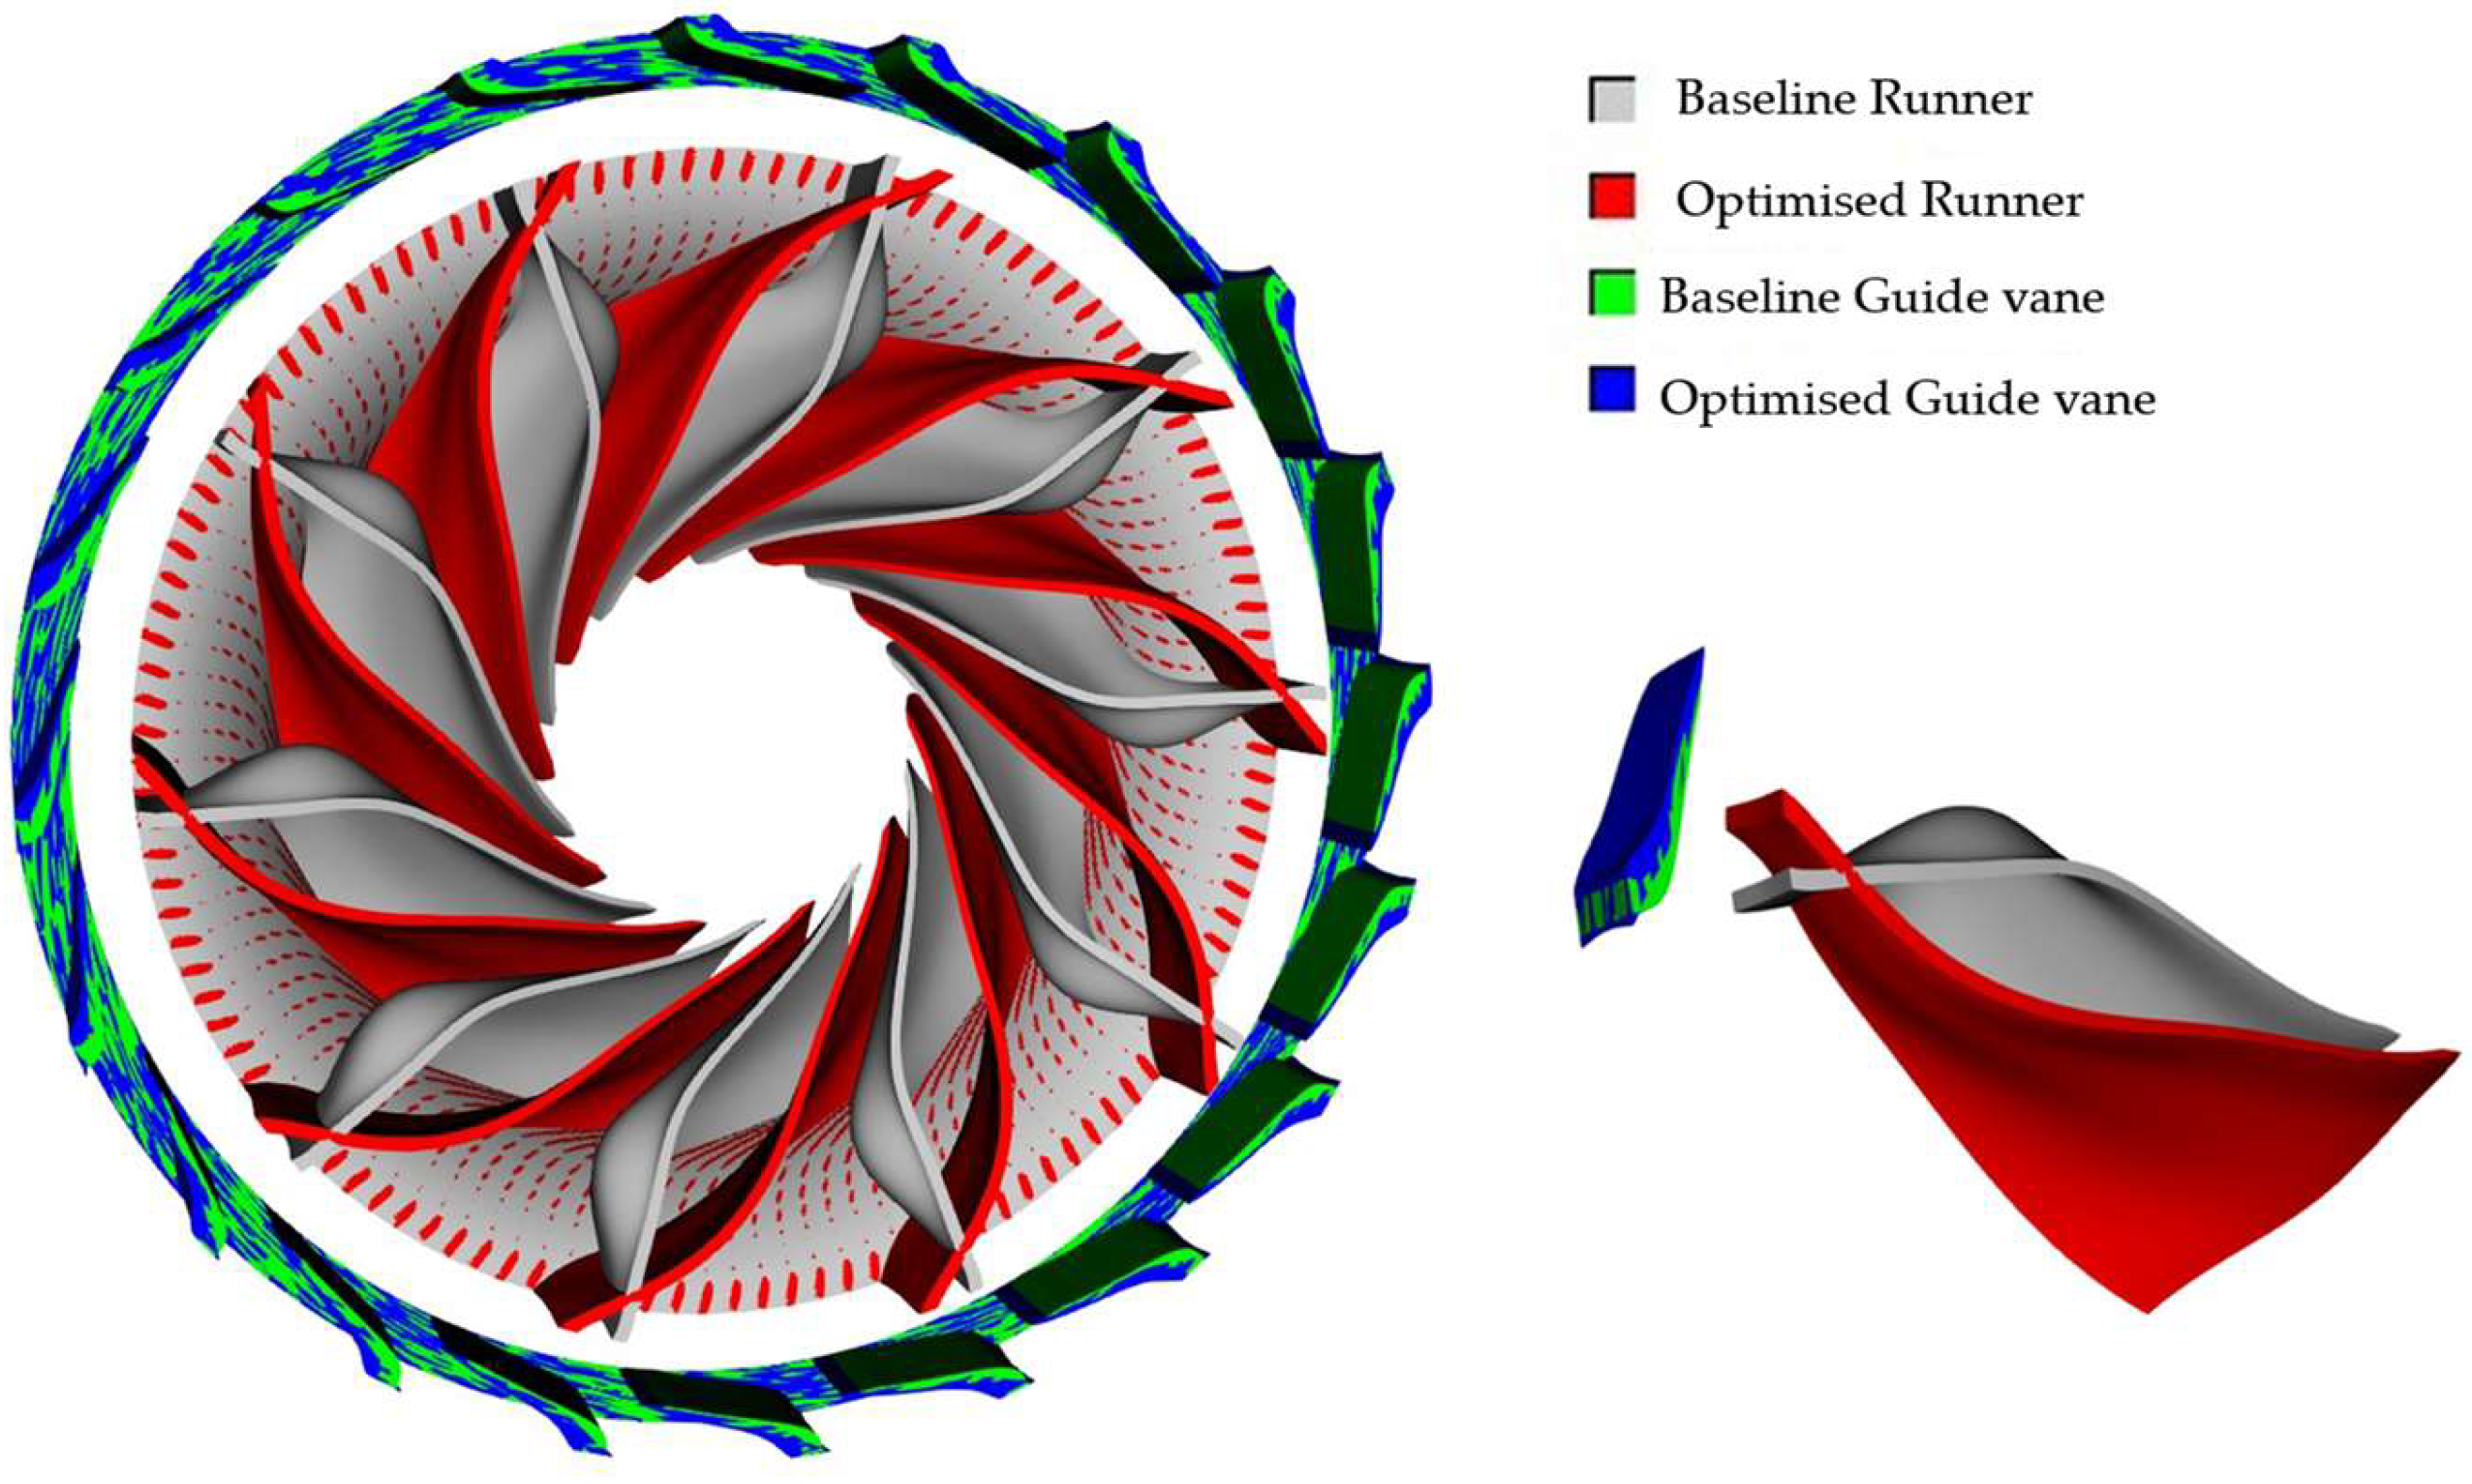
The collective findings between both stages demonstrate the beneficial synergies that arise from designing guide vanes and runner blades as a single system. The guide vanes set up the flow conditions that directly affect the runner inlet, while the runner blades determine the energy extraction and pressure recovery capabilities. The 3D representation in Figure 9 displays the baseline and optimised configurations of the guide vane and runner blades.
The runner blade optimisation converted an original design that caused severe cavitation into a design that does not cavitate at all, while the guide vane optimisation increased Pmin to positive pressures, which created safe operating conditions. These results confirm that optimising components in isolation is insufficient. The coordinated two-stage optimisation produces superior performance rather than separate optimisation of individual components. The two-stage optimisation approach achieved improved hydraulic performance along with enhanced cavitation resistance through iterative design changes in runner blades and guide vanes. The Pareto front development proves the intricate relationship between different performance parameters, including losses, flow characteristics, and pressure dynamics. Through this method, designers can explore a wide and clearly defined optimisation space that reveals solutions that meet operational needs, including maximum efficiency, stability, and cavitation robustness.

4.3. CFD Validation of the Combined Optimised Design

Following the two-stage optimisation of the hydraulic turbine’s runner blades and guide vanes, a complete 3D CFD simulation of the baseline design and stages 1 and 2 optimisations under rated operating conditions was conducted to confirm hydraulic performance. The CFD analysis confirmed the optimisation results while studying the intercomponent interactions to measure efficiency improvements and head and power increases compared to the baseline design. Validation was performed through comparison with obtained site operating conditions, as shown in Table 8.
The operating conditions of 0.8 m3/s and 1500 rpm with 136.5 m head and 942 kW power output were applied to the three configurations for uniform evaluation and ensure consistency and comparability across all performance metrics.

4.3.1. CFD Performance Validation Using Site Operating Data

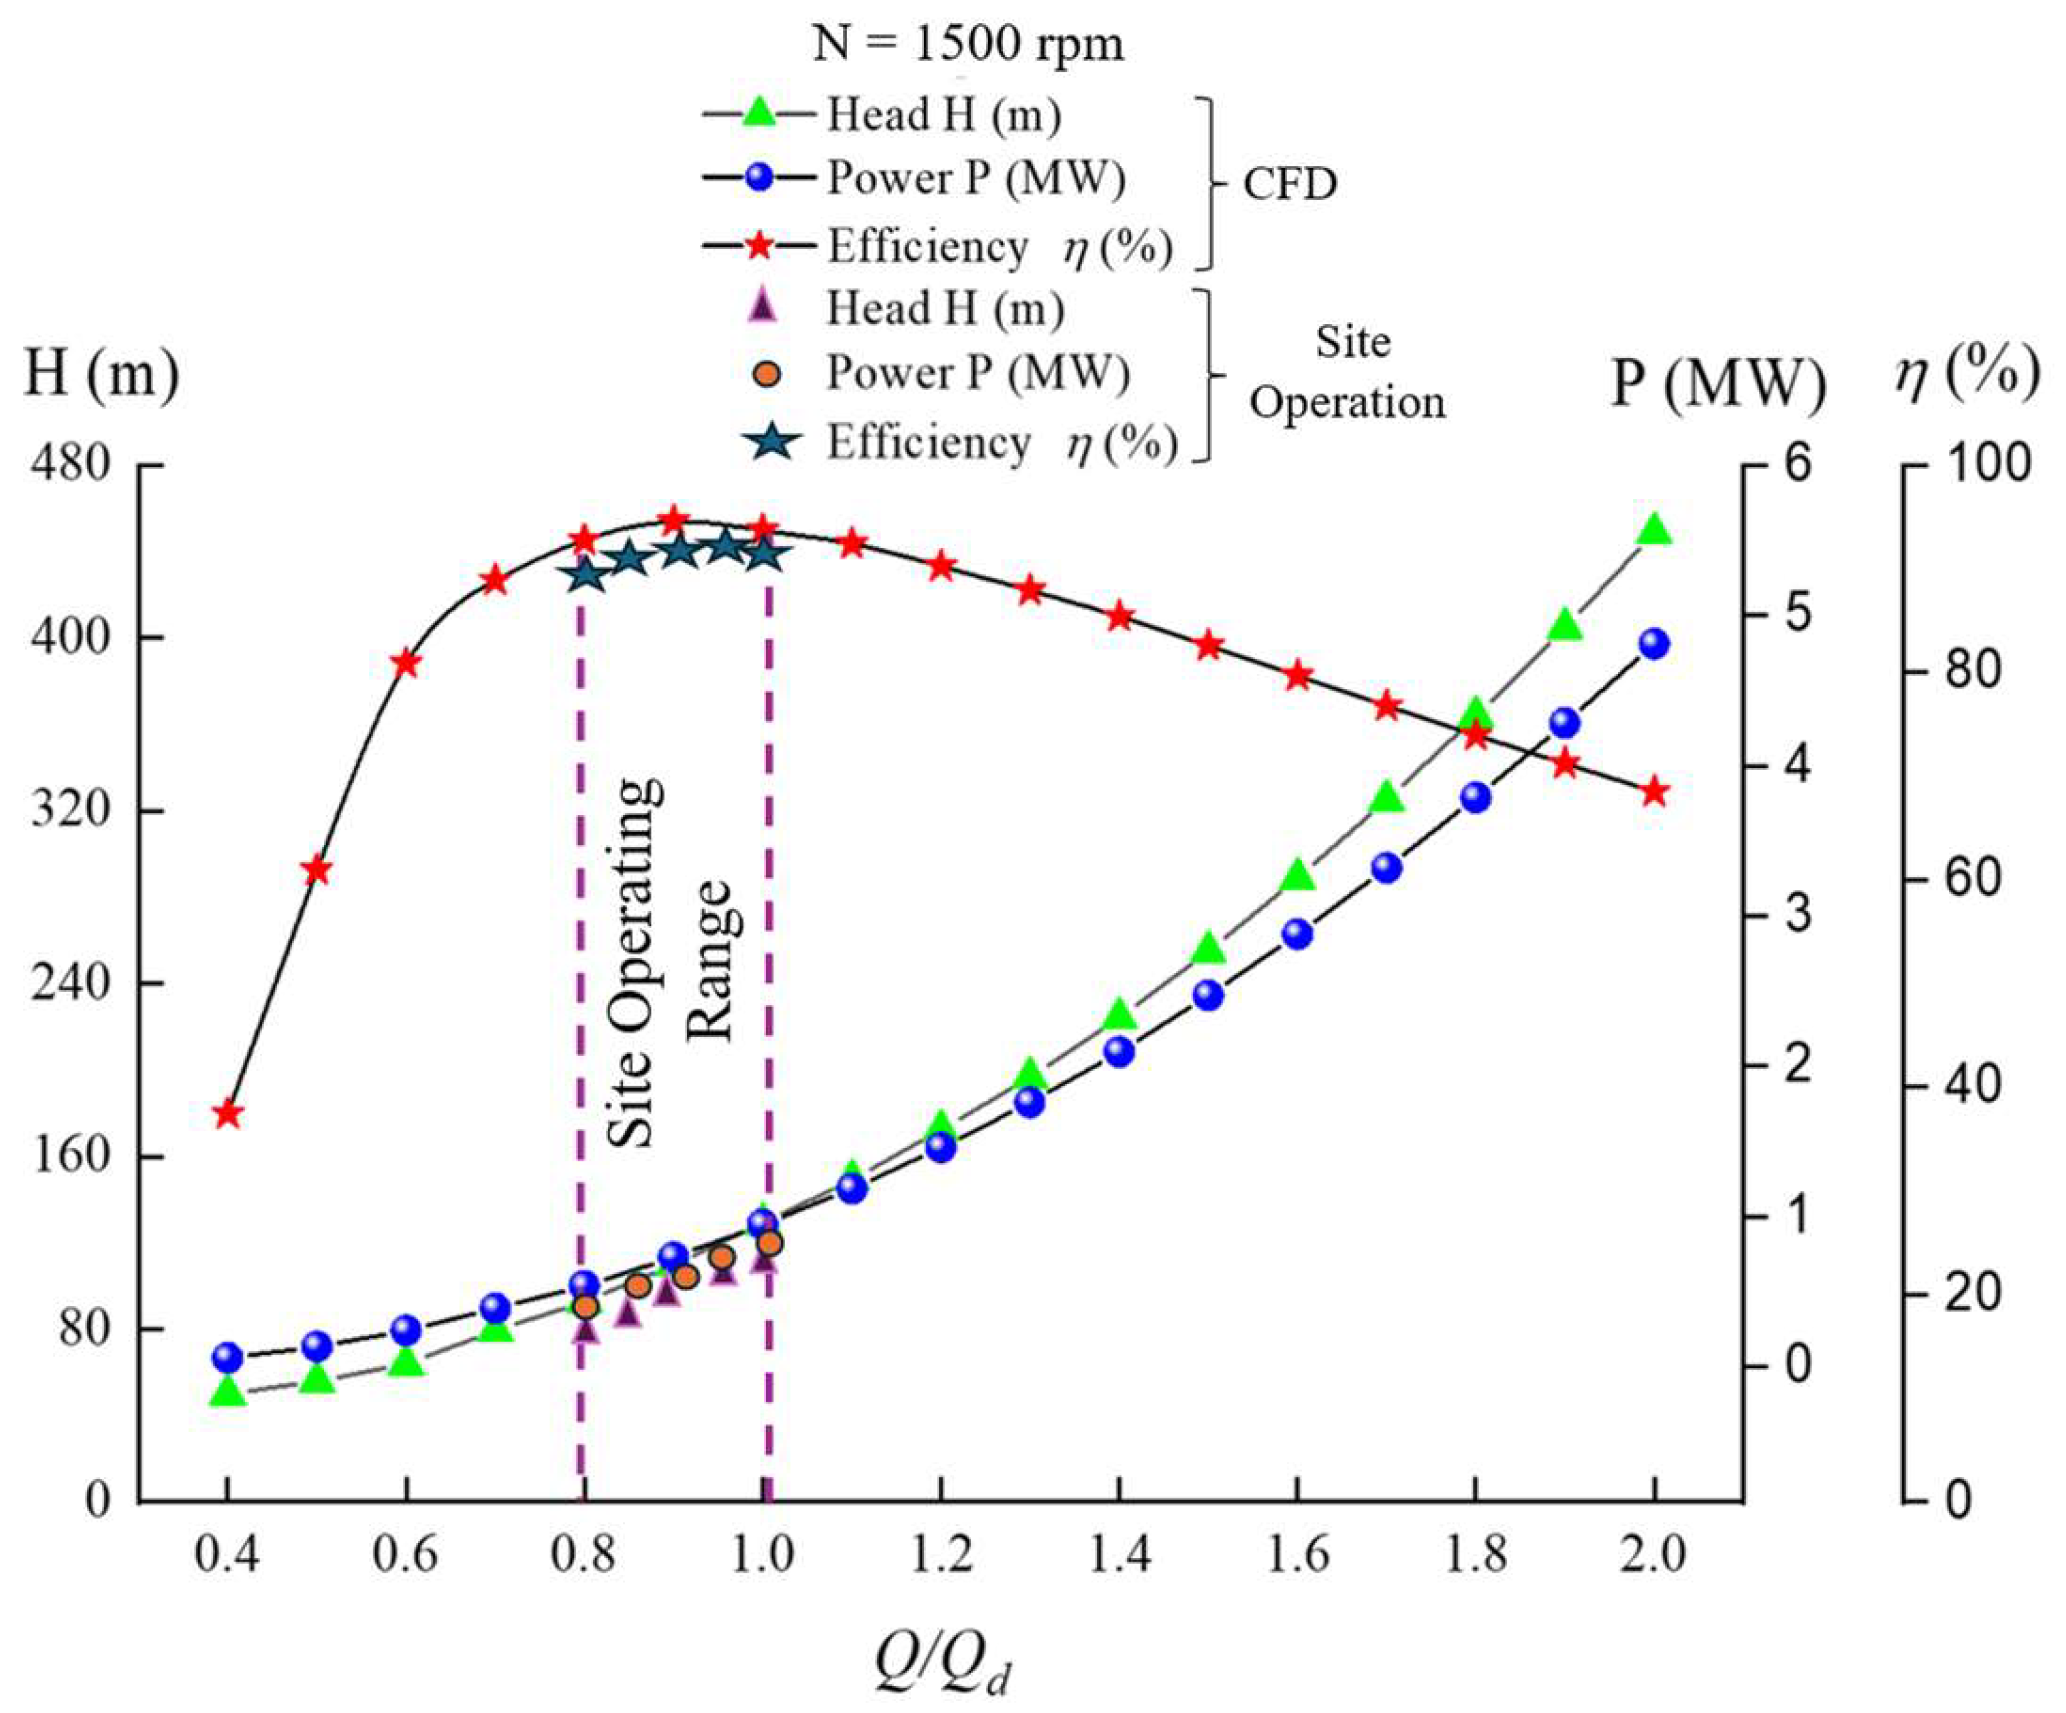
The performance of the final optimised design obtained through the two-stage optimisation of the runner and guide vane was confirmed against actual site operating data obtained from Bérchules hydropower plant in Spain. As shown in Figure 10, the variation in head (H), power output (P), and hydraulic efficiency (η), with respect to the flow ratio (Q/Qd), was used to benchmark the CFD predictions.
The site measurements served as a trustworthy benchmark to evaluate the accuracy of the CFD model. The CFD results matched measured data precisely throughout the entire operating range, particularly during the site’s normal operating conditions. The simulation results matched the site data for both head and power output trends and precisely located the maximum efficiency point. The minor discrepancies at off-design flow rates fall within normal engineering limits because of operational variations and small measurement errors. The strong correlation between the CFD model and actual measurements proves the model’s robustness while confirming the practical application of the optimised Stage II runner through its simulation results.
When comparing CFD-derived efficiencies with nameplate or experimentally measured values, it is important to recognise inherent differences between the two approaches. CFD simulations typically report higher efficiencies because they capture only the hydraulic behaviour of the turbine under idealised flow conditions. They do not account for mechanical losses (e.g., bearings, seals), electrical losses in the generator, or more factors such as surface roughness, wear, and cavitation, which are always present in real machines.
By contrast, nameplate ratings and experimental measurements reflect the actual operational performance of the entire turbine–generator system, incorporating all the above loss mechanisms. As such, direct comparisons between CFD predictions and field efficiencies will inevitably show a discrepancy.
The purpose of CFD-based optimisation, therefore, is not to reproduce absolute nameplate efficiency but to show relative improvements within the same numerical framework. Efficiency gains reported in CFD highlight the effectiveness of geometric or operational modifications to the hydraulic components, while acknowledging that real-world operating values will be lower.
This distinction underscores the value of CFD as a design and optimisation tool rather than a direct predictor of field efficiency, providing engineers with insights into performance improvements that can later be validated through experimental or operational testing.
The predictive precision of the developed method via CFD was quantitatively computed against site performance data. Standard error metrics, namely Mean Percentage Error (MPE), Mean Absolute Error (MAE), and Root Mean Square Error (RMSE) were used for this analysis (see Table 9).
The slight discrepancies observed in the site data and CFD depicts a close prediction of the turbine head, since the RMSE, MAE, and MPE are 5.53, 5.06, and 5.00%, respectively.
Furthermore, the error metrics of RMSE (0.022), MAE (0.015), and MPE (2.48%) were recorded in the power output prediction. These low margins clearly represent excellent predictive agreement in the power output. In terms of efficiency, RMSE (2.97), MAE (2.80), and MPE (3.05%) were recorded. The values obtained via CFD are marginally higher than the site data, but these discrepancies are within an acceptable range for the validation of hydraulic turbine performance.
The analysis confirms the reliability and consistency of the proposed method for predicting actual turbine characteristics. The RMSE, MAE, and MPE are moderate across all performance metrics and are within the acceptable limits recorded in the literature [22,34].
As observed in the work of Ohiemi and McNabola [22], the CFD model analytically provides marginally higher estimations of performance. Nevertheless, the clear alliance of the performance tendencies and the comparatively insignificant percentage errors establish that the combination of the IDM with CFD and MOGA is a valid and accurate predictive framework for reproducing digital models of legacy hydro turbines with limited blueprints, regardless of the size of plant in question.
Whilst global SCADA data were employed for system-level validation in this study, we acknowledge that such comparisons are insufficient to fully capture local flow physics. Ideally, local validation data such as pressure tap measurements, LDV velocity profiles, or cavitation observations would provide stronger corroboration of CFD predictions of secondary flows, profile losses, and minimum pressure. However, implementing these methods in the present case was not practicable. The hydropower facility investigated is an operational legacy plant, where intrusive instrumentation would necessitate modifications to the turbine casing, runner, or guide vane system, leading to operational downtime. Such approaches are more readily undertaken in laboratory-scale rigs or experimental turbines, where measurement access can be incorporated by design. We therefore relied on global SCADA data for validation, which offered reliable system-level insights across operating conditions. Future studies, particularly those undertaken during major refurbishments or on dedicated test rigs, may incorporate local validation techniques to further strengthen the link between CFD predictions and measured flow behaviour.

4.3.2. Velocity Field and Streamlines

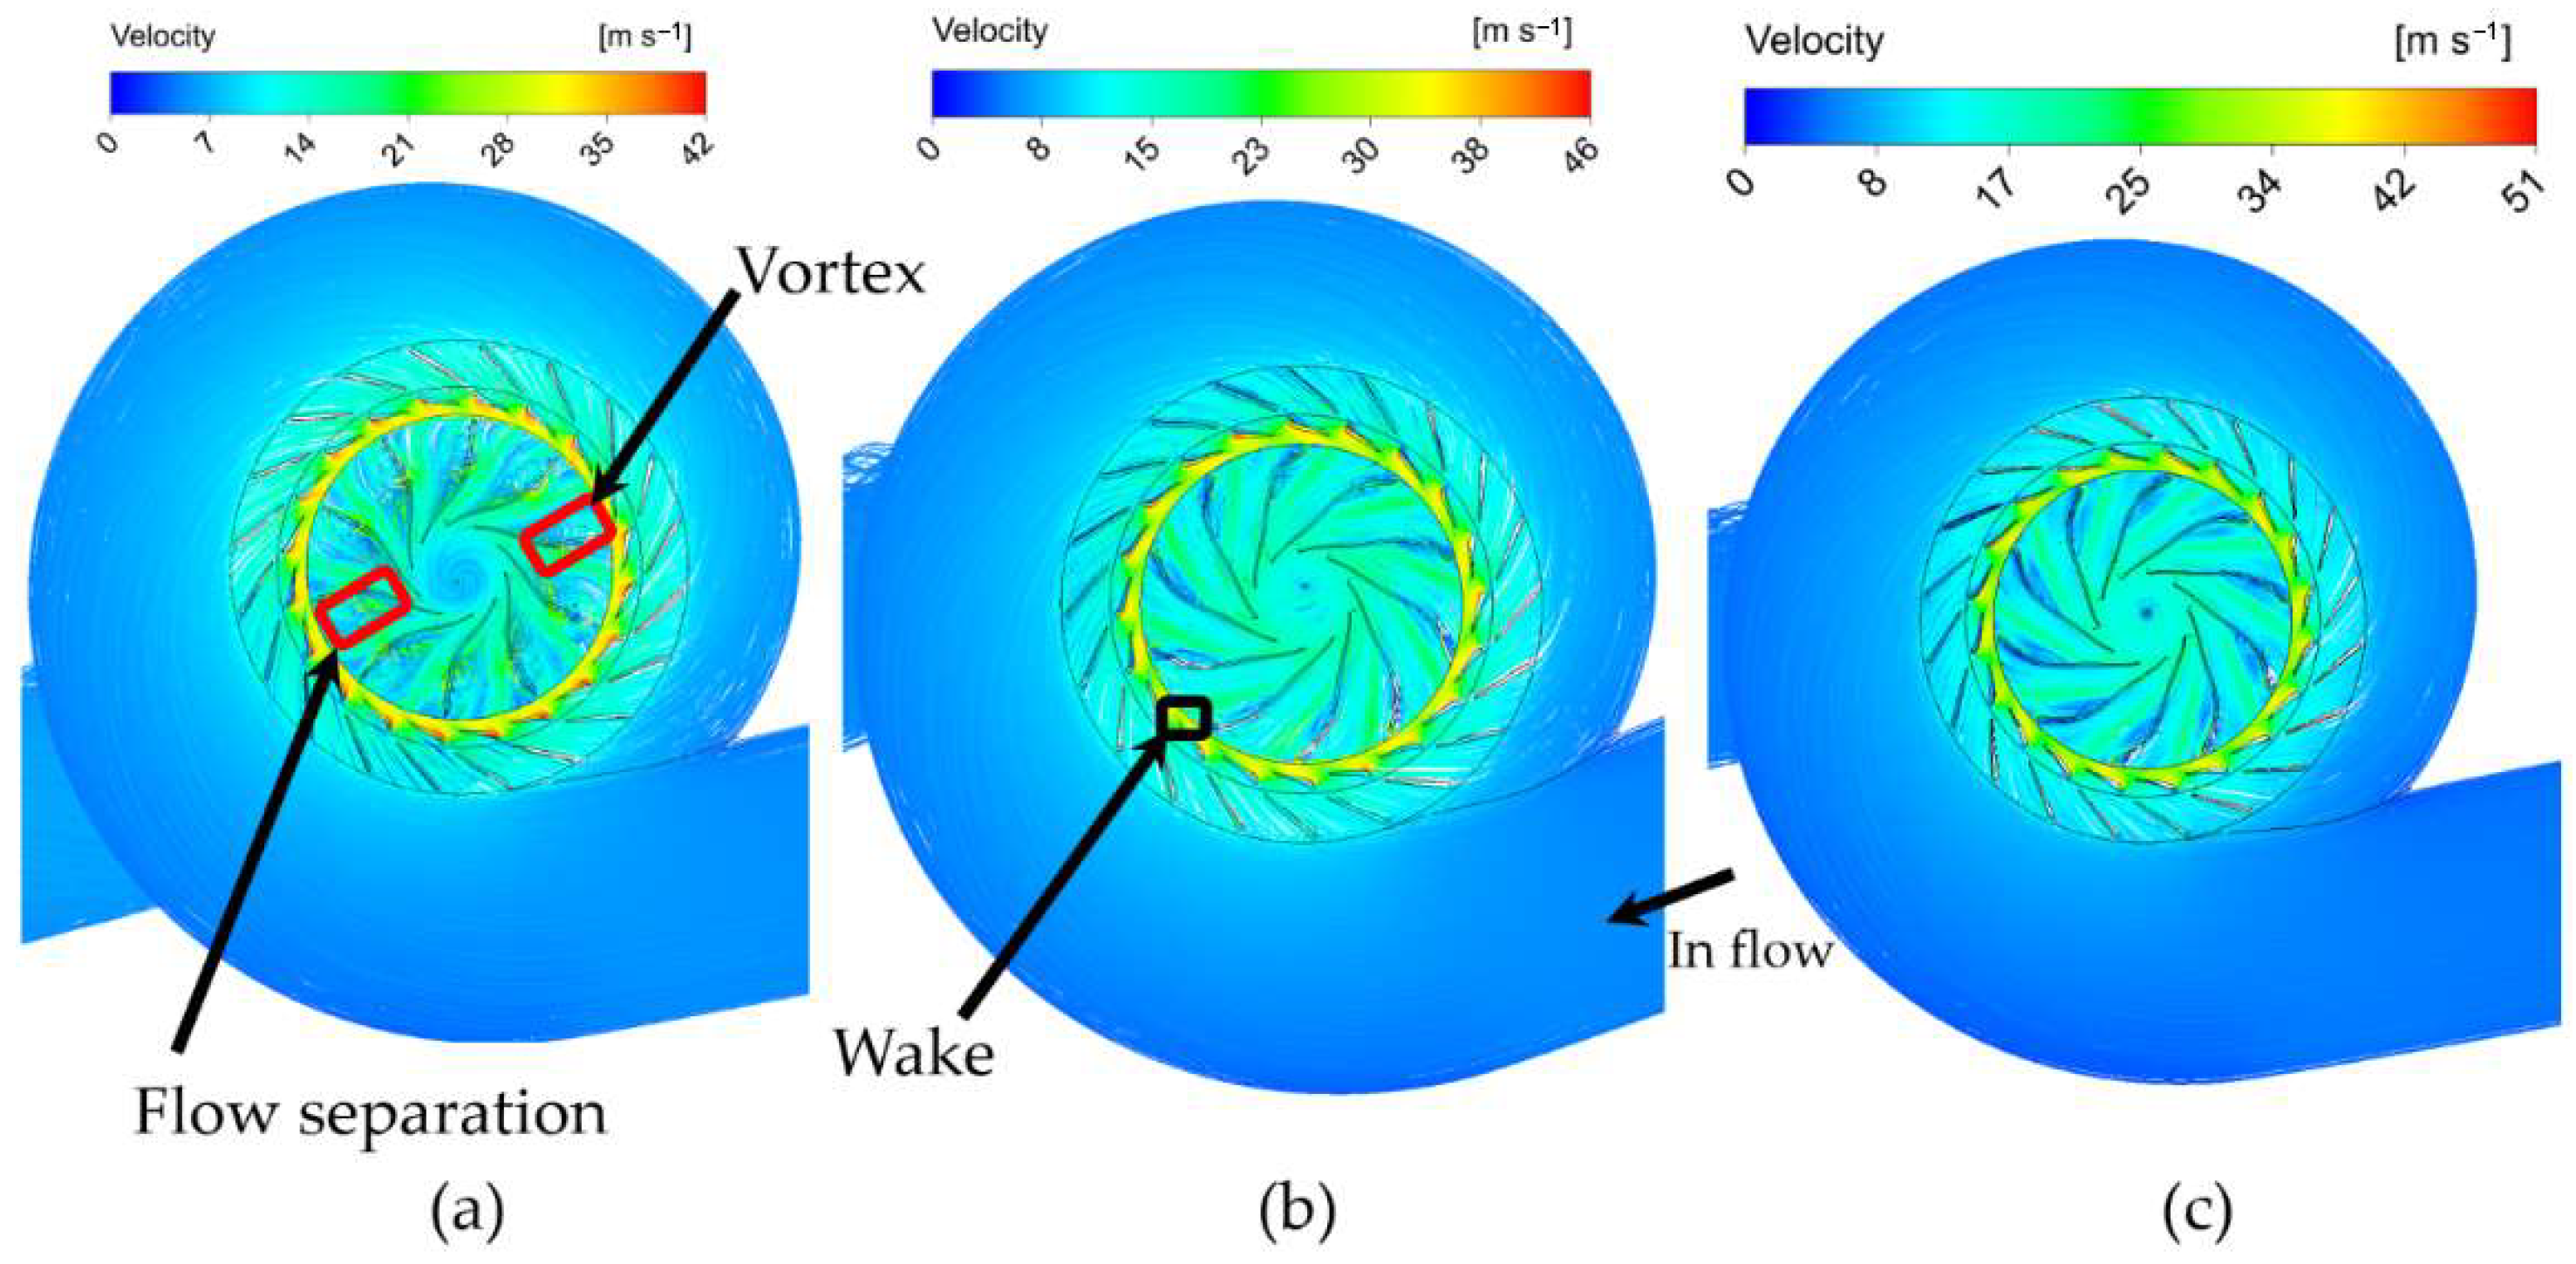
Velocity contour plots and streamline analyses in Figure 11 and Figure 12 showed that the baseline turbine experienced significant flow misalignment and separation zones at both guide vane exits and runner inlets (See Figure 11a and Figure 12b). These phenomena generated secondary vortices and localised turbulence that contributed to energy loss and pressure drops.
The optimised geometry maintained uniform inlet flow conditions at the runner with streamlines that accelerated smoothly and showed minimal cross-passage deviation as seen in Figure 12b,c. The suppression of vortex formation became evident, especially near blade tips and roots, which led to a significant decrease in secondary flow intensity. The SF factor reduction from 0.0483 (baseline) to 0.0187 (Stage 2) matches the observed improvement. The baseline turbine showed high viscous losses together with flow detachment on the suction side of the runner blades and in the guide vane wake region. The optimised design displayed reduced wall shear stress and total pressure loss contours, which proved the improvement of the isentropic flow path especially in areas where boundary layer separation and recirculation occurred. The Profile Loss decreased to 0.96 in Stage 1 and remained at 1.16 in Stage 2 due to runner and guide vane optimisation, which simultaneously reduced flow resistance and improved passage diffusion rates.

4.4. Internal Flow Field Analysis

This section solely relies on CFD validation to present visual data that validates previous results. It provides an extensive examination of pressure and velocity contour plots that demonstrates the progression from the baseline through Stage 1 runner blade optimisation to Stage 2 combined runner and guide vane optimisation.

4.4.1. Pressure Distribution at Blade Spanwise Sections

The internal flow behaviour changes resulting from two-stage optimisation can be better understood by analysing spanwise pressure contour plots at three representative blade heights (Span = 0.1, 0.5, and 0.9) for every design configuration. The plots are presented in Figure 13. Static pressure distribution visualisations in Figure 13 display meridional slices between guide vane and runner passages, offering insight into blade loading areas and cavitation-prone points across the span.
Figure 13a presents the pressure distribution across individual blades for the baseline design. The pressure contour demonstrates extensive low-pressure areas that exist mainly on the suction side of the runner blade at spans 0.5 and 0.9. These regions display the indicators of high loading, along with potential cavitation risks. The pressure distribution at Span 0.1 remains less intense compared to other regions, but the passage experiences uneven pressure gradients. The Stage 1-optimised runner blade geometry produces a more balanced pressure field, as shown in Figure 12b.
At Span 0.5, the pressure distribution demonstrates better loading patterns across the blade while showing reduced cavitation vulnerability. The runner blade maintains a steady pressure increase along its passage, which confirms the improved minimum pressure results. The pressure field reaches its most stable state when guide vane optimisation is implemented during Stage 2, as demonstrated in Figure 13c. The spanwise pressure gradients decrease while the high-pressure zones linking from the vane leading edge to the runner trailing edge show uniform maintenance.
The greatest improvements were observed around the hub and mid-span regions, demonstrating excellent flow pre-conditioning from the optimised guide vane. The pressure distribution remains cohesive throughout all spans because combined guide vane and runner blade optimisation works to reduce pressure drops and increase blade loading.

4.4.2. Velocity Distribution at Blade Spanwise Sections

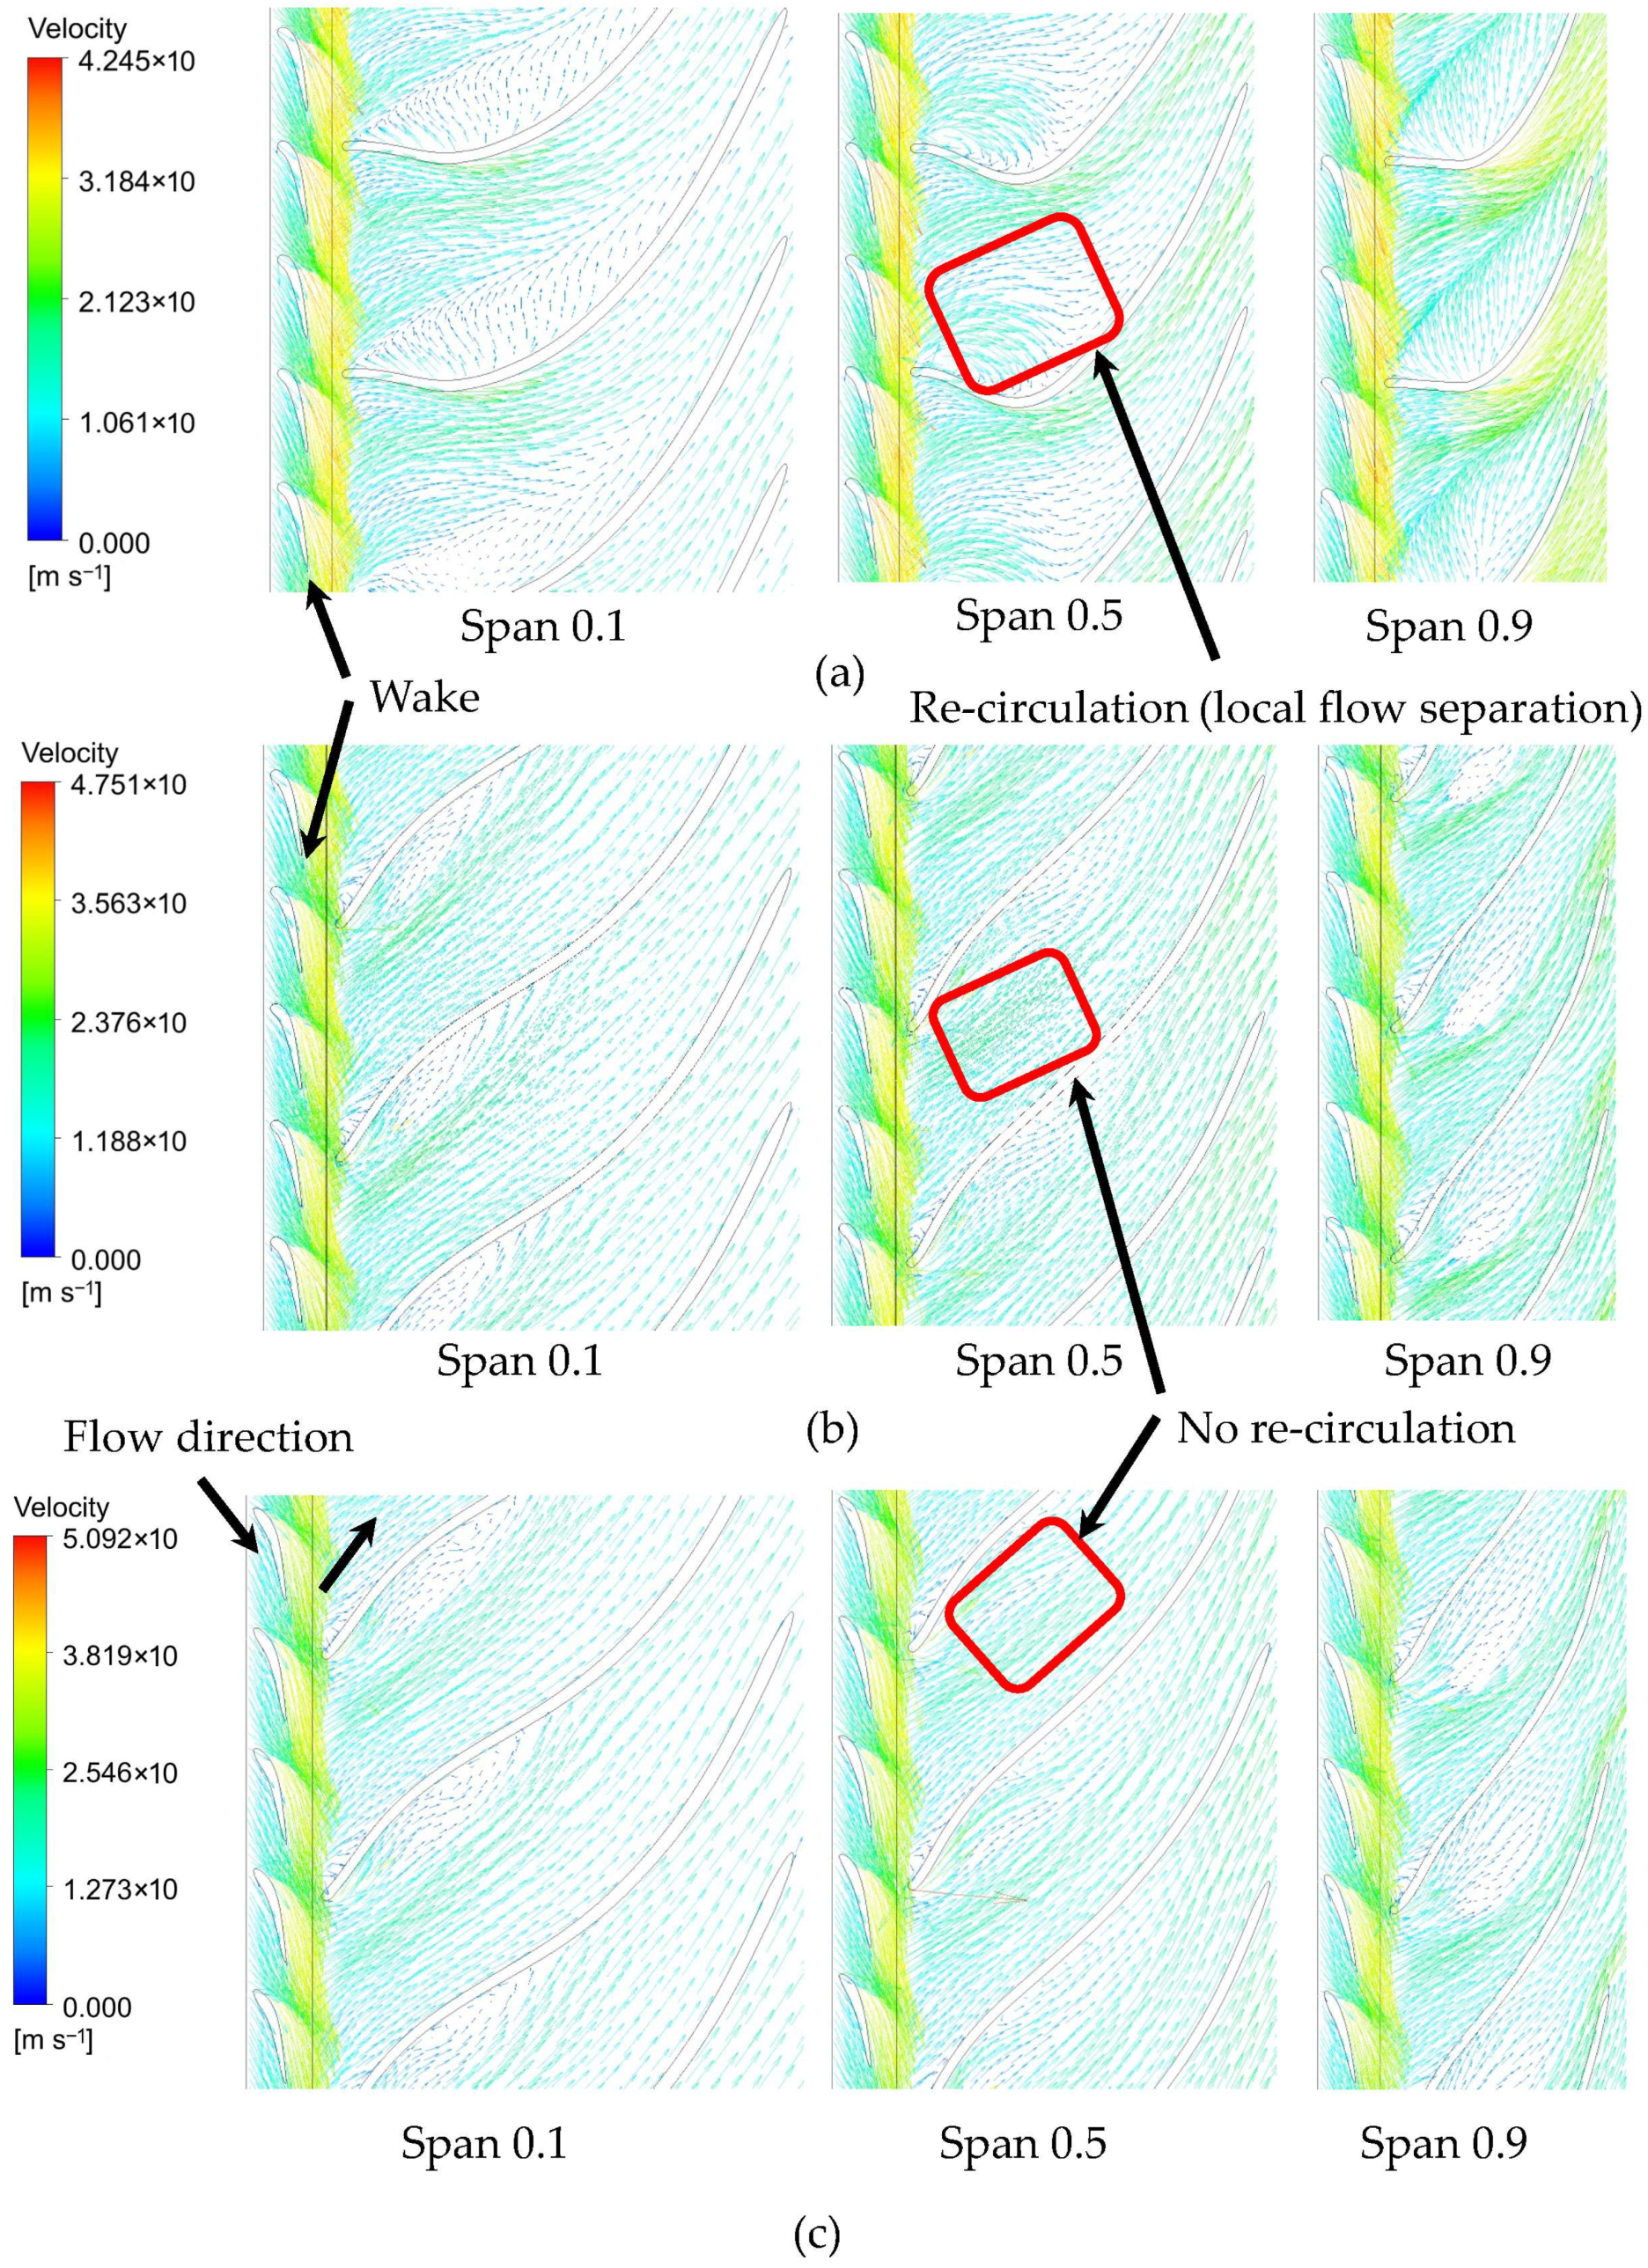
The evaluation of velocity vector plots alongside static pressure distributions was performed to critically examine the internal flow patterns and clearly visualise flow separation areas as well as misalignment regions in the turbine flow passage. Figure 14 shows the velocity vector fields at three representative blade spans (Span = 0.1, 0.5, and 0.9) for the baseline design as well as Stage1 and Stage 2 optimisation. The velocity contours in Figure 14a display both velocity magnitude and vector direction for visualising streamlines and flow attachment. It shows how the baseline design exhibits major misalignment and disordered behaviour mostly at the tip and mid-span. Flow separation occurs and the formation of strong cross-passage vortices reveals high levels of energy loss through secondary flows. The flow loses attachment to the pressure surface at Span 0.9, which results in increased profile loss and reduced efficiency. The runner optimisation at Stage 1 leads to vector alignment improvements throughout all span regions according to Figure 14b. The elimination of swirling motions becomes evident when the flow tracks the blade surfaces more uniformly. The velocity magnitude shows a steady rise from one end of the passage to the other, especially at Span 0.5, where boundary layer separation is almost eliminated.
The Stage 2-optimised configuration displays flow behaviour that is nearly optimal according to Figure 14c. The flow vectors show perfect alignment while maintaining uniform distribution without any visible separation zones or recirculation areas. The design transition demonstrates how the guide vane and runner blade operate together to control the incoming flow path while maximising axial velocity recovery. The design shows a highly efficient and hydraulically balanced design.
These improvements reflect a highly efficient and hydraulically balanced design. The guide vane optimisation clearly contributes to flow pre-conditioning, reducing turbulence and smoothing the flow field before it reaches the runner.

4.5. Discussion

4.5.1. Inverse Design Method and Baseline Design

The inverse design method (IDM) provides the foundation for this study. Starting from the targeted design point, IDM generates a baseline turbine design closely matching the existing site turbine. This ensures that initial geometries capture the primary hydraulic characteristics of the legacy turbine, providing a reliable starting point for optimisation and digital twin reconstruction. However, optimisation is necessary to achieve targeted performance, including efficiency, cavitation resistance, and flow uniformity under off-design conditions.

4.5.2. Limitations of Steady CFD

Optimisation was conducted using steady CFD simulations, which are computationally efficient and provide valuable insight into flow patterns and performance trade-offs. Nevertheless, steady CFD cannot capture transient phenomena such as load ramps, start-up/shutdown events, unsteady forces, or vortex shedding. Time-averaged turbulence models smooth out secondary flows and dynamic fluctuations, potentially underestimating cavitation risks or local instabilities. Additionally, steady simulations cannot accurately resolve dynamic forces critical for fatigue and structural integrity assessments.
Future work should explore unsteady CFD approaches (URANS or LES), rotor-stator interaction models, and transient cavitation simulations to more accurately represent operational realities. Integration with IDM–MOGA optimisation under unsteady conditions would enable robust turbine designs capable of performing efficiently across steady and transient operating scenarios.

4.5.3. Justification of MOGA Population Size and Generations

A population size of 30 individuals and 30 generations was selected for the MOGA to balance computational cost with effective design space exploration. Each candidate evaluation requires a full CFD simulation of the runner and guide vane, and increasing the population or number of generations would primarily increase computational time without significantly improving the Pareto front. The results indicated convergence toward the target performance, with Pareto-optimal solutions clustering around the desired objectives, suggesting diminishing returns for larger populations or generations.

4.5.4. Integration and Future Perspectives

By combining IDM, steady CFD, and MOGA, the framework provides an efficient pathway to optimise runner and guide vane designs for small-legacy Francis turbines. The IDM baseline ensures designs are hydraulically close to the site turbine, while MOGA refinement achieves the targeted performance. Future extensions could include adaptive or parallelised MOGA approaches integrated with unsteady CFD, improving robustness and reliability under off-design and transient operating conditions, and enabling broader application to legacy hydropower refurbishment.

5. Conclusions

This research introduced a system that fully integrates the IDM, CFD, and MOGA to optimise the hydraulic performance of legacy Francis turbines using limited original design data. The aim was to develop an accurate CFD model of Francis turbines with limited design information. The approach was to develop CFD model for Bérchules hydropower facility that represents ageing infrastructure with scarce documentation. The specific contributions of this study, beyond previous IDM–CFD–MOGA applications, are as follows:
  • The use of IDM and CFD allowed for the recreation of runner and guide vane shapes with geometric details provided, avoiding the necessity for a full plant shutdown or the process of reverse engineering entirely.
  • The method extends optimisation beyond runner-only designs by incorporating guide vane geometry into the process, a step not addressed in prior studies. This extension demonstrates that simultaneous optimisation of runner and distributor components can yield superior hydraulic performance for small-scale legacy turbines.
  • Significant enhancements in flow uniformity and pressure recovery were observed through a two-step optimisation procedure, initially focusing on the runner, followed by the integration of guide vanes into the system. This approach led to the development of an expanded Pareto front that aids in making decisions during the phases of designing hydraulic runners and distributors. The ultimate design highlighted improvements such as reduced velocity swirl patterns and better alignment of streamlines, along with flow coherence throughout the runner channel.
  • Pressure distribution maps along three sections of the blade (near the hub, midsection, and shroud) showed significant rises in the lowest pressure points (reaching around 1050 kPa). These findings help reduce the likelihood of cavitation and promote pressure changes from the trailing edge of the guide vane to the exit of the runner blade segment.
  • A sensitivity analysis was conducted on 14 design input parameters, showing that LE Loading Mid, NC Mid, and ND Mid impact performance metrics like profile loss, diffusion ratio, and throat. These factors play a role in shaping the outcome and offer valuable opportunities for further optimisation.
  • The improved setup showed enhanced water flow efficiency with attachment of the flow and decreased formation of secondary flows, along with improved distribution of blade loading around the hub and shroud area. The results clearly show the benefits of optimising both guide vanes and runner geometry for upgrading existing equipment.
The findings confirm that the suggested digitalisation strategy is not just feasible but quite impactful for renovating hydroelectric facilities successfully. By using IDM and evolutionary optimisation within a CFD setting, designers can address the intricacy of worn-down turbine systems to reach performance standards to freshly produced units.
Future studies will aim to expand the application of the established geometry in producing information in order to create a monitoring system that can effectively find faults for forming an assessment management platform for hydropower plant operations.

Author Contributions

Conceptualisation, A.M. and I.E.O.; methodology, I.E.O.; software, I.E.O.; validation, I.E.O. and A.M.; formal analysis, I.E.O.; investigation, I.E.O.; resources, A.M.; data curation, I.E.O.; writing—original draft preparation, I.E.O.; writing—review and editing, A.M.; visualisation, I.E.O.; supervision, A.M.; project administration, A.M.; funding acquisition, A.M. All authors have read and agreed to the published version of the manuscript.

Funding

This research was supported by the iAMP-Hydro project, funded by the European Commission under Horizon Europe programme Grant No. 101122167.

Data Availability Statement

The original contributions presented in the study are included in the article. Further inquiries can be directed to the corresponding author.

Conflicts of Interest

The authors declare no conflicts of interest.

Abbreviations

The following abbreviations are used in this manuscript:
CFDComputational fluid dynamics
GAGenetic algorithm
IDMInverse design method
LELeading edge
MOGAMulti-objective genetic algorithm
NCNon-continuous
NDNon-distorted
NSGA-IINon-dominated sorting genetic algorithm II
RSMResponse surface model
SBXSimulated binary crossover
SFSecondary flow
SSTShear stress transport
Dv1Volute inlet diameter, m
Dv2Volute outlet diameter, m
DrRunner reference diameter, m
DjInlet diameter, m
F1Blending or auxiliary functions in the turbulence model
GAcceleration due to gravity, m/s2
HHub diameter, mm
HHead, m
H d Head at design point, m
ηEfficiency
NRotational speed, r/min
nsSpecific speed
PhpPower Output, Kilowatts
QdDesign Flow rate, m3/h
ρDensity of the Liquid, kg/m3
TTime, s
URunner periphery velocity, ms−1
usSpecific peripheral velocity of the runner
VVelocity, m/s
ZRunner blade number
ΓSpecific weight of fluid, Nm−3
ΓAuxiliary variables in the turbulence model
δijKronecker’s delta
ΜDynamic viscosity, Pa.s
σk, σω, β*, and γTurbulence–model coefficients
ΩOmega, rads−1
µtTurbulent viscosity

References

  1. Killingtveit, Å. Hydropower. In Managing Global Warming; Elsevier: Amsterdam, The Netherlands, 2019; pp. 265–315. [Google Scholar]
  2. Gaudard, L.; Romerio, F. The Future of Hydropower in Europe: Interconnecting Climate, Markets and Policies. Environ. Sci. Policy 2014, 37, 172–181. [Google Scholar] [CrossRef]
  3. Leguizamón, S.; Avellan, F. Open-Source Implementation and Validation of a 3D Inverse Design Method for Francis Turbine Runners. Energies 2020, 13, 2020. [Google Scholar] [CrossRef]
  4. Koini, G.N.; Sarakinos, S.S.; Nikolos, I.K. A Software Tool for Parametric Design of Turbomachinery Blades. Adv. Eng. Softw. 2009, 40, 41–51. [Google Scholar] [CrossRef]
  5. Wu, J.; Shimmei, K.; Tani, K.; Niikura, K.; Sato, J. CFD-Based Design Optimization for Hydro Turbines. J. Fluids Eng. 2007, 129, 159–168. [Google Scholar] [CrossRef]
  6. Borges, J.E. A Three-Dimensional Inverse Method for Turbomachinery: Part I—Theory. J. Turbomach. 1990, 112, 346–354. [Google Scholar] [CrossRef]
  7. Zangeneh, M. A Compressible Three-dimensional Design Method for Radial and Mixed Flow Turbomachinery Blades. Int. J. Numer. Methods Fluids 1991, 13, 599–624. [Google Scholar] [CrossRef]
  8. Zangeneh, M.; Goto, A.; Takemura, T. Suppression of Secondary Flows in a Mixed-Flow Pump Impeller by Application of Three-Dimensional Inverse Design Method: Part 1—Design and Numerical Validation. J. Turbomach. 1996, 118, 536–543. [Google Scholar] [CrossRef]
  9. Zangeneh, M. Inverse Design of Centrifugal Compressor Vaned Diffusers in Inlet Shear Flows. J. Turbomach. 1996, 118, 385–393. [Google Scholar] [CrossRef]
  10. Goto, A.; Zangeneh, M. Hydrodynamic Design of Pump Diffuser Using Inverse Design Method and CFD. J. Fluids Eng. 2002, 124, 319–328. [Google Scholar] [CrossRef]
  11. Demeulenaere, A.; Van den Braembussche, R. Three-Dimensional Inverse Method for Turbomachinery Blading Design. J. Turbomach. 1998, 120, 247–255. [Google Scholar] [CrossRef]
  12. Dang, T.; Isgro, V. Euler-Based Inverse Method for Turbomachine Blades. I—Two-Dimensional Cascades. AIAA J. 1995, 33, 2309–2315. [Google Scholar] [CrossRef]
  13. Wang, Z.; Cai, R.; Chen, H.; Jia, X. A Three-Dimensional Inverse Method Using Navier—Stokes Equations for Turbomachinery Blading. Inverse Probl. Eng. 2000, 8, 529–551. [Google Scholar] [CrossRef]
  14. Daneshkhah, K.; Ghaly, W. Aerodynamic Inverse Design for Viscous Flow in Turbomachinery Blading. J. Propuls. Power 2007, 23, 814–820. [Google Scholar] [CrossRef]
  15. Ashihara, K.; Goto, A. Effects of Blade Loading on Pump Inducer Performance and Flow Fields. In Proceedings of the ASME 2002 Joint U.S.-European Fluids Engineering Division Conference, Montreal, QC, Canada, 14–18 July 2002. [Google Scholar]
  16. Ashihara, K.; Goto, A.; Kamijo, K.; Yamada, H. Improvements of Inducer Inlet Backflow Characteristics Using 3-D Inverse Design Method. In Proceedings of the 38th AIAA/ASME/SAE/ASEE Joint Propulsion Conference & Exhibit, Indianapolis, IN, USA, 7–10 July 2002. [Google Scholar]
  17. Zhao, J.; Pei, J.; Wang, W.; Gan, X. Blade Redesign Based on Inverse Design Method for Energy Performance Improvement and Hydro-Induced Vibration Suppression of a Multi-Stage Centrifugal Pump. Energy 2024, 308, 132862. [Google Scholar] [CrossRef]
  18. Vogt, D.; Roduner, C.; Zangeneh, M. Improving a Vaned Diffuser for a Given Centrifugal Impeller by 3D Inverse Design. In Proceedings of the ASME Turbo Expo 2002: Power for Land, Sea, and Air, Amsterdam, The Netherlands, 3–6 June 2002. [Google Scholar]
  19. Schleer, M.; Hong, S.S.; Zangeneh, M.; Roduner, C.; Ribi, B.; Pløger, F.; Abhari, R.S. Investigation of an Inversely Designed Centrifugal Compressor Stage—Part II: Experimental Investigations. J. Turbomach. 2004, 126, 82–90. [Google Scholar] [CrossRef]
  20. Zangeneh, M.; Schleer, M.; Pløger, F.; Hong, S.S.; Roduner, C.; Ribi, B.; Abhari, R.S. Investigation of an Inversely Designed Centrifugal Compressor Stage—Part I: Design and Numerical Verification. J. Turbomach. 2004, 126, 73–81. [Google Scholar] [CrossRef]
  21. Zangeneh, M. Inviscid-Viscous Interaction Method for Three-Dimensional Inverse Design of Centrifugal Impellers. J. Turbomach. 1994, 116, 280–290. [Google Scholar] [CrossRef]
  22. Ohiemi, I.E.; McNabola, A. Supporting the Digitalisation of Existing Hydropower Plants Using Computational Fluid Dynamics Modelling. Renew. Energy 2025, 256, 124174. [Google Scholar] [CrossRef]
  23. Kerschberger, P.; Gehrer, A. Hydraulic Development of High Specific-Speed Pump-Turbines by Means of an Inverse Design Method, Numerical Flow-Simulation (CFD) and Model Testing. IOP Conf. Ser. Earth Environ. Sci. 2010, 12, 012039. [Google Scholar] [CrossRef]
  24. Yang, W.; Xiao, R. Multiobjective Optimization Design of a Pump–Turbine Impeller Based on an Inverse Design Using a Combination Optimization Strategy. J. Fluids Eng. 2014, 136, 014501. [Google Scholar] [CrossRef]
  25. Yin, J.; Wang, D.; Wei, X.; Wang, L. Hydraulic Improvement to Eliminate S-Shaped Curve in Pump Turbine. J. Fluids Eng. 2013, 135, 071105. [Google Scholar] [CrossRef]
  26. Wang, X.H.; Zhu, B.S.; Cao, S.L.; Tan, L. Full 3-D Viscous Optimization Design of a Reversible Pump Turbine Runner. IOP Conf. Ser. Mater. Sci. Eng. 2013, 52, 022014. [Google Scholar] [CrossRef]
  27. Xuhe, W.; Baoshan, Z.; Lei, T.; Jie, Z.; Shuliang, C. Development of a Pump-Turbine Runner Based on Multiobjective Optimization. IOP Conf. Ser. Earth Environ. Sci. 2014, 22, 012028. [Google Scholar] [CrossRef]
  28. Zhu, B.; Tan, L.; Wang, X.; Ma, Z. Investigation on Flow Characteristics of Pump-Turbine Runners with Large Blade Lean. J. Fluids Eng. 2018, 140, 031101. [Google Scholar] [CrossRef]
  29. Zhu, B.; Wang, X.; Tan, L.; Zhou, D.; Zhao, Y.; Cao, S. Optimization Design of a Reversible Pump–Turbine Runner with High Efficiency and Stability. Renew. Energy 2015, 81, 366–376. [Google Scholar] [CrossRef]
  30. Liu, L.; Zhu, B.; Bai, L.; Liu, X.; Zhao, Y. Parametric Design of an Ultrahigh-Head Pump-Turbine Runner Based on Multiobjective Optimization. Energies 2017, 10, 1169. [Google Scholar] [CrossRef]
  31. Wang, P.; Vera-Morales, M.; Vollmer, M.; Zangeneh, M.; Zhu, B.S.; Ma, Z. Optimisation of a Pump-as-Turbine Runner Using a 3D Inverse Design Methodology. In Proceedings of the 29th IAHR Symposium on Hydraulic Machinery and Systems, Kyoto, Japan, 17–21 September 2018; Volume 240. [Google Scholar]
  32. Hu, Z.; Zhu, B.; Liu, X.; Ma, Z.; Xue, C. Multiobjective Optimization Design of Ultrahigh-Head Pump Turbine Runners with Splitter Blades. In Proceedings of the 29th IAHR Symposium on Hydraulic Machinery and Systems, Kyoto, Japan, 17–21 September 2018; Volume 240. [Google Scholar]
  33. Hu, Z.; Cheng, Y.; Liu, D.; Chen, H.; Ji, B.; Ding, J. Broadening the Operating Range of Pump-Turbine to Deep-Part Load by Runner Optimization. Renew. Energy 2023, 207, 73–88. [Google Scholar] [CrossRef]
  34. Ohiemi, I.E.; Sunsheng, Y.; Singh, P.; Li, Y.; Osman, F. Evaluation of Energy Loss in a Low-Head Axial Flow Turbine under Different Blade Numbers Using Entropy Production Method. Energy 2023, 274, 127262. [Google Scholar] [CrossRef]
  35. Sunsheng, Y.; Ohiemi, I.E.; Singh, P.; Li, Y.; Ali, A.; Osman, F. Numerical and Experimental Investigation on Unsteady Flow and Hydraulic Radial Force of Low-Head Axial Flow Turbine. J. Appl. Fluid Mech. 2023, 16, 830–849. [Google Scholar] [CrossRef]
  36. Li, Y.; Ohiemi, I.E.; Singh, P.; Sunsheng, Y. Numerical and Experimental Analysis of Pressure Fluctuation in Axial Flow Turbine. AIP Adv. 2022, 12, 025122. [Google Scholar] [CrossRef]
  37. Yang, S.; Ohiemi, I.E.; Singh, P. Numerical and Experimental Investigation of 3D Unsteady Flow Fields of a Low Head Axial Flow Turbine under Different Blade Number. Proc. Inst. Mech. Eng. Part A J. Power Energy 2022, 237, 687–717. [Google Scholar] [CrossRef]
  38. Menter, F. Zonal Two Equation K-w Turbulence Models For Aerodynamic Flows. In Proceedings of the 23rd Fluid Dynamics, Plasmadynamics, and Lasers Conference, Orlando, FL, USA, 6–9 July 1993; American Institute of Aeronautics and Astronautics: Reston, VA, USA, 1993. [Google Scholar]
  39. Pei, J.; Zhang, F.; Appiah, D.; Hu, B.; Yuan, S.; Chen, K.; Asomani, S.N. Performance Prediction Based on Effects of wrapping Angle of a Side Channel Pump. Energies 2019, 12, 139. [Google Scholar] [CrossRef]
  40. Zhang, F.; Appiah, D.; Hong, F.; Zhang, J.; Yuan, S.; Adu-Poku, K.A.; Wei, X. Energy Loss Evaluation in a Side Channel Pump under Different Wrapping Angles Using Entropy Production Method. Int. Commun. Heat Mass Transf. 2020, 113, 104526. [Google Scholar] [CrossRef]
  41. Gileva, L.V.; Aksenov, A.A.; Kozhukhov, Y.V.; Petrov, A.Y. The Study of Y+ Influence on the Results of ANSYS CFX Flow Simulation in the Centrifugal Compressor Radial Inlet; AIP Publishing LLC: Melville, NY, USA, 2020; p. 030038. [Google Scholar]
  42. Li, Z.; Zheng, X. Review of Design Optimization Methods for Turbomachinery Aerodynamics. Prog. Aerosp. Sci. 2017, 93, 1–23. [Google Scholar] [CrossRef]
  43. Deb, K.; Pratap, A.; Agarwal, S.; Meyarivan, T. A Fast and Elitist Multiobjective Genetic Algorithm: NSGA-II. IEEE Trans. Evol. Comput. 2002, 6, 182–197. [Google Scholar] [CrossRef]
  44. Mehrdad, Z. What Is Blade Loading and How Is It Specified? Available online: https://blog.adtechnology.com/what-is-blade-loading (accessed on 1 September 2025).
Figure 2. Mesh overview: (a) flow domains; (b) dimensionless y + .
Energies 18 05602 g002
Figure 3. Performance comparison for 5 independent grids (chosen mesh highlighted in red box).
Energies 18 05602 g003
Figure 4. Streamwise blade loading parameterisation in TURBOdesign1 [44].
Energies 18 05602 g004
Figure 5. Optimisation framework.
Energies 18 05602 g005
Figure 6. Sensitivity analysis.
Energies 18 05602 g006
Figure 7. Three-dimensional Pareto front for Stage 1 Runner Designs.
Energies 18 05602 g007
Figure 8. Three-dimensional Pareto front for Stage 2 guide vane designs.
Energies 18 05602 g008
Figure 9. Comparative illustration of baseline and optimised geometries for both guide vanes and runner blades.
Energies 18 05602 g009
Figure 10. Validation of CFD predictions for the optimised Stage II Optimisation using site operating data.
Energies 18 05602 g010
Figure 11. Velocity contour compared: (a) baseline; (b) Stage 1 optimisation; (c) Stage 2 optimisation.
Energies 18 05602 g011
Figure 12. Velocity streamline compared: (a) baseline; (b) Stage 1 optimisation; (c) Stage 2 optimisation.
Energies 18 05602 g012
Figure 13. Comparative blade-to-blade pressure across spans 0.1, 0.5 and 0.9: (a) baseline; (b) Stage 1 optimisation; and (c) Stage 2 optimisation.
Energies 18 05602 g013
Figure 14. Comparative blade-to-blade velocity vector across spans 0.1, 0.5, and 0.9: (a) Baseline; (b) Stage 1 optimisation; and (c) Stage 2 optimisation.
Energies 18 05602 g014
Table 2. Mesh elements for calculated grids (chosen mesh highlighted in red).
Test CaseElementsHead (m)Efficiency (%)Power (W)
Mesh I4,366,690105.7671.89832,437
Mesh II5,538,624122.4084.31887,556
Mesh III6,466,284129.0593.70945,785
Mesh IV7,510,563129.0093.72947,272
Mesh V8,863,976129.1093.70949,853
Table 3. Grid cells of the selected mesh.
DomainVoluteStay VanesGuide VanesRunnerDraft TubeAll Domains
No. of Elements220,9922,843,2001,268,2001,864,000269,8926,466,284
No. of Nodes233,8593,083,4601,386,7201,986,400282,1046,972,543
Table 4. Boundary condition.
BoundaryTypes
InletInlet Pressure
WallNo slip wall
OutletFlow rate
Table 5. Design input parameters.
First Optimisation Second Optimisation
ParameterVariableValueParameterVariableValue
Design ParameterBlade loadingNC Shroud0.72 ~ 0.88Blade loadingNC Shroud0.27 ~ 0.33
NC Hub0.135 ~ 0.165NC Hub0.27 ~ 0.33
ND Hub0.765 ~ 0.935 ND Hub0.63 ~ 0.77
ND Shroud0.765 ~ 0.935 ND Shroud0.63 ~ 0.77
LE Loading Hub−825 ~ −0.675 LE Loading Hub−0.1 ~ 0.1
LE Loading Shroud−825 ~ −0.675 LE Loading Shroud−0.1 ~ 0.1
Slope Hub0.9 ~ 1.1 Slope Hub−0.1 ~ 0.1
Slope Shroud0.9 ~ 1.1 Slope Shroud−0.1 ~ 0.1
NC Mid0.4275 ~ 0.5225 NC Mid0.27 ~ 0.33
ND Mid0.765 ~ 0.935 ND Mid0.63 ~ 0.77
Slope Mid0.9 ~ 1.1 Slope Mid−0.1 ~ 0.1
LE Loading Mid−0.825 ~ 0.675 LE Loading Mid−0.1 ~ 0.1
Wrap angle [Hub]−0.1 ~ 0.1
Wrap angle [Shroud]−0.1 ~ 0.1
Objective FunctionMinimise profile loss Minimise profile loss
Minimise secondary flow factor Minimise secondary flow factor
Maximise minimum pressure Maximise minimum pressure
ConstraintsThroat area ( m 2 ) 0.03445 ~ 0.04211 Throat area 0.02489 ~ 0.03042
Euler head (m) 122.85 ~ 150.15 Diffusion ratio 1.3660 ~ 1.6695
Diffusion ratio 2.061 ~ 2.519
Table 6. Runner blades performance: Baseline vs. optimised (Stage 1).
Optimisation ObjectivesRunner Blade Baseline Optimised (Stage 1)
Profile Loss1.2542890.969177
SF factor0.0482830.0401519
Pmin−877,325.5−132,703.4
Table 7. Guide vane performance: Baseline vs. optimised (Stage 2).
Optimisation ObjectivesGuide Vane Baseline Optimised (Stage 2)
Profile Loss1.279071.160236
SF factor0.023450.0187282
Pmin87,559.22247,452.1
Table 8. Performance characteristics of the site operation and CFD results for baseline and optimised configurations compared.
Global ParametersSite RatingCFD Results of Baseline and Optimised Design
BaselineStage 1Stage 2
Head H (m)136.5106123129
Power P (kW)942740898945
Efficiency η (%)N/A89.193.493.7
Shaft Speed N (rpm)1500
Design Flow Rate Qd (m3/s)0.8
Table 9. CFD vs. site operating data compared.
Global ParametersNormalised Flow (Q/Qd)Error Metrics
0.80.850.90.951RMSEMAEMPE (%)
Head
H (m)
CFD92.81011101201295.535.065.00
Site89.599104115120
Powe
P (MW)
CFD0.540.6810.7310.8910.9450.0220.0152.48
Site0.5290.6670.7250.8510.942
Efficiency η (%)CFD93949596942.972.803.05
Site8990939492
Disclaimer/Publisher’s Note: The statements, opinions and data contained in all publications are solely those of the individual author(s) and contributor(s) and not of MDPI and/or the editor(s). MDPI and/or the editor(s) disclaim responsibility for any injury to people or property resulting from any ideas, methods, instructions or products referred to in the content.