Abstract
Switzerland’s energy transition toward net-zero greenhouse gas emissions by 2050 presents a critical challenge in managing winter electricity demand, particularly due to the widespread electrification of space heating and domestic hot water. In this study, we assess how targeted measures in the building sector can influence heat demand and thereby also the winter electricity gap. To this end, we extended the existing PowerCheck simulation tool by incorporating a detailed bottom-up representation of the Swiss building stock. We model hourly heat and electricity demand across 60 building categories, defined by climate zone, usage type, and insulation standard. Twelve future scenarios are developed based on variations in four key parameters: building renovation rate, hot water heat recovery, heat sources used by heat pumps, and ambient temperature trends. Our results indicate that renovation of old buildings to current insulation standards has by far the greatest effect out of the studied parameters. Increasing the annual thermal renovation rate of building shells from the currently planned 1.1% to 2% can reduce the winter electricity gap from 10.7 TWh to 6.0 TWh, a 44% reduction. Conversely, achieving only a low renovation rate of 0.5% could increase the gap to 13.9 TWh. Additional measures, such as greater use of ground-source instead of air-source heat pumps and implementation of hot water recovery, offer further potential for reduction. These findings underscore the importance of early and sustained investment in thermal renovation of building shells for achieving Switzerland’s 2050 net-zero climate targets.
1. Introduction
In the context of Switzerland’s energy transition, the reliable supply of electricity during the winter months is becoming a key challenge. While the long-term goal is to achieve a net-zero energy system based largely on renewable sources, seasonality in both energy demand and domestic production leads to an imbalance—commonly referred to as the winter energy gap—which is projected to grow strongly in the future. According to the Swiss Federal Office of Energy (SFOE), after fully phasing out fossil fuel imports, massively electrifying the mobility and heat sector, and expanding domestic renewable generation, Switzerland may face a winter electricity shortfall of around 10 TWh per year by 2050 [1]. This seasonal gap is particularly relevant, considering the high share of heating demand in winter energy consumption, most of which is currently covered by fossil fuels and will need to be electrified largely by heat pumps in a net-zero scenario [2,3].
This paper investigates the extent to which the heating demand of the Swiss building stock can be reduced through targeted measures, and how these changes affect future winter electricity consumption. Our approach is based on detailed energy system simulations using the PowerCheck tool [4], with a particular focus on space heating and domestic hot water demand. By modifying key parameters, such as the building renovation rate, hot water heat recovery, deployment of heat pumps, and expected climate warming, we assess how various combinations of measures and climate change could contribute to reducing the winter gap by 2050.
Recent studies have examined the role of the building sector in energy system decarbonization and its implications for electricity demand. Internationally, the electrification of heat using heat pumps is widely recognized as a key strategy to reduce emissions, though it may increase winter electricity demand [2,5]. At the European level, Economidou et al. [6] provide a comparative overview of building energy performance and renovation strategies, while recent modeling approaches assess retrofit impacts at the building-stock scale [7,8]. For Switzerland, Schneider et al. [9] present a detailed bottom-up spatial model of building heat and electricity demand, revealing that net retrofit savings may be only half of gross potential due to performance gaps. In parallel Nägeli et al. [10] use agent-based stock models to simulate renovation pathways under different policy scenarios, highlighting the inertia of the building stock and the difficulty of reaching ambitious targets without strong regulatory or financial incentives. Complementary to these approaches, Schneeberger et al. [11] propose a scalable method to estimate residential heating demand across Switzerland using only publicly available data—offering a transparent alternative where detailed building-level measurements are lacking. In addition, Vulić et al. [8] developed a national-scale building-stock model that incorporates renovation measures and evaluates their effect on long-term heat-demand trends—offering a complementary approach to our own categorization strategy.
While the PowerCheck framework has previously been used as a system-level energy balance model for Switzerland, the detailed building heat-demand representation presented here is newly developed as part of this study. This work, therefore, constitutes the first application of PowerCheck that explicitly integrates bottom-up building modeling into the national energy system context.
A growing body of research emphasizes that while demand-side measures, such as renovations and heat recovery, are necessary, they alone are unlikely to close the projected winter electricity gap on their own. Broader techno-economic analyses, such as those using the Swiss TIMES model [12] and the SES-ETH scenario framework [13], highlight the scale of investments and flexibility requirements for net-zero pathways, and point to the continued relevance of winter imports and backup generation. Updated scenario studies, such as those by Mellot et al. [14], go further by quantifying the risk of supply deficits even under optimistic assumptions, particularly during the winter season. These studies converge on the conclusion that a balanced strategy is needed—combining deep renovations, increased electrification, supply diversification (e.g., alpine photovoltaics), and storage solutions.
Multiple studies underscore the specific challenges of implementing such measures in the Swiss building sector. For example, Berger and Worlitschek [3], Frank [15] confirm the strong seasonal dependence of heat demand on ambient temperature, reinforcing the urgency of winter-focused mitigation. Christenson et al. [16], Mutschler et al. [17] both confirm that climate warming is expected to reduce heating demand in Switzerland; however, Mutschler et al. [17] further show that this reduction is insufficient to offset the anticipated increase in electricity demand from widespread electrification. Rüdisüli et al. [18], Roca-Puigros et al. [19] highlight the implications of heat electrification for the power grid and question whether current policy instruments are sufficient to drive the required transformation.
While some of the above modeling efforts focus on high-level energy balances or national-scale metrics, others have explored spatial granularity and technical system interactions. For instance, Schnidrig et al. [20] examine the effect of regional modeling choices on system design under high shares of renewables, while Li et al. [21] simulate multi-sector decarbonization pathways for Switzerland, including buildings. Thrampoulidis et al. [7] explore the trade-offs between retrofit depth and cost-effectiveness, a topic directly relevant for the interpretation of our renovation scenarios.
Moreover, several recent studies highlight that the operational performance of low-carbon heating systems is often overestimated in models. Field data from Swiss residential buildings show that air-source heat pumps, in particular, perform below theoretical COPs in winter due to defrost cycles, poor sizing, and installation errors [22]. Such findings emphasize the need for realistic assumptions in system simulations. Similarly, the widespread assumption of fixed seasonal COP values in high-level energy models may underestimate the benefits of ground-source systems, which have higher and more stable COPs under winter conditions [14,18].
Projections of seasonal storage requirements further illustrate the urgency of combining demand-side efficiency with flexible infrastructure and balancing solutions [23]. Yet few models explicitly represent bottom-up building-level dynamics with hourly resolution. Our study addresses this gap by integrating high-resolution thermal demand simulations into a national energy system context, allowing us to quantify the contribution of specific building-sector measures to reducing Switzerland’s winter electricity gap. In particular, we explicitly link building renovation dynamics, domestic hot water recovery, heat pump deployment, and climate warming to national winter electricity needs, and assess the extent to which these factors can mitigate the projected winter gap by 2050. In doing so, the paper contributes new evidence on the potential of demand-side measures to reduce Switzerland’s winter electricity shortfall and clarifies the extent to which complementary supply-side measures will be needed, depending on the developments on the demand side.
Simulation of the Energy System in Switzerland
Switzerland’s energy transition is described by the scenarios outlined in the Energy Perspectives 2050+ (EP2050+), which describe possible pathways towards a climate-neutral energy system by mid-century [1]. These scenarios include assumptions about energy demand, technological development, decarbonization measures, and system-wide transformations. Simulation tools play a central role in evaluating such scenarios, helping to quantify the impact of policy choices and sectoral developments on energy balances, infrastructure needs, and sustainability targets [24,25].
Among the sectors covered in EP2050+, the building sector is of particular importance due to its large share of final energy consumption, especially in the form of heating. Over the whole year, buildings currently use 50% of the final energy needed in Switzerland [26], which, due to its seasonal nature, can be up to 66% in a cold month, such as January (source: own simulations). Electrification of heat supply with heat pumps—combined with efficiency gains—is considered one of the primary strategies for decarbonizing this sector [2,6]. However, the shift from fossil fuels to electricity-driven heat pumps also contributes to increasing winter power demand, potentially exacerbating the winter electricity gap. Accurately modeling the evolution of heat demand and its interaction with the broader energy system is thus crucial for designing effective mitigation strategies.
2. Methodology: Modeling the Heat Demand of the Swiss Building Stock
2.1. Short Description of PowerCheck Code
For the energy system analysis in this paper, we use PowerCheck, a Python 3.10-based simulation and optimization tool for the Swiss energy system. A basic version of PowerCheck can be used online [4]. The key idea of PowerCheck is the preservation of the energy balance at all times, with a resolution of up to a quarter hour. Several years of historical time series allow for detailed dynamic analysis that includes real weather influences and fluctuations instead of a representative average year. PowerCheck uses no geographical resolution, the energy system is treated as a “One-Node-Model” with losses. Using historical and projected data for production and demand, the energy balance is calculated and compensated by using storage and cross-border trading. All relevant production technologies like hydropower, photovoltaics, wind power, and nuclear power are represented. The corresponding time series can be adjusted to represent future scenarios. The same holds for the consumption side, which is subdivided into domestic and industrial consumption, electric mobility, comfort, and process heat. Moreover, existing and future energy storage technologies are included in the simulation, for example, batteries, pumped hydro, and Power-to-X (-to-Power). Including the calculation of the energy system costs and the possibility of sensitivity analysis and mathematical optimization, PowerCheck offers an extensive tool set to quickly analyze the impact of a multitude of parameters on the Swiss energy system.
For this work, we extended PowerCheck with a detailed representation of the Swiss building stock’s space heating and domestic hot water demand. Each building in the national inventory is categorized according to climate zone, usage type, and insulation level, allowing for a bottom-up modeling approach. The updated model captures the effects of various renovation rates, the introduction of heat recovery systems, shifts towards heat pump technology, and the influence of future climatic temperature trends. These enhancements make PowerCheck a suitable tool for analyzing how targeted building sector measures can alleviate the winter energy—and consequently electricity—deficit in Switzerland by 2050.
In order to better estimate the heat and energy demand of the Swiss building stock, we have expanded the modeling in the PowerCheck code and included detailed simulations of space heat and domestic hot water demands. In the following sections, we describe the data collection and the processes that we model in the code.
2.2. Input Data
2.2.1. Space Heating
We collected basic building information from the Swiss Federal Register of Buildings and Dwellings (GWR) database for all buildings in Switzerland [27]. We classified Swiss buildings according to their location, usage, and insulation standard. For each building, we calculated the energy reference area as a function of its usage category, gross surface, number of floors, and dwelling surface (using Equation (1) of Ref. [28]).
where is the modeled energy reference area of the building, based on its corresponding living area (), footprint area (), and number of floors (). All variables are -transformed, except for the number of floors, for which the square root is used. The building use is encoded by “BLT,” and the parameters , , and depend on the respective building type. ε denotes the error term. The parameters to are listed in Ref. [28].
In order to reduce the number of building categories, we have made the following groupings:
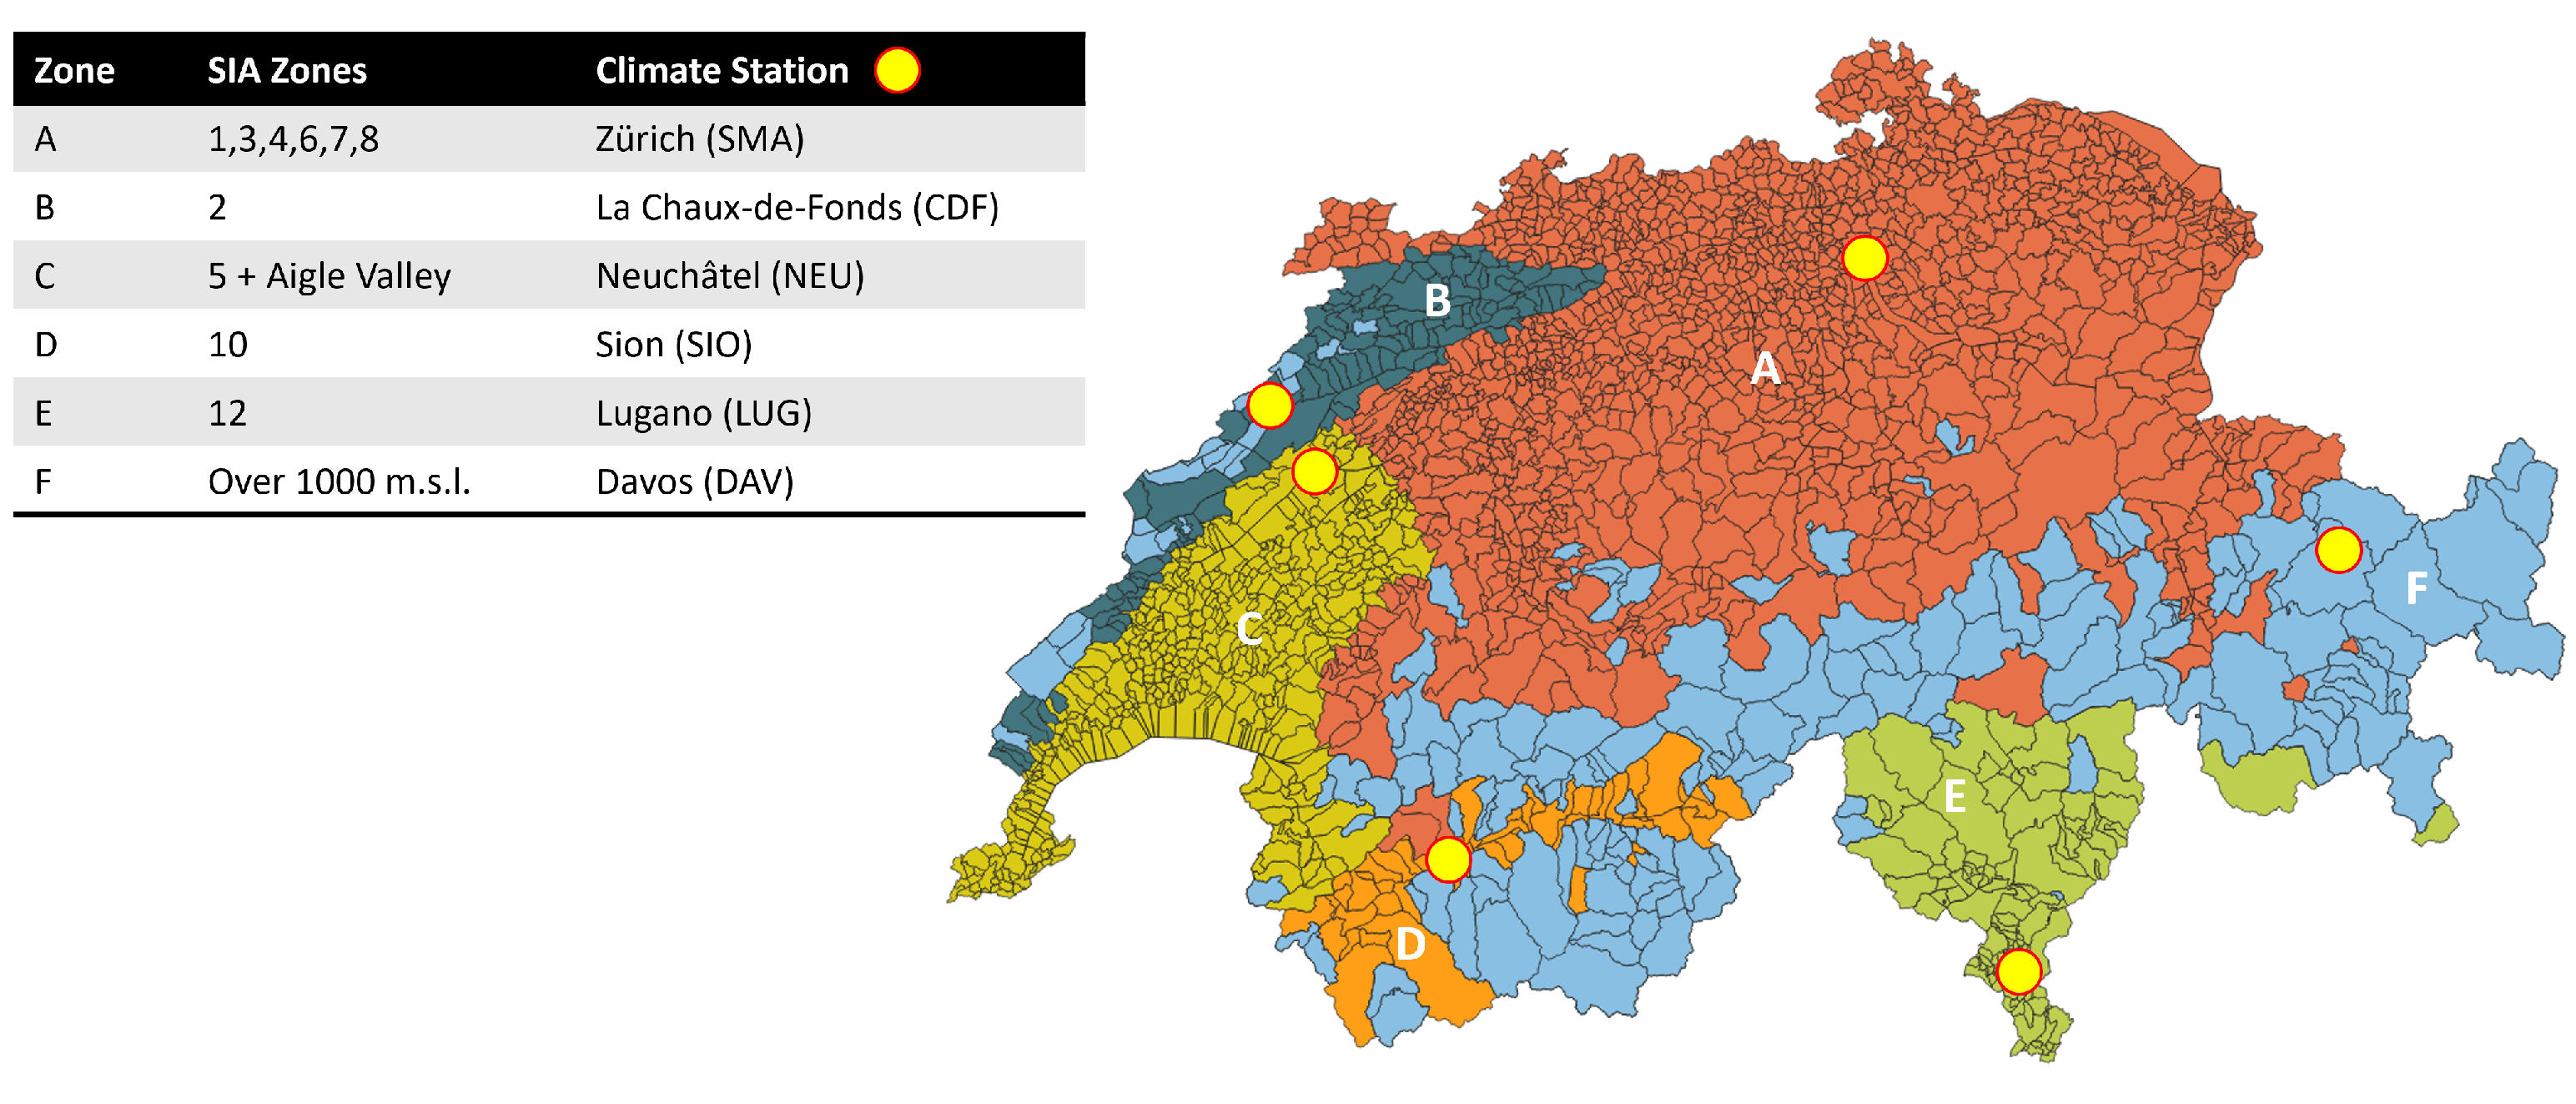
- Climate Zones: We merged the 12 climate zones published by the Swiss Society of Engineers and Architects (SIA) into six zones by aggregating neighboring zones with similar temperature and solar irradiance over the year into a single zone, and we introduced a new “mountain” climate zone, which includes all municipalities over 1000 m above sea level. Figure 1 shows the six zones and their equivalent SIA zones.
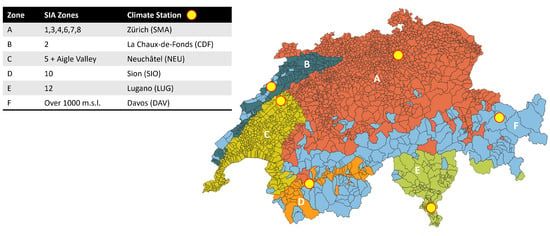 Figure 1. (Left) The original SIA zone numbers on which the climate zones used in this study are based, with the exception of “Zone F”, which includes all municipalities over 1000 m above sea level. (Right) The location of the six zones and the climate station from which the climate data is collected.
 - Building Usage: We differentiate between single- and multi-family houses for the purposes of the heat-demand modeling. Single-family houses include the “single” and “double” family house categories from the GWR database, while the multi-family house category includes all larger multi-family houses and non-residential buildings, such as hospitals, schools, commercial buildings, etc. The energy reference area of each building is first calculated according to its usage, and then, for further modeling purposes, the buildings are merged into these 2 single- and multi-family house categories.
- Insulation Standard: We separate four different insulation standards up to the present time to group the buildings in each climate zone and usage category according to data from the GWR: built before 1960, built between 1961 and 1980, built between 1981 and 2000, and built since 2001. In the PowerCheck simulations referring to the future, it is possible to add a fifth insulation standard category, “passive house”.
With the six climate zones, two usage types, and four insulation standard categories, we obtained a total of forty-eight (6 × 2 × 4) categories for the Swiss building stock. This number increases to 60 categories in simulations regarding the future, where passive houses are introduced as well. The initial 48 categories and the corresponding energy reference area are shown in Table 1.

Table 1.
Swiss building stock classified by climate zone, usage type, and insulation standard. All values in million m2 energy reference area.
2.2.2. Domestic Hot Water and Process Heat
For domestic hot water and process heat, we take 2019 as the reference year with a yearly total usage of 11.94 TWh and 25.6 TWh, respectively [29]. Process heat refers to thermal energy used for industrial and commercial production processes, such as drying, melting, sterilization, chemical reactions, or other manufacturing operations that require elevated temperatures. It does not include space heating for industrial buildings or offices, which are accounted for separately under “space heating” in Section 2.2.1.
2.3. Modeled Processes
In the following sections, we detail the various input parameters that the user can influence in PowerCheck, as well as the modeling process behind the estimation of future space heating and domestic hot water demand and final energy demand calculation. The values that we use in the simulations presented in this paper are described later in Section 2.4.
2.3.1. Space Heating
The present (2023) building stock of Switzerland is grouped into categories, described in detail in Section 2.2.1. We assumed that the year of construction of each building from the GWR database reflects the insulation standard at the time of construction. Since the information on renovations seems to be incomplete in the GWR database, we assumed an energetic renovation rate of 0.5% from 2000 onward until 2019, which is our reference year and starting point for simulations of future scenarios. Thus, in the years between 2000 and 2019, each year 0.5% of the total building stock is re-assigned within each climate zone from older building types to the newest presently available building type (built since 2001). The simulation into the future starts in 2019, and each year the following changes are made in the building stock according to the user input:
- New buildings are added, these are expressed as a % of the total building stock, and they are distributed into the various climate zones and building usage types, proportionate to their current distribution (i.e., most of the houses will be multi-family houses in climate zone A).
- Passive houses are added if the user chooses a certain % of the newly built houses to fall in this category.
- Each year, a certain percentage of the building stock is renovated. This percentage is based on the total energy reference area, including newly built houses that year. Renovations are contained within climate zones and building usage types. Houses are not re-renovated. For example, a house that was renovated in 2005 might be due for re-renovation in 2045, but in PowerCheck, this would mean it just stays in the newest insulation standard category. Since renovation cost is not included in the simulation, this would not change the results; therefore, it is not considered. The user is warned if the chosen parameters result in the renovation of all houses built before 2000, and no further renovations are performed in the simulation. Newly built houses are still added each year in this case.
Following the re-distribution of energy reference area into the correct insulation standard category, another important aspect is to determine a new distribution of the heating systems for each insulation standard. The user can give the input in % separately for the single-family and multi-family houses to determine the share of (i) heat pumps, (ii) district heating, (iii) gas, (iv) oil, (v) wood, (vi) electricity, or (vii) other heating systems. The simulation then redistributes the energy reference area in each category so that the manual settings for both the renovation and the heating system are respected. It is assumed that each climate zone has the same proportions of heating systems, which is a simplification. For passive houses, heat pumps are always assigned as heating systems, and the user can decide if newly built and renovated houses are automatically assigned to heat pumps or follow the average distribution of heating systems.
In the case of heat pumps, the user can decide the share of air-source and ground-source heat pumps separately for the single-family and multi-family groups. Across climate zones and insulation standard groups, the share is the same. Although this simplification leads to a significant share of air source heat pumps also for the higher altitude zone F, which is likely overestimating the share in this zone, the bias this introduces was considered to be negligible since only ∼5% of heated building floor areas are located in this zone.
We created hourly heat demand profiles for each of the 60 established building categories. We use hourly weather information from the six selected climate stations to represent the conditions of the specific climate zones, including the ambient temperature and the irradiation. Each insulation standard and usage type combination is characterized individually according to the relevant parameters. These parameters, including internal gains, solar gains, heat transfer coefficients k × A of the different building shell components (window, walls, roof), ventilation rates, and their specific values, are shown in Table A1 of the Appendix A. With the combination of these parameters and the weather profiles, we generate the hourly demand profile for each category, describing the demand necessary to heat 1 m2 of floor area. As a result, the user can choose between six sets of pre-generated total head demand profiles of the building stock, each of them corresponding to a yearly weather profile between 2014 and 2019. It is possible to alter the yearly temperature profile, if the user wishes to assume a warmer climate in the modeled future year. In this case, the pre-generated heat demand profiles are not used, but new ones are generated during the simulation with the assumed warmer (or colder) climate, by using a temperature profile where the requested degree was added to (or subtracted from) each value of the hourly reference temperature profile.
The total heat demand is then calculated for each of the 48 or 60 categories, based on the heat demand profiles described above and the m2 energy reference area within each category after the renovation calculations and the addition of newly built buildings. The results of different climate zones and insulation standards are merged at this stage into an hourly dataset for heating power and electric energy for heat pump heating per m2 of heated area. The final energy is calculated based on the usage type (single- or multi-family house) and the requested distribution of heating systems, as well as the efficiency of each of these. Both the hourly heat demand and the hourly final energy for each energy carrier are included in the output of the simulation, grouped by building usage. Results from air-source and ground-source heat pumps are thereby kept separate.
2.3.2. Domestic Hot Water and Process Heat
The domestic hot water simulation starts from the yearly total reference value of 11.94 TWh final energy demand [29]. We assume a sinusoidal variation over the year, with a peak in February that is 15% higher than the mean value. The user can vary the annual total based on assumptions of more or less domestic hot water usage in the modeled future year. We introduced hot water recovery in the simulation. It is thus possible to define a percentage of the heat demand for water heating that will be provided by heat recovery and thus does not have to be provided by final energy carriers. The user can—similarly to the space heating inputs—set the desired final energy carrier share in the modeled year. Based on these inputs and the efficiency of each energy carrier, the final energy for domestic hot water is calculated on an hourly basis, and the output is grouped by the different types of energy carriers. The results from air-source and ground-source heat pumps are kept separate in this case as well. No additional storage or circulation losses are modeled since these are considered to be already included by the value reported by Swiss Federal Office of Energy [29].
Process heat usage is taken into account in lesser detail. A reference value of 25.6 TWh is used for 2019 [29]. This is distributed equally over the year, and the user has the possibility to increase or decrease the total, as well as to change the distribution and shares of the final energy carriers and systems used for heating. Future studies will look in greater detail into the individual major industries and their energy demand patterns in Switzerland.
2.3.3. Heat Pump COP
For both space heating and domestic hot water, the Coefficient of Performance (COP) of the air-source and ground-source heat pumps is calculated based on the source and sink temperatures, as well as temperature differences across the evaporator and condenser heat exchangers. These are used to calculate the Carnot efficiency, which represents the theoretical maximum. This Carnot efficiency is then multiplied by a factor describing how close the actual heat pump process is to this efficiency. For this purpose, the hourly ambient temperature profile and a ground temperature profile (shown in Figure A1) are used as source temperatures for the air-source and ground-source cases, respectively.
The main assumptions and modeling choices are as follows:
- Temperature differences across heat exchangers: K, K;
- Minimum refrigerant temperature lift: K;
- Heat pump efficiency factors: , ;
- Supply temperatures for space heating in MFH increased by +5 °C to reflect operational practice;
- COP reduction by 0.5 for ASHP when (defrost correction).
With these measures, we aim to model a realistic usage pattern for both air-source and ground-source heat pumps. Detailed description, specific parameters, and further assumptions of the COP calculations are shown in Appendix D.
To facilitate comparison at the system level, in Table 2, we also report seasonal performance factors (SPFs) computed from the simulated hourly COP time series. These values are within the range of what has been reported through field studies (e.g., [30]).

Table 2.
Seasonal performance factors (SCOPs) resulting from the simulations (dimensionless).
2.4. Parameter Study
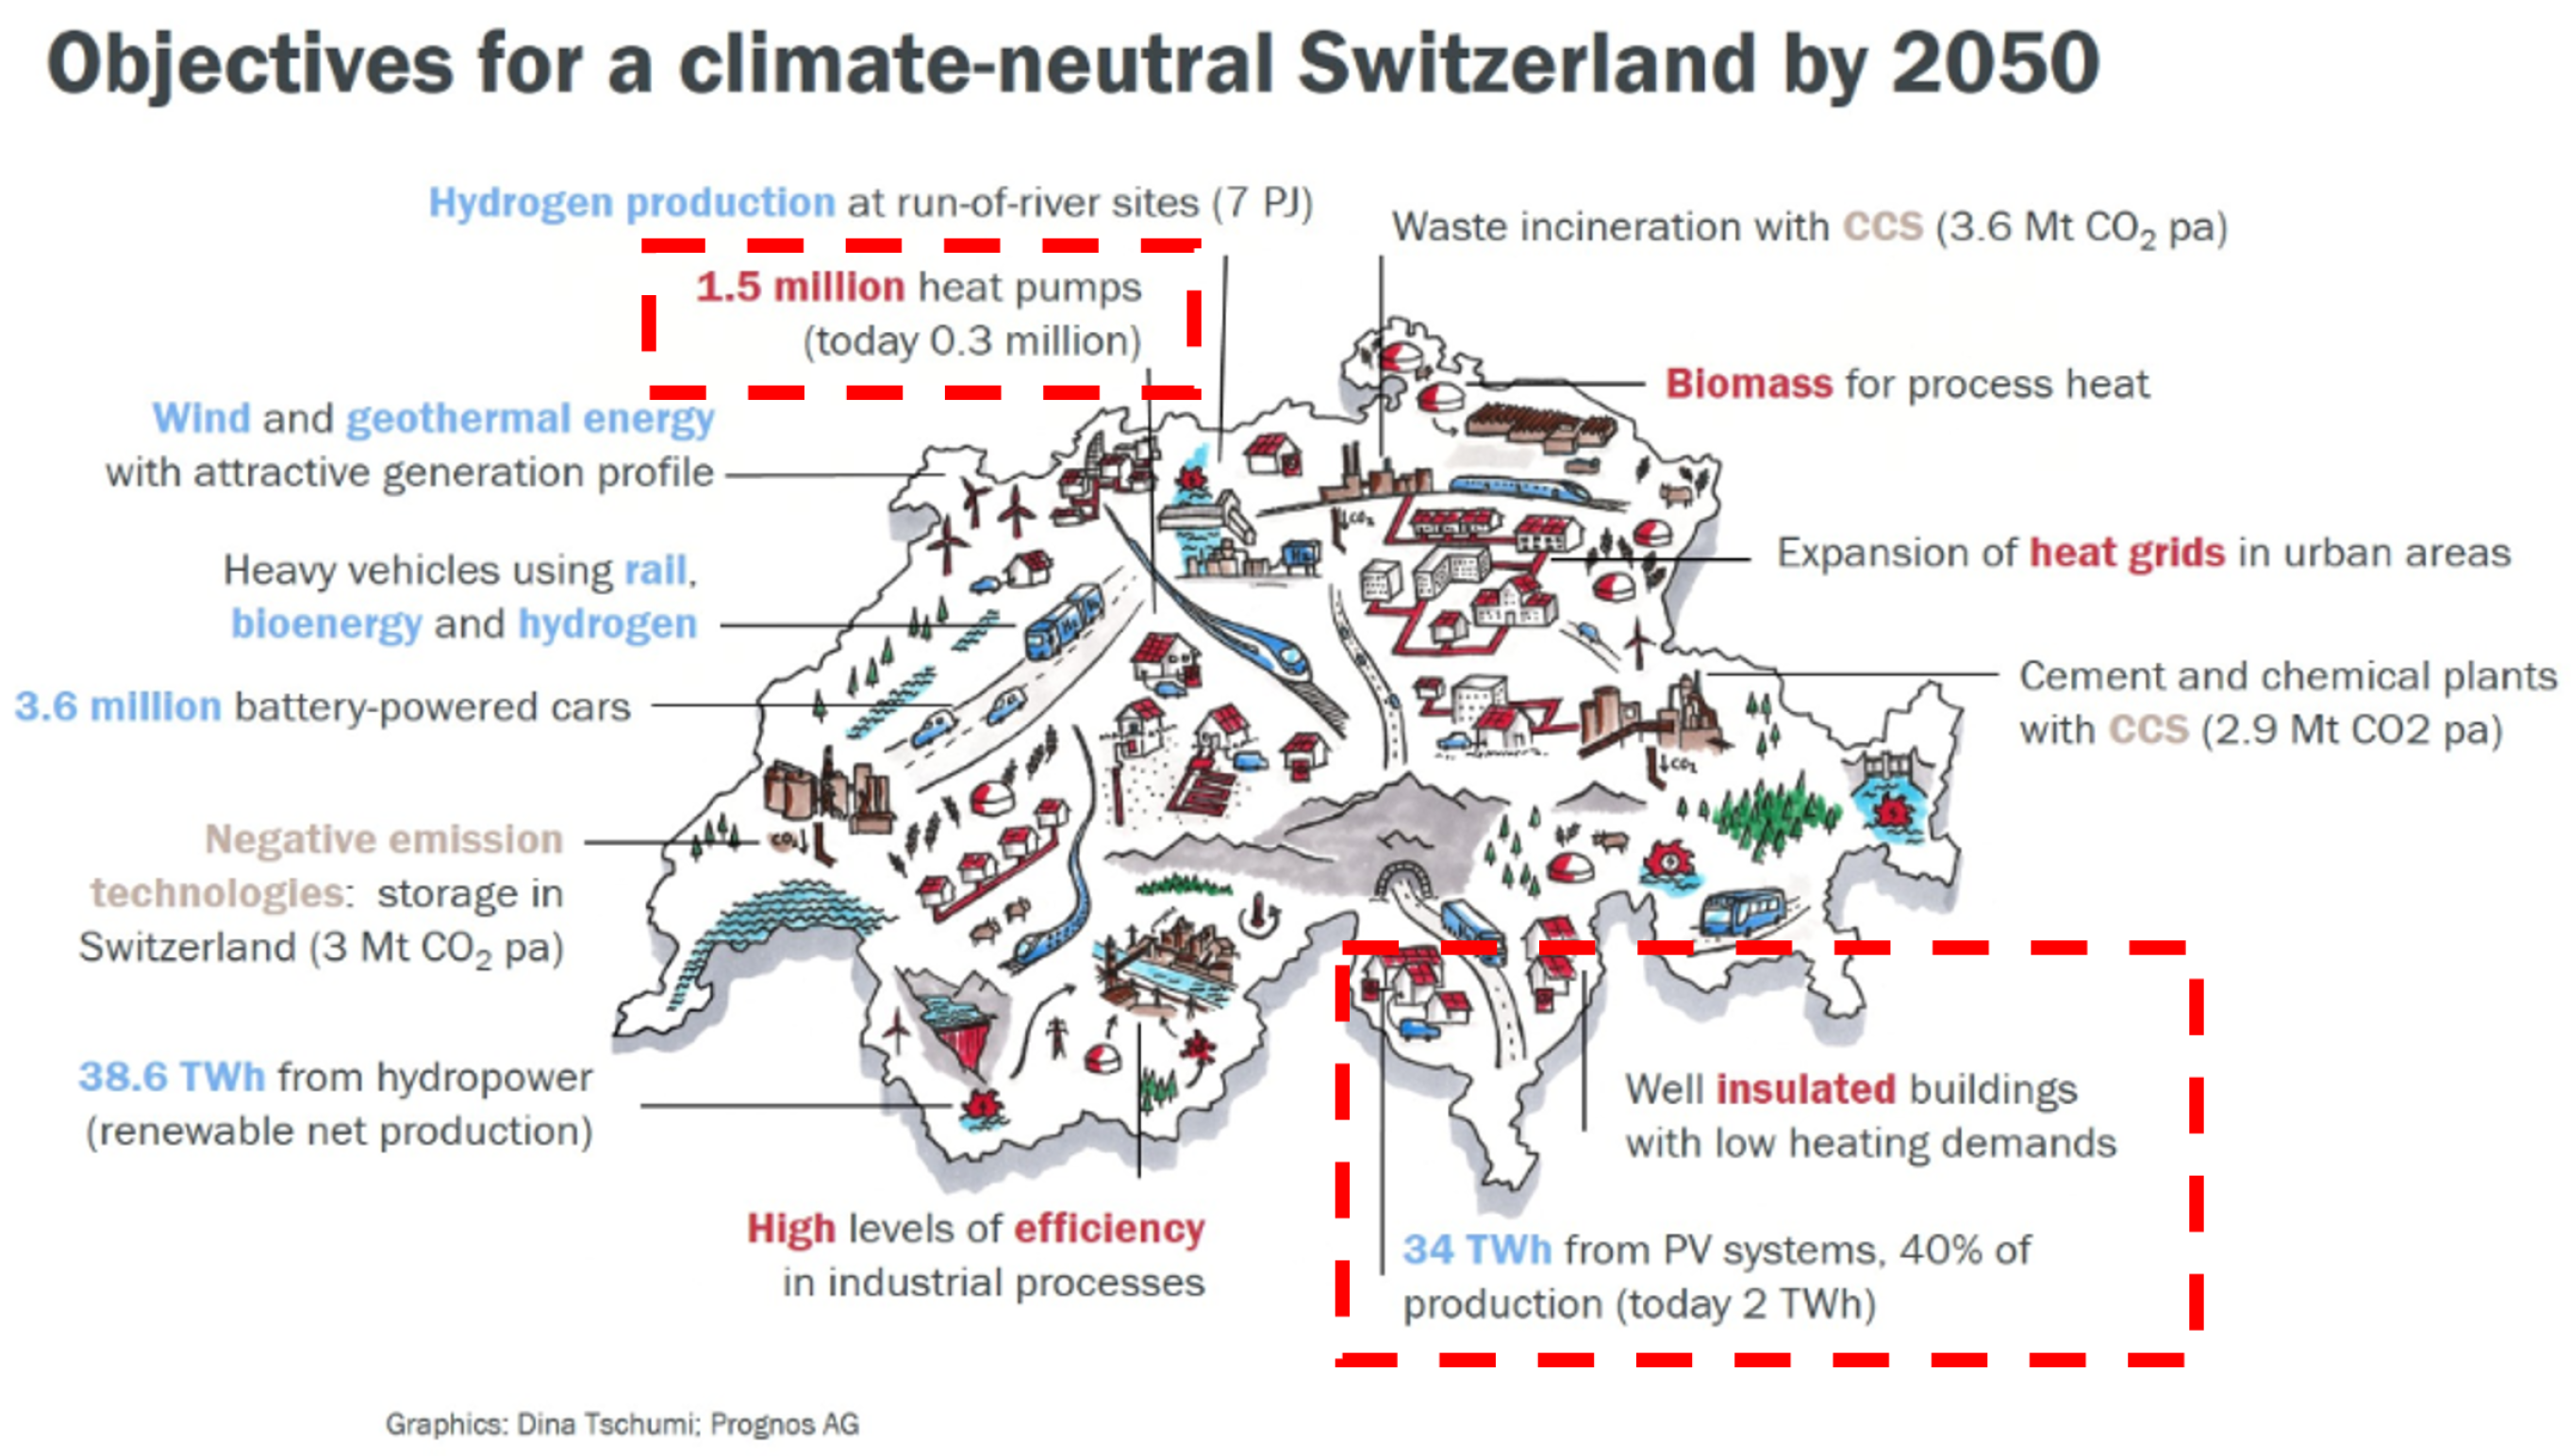
The Swiss Federal Office of Energy (SFOE) has conducted a comprehensive analysis to explore pathways for Switzerland to achieve net-zero greenhouse gas emissions by 2050 [1]. This plan, the Energy Perspectives 2050+ (EP2050+), outlines various possibilities and a mix of technologies that can result in the desired net-zero outcome in 2050. The goal is often visualized, as shown in Figure 2. In this study, we aim to investigate the building sector heat demand, and the various measures that can affect the demand and, as a result, the predicted winter electricity gap in 2050. In Figure 2, red dashed boxes highlight the most relevant elements of the EP2050+ plan:
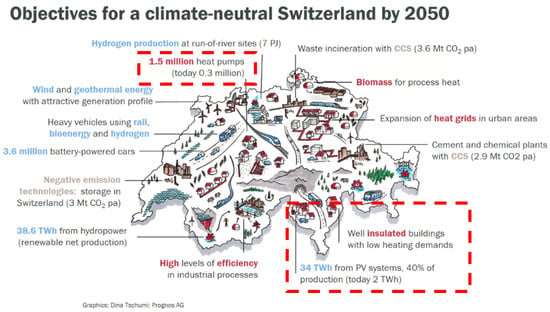
Figure 2.
The visualized goal of the SFOE’s Energy Perspective 2050. Red dashed boxes highlight the parts most relevant to the current study regarding the building stock heat demand and the winter gap.
- A total of 1.5 million heat pumps installed to cover 81% of the heat demand of single-family houses and 59% of that of multi-family houses. The remaining heat demand would be covered mainly by district heating. As of the end of 2024, an estimated 0.42 million heat pumps were installed, as opposed to the 0.3 million shown in the image that refers to 2020.
- Well-insulated houses and 40% of the energy to come from PV systems. This would correspond to 34 TWh PV production, compared to the current (end of 2024) 6 TWh. The image shows the status in 2020, when only 2 TWh were available.
Further changes include no more nuclear power plants, which would mean a reduction of 22 TWh in yearly electricity production, and an additional 1–2 TWh of winter electricity production with wind power and stored hydro-power. Mobility is planned to be largely electrified, which adds an estimated 18 TWh of yearly electricity demand.
According to the details of EP2050+, some of the relevant parameters to the building-stock heat demand are as follows:
- The renovation rate is 1.1% per year, meaning that 1.1% of the total building stock is renovated to meet the current best standard;
- No warm-water heat recovery (0%);
- A total of 20% of the heat pumps operate with a geothermal source (the rest with an air source); and
- No significant change in the climate.
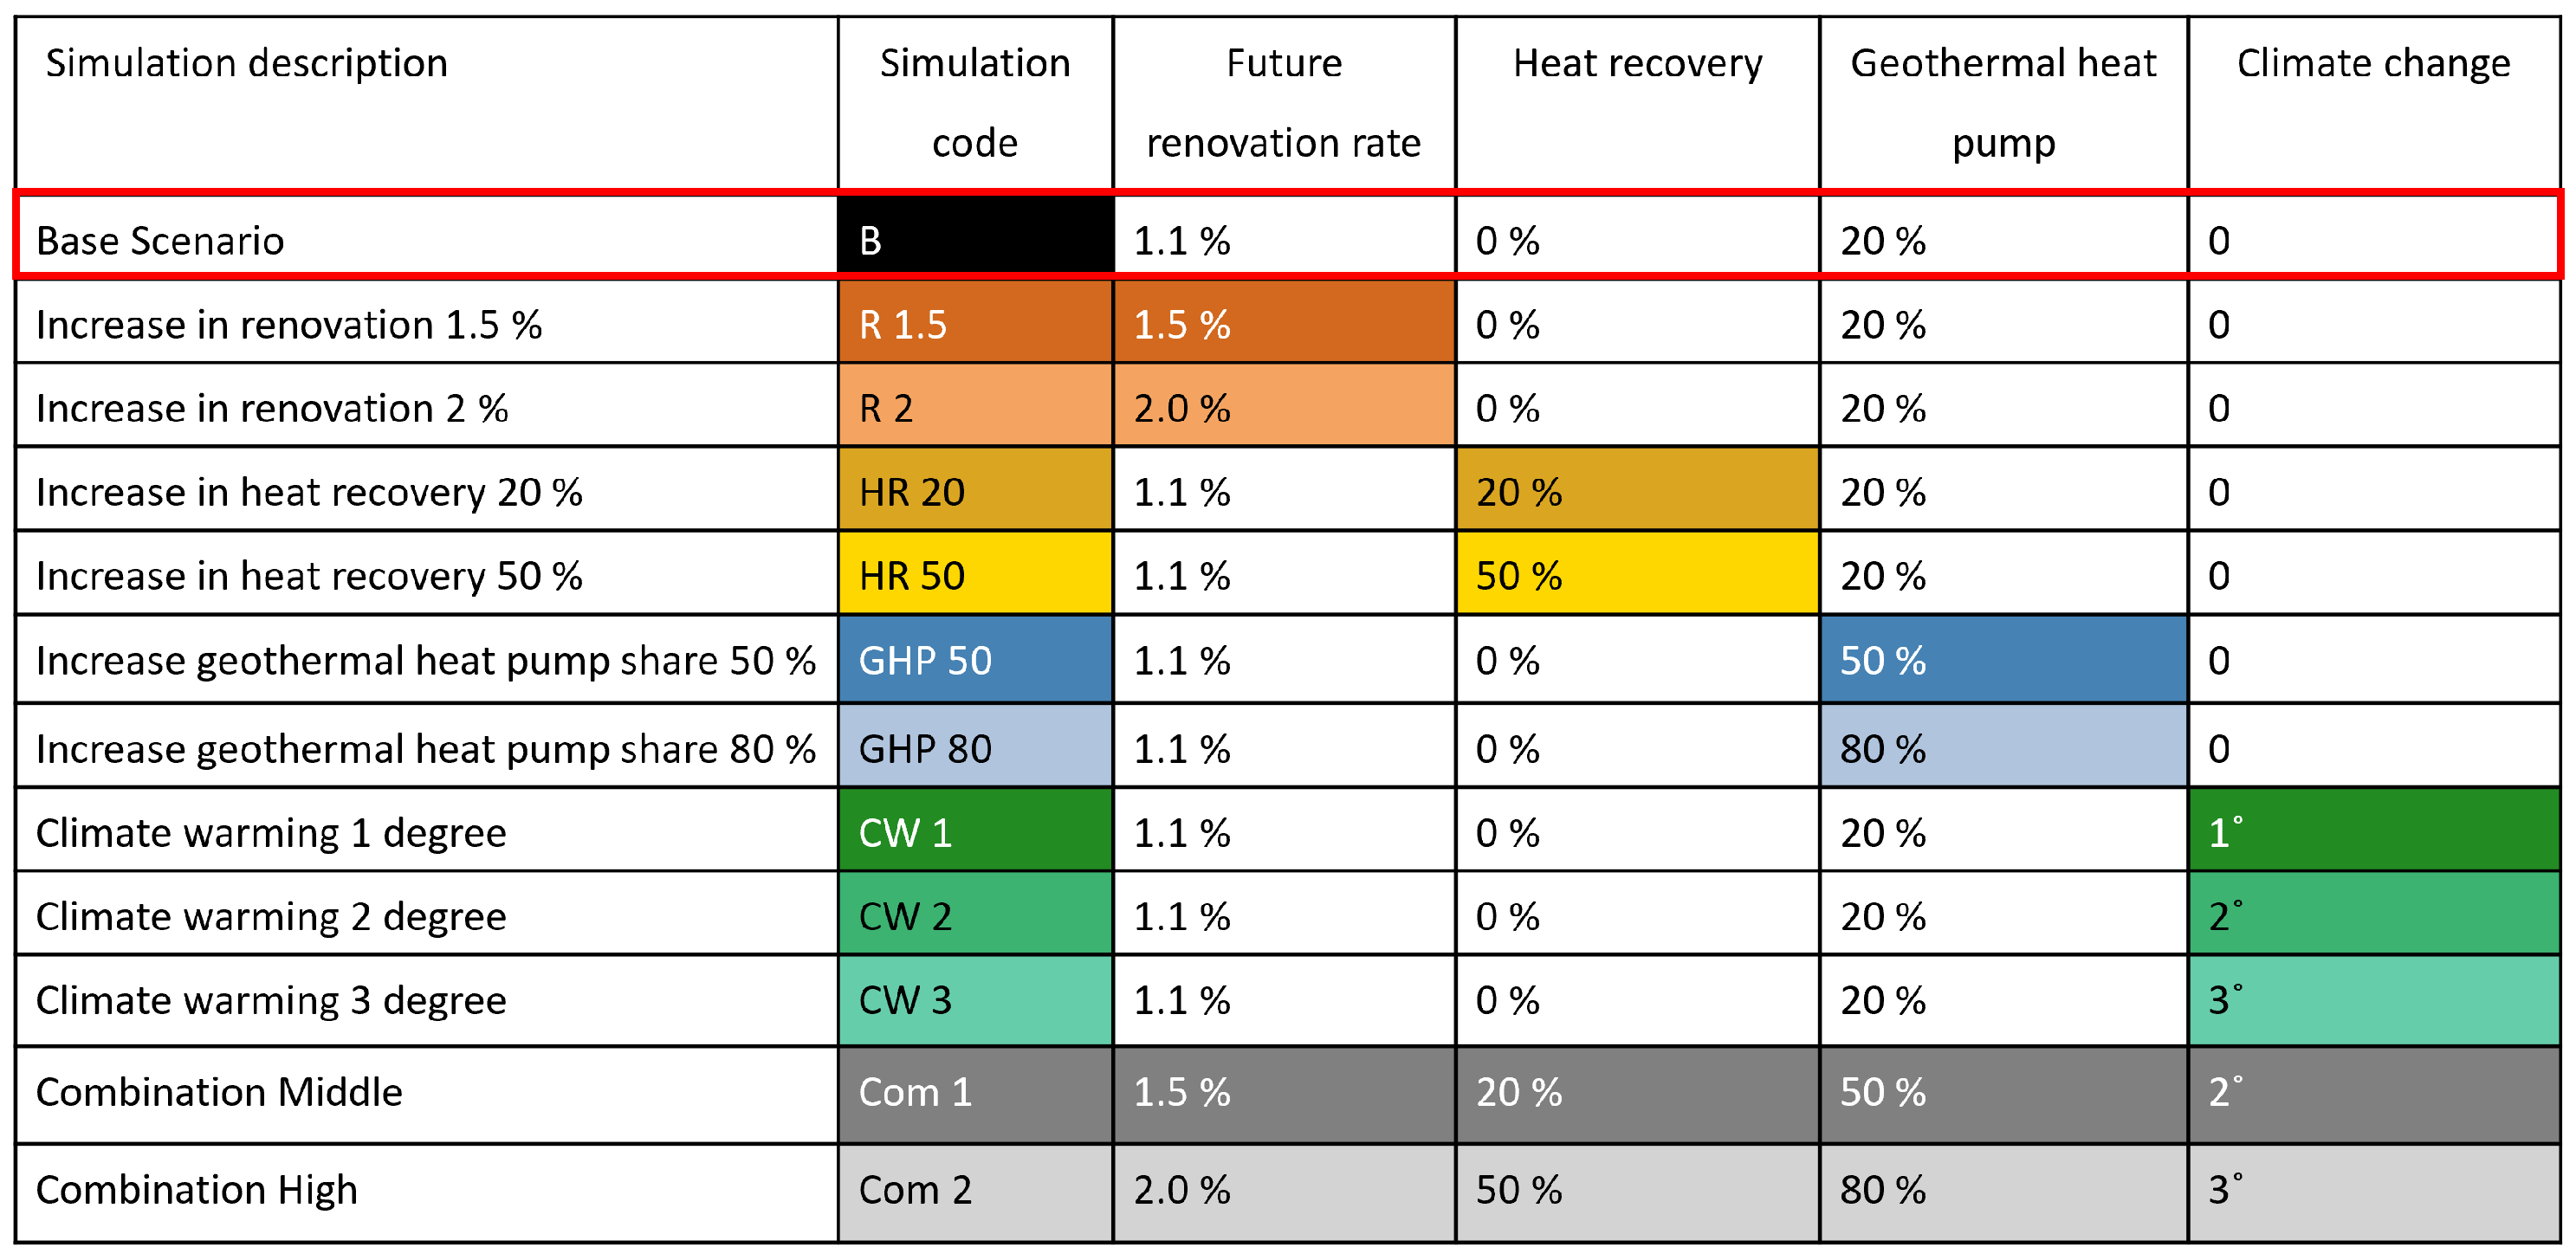
In this study, we vary the values of these four parameters to investigate their effect on the heat demand of the building sector. This includes both space heating and domestic hot water needs of the residential building stock. Figure 3 shows the parameter setups of the 12 scenarios that were simulated with the PowerCheck code.
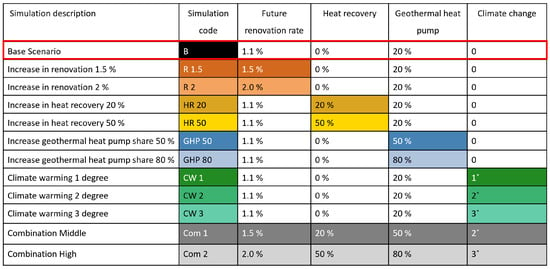
Figure 3.
The 12 scenarios were included in the parameter study, and the specific values for each of the four analyzed parameters were included. Colors and codes are used in the analysis figures in Section 3.1. The red frame shows the basis scenario from the EP2050+ study.
The first scenario is the base scenario, which reflects the EP2050+ plans and is described above. The next nine scenarios vary only one parameter to isolate the effect of each individual parameter. For these 4 parameters, we test two or three levels of changes:
- The renovation rate increase to 1.5% and 2%;
- Warm-water heat recovery of 20% and 50%;
- Geothermal heat pump shares of 50% and 80%; and
- An increase in the ambient temperature by 1, 2, and 3 degrees.
The choice of these scenarios is not based on an analysis of what is most likely to occur, but rather an open minded “what-if” analysis that includes values that can be considered extreme or unrealistic (e.g., 2% renovation rate, 50% warm-water heat recovery, or 80% of heat pumps using geothermal heat), in order to show the potential without considering societal, economic, or geographical (ground source) limits. Finally, the last two scenarios are medium- and high-level combinations of the previous nine scenarios. In the cases where we assume a warming in the climate, we modify past temperature profiles and increase the hourly resolved temperatures by 1, 2, or 3 degrees. We study only the effect on the building-stock heat demand, not on the increase in summer cooling demand that would certainly result from such scenarios.
Colors and simulation codes shown in Figure 3 are used in Section 3.1 to differentiate between the different scenarios in the analysis figures.
3. Simulation Results
3.1. Comparison of Scenarios
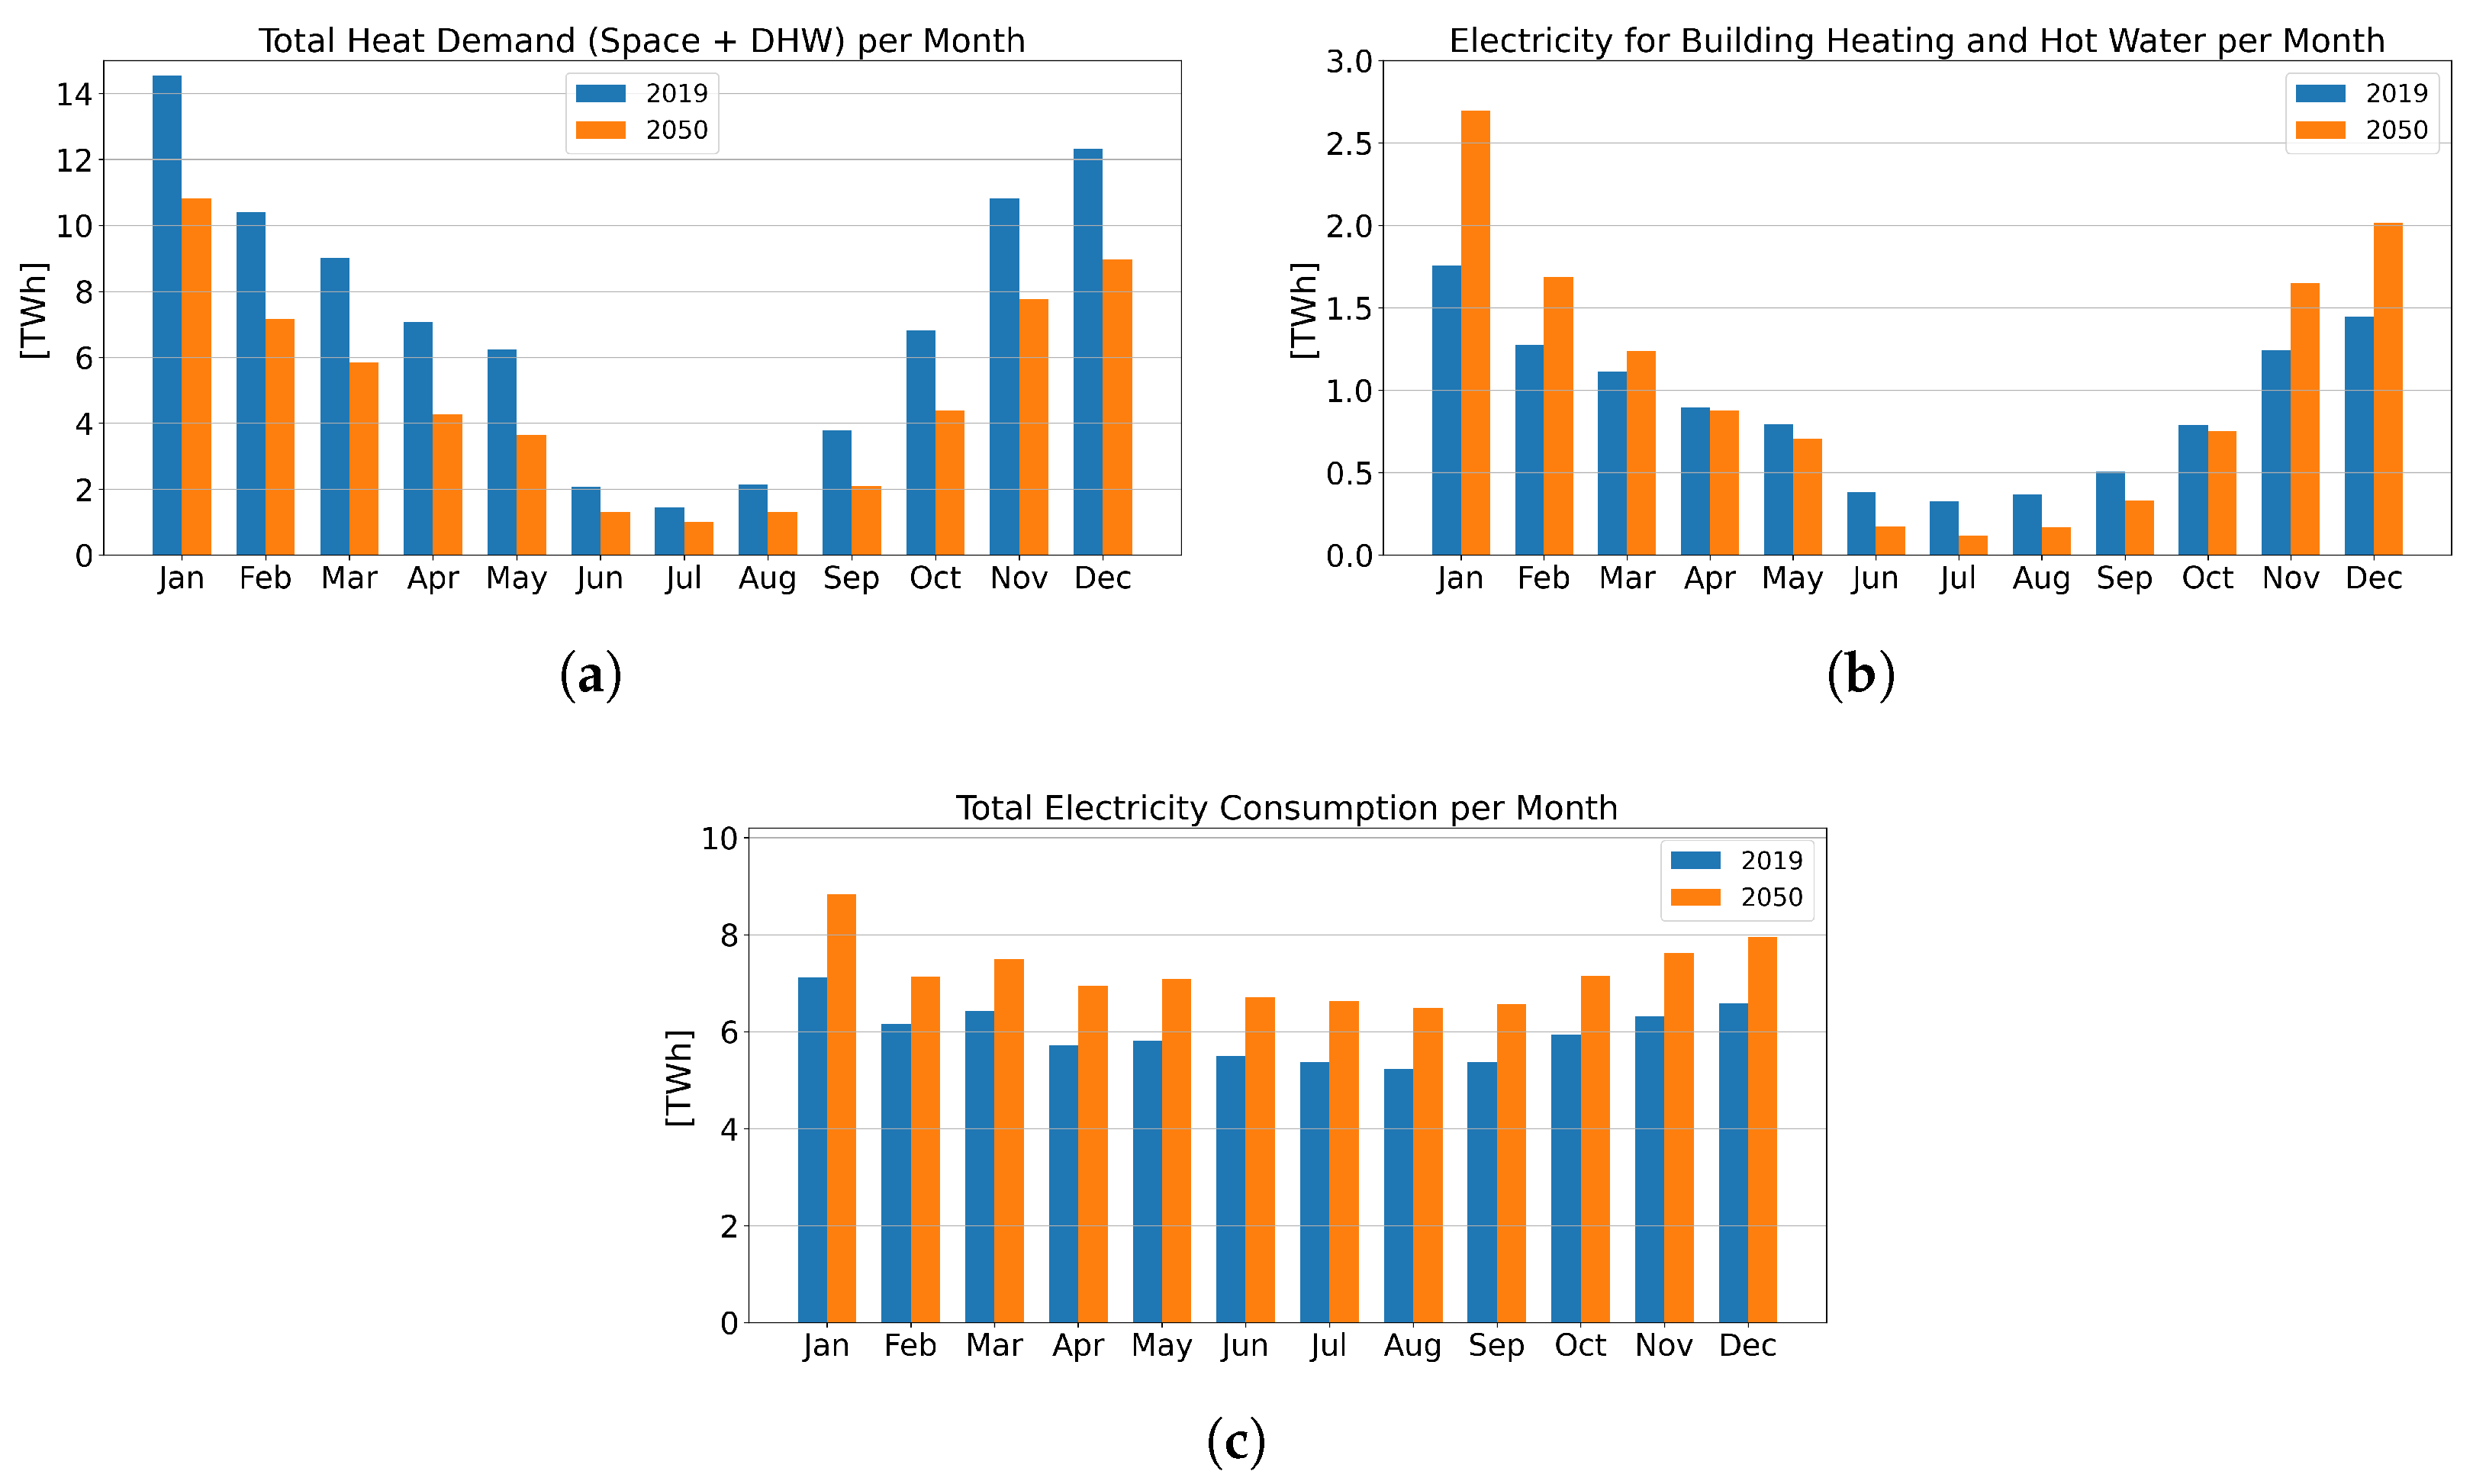
Based on the changes described in Section 2.4 that are expected to take place until 2050 to achieve the net-zero greenhouse gas emissions, we simulated the monthly heat demand, the electricity demand associated with the building heat demand, and the total electricity demand of Switzerland in 2050. Figure 4 shows the monthly distribution of the 2019 heat demand and electricity consumption and the simulated results of 2050.
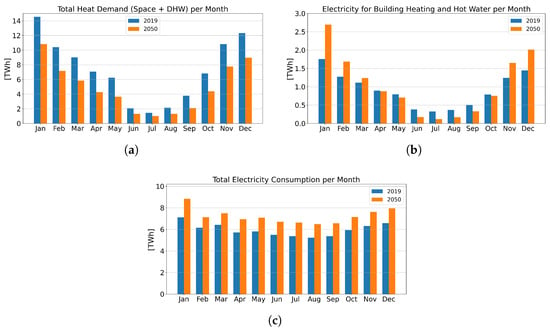
Figure 4.
Monthly profiles in 2019 (blue) and in 2050 simulations (orange): (a) building heat demand, including space heating and domestic hot water; (b) electricity demand for building heating and domestic hot water; and (c) total electricity demand in Switzerland.
These simulations follow the EP2050+, which is described as the baseline scenario in Figure 3. Heat demand is expected to be lower due to the renovation of old houses and the building of new energy-efficient buildings. The total yearly heat demand is expected to decrease from 86.7 TWh in 2019 to 58.6 TWh in 2050. Electricity demand, on the other hand, is predicted to rise as we shift away from fossil fuels towards renewable energies and sustainable solutions. The 71.5 TWh yearly electricity usage in 2019 is expected to rise to 86.6 TWh in 2050. The proportion of electricity consumption related to the building heat demand (space heating and domestic hot water) is expected to rise from 10.9 TWh in 2019 to 12.4 TWh in 2050.
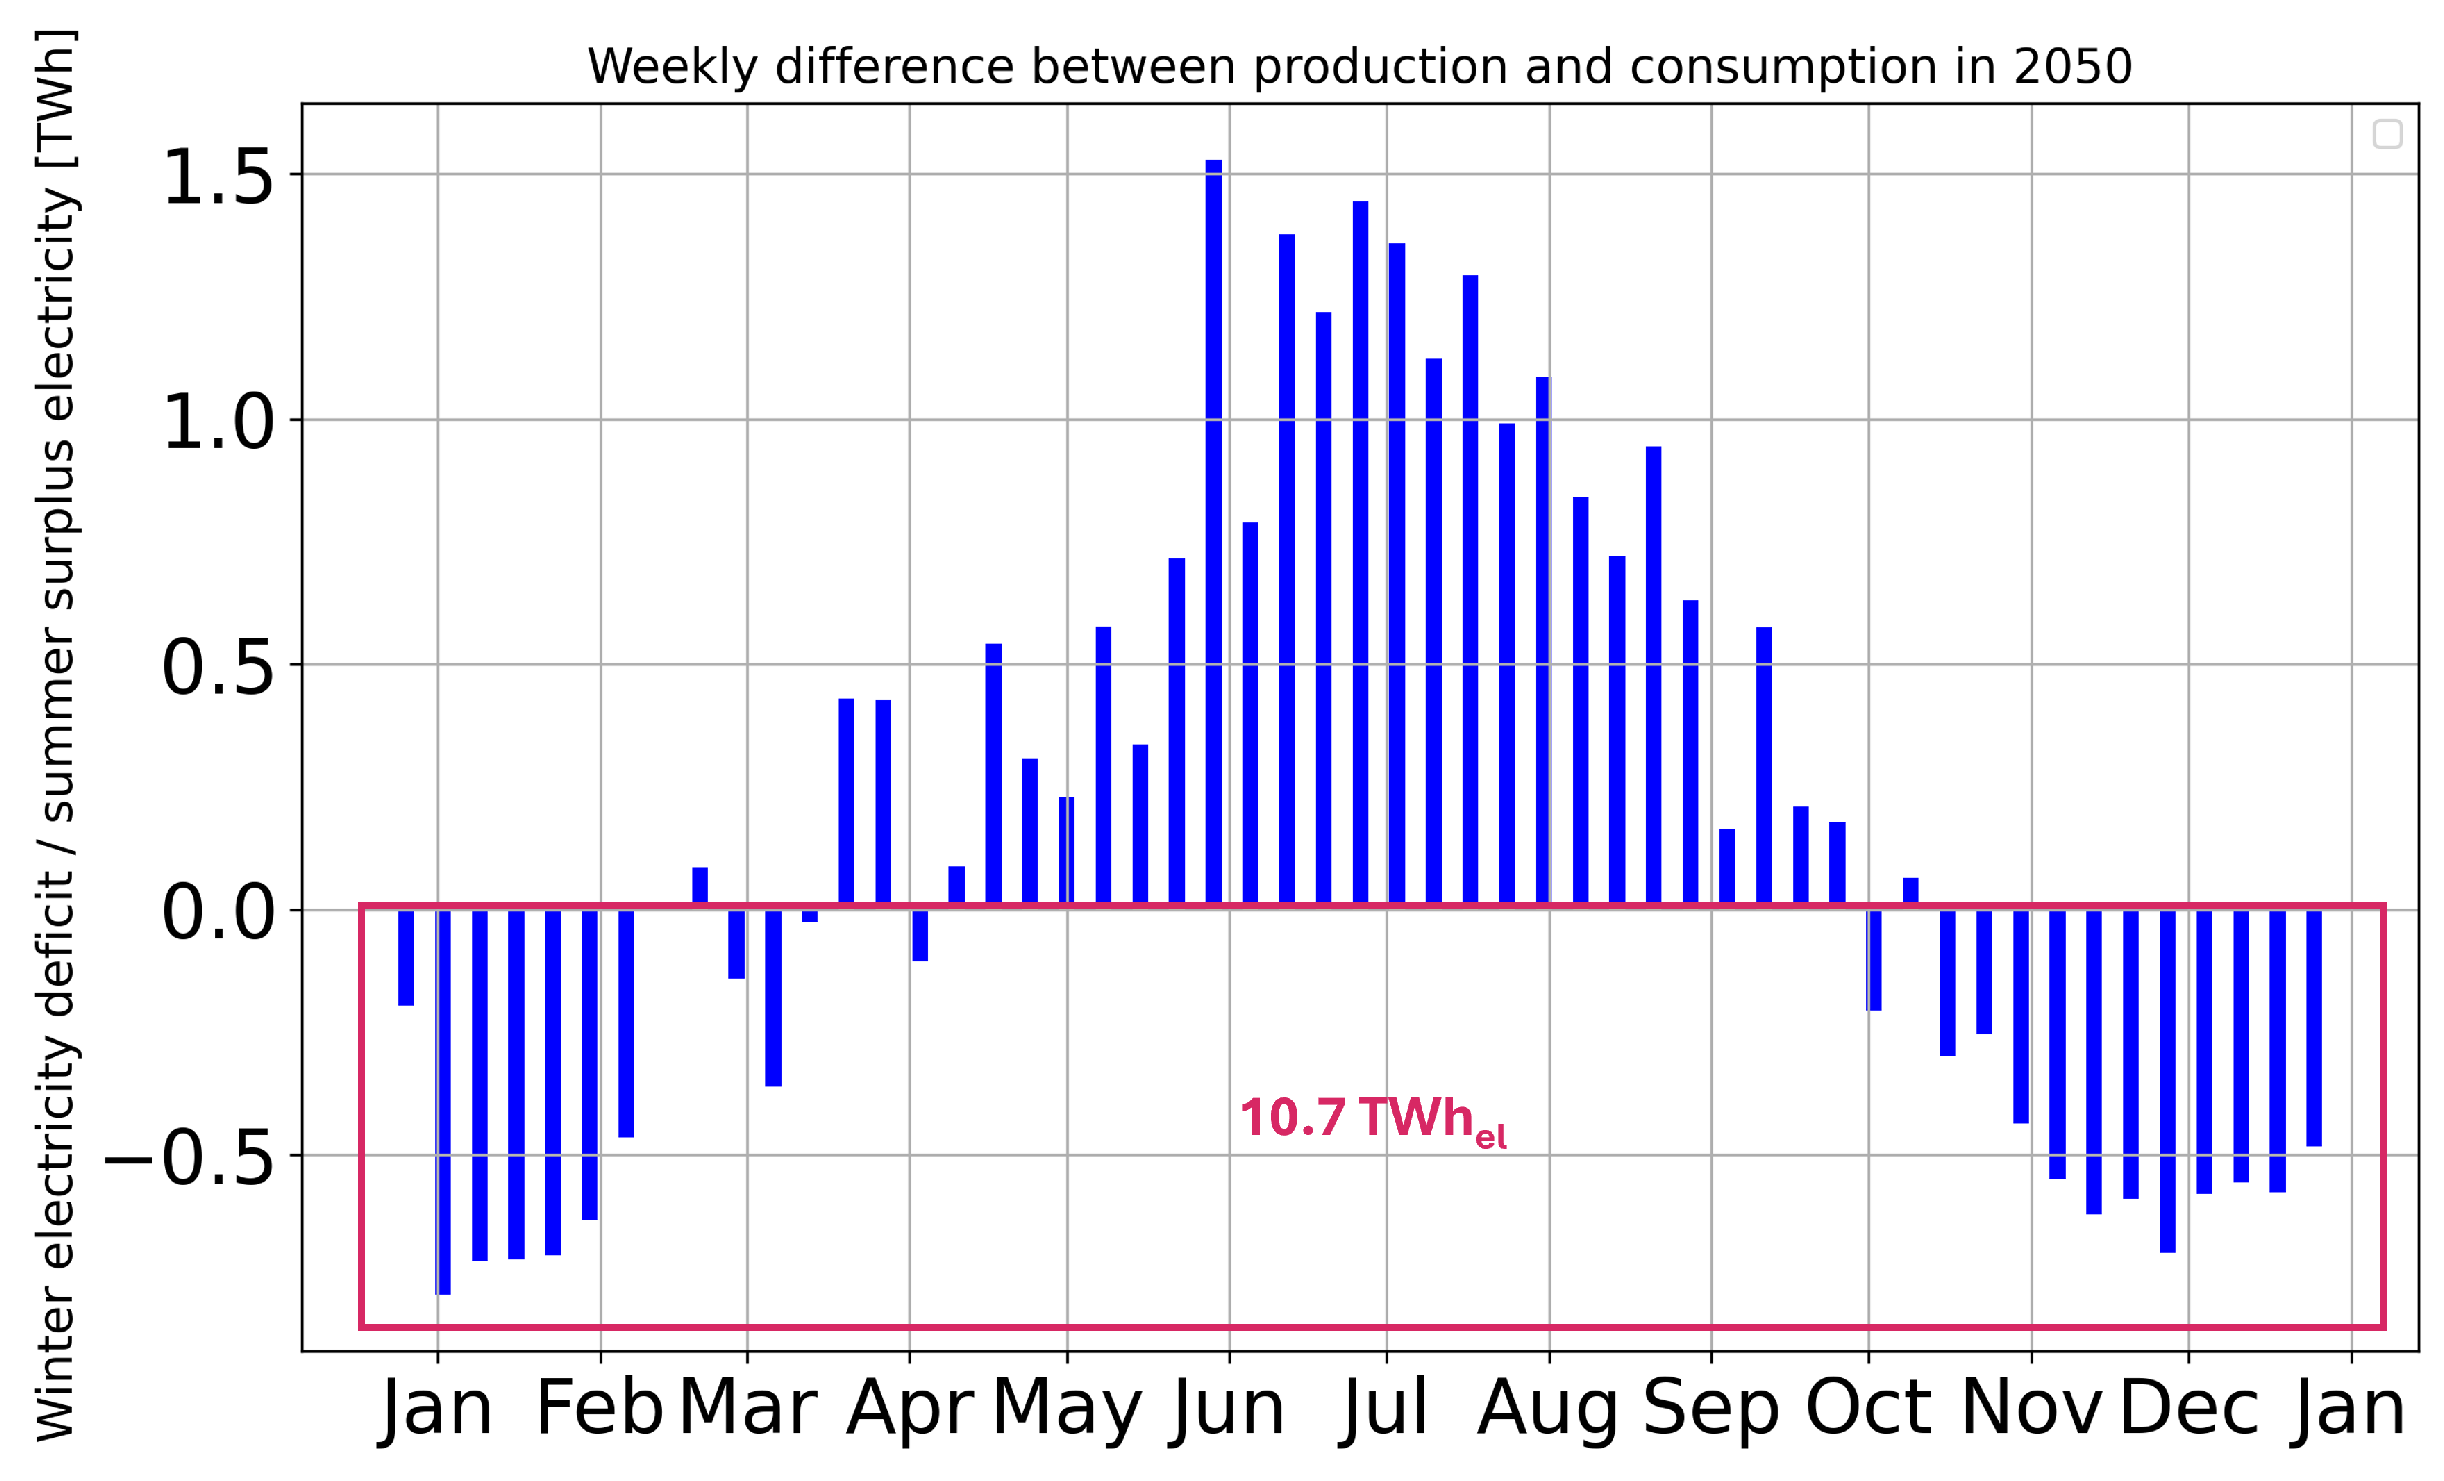
We compare the electricity demand and production on a weekly basis to determine the winter gap still remaining in 2050. We define “winter gap” as anything that cannot be balanced on a weekly basis (through pumped storage, batteries, heat storage, etc.). This is considered a seasonal mismatch and contributes to the winter gap or summer surplus. Figure 5 shows the weekly difference between electricity production and demand in the 2050 base scenario simulation. This corresponds to the EP2050+ scenario.
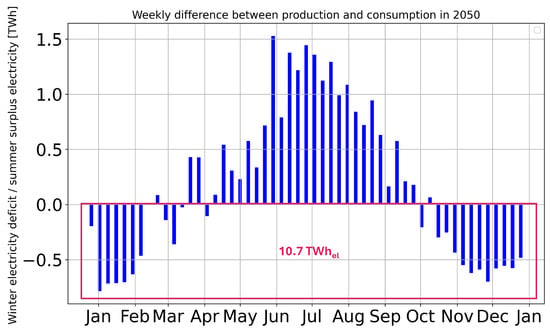
Figure 5.
Weekly distribution of the difference between production and consumption simulated in 2050. Positive values show summer surplus, while negative values show winter gap. The sum of the negative values is 10.7 TWh.
The estimated winter gap for electric energy according to EP2050+ will be 9 TWh in 2050. Our simulation results in a winter gap of 10.7 TWh. The difference can be due to the definition of winter gap or in assumptions that differ from each other between the EP2050+ estimation and the PowerCheck simulation. Some of these differences are
- EP2050+ assumes a PV winter production share of 31%, which is to be achieved through various measures. We simulated only a 27% PV winter share. The discrepancy can be attributed to different assumptions for parameters, such as the inclination of rooftop PV, the amount of PV installed in the Alps instead of the plains, or the degree of increase in albedo in the Alps.
- EP2050+ assumes an additional electricity consumption of 3 TWh for electrolysis in summer, which is also not included in our simulation. The resulting winter electricity provided from here is also not modeled.
To put this winter gap in context, currently (end of 2024), the amount of imported energy carriers such as heating oil, gasoline, diesel, natural gas, and uranium is approximately 200 TWh. Therefore, the 10.7 TWh that we estimate as the winter gap in 2050 is not a new demand, but it is what might remain of the current 200 TWh of energy carrier imports. The summer surplus of our simulations is far greater than the winter gap. It is to be noted that the increased demand for cooling in summer due to climate change was not considered in our simulations; thus, the projected summer surplus is most likely overestimating reality substantially and is not to be used for conclusions or citations. As in this study the focus is on reducing the winter gap through measures on the building-heat-demand side, the overestimation of summer surplus is not of relevance.
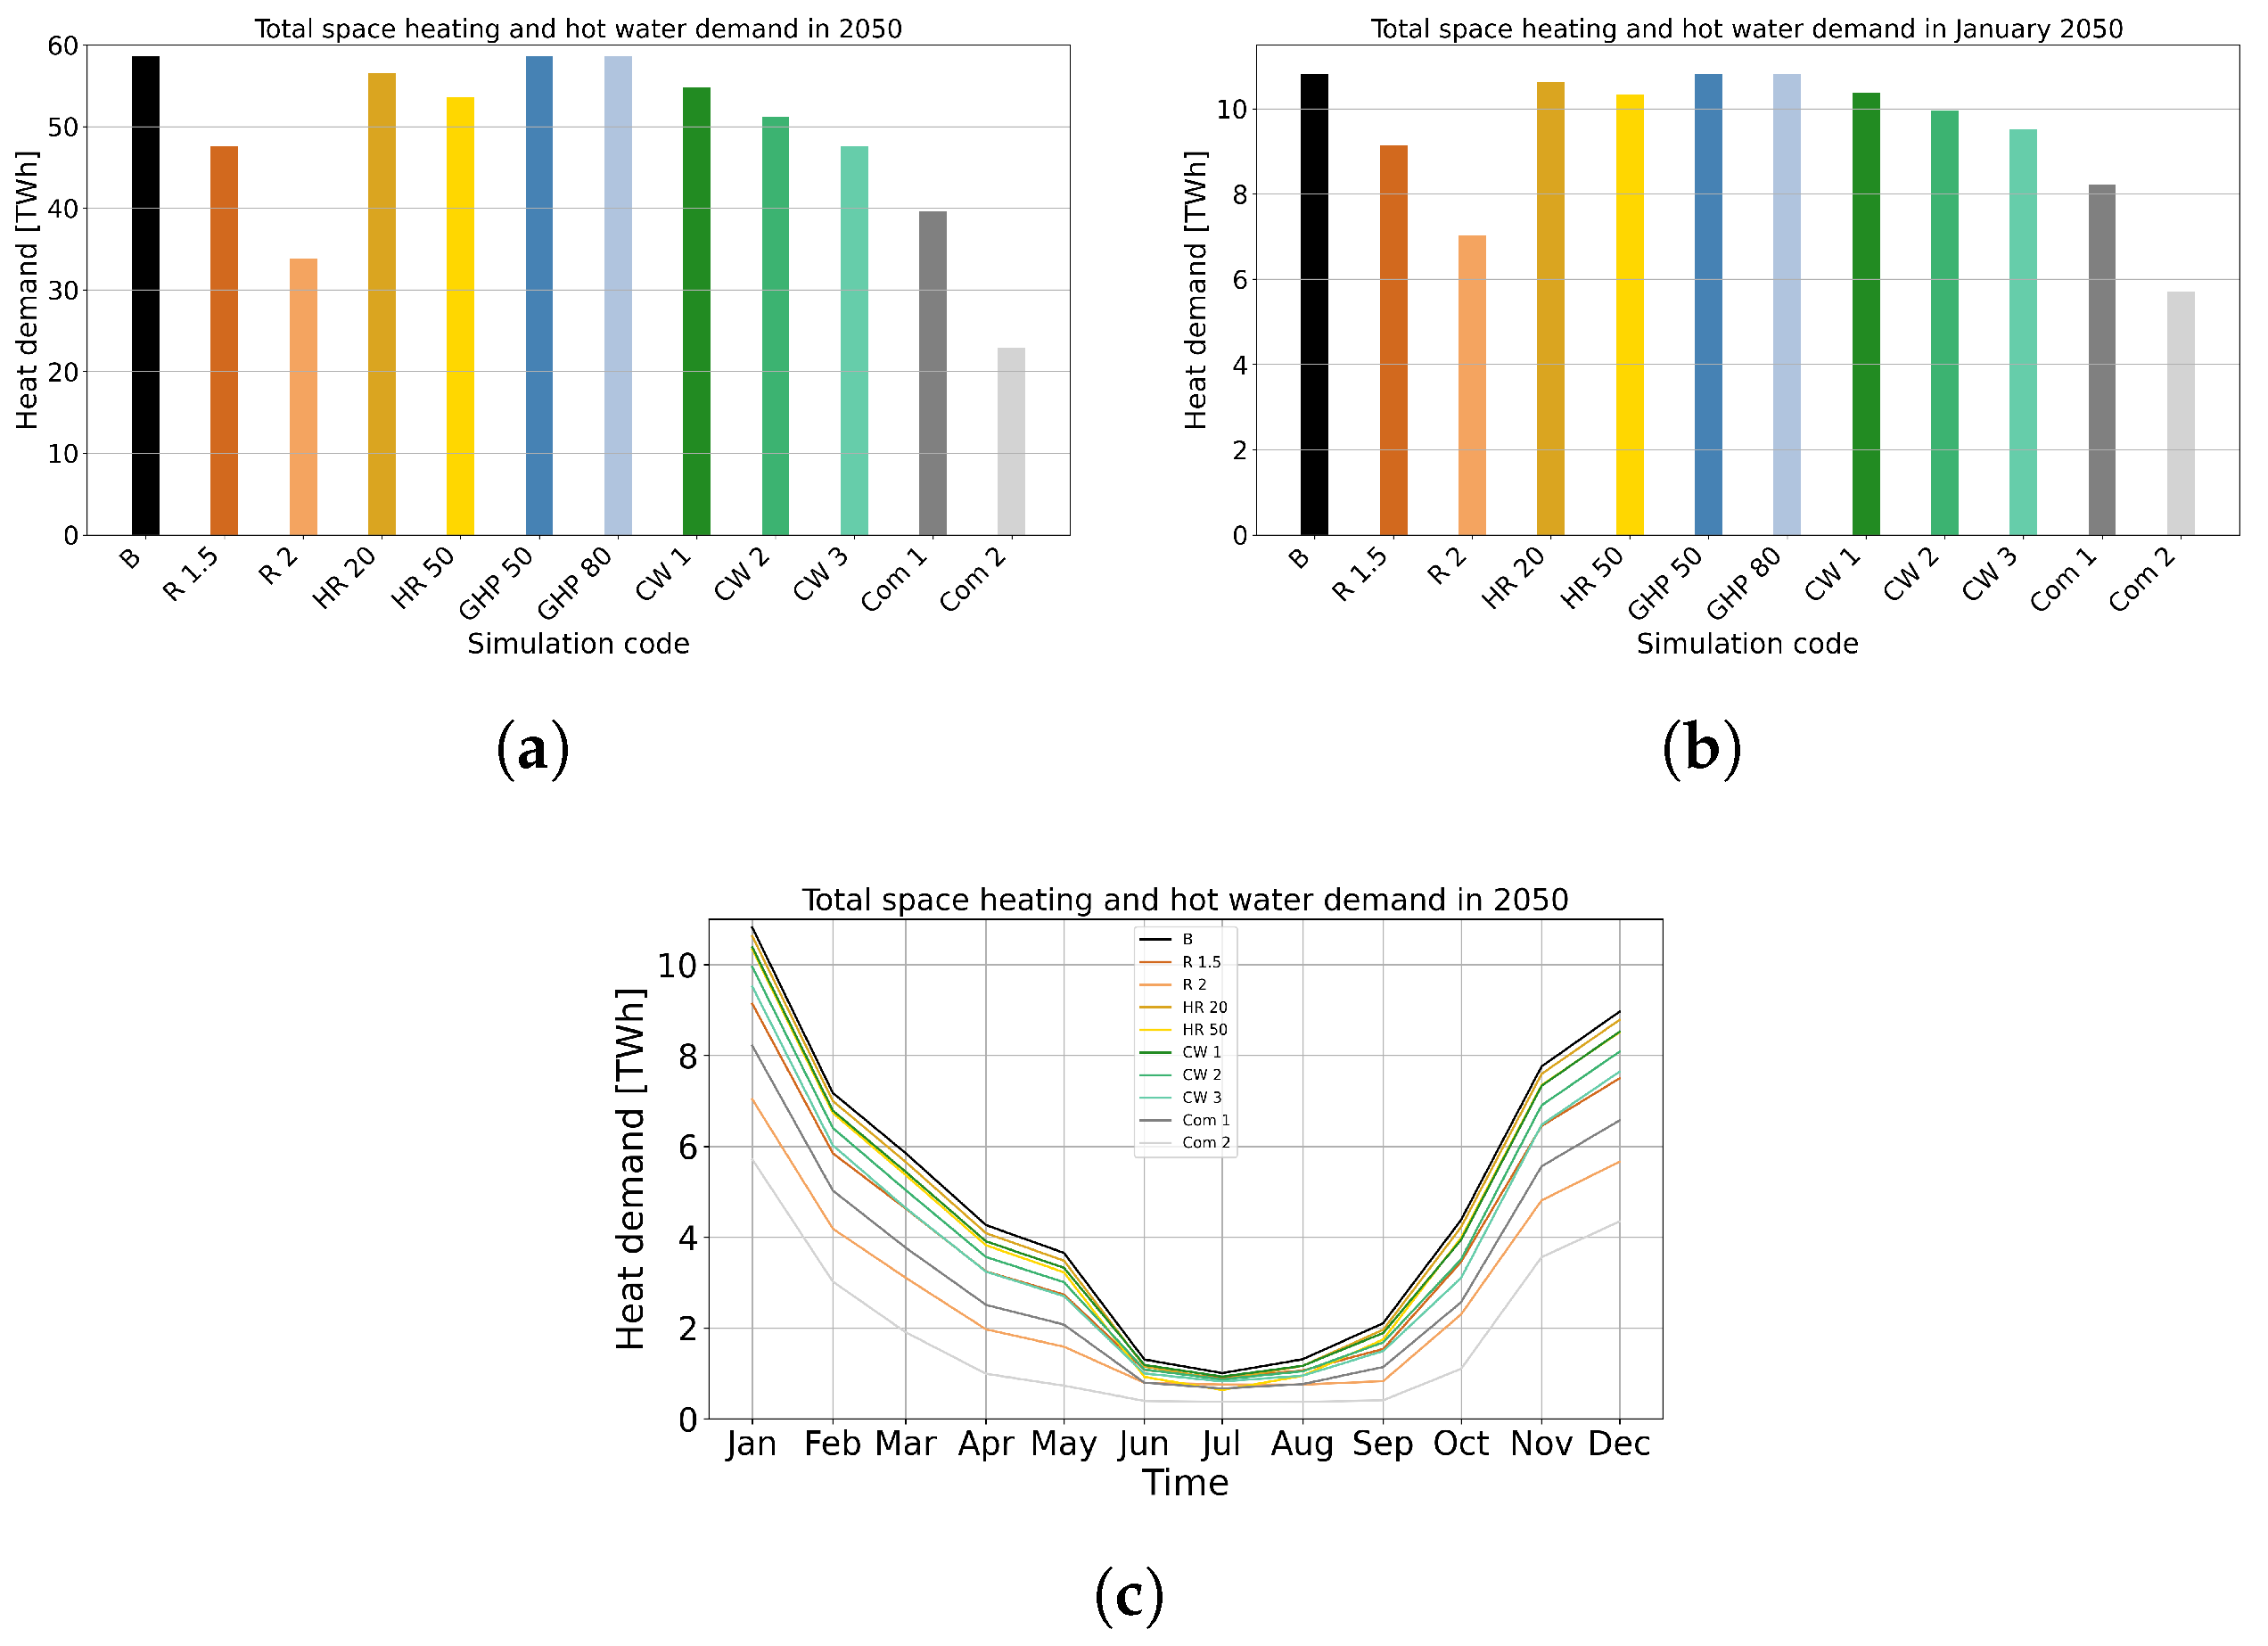
With our simulation model, we tested the influence of the different parameters described in Section 2.4. Figure 6 shows the simulated heat demand of the Swiss building stock in 2050, including space heat and domestic hot water usage, for the different scenarios that assume different values for these influencing parameters.
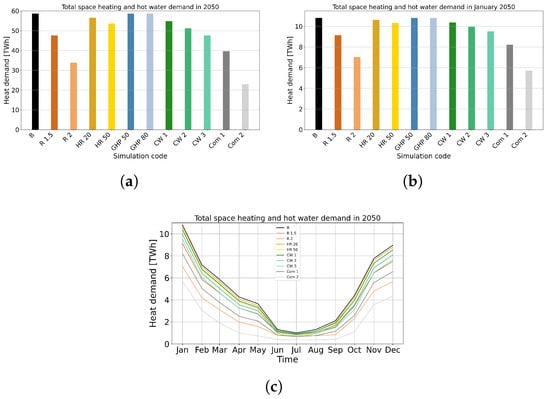
Figure 6.
Building heat demand (space heating and domestic hot water) according to the scenarios described in Figure 3: (a) total yearly heat demand in 2050; (b) heat demand in January in 2050; and (c) monthly distribution in 2050.
The different colored bars correspond to the different scenarios presented in Section 2.4 and Figure 3. We can see that the largest reduction in head demand is achieved by renovating the old buildings to the current best insulation standard (orange bars). The demand is affected to a lower amount by the warm-water heat recovery (yellow bars) and the possible warming of the climate (green bars). The share of air-source and ground-source heat pumps has no influence on the heat demand (blue bars), since this share does not influence the amount of heat needed for heating but only the amount of electricity needed to provide this heat. With a combination of all measures and influences, the largest reduction in heat demand can be achieved (gray bars).
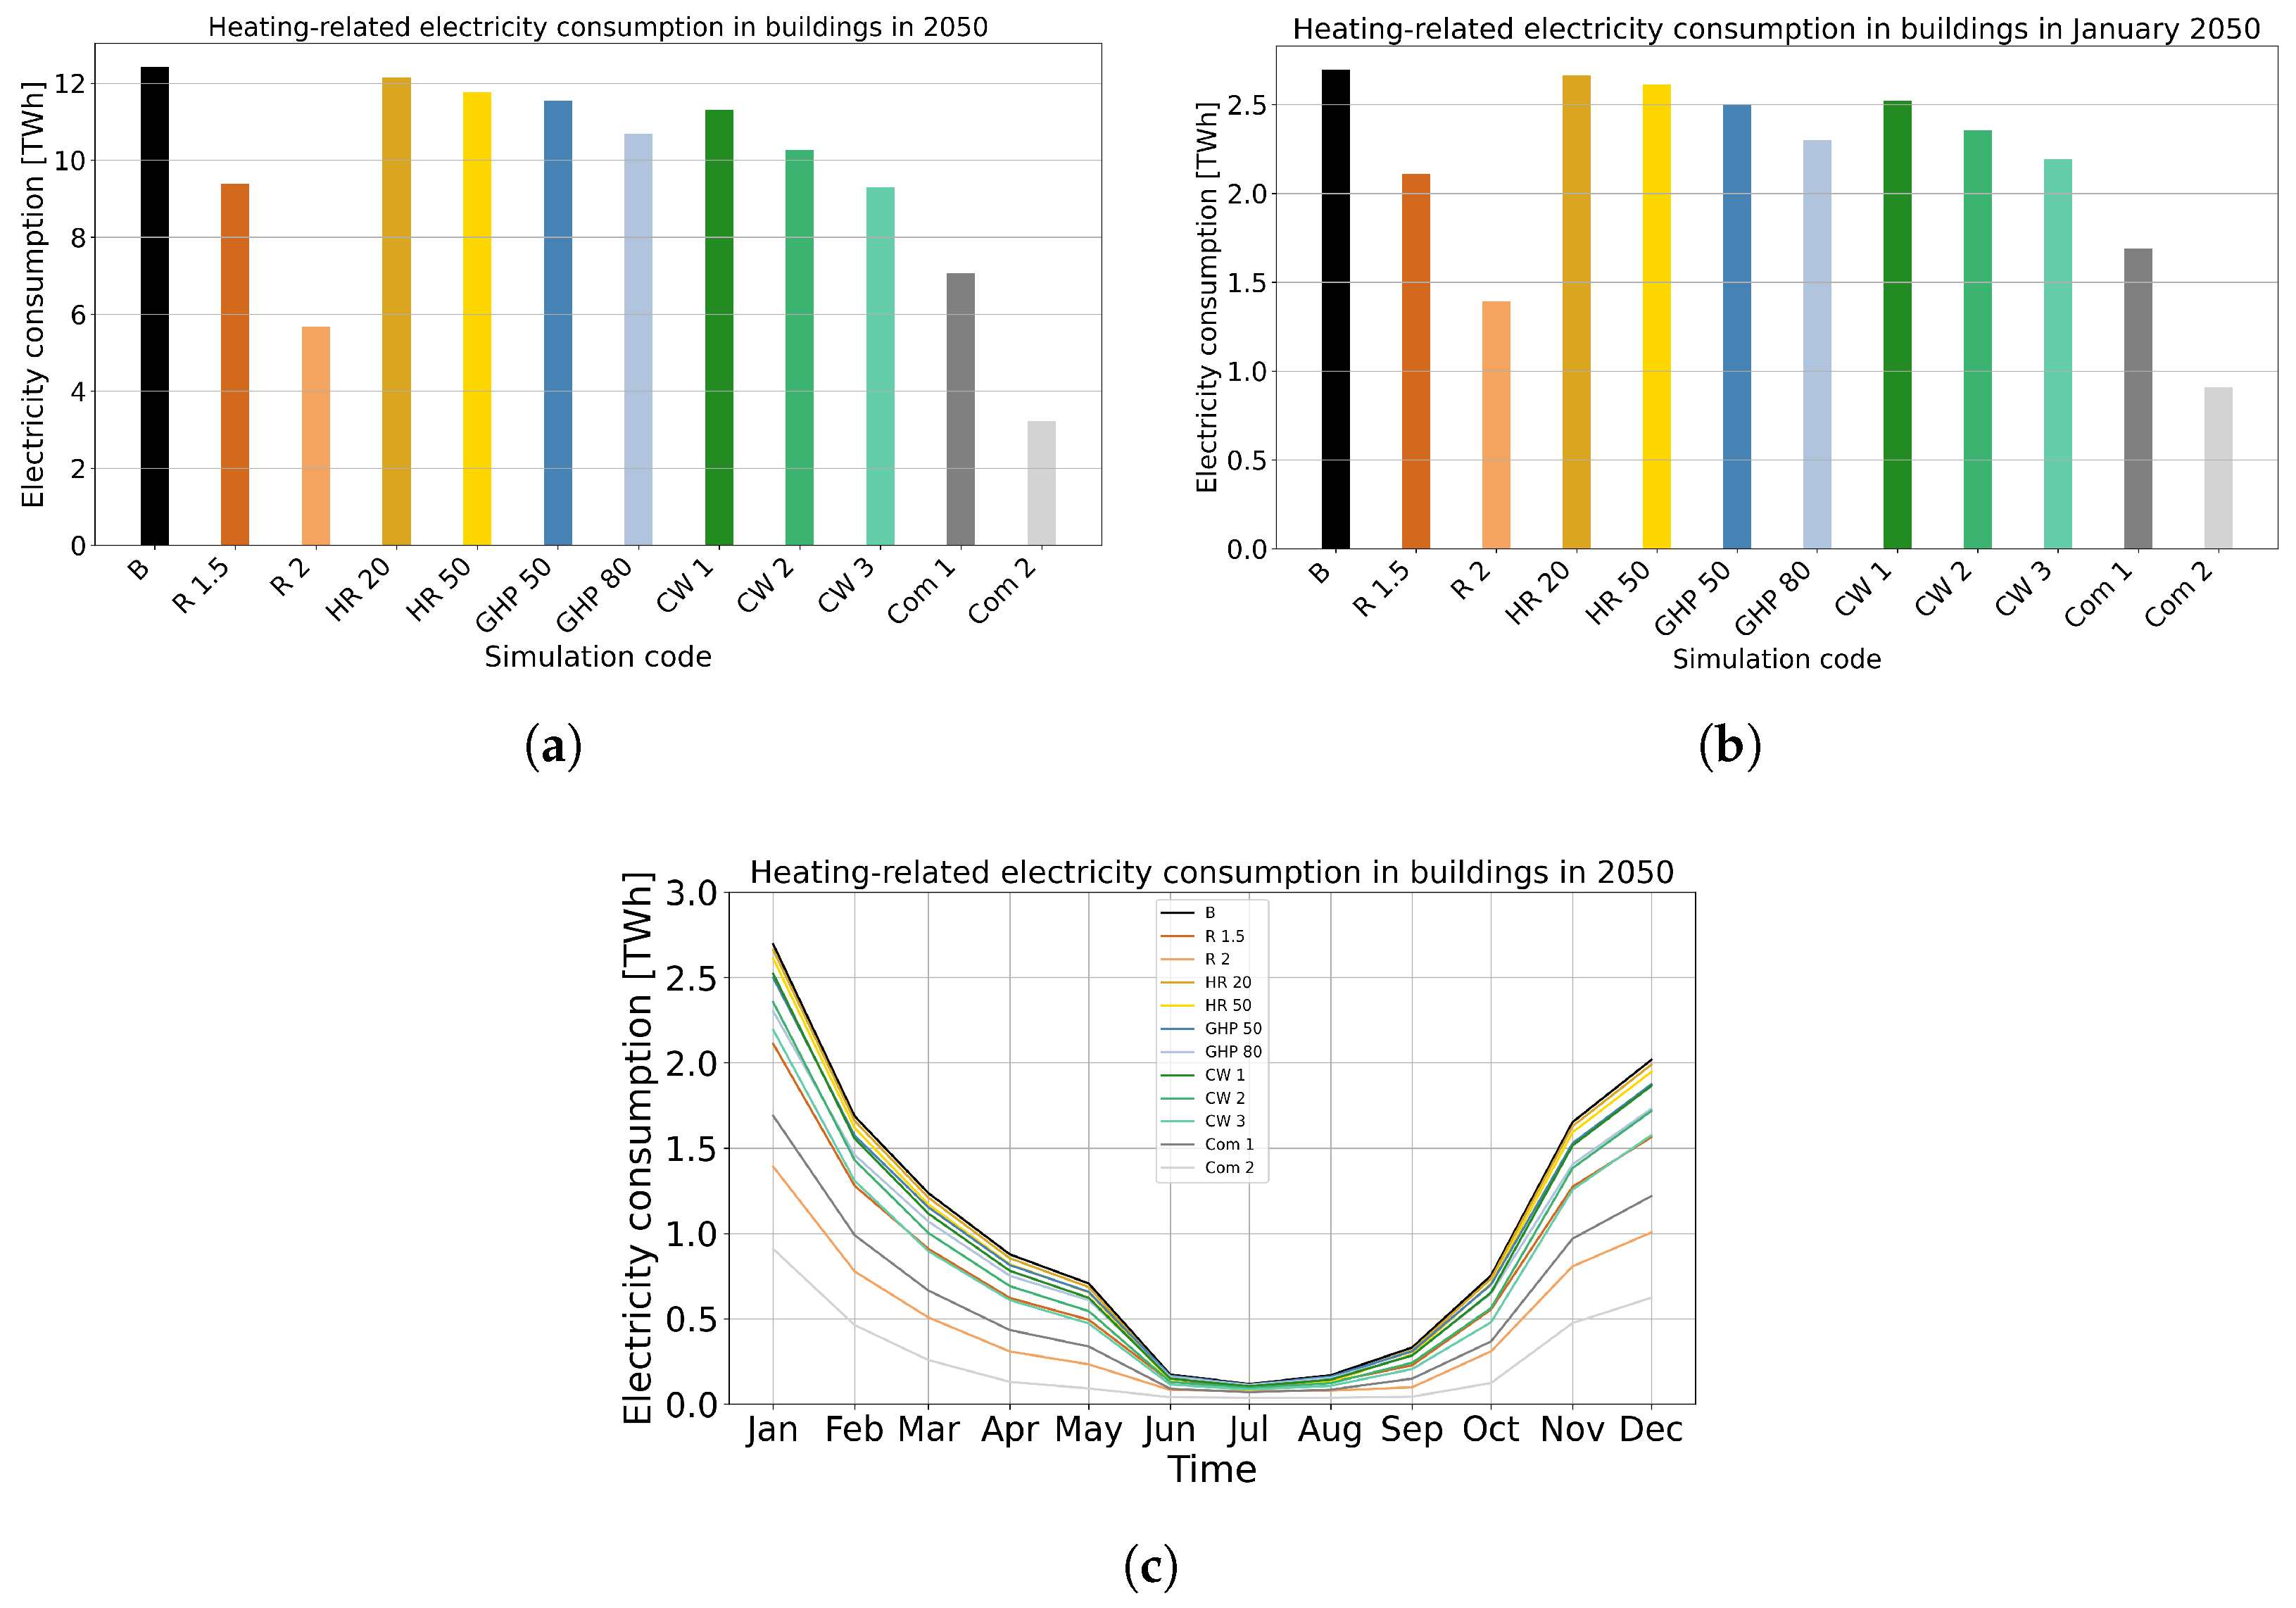
The simulated electricity usage based on the various scenarios is shown in Figure 7, similarly to Figure 6. While the biggest effect is also seen for the higher rates of renovation (orange bars), an increase in the share of ground-source heat pumps (blue bars) also becomes an important factor in reducing the electricity consumption.
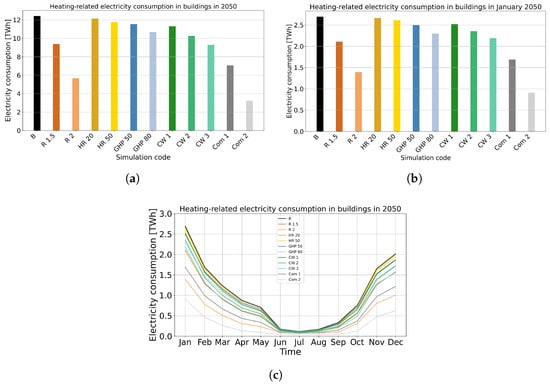
Figure 7.
Electricity consumption related to residential buildings (space heating and domestic hot water) according to the scenarios described in Figure 3: (a) total yearly electricity consumption in 2050; (b) electricity consumption in January in 2050; and (c) monthly distribution in 2050.
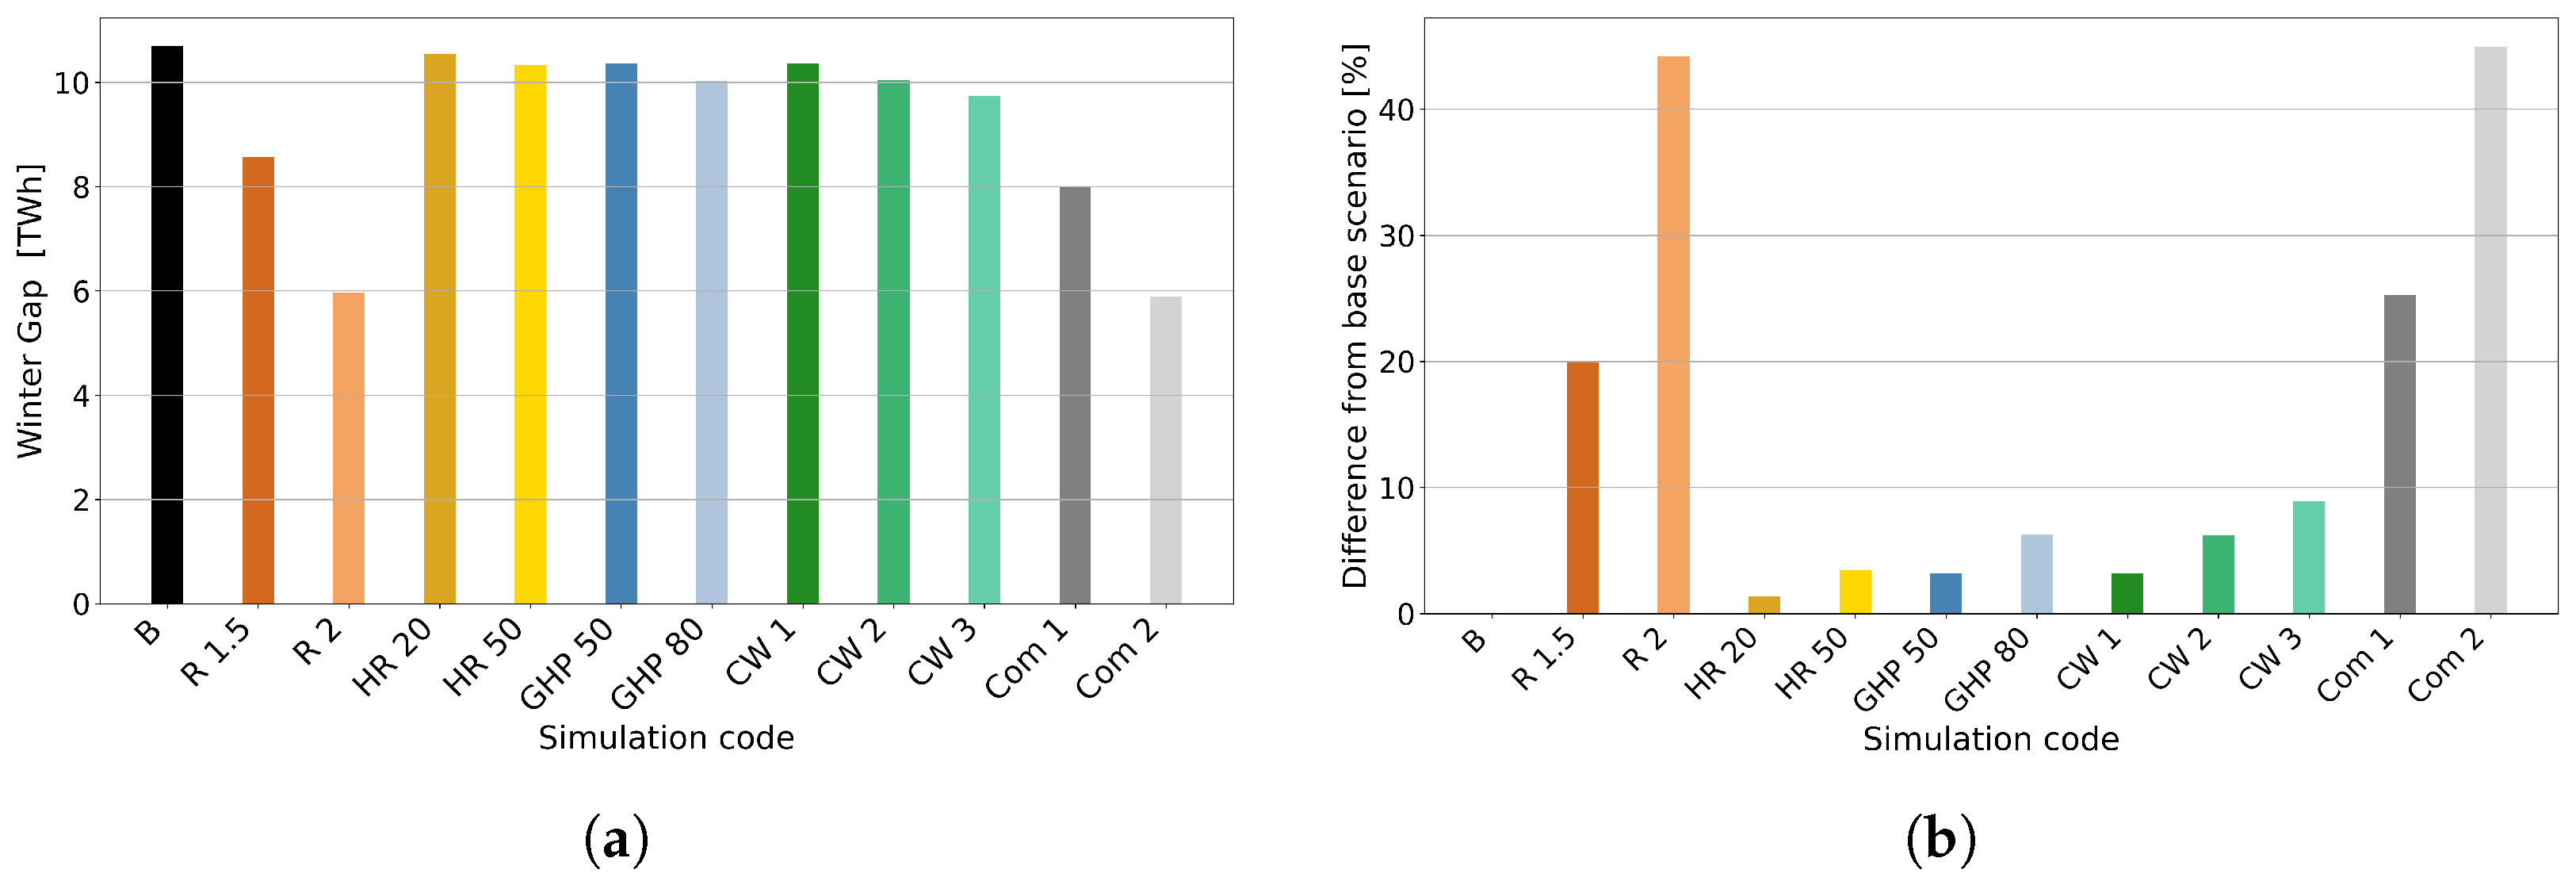
Finally, we show the effect of these measures on the winter gap. With the parameters of the base scenario that follows the EP2050+ pathways, we found a 10.7 TWh winter gap. Figure 8 presents the effect on the winter gap of the various measures that we simulated with the PowerCheck code. As seen earlier, the largest effect with a single measure can be achieved when the renovation rate is increased. With a 2% renovation rate, the winter gap can be reduced to 6 TWh (44% decrease). A combination of measurements can also be beneficial, since this renovation rate is unlikely to be achieved by 2050. When we compare the “middle” level changes, we can see that while a renovation rate of 1.5% alone can reduce the winter gap by 20%, when it is coupled with 20% of warm water regeneration and 50% of the heat pumps being ground source, as well as an assumed increase in the ambient temperature, the combination can reduce the winter gap by 25%.
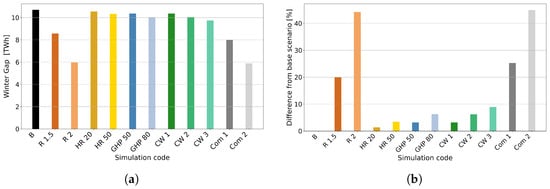
Figure 8.
(a) Winter gap simulated according to the scenarios described in Section 2.4; (b) winter gap reduction compared to the base scenario.
3.2. The Importance of Renovation
As shown in Section 3.1, increasing the renovation rate is essential to lower the winter heat demand of the building stock, and by extension to lower the building-related electricity usage and the winter gap. Some of the foreseen changes to the energy system, like the installation of new PV plants, or more heat pumps, are measures that can be implemented either over time until 2050, or even in bulk closer to 2050. However, when it comes to the renovation rate, the expected benefits will be only seen if the rate is changed already at the present time and kept up all the way through 2050. For example, if we envisage a 2% yearly renovation rate from 2019 to 2050, it means that 85% of the total building stock will be renovated during this time. If we do not renovate steadily over time but start in 2045 to renovate 85% of the buildings, we would need a yearly renovation rate of over 13%, which is not realistic.
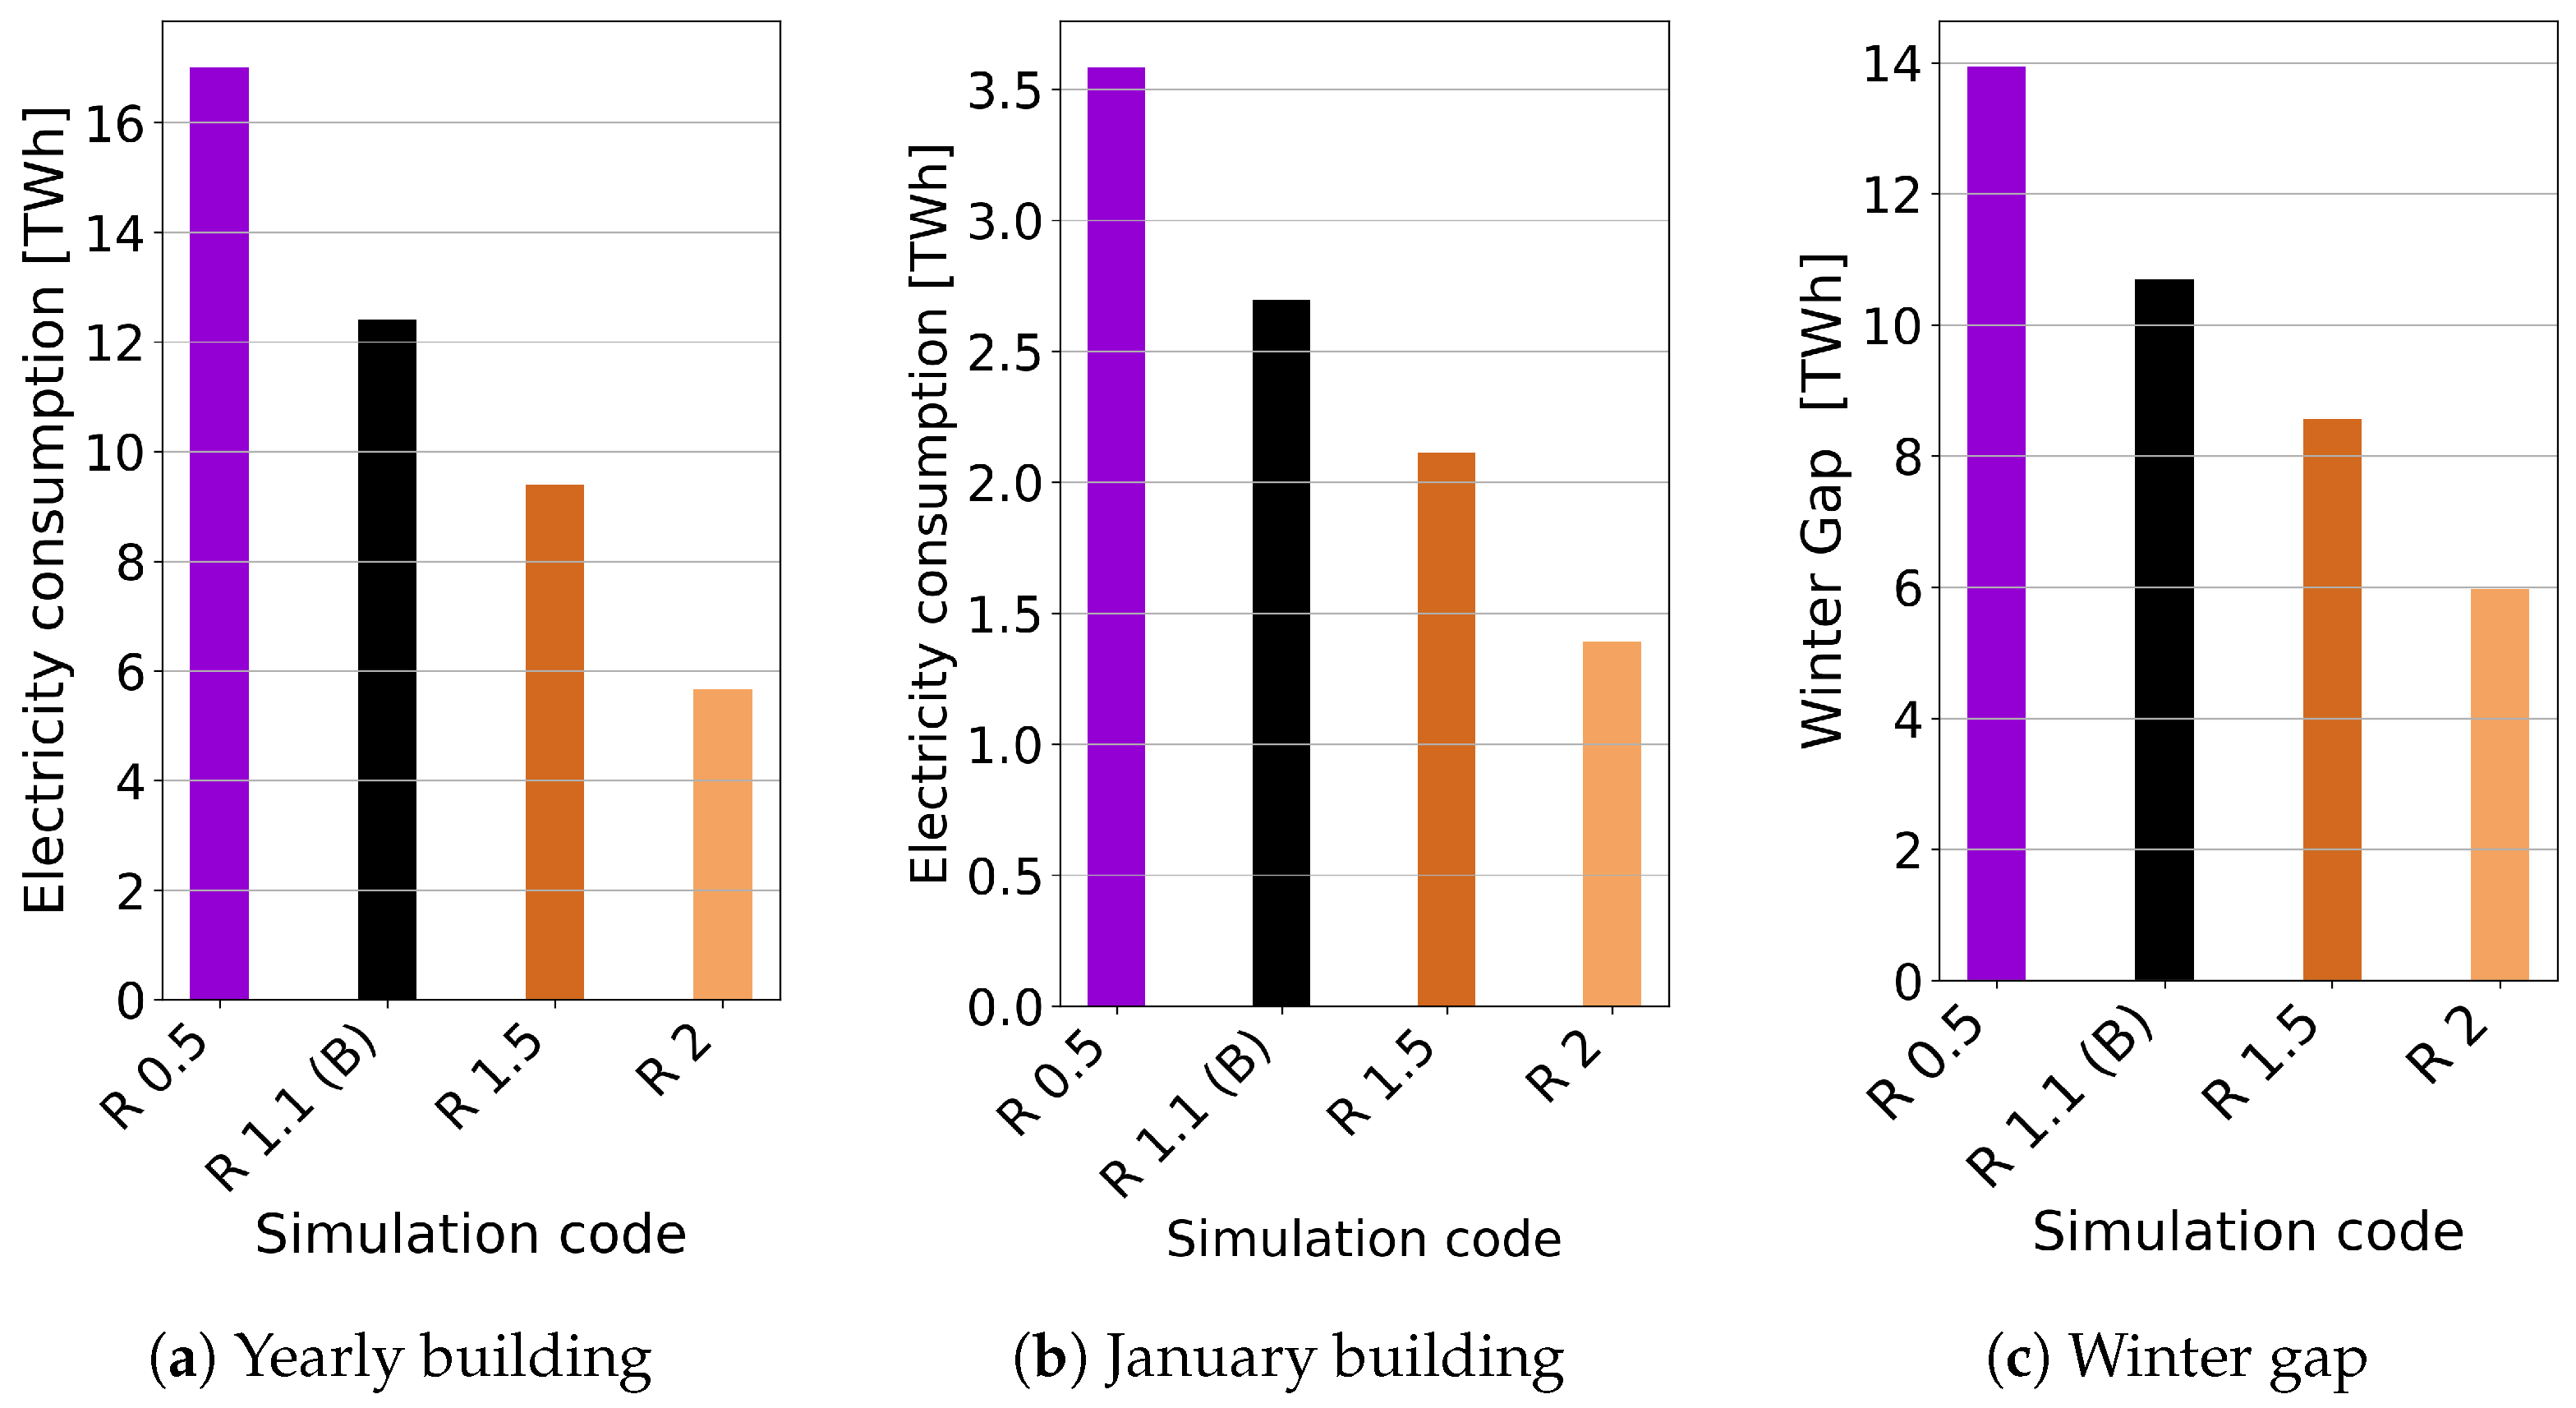
The current renovation rate does not even reach the 1.1% that is set in the EP2050+ pathway. Sources show that the actual value is closer to 0.5%. Figure 9 shows the predicted electricity consumed in the building sector and the winter gap of the 12 scenarios that we showed earlier in Section 3.1 and Figure 7 and Figure 8, with the addition of a “R 0.5” scenario, where we use the parameters of the base scenario but simulate with only a 0.5% renovation rate. This addition is shown with a violet color bar on the left side of each figure.
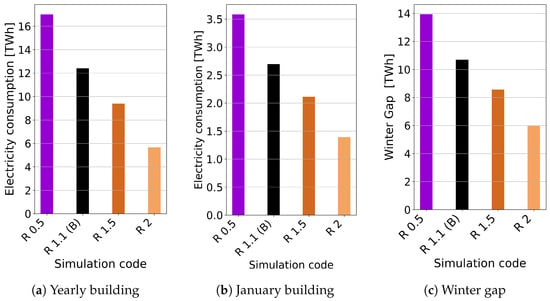
Figure 9.
(a) Electricity consumption related to building heat demand for the entire year of 2050; (b) electricity consumption related to building heat demand in January 2050; (c) winter gap; purple bars show the “R 0.5” scenario, where the base scenario is altered to have only a 0.5% yearly renovation rate.
If the renovation rate were kept at the current low level of 0.5%, it would mean that the yearly electricity consumption related to building heat demand would increase from 12.4 TWh to 17 TWh (37% increase), and the winter gap would increase from 10.7 TWh to 13.9 TWh (30% increase).
The PowerCheck code treats energetic building renovations as an overall parameter, and does not reflect how different parts of the building shell are renovated at different rates. For example, in reality, windows are renovated at a much faster rate than the 0.5%, while walls are likely to be renovated at a lower level than windows or even roofs. In the code, we categorize the buildings into four main categories, widely existing today, and a highly insulated “passive house” category. When we represent renovation, we move houses (or the equivalent energy reference area) from an older category to the current standard.
4. Discussion
The results highlight several consistent trends regarding the role of building-sector measures in shaping Switzerland’s future electricity balance. The renovation rate of the building shell emerges as the dominant driver for reducing both heat demand and the winter electricity gap. This reflects the large share of space heating in total demand, and the fact that shell renovations provide long-term cumulative savings. Although the performance gap might reduce the effect of renovations compared to expectations [9], our results underline the importance of accelerating renovation rates: delaying them or reducing ambitions in this field will inevitably lead to significantly more electricity demand in winter. This is in line with Nägeli et al. [10], who emphasize that without strong policy support, renovation rates will not reach targeted values, which may, in turn, have strong consequences for winter energy demand.
Domestic hot water recovery contributes only modestly when assessed in isolation, but becomes more relevant in combination with other measures. This echoes European-level reviews [6] that highlight the need for integrated packages of technical and behavioral measures to achieve meaningful reductions. Likewise, climate warming provides a visible reduction in heating demand, but cannot offset the structural need for building shell improvements.
The deployment of ground-source heat pumps reduces winter electricity demand relative to air-source systems, owing to higher and more stable COP values under cold conditions. This finding is consistent with field evidence showing that real-world performance of air-source heat pumps often falls below theoretical expectations due to defrosting and control issues [22]. While the impact of the technology mix is smaller than that of renovation, the choice of heat pump type significantly influences electricity demand in the winter months.
Comparison with national scenarios shows that our estimate of a 10.7 TWh winter gap in 2050 is close to the 9–10 TWh projected in EP2050+ [1]. Differences are largely attributable to assumptions regarding photovoltaic deployment and electrolysis. Other recent Swiss studies [12,14,19] similarly conclude that efficiency improvements in buildings are essential but insufficient, and must be combined with supply-side and flexibility measures such as alpine photovoltaics, imports, and storage. Projections of seasonal storage requirements further illustrate the possible complementary infrastructure solutions [23].
As with any system simulation, the results presented here are subject to uncertainties in both the model structure and the input data. The extended PowerCheck framework was designed to reproduce the main energy balances of the Swiss system and to provide a consistent representation of building heat demand within that context. Nevertheless, several input parameters remain uncertain. Hourly heat–load curves for the different building types are based on parameterized models that use typical building-physics assumptions and climate data rather than direct measurements, which can lead to deviations in absolute demand levels or seasonal profiles. Likewise, the heat pump performance is represented through temperature-dependent COP functions derived from theoretical relationships, while actual installations can deviate due to control settings or sizing effects. Occupant behavior is another important source of uncertainty: changes in heating practices, temperature set points, and domestic hot water use can substantially influence actual energy demand but are not explicitly modeled here. Simplifications were also introduced regarding renovation rates, building typologies, and the spatial uniformity of system shares across climate zones. Consequently, while the absolute energy values should be interpreted with caution, the relative differences between scenarios and the overall trends identified are considered robust for comparative analysis.
Beyond the demand-side measures analyzed here, distributed and flexible energy resources can also play an important complementary role. While rooftop photovoltaics and community-scale battery storage can help stabilize the grid by balancing day–night fluctuations and reducing local peak loads, their effect on the weekly winter electricity gap considered in this study is limited. Nevertheless, power-system flexibility measures, such as demand response, vehicle-to-grid (V2G) integration of electric vehicles, and enhanced trans-regional transmission capacity, can provide additional balancing potential and improve system resilience during the heating season.
Taken together, these results confirm that while targeted demand-side measures—particularly energetic renovation of the building shell—can meaningfully reduce the winter gap, they cannot eliminate it entirely. Building-sector interventions, therefore, need to be embedded within a broader strategy that includes additional supply-side resources and flexibility solutions—e.g., seasonal heat storage [23]—to ensure security of supply in a decarbonized Swiss energy system.
5. Conclusions
In this paper, we study various measures to reduce the heat demand of the Swiss building stock and assess their impact on electricity consumption and the projected winter electricity gap in 2050. Using the PowerCheck tool, we simulate different scenarios based on the Energy Perspectives 2050+ (EP2050+) developed by the Swiss Federal Office of Energy (SFOE), with a particular focus on aspects related to space heating and domestic hot water demand. Our model classifies each building into one of 48 current (and 60 potential future) categories based on climate region, usage type, and insulation standard, allowing for a detailed bottom-up representation of the building stock.
From the base scenario, we explore the impact of several key parameters: (i) the energetic renovation rate of the building shell, (ii) the rate of warm water heat recovery, (iii) the share of ground-source heat pumps vs. air source heat pumps, and (iv) future ambient temperature changes due to climate change.
We analyze how these factors influence annual and seasonal building heat demand, electricity consumption, and ultimately the size of the winter gap in electricity.
Our findings show that increasing the energetic renovation rate of buildings is by far the single most effective measure to reduce the winter electricity deficit. In the EP2050+ base scenario, we estimate the winter gap to be approximately 10.7 TWh. This can be reduced to around 6 TWh, corresponding to a 44% decrease, when multiple measures are implemented in combination, including higher renovation rates and increased deployment of ground-source heat pumps instead of air-source heat pumps. However, almost the same reduction in the winter gap can be achieved by a 2% per annum energetic renovation rate of the building shells alone. Conversely, if the energetic renovation rate of the shell is only 0.5%, the winter gap may increase to 13.9 TWh, a 30% rise compared to the base case, and more than doubling the winter gap compared to a renovation rate of 2%.
These results highlight the significant influence of building sector measures on seasonal electricity dynamics in Switzerland, and, in particular, the energetic renovation rate of the building shell. While imports and storage technologies will continue to play an important role, reducing heating demand through efficiency improvements offers a highly effective, immediate, and scalable strategy. Although this study focuses on Switzerland, the methods and general findings are transferable to other European countries with comparable climatic conditions, building typologies, and renovation challenges. The quantitative results—such as the absolute size of the winter gap—are country-specific, but the qualitative insights regarding the dominant influence of renovation rates, the role of ground-source heat pumps, and the impact of climate warming on heating demand are broadly applicable across temperate and cold-climate regions of Europe. To ensure a secure and decarbonized energy supply, it will be essential to accelerate energetic renovations of buildings and support electrification in the heating sector through sustained policy and investment efforts.
Author Contributions
Conceptualization, K.K. and M.H.; methodology, K.K. and M.H.; software, K.K., M.F. and B.M.; validation, K.K. and M.H.; formal analysis, K.K. and M.H.; investigation, K.K. and M.H.; resources, M.H. and B.M.; data curation, K.K.; writing—original draft preparation, K.K.; writing—review and editing, M.H., M.F. and B.M.; visualization, K.K.; supervision, M.H.; project administration, K.K.; funding acquisition, K.K., M.H. and B.M. All authors have read and agreed to the published version of the manuscript.
Funding
Funding from the Interessengemeinschaft Power-to-X (IG PtX) has been contributing to the analysis carried out in this study.
Data Availability Statement
The simulations presented in this study were conducted using an internal version of the PowerCheck tool, which was further developed beyond the publicly available version at https://powercheck.ch/ (accessed on 2 May 2025). The original data presented in the study are openly available in the GWR database: https://www.housing-stat.ch/de/index.html (accessed on 2 May 2025).
Acknowledgments
The authors thank the Swiss Federal Statistical Office for free access to the GWR database. We thank Marcel Troxler for his contributions to the Swiss climate zone distribution. Funding from the IG PtX has been contributing to the analysis carried out in this study.
Conflicts of Interest
The authors declare no conflicts of interest.
Appendix A. Building Heat Load Calculation
The heat transfer from the (heated) building rooms to the outside was modeled taking into account heat transfer through the roof (), the windows (), the walls () and the floor (), plus heat losses through ventilation (, active or passive, i.e., including air-leakages). The driving force for these heat transfers is the temperature difference between the inside space (room) and the ambient (outdoor) temperature, the temperature difference between the inside space and the core temperature of the solid wall (wall), and the temperature difference between the inside space and the floor (floor). Table A1 describes the parameters used in the calculation of the building heat loads.
The heat transfer is calculated as follows:
where
- is the volume of the inside rooms in m3;
- is the total air exchange per volume of the rooms and per hour in (shown as ventilation rates in Table A1); and
- is the specific heat capacity of air at 20 °C: .

Table A1.
Specific parameters used in the building heat demand calculation for each building usage and insulation standard category.
Table A1.
Specific parameters used in the building heat demand calculation for each building usage and insulation standard category.
| Single Family House | |||||
| Before 1960 | 1961–1980 | 1981–2000 | After 2001 | Passiv | |
| Internal gain (W) | 280 | 280 | 280 | 280 | 280 |
| Solar gain factor | 0.18 | 0.18 | 0.18 | 0.18 | 0.18 |
| Heating limit (°C) | 18 | 18 | 16 | 14 | 14 |
| /m2K) | 3 | 2 | 1.5 | 1 | 0.7 |
| /m2K) | 1.43 | 1.43 | 1.43 | 1.43 | 1.43 |
| /m2K) | 1.8 | 1 | 0.4 | 0.18 | 0.1 |
| /m2K) | 0.7 | 0.4 | 0.2 | 0.15 | 0.1 |
| /m2K) | 0.28 | 0.26 | 0.2 | 0.1 | 0.05 |
| (m2) | 23 | 23 | 23 | 23 | 23 |
| (m2) | 180 | 180 | 180 | 180 | 180 |
| (m2) | 81 | 81 | 81 | 81 | 81 |
| /Energy reference area (m2) | 140 | 140 | 140 | 140 | 140 |
| volume (m3) | 390 | 390 | 390 | 390 | 390 |
| Infiltration rate (1/h) | 0.4 | 0.4 | 0.15 | 0.05 | 0.01 |
| Window ventilation rate (1/h) | 0.1 | 0.1 | 0.25 | 0 | 0 |
| Controlled ventilation rate (1/h) | 0 | 0 | 0 | 0.08 | 0.08 |
| Multi Family House | |||||
| Before 1960 | 1961–1980 | 1981–2000 | After 2001 | Passiv | |
| Internal gain (w) | 2522 | 2522 | 2522 | 2522 | 2522 |
| Solar gain factor | 0.18 | 0.18 | 0.18 | 0.18 | 0.18 |
| Heating limit (°C) | 18 | 18 | 16 | 14 | 14 |
| /m2K) | 3 | 2 | 1.5 | 1 | 0.7 |
| /m2K) | 1.43 | 1.43 | 1.43 | 1.43 | 1.43 |
| /m2K) | 1.8 | 1 | 0.4 | 0.18 | 0.1 |
| /m2K) | 0.7 | 0.4 | 0.2 | 0.15 | 0.1 |
| /m2K) | 0.4 | 0.087 | 0.067 | 0.033 | 0.017 |
| (m2) | 167 | 167 | 167 | 167 | 167 |
| (m2) | 666 | 666 | 666 | 666 | 666 |
| (m2) | 390 | 390 | 390 | 390 | 390 |
| /Energy reference area (m2) | 1174 | 1174 | 1174 | 1174 | 1174 |
| volume (m3) | 2548 | 2548 | 2548 | 2548 | 2548 |
| Infiltration rate (1/h) | 0.4 | 0.4 | 0.15 | 0.05 | 0.01 |
| Window ventilation rate (1/h) | 0.1 | 0.1 | 0.25 | 0 | 0 |
| Controlled ventilation rate (1/h) | 0 | 0 | 0 | 0.08 | 0.08 |
Thermal capacities of the room () with its furniture and inside walls, as well as of the outside walls (), are taken into account in order to add inertia and dampen response. Since losses through the outside wall are calculated in two steps as heat transfer from the room to the core of the wall and then from the core of the wall to the outside, the core temperature of the wall is calculated from both heat transfers within a timestep and the core temperature of the previous timestep. All calculations are made on an hourly basis.
where and
Passive solar gains were estimated with a rather simple approach of multiplying the window area of the building by the horizontal irradiance times a factor (shown in Table A1). While not being completely accurate, this procedure has the advantage that it can be applied without knowing the building orientation or particular shading situations of window areas, and it provides for a good correlation between hours and intensity of sunshine and solar gains in general.
Appendix B. Simulation Parameters

Table A2.
Heating source distribution for single-family house (SFH), multi-family house (MFH), and domestic hot water (DHW) in the reference year and model year, 2019 and 2050, respectively. All values are in %.
Table A2.
Heating source distribution for single-family house (SFH), multi-family house (MFH), and domestic hot water (DHW) in the reference year and model year, 2019 and 2050, respectively. All values are in %.
| Heating Source | SFH | MFH | DHW | |||
|---|---|---|---|---|---|---|
| 2019 | 2050 | 2019 | 2050 | 2019 | 2050 | |
| District Heating | 2.2 | 10.0 | 12.9 | 31.0 | 5.0 | 29.0 |
| Electric | 7.5 | 0.0 | 1.8 | 0.0 | 30.0 | 0.0 |
| Oil | 40.0 | 0.0 | 39.0 | 0.0 | 28.0 | 0.0 |
| Gas | 13.8 | 4.0 | 30.5 | 7.0 | 24.0 | 0.0 |
| Wood | 17.3 | 4.0 | 4.0 | 2.0 | 4.0 | 5.0 |
| Heat Pumps | 18.8 | 81.0 | 11.5 | 59.0 | 9.0 | 37.0 |
| Other | 0.4 | 1.0 | 0.3 | 1.0 | 0.0 | 29.0 |
Appendix C. Ground Source Heat Pump Temperatures
Figure A1 shows the simulated ground-source temperature hourly time series that were used in the simulations. We use higher temperatures for multi-family houses than for single-family houses to represent the differences in the pattern of their long-term cooling. The PowerCheck simulation is concerned only with the model year in question (for example, 2050), and it is not known how long a borehole field has already been in use before the start of the simulation.
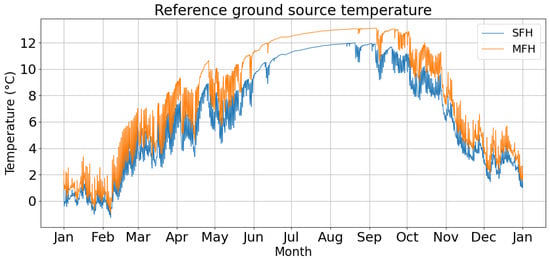
Figure A1.
Hourly ground temperature used as input for the ground-source heat pumps. The blue curve marks the values used for single-family houses (SFH) and the orange for multi-family houses (MFH).
Figure A1.
Hourly ground temperature used as input for the ground-source heat pumps. The blue curve marks the values used for single-family houses (SFH) and the orange for multi-family houses (MFH).
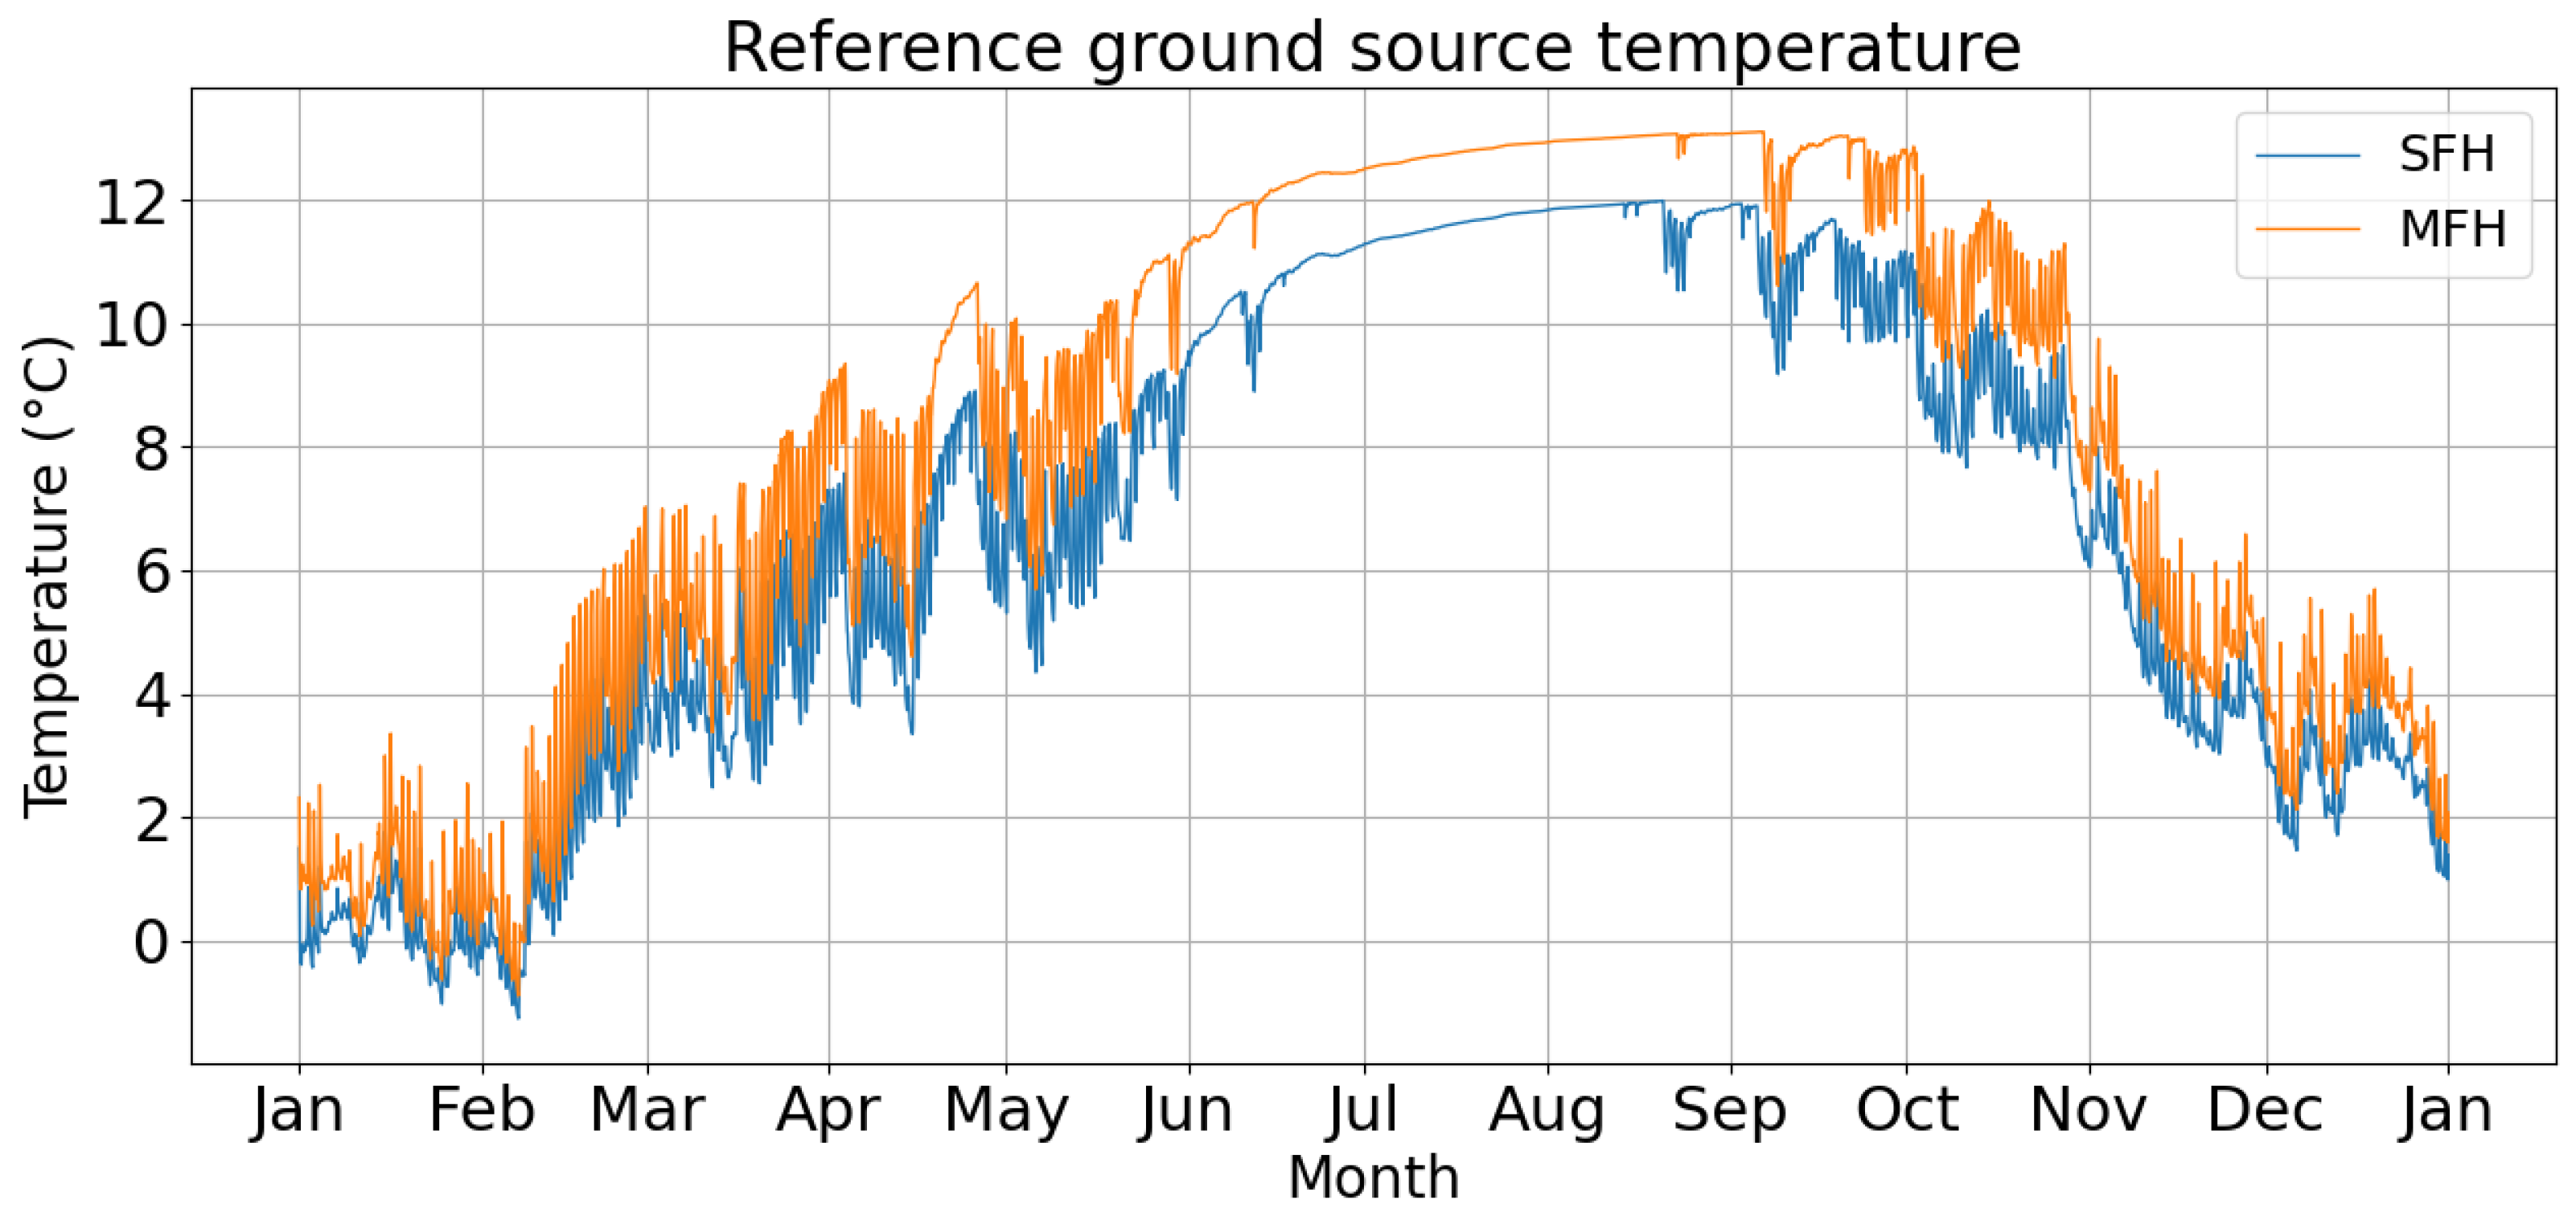
To account for borehole field over-sizing, the simulation increases the ground-source temperature profiles by 2 °C. This adjustment reflects the observed practice in field studies, where borehole fields are often dimensioned beyond the minimum requirements specified by the Swiss standard SIA 384/6 [31], resulting in higher ground temperatures than those predicted by a just-adequate design.
Appendix D. Calculation of COP
Appendix D.1. General Definitions
The absolute Kelvin temperatures of the refrigerant in the evaporator () and condenser () are calculated by adding the temperature losses of the respective heat exchangers to the source (inlet) and sink (outlet) temperatures:
where
- K (absolute temperature conversion);
- is the evaporator inlet temperature;
- is the condenser outlet temperature;
- is the temperature loss in the heat exchanger;
- K;
- K.
The temperature lift of the refrigerant () between the evaporating temperature and the condensing temperature is based on the above calculated temperatures, but at the same time not allowed to be lower than 15 K:
A minimum temperature difference of 15 K is used to prevent unreasonably high efficiency values that are not observed in practice.
The Carnot efficiency of the heat pump is then calculated as
The final Coefficient of Performance is yields
where
- is the heat pump’s efficiency factor;
- ;
- .
The supply temperatures for space heating in multi-family houses that result from ideal heating curve calculations are increased by five degrees. This is to account for the behavior of heat pumps in multi-family houses, where the highest request of comfort and room temperature of a single user often determines the setting of the heating curve for the whole building.
Appendix D.2. Electrical Power Calculation
The electrical power required by the heat pump is computed as follows:
Air-source heat pumps
where is the heat supplied by the condenser. The reduction in the COP by 0.5 when the temperature is below 5 °C ensures a performance correction, and accounts for possible de-frosting activities that the heat pump has to perform to function correctly.
Ground-source heat pumps
where is the heat supplied by the condenser. Ground-source heat pumps are not affected by low outside temperatures.
References
- Swiss Federal Office of Energy. Energieperspektiven 2050+. Volkswirtschaftliche Auswirkungen—Zusammenfassung der Wichtigsten Ergebnisse. 2022. Available online: https://www.bfe.admin.ch/bfe/de/home/politik/energieperspektiven-2050-plus.html (accessed on 2 May 2025).
- International Energy Agency (IEA). The Future of Heat Pumps; International Energy Agency (IEA): Paris, France, 2022; Available online: https://www.iea.org/reports/the-future-of-heat-pumps (accessed on 2 May 2025).
- Berger, M.; Worlitschek, J. The link between climate and thermal energy demand on national level: A case study on Switzerland. Energy Build. 2019, 202, 109372. [Google Scholar] [CrossRef]
- EnergieSchweiz. Powercheck. Available online: https://powercheck.ch/ (accessed on 2 May 2025).
- Grubler, A.; Wilson, C.; Bento, N.; Boza-Kiss, B.; Krey, V.; McCollum, D.L.; Rao, N.D.; Riahi, K.; Rogelj, J.; De Stercke, S.; et al. A low energy demand scenario for meeting the 1.5 °C target and sustainable development goals without negative emission technologies. Nat. Energy 2018, 3, 515–527. [Google Scholar] [CrossRef]
- Economidou, M.; Atanasiu, B.; Despret, C.; Maio, J.; Nolte, I.; Rapf, O.; Laustsen, J.; Ruyssevelt, P.; Staniaszek, D.; Strong, D.; et al. Europe’s Buildings Under the Microscope: A Country-by-Country Review of the Energy Performance of Buildings; Buildings Performance Institute Europe BPIE: Brussels, Belgium, 2011. [Google Scholar]
- Thrampoulidis, E.; Hug, G.; Orehounig, K. Approximating optimal building retrofit solutions for large-scale retrofit analysis. Appl. Energy 2023, 333, 120566. [Google Scholar] [CrossRef]
- Vulić, N.; Eggimann, S.; Sulzer, M.; Orehounig, K. National building stock model for evaluating the impact of different retrofit measures. J. Physics Conf. Ser. 2023, 2600, 032004. [Google Scholar] [CrossRef]
- Schneider, S.; Hollmuller, P.; Strat, P.L.; Khoury, J.; Patel, M.; Lachal, B. Spatial–temporal analysis of the heat and electricity demand of the Swiss building stock. Front. Built Environ. 2017, 3, 53. [Google Scholar] [PubMed]
- Nägeli, C.; Jakob, M.; Catenazzi, G.; Ostermeyer, Y. Towards agent-based building stock modeling: Bottom-up modeling of long-term stock dynamics affecting the energy and climate impact of building stocks. Energy Build. 2020, 211, 109763. [Google Scholar] [CrossRef]
- Schneeberger, S.; Meister, C.; Schuetz, P. Estimating the heating energy demand of residential buildings in Switzerland using only public data. Energy Build. 2025, 347, 116371. [Google Scholar] [CrossRef]
- Panos, E.; Kannan, R.; Hirschberg, S.; Kober, T. An assessment of energy system transformation pathways to achieve net-zero carbon dioxide emissions in Switzerland. Commun. Earth Environ. 2023, 4, 157. [Google Scholar] [CrossRef] [PubMed]
- Marcucci, A.; Guidati, G.; Giardini, D. Probabilistic Assessment of the Swiss Energy Strategy—Scenario Analysis with the SES-ETH Model; ETH Zurich: Zurich, Switzerland, 2021. [Google Scholar]
- Mellot, A.; Moretti, C.; Tröndle, T.; Patt, A. Mitigating future winter electricity deficits: A case study from Switzerland. Energy Convers. Manag. 2024, 309, 118426. [Google Scholar] [CrossRef]
- Frank, T. Climate change impacts on building heating and cooling energy demand in Switzerland. Energy Build. 2005, 37, 1175–1185. [Google Scholar] [CrossRef]
- Christenson, M.; Manz, H.; Gyalistras, D. Climate warming impact on degree-days and building energy demand in Switzerland. Energy Convers. Manag. 2006, 47, 671–686. [Google Scholar] [CrossRef]
- Mutschler, R.; Rüdisüli, M.; Heer, P.; Eggimann, S. Benchmarking cooling and heating energy demands considering climate change, population growth and cooling device uptake. Appl. Energy 2021, 288, 116636. [Google Scholar] [CrossRef]
- Rüdisüli, M.; Teske, S.L.; Elber, U. Impacts of an increased substitution of fossil energy carriers with electricity-based technologies on the Swiss electricity system. Energies 2019, 12, 2399. [Google Scholar] [CrossRef]
- Roca-Puigròs, M.; Billy, R.G.; Gerber, A.; Wäger, P.; Müller, D.B. Pathways toward a carbon-neutral Swiss residential building stock. Build. Cities 2020, 1, 579–593. [Google Scholar] [CrossRef]
- Schnidrig, J.; Li, X.; Slaymaker, A.; Nguyen, T.; Maréchal, F. Regionalisation in high share renewable energy system modelling. In Proceedings of the 2022 IEEE Power & Energy Society General Meeting (PESGM), Denver, CO, USA, 17–21 July 2022; pp. 1–5. [Google Scholar]
- Li, X.; Damartzis, T.; Stadler, Z.; Moret, S.; Meier, B.; Friedl, M.; Maréchal, F. Decarbonization in complex energy systems: A study on the feasibility of carbon neutrality for Switzerland in 2050. Front. Energy Res. 2020, 8, 549615. [Google Scholar] [CrossRef]
- Brudermueller, T.; Potthoff, U.; Fleisch, E.; Wortmann, F.; Staake, T. Estimation of energy efficiency of heat pumps in residential buildings using real operation data. Nat. Commun. 2025, 16, 2834. [Google Scholar] [CrossRef] [PubMed]
- International Association for Energy Economics (IAEE). Seasonal Energy Storage Outlook for Central Europe: 2025 Conference Proceedings. In Proceedings of the IAEE 2025 Conference, Paris, France, 15–18 June 2025. [Google Scholar]
- Connolly, D.; Lund, H.; Mathiesen, B.V.; Leahy, M. A review of computer tools for analysing the integration of renewable energy into various energy systems. Appl. Energy 2010, 87, 1059–1082. [Google Scholar] [CrossRef]
- Pfenninger, S.; Hawkes, A.; Keirstead, J. Energy systems modeling for twenty-first century energy challenges. Renew. Sustain. Energy Rev. 2014, 33, 74–86. [Google Scholar] [CrossRef]
- Bundesamt für Energie (BFE). Analyse des Schweizerischen Energieverbrauchs 2000–2023 nach Verwendungszwecken, October 2024. Available online: https://www.bfe.admin.ch/bfe/de/home/versorgung/statistik-und-geodaten/energiestatistiken/energieverbrauch-nach-verwendungszweck.exturl.html/aHR0cHM6Ly9wdWJkYi5iZmUuYWRtaW4uY2gvZGUvcHVibGljYX/Rpb24vZG93bmxvYWQvMTE4OTg=.html (accessed on 2 May 2025).
- Federal Statistical Office. Federal Register of Buildings and Dwellings (RBD); Federal Statistical Office: Neuchâtel, Switzerland, 2019. [Google Scholar]
- Schluck, T.; Streicher, K.N.; Mennel, S. Statistical modelling of the energy reference area based on the Swiss building stock. J. Phys. Conf. Ser. 2019, 1343, 012031. [Google Scholar] [CrossRef]
- Swiss Federal Office of Energy. Der Energieverbrauch der Privaten Haushalte 2000–2022; Swiss Federal Office of Energy: Bern, Switzerland, 2023. [Google Scholar]
- Miara, M.; Günther, D.; Langner, R.; Helmling, S.; Wapler, J. 10 Years of Heat Pumps Monitoring in Germany: Outcomes of Several Monitoring Campaigns. From Low-Energy Houses to Un-Retrofitted Single-Family Dwellings. In Proceedings of the 12th IEA Heat Pump Conference, Rotterdam, The Netherlands, 15–18 May 2017. [Google Scholar]
- SIA 384/6; Borehole Heat Exchangers. SIA: Zurich, Switzerland, 2010; (In French, German and Italian).
Disclaimer/Publisher’s Note: The statements, opinions and data contained in all publications are solely those of the individual author(s) and contributor(s) and not of MDPI and/or the editor(s). MDPI and/or the editor(s) disclaim responsibility for any injury to people or property resulting from any ideas, methods, instructions or products referred to in the content. |
© 2025 by the authors. Licensee MDPI, Basel, Switzerland. This article is an open access article distributed under the terms and conditions of the Creative Commons Attribution (CC BY) license (https://creativecommons.org/licenses/by/4.0/).

