1. Introduction
The latest generation of energy power systems is defined by the extensive grid-connected operation of power electronic devices. The multi-scale cascade and switching control attributes of power electronic devices have fundamentally altered the physical coupling mechanism, leading to substantial changes in the operational mode and dynamic characteristics of the power system [
1,
2]. When the power system is disturbed, it displays intricate characteristics such as time–frequency coupling and multiple superposition. It triggers periodic fluctuations in electrical quantities over time. The frequency oscillations range from a few Hz to several thousand Hz. This dynamic phenomenon is referred to as the power system wide-range-frequency oscillation [
3]. In recent years, numerous wide-range-frequency oscillation incidents in power systems have transpired both domestically and internationally [
4,
5]. Consequently, wide-range-frequency oscillation has emerged as a novel challenge jeopardizing the safe and stable functioning of power systems.
The precise collecting of wide-range-frequency oscillation parameter data is a crucial method for mitigating wide-range-frequency oscillation in power systems. Nonetheless, broad-frequency oscillations manifest in several modes contingent upon alterations in the source network’s operational mode and have pronounced nonlinear properties [
6]. Simultaneously, the frequency of wide-band-frequency oscillations in power systems also varies with changes in grid operating modes and the operating points of power electronic equipment. It results in frequency deviation phenomena exhibiting pronounced time-varying characteristics [
7]. Furthermore, the current characterization methods are inadequate for accurately capturing all oscillation modes. The pronounced nonlinearity and significant time-varying attributes of wide-range-frequency oscillation signals in contemporary energy power systems present problems for the precise detection of oscillatory parameters across a broad frequency spectrum.
There are two main types of wide-range-frequency oscillation parameter identification methods. The first involves classifying the original signal using filters. Signals are divided into low-frequency oscillations, sub-synchronous oscillations, super-synchronous oscillations, and high-frequency oscillations based on frequency bands. Parameter identification is then performed on the oscillation signals within each band. This approach results in the loss of original signal information. This method results in the loss of original signal information. The second is to directly identify the wide-range-frequency oscillation parameters of the original signal. This method has emerged in recent years and has attracted widespread attention from scholars. Reference [
8] discusses different modal parameter identification methods and analyzes the distinctions and characteristics of existing identification methods from the perspective of applicability. Reference [
9] proposes a wide-band-frequency oscillation identification method integrating ICEEMDAN and KPCAKAN. This method enables rapid and accurate identification of wide-band-frequency oscillation signals, achieving an identification rate of 99.73%. Currently, common signal parameter identification methods include fast Fourier transform (FFT) [
10], Prony transformation [
11], HHT transformation [
12], and synchronous compression wavelet transform (SST) [
13]. However, each method has its own scope of application and limitations. FFT and Prony transforms are used for linear stationary signal analysis. HHT can analyze nonlinear signal decomposition, decomposing non-stationary signals into multiple sub-signals with different frequency scales that are relatively stationary. Nevertheless, problems such as mode mixing and breakpoint effect exist during the decomposition process, affecting the identification results. SST can solve the problem of mode mixing in traditional modal decomposition by rearranging the traditional time–frequency spectrum, but the results are not ideal when processing signals with strong time-varying characteristics.
Variational Mode Decomposition (VMD) is an adaptive, non-recursive signal decomposition method [
14]. By selecting appropriate parameters, it can overcome issues inherent in traditional mode decomposition, such as mode aliasing, spurious modes, and low accuracy. It can retain the dynamic characteristics of the original signal and has excellent robustness [
15]. Reference [
16] proposed a wide-range-frequency oscillation signal estimation algorithm based on variational modal decomposition, which can accurately obtain the parameter information of wide-range-frequency oscillation signals. However, this method requires estimating the number of modal decompositions based on oscillation events before decomposition. Reference [
17] employs variational modal decomposition and Hilbert transform to identify modal parameters of synchronous oscillation components in synchronous phasors. Reference [
18] proposes a method for identifying power system oscillation parameters based on the combination of enhanced modal decomposition and Bayesian inference. The approach addresses the challenges in parameter identification caused by oscillation mode aliasing and noise interference in disturbance recording data from power systems. This method achieves robust and accurate modal parameter identification under conditions where the signal-to-noise ratio is greater than or equal to 10 dB. It demonstrates excellent noise resistance and uncertainty quantification capabilities. Reference [
19] employs the Black-winged Kite optimization algorithm to refine key parameters of the VMD method, enabling accurate extraction of modal components and transient parameters from broadband signals. Reference [
20] proposes an improved parameter identification method for CNN-LSTM neural networks. It addresses the challenge that strong nonlinearity and strong time-varying characteristics in wide-band-frequency oscillations make accurate parameter identification difficult. The improved CNN-LSTM achieves high recognition accuracy for both the frequency and damping factor of wide-band-frequency oscillations. It demonstrates outstanding advantages in handling issues such as frequency drift in wide-band-frequency oscillations and sudden changes in the damping factor. Reference [
21] proposes a method for identifying low-frequency oscillation modes in power systems based on deep learning and variational mode decomposition. In the aforementioned references, the parameters of VMD are determined using empirical values. Nevertheless, the decomposition performance of VMD is affected by the number of decomposition modes and the penalty factor. If the values of these two parameters are selected based on human experience, it may lead to suboptimal signal decomposition results.
Furthermore, the integration of the Yuan heuristic algorithm with VMD has emerged as a powerful approach. This method is employed to overcome the parameter selection challenge associated with VMD. Reference [
22] discusses the application of the whale optimization algorithm (WOA) in VMD parameter optimization. It proposes an ultra-short-term photovoltaic power forecasting method based on a hybrid model combining WOA, VMD, and sample-convolution interactive neural networks. Reference [
23] proposes a hybrid forecasting model that integrates VMD, the Sparrow Search Algorithm (SSA), and a Transformer-LSTM architecture. The model effectively captures the complex interactions between meteorological variables and photovoltaic power generation time series, achieving high-precision forecasting.
In response to the above issues and research trends, this paper proposes a method for identifying wide-range-frequency oscillation parameters in power systems based on parameter self-optimization variational modal decomposition. The main contributions are as follows:
- (1)
Adaptive optimization of the optimal mode and quadratic penalty factor of VMD is achieved by improving the particle swarm optimization (PSO) algorithm. The energy loss is used as the fitness function, and the search capability is improved by dynamically adjusting the inertia factor of the particle swarm algorithm.
- (2)
Based on the optimal number of modes obtained and the quadratic penalty factor, the original signal is decomposed using VMD. The effective mode components and noisy mode components are separated using the correlation coefficient method. Wavelet denoising technology is used to denoise the noisy modes, and denoising is completed through signal reconstruction.
- (3)
Verify the feasibility of the method proposed in this paper by constructing a wide-range-frequency oscillation simulation signal.
The structure of this paper is as follows:
Section 2 proposes a method for identifying wide-range-frequency oscillation parameters in power systems based on VMD;
Section 3 tests the performance of the proposed identification method;
Section 4 conducts simulation tests; and
Section 5 summarizes the entire paper.
2. Wide-Range-Frequency Oscillation Parameter Identification Method Based on VMD
2.1. VMD Principles
VMD is a signal decomposition method that can decompose complex nonlinear and non-stationary signals into multiple intrinsic mode functions (IMF). Assume that VMD can decompose the signal x(t) into p IMF, and the sum of p modal functions up(t) equals x(t). The VMD algorithm can separate two modes with similar frequencies and overcome the end effect and mode mixing issues in the signal decomposition process. The VMD algorithm consists of two parts: variational problem construction and solution. The specific process is as follows:
(1) Variational problem construction
Decompose the input signal
x(
t) into
p IMF components
up(
t). Through the Hilbert transform, its unilateral spectrum can be obtained, specifically:
where
denotes convolution.
Estimating the center frequency of each IMF component as
ωp, the spectrum of each mode
up(
t) is shifted to the corresponding baseband. The result is
where
ωp is the estimated center frequency.
This paper uses the L
2 norm criterion to estimate the bandwidth of each mode, and the VMD variational model is expressed as
where {
up} = {
u1,
u2,…,
up} is the set of modal functions. {
ωp} = {
ω1,
ω2,…,
ωp}is the set of modal center frequencies.
(2) Variational problem solving
To efficiently obtain the optimal solution of the VMD variational model in Formula (3), the Lagrange multiplication operator λ(
t) and the quadratic penalty function term α are introduced. The alternating direction multiplier method is used to solve the problem, alternately calculating and updating
upn+1 and
ωpn+1. The frequency domain iterative equation for mode
is obtained as follows:
The iterative equation for the center frequency
ωp is
where
is equivalent to the Wiener filter of the current
;
is equivalent to the center of gravity of the current modal function power spectrum. After iteration is complete, perform an inverse Fourier transform on
, where the real part is
up(
t).
2.2. VMD Parameter Optimization
Accurately predicting the number of wide-range-frequency oscillation modes in power systems remains a challenge, which poses a significant challenge for determining the mode number p in the VMD algorithm. When the number of modal decompositions is large, it causes over-decomposition and false components. When the number of modal decompositions is small, it is difficult to accurately extract the oscillation modes of the system and characterize the oscillation process. At the same time, the penalty factor α is crucial for ensuring signal reconstruction accuracy. Therefore, this paper proposes employing an improved particle swarm optimization algorithm to optimize the parameters p and α of the VMD algorithm. This approach enhances the recognition accuracy of wide-band-frequency oscillation signals.
For wide-range-frequency oscillation signal characteristics, we proposed using energy loss as the fitness function. By optimizing the boundary particle swarm and implementing an inertia weight calculation method that starts large and decreases over the search process, the algorithm’s search capability is enhanced. This approach simultaneously prevents premature convergence and avoids getting stuck in local optima. The specific process is as follows:
Step 1: Initialization. Based on the two parameters p and α of the VMD algorithm, set the particle swarm dimension D to 2 and the maximum iteration count to Kmax. Randomly select m particles within the feasible domain of this dimension and initialize the particle positions xi = (xi1, xi2) and velocities vi = (vi1, vi2).
Step 2: For each particle 2-dimensional combination, perform VMD calculation on the original signal to obtain the
pth modal function {
up}. Among them, the position and velocity of each particle are updated as follows:
where
k is the number of iterations.
i is the number of particles.
d is the spatial dimension.
r1 and
r2 are random numbers in the range [0, 1].
c1 and
c2 are the individual and global optimal position direction learning factors for the particle.
vid(
k) and
xid(
k) are the velocity and position of particle
i in the
d-dimensional space at the
kth iteration.
pid(
k) and
pgd(
k) are the optimal individual and global positions of particle
i in the
d-dimensional space at the
kth iteration.
w is the inertia weight.
By updating the particle positions and velocities, the fitness function value
Q(
upi) of each particle is calculated. In this paper, the minimum energy loss is selected as the fitness value to determine the optimal position of each particle and the global optimal position of the entire particle swarm. The fitness function is calculated as follows:
where
Ex is the spectral energy of the input signal
x(
t).
Ep is the energy of the spectral components of each mode after VMD decomposition.
The formulas for calculating
Ex and
Ep are as follows:
where
N is the spectrum length.
The smallest fitness value is selected as the optimal value, and the individual optimal position pi = (pi1, pi2) of the corresponding particle and the optimal position pw = (pw1, pw2) of the entire particle swarm are saved.
Step 3: Set the inertial weight. The inertial weight has a significant impact on improving the search results of the particle swarm algorithm and needs to be dynamically adjusted to improve search capabilities while avoiding getting stuck in local optima. The dynamic weight calculation formula is as follows:
where
wmax and
wmin are the maximum and minimum values of the inertial weight, respectively.
k is the number of iterations.
Kmax is the maximum number of iterations;
D is the decay factor, with a value of (0, 1).
To avoid premature convergence due to boundary issues during the search process, particles that exceed the boundary range are optimized. Set the position value of particles that fall within the boundary to the boundary value. At the same time, reverse the direction of the particles and multiply their velocity by a random number between [0, 1]. The specific calculation formula is as follows:
where
xid and
vid represent the position and velocity of particle
i in
d-dimensional space, respectively.
xmaxd and
xmind represent the position limits of the particle in
d-dimensional space.
Step 4: After updating the particle positions and velocities, the algorithm performs VMD calculations on the input signals to obtain the new fitness function values Q(upi(k + 1)) for each particle. These values are then used to update both the particle’s individual optimal position pi(k + 1) and the global optimal position pg(k + 1).
Step 5: Determine whether the number of iterations has reached the maximum value Kmax. If so, terminate the iteration and output the optimal modal decomposition p and quadratic penalty factor α. If not, return to Step 2 to continue optimization until the termination condition is met.
2.3. VDM Noise Rejection Method
In this paper, wavelet noise reduction technology is used to achieve high-precision identification of VMD. The specific steps are as follows:
Firstly, VMD is applied to decompose the noisy input signal, using the optimal mode decomposition number
K and the quadratic penalty factor
α obtained in
Section 2.2, to obtain
p intrinsic mode components {
up}.
Secondly, the correlation coefficient method is used to separate the effective modal component and the noisy modal component. The correlation coefficient
r between each modal component and the input signal is calculated as follows:
where
xi is the input signal.
is the average of the input signal.
n is the number of signal sampling.
According to the wavelet noise reduction technology, the wavelet correlation coefficient threshold
r0 is
where
rmax is the maximum value of the correlation coefficient in all modal components.
If any modal correlation coefficient
rj ≥
r0, then the corresponding modal is the effective modal group {
ue1,
ue2, …,
ueb}; if
rj ≤
r0, the corresponding mode is the noisy mode group {
un1,
un2, …,
unb}. When there is only one modal component in the noisy modal group, the modal component is directly eliminated. When the noisy modal group contains more than two modal components, the wavelet threshold de-noising technology is used for processing. In this paper, the wavelet basis function is db7, the decomposition level is 3, and the wavelet threshold
λ is
where
N is the signal length (number of data points).
σ is the noise standard deviation. The MAD estimation of the highest frequency coefficient (HH1) of wavelet decomposition is used as follows:
where
W1 is the highest frequency coefficient of wavelet decomposition.
When the wavelet coefficient is greater than the threshold value, the corresponding data is the effective mode, and the wavelet coefficient is retained. On the contrary, it is a noise signal, and the wavelet coefficient is discarded as follows:
The denoised modal group is {u′e1, u′e2, …, u′eb}.
Finally, the denoised modal group and the effective modal group are reconstructed to complete the noise reduction processing of the input signal. The calculation formula is as follows:
3. Algorithm Performance Analysis
This paper uses fitting wide-range-frequency oscillation signals to analyze the effectiveness of improved PSO-VMD identification of wide-range-frequency oscillation parameters. The fitting signal is shown in Equation (17).
where
Ai is the amplitude of the
ith mode.
fi is the frequency of the
ith mode.
φi is the phase of the
ith mode.
γi is the decay factor of the
ith mode.
Through stochastic free combinations of the modal parameters from Formula (1) and the superimposition of the signal, a substantial array of wide-frequency oscillation signals is generated. This study establishes the following ranges for the modal oscillation parameters: oscillation frequency fi is (1:1:1500) Hz, decay factor γi is (0:0.01:0.9), oscillation amplitude Ai is (0:0.01:1), and phase i is (0:1°:180°). A frequency of 2 kHz and a simulation time of 0.5 s were adopted. From the generated stochastic data, 1000 data sets conforming to the requirements for wide-range-frequency oscillation in power systems were chosen to provide the test set for this research.
A simulation signal containing six modal oscillations was stochastically selected from the data set to verify the effectiveness of the high-accuracy parameter identification method proposed in this paper. The parameters of the modal simulation signal are as follows: A1 = 0.98, A2 = 0.74, A3 = 0.62, A4 = 0.82, A5 = 0.23, A6 = 0.19; f1 = 3 Hz, f2 = 23 Hz, f3 = 74 Hz, f4 = 158 Hz, f5 = 495 Hz, f6 = 976 Hz; φ1 = 10°, φ2 = 31°, φ3 = 47°, φ4 = 73°, φ5 = 98°, φ6 = 122°; γ1 = 0.12, γ2 = 0.05, γ3 = 0.19, γ4 = 0.27, γ5 = 0.44, γ6 = 0.66.
To effectively verify the feasibility of the method proposed in this paper and ensure that it conforms to the characteristics of the measured data, Gaussian white noise
N1(
t) and random impulse noise
N2(
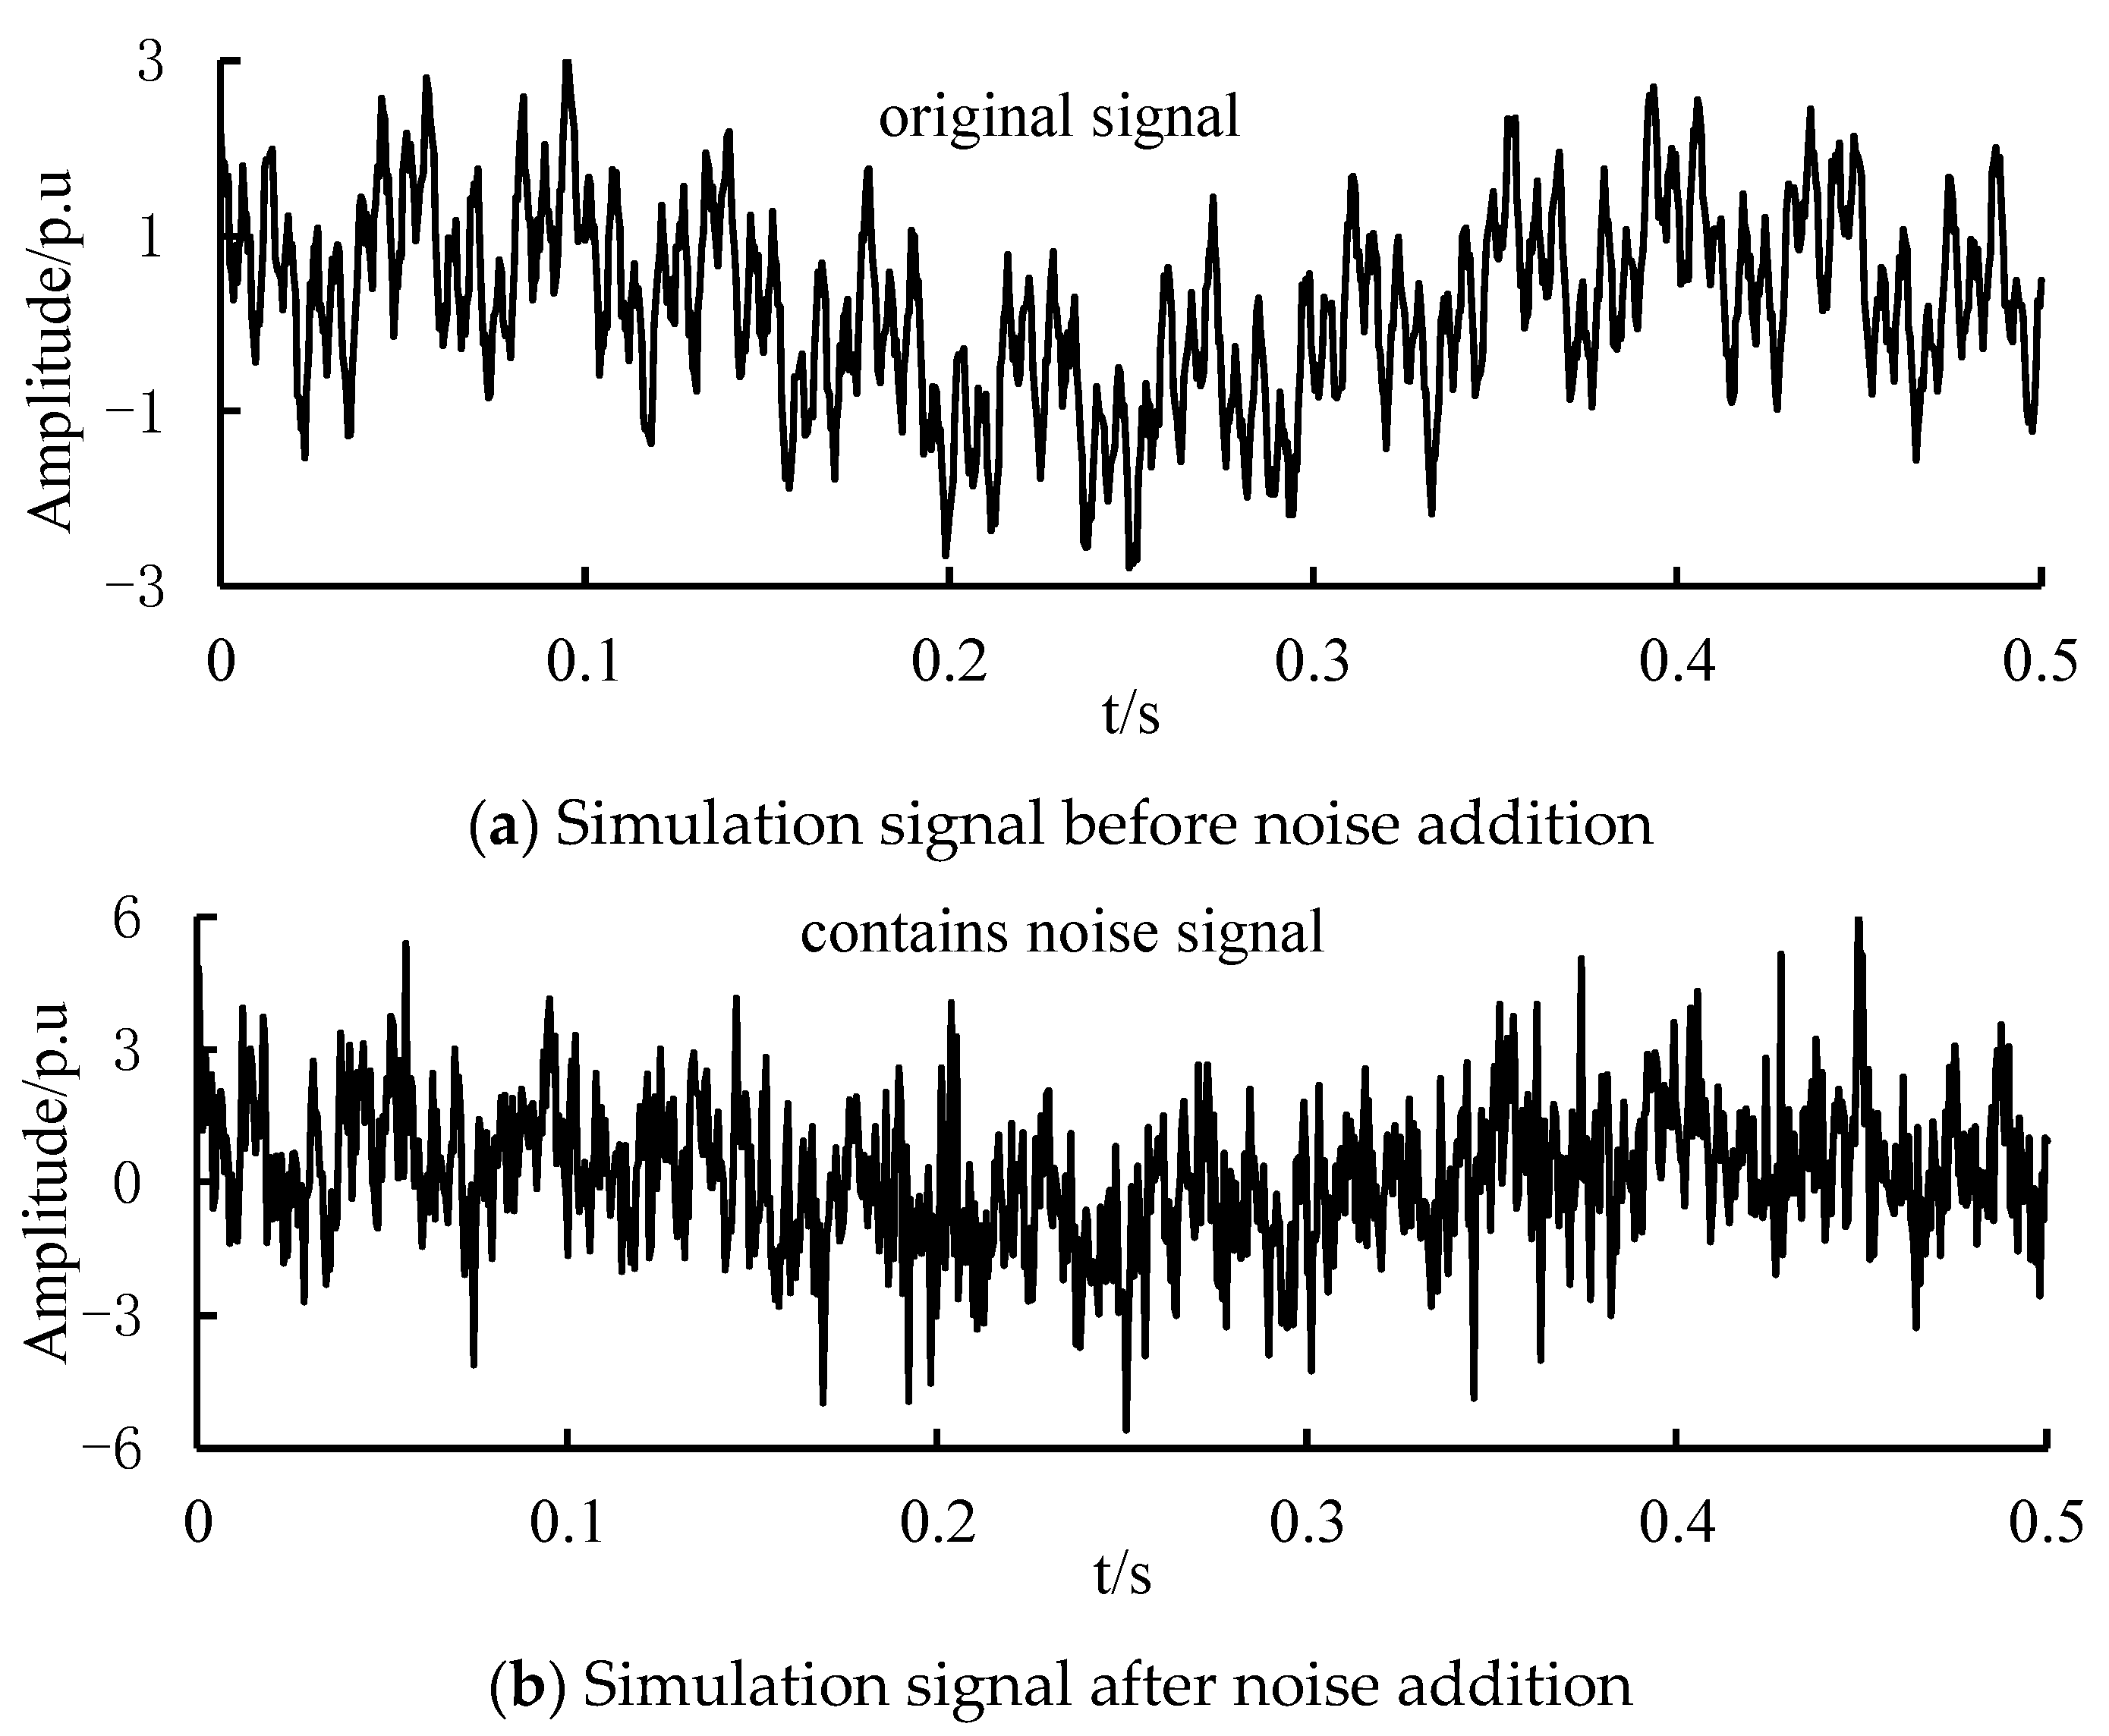
t) are added to the simulation signal. Among them, the Gaussian white noise signal is 1 dB, the amplitude of the random impulse noise is 4 times that of the background noise, and the coverage rate in the time domain is 6%. The simulation signals before and after adding noise are shown in
Figure 1.
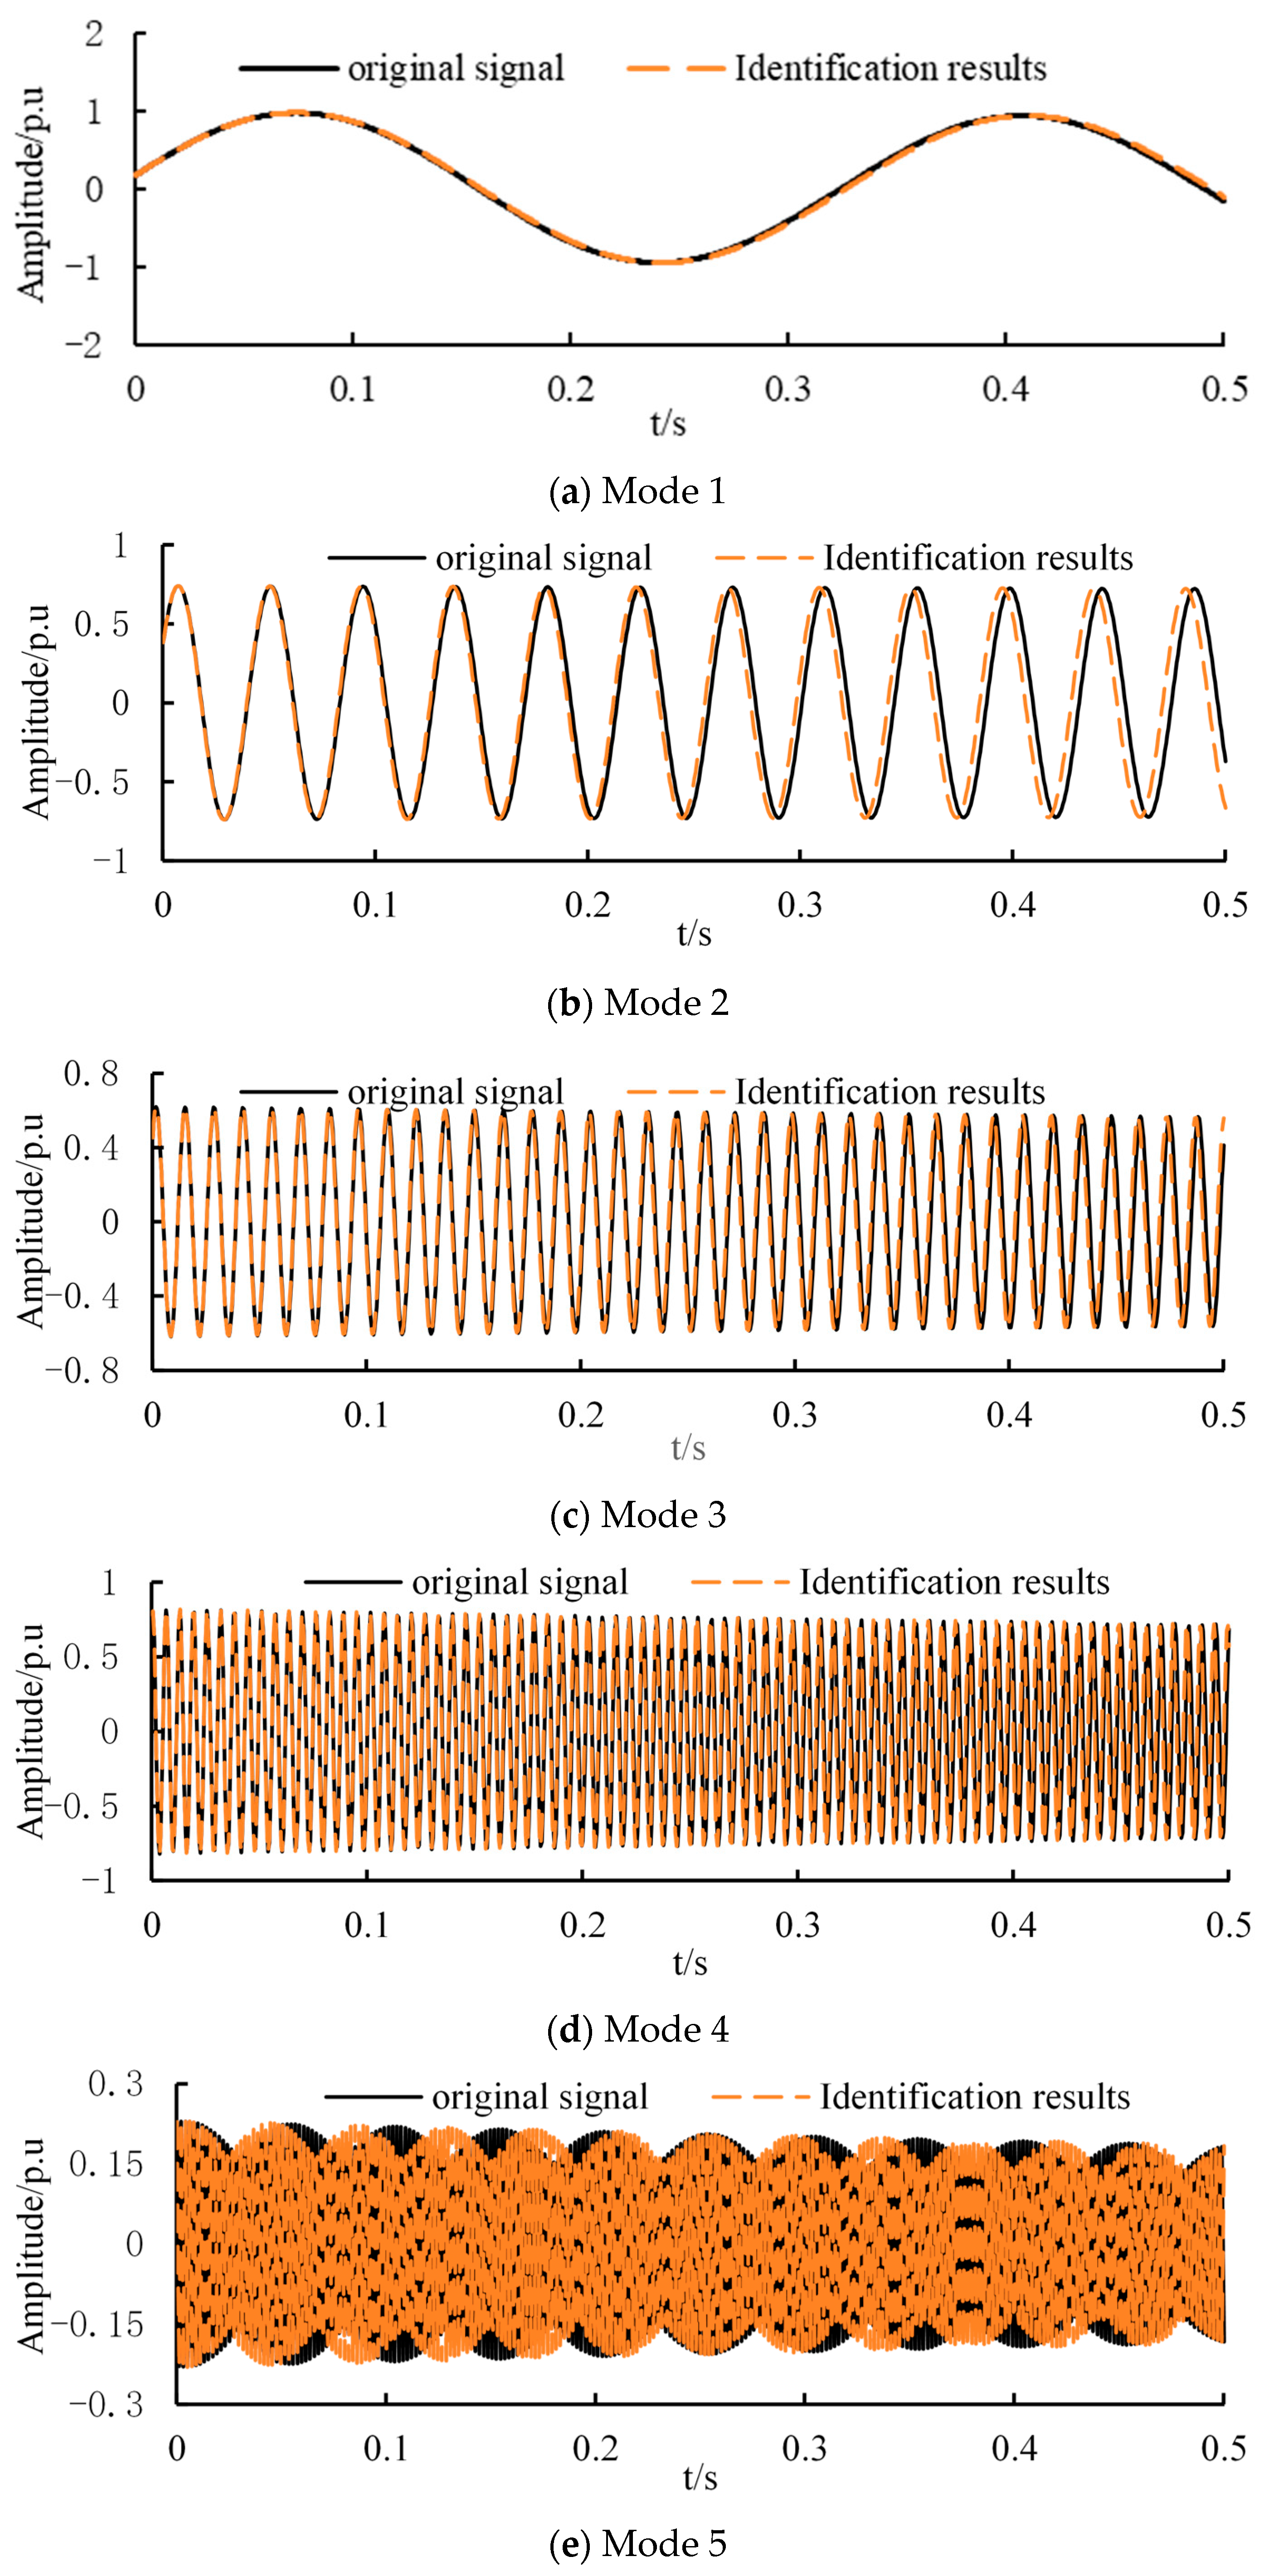
The VMD identification method proposed in this paper using the improved particle swarm optimization algorithm is used to perform modal decomposition and parameter identification on the simulation signal with noise shown in
Figure 1b. The maximum number of iterations is
Kmax = 100, the number of particles is
m = 50, the learning parameter is
c1 =
c2 = 0.05, and the spectrum length is
N = 6. The calculation results are shown in
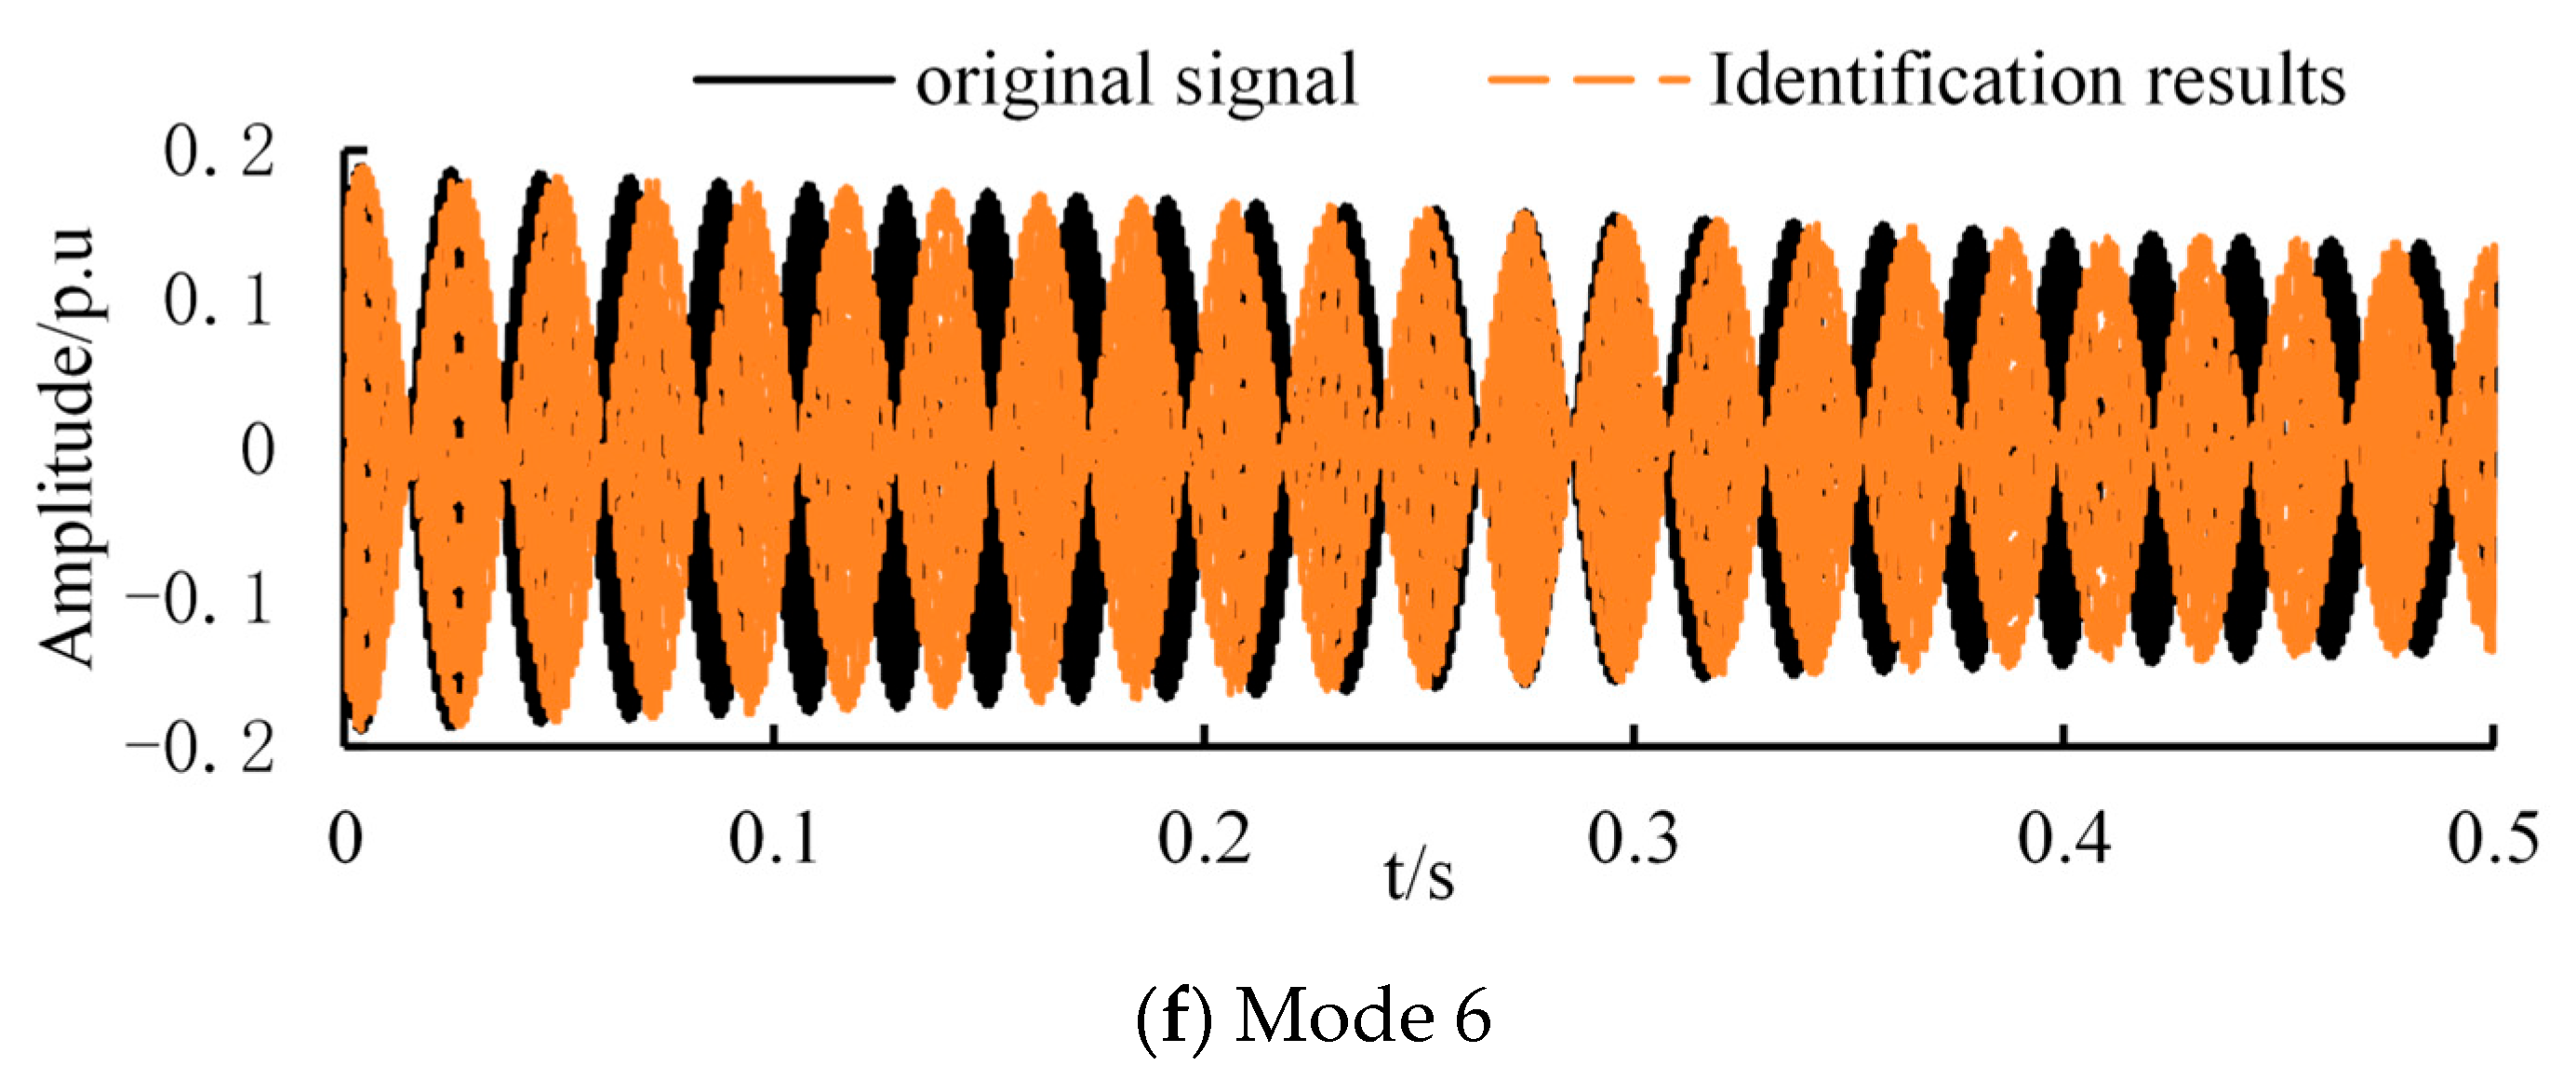
Figure 2.
As shown in
Figure 2, even for signals containing noise, six modes can be accurately identified, and the time domain distribution curves of each mode are basically consistent, which can significantly reduce the impact of noise signals on parameter identification. The parameter identification results are shown in
Table 1.
To validate the robustness of the proposed method, the identification performance under different noise intensities was evaluated for Equation (19), with all other parameters held constant. The specific results are shown in
Table 2. Meanwhile, while keeping other parameters constant, the recognition results for different signal lengths are shown in
Table 3.
As shown in
Table 2,
Table 3 and
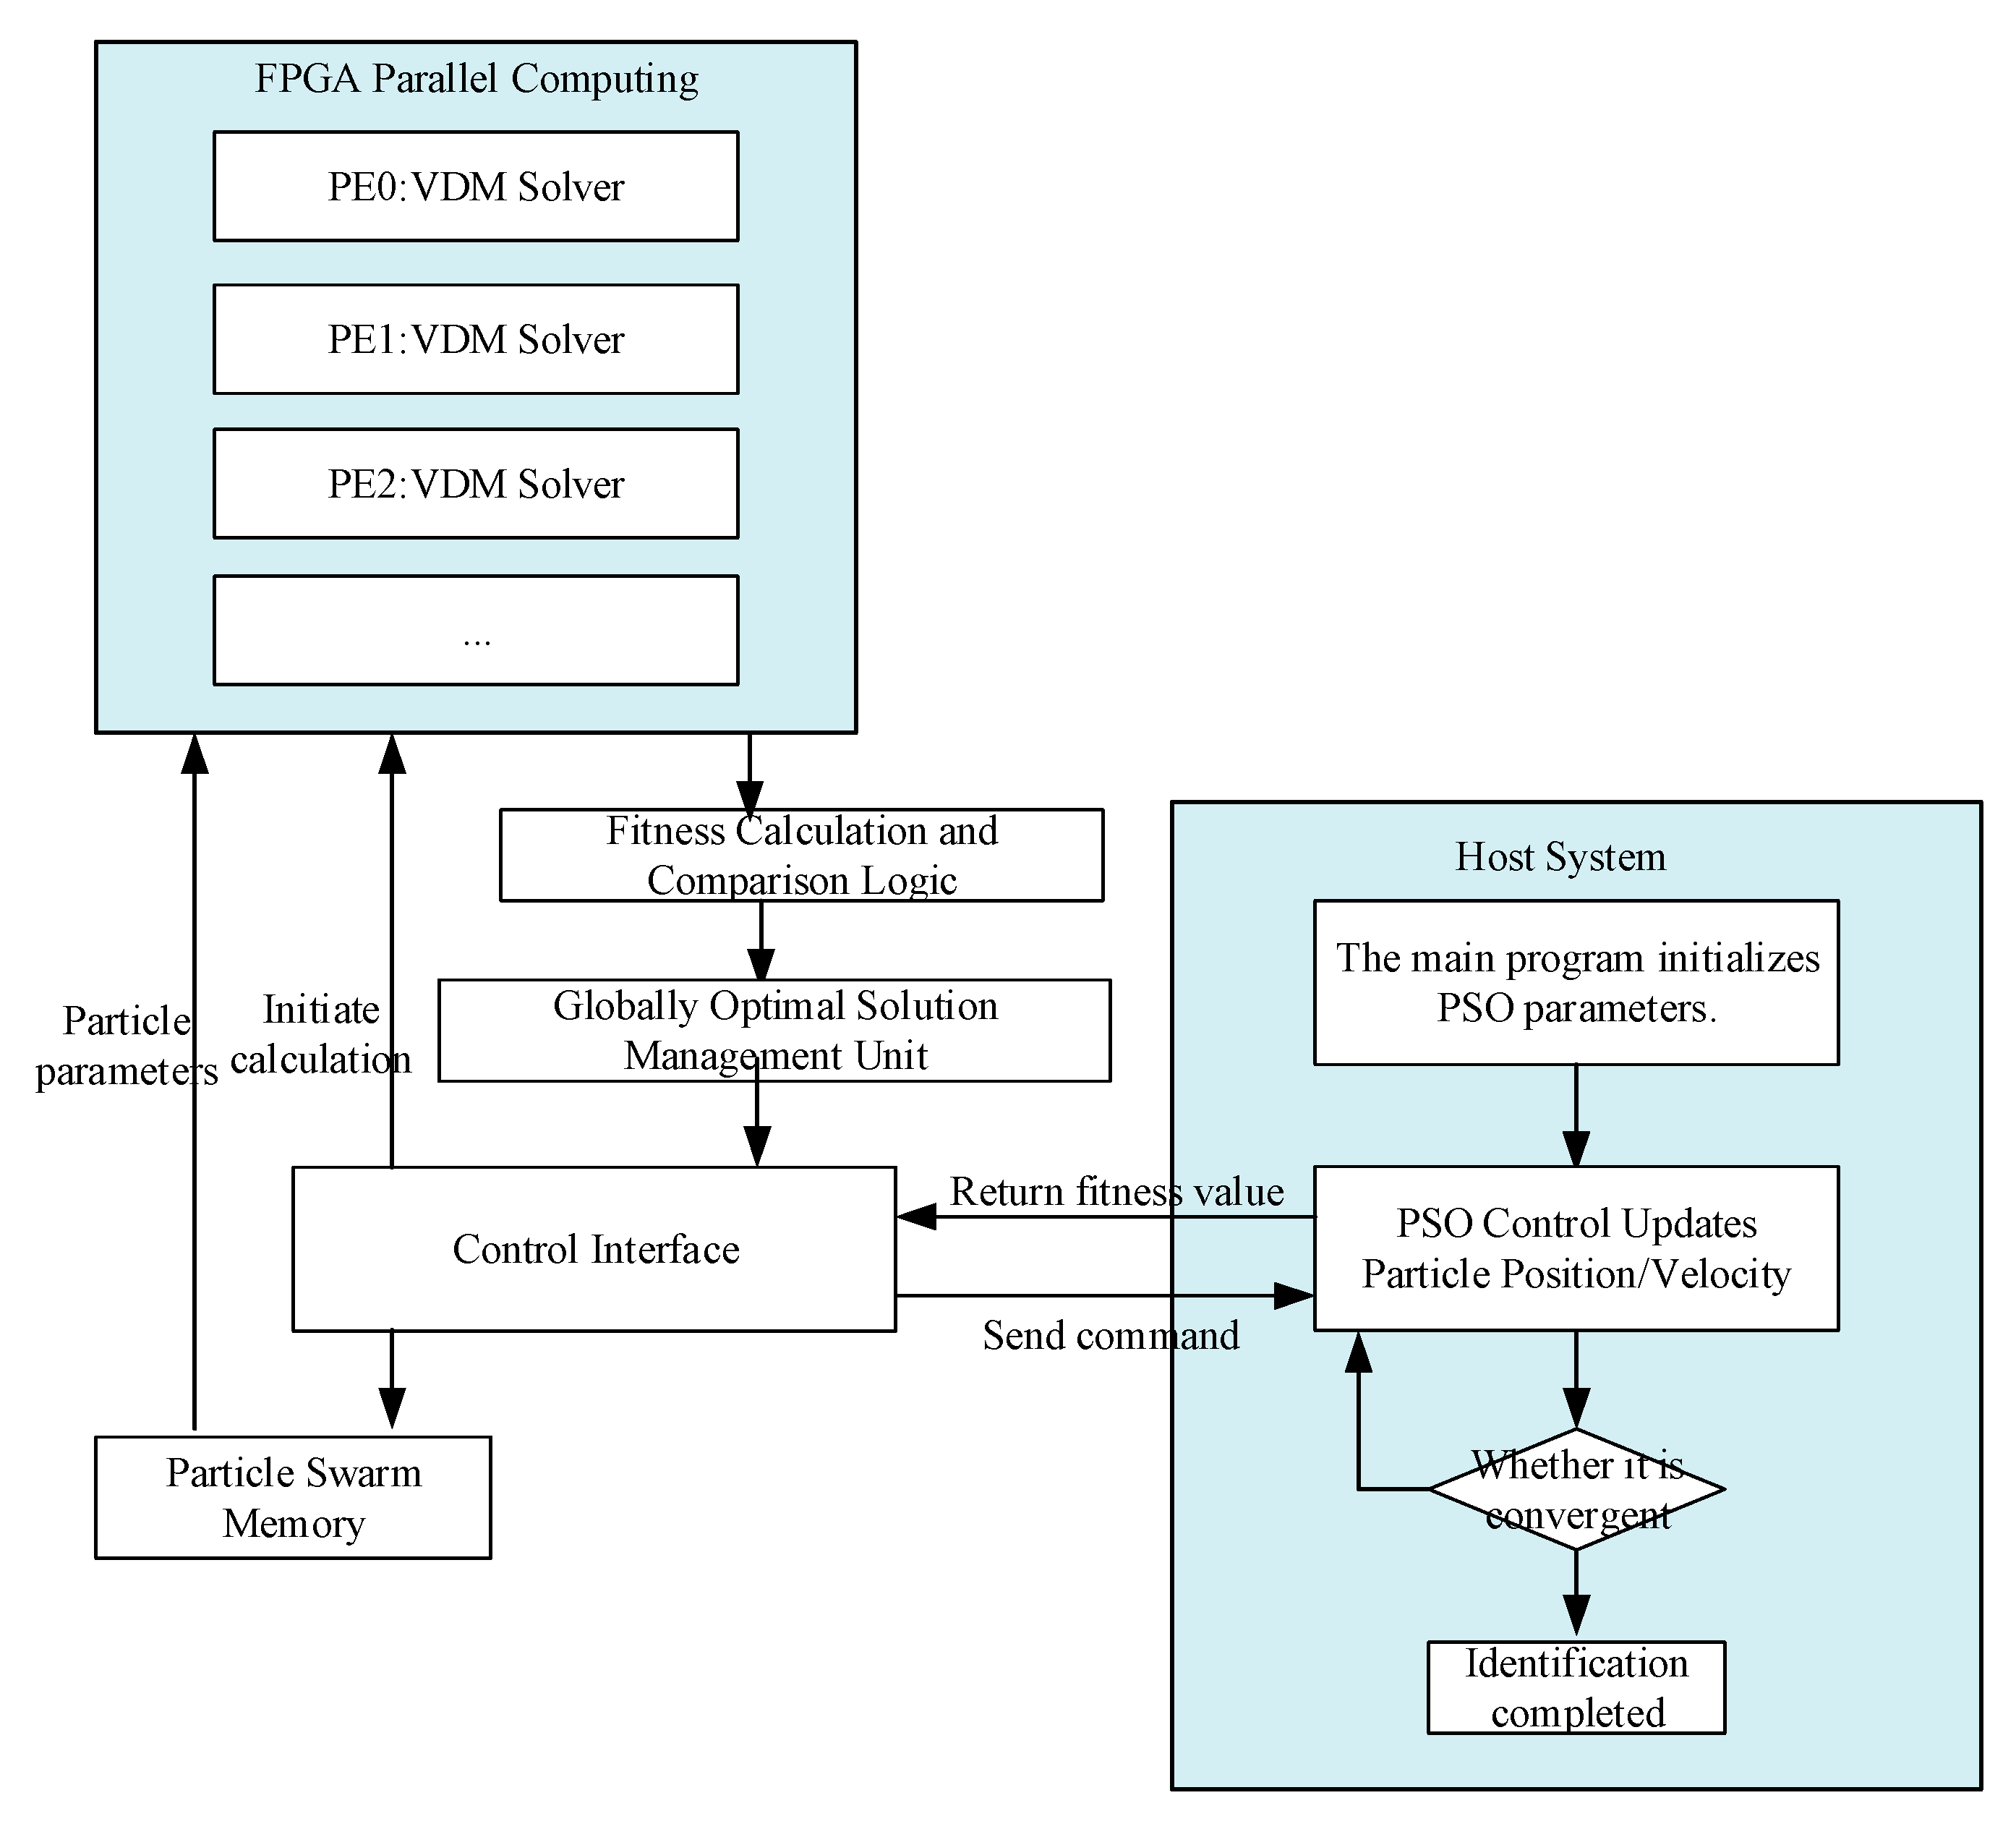
Table 4, the recognition results of the proposed method exhibit minimal variation under different noise intensities, PSO parameters, and signal lengths. It exhibits excellent noise resistance, particularly with the minimal impact of signal length on recognition results. It demonstrates strong robustness and adaptability. However, signal length has a significant impact on the time required for recognition calculations. When the signal length is 0.5 s, the computation time is 5.854 s. When the signal length is 2 s, the computation time increases to 54.12 s, resulting in a significant impact. This paper employs adaptive inertial weighting to enhance computational speed. However, when signal lengths are substantial, computation time remains lengthy, resulting in insufficient real-time performance. Consequently, reducing the length of recognition signals has become the primary approach for achieving real-time recognition. Meanwhile, during real-time broadband oscillation identification, a high sampling frequency is required to achieve precise identification results. Therefore, FPGA integrated circuit technology will be employed to further enhance identification speed. The proposed specific solution is illustrated in
Figure 3.
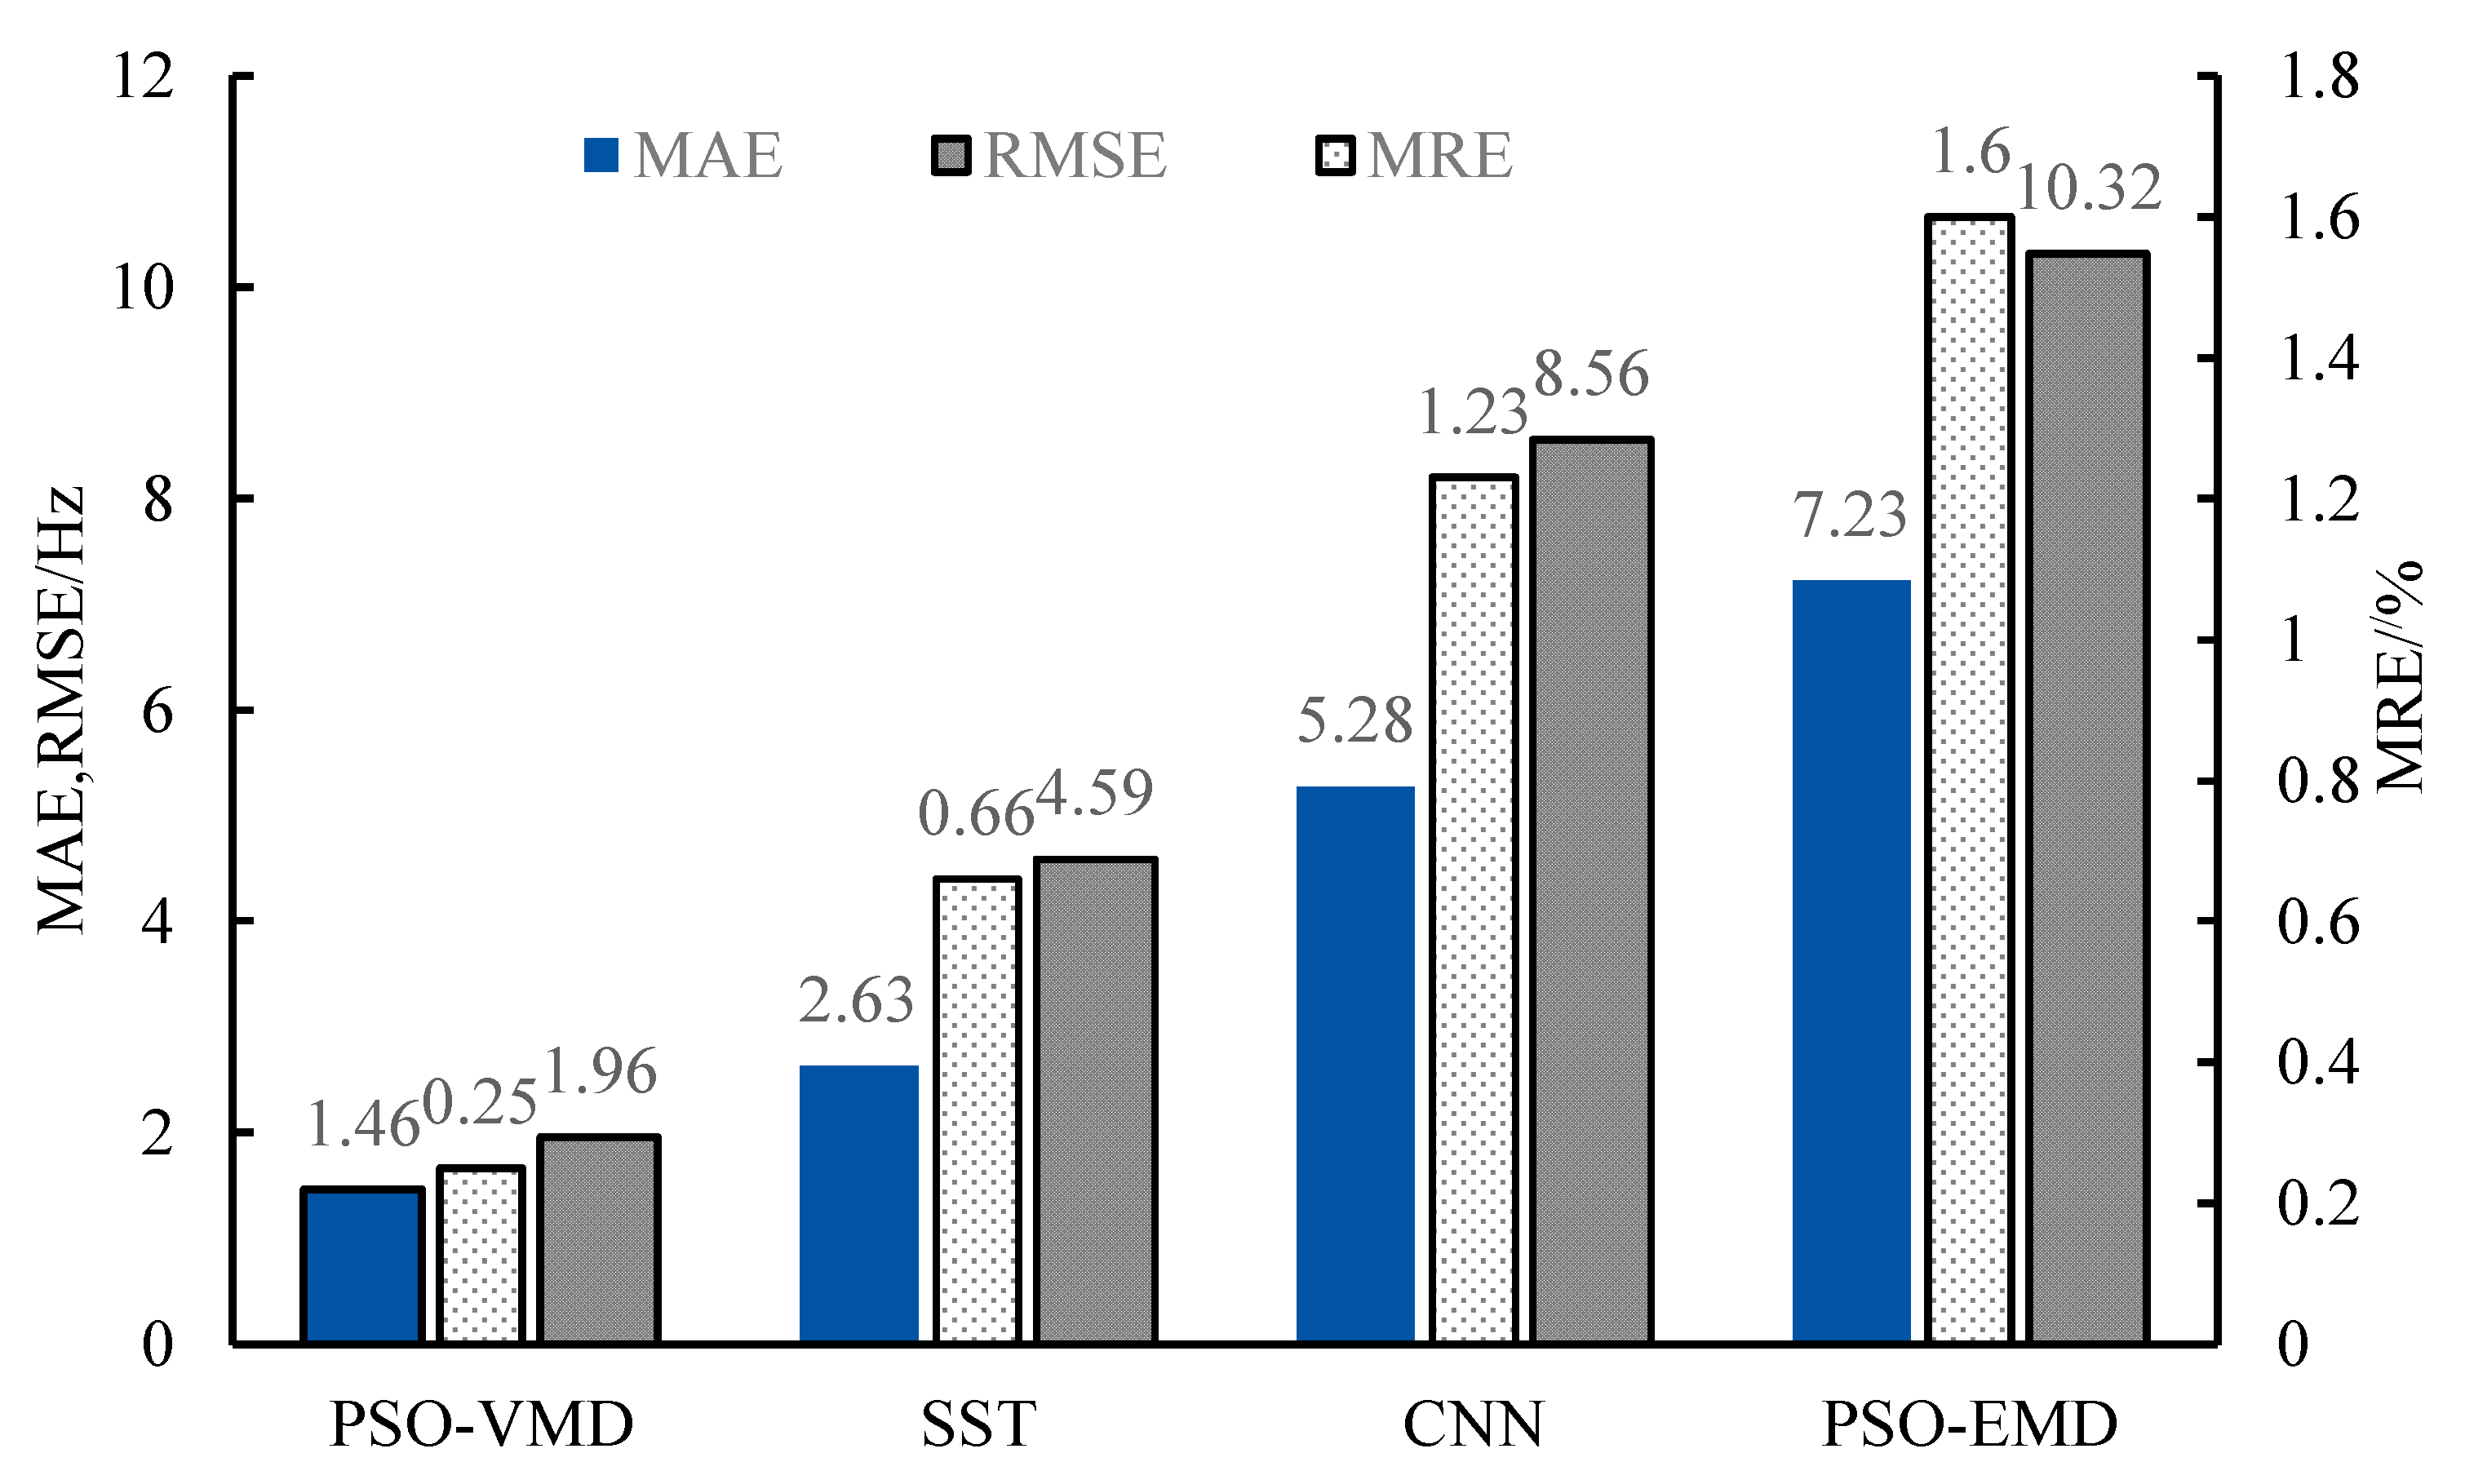
To further validate the effectiveness of the proposed method, the Mean Absolute Error (MAE), Root Mean Squared Error (RMSE), and Mean Relative Error (MRE) were used as evaluation criteria, and comparisons were made with the synchrosqueezed transform (SST), convolutional neural network (CNN), and PSO-EMD. A simulation signal containing eight modal oscillations was randomly selected, and the index value for the signal’s oscillation frequency was calculated. The results are shown in
Figure 4.
As shown in
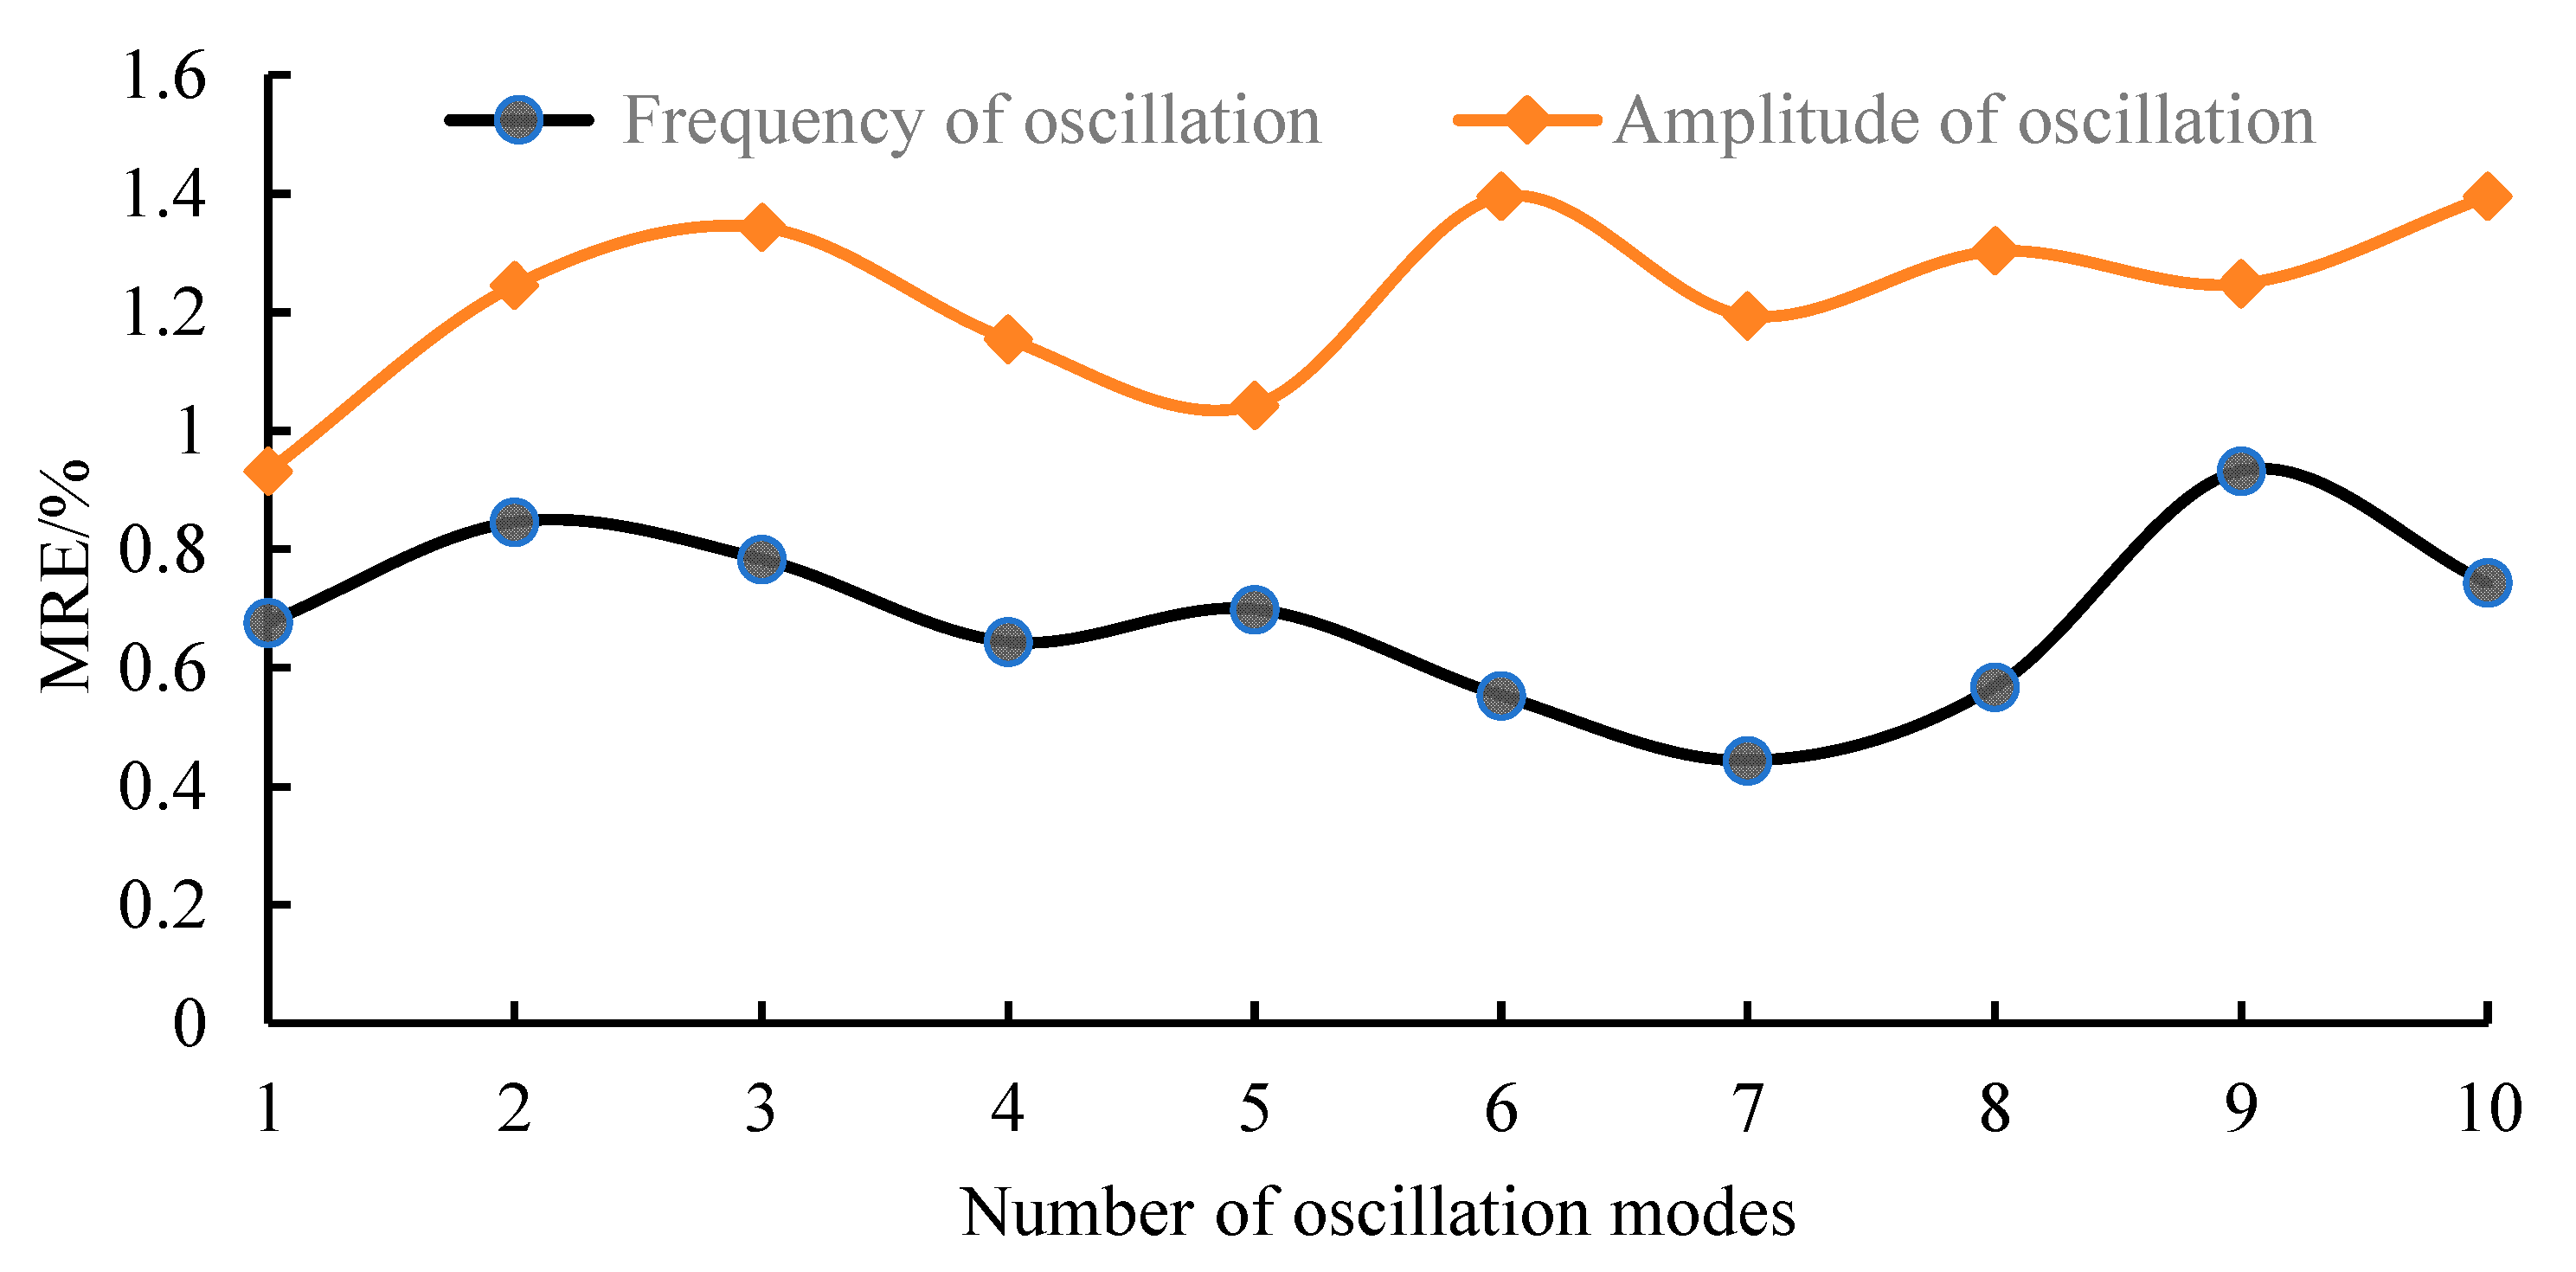
Figure 4, the VMD algorithm exhibits relatively low overall error, particularly with RMSE and MRE values significantly lower than those of the other three identification methods. The VMD proposed in this paper is more suitable for high-accuracy identification of wide-range-frequency oscillation parameters. To further validate the adaptability and robustness of the VMD method, samples with modal numbers randomly selected as 1, 2,…, 10 were used in the test set to calculate the MRE of frequency and decay factor. The results are shown in
Figure 4.
As can be seen from
Figure 5, even though the number of modal oscillations differs, the frequency MRE values of all modal oscillations are within 1%, and the amplitude MRE values do not exceed 2%. It shows that the identification accuracy of the proposed method is unaffected by the number of modes. It exhibits excellent adaptability and is particularly suitable for identifying wide-band oscillations in new power systems.
4. Simulation Testing
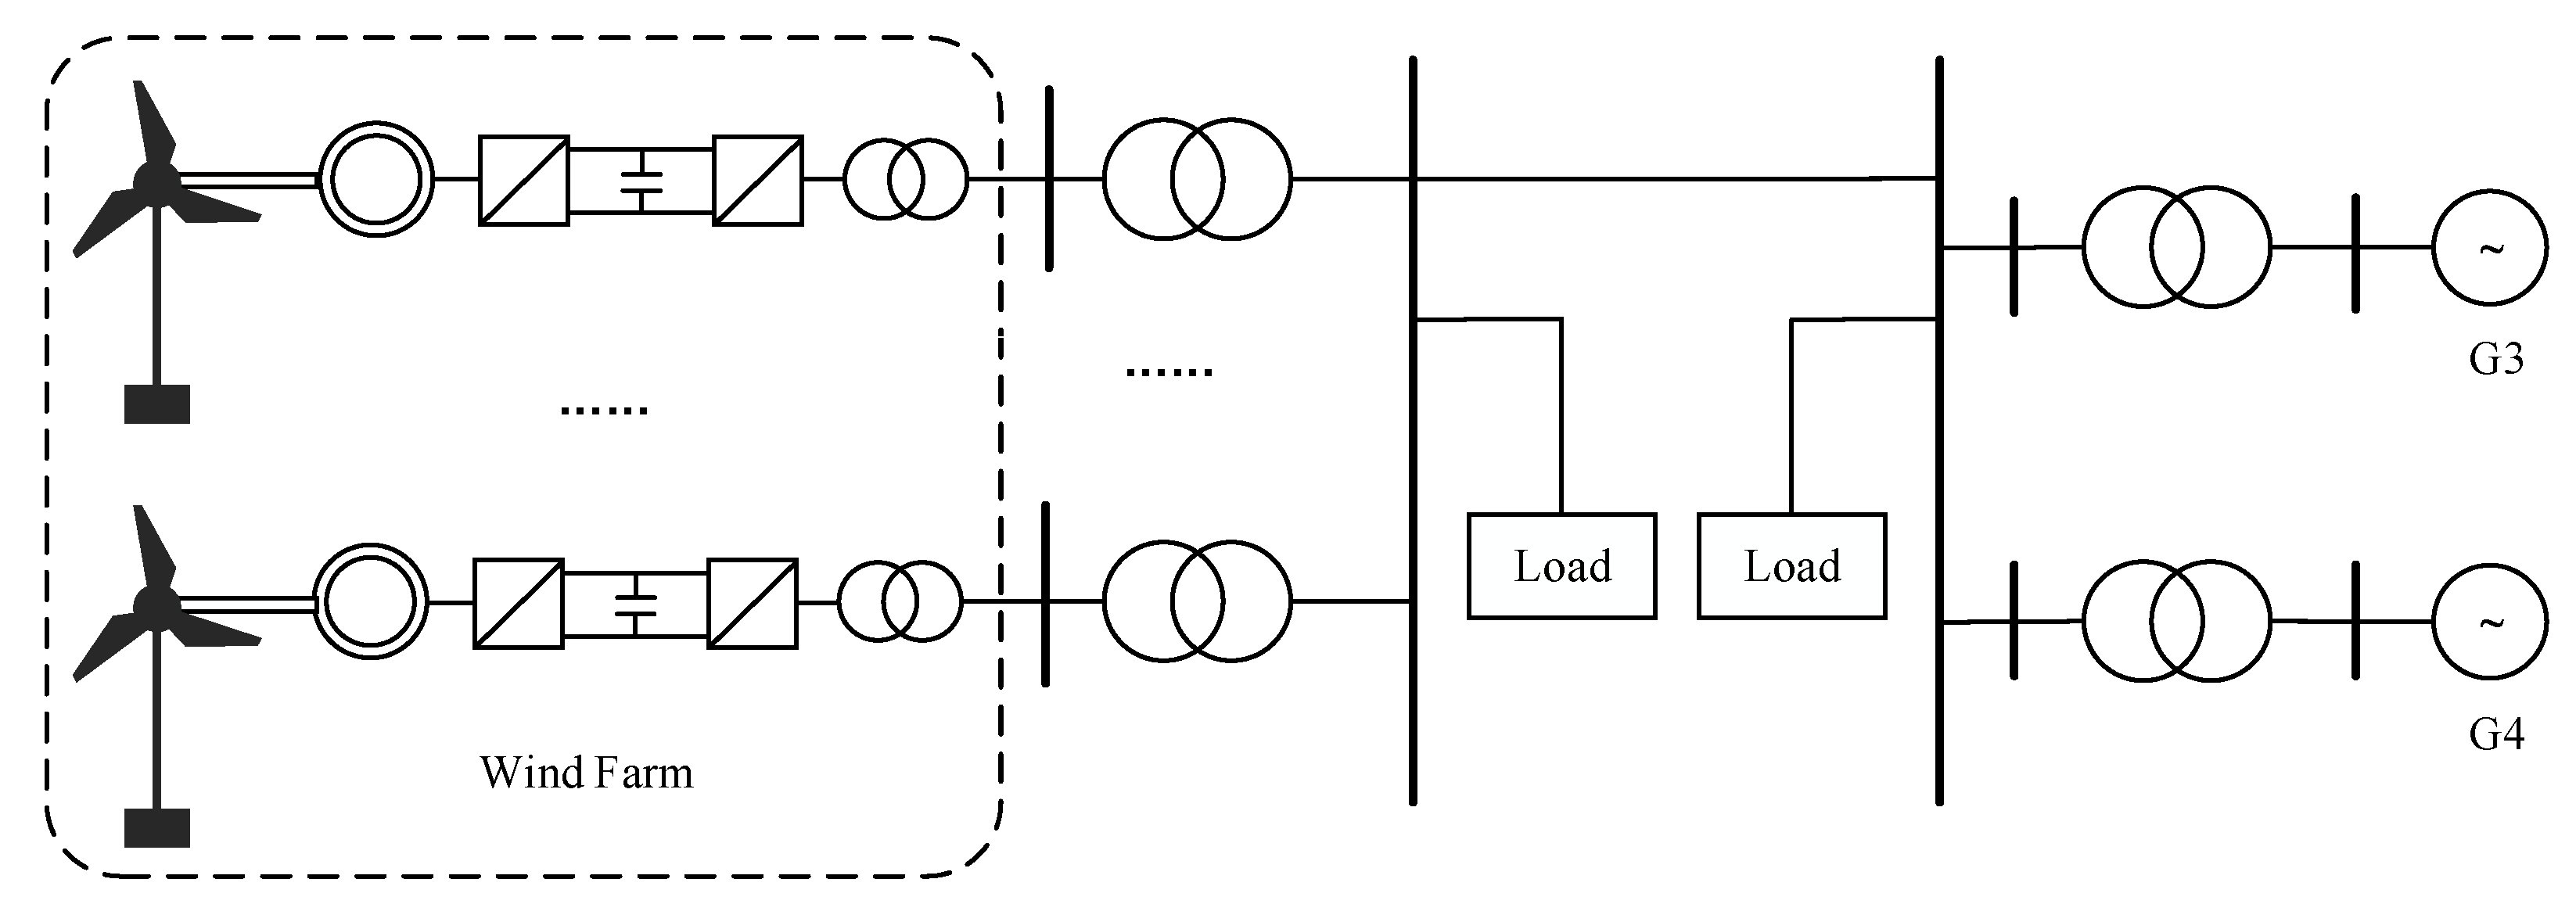
This paper uses a two-area, four-machine system as a simulation example to test the identification of wide-range-frequency oscillations. The wiring diagram is shown in
Figure 6, where the wind farm consists of direct-drive wind turbine systems, accounting for more than 50% of the installed capacity. In the example, synchronous generators G1 and G2 are replaced by the wind farm to fit the scenario of large-scale wind power generation connected to the system. The rated power of each wind turbine is 300 MW. The rated power of synchronous generators G3 and G4 is 200 MW each, with G3 serving as the balancer set and G4 as the PV node, while the remaining nodes are PQ nodes.
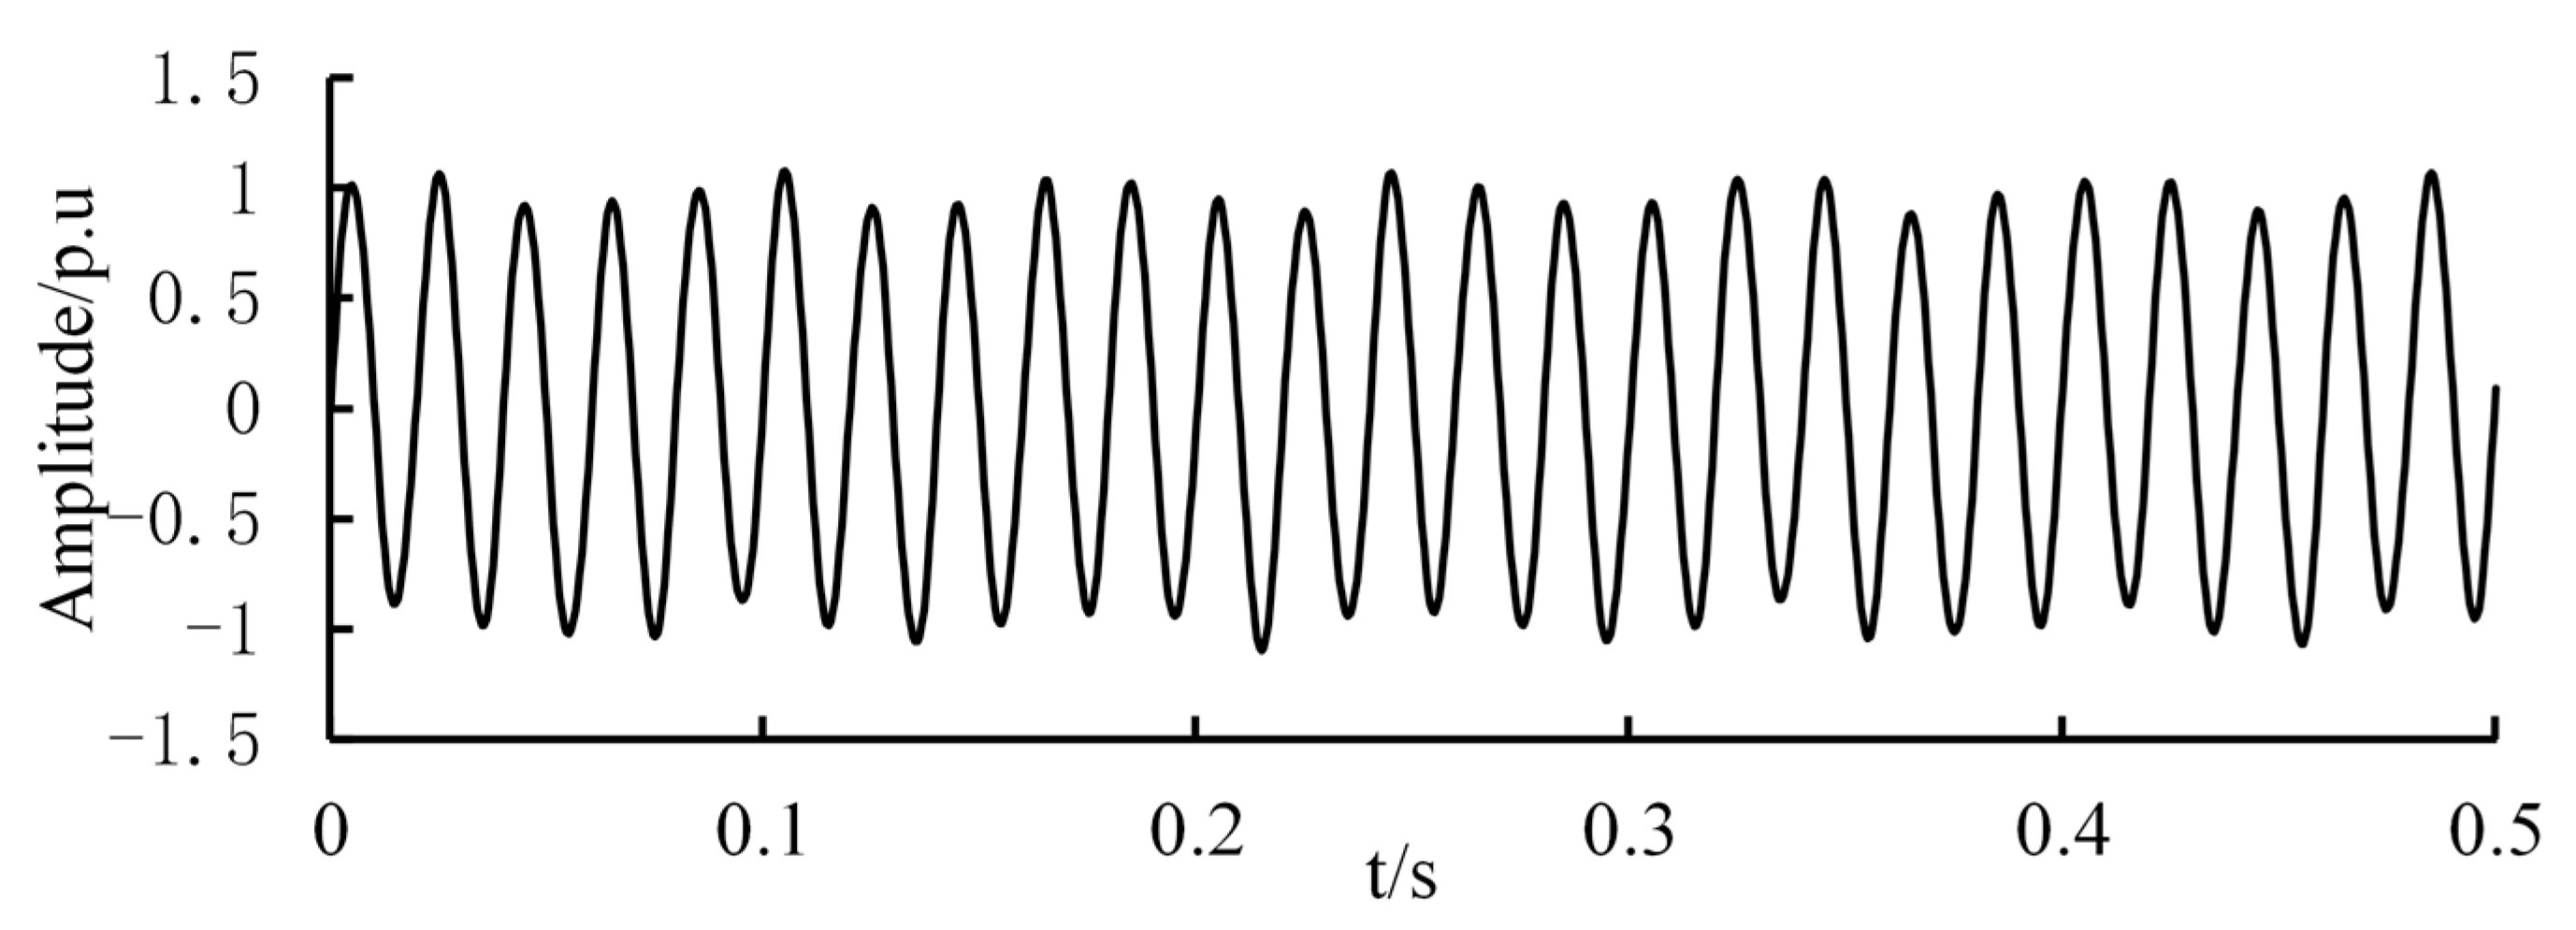
By altering the wind turbine control parameters to induce wide-range-frequency oscillation modes and simultaneously injecting periodic fluctuation signals of varying frequencies and amplitudes into the synchronous generator’s primary mover input or the wind turbine grid side, the bus voltage amplitude is sampled at a frequency of 2 kHz. It comprehensively covers the wide-frequency oscillation sample space of the four-machine, two-area system incorporating direct-drive wind farms. It completes the construction of the wide-frequency oscillation datasets. The time domain diagram of the voltage waveform at node X is shown in
Figure 7.
Based on the simulation results shown in
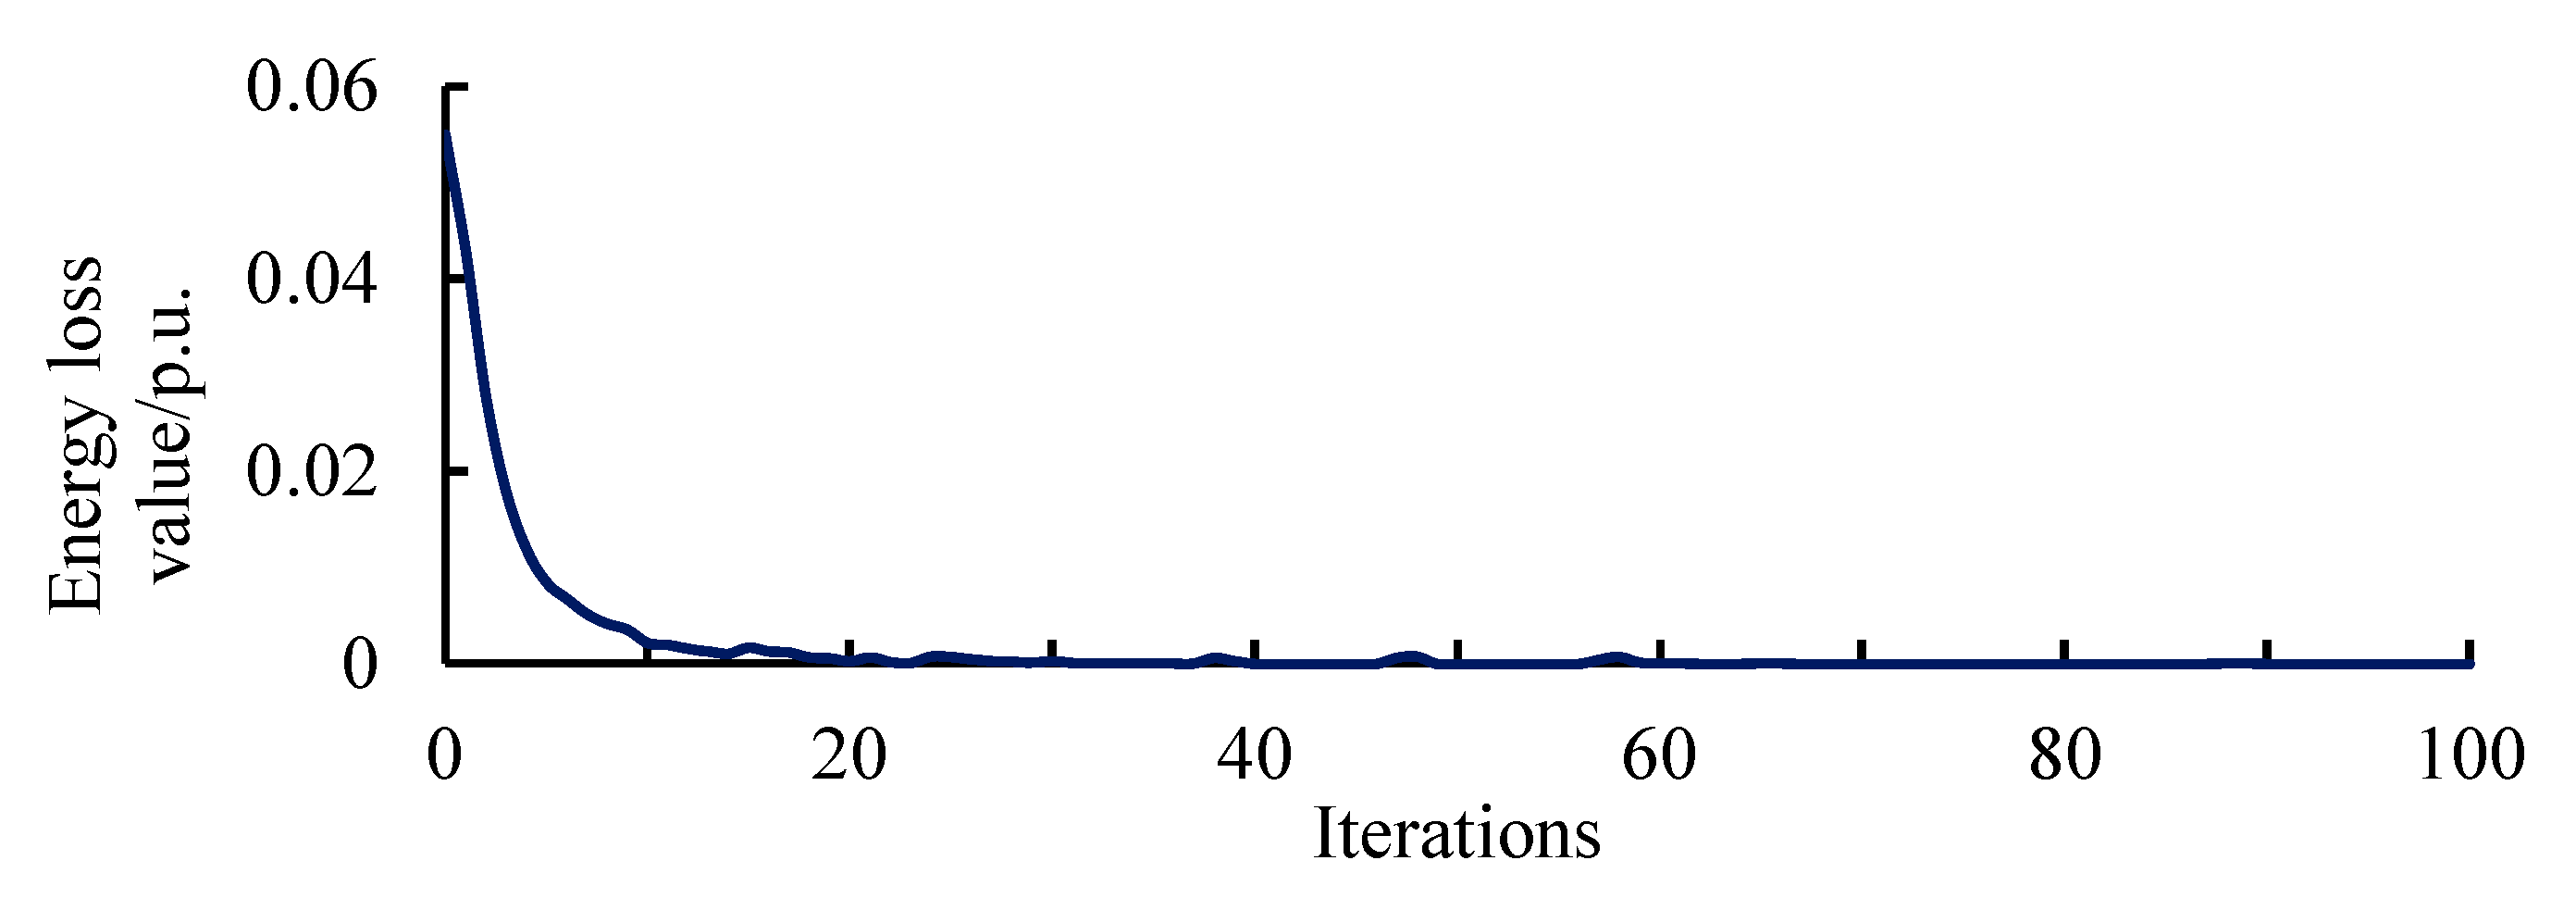
Figure 6, modal decomposition was performed using the improved PSO-VMD method, and the energy loss value curve is shown in
Figure 8.
The results of the wide-range-frequency oscillation identification are shown in
Table 5.
Based on the identification results in
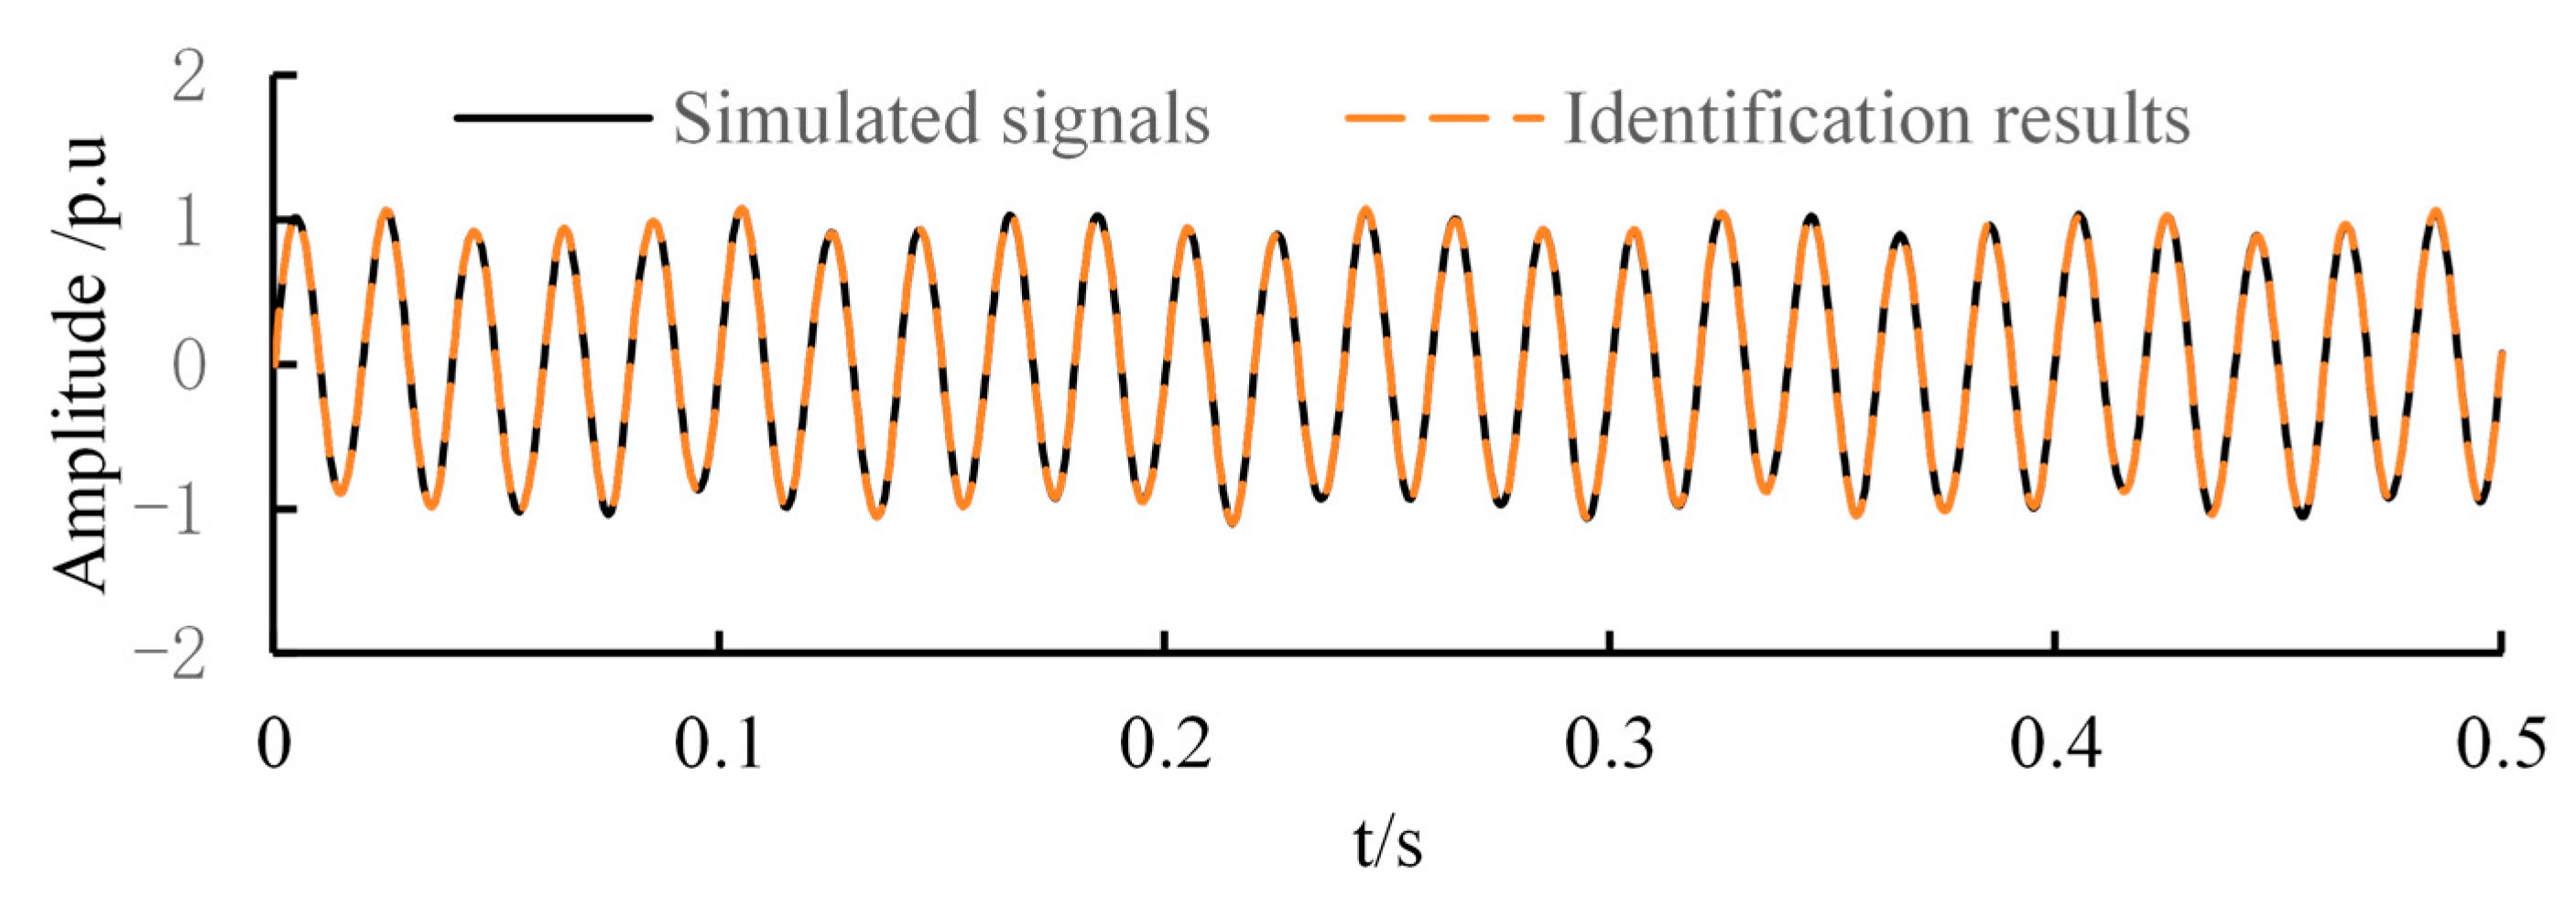
Table 2, signal reconstruction was performed, and the results are shown in
Figure 9.
As can be seen from
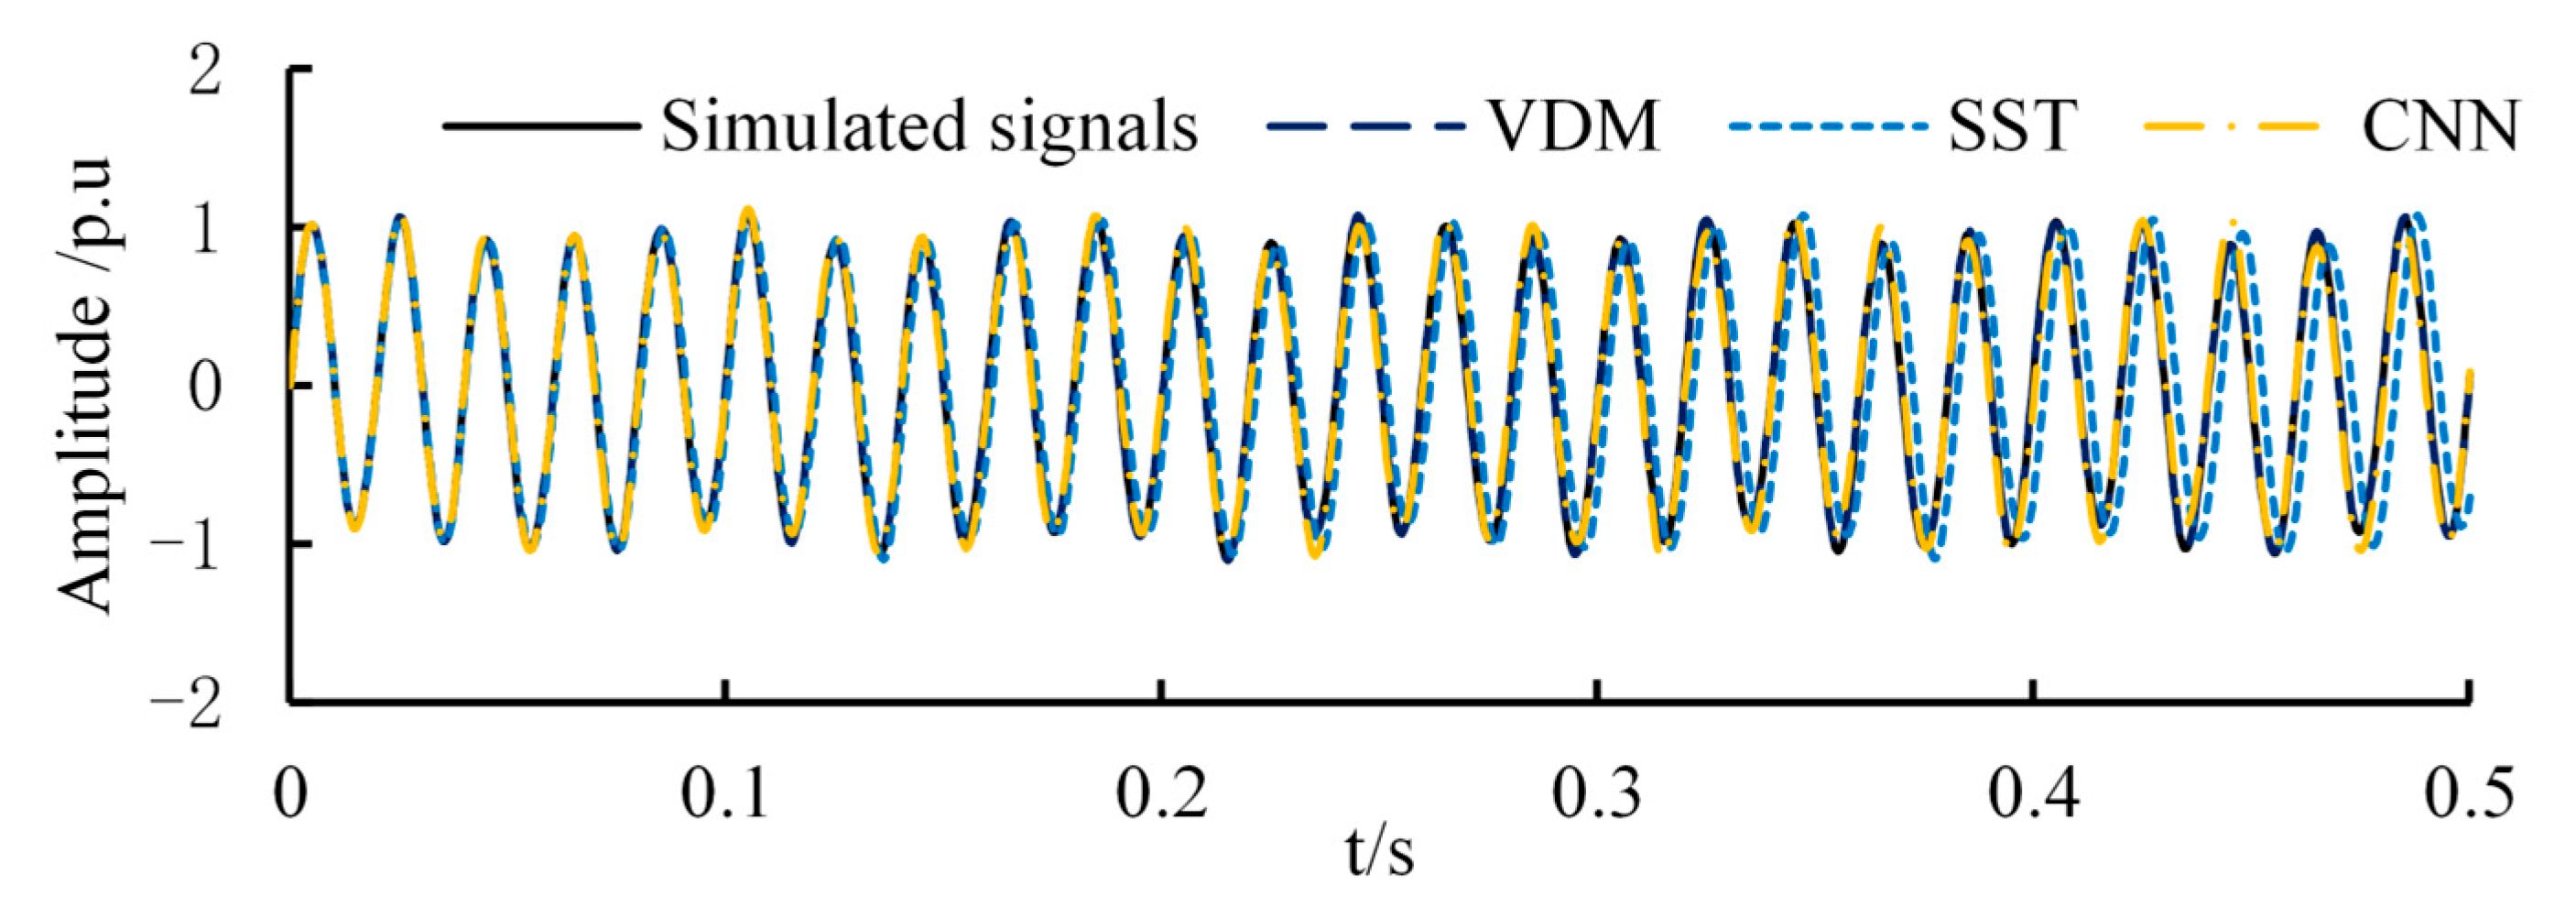
Figure 9, the reconstruction of the signal basically coincides with the simulation signals, indicating that the improved PSO-VMD can accurately identify all the wide-range-frequency oscillation information of the simulation signals. Then, the measured signals in practical power systems inevitably contain noise signals. To further fit the wide-range-frequency oscillation signals in practical projects, Gaussian white noise signals and random signals were added to the simulation signals. This involves adding noise to the simulated signal to make the wide-band-frequency oscillation signal more closely resemble actual engineering measurement signals. These signals are then identified and compared with the SST and CNN methods. The reconstructed signal waveform results are shown in
Figure 10.
As can be seen from
Figure 10, the method proposed in this paper has the highest accuracy and can be used in practical projects to identify the wide-range-frequency oscillation parameters of measurement signals.
