Article

Study on CO2 Induced Gas Channeling in Tight Gas Reservoirs and Optimization of Injection Production Parameters

1
Research Institute of Petroleum Exploration and Development, PetroChina, Beijing 100083, China
2
Institute of New Energy and Low-Carbon Technology, Sichuan University, Chengdu 610065, China
*
Author to whom correspondence should be addressed.
Energies 2025, 18(21), 5584; https://doi.org/10.3390/en18215584
Submission received: 18 September 2025 / Revised: 18 October 2025 / Accepted: 22 October 2025 / Published: 23 October 2025

Abstract

Tight gas reservoirs are characterized by low porosity, low permeability, and strong heterogeneity. CO2 flooding, as an important approach for enhancing gas recovery while achieving carbon sequestration, is often restricted by gas channeling. Based on the sandstone reservoir parameters of the Shihezi Formation in the Ordos Basin, a two-dimensional fracture–matrix coupled numerical model was developed to systematically investigate the effects of fracture number, fracture inclination, fracture width, injection pressure, and permeability contrast on gas breakthrough time and sweep efficiency. A second-order regression model was further established using response surface methodology (RSM). The results show that a moderate fracture density can extend breakthrough time and improve sweep efficiency, while permeability contrast is the fundamental factor controlling gas channeling risk. When the contrast increases from 0.7 to 9.9, the breakthrough efficiency decreases from 88.5% to 68.9%. The response surface analysis reveals significant nonlinear interactions, including the coupled effects of fracture number with fracture width, injection pressure, and inclination angle. Under the optimized conditions, the breakthrough time can be extended to 46,984 h, with a corresponding sweep efficiency of 87.7%. These findings provide a quantitative evaluation method and engineering optimization guidance for controlling CO2 channeling in tight gas reservoirs.

1. Introduction

With global natural gas production entering the stage dominated by tight gas development, tight gas reservoirs have gradually become a key foundation for maintaining stable and increasing gas supply due to their abundant resources and wide distribution [1,2]. However, these reservoirs are typically characterized by low porosity, low permeability, high capillary pressure, and strong heterogeneity. Under conventional depletion development, the recovery factor is only 20–30%, making economic and efficient exploitation difficult to achieve [3,4]. Therefore, it is urgent to develop novel, green, and efficient enhanced gas recovery technologies.
Carbon dioxide (CO2) flooding, as a technique that simultaneously enhances gas recovery and achieves carbon sequestration (CCUS), holds broad application prospects [5,6,7]. Under supercritical conditions, CO2 exhibits high density, strong solubility, and partial miscibility with methane, enabling it to effectively displace residual gas, replenish reservoir energy, and achieve underground storage. It has thus become a core component of CCUS–EGR (Carbon Capture, Utilization and Storage—Enhanced Gas Recovery) technology [8]. Field trials have shown that CO2 injection can increase natural gas recovery by 5–15% [9]. The Dutch K12-B project, the world’s first CO2–EGR demonstration, reported that each ton of injected CO2 yielded an additional 0.03–0.05 tons of CH4 [10]. Similarly, the German CLEAN project validated the recovery improvement in the Altmark gas field and investigated wellbore integrity and environmental benefits. In addition, projects in Alberta (Canada), Otway (Australia), and CASTOR (Spain) have further demonstrated the feasibility and effectiveness of this approach [11,12,13]. In China, pilot tests have been initiated in the Wolonghe gas field (Chongqing) and the Sudong 41-53 block of the Sulige gas field, exploring CO2 flooding strategies in carbonate and tight sandstone reservoirs [14].
In addition to field demonstrations, numerous numerical simulation studies have provided in-depth insights into the feasibility and recovery mechanisms of CO2 flooding. Van et al. employed numerical models to confirm the feasibility of CO2-enhanced gas recovery and highlighted the controllability of reservoir phase behavior [15]. Al-Hasami et al. developed a coupled simulator to systematically analyze the effects of gas mixing, CO2 diffusion, and solubility on recovery, along with an assessment of economic feasibility [9]. Patel et al. applied high-fidelity simulations and found that miscibility is strongly influenced by reservoir properties and injection rates; by increasing the injection rate, the recovery factor could be improved from 53% to 69% [16]. Tian et al. established a model incorporating Knudsen diffusion and real gas effects, revealing that formation temperature, average porosity, and initial permeability play critical roles in recovery performance [17]. Hasan et al. further investigated the influence of injection location and irreducible water saturation on breakthrough behavior [18].
At the same time, experimental studies have also demonstrated that gas channeling is a key bottleneck affecting the stability and effectiveness of CO2 flooding. When the injection front breaks through to the production well along large pores, fractures, or other high-permeability layers, most of the injected gas becomes ineffective, reducing the sweep efficiency and subsequently influencing both recovery and reservoir pressure maintenance [2]. Zhao et al. proposed a coupled model incorporating fracture stress sensitivity and diffusion, revealing the impacts of injection–production rate, pressure differential, and fracture structure on CO2–CH4 migration [19]. Zhang et al. conducted CO2 flooding experiments on carbonate cores, measuring CO2–CH4 diffusion coefficients of 0.01–0.12 cm2/min, and noted that increasing pressure helps delay breakthrough [14]. Omari et al. examined the regulatory effects of inlet/outlet pressure and gravity segregation on gas behavior [20]. Wang et al. found in inclined-fracture models that preferential flow channels significantly affect breakthrough time and recovery efficiency [21]. Feather and Archer suggested that low-permeability isotropic reservoirs are most favorable for CO2–EGR, while Luo et al. showed that injection–production schemes in low-permeability layers maximize CO2 storage capacity [22]. Although previous studies have systematically addressed phase behavior, flow mechanisms, and production strategies in CO2 flooding, most have focused only on the effect of a single factor on gas channeling while neglecting the interactions among factors. Reports linking breakthrough time and sweep efficiency to multiple controlling variables remain scarce, and no systematic evaluation framework for gas channeling risk has yet been established, which limits the large-scale application of CO2 flooding in tight gas reservoirs.
This work investigates CO2 flooding in tight gas reservoirs. A multi-factor numerical simulation model was constructed based on actual reservoir parameters to systematically investigate the effects of fluid properties, reservoir structure, and production schemes on gas channeling behavior. In addition, response surface methodology was employed to establish a quantitative evaluation and optimization model for gas channeling risk, thereby revealing the heterogeneous migration patterns and breakthrough mechanisms of CO2 in tight reservoirs. On this basis, practical channeling control strategies are proposed. The findings provide theoretical support and engineering guidance for the efficient development of tight gas reservoirs and the synergistic optimization of carbon sequestration.

2. Model Construction and Numerical Methods

2.1. Geological Background and Modeling Domain

This study takes the Permian Shihezi Formation (He 8 to Shan 1 members) sandstone reservoirs in the Ordos Basin as the research object. The reservoir is subdivided into seven layers, with porosity ranging from 6.0% to 14.0% (average 9.52%) and permeability between 0.1 mD and 1.0 mD (average 0.72 mD) [23,24]. These reservoirs are characterized by low porosity, low permeability, high capillary pressure, and strong heterogeneity, representing a typical geological background of tight gas reservoirs. The reservoir was initially under a pressure of 12.6 MPa and a temperature of 373.15 K, typical of conditions found at a depth of 2500 m in the Shihezi Formation. To investigate CO2 migration behavior and gas channeling risk under different reservoir conditions, a two-dimensional rectangular cross-sectional model was established. The model has a horizontal length of L and is vertically divided into seven layers corresponding to the natural stratification of the reservoir. Distinct porosity and permeability values were assigned to each layer in the base case, and additional scenarios with varying permeability distributions and fracture configurations were designed to simulate the conditions of naturally fractured or hydraulically fractured reservoirs.
Fracture parameters were derived from core, image-log, and outcrop data of the Shihezi Formation and analogous tight-sandstone reservoirs in the Ordos Basin. The fracture network was generated stochastically using the Monte Carlo method, following the statistical distributions of length (200–250 m) and aperture (0.05–5 mm). The local fracture permeability was calculated using the cubic-law relation kf = b2/12, thereby establishing an implicit coupling between fracture geometry and flow capacity [14,25]. Matrix permeability was independently assigned according to measured interlayer heterogeneity to maintain realistic multi-scale variability. The geometric configuration, stratified structure, and boundary conditions of the two-dimensional reservoir model are illustrated in Figure 1.

2.2. Governing Equations and Coupled Physical Fields

The model couples the flow field and the component transport field to simulate the entire process of CO2 and CH4 flow, mixing, and breakthrough in the fracture–matrix system.
  • Darcy Flow Governing Equation
This equation is employed to simulate the seepage behavior of compressible gas in porous media. The mass conservation and momentum equations for the matrix are expressed as:
t ε p ρ + ρ u = Q m
u = κ μ p ρ g
The mass conservation and momentum equations for the fracture are expressed as:
d f t ε p ρ + T d f ρ u = d f Q m
u = κ μ T p ρ g
where εp is the porosity, dimensionless; ρ is the gas density, kg·m−3; κ is the permeability, m2; μ is the gas viscosity, Pa·s; u is the Darcy velocity, m·s−1; Qm is the mass source/sink term, kg·m−3·s−1; g is the gravitational acceleration, m·s−2; df is the fracture aperture, m.
2.
Dilute Species Transport Equation
This equation is used to describe the advection–diffusion–reaction migration of CH4, CO2, and other components in porous media. For porous media:
ϵ p c i t + ( ρ c p , i ) t + J i + u c i = R i + S i
J i = ( D D , i + D e , i ) c i
For fractures:
d f ρ c P , i t + ϵ p c i t + t J i + u t c i = d f R i + d f S i + n 0
J i = D e , i t c i
where ci is the concentration of component i, kg·m−3; Ji is the diffusion flux, kg·m−2·s−1; Dij is the molecular diffusion coefficient, m2·s−1; De is the dispersion coefficient, m2·s−1; Ri is the reaction rate term, kg·m−3·s−1; Si is the external source/sink term, kg·m−3·s−1; n0 is the external source term intensity, dimensionless; df is the fracture aperture, m. This model comprehensively accounts for the density difference between CO2 and CH4, dissolution–diffusion effects, and the influence of reservoir heterogeneity.

2.3. Boundary Conditions and Solution Method

The boundary conditions of the model were defined as follows: the left boundary was set as the injection port, where CO2 was injected at a constant flow rate or pressure; the right boundary was defined as the production outlet, allowing free outflow of CO2 and CH4; the top and bottom boundaries were treated as no-flow boundaries (Neumann type) to simulate a closed reservoir environment. Interlayer connectivity was represented by transmissibility coefficients defined between adjacent layers, allowing partial pressure communication and limited crossflow. The transmissibility was calculated using the harmonic mean of adjacent layer permeabilities to capture realistic vertical heterogeneity while preserving the independence of each sublayer. The breakthrough time for each multi-fracture model was defined as the time when the CO2 concentration at the production outlet reached 20% of the inlet concentration [16].
The numerical simulations were conducted using COMSOL Multiphysics® 6.2, invoking the Darcy’s Law module and the Transport of Diluted Species in Porous Media module [26]. The governing equations were solved by the finite element method (FEM) with a time-dependent solver to simulate the entire process from CO2 injection to breakthrough. To improve simulation accuracy, local mesh refinement was applied in the fracture regions and at interlayer interfaces, and appropriate convergence criteria were adopted to control computational precision.

2.4. Grid Partitioning and Independence Test

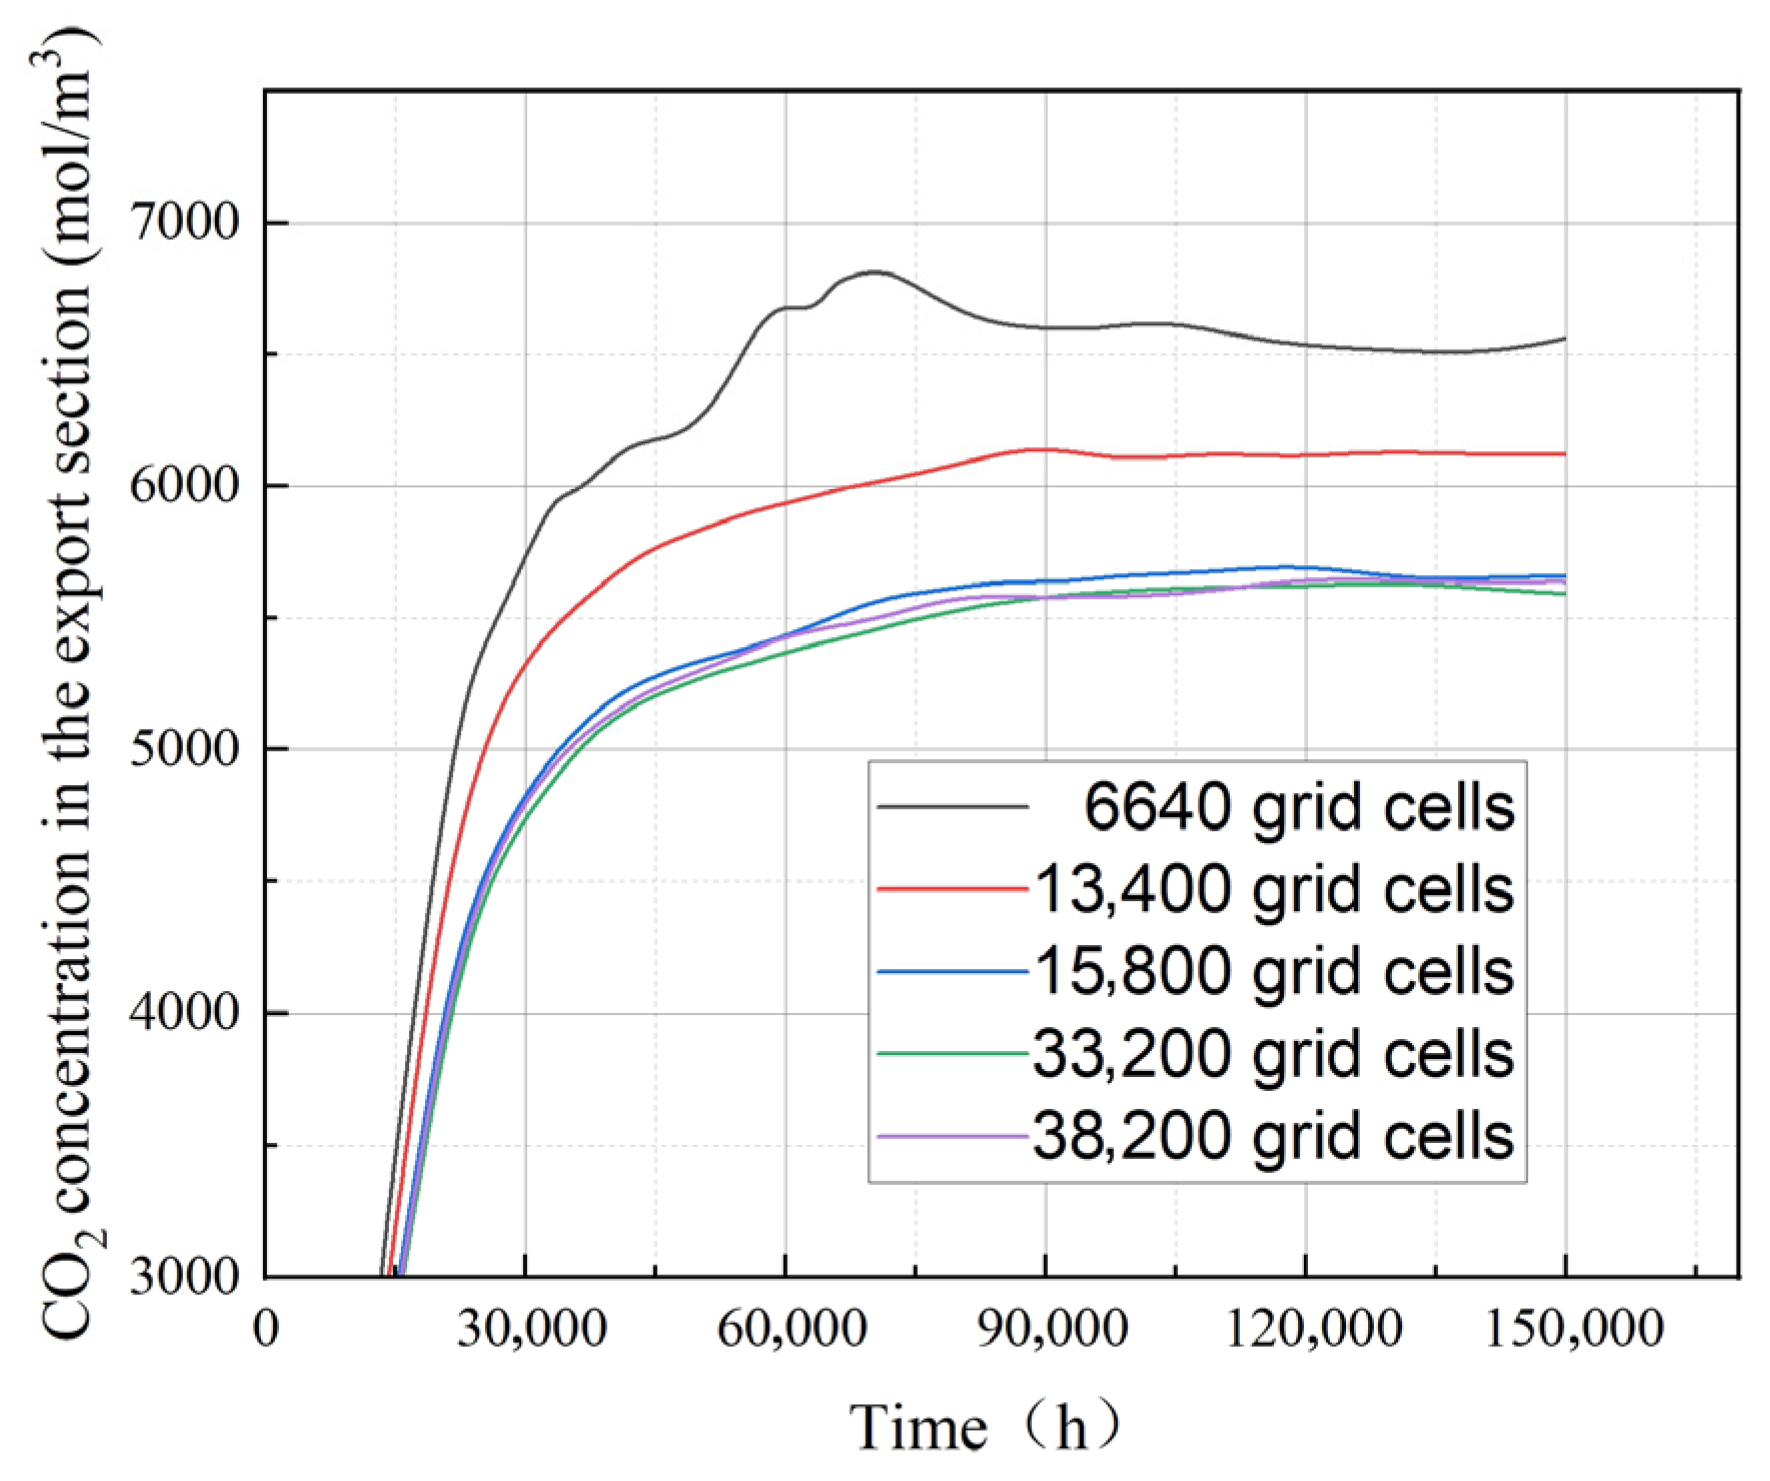
The model was discretized with a total of 33,219 elements within a domain of 526,800 m2. The unstructured grid consists primarily of triangular elements with an average element quality of 0.8733. Mesh refinement was applied in regions of high fracture density to ensure accurate representation of fluid flow and fracture behavior. The grid configuration was validated through mesh convergence tests, which showed no significant change in results with further refinement, confirming the adequacy of the chosen resolution.
The results of the grid independence test, shown in Figure 2, demonstrate that the CO2 concentration in the export section stabilizes at 15,800 grid cells. However, to achieve more accurate results, this study uses a grid with 33,200 grid cells. While the simulation with 15,800 grid cells already reaches stability, increasing the grid resolution further ensures better precision in capturing the behavior of CO2 migration over time.

3. Simulation Schemes and Variable Design

3.1. Single-Factor Simulation Variables and Grouping Design

To systematically evaluate the effects of reservoir heterogeneity and fracture structures on gas channeling behavior during CO2 flooding, multiple variable groups were established based on the numerical model developed in Section 2. Three categories of controlling factors were considered: fracture parameters, CO2 injection parameters, and reservoir heterogeneity (permeability contrast).
An orthogonal design approach was adopted to conduct comparative simulations around these three categories of factors. The specific variables and parameter levels are summarized in Table 1:
  • Fracture parameter design: number, inclination, and permeability (Groups A/B/C)
A stochastic fracture network was introduced to represent natural fractures or hydraulically induced fractures in the reservoir [27]. Fractures were randomly generated using the Monte Carlo method, with controlled length, inclination, and spatial distribution, and were assigned higher porosity and permeability values before being embedded into the multilayer reservoir profile. Fracture modeling was achieved by combining geometric partitioning with parameter mapping, thereby forming a coupled fracture–matrix structure to capture CO2 migration and breakthrough behavior under fracture-dominated flow fields.
Three fracture parameters were considered: fracture number (Group A), controlling the overall fracture density; fracture inclination (Group B), covering orientations from horizontal to inclined fractures; and fracture permeability (Group C), represented by aperture variations to simulate differences in conductivity. Other parameters were kept constant: fracture length was set between 200 and 250 m following a specified distribution, fracture porosity was fixed at 0.7, and all fracture models were generated using a random seed to ensure consistency of spatial distribution across different scenarios.
2.
Injection parameter design: constant-pressure injection (Group D)
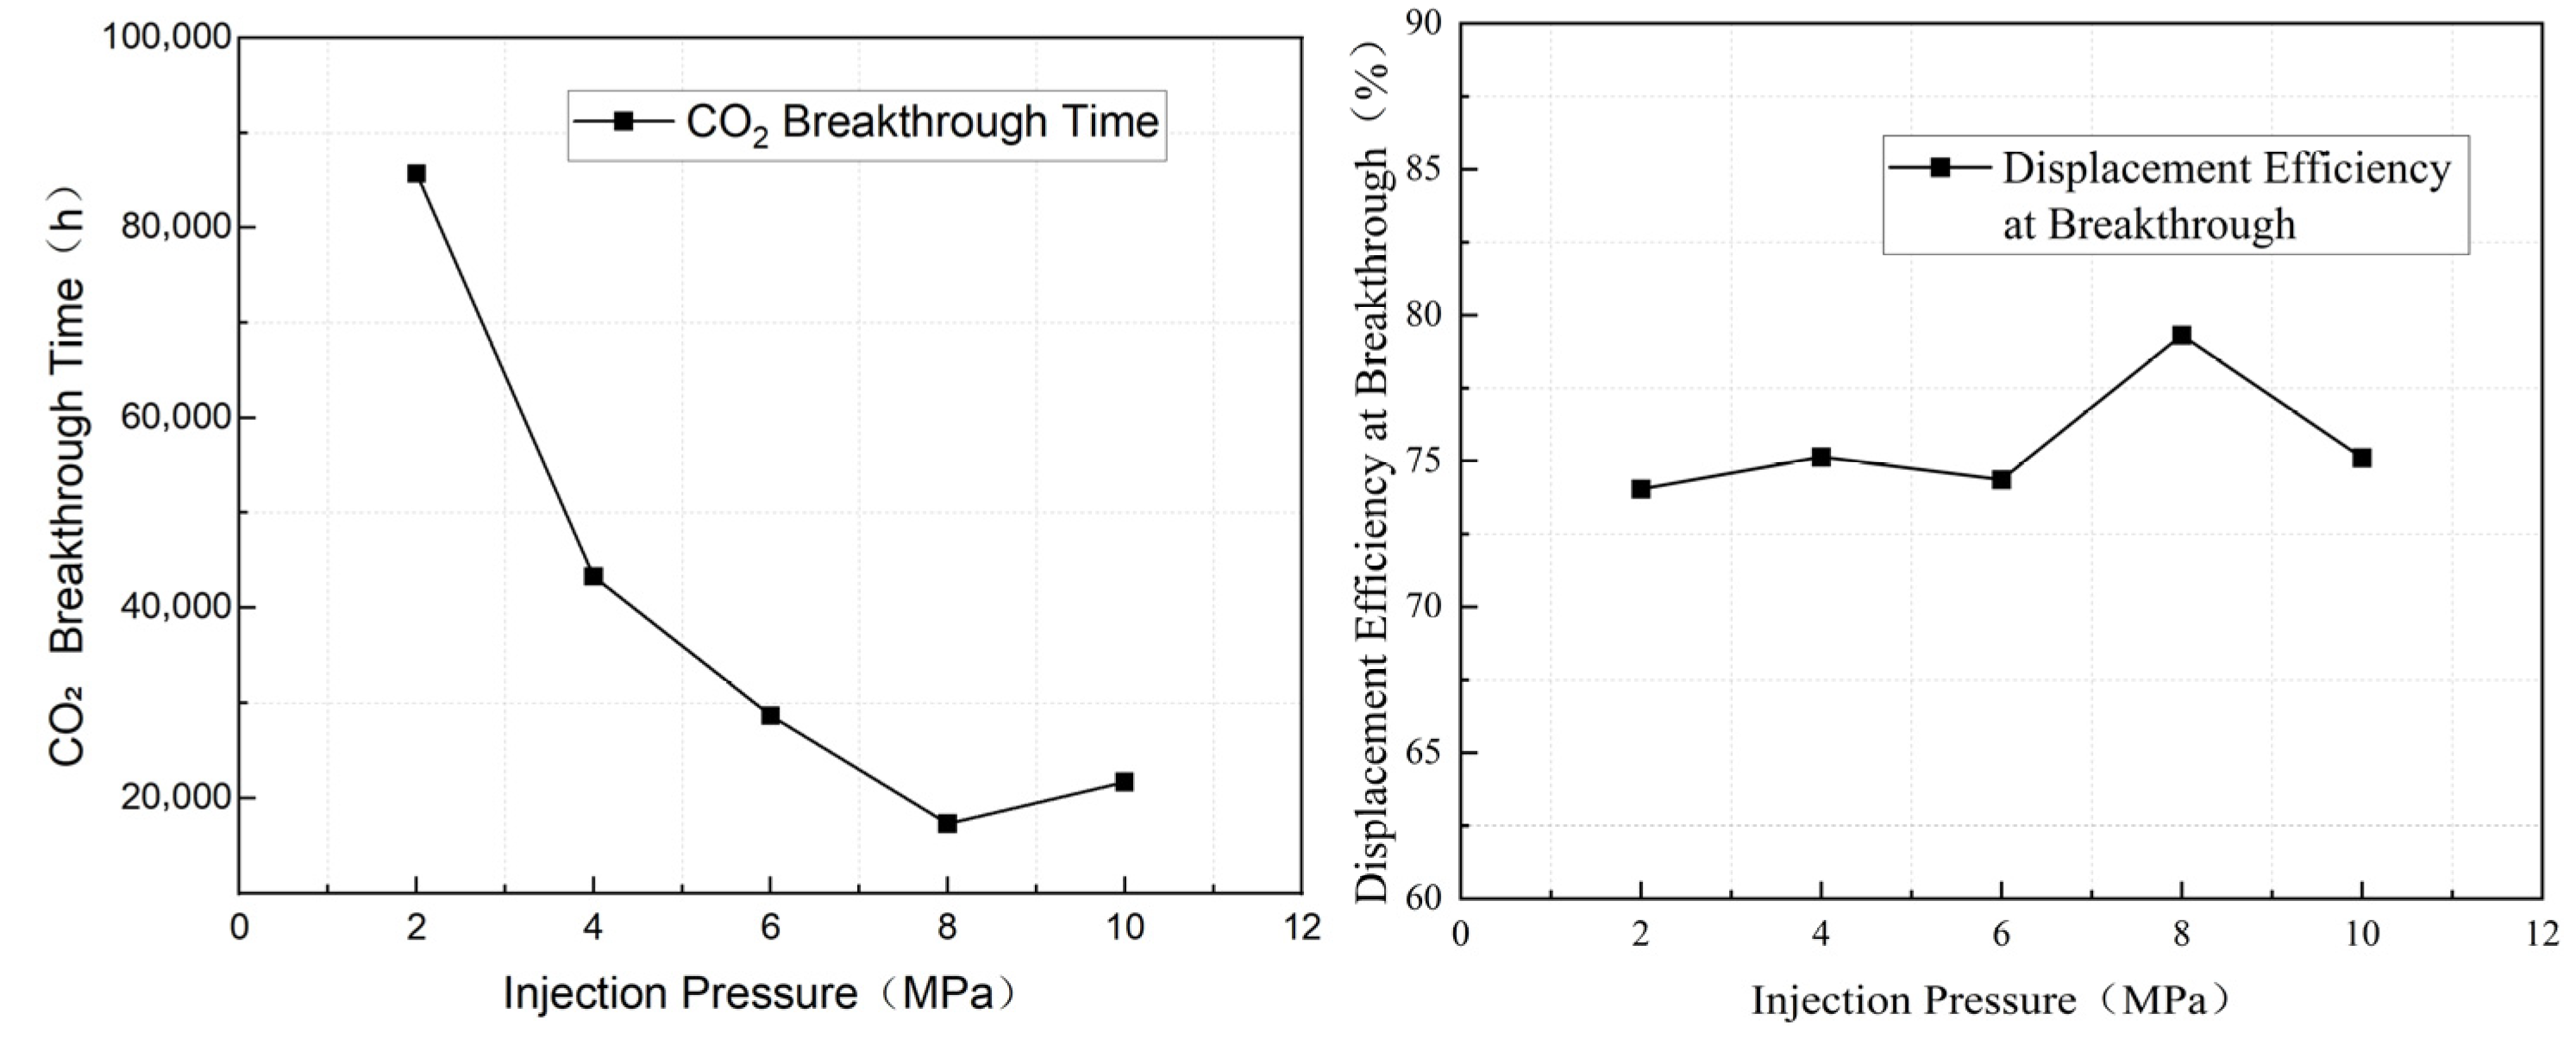
To account for the pressure-driven effects during CO2 flooding, five injection pressure levels were defined: 2, 4, 6, 8, and 10 MPa. These scenarios were used to simulate the variation of CO2 flooding behavior under different injection–production pressure differentials.
3.
Reservoir heterogeneity setting (Group E)
Permeability contrast reflects the variation in flow capacity among reservoir sublayers and plays a critical role in controlling gas migration pathways. In this study, different permeability values were assigned to the seven sublayers, and five contrast scenarios were designed, ranging from nearly homogeneous to highly heterogeneous conditions.

3.2. Multi-Factor Experimental Design

Response Surface Methodology (RSM), which combines mathematical and statistical approaches, is commonly used to model and analyze problems where the response is affected by multiple variables [28,29,30]. Through a well-structured experimental design, a quadratic regression equation is established to describe the relationship between response values and variables. The second-order model is then tested and analyzed to identify the optimal parameter conditions and to evaluate the interaction effects among factors. In this study, Design-Expert software was employed to design a three-factor, three-level experiment (Table 2), resulting in 17 simulation runs (Table 3).
Based on the results of the single-factor simulations, the Box–Behnken design of the RSM was employed to further optimize the experimental conditions. Five major factors were selected as independent variables: fracture number (A), fracture inclination (B), fracture width (C), injection pressure (D), and permeability contrast (E). The breakthrough time T was taken as the response variable. The experimental factors and their levels for optimization are summarized in Table 2.

4. Results and Discussion

4.1. Single-Factor Simulation Results

  • Effect of fracture number
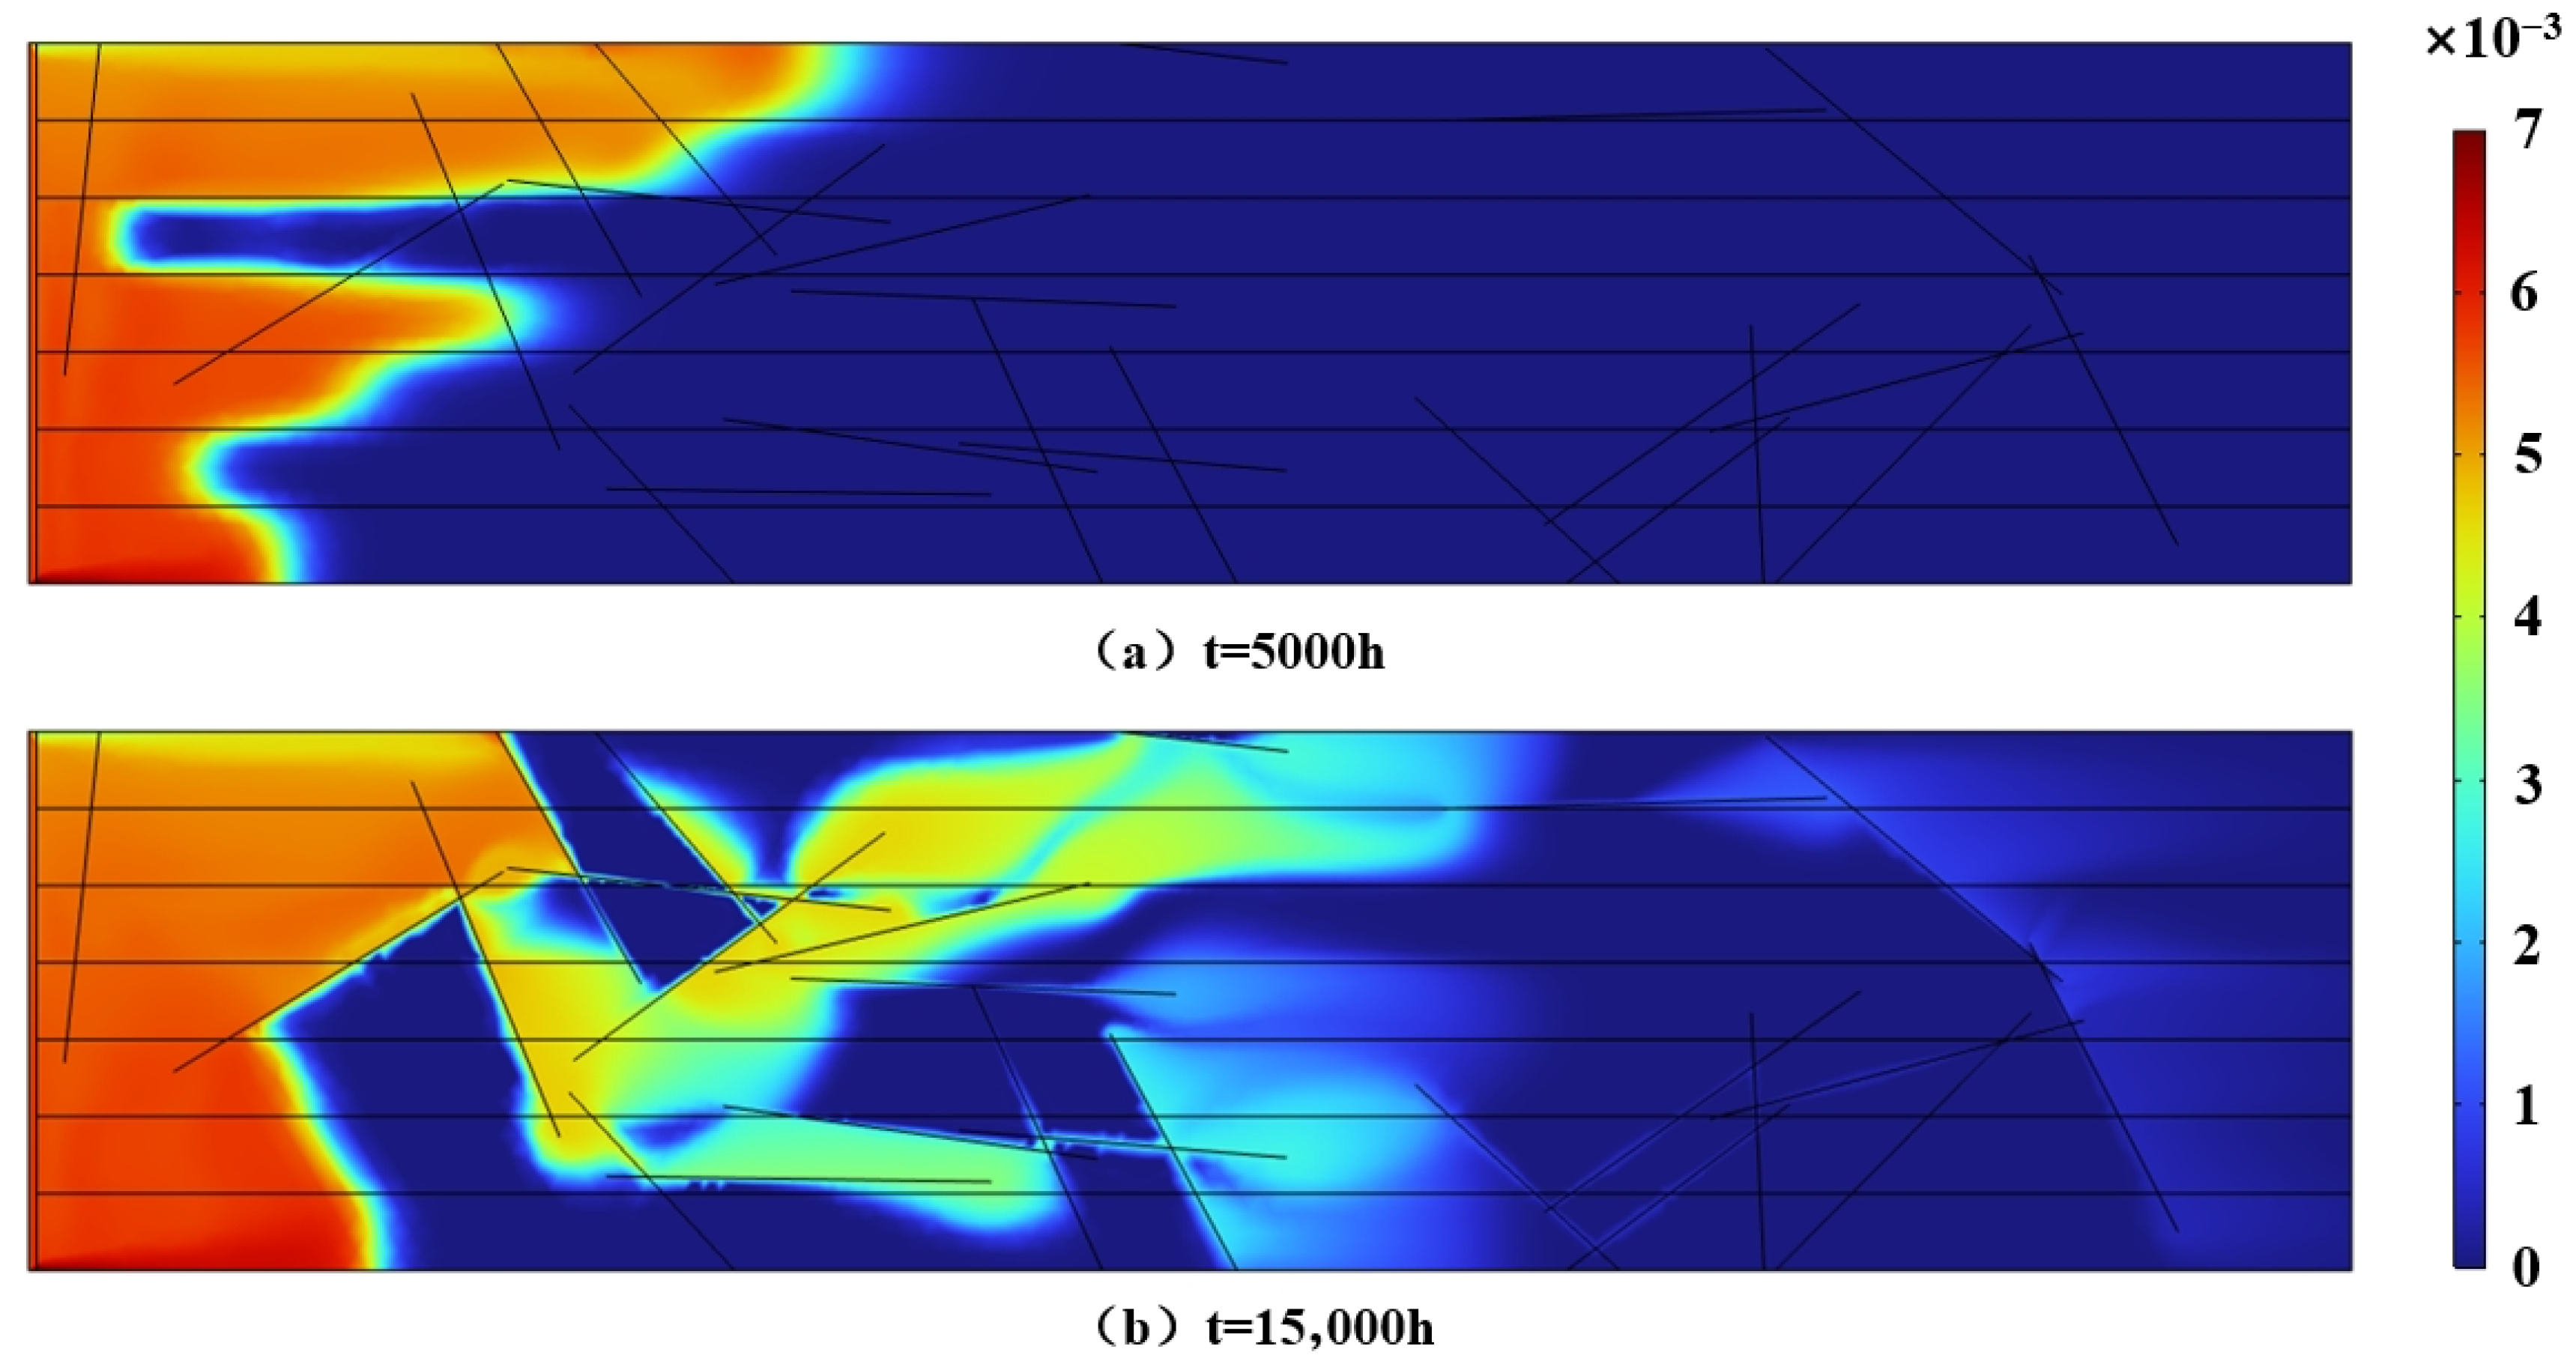
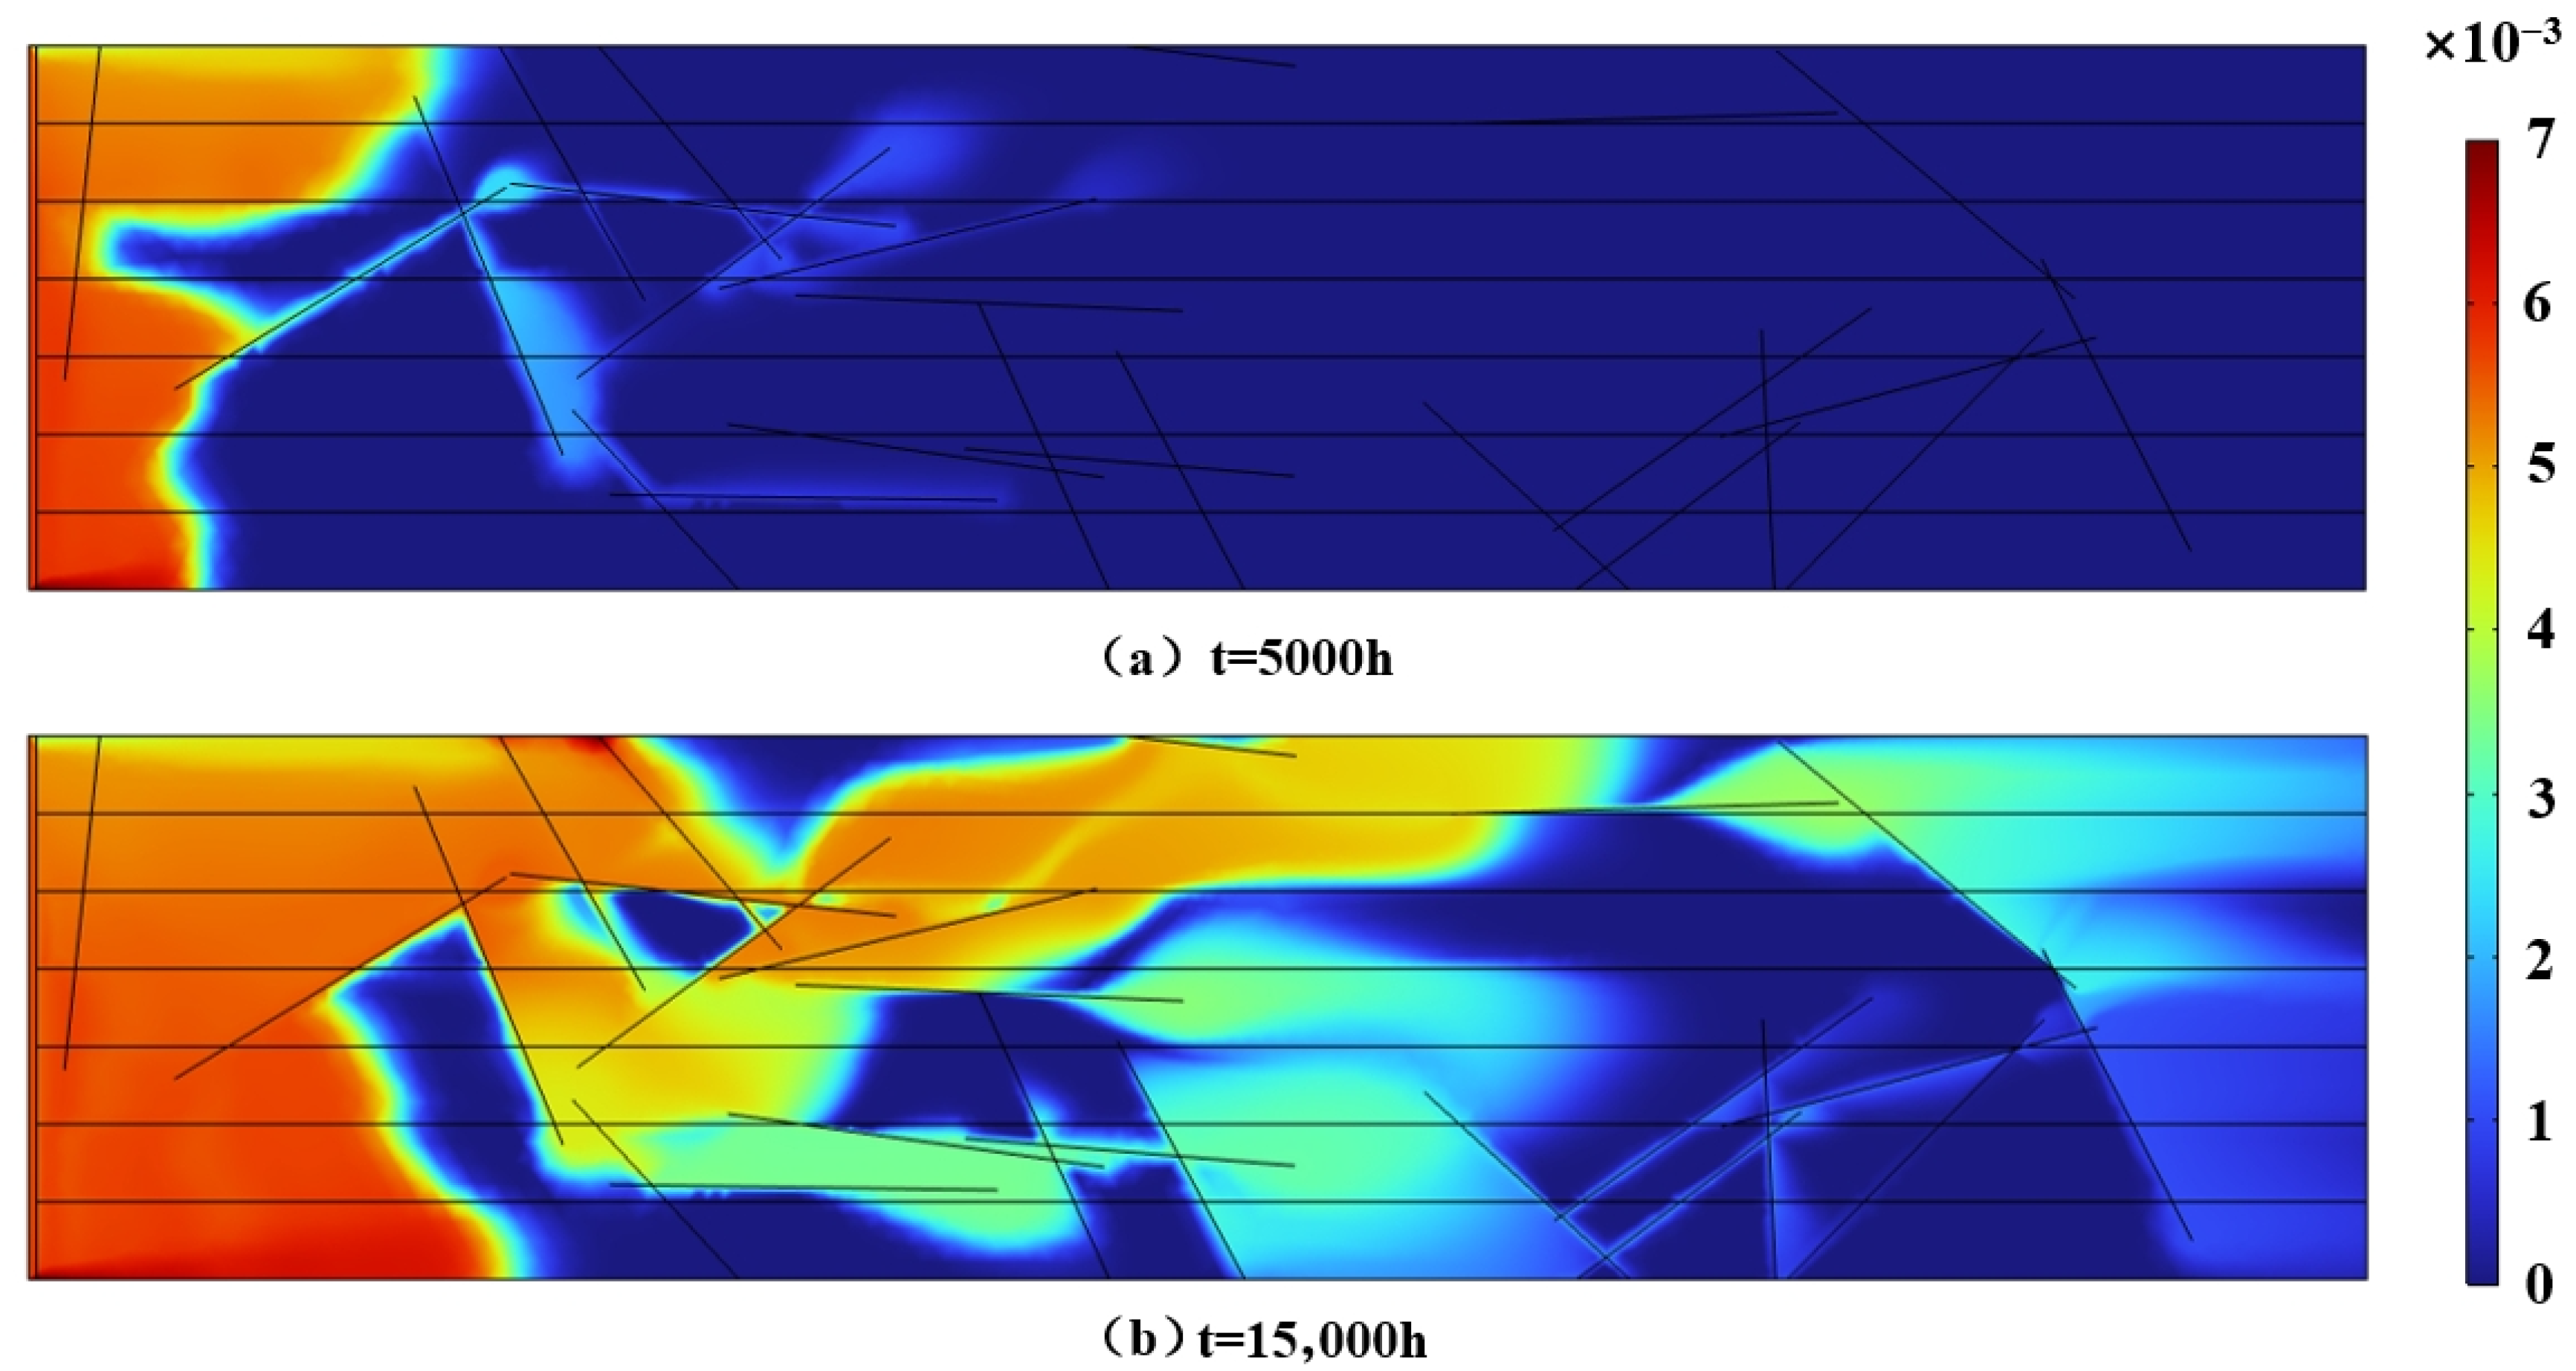
The increase in fracture number has a significant impact on gas channeling behavior. As the number of fractures increases, the flow paths of the gas become more numerous, leading to shorter breakthrough times and more pronounced channeling phenomena. Figure 3 shows the distribution of CO2 in the reservoir at 5000 h under different fracture numbers. (a) When the fracture number is 5, the diffusion of CO2 in the reservoir is limited, breakthrough occurs relatively uniformly, and no obvious preferential flow channels are formed. (b) When the fracture number increases to 75, the number of flow channels increases markedly, CO2 diffusion accelerates, and multiple preferential channels appear, indicating a clear channeling effect.
In comparison, the risk of gas channeling increases significantly with fracture number, resulting in earlier breakthrough and larger unswept regions. Figure 4 summarizes the breakthrough time and sweep efficiency under different fracture numbers. As the fracture number increases from 5 to 75, the breakthrough time decreases gradually; specifically, the breakthrough time is 40,001 h when the fracture number is 5, whereas it drops to 20,101 h when the fracture number is 75. These results indicate that fracture number plays a critical role in controlling gas flow pathways, and that an increase in fracture number promotes the formation of strong preferential channels, thereby accelerating gas breakthrough.
2.
Effect of fracture inclination
Figure 5 shows the CO2 distribution in the reservoir at 5000 h under different fracture inclinations. (a) At a fracture inclination of 0°, the gas flow path along the fracture is relatively uniform, breakthrough is somewhat restricted, the breakthrough region is concentrated, and the flow channel remains narrow. (b) At a fracture inclination of 90°, the number of flow channels increases substantially, gas breakthrough occurs rapidly with a wider sweep range, and pronounced channeling is observed. With larger inclinations, gas tends to migrate along inclined fractures, resulting in shorter breakthrough times.
Figure 6 summarizes the breakthrough time and sweep efficiency under different fracture inclinations. When the fracture inclination is 0°, the breakthrough time is 37,601 h, whereas at 120° it decreases to 15,601 h, with the efficiency dropping to 76.5%. These results demonstrate that greater fracture inclination accelerates gas breakthrough, potentially compromising displacement performance and increasing the likelihood of channeling. Fracture inclination primarily affects the directionality of fluid migration and its coupling with gravitational effects. High-angle fractures easily form direct pathways to the production outlet, leading to premature breakthrough before sufficient displacement occurs. Therefore, fracture inclinations in the range of 30–60° are most favorable for achieving uniform displacement.
3.
Effect of fracture width
Fracture width directly affects the flow capacity of gas. Figure 7 shows the CO2 distribution in the reservoir at 5000 h under different fracture widths. (a) At a fracture width of 0.05 mm, gas diffusion in the reservoir is restricted, the breakthrough region is relatively small, and flow channels remain narrow. (b) At a fracture width of 5 mm, gas breakthrough accelerates significantly, with wider flow channels and a larger spread of gas.
Figure 8 summarizes the breakthrough time and sweep efficiency under different fracture widths. When the fracture width is 0.05 mm, the breakthrough time is 28,001 h, whereas at 0.25 mm it decreases to 14,101 h. This indicates that fracture width plays a critical role in controlling gas conductivity: larger widths shorten the breakthrough time and increase the risk of channeling. The effect of fracture width on sweep efficiency is particularly sensitive. Simulation results show that as fracture width increases from 0.05 mm to 0.25 mm, the sweep efficiency decreases dramatically from 82.7% to 18.4%. These results demonstrate that although wide fractures enhance instantaneous conductivity, they cause gas to concentrate in large channels, thereby reducing the overall sweep efficiency. This phenomenon is especially important in field hydraulic fracturing, suggesting that simply increasing fracture width cannot guarantee production improvement, and displacement uniformity must also be considered.
4.
Effect of injection pressure
Increasing injection pressure significantly accelerates gas flow and shortens breakthrough time. Figure 9 shows the CO2 distribution in the reservoir at 5000 h under different injection pressures. (a) At an injection pressure of 2 MPa, the CO2 front advances relatively slowly, the breakthrough region remains limited, and the flow channels are restricted. (b) At an injection pressure of 10 MPa, breakthrough occurs rapidly, the flow channels expand considerably, and the gas spreads more widely, exhibiting a strong channeling effect.
Figure 10 summarizes the breakthrough time and sweep efficiency under different injection pressures. When the injection pressure is 2 MPa, the breakthrough time is 40,001 h, whereas at 10 MPa it decreases to 15,001 h. These results indicate that higher injection pressure enhances the displacement capacity of CO2 but also increases the risk of channeling, highlighting the need for careful control in field applications. Injection pressure thus exhibits a typical “double-edged sword” effect. Moderate increases in pressure can significantly improve seepage performance in both the matrix and fractures: when the pressure rises from 2 MPa to 6 MPa, the breakthrough efficiency increases from 73.9% to 86.2%. However, further increasing the pressure to 10 MPa reduces the efficiency to 75.8%, as the higher driving force accelerates the CO2 front, causing earlier breakthrough and leaving more unswept regions.
5.
Effect of permeability contrast
Permeability contrast directly reflects reservoir heterogeneity and exerts the most fundamental influence on breakthrough time and sweep efficiency. A larger contrast causes gas to preferentially flow through high-permeability zones, leading to shorter breakthrough times. Figure 11 shows the CO2 distribution in the reservoir at 5000 h under different permeability contrasts. (a) At a contrast of 0.7, the CO2 front advances relatively uniformly, the breakthrough region remains small, and flow paths are concentrated. (b) At a contrast of 9.9, the number of flow channels increases significantly, breakthrough occurs earlier, and the gas spreads over a wider area, indicating pronounced channeling. This enhanced understanding of the CO2 distribution emphasizes the key role of permeability contrast in controlling gas migration. When permeability contrast is high, the CO2 front is more likely to advance through fractures or highly permeable layers, bypassing the matrix and resulting in uneven gas distribution. In contrast, lower permeability contrasts lead to a more uniform distribution of CO2, improving sweep efficiency and delaying breakthrough. The analysis of CO2 distribution at varying permeability contrasts provides a clear visualization of how reservoir heterogeneity influences the dynamics of gas channeling and breakthrough behavior, highlighting the importance of controlling permeability distribution in CO2 flooding operations.
Figure 12 summarizes the breakthrough time and sweep efficiency under different permeability contrasts. When the contrast is 0.7, the breakthrough time is 40,001 h, whereas at 9.9 it decreases sharply to 5001 h. Meanwhile, the breakthrough efficiency decreases markedly from 88.5% to 68.9% as the contrast increases from 0.7 to 9.9. These results demonstrate that greater permeability contrast aggravates flow nonuniformity, with reservoir heterogeneity providing “natural channels” for gas channeling, thereby reducing the effectiveness of CO2 flooding. Consequently, controlling heterogeneity (e.g., by layered injection–production or selective plugging) is a key strategy in field applications to improve sweep efficiency.

4.2. Response Surface Analysis Results

  • Establishment of the second-order mathematical model
Based on the factors and levels defined in the response surface methodology design, simulations were carried out. The experimental design and corresponding results are summarized in Table 3.
The simulation results of breakthrough time were fitted using Design-Expert software, and a second-order mathematical model was established to describe the relationship between the response variable (breakthrough time, T) and the influencing factors. The resulting model is expressed as follows:
T = 78,140.84 − 331.13A − 2,851,134.89C − 12,082.59D − 45.35B−1396.89E + (−58,874.46)AC + 60.54AD − 2.64AB + 6.99AE + 424,242.42CD − 4713.80CB − 74,659.64CE + 7.92DB + 57.07DE − 0.27BE + 0.168A2 + 496,207,869.95C2 + 417.58D2 + 0.71 × B2 − 6.01E2
This regression equation was intentionally expressed in a full quadratic form to capture the nonlinear and coupled effects among multiple variables. Although the expression appears complex, it ensures high predictive accuracy and provides a rigorous basis for analyzing the sensitivity and interaction of fracture parameters.
2.
Validation and significance testing of the second-order model
The validity of the second-order mathematical model for breakthrough time was assessed in Design-Expert by examining whether the normal probability distribution of residuals approximated a straight line [31,32]. As shown in Figure 13, the externally studentized residuals are distributed closely along the 45° reference line, without obvious deviations or systematic curvature, indicating that the residuals approximately follow a normal distribution. This confirms that the residuals of the breakthrough time model satisfy the assumption of independence and identical distribution, and the fitting results are statistically valid.
Significance reflects the predictive accuracy of a mathematical model with respect to the experimental results [33,34]. To evaluate the significance of the second-order model, an analysis of variance (ANOVA) was conducted. The significance level was determined by the p-value: p < 0.01 indicates a highly significant effect, 0.01 < p < 0.05 indicates a significant effect, and p > 0.05 indicates an insignificant effect. The ANOVA results for the second-order response surface model are presented in Table 4. As shown in Table 4, the second-order response surface model for breakthrough time is statistically significant and can be reliably used for analysis and prediction.
3.
Interaction analysis based on response surfaces
Response surface curves and contour plots, generated by the quadratic regression equation, are effective tools for analyzing the interaction effects between two factors [35,36]. By analyzing the response surfaces and contour plots, the optimal experimental parameters can be identified. The slope of the response surface shows the sensitivity of the response to changes in conditions. A steep slope indicates a high sensitivity, while a gentle slope suggests limited impact. The shape of the contour lines intuitively illustrates the strength of the interaction effect, where an elliptical shape usually indicates a significant interaction between two factors, while a circular shape suggests a weak or negligible interaction.
  • Fracture number and fracture width
For narrow fractures with limited conductivity, increasing the fracture number effectively expands seepage pathways and improves the sweep area. In contrast, wide fractures provide highly efficient channels, where increasing the fracture number intensifies preferential flow and accelerates gas channeling. When fracture width exceeds 0.005 m, an increase in fracture number causes the breakthrough time to rapidly drop to less than 10,000 h. The contour plots in Figure 14 exhibit a clear elliptical shape, indicating a significant interaction between these two factors.
2.
Fracture number and injection pressure
Fracture number and injection pressure significantly interact. Under low pressure (≤4 MPa), increasing the fracture number delays breakthrough, extending the time from about 15,000 h to over 40,000 h. However, at high injection pressures (≥8 MPa), even with fewer fractures, breakthrough time rapidly decreases to less than 10,000 h. At low pressures, gas flow is constrained, and additional fractures help disperse flow channels and slow the advance of the gas front. In contrast, under high-pressure conditions, the driving force is so strong that channeling cannot be suppressed, and the gas front almost directly connects to the production outlet. The contour plots in Figure 15 are nearly parallel straight lines, indicating that injection pressure is the dominant factor, while fracture number only regulates breakthrough behavior under low-to-moderate pressures.
3.
Fracture number and fracture inclination
The coupling effect between fracture number and inclination exhibits a “regulation threshold”: when the fracture number is large, a reasonable design of fracture inclination (inclined type) can significantly suppress gas channeling. The contour plots appear elliptical, indicating an interactive regulatory relationship between the two factors. With increasing fracture number, the influence of fracture inclination on breakthrough time becomes more pronounced. At low fracture numbers, breakthrough time is mainly controlled by fracture number (approximately 15,000–20,000 h). When the fracture number reaches ≥50, increasing inclination from 0° to 60° extends breakthrough time to 30,000–35,000 h. However, further increasing the inclination to 120° shortens breakthrough time to less than 20,000 h. These results suggest that moderate fracture inclinations (30–60°) improve the vertical and horizontal distribution of gas and delay the gas front, whereas excessively large inclinations create direct flow paths and accelerate breakthrough.
4.
Optimization and validation of experimental conditions
The experimental data were processed using Design-Expert 13.0 software. Based on regression model analysis, the optimal displacement conditions were determined, as summarized in Table 5, under which the breakthrough time was maximized. Validation experiments conducted under the optimal conditions showed that the breakthrough time fell within the 95% confidence interval of the model prediction, confirming that process parameter optimization using response surface methodology is both reliable and applicable.
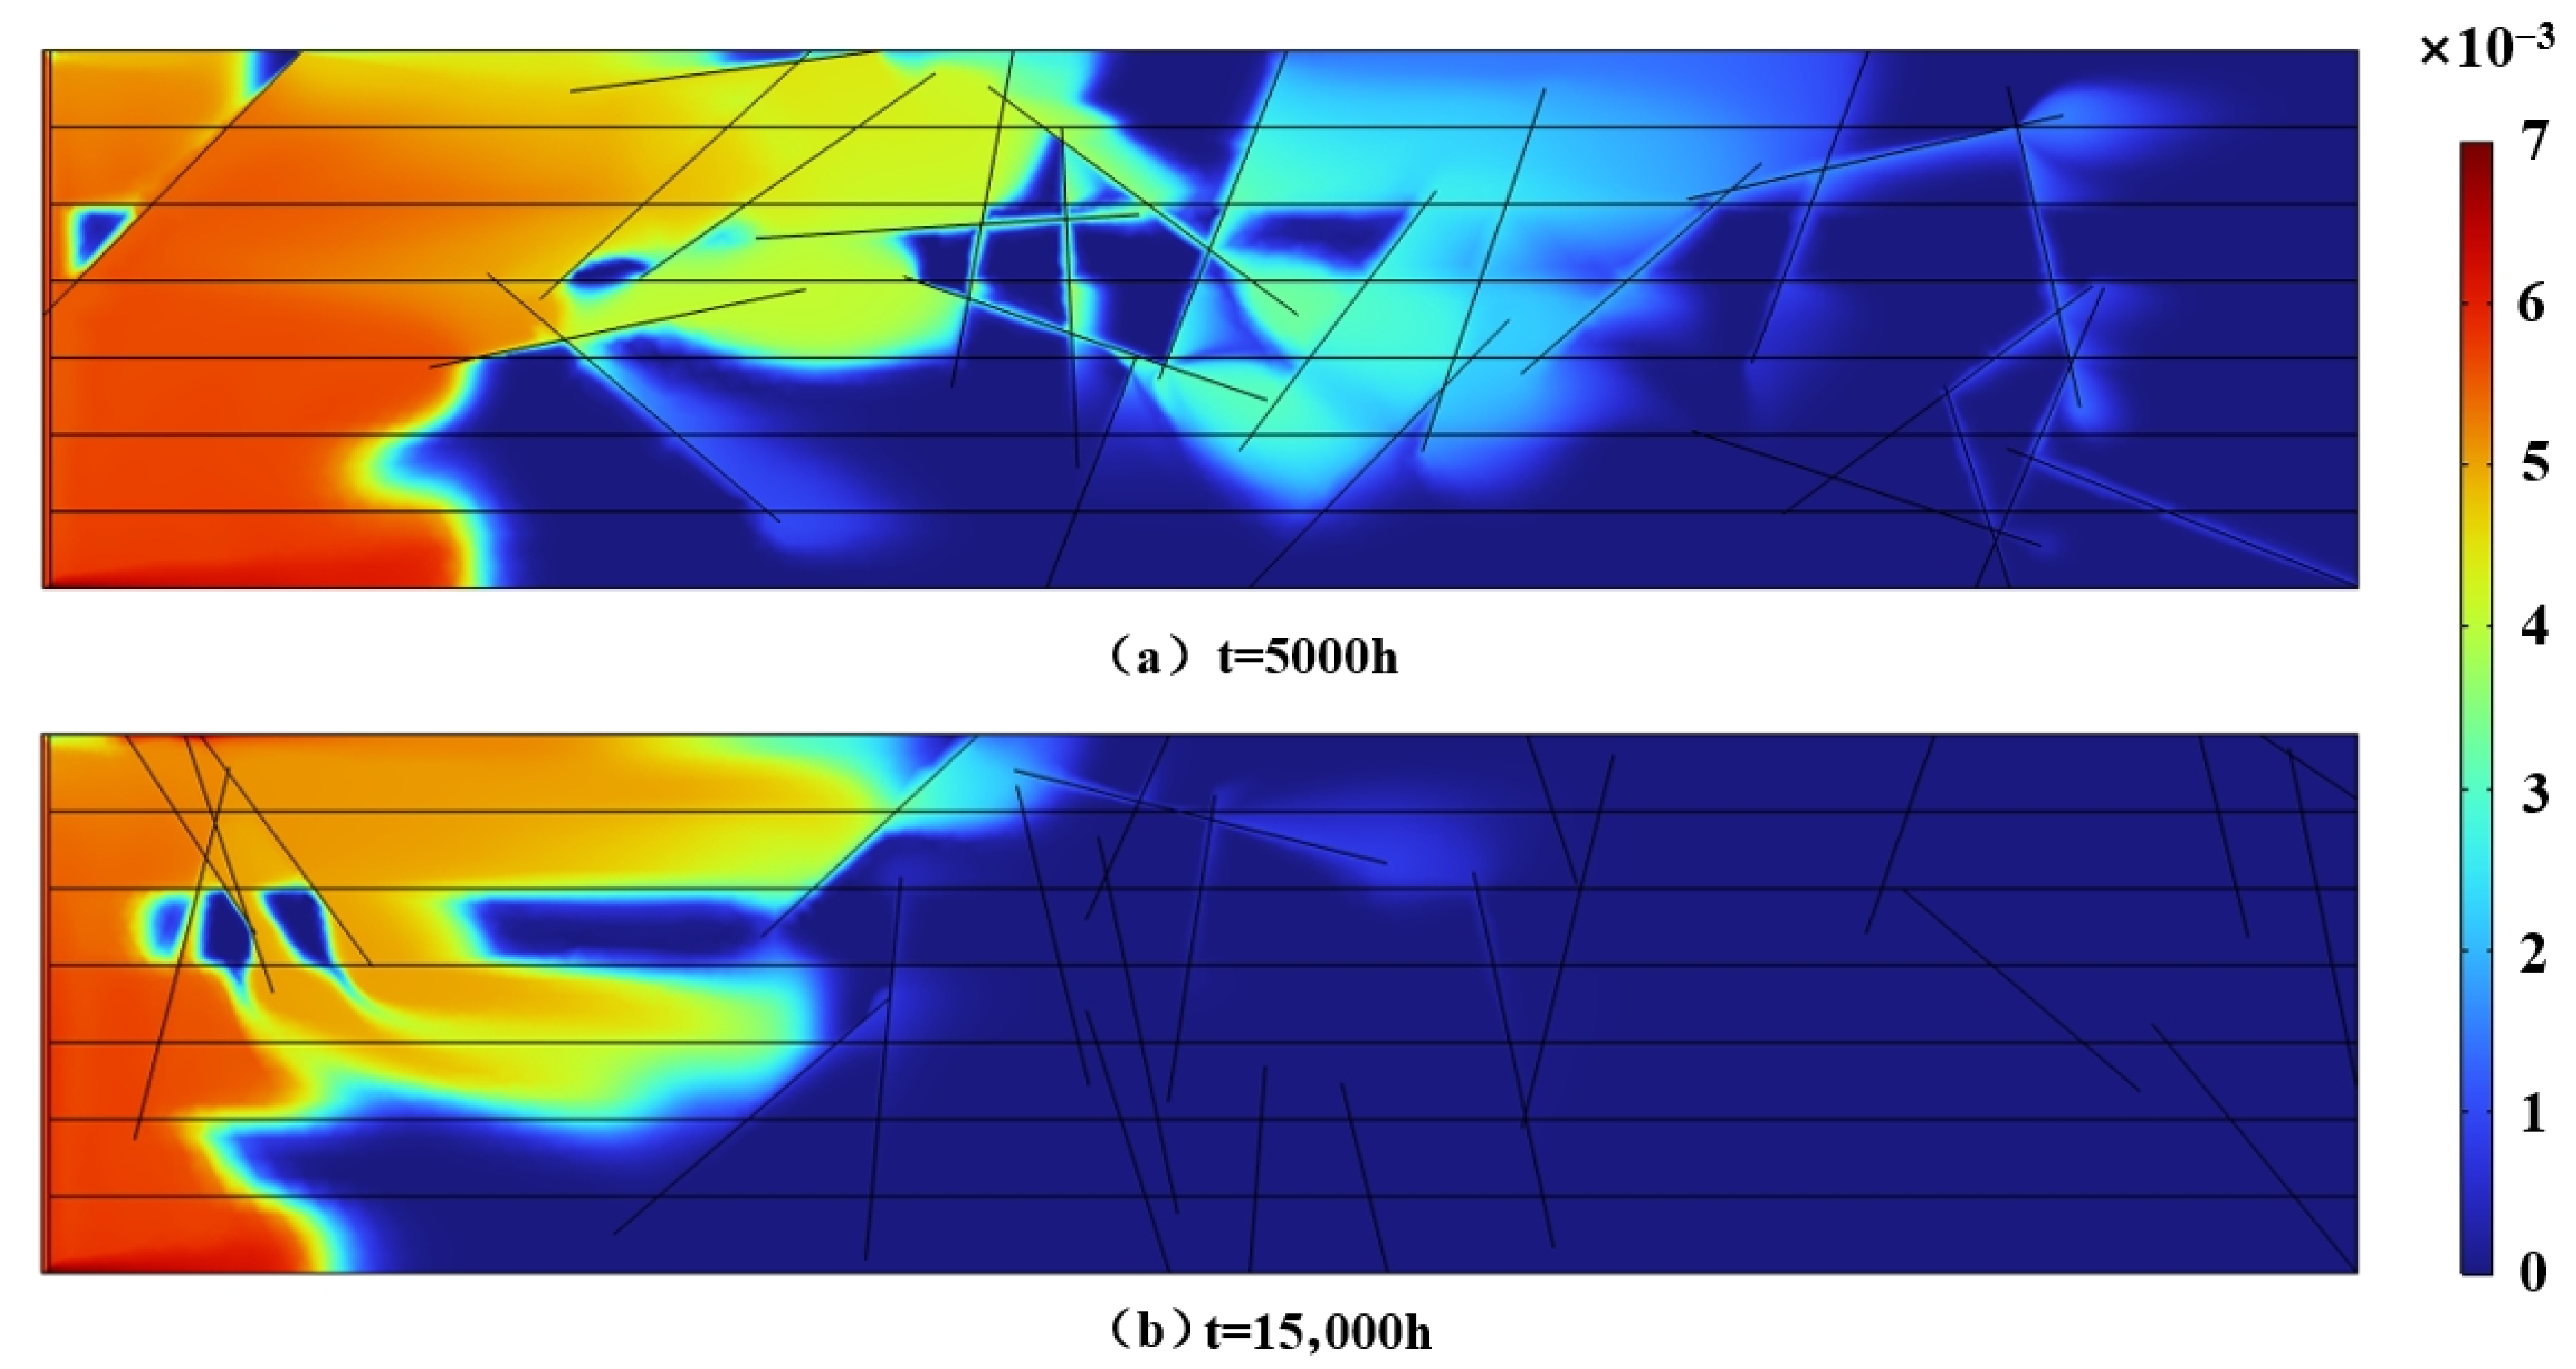
Figure 16 and Figure 17 illustrate the CO2 concentration distribution in the reservoir under the optimized injection–production parameters at different times. (a) At t = 5000 h, the CO2 front advanced uniformly within the reservoir without forming obvious high-permeability breakthrough channels. (b) At t = 15,000 h, although the gas front had propagated substantially, the overall displacement remained relatively uniform, with no severe direct channels in high-permeability zones, and the matrix region was effectively swept. Compared with the non-optimized scenario, gas migration under optimized conditions was more stable, breakthrough time was significantly extended, and sweep efficiency was notably improved. These results demonstrate that the parameter combinations determined by response surface methodology can effectively suppress gas channeling and enhance the sweep efficiency.
It is worth noting that while the proposed fracture–matrix coupled model successfully reproduces the dominant mechanisms of CO2 migration and gas channeling in tight sandstone reservoirs, its applicability remains constrained by several simplifying assumptions. The present numerical framework does not yet consider geochemical interactions, long-term stress sensitivity, or field-scale heterogeneity, all of which may influence CO2 migration and storage performance. Moreover, the model adopts a two-dimensional configuration, which, although providing valuable mechanistic insights, cannot fully capture the three-dimensional connectivity of fractures and the tortuosity of fluid pathways in actual reservoirs. Future work will therefore extend this framework to a three-dimensional thermo–hydro–mechanical–chemical (THMC) coupling scheme to better simulate realistic reservoir behavior.
In addition, although the optimized parameters (e.g., injection pressure of approximately 2.3 MPa) maximize breakthrough time and sweep efficiency from a technical perspective, their economic feasibility depends on the achievable production rate and compression cost under field conditions. Hence, practical implementation should balance channeling control, recovery enhancement, and overall economic efficiency to ensure the sustainable development of CO2-EGR projects in tight gas reservoirs.

5. Conclusions

By combining fracture–matrix-coupled numerical simulation with response surface analysis, this study systematically investigated the effects of fracture geometry, injection pressure, and permeability contrast on gas channeling behavior during CO2 flooding in tight gas reservoirs, and revealed the key controlling factors and their interaction mechanisms.
Fracture geometry, injection pressure, and permeability contrast jointly determine gas channeling in CO2 flooding of tight reservoirs. A moderate fracture density delays breakthrough and improves sweep efficiency; fracture inclinations between 30° and 60° are most favorable for uniform displacement, while high inclinations aggravate direct channeling. Both fracture width and injection pressure exhibit “threshold effects”, where excessive width or high pressure accelerates breakthrough. Permeability contrast is the fundamental factor influencing channeling risk: when the contrast increases from 0.7 mD to 9.9 mD, breakthrough efficiency decreases from 88.5% to 68.9%. This indicates that controlling heterogeneity (e.g., layered injection–production or selective plugging) is essential for enhancing the stability and sweep efficiency of CO2 flooding in field applications.
Response surface analysis further revealed significant interactions among fracture number–width, number–pressure, and number–inclination, with elliptical contour plots indicating that multi-factor coupling strongly alters breakthrough time and sweep efficiency. The optimal conditions obtained from RSM are approximately 12 fractures, an injection pressure of 2.3 MPa, fracture inclination of 105°, fracture width of 0.0046 m, and permeability contrast of ~1. Under these conditions, the breakthrough time is extended to 46,984 h, with a sweep efficiency of 87.7% at breakthrough. These results validate the reliability of the model and provide an operational basis for risk evaluation and control of gas channeling during CO2 flooding in tight gas reservoirs.

Author Contributions

Conceptualization, H.Y. (Haijun Yan); Methodology, H.Y. (Haijun Yan); Software, G.C.; Validation, G.C.; Formal analysis, J.G.; Investigation, R.W.; Resources, R.W.; Data curation, B.N. and X.W.; Writing—original draft, X.W.; Writing—review & editing, H.Y. (He Yuan); Visualization, H.Y. (He Yuan); Project administration, H.L. All authors have read and agreed to the published version of the manuscript.

Funding

This work was supported by China National Science and Technology Project (NO. 2025ZD1404300); Project of Science and Technology of PetroChina Oil, Gas and New Energy Company (NO. 2023YQX105); Project of Science and Technology of PetroChina (NO. 2024DJ86).

Data Availability Statement

The raw data supporting the conclusions of this article will be made available by the authors on request.

Acknowledgments

The authors would like to acknowledge the support of the Research Institute of Petroleum Exploration and Development for providing laboratory facilities and geological data from the Shihezi Formation, and the Institute of New Energy and Low-Carbon Technology, Sichuan University, for helpful discussions during model development and analysis.

Conflicts of Interest

Authors Haijun Yan, Gang Cheng, Jianlin Guo, Bo Ning and He Yuan and Huaxun Liu were employed by the company PetroChina. The remaining authors declare that the research was conducted in the absence of any commercial or financial relationships that could be construed as a potential conflict of interest. The authors declare that this study received funding from PetroChina Oil, Gas and New Energy Company and PetroChina. The funder was not involved in the study design, collection, analysis, interpretation of data, the writing of this article or the decision to submit it for publication.

References

  1. Ma, X.; He, D.; Wei, Y.; Guo, J.; Jia, C. Enhanced gas recovery: Theory, technology, and prospects. Nat. Gas Ind. B 2023, 10, 393–405. [Google Scholar] [CrossRef]
  2. Sun, Y.; Zuo, L.; Li, X.; Liu, X. Enhancing shale gas recovery by carbon dioxide injection: A method of carbon capture, utilization and storage (CCUS). Process. Saf. Environ. Prot. 2023, 179, 484–492. [Google Scholar] [CrossRef]
  3. Fahandezhsaadi, M.; Amooie, M.A.; Hemmati-Sarapardeh, A.; Ayatollahi, S.; Schaffie, M.; Ranjbar, M. Laboratory evaluation of nitrogen injection for enhanced oil recovery: Effects of pressure and induced fractures. Fuel 2019, 253, 607–614. [Google Scholar] [CrossRef]
  4. Xiong, L.; Chen, D.; Yang, Y.; Zhang, L.; Li, S.; Wang, Q. Accumulation mechanism and enrichment model of deep tight sandstone gas in second member of Upper Triassic Xujiahe Formation, Xinchang structural belt, Sichuan Basin, SW China. Pet. Explor. Dev. 2025, 52, 907–920. [Google Scholar] [CrossRef]
  5. Mabuza, M.; Premlall, K.; Daramola, M.O. Modelling and thermodynamic properties of pure CO2 and flue gas sorption data on South African coals using Langmuir, Freundlich, Temkin, and extended Langmuir isotherm models. Int. J. Coal. Sci. Technol. 2022, 9, 45. [Google Scholar] [CrossRef]
  6. English, J.M.; English, K.L. An overview of carbon capture and storage and its potential role in the energy transition. First Break 2022, 40, 35–40. [Google Scholar] [CrossRef]
  7. Liu, J.; Xie, L.-Z.; He, B.; Zhao, P.; Ding, H.-Y. Performance of free gases during the recovery enhancement of shale gas by CO2 injection: A case study on the depleted Wufeng–Longmaxi shale in northeastern Sichuan Basin, China. Pet. Sci. 2021, 18, 530–545. [Google Scholar] [CrossRef]
  8. Rezk, M.G.; Adebayo, A.R. An insight into hydrogen and carbon dioxide displacement and trapping efficiencies in carbonate formations through NMR and core flooding. Int. J. Hydrogen Energy 2024, 86, 890–898. [Google Scholar] [CrossRef]
  9. Al-Hashami, A.; Ren, S.R.; Tohidi, B. CO2 Injection for enhanced gas recovery and geo-storage: Reservoir simulation and economics. In Proceedings of the SPE Europec/EAGE Annual Conference, Madrid, Spain, 13–16 June 2005. [Google Scholar]
  10. Zhang, K.; Lau, H.C.; Chen, Z. Regional carbon capture and storage opportunities in Alberta, Canada. Fuel 2022, 322, 124224. [Google Scholar] [CrossRef]
  11. Fu, L.; Shao, Y.; Shao, M.; Zhu, T.; Li, X.; Yang, Z.; Zou, J.; Fan, M.; Liao, K. Application and research progress of CO2 stimulation technology in unconventional oil and gas reservoirs: A review and prospect. Energy Fuels 2023, 37, 19400–19418. [Google Scholar] [CrossRef]
  12. Cook, P.J. 11—The CO2CRC otway project in Australia. In Geological Storage of Carbon Dioxide (CO2); Gluyas, J., Mathias, S., Eds.; Woodhead Publishing: London, UK, 2013; pp. 251–277. [Google Scholar] [CrossRef]
  13. Thiez, P.L.; Mosditchian, G.; Torp, T.; Feron, P.; Ritsema, I.; Zweigel, P.; Lindeberg, E. An innovative European integrated project: Castor—CO2 from capture to storage. In Greenhouse Gas Control Technologies 7; Rubin, E.S., Keith, D.W., Gilboy, C.F., Wilson, M., Morris, T., Gale, J., Thambimuthu, K., Eds.; Elsevier Science Ltd.: Oxford, UK, 2005; pp. 2047–2050. [Google Scholar] [CrossRef]
  14. Zhang, Y.-Q.; Yang, S.-L.; Bi, L.-F.; Gao, X.-Y.; Shen, B.; Hu, J.-T.; Luo, Y.; Zhao, Y.; Chen, H.; Li, J. A technical review of CO2 flooding sweep-characteristics research advance and sweep-extend technology. Pet. Sci. 2025, 22, 255–276. [Google Scholar] [CrossRef]
  15. van der Burgt, M.J.; Cantle, J.; Boutkan, V.K. Carbon dioxide disposal from coal-based IGCC’s in depleted gas fields. Energy Convers. Manag. 1992, 33, 603–610. [Google Scholar] [CrossRef]
  16. Patel, M.J.; May, E.F.; Johns, M.L. High-fidelity reservoir simulations of enhanced gas recovery with supercritical CO2. Energy 2016, 111, 548–559. [Google Scholar] [CrossRef]
  17. Tian, M.; Wu, Y.; Shi, Y.; Cao, G.; Sun, Y.; Li, M.; Wang, W.; Gao, L.; Wang, Z.; Li, Y. Experimental Investigation on Temperature-Resistant CO2 Foam Flooding in a Heterogenous Reservoir. Energies 2025, 18, 89. [Google Scholar] [CrossRef]
  18. Hasan, M.; Eliebid, M.; Mahmoud, M.; Elkatatny, S.; Shawabkeh, R. Enhanced gas recovery (EGR) methods and production enhancement techniques for shale & tight gas reservoirs. In Proceedings of the SPE Kingdom of Saudi Arabia Annual Technical Symposium and Exhibition, Dammam, Saudi Arabia, 24–27 April 2017. [Google Scholar]
  19. Zhao, X.; Chen, Z.; Wang, B.; Liao, X.; Li, D.; Zhou, B. A Multi-medium and Multi-mechanism model for CO2 injection and storage in fractured shale gas reservoirs. Fuel 2023, 345, 128167. [Google Scholar] [CrossRef]
  20. Omari, A.; Wang, C.; Li, Y.; Xu, X. The progress of enhanced gas recovery (EGR) in shale gas reservoirs: A review of theory, experiments, and simulations. J. Pet. Sci. Eng. 2022, 213, 110461. [Google Scholar] [CrossRef]
  21. Wang, Z.; Kong, Y.; Li, W. Review on the development of China’s natural gas industry in the background of “carbon neutrality”. Nat. Gas Ind. B 2022, 9, 132–140. [Google Scholar] [CrossRef]
  22. Luo, F.; Xu, R.-N.; Jiang, P.-X. Numerical investigation of the influence of vertical permeability heterogeneity in stratified formation and of injection/production well perforation placement on CO2 geological storage with enhanced CH4 recovery. Appl. Energy 2013, 102, 1314–1323. [Google Scholar] [CrossRef]
  23. Li, Y.; Fan, A.; Yang, R.; Sun, Y.; Lenhardt, N. Braided deltas and diagenetic control on tight sandstone reservoirs: A case study on the Permian Lower Shihezi Formation in the southern Ordos Basin (central China). Sediment. Geol. 2022, 435, 106156. [Google Scholar] [CrossRef]
  24. Wu, Y.; Liu, C.; Ouyang, S.; Luo, B.; Zhao, D.; Sun, W.; Awan, R.S.; Lu, Z.; Li, G.; Zang, Q. Investigation of pore-throat structure and fractal characteristics of tight sandstones using HPMI, CRMI, and NMR methods: A case study of the lower Shihezi Formation in the Sulige area, Ordos Basin. J. Pet. Sci. Eng. 2022, 210, 110053. [Google Scholar] [CrossRef]
  25. Yu, T.; Yin, Z. Integrated characterization of a tight sandstone gas reservoir: Member 8 Permian Shihezi Formation, Su49-01 Block, Sulige gas field, Ordos Basin, China. In Proceedings of the SPG/SEG 2016 International Geophysical Conference, Beijing, China, 20–22 April 2016. Global Meeting Abstracts. [Google Scholar] [CrossRef]
  26. Koohbor, B.; Colombano, S.; Harrouet, T.; Deparis, J.; Lion, F.; Davarzani, D.; Ataie-Ashtiani, B. The effects of water table fluctuation on LNAPL deposit in highly permeable porous media: A coupled numerical and experimental study. J. Contam. Hydrol. 2023, 256, 104183. [Google Scholar] [CrossRef]
  27. Huang, Y.; Pang, Z.; Kong, Y.; Watanabe, N. Assessment of the high-temperature aquifer thermal energy storage (HT-ATES) potential in naturally fractured geothermal reservoirs with a stochastic discrete fracture network model. J. Hydrol. 2021, 603, 127188. [Google Scholar] [CrossRef]
  28. Hu, Z.; Liu, R.; Li, K.; Wang, Z.; Gu, K.; He, W. Performance analysis and design optimization of a novel Trombe wall system using CFD and response surface method. Energy 2025, 324, 136031. [Google Scholar] [CrossRef]
  29. Tiwari, S.; Kumar, A.; Gupta, N.; Tiwari, G.; Sharma, P. Hydrogen storage systems performance and design parameters using response surface methods and sensitivity analysis. Renew. Sustain. Energy Rev. 2024, 202, 114628. [Google Scholar] [CrossRef]
  30. Assareh, M.; Yavari, P.; Jamil, M.; Rafiei, B.; Assareh, E. Thermodynamic analysis of a multiple energy production system based on geothermal energy for commissioning in Canada and optimization by response surface method (RSM). Energy 2024, 302, 131669. [Google Scholar] [CrossRef]
  31. Rahimi-Esbo, M.; Rezaei Firouzjaee, M.; Bagherian Farahabadi, H.; Alizadeh, E. Performance investigation of a standalone renewable energy system using response surface methodology (RSM): 4E analysis and multi-objective optimization. Energy Convers. Manag. 2024, 299, 117752. [Google Scholar] [CrossRef]
  32. Li, F.; Cai, X.; Zhang, Y.; Guo, X.; Jiang, M. Mechanical and permeability analysis and optimization of recycled aggregate pervious concrete based on response surface method. JRM 2022, 11, 1745–1762. [Google Scholar] [CrossRef]
  33. Sun, Q.; Gupta, R.; Zhu, Z.; Sharma, A.; Qiang, S. A new mathematical model for elastic modulus prediction in mortar and concrete. J. Build. Eng. 2025, 100, 111761. [Google Scholar] [CrossRef]
  34. Hagglund, C.R.; Duranceau, S.J. Application of mathematical models to predict permeate water quality in pilot- and full-scale reverse osmosis processes. J. Water Process Eng. 2025, 76, 108167. [Google Scholar] [CrossRef]
  35. Deng, L.; Han, D.; Zhang, L.; Wang, S. Bridge influence surface identification using a physical informed neural network and its application on load transverse localisation. Eng. Struct. 2025, 339, 120618. [Google Scholar] [CrossRef]
  36. Seo, J.; Linzell, D.G. Use of response surface metamodels to generate system level fragilities for existing curved steel bridges. Eng. Struct. 2013, 52, 642–653. [Google Scholar] [CrossRef]
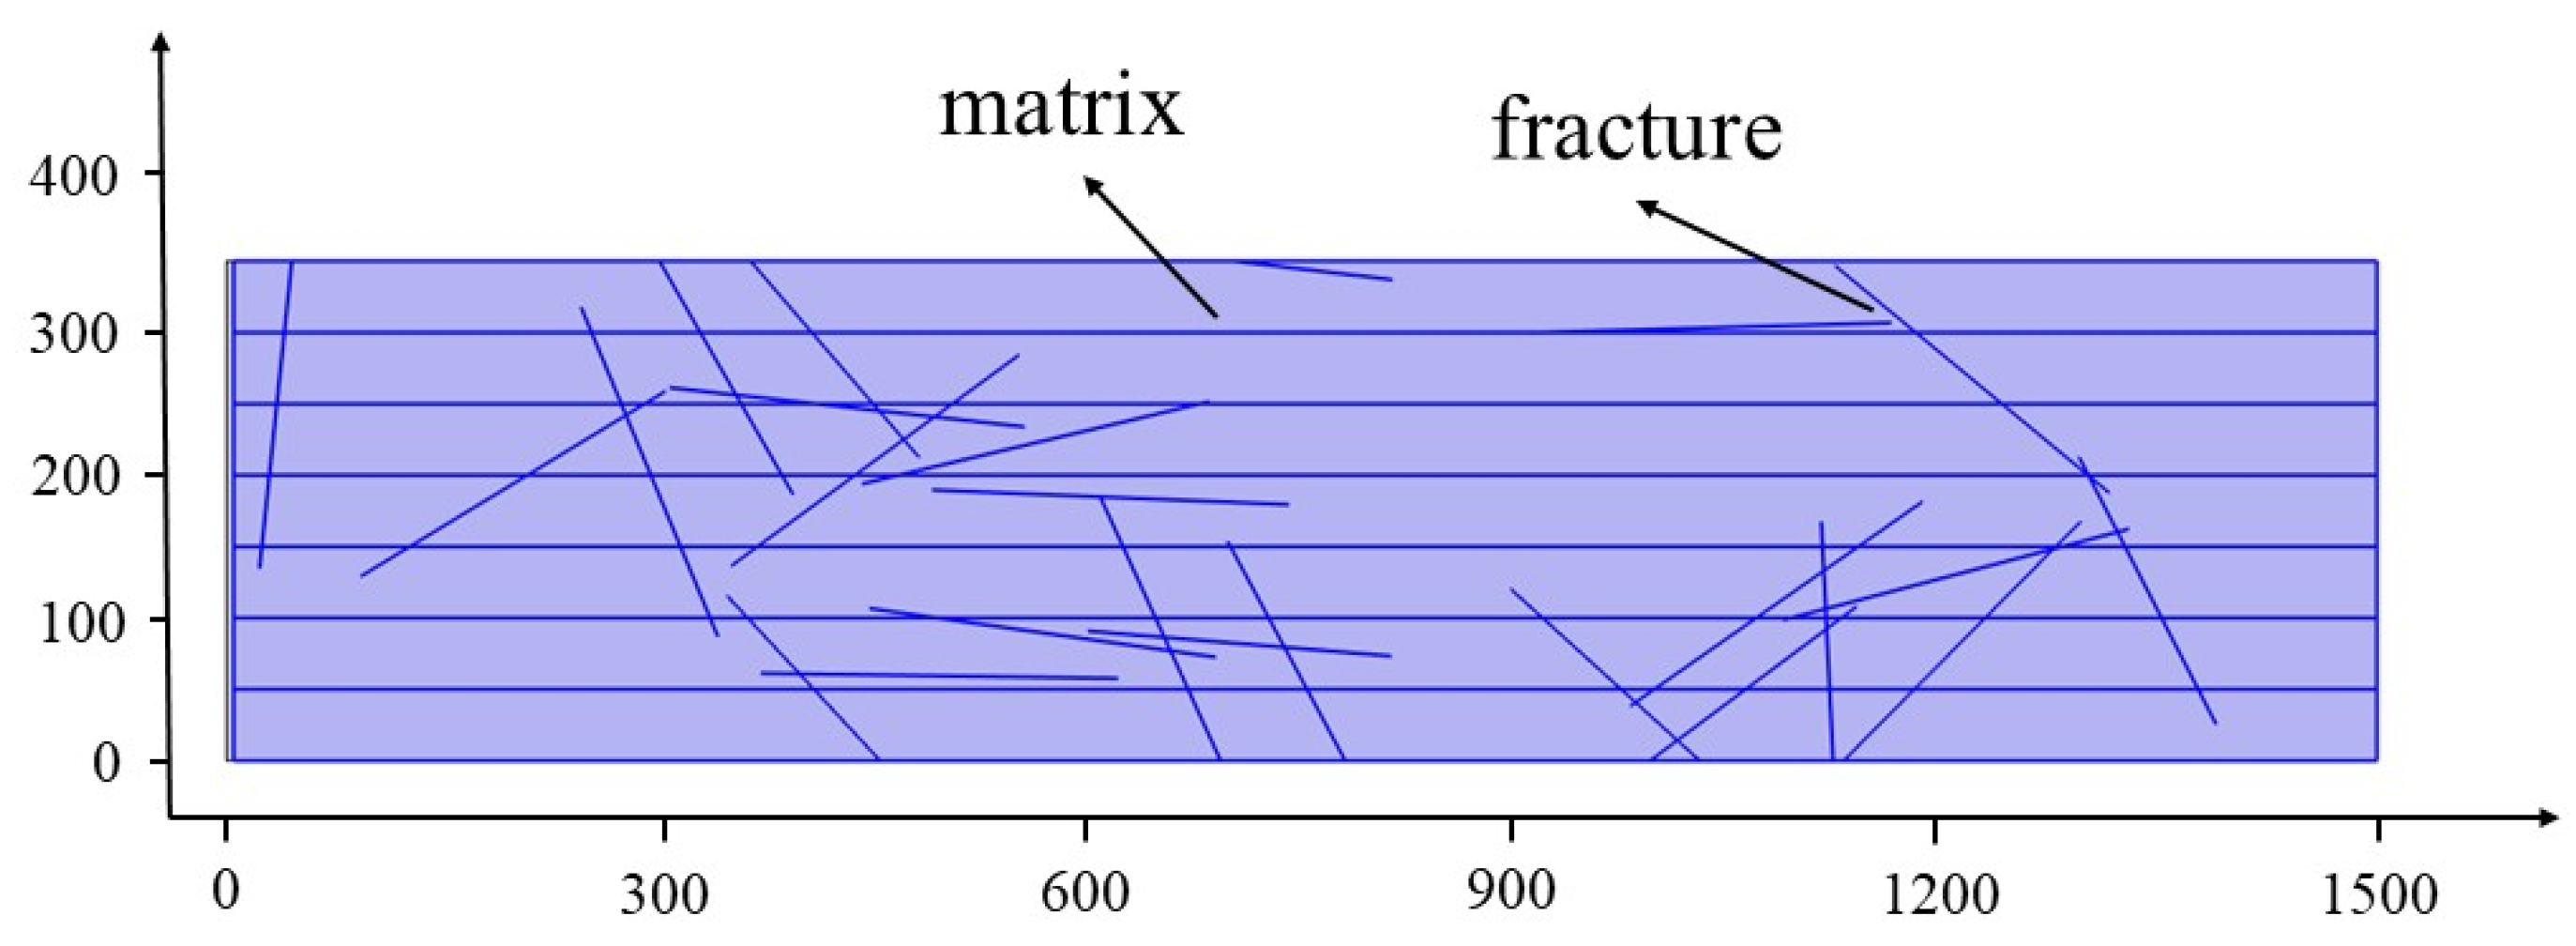
Figure 1. Schematic of the reservoir model.
Energies 18 05584 g001
Figure 2. Grid Independence Test for CO2 Concentration in Export Section.
Energies 18 05584 g002
Figure 3. CO2 distribution in the reservoir at 5000 h under different fracture numbers. (a) Fracture number = 5, (b) fracture number = 75.
Energies 18 05584 g003
Figure 4. Effect of fracture number on breakthrough time and sweep efficiency.
Energies 18 05584 g004
Figure 5. CO2 distribution in the reservoir at 5000 h under different fracture inclinations. (a) 0°, (b) 90°.
Energies 18 05584 g005
Figure 6. Effect of fracture inclination on breakthrough time.
Energies 18 05584 g006
Figure 7. CO2 distribution in the reservoir at 5000 h under different fracture widths. (a) 0.05 mm, (b) 5 mm.
Energies 18 05584 g007
Figure 8. Effect of fracture width on breakthrough time and sweep efficiency.
Energies 18 05584 g008
Figure 9. CO2 distribution in the reservoir at 5000 h under different injection pressures. (a) 2 Mpa, (b) 10 MPa.
Energies 18 05584 g009
Figure 10. Effect of injection pressure on breakthrough time and sweep efficiency.
Energies 18 05584 g010
Figure 11. CO2 distribution in the reservoir at 5000 h under different permeability contrasts. (a) 0.7, (b) 9.9.
Energies 18 05584 g011
Figure 12. Effect of permeability contrast on breakthrough time and sweep efficiency.
Energies 18 05584 g012
Figure 13. Normal probability plot of residuals for the quadratic model of breakthrough time (The colors represent the time at which CO2; first reaches each region, as indicated by the color bar).
Energies 18 05584 g013
Figure 14. Response surface of fracture number and fracture width (The red dots in the figure denote the simulation results obtained from the numerical model).
Energies 18 05584 g014
Figure 15. Response surface of fracture number and injection pressure (The red and pink dots in the figure denote the simulation results obtained from the numerical model).
Energies 18 05584 g015
Figure 16. Response surface of fracture number and fracture inclination (The red and pink dots in the figure denote the simulation results obtained from the numerical model).
Energies 18 05584 g016
Figure 17. Reservoir CO2 concentration distribution under optimized conditions at different times.
Energies 18 05584 g017
Table 1. Design of simulation variables and parameter levels.
CategoryControlling FactorParameter LevelsControl Approach
ANumber of fractures5, 15, 25, 50, 75Control fracture number with fixed distribution
BFracture inclination (°)0, 30, 60, 90, 120Uniform distribution
CFracture permeability (width)5, 1, 0.5, 0.1, 0.05 mmControl fracture conductivity
DInjection–production pressure differential (MPa)2, 4, 6, 8, 10Constant-pressure injection
EPermeability contrast (mD)0.7, 3.0, 4.5, 7.7, 9.9Control layered permeability configuration
Table 2. Experimental factors and corresponding levels for optimization.
LevelFactors
ABCDE
−1500.252520.7
040600.000565.3
1751200.5109.9
Table 3. Optimization experimental design and results.
CategoryABCDEBreakthrough Time
140600.00252529.921,401
27500.00252565.315,001
35605 × 10−565.313,701
440600.002525109.93201
540600.00252565.36601
65600.002525105.313,001
740605 × 10−525.340,801
840600.005105.34001
95600.00252569.911,001
1040600.00560.723,101
114005 × 10−565.313,501
1275605 × 10−565.313,401
1340605 × 10−560.720,901
1451200.00252565.321,301
1540600.00252565.321,001
16401200.00565.39901
1740600.002525100.75601
1875600.00252560.72001
19401200.00252525.327,401
20500.00252565.313,601
21401205 × 10−565.313,601
2240600.00252565.36501
2340600.00569.95701
2440605 × 10−569.96901
254000.00252560.720,501
264000.00252525.337,601
2740600.00525.319,901
2840600.00252565.36501
295600.00565.321,701
3040600.00252565.36501
31401200.002525105.34901
3275600.00252525.32101
3340600.00252565.36501
3440600.00252520.728,001
3540605 × 10−5105.38101
36401200.00252569.92101
374000.002525105.37501
385600.00252525.348,701
395600.00252560.717,301
40401200.00252560.716,401
414000.00565.312,601
4275600.00565.31001
43751200.00252565.3501
444000.00252569.96501
4575600.00252569.9201
4675600.002525105.3301
Table 4. Analysis of variance (ANOVA) for the second-order response surface model.
Source of VariationSum of SquaresDegrees of FreedomMean SquareF-ValuepSignificance
Model4.594 × 109202.297 × 1087.52<0.0001significant
A9.891 × 10819.891 × 10832.40<0.0001
B6.806 × 10716.806 × 1072.230.1479
C2.009 × 10912.009 × 10965.81<0.0001
D5.891 × 10715.891 × 1071.930.1771
E3.686 × 10813.686 × 10812.070.0019
AB1.040 × 10811.040 × 1083.410.0768
AC2.873 × 10812.873 × 1089.410.0051
AD1.232 × 10811.232 × 1084.040.0555
AE5.063 × 10615.063 × 1060.16580.6873
BC7.056 × 10717.056 × 1072.310.1410
BD1.960 × 10611.960 × 1060.06420.8021
BE2.890 × 10612.890 × 1060.09470.7609
CD1.444 × 10711.444 × 1070.47290.4980
CE4.410 × 10614.410 × 1060.14440.7071
DE22,500.00122,500.000.00070.9786
A23.713 × 10513.713 × 1050.01220.9131
B28.063 × 10718.063 × 1072.640.1167
C23.896 × 10813.896 × 10812.760.0015
D25.666 × 10715.666 × 1071.860.1853
E21.409 × 10511.409 × 1050.00460.9464
Residual7.633 × 108253.053 × 107
Lack of Fit5.886 × 108202.943 × 1070.84210.6497not significant
Pure Error1.747 × 10853.495 × 107
Cor Total5.358 × 10945
Table 5. Optimal injection–production parameters and validation results.
ItemFracture Density (Number)Injection Pressure (MPa)Fracture Inclination (°)Fracture Width (m)Permeability ContrastBreakthrough Time (h)Sweep Efficiency (%)
Optimized parameters11.82.28105.40.004580.9746,98487.68
Simulation validation122.3105.40.00458142,99084.31
Disclaimer/Publisher’s Note: The statements, opinions and data contained in all publications are solely those of the individual author(s) and contributor(s) and not of MDPI and/or the editor(s). MDPI and/or the editor(s) disclaim responsibility for any injury to people or property resulting from any ideas, methods, instructions or products referred to in the content.