Article

Experimental Characterization and Modelling of a Humidification–Dehumidification (HDH) System Coupled with Photovoltaic/Thermal (PV/T) Modules

by
Giovanni Picotti
1,*,
Riccardo Simonetti
2,
Luca Molinaroli
2,* and
Giampaolo Manzolini
2
1
School of Mechanical, Medical and Process Engineering, Queensland University of Technology, 2 George St., Brisbane, QLD 4000, Australia
2
Dipartimento di Energia, Politecnico di Milano, Via Lambruschini 4, 20156 Milan, Italy
*
Authors to whom correspondence should be addressed.
Energies 2025, 18(21), 5586; https://doi.org/10.3390/en18215586
Submission received: 3 September 2025 / Revised: 14 October 2025 / Accepted: 21 October 2025 / Published: 24 October 2025

Abstract

Water scarcity is a relevant issue whose impact can be mitigated through sustainable solutions. Humidification–dehumidification (HDH) cycles powered by photovoltaic thermal (PVT) modules enable pure water production in remote areas. In this study, models have been developed and validated for the main components of the system, the humidifier and the dehumidifier. A unique HDH-PVT prototype was built and experimentally tested at the SolarTech Lab of Politecnico di Milano in Milan, Italy. The experimental system is a Closed Air Closed Water—Water Heated (CACW-WH) that mimics a Closed Air Open Water—Water Heated (CAOW-WH) cycle through brine cooling, pure water mixing, and recirculation, avoiding a continuous waste of water. Tests were performed varying the mass flow ratio (MR) between 0.346 and 2.03 during summer and autumn in 2023 and 2024. The experimental results enabled the verification of the developed models. The optimal system performance was obtained for an MR close to 1 and a maximum cycle temperature of 44   ° C , enabling a 0.51 gain output ratio (GOR) and 0.72% recovery ratio (RR). The electrical and thermal energy generation of the PVT modules satisfied the whole consumption of the system enabling pure water production exploiting only the solar resource available. The PVT-HDH system proved the viability of the proposed solution for a sustainable self-sufficient desalination system in remote areas, thus successfully addressing water scarcity issues exploiting a renewable energy source.

1. Introduction

Water usage represents one of the paramount challenges of the 21st century. Ensuring access to clean and potable water for every individual is both a fundamental right and a necessity [1]. Water scarcity is a recognized phenomenon, globally exacerbated by climate change, with recent studies stating that 2.2 billion people lack access to safely managed drinking water, including 703 million without basic water services and 653 million with no handwashing facility at all [2]. This scarcity of water resources poses significant challenges to agricultural productivity, food security, public health, and socioeconomic development in many regions. In areas where freshwater is scarcely available, seawater desalination offers a potential solution to water issues [3,4].
Desalination technologies encompass various methods for converting seawater and brackish into freshwater. Most water desalination worldwide is carried out by reverse osmosis (RO), multi-stage flash distillation (MSF), and multi-effect distillation (MED) technologies. The first technology relies on mechanical energy and a permeable membrane, while MSF and MED are thermally driven processes based on phase change phenomena such as evaporation and condensation [5,6,7].
An alternative route is the humidification–dehumidification (HDH) concept which is not widely adopted for large-scale desalination, since the energy efficiency and water productivity are generally lower than more traditional technologies like MED and RO [8]. However, HDH systems offer relatively simple solutions with low maintenance costs for remote areas where large-scale desalination plants are not feasible [9,10]. Furthermore, HDH can be driven by solar energy, reducing the environmental impact by 83.6% compared to solar-powered RO technologies [11]. HDH exploits a carrier fluid (commonly air) to absorb water from the saline feed and later releases it as pure water. The system is made of three main sub-systems: humidifier (i.e., evaporator), dehumidifier (i.e., condenser), and the carrier fluid circuit [5,10]. HDH systems are usually classified based on the cycle configuration (i.e., flow paths of air and water), whether water or air is heated providing the main thermal input to the cycle, and which energy source is exploited for heating [12], creating the following possible combinations: CACW (Closed Air Closed Water), CAOW (Closed Air Open Water), OAOW (Open Air Open Water), and OACW (Open Air Closed Water). Furthermore, WH indicates systems where the thermal input is collected by water, and AH is used when the thermal input is collected by air.
Desalination technologies have often been studied in hybrid systems with combined generation of pure water and other outputs (e.g., electricity, heat), especially if combined with PVT panels [4,13]. A few studies exist in the literature that model and assess the performance of solar-integrated HDH systems, although most of them used evacuated tubes or flat plate solar collectors to satisfy the thermal energy input. Zubair at el. [14] modelled a CAOW-WH system with evacuated tubes and verified their results against the work of Sharqawy et al. [15]. They observed that increasing water temperature at the humidifier input reduced the gain output ratio (GOR) for WH systems and increased the Gain Output Ratio (GOR) for air-heated (AH) systems. Mahmoud et al. [16] studied the impact of combining solar still HDH desalination systems with solar concentrators, PV, and PVT panels. The hybridization of the system proved to provide enhanced performance, which is in agreement with the findings of two recent extensive review publications [4,13]. Pourafshar et al. [17] combined a heat pump with an AH-HDH system obtaining specific electrical energy consumption values between 0.22 to 0.53 kWh/kg and verified their model with experimental data on a prototype. Rafiei et al. [18] developed a hybrid HDH system combining two PVTs for water pre-heating, a dish collector, and PV panels, focusing on the optimization of the cavity receiver’s shape. Weifeng et al. [19] modeled an HDH desalination system powered by PVT including CPC (compound parabolic concentrators) to enhance the solar irradiation available on the PVT panels surface, combined with direct contact heat exchangers for both humidifier and dehumidifier. Their simulations provided GOR = 1.8, and were verified against other results available in literature. Elsafi [20] investigated air-heated HDH systems integrated with photovoltaic-thermal (PVT) modules, developing a mathematical system model and performing an economic assessment with an exergy-costing model. Similarly, Anand and Srinivas [21] developed a mathematical model of a PVT-HDH integrated system with the objective of maximizing PV generation by removing heat and thus reducing their operating temperature. Although increasing the PV efficiency, higher mass flow rates of cooling water reduced its outlet temperature penalizing the distilled water production. HDH systems can also be hybridized with a vapor-compression chiller (VCC) to enhance performance while exploiting the PVT modules generation to supply the required electricity. Ravajiri et al. [22] recently performed a techno-economic analysis of a PVT-HDH-VCC system, obtaining GORs between 1.24 and 1.28, depending on the adopted refrigerant fluid. Gabrielli et al. [23] performed a detailed assessment of a PVT-HDH system, combining commercially available software for the HDH system with experimentally derived models for the PVT components. Their analysis shows that the specific clean water flow rate increases and the maximum process temperature decreases with higher specific saline water flow rate, while they both increase with higher available irradiance.
Experimental studies on solar-powered HDH systems are very limited and most of them employ flat plate collectors or use electric heaters to simulate or satisfy the required thermal input. Zhani et al. [24] and Nafey et al. [25] examined the impact of inlet air and PV inlet water temperature on water productivity for systems based on flat plat collectors used to heat air. Hermosillo et al. [26] combined mathematical modelling of HDH systems with experimental prototypes to verify their heat and mass transfer properties, revealing that lower water flow rates enhanced heat recovery and distillate production. Chang et al. [27] realized experiments simulating the solar heat source with electric heaters that maintain a water tank at a constant temperature, obtaining GOR values between 1.8 and 2.1, largely unaffected by the mass flow rate of the feed saline water. Ghazy [28] focused on air-heated HDH cycles coupled with PVT-air collectors, due to their lower complexity over water-heated systems. The experimental results show that the output power of the PVT-HDH system was generally greater than that of the conventional PV modules, with an additional 3.8 litres/day of pure water for each standard PVT module.
Only one recent experimental study by Taheri et al. [29] focused on integrating PVT collectors into an HDH system to both preheat saline water and generate electricity for powering the air circuit within the system itself. However, the experimental setup required an electric heater to reach the target thermal input and a connection to the grid to satisfy the electrical demand. The research proved that GOR and RR were higher without PVT integration (0.8 vs. 0.48 for GOR, and 4.01% vs. 3.15% for RR), which verifies the lower efficiency of PVT-HDH systems that are however paramount for remote locations where grid power is not reliably available.
This study presents a novel and fully self-sufficient experimental HDH CACW-WH system coupled with PVT modules. The setup combines PVT modules for water heating and electricity generation with an HDH cycle for pure water production. To the authors’ best knowledge, it is the only study with a complete self-sufficient PVT-HDH setup in terms of both thermal and electrical supply, thus making it novel and able to provide helpful data and new insights to the scientific community.
The conducted study involves the characterization of a prototype plant for desalinated water production. The experimental setup, due to practical reasons, is a CACW-WH system that avoids wasting a continuous stream of water required for the experiments. However, it is able to mimic a CAOW-WH system implementing a dry cooler to cool down the brine which is subsequently mixed with the pure water produced to maintain the fluid inventory constant. The purpose of the experimental campaign is the characterization of the concept in terms of common KPIs for water desalination plants and to validate the models of the humidifier and dehumidifier sections. This project hence aligns with Sustainable Development Goals (SDGs), particularly for access to clean water (SDG 6) and development through accessible and clean energy (SDG 7).
The remainder of the paper is structured follows: Section 2 describes the models developed to simulate the two main components of the system, the humidifier and the dehumidifier. Section 3 and Section 4 presents the experimental setup and the performed activities, whose outcomes are evaluated in Section 5, where an additional verification of the developed models is performed. Eventually, in Section 6 conclusions are drawn.

2. Humidifier and Dehumidifier Models

A PVT-HDH system is composed of four main components: the air circuit, the humidifier, the dehumidifier, and the PVT collectors. The humidifier and dehumidifier are the two more innovative components for the system, and a specific model has been developed to describe their behaviour, which will be verified against experimental data. The PVT system is instead modelled based on previously published studies [30,31].

2.1. Humidifier

The humidifier is a column heat and mass exchanger that humidifies the air entering from the bottom and rising through its structure. The air has an upward motion driven by the ventilation system, used to overcome the pressure drop, and aided also by natural convective motion. The latter is due to the hot saline water sprayed by nozzles from the top of the column that falls through the humidifier by gravity and heats up and humidifies the rising flow of air. A packing material is used to increase the contact surface between the two fluids, and thus to improve their heat and mass transfer.
The hypotheses behind the humidifier model are the following:
  • The heat exchanger operates in steady-state conditions.
  • Kinetic energy and potential energy are negligible.
  • The cylinder is adiabatic and there is no heat exchange to the outside.
  • Saline water and moist air properties are constant in each volume.
The developed model is based on differential equations that describe the variation of the thermodynamic properties of the working fluids along the column (temperature and mass flow rate for the saline water and temperature and humidity ratio for the moist air). The system is then solved assuming a one-dimensional (the height) characterization of the humidifier, as shown in Figure 1, where m ˙ d a and m ˙ s w represents the dry air and saline water mass flow rates, respectively, ω is the humidity ratio of air, and T is the temperature.
The system is solved by employing mass flow rate balances, as described in Equation (1) where m ˙ da is the dry air mass flow air, ω the humidity ratio, T air the air temperature, and m ˙ sw the saline water mass flow rate.
m ˙ da d ω d T air d T air dz = d m ˙ sw dz
The moist air properties are computed following the standard psychrometric equations [32]. The mass transfer increases with higher moist air temperature, which is obtained with hotter water. Consequently, this leads to an increase in the humidity ratio in saturated conditions.
The variation of the enthalpy content of the working fluids along the column can be described by Equations (2) and (3), considering positive values of the coordinate z in the downward direction, as shown in Figure 1:
m ˙ da d h ma dz = U ma a A T air T sw + m ˙ da d ω d T air d T air dz Δ h l v
d m ˙ sw h sw dz = U ma a A T air T sw + m ˙ da d ω d T air d T air dz Δ h l v
where h m a is the specific enthalpy of moist air, U m a is the heat transfer coefficient for moist air, a is the specific packing area, A is the cross-sectional area of the humidifier, and Δ h l v is the latent heat of vaporization of water. Equations (2) and (3) characterize the behaviour of the humidifier, highlighting the impact of both sensible and latent heat. Moist air and saline water flow in opposite directions within the humidifier, resulting in an enthalpy decrease for both flows in the positive direction of z .
Equations (1)–(3). can be thus rewritten as:
d m ˙ s w d z = U m a a A T a i r T s w d ω d T a i r c p , d a + c p , v ω + c p , v T a i r d ω d T a i r
d T s w d z = U m a a A T a i r T s w m ˙ s w c p , s w c p , d a + c p , v ω + c p , v T a i r c p , s w T s w + Δ h l v d ω d T a i r c p , d a + c p , v ω + c p , v T a i r d ω d T a i r
d T a i r d z = U m a a A T a i r T s w m ˙ d a c p , d a + c p , v ω + c p , v T a i r d ω d T a i r
In order to evaluate the overall heat transfer coefficient U m a and the mass transfer coefficient k G , a correlation for the Merkel number M e from [33] and for the Lewis Factor L e f from [34] were used:
M e = k G a L G s w = 1.90741 L G s w , i n 0.599957 G d a 0.649337 T s w , i n 0.209468
L e f = U m a c p , d a k G = 0.865 0.6666 ω s w + 0.662 ω + 0.662 1 ln ω s w + 0.662 ω + 0.662
where G is the specific mass flow rate, referred to the frontal area of the humidifier, ω s w is the humidity ratio of moist air in saturated conditions at the same temperature of the saline water, and L is the height of the packing material.
To properly describe the component, pressure drops have to be taken into account. Those of the air stream are computed exploiting the correlation from [33]:
Δ p d a = 5.5468205 G s w , i n 0.603252 G d a 1.85138 L 0.796024 ρ d a 1
The overpressure required to spray water through the nozzles in the humidifier is modelled as a localized pressure loss assumed constant at the nozzle outlets.
Finally, the set of Equation (10) summarizes the boundary (inlet) conditions of this problem.
ω z = L = ω i n T s w z = 0 = T s w , i n T d a z = L = T d a , i n m ˙ s w z = 0 = m s w , i n
The system of differential equations has been solved in MATLAB® R2016b environment using the BV4C function. This is a function that solves boundary value problems for ordinary differential equations. The equations to be solved are provided in vectorial form, ensuring a decrease in computational time, since the algorithm can solve simultaneously the equations along the column height for each point.

2.2. Dehumidifier

The dehumidifier requires a large heat exchanger area to compensate for the poor heat transfer properties of moist air. Moreover, vapor condensation typically occurs mainly on a physical surface through droplets formation. These factors induce a technical challenge when attempting to reduce the system size and concurrently maintaining high efficiencies for remote applications. The most suitable solution has been identified in a fin-and-tube condenser, whose finned structure enables high air-to-water surface ratio. An example of fin-and-tube condenser is depicted in Figure 2, which also graphically explains the methodology adopted to solve the mathematical set of equations that is described below.
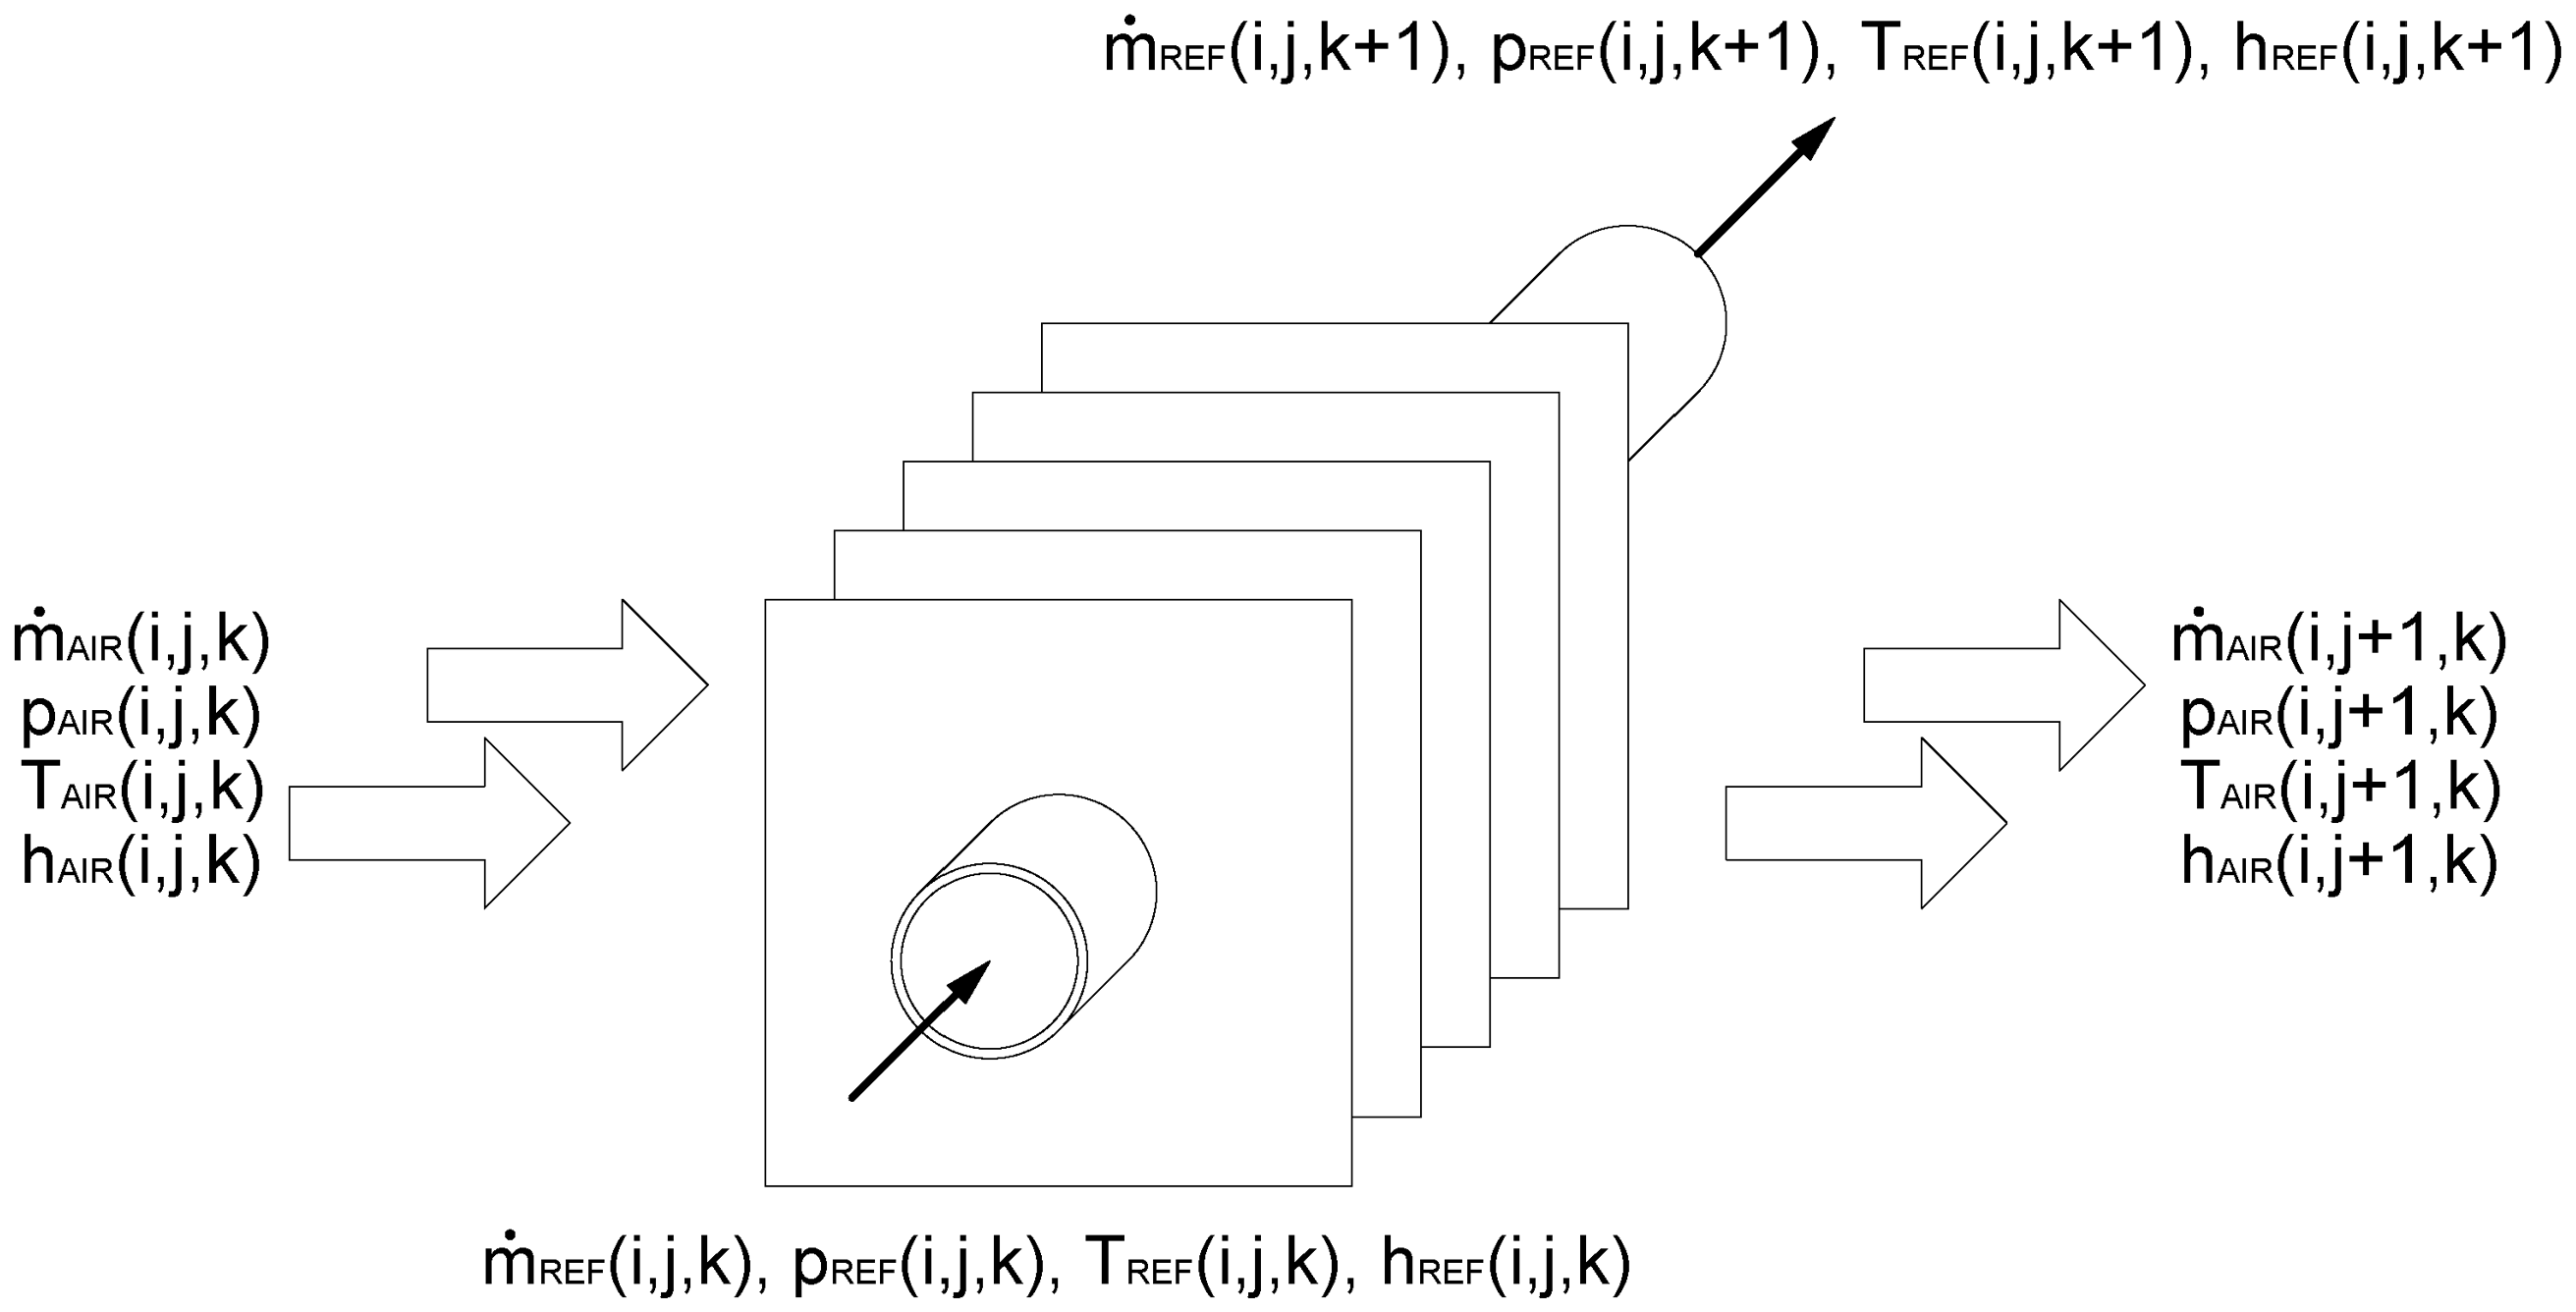
The dehumidifier works as a counterflow heat exchanger, where the feed water flows from bottom to top while the humid and warm air flows in the opposite direction. A finite volume approach has been adopted to model the component, where the heat exchanger is divided into small, tube-centred elemental volumes as illustrated in Figure 3, following the approach adopted in a previous publication [35]. The model is adapted to the HDH application, substituting water instead of a standard refrigerant fluid inside the tubes and taking into account water condensation from moist air. In Figure 3 the volume discretization is performed so that parallel tubes, oriented in the V dimension, are organized in serpentines in the (R,V) plane, with cold water entering from the right. Along dimension T, several serpentines are repeated, with water distributed and collected by manifolds. Air is flowing in the opposite direction through the tubes from left to right.
To develop the model, a few key assumptions are made, which are summarized below:
  • The heat exchanger operates in steady-state conditions.
  • Kinetic energy and potential energy are negligible.
  • Axial heat conduction through tube thickness is negligible.
  • Radiation heat transfer with the surrounding elements is negligible.
  • Return bends, joints, splits and headers are adiabatic.
  • Saline water and moist air properties are constant in each volume.
  • Condensation enthalpy of vapor is added to the total heat absorbed by water.
The coolant mass, momentum, and energy equations applied to each elemental volume are described by the following:
m ˙ s w i , j , k = m ˙ s w i , j , k + 1
p s w i , j , k = p s w i , j , k + 1 + Δ p s w , f r i c ( i , j , k )
m ˙ s w i , j , k h s w i , j , k + Q ˙ i , j , k = m ˙ s w i , j , k + 1 h s w ( i , j , k + 1 )
where Δ p s w , f r i c represents the friction term of the pressure drop, which is evaluated according to Celen et al. [36]. Equation (11) establishes a constant saline water mass flow rate in the k direction within the dehumidifier, Equation (12) describes the saline water pressure losses in the k direction, and Equation (13) explains the saline water enthalpy variation in the k direction, which is only affected by the inlet enthalpy value and the heat absorbed in the kth element.
For the air side of the dehumidifier, the system can be described in term of mass and energy balance equations as:
m ˙ d a i , j , k = m ˙ d a i , j + 1 , k
m ˙ d a i , j , k ω i , j , k = m ˙ p w + m ˙ d a i , j + 1 , k ω ( i , j + 1 , k )
m ˙ d a i , j , k h d a i , j , k = Q ˙ i , j , k + Q ˙ c o n d i , j , k + m ˙ d a i , j + 1 , k h d a i , j + 1 , k
where the heat exchanged due to the condensation of the water Q ˙ c o n d can be evaluated as follow:
Q ˙ c o n d i , j , k =   m ˙ d a i , j , k ω i , j + 1 , k ω i , j , k h p w * ( i , j , k )
where h p w * is the enthalpy of the fresh water calculated at the temperature of air.
Similarly to the saline water side, Equation (14) establishes a constant air mass flow rate in the k direction, while Equation (15) describes the condensation of water content of humid air into pure water along each element, and Equation (16) explains the enthalpy variation of air due to the heat released to the saline water and the heat of condensation of its water content between two subsequent kth elements. Regarding the momentum equation, it is solved separately from the energy equation and the whole pressure drop in the dehumidifier is calculated using the following equation:
p d a , i n = p d a , o u t + Δ p d a , f r i c
where the friction term in wet conditions is calculated using the correlation proposed by Wang et al. [37]. The model eventually evaluates for each finite volume the heat exchanged using the ϵ N T U method:
Q ˙ = ϵ min m ˙ s w c p , s w , m ˙ d a c p , m a T s w T d a
where ϵ is the effectiveness calculated considering the fictitious isobaric specific heat capacity, according to [38].
After the calculation of the heat transferred, the enthalpy of the air and of the saline water can be determined from the energy balances. Then, the pressure drops are determined and used to calculate the temperatures and physical properties. Finally, also the flow rate of the fresh water produced is obtained. An iterative method is employed for the solution of this process.

3. Experimental Setup

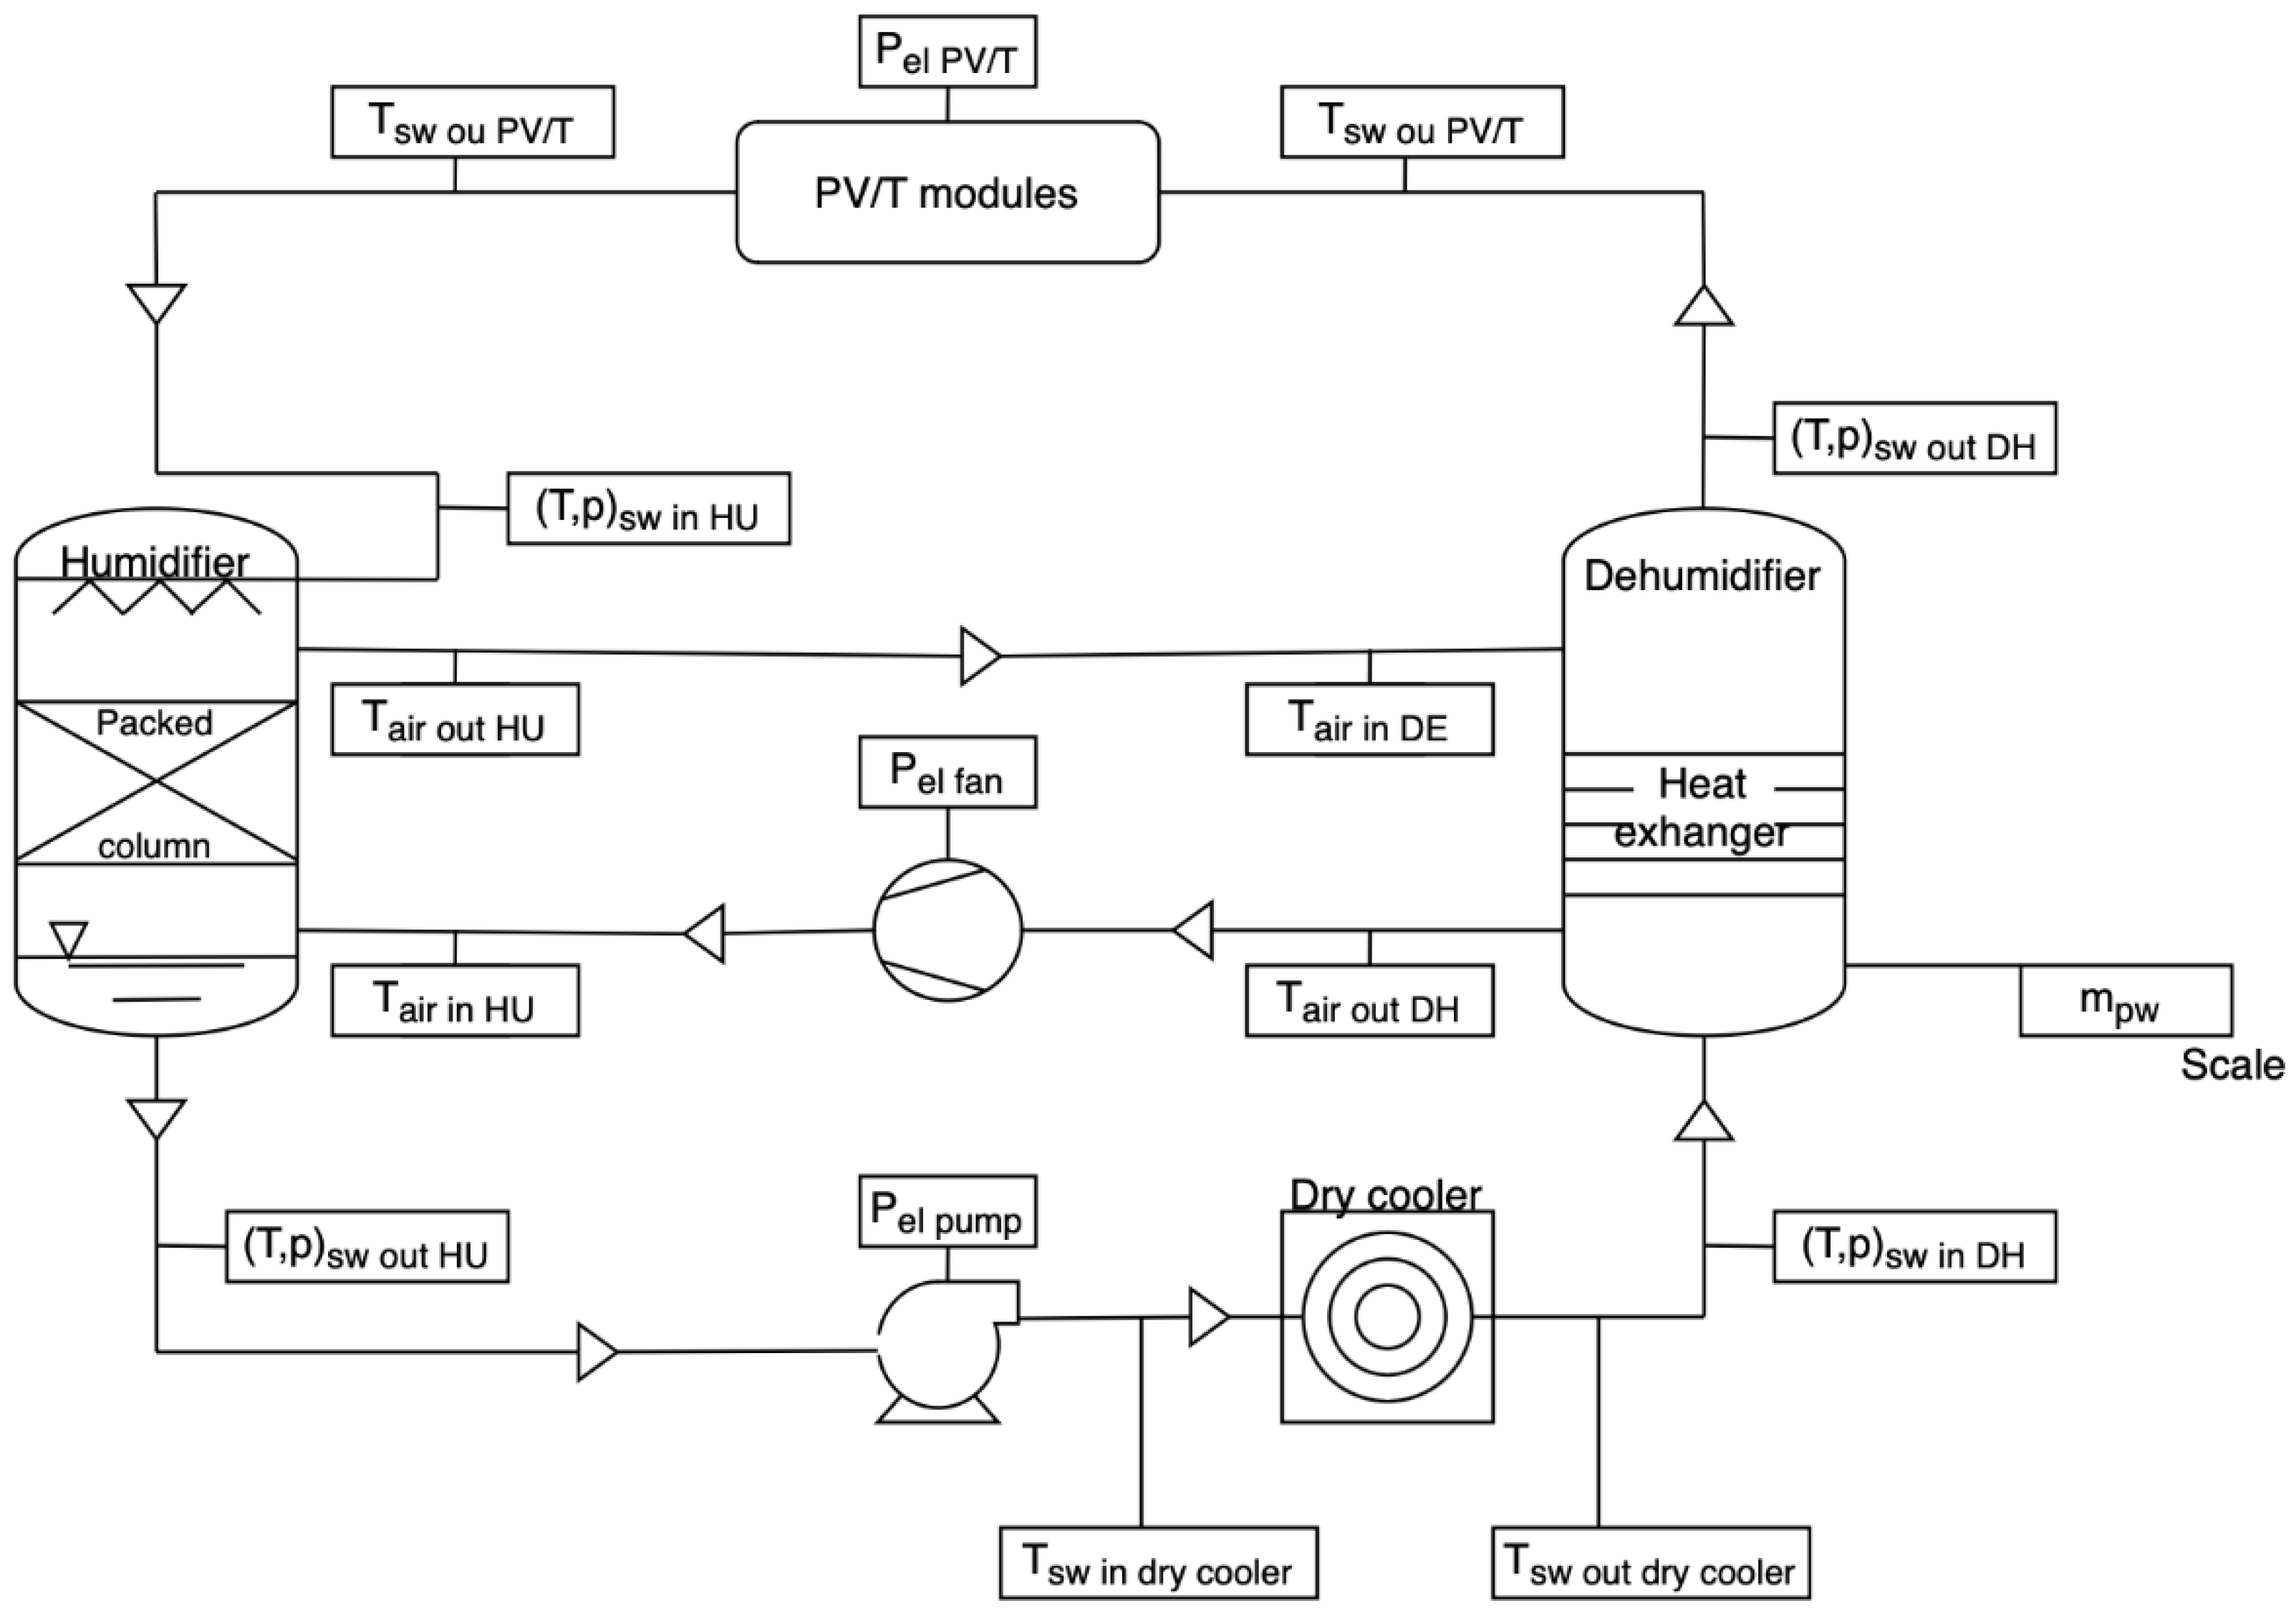
This paragraph describes the experimental setup of the HDH desalination unit. The system is a CACW-WH HDH desalination cycle powered by eight photovoltaic thermal modules (PVT) placed on the roof of the SolarTech Lab at Politecnico di Milano. A schematic of the entire system is depicted in Figure 4.
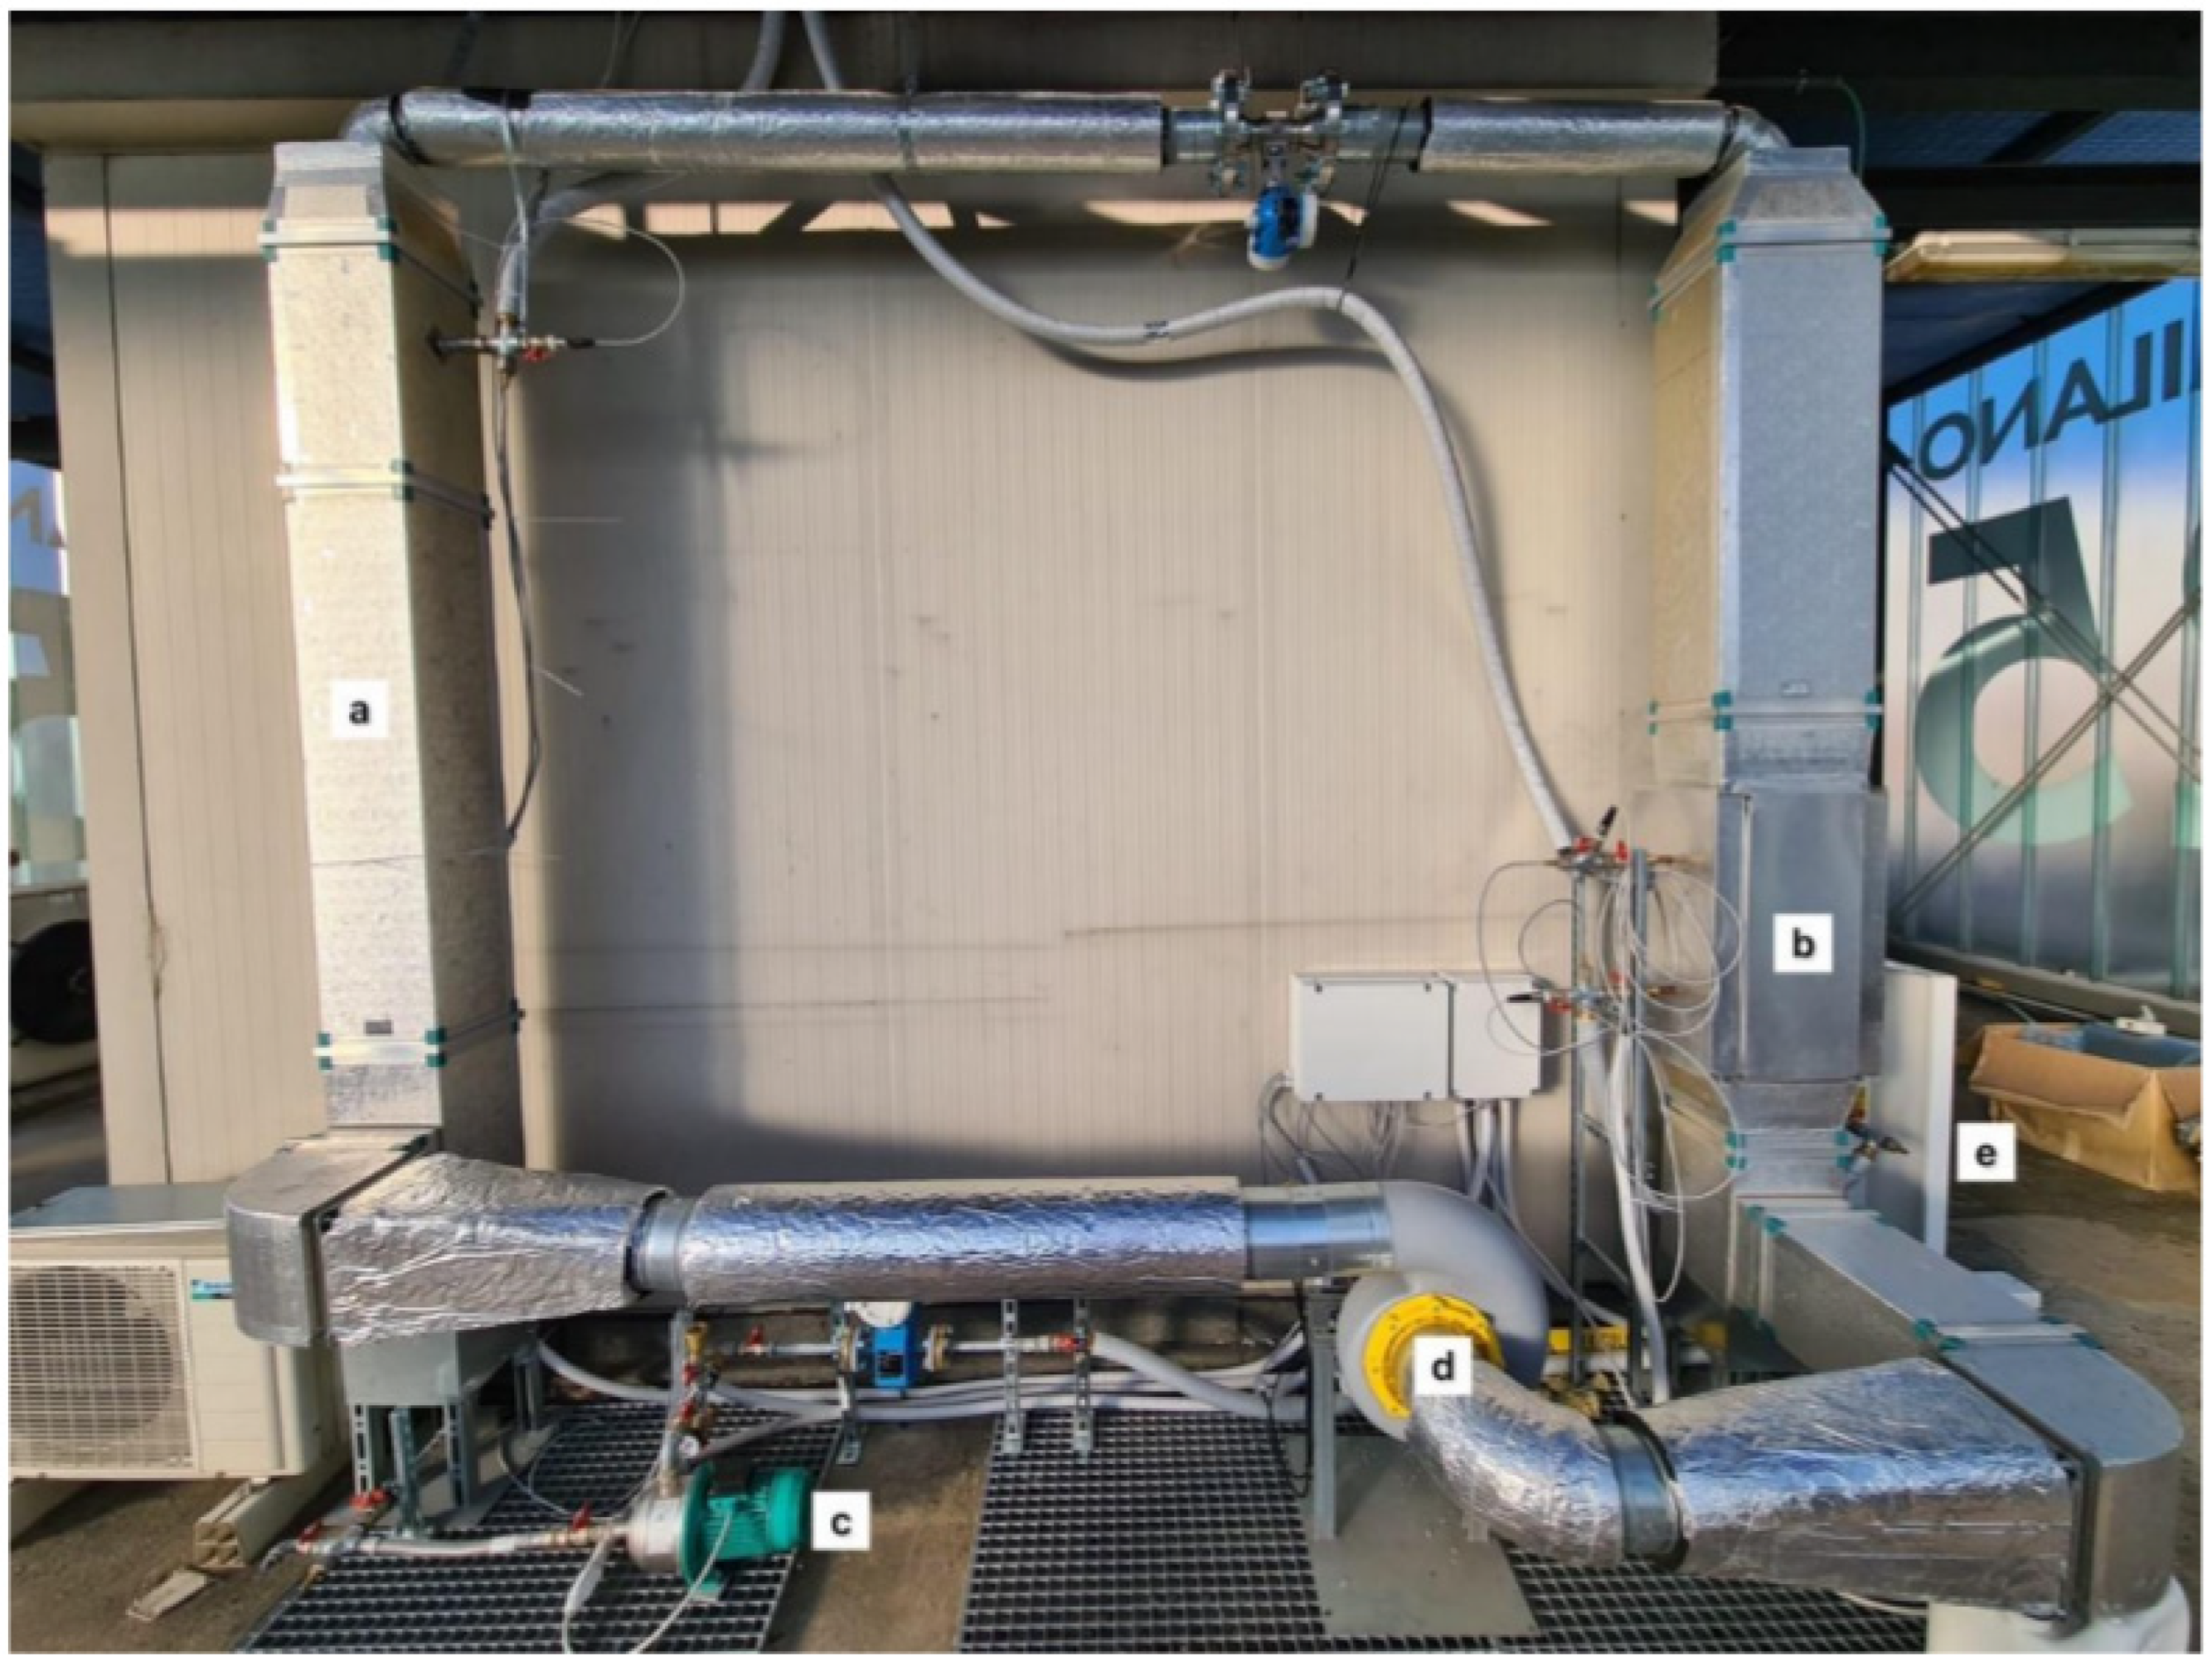
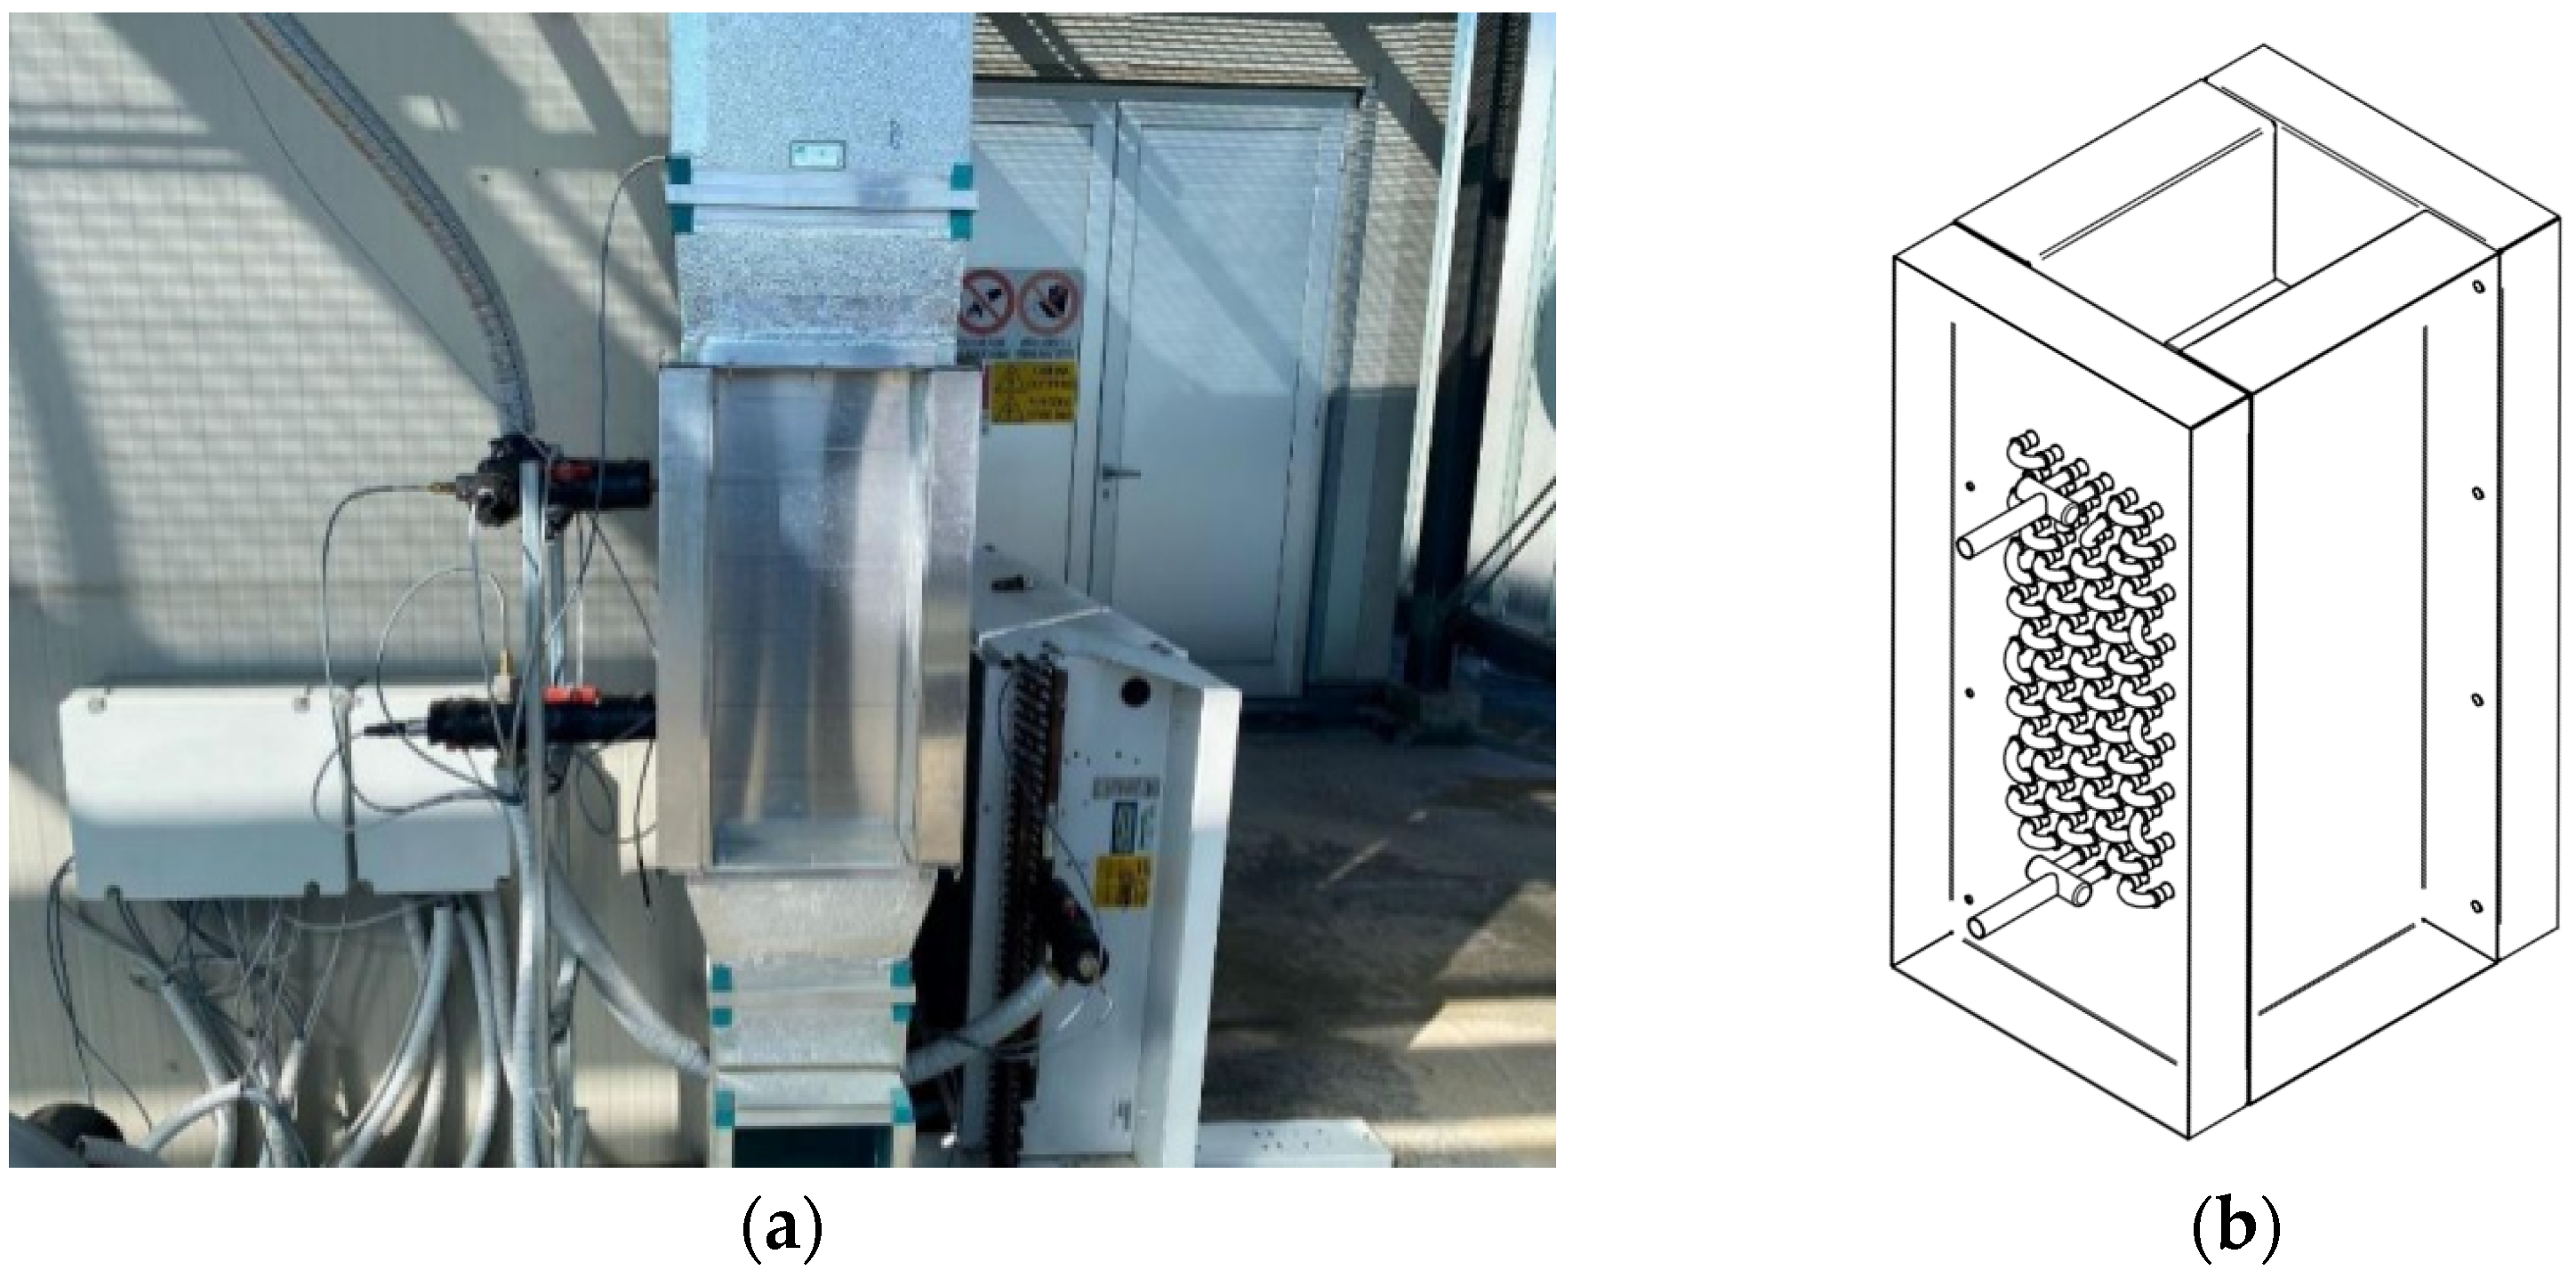
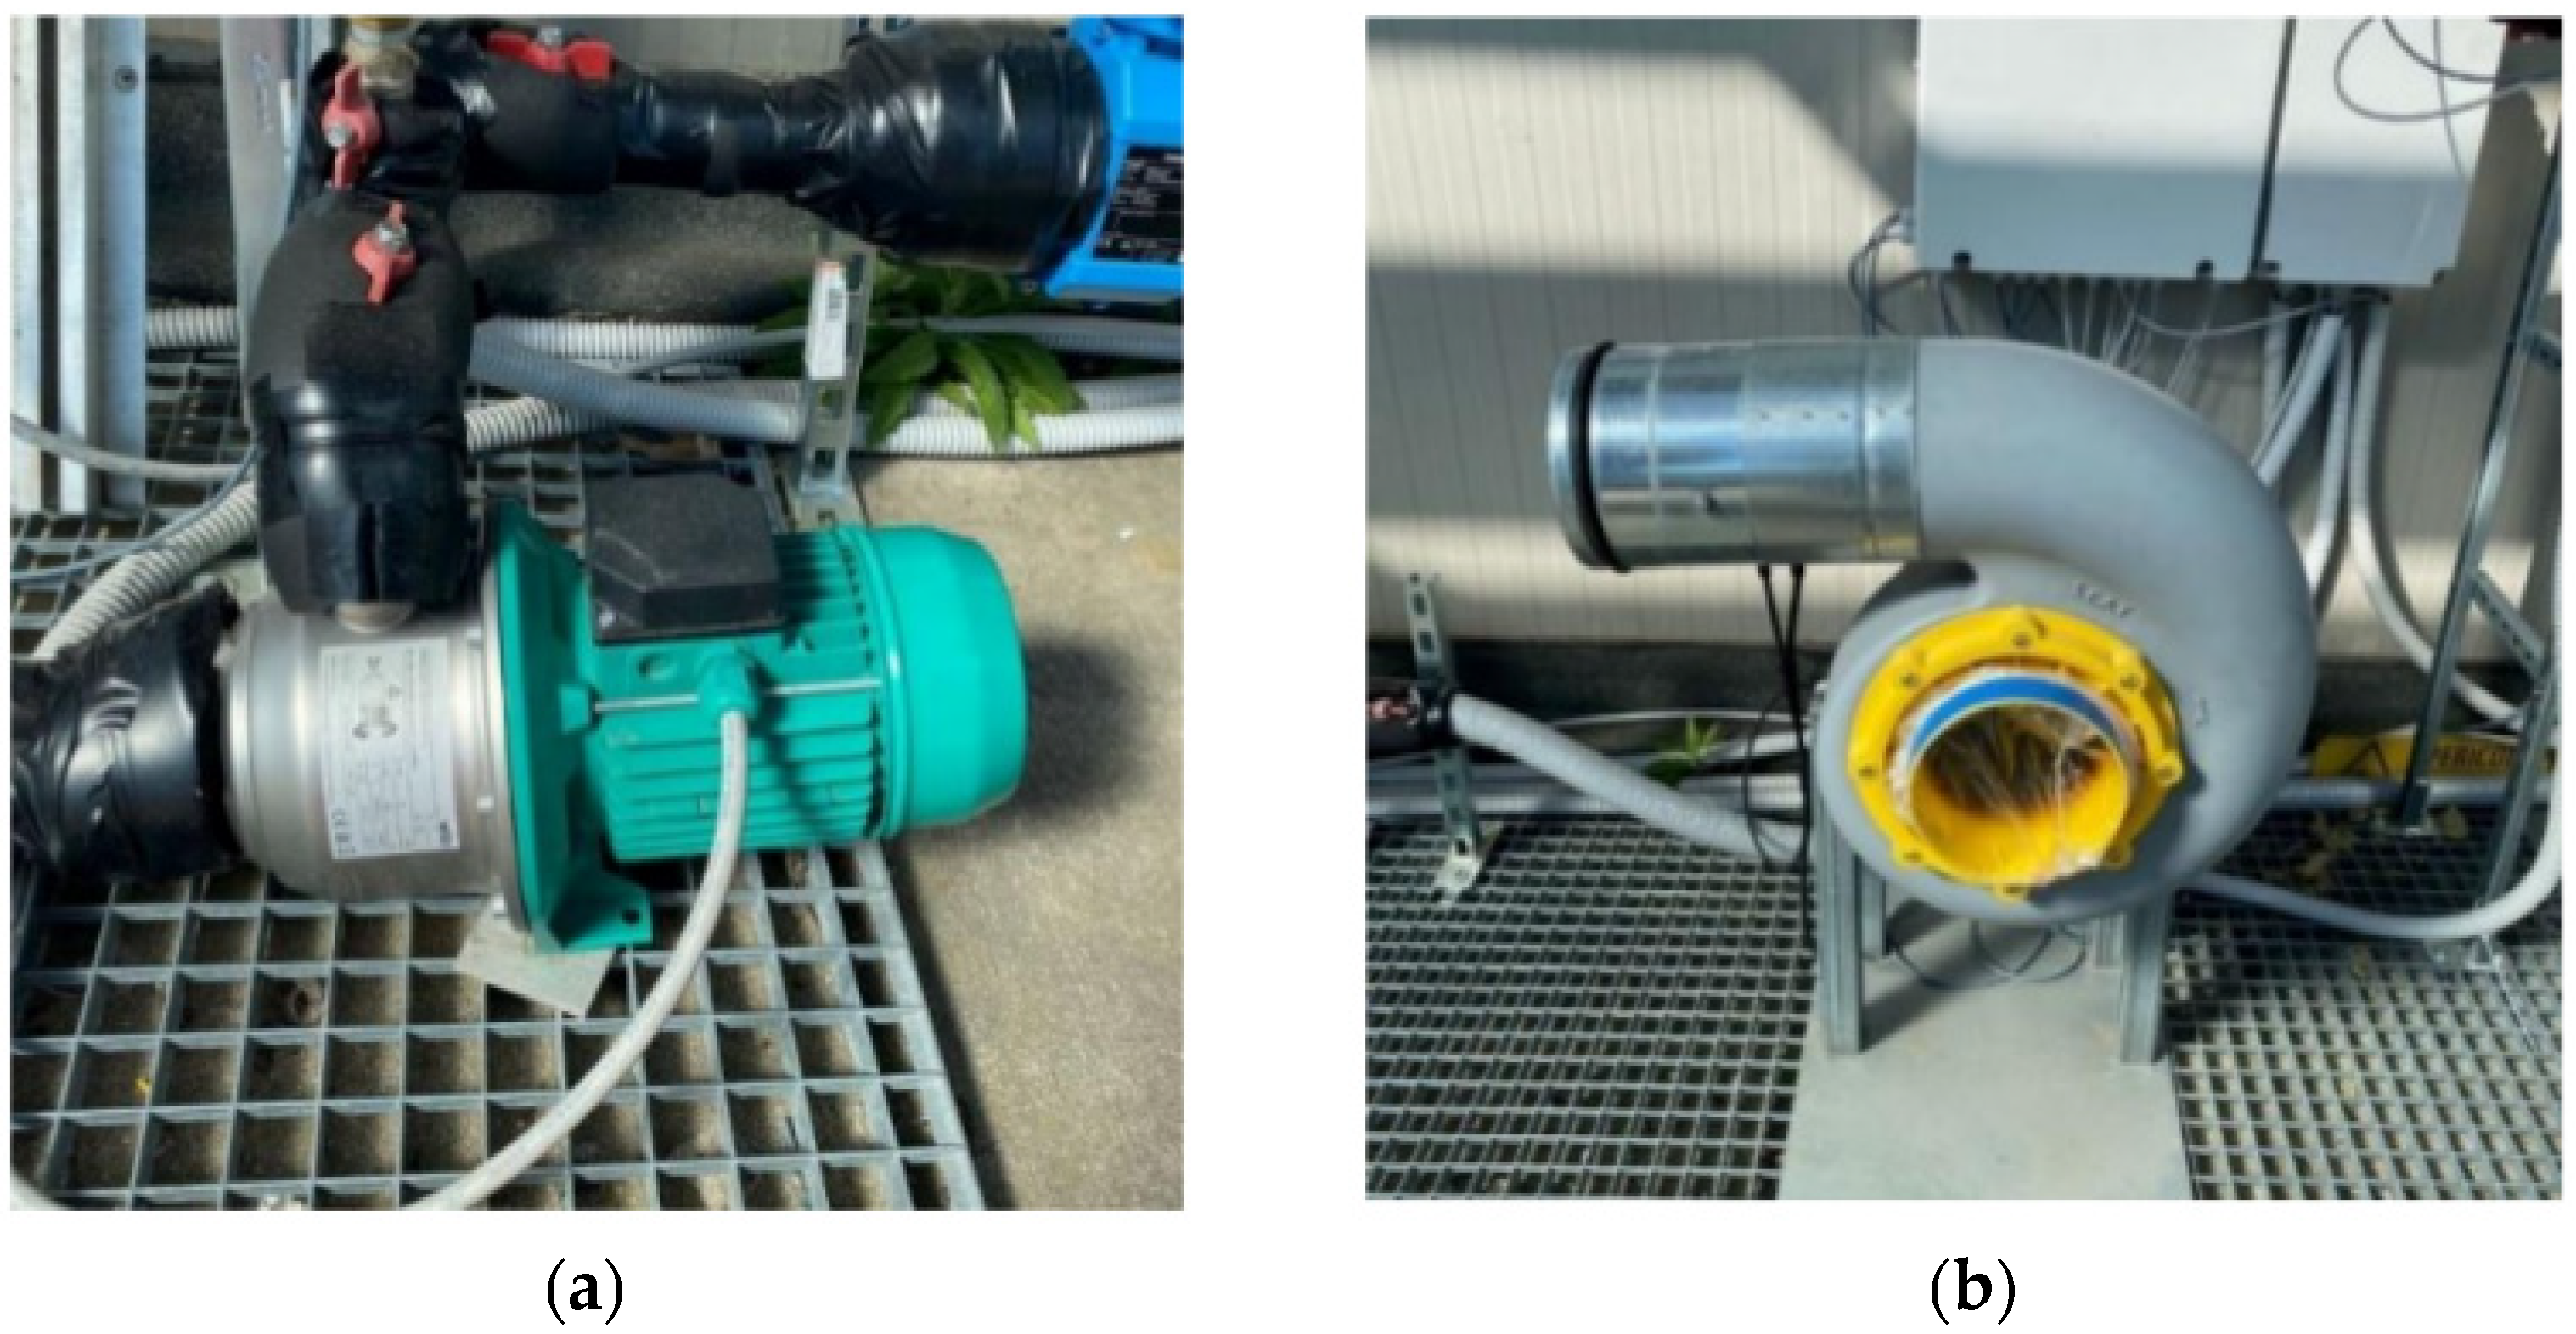
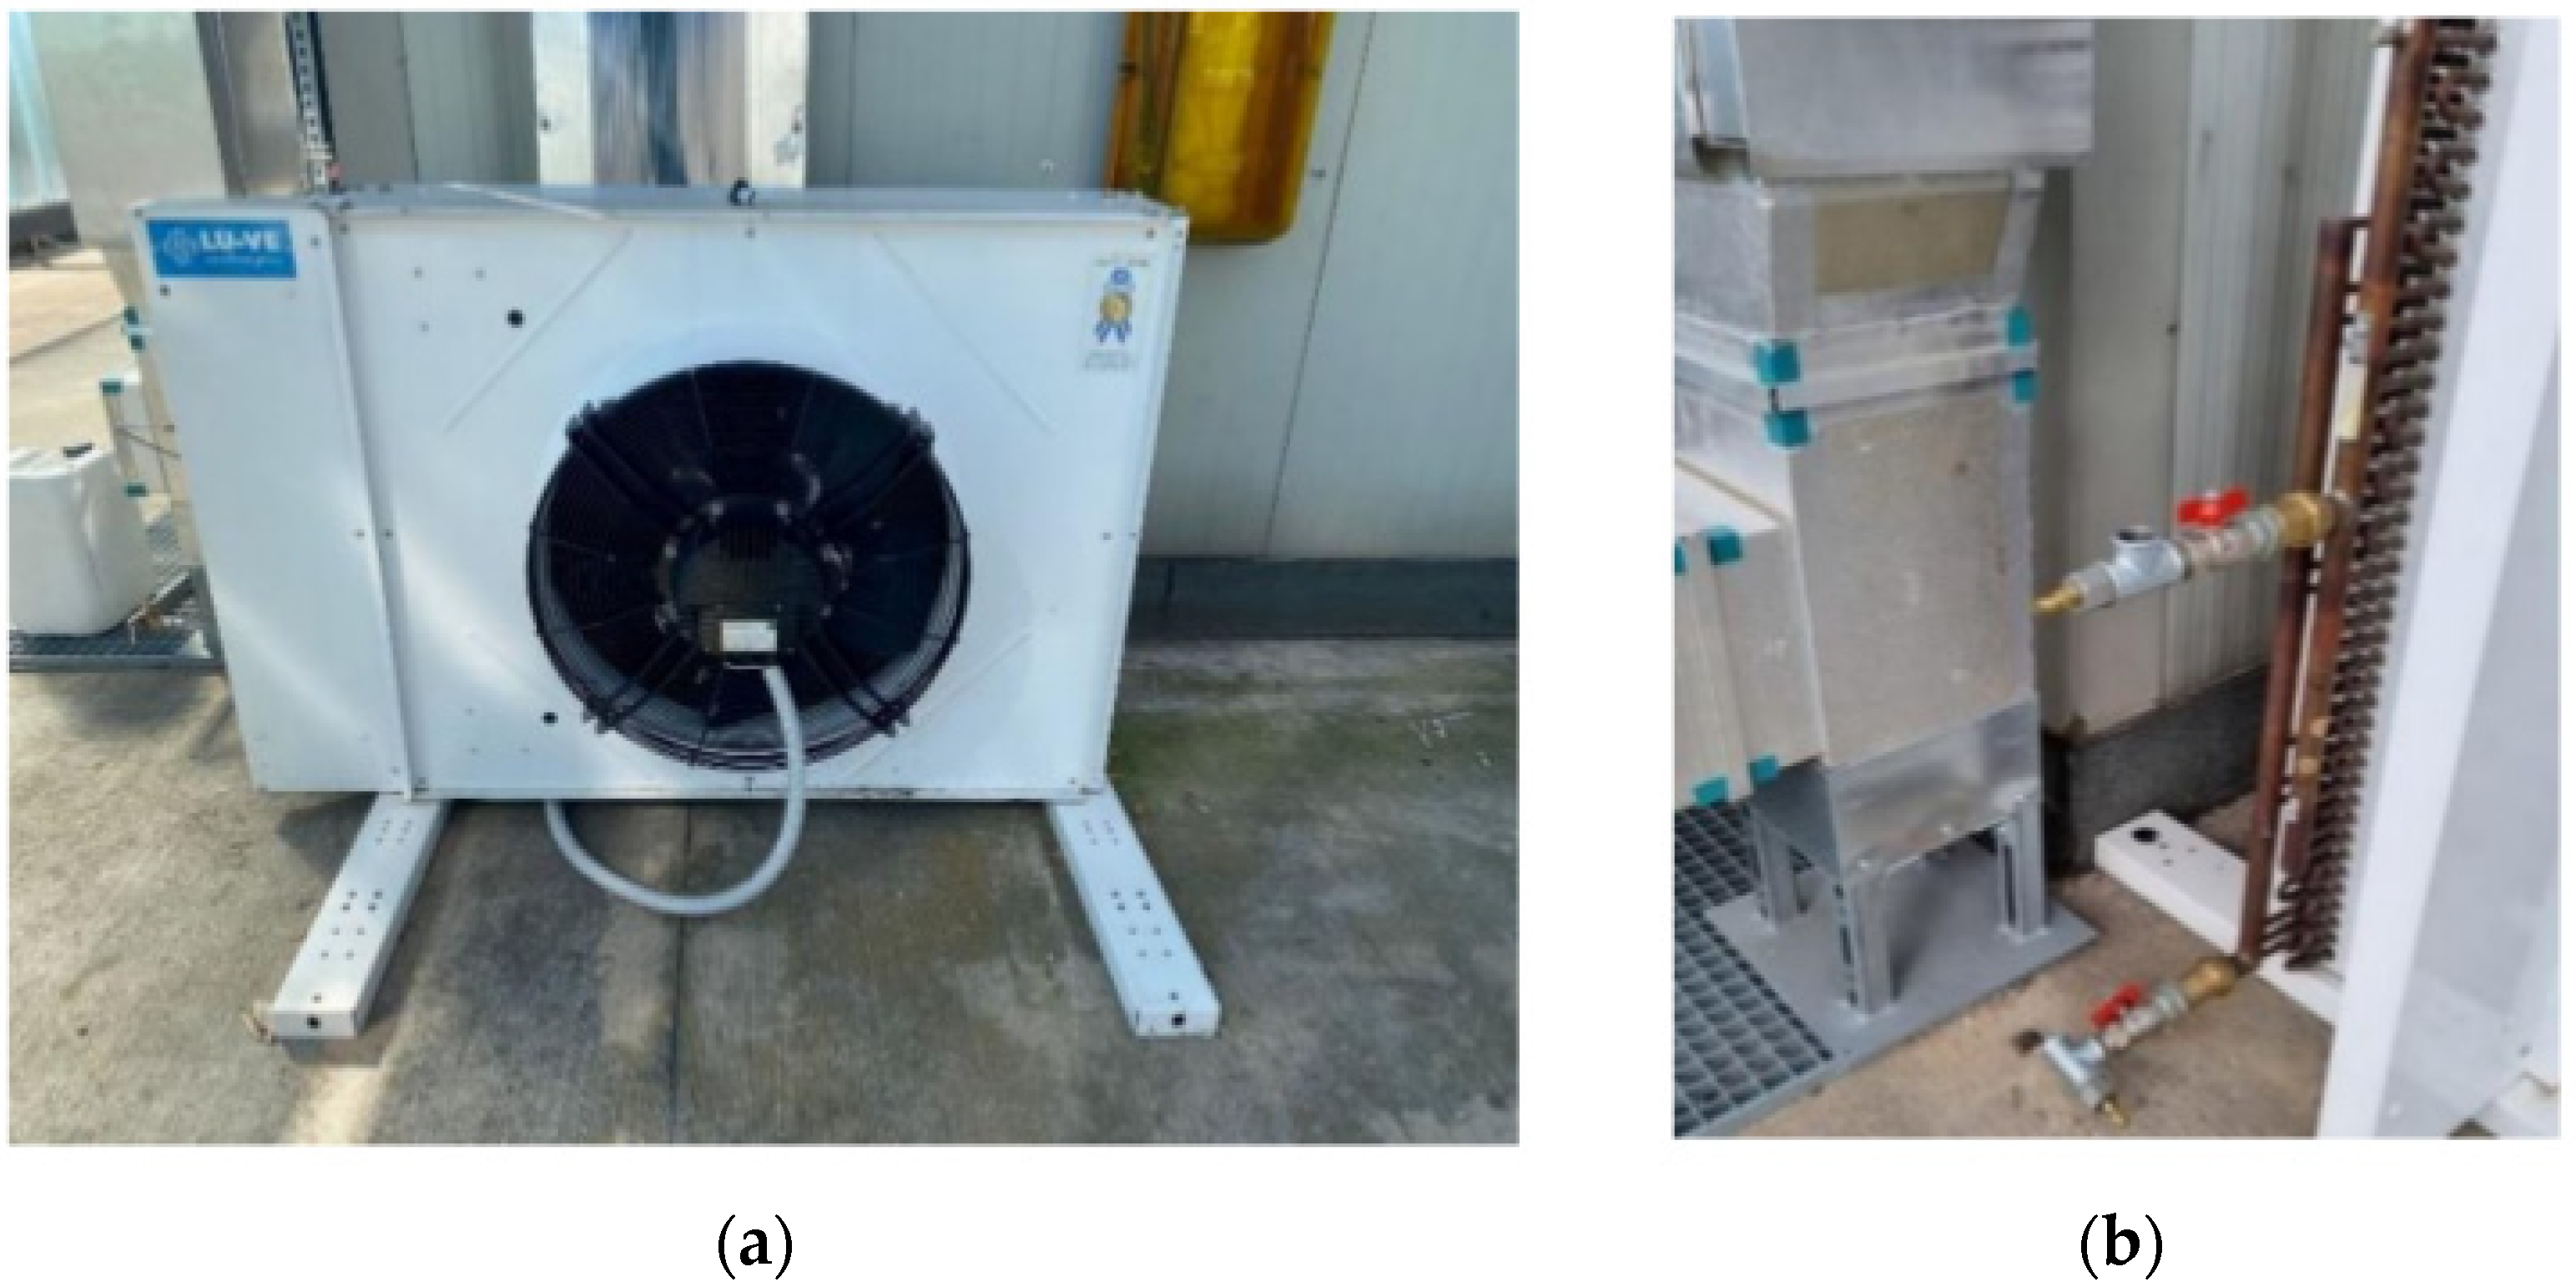
The system is composed of the following components: (1) humidifier, (2) dehumidifier, (3) PVT modules, (4) pump, (5) fan, (6) dry cooler, (7) measurement and control instruments. The main components (excluding the PVT modules located on the roof and the control instruments) are represented in Figure 5. A high-level description of the whole system is provided in the next paragraph while additional details for PVT, humidifier, and dehumidifier are given later in this section.
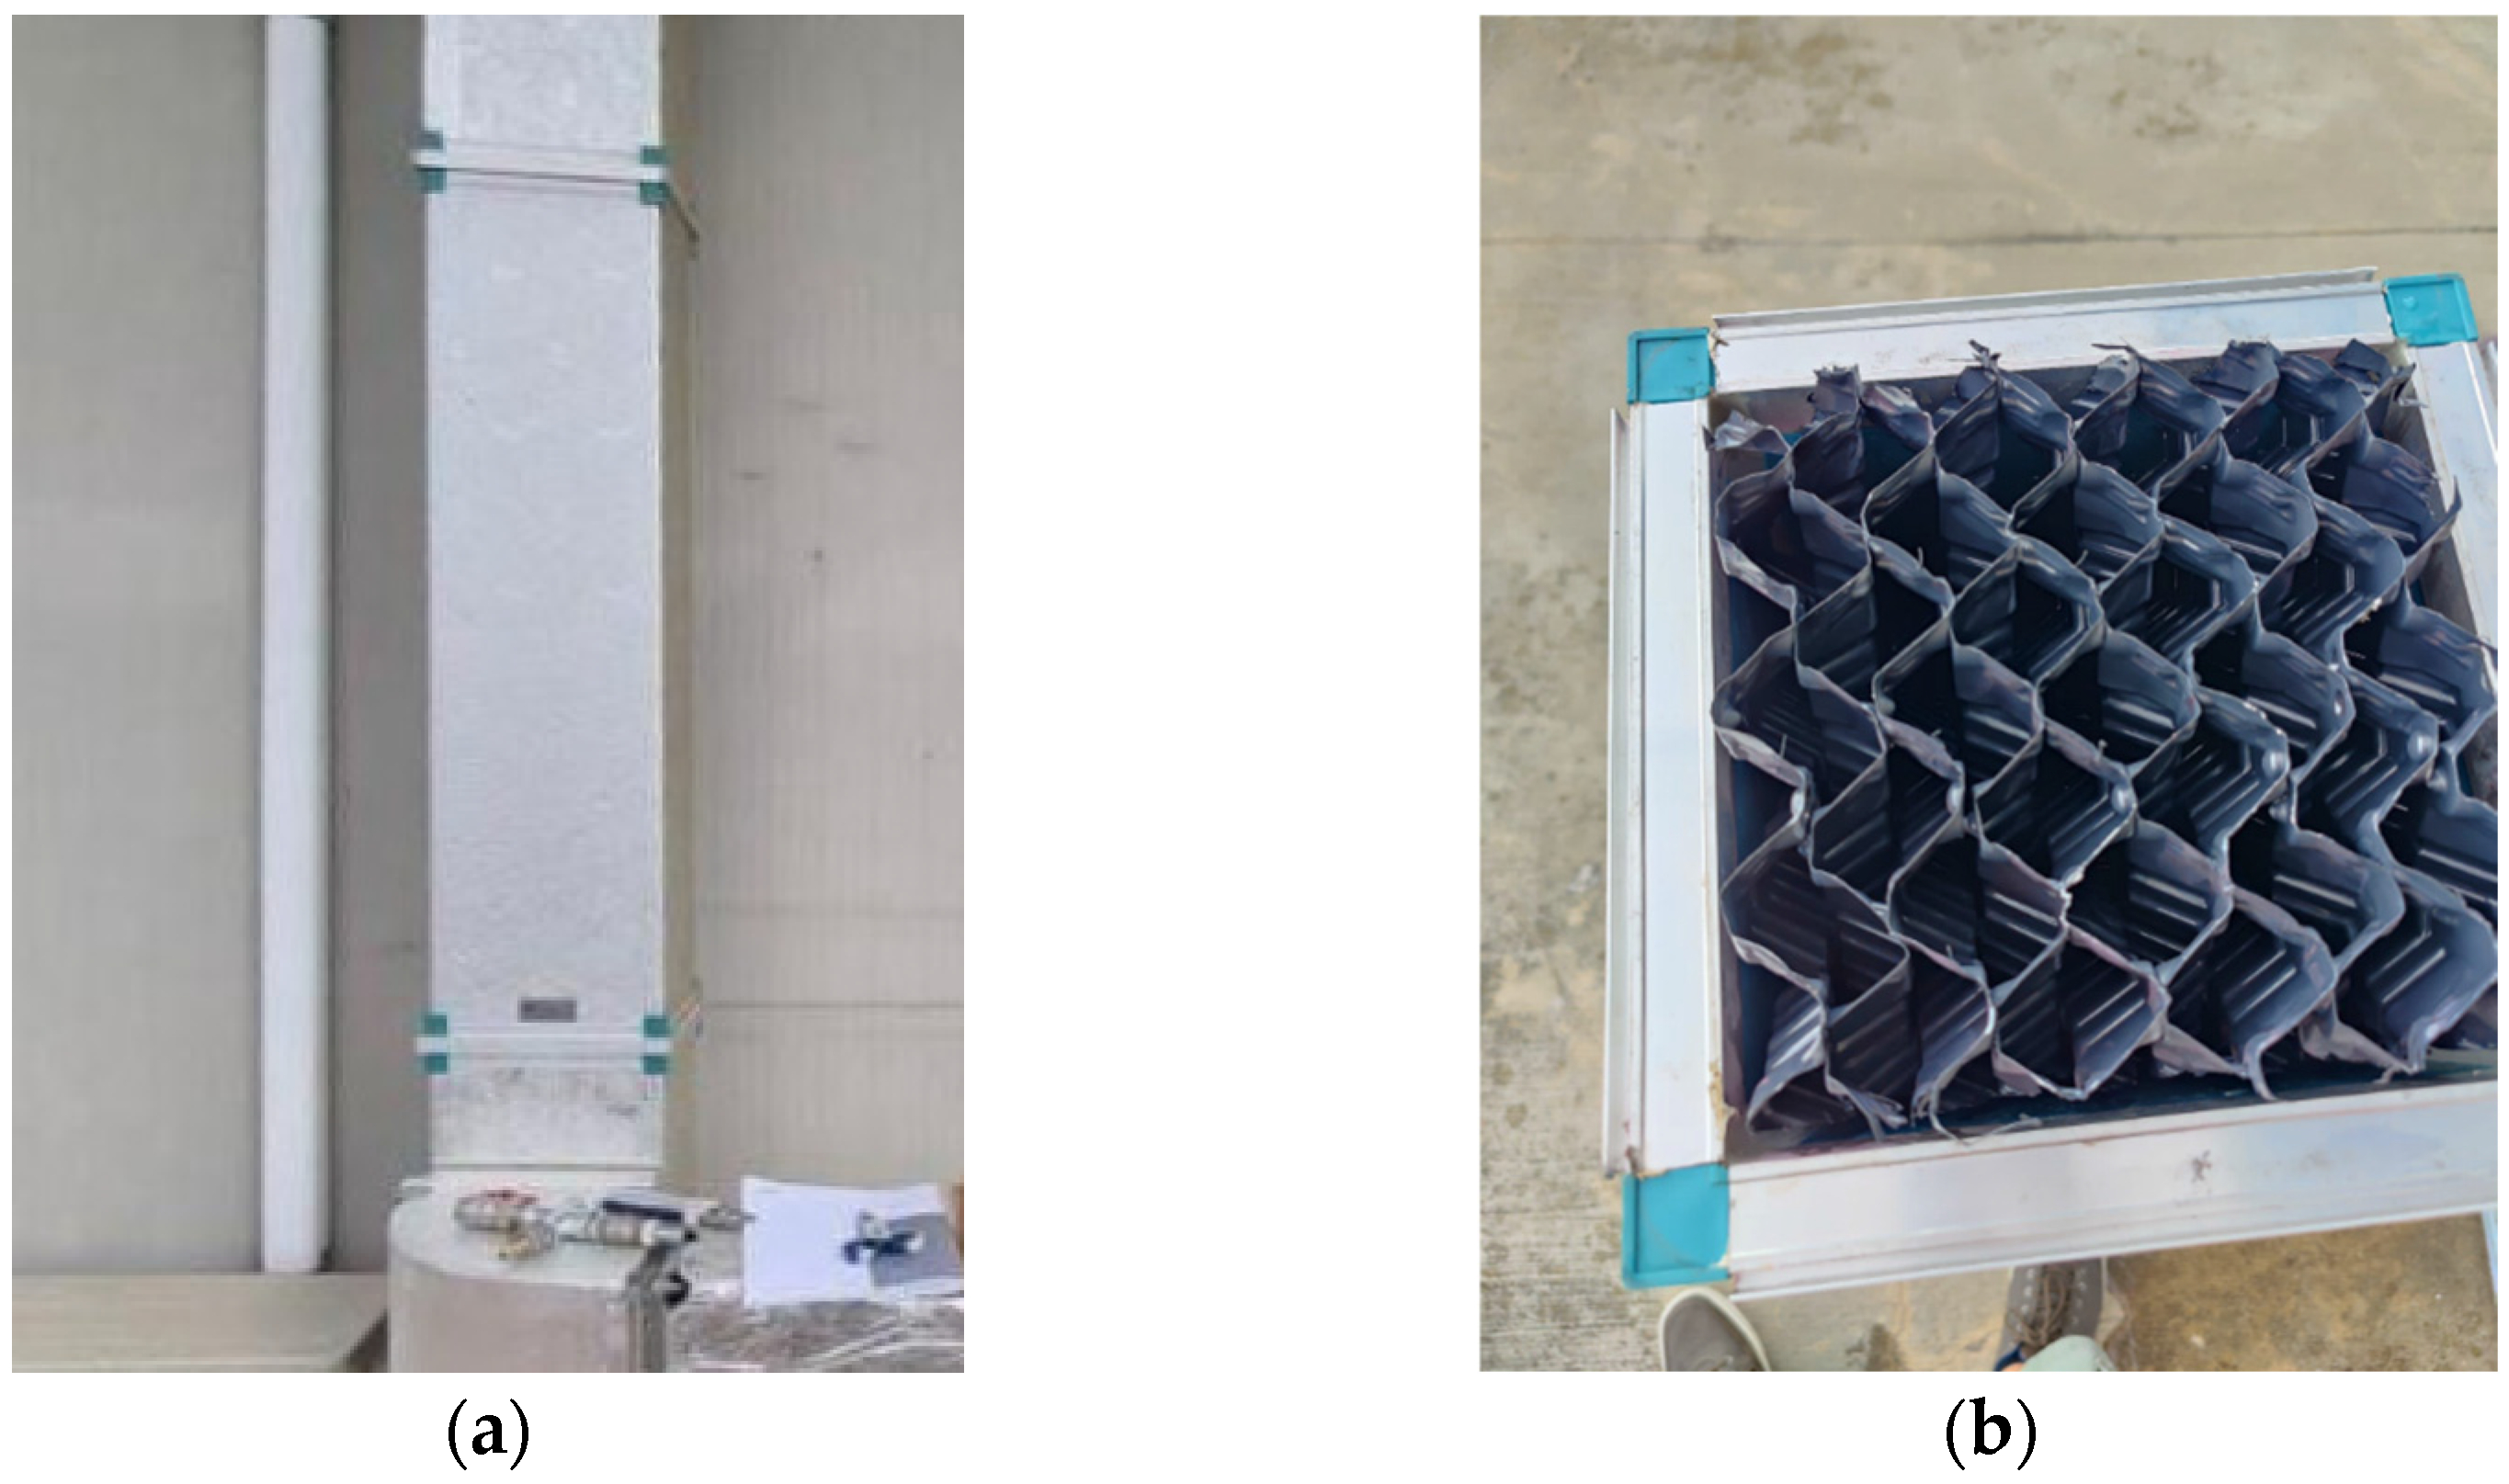
The feed water is pumped into the dehumidifier where it is warmed up, transferring heat with the hot and moist air coming from the humidifier. Following the preheating process in the dehumidifier, the water temperature is increased to reach its maximum inside the PVT modules exploiting a roll-bond cooling system organized in four serpentines placed underneath the surface. The hot water is subsequently sprayed inside the humidifier, where a contact heat exchange process enables mass transfer into moist and warm air to reach saturation conditions. Finally, the brine is removed from the bottom of the humidifier, mixed with the pure water, and pumped through the dry cooler to be recirculated in the system. The closed air circuit enables the heat and mass transfer between humidifier and dehumidifier, exploiting air as transfer fluid. A fan provides the required pressure to overcome losses and guarantees continuous circulation between the two heat exchangers. Cool and dry air at the outlet of the dehumidifier is forced into the humidifier from the bottom and raises inside absorbing water and heat reaching saturated conditions before exiting from the top. It is subsequently sent into the dehumidifier to be cooled down by the inlet stream of feed water, causing condensation of pure water that is extracted from the system, collected in a container, and weighed by means of a scale to measure its amount. The pure water container is emptied regularly and the produced water mixed with the brine outlet from the humidifier, following the heat rejection in the dry cooler to maintain inlet conditions representative of an external water stream. Pictures of the set up are reported in Figure 5, Figure 6, Figure 7, Figure 8, Figure 9 and Figure 10.

Measurement and Control Instruments

In addition to the HDH-PVT system, some devices were deployed on site to measure relevant environmental parameters that could affect the experiments. A meteorological station equipped with two pyranometers and a thermometer was used to measure the solar radiation—Global Horizontal Irradiance (GHI) and the Diffuse Horizontal Irradiance (DHI)—and ambient temperature.
The outputs obtained from the various instruments are managed by the LABVIEW® 2016 acquisition system, supplied by National Instruments. An example of the LABVIEW® 2016 interface is reported in Figure 11, including a schematic representation of the whole HDH system.
Table 1, Table 2 and Table 3 summarize the main characteristics of the instruments and components included in the experimental setup.

4. Experimental Activities

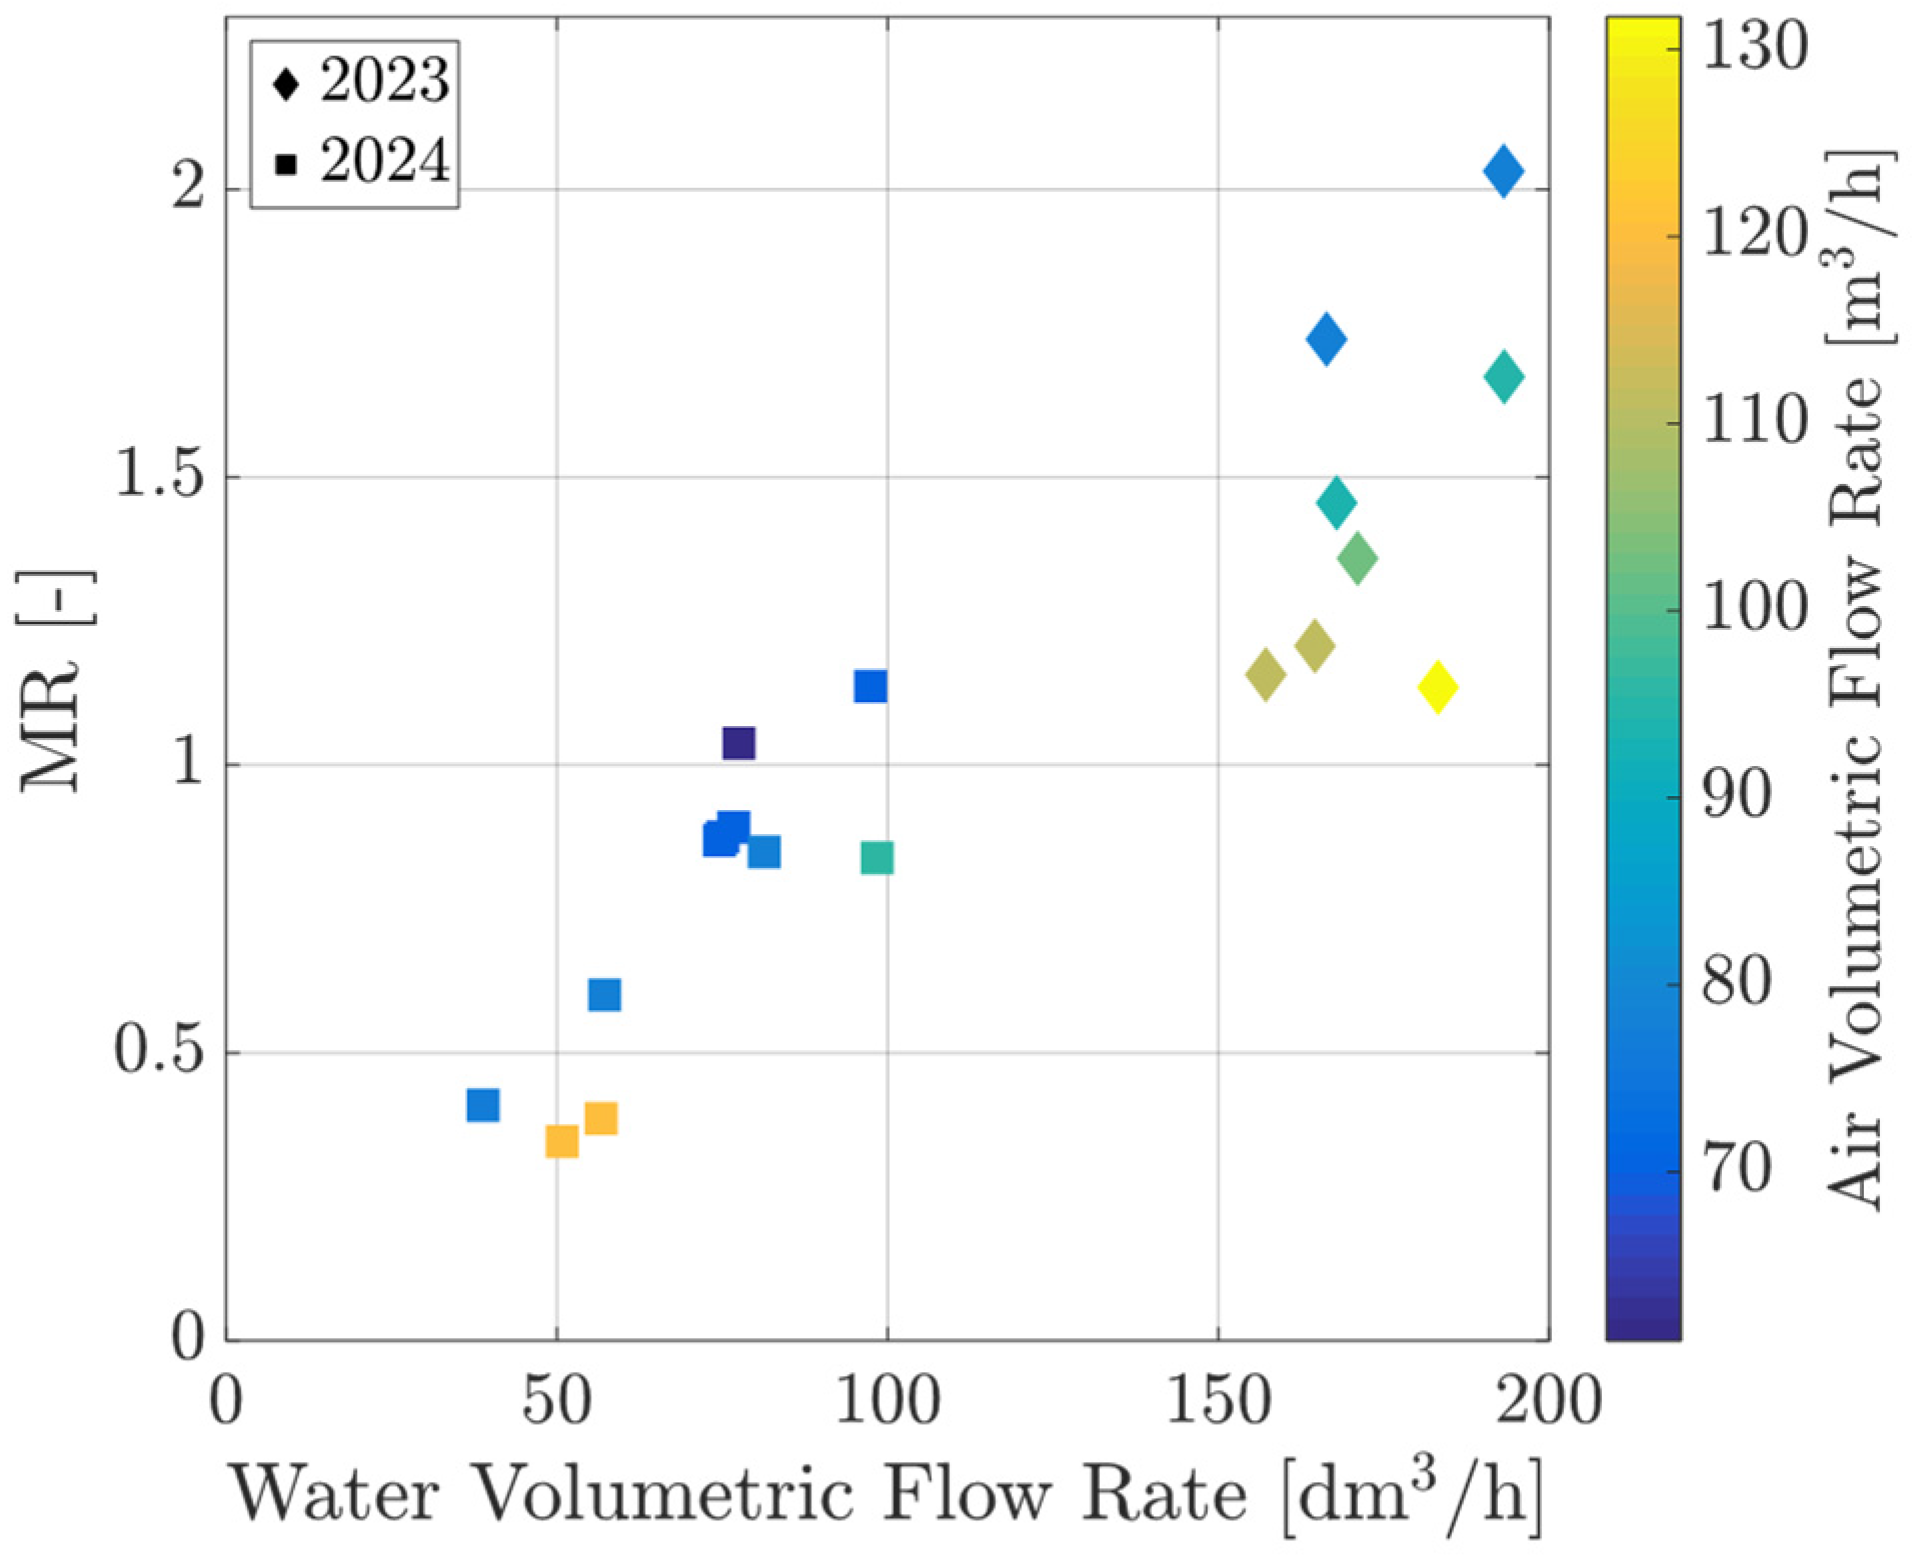
Several tests were carried out to characterize and evaluate the performance of the HDH system under different operational and environmental conditions. The mass flow rates of air and water varied between 60,980 dm3/h and 131,750 dm3/h (60.98 m3/h and 131.75 m3/h), and 51 dm3/h and 193.2 dm3/h (0.85 L/min and 3.22 L/min), respectively, enabling a range of mass flow ratio between 0.346 and 2.03. Additionally, performing the experiments over a few months allowed us to test different external weather conditions. The experiments were performed using tap water available at Politecnico di Milano instead of sea water. However, a colorant was added to the tap water confirming the capacity of theHDH system to deliver pure water without any carryover. Although the tap water properties may differ from those of saline water, their variation has been estimated to be within 2.5%, which is unlikely to affect any of the outcome of this study. Moreover, this methodology could be used to purify brackish or contaminated water, whose properties would differ very slightly from the feed water used in the experiments. However, the use of saline water in the system is expected to incur long-term potential issues for salt residue deposition and corrosion of the pipes. The latter consideration is outside the scope of this study but should be considered for applications of this technology to TRL 5 and above. In the remainder of this section the feed water will be referred to as saline water to facilitate the identification of the two streams of water in the system.
The experiments require stable solar irradiation conditions to properly assess the behaviour of the PVT-HDH system. Every suitable day, the mass flow rates of air m ˙ a i r and water m ˙ s w were set and kept constant to obtain a predefined mass flow ratio (MR). The pure water m ˙ p w production was measured by weighing the container where the pure water was collected by means of a scale, obtaining one value for each day. Moreover, to avoid inaccuracies due to shading of the PVT panels, data are collected only between 9 am and 5 pm are every day. The system was designed to ensure continuous operations without any additional thermal or electricity input, emphasizing the suitability for pure water production in remote areas.
Utilizing the acquisition system, all recorded data including temperature, pressures, electrical power consumption by the auxiliary, and electrical power generation by the PV/T are seamlessly imported into LabVIEW® every second. Data is subsequently imported and evaluated using MATLAB®. To investigate the system performance, some key parameters are considered and described in the following:
  • Mass flow ratio: it expresses the ratio between the flow rates of saline water and air circulating in the plant.
M R = m ˙ s w m ˙ a i r
  • Recovery ratio: it expresses the percentage ratio between pure water mass flow rate and saline water mass flow rate.
R R = m ˙ p w m ˙ s w 100
  • Gain output ratio: the ratio between the latent heat of evaporation of the distillate produced and the total thermal input absorbed by the solar collectors.
G O R = m ˙ p w Δ h p w Q ˙ i n , P V T
  • Specific electrical consumption: the amount of electricity that the auxiliaries (pump and fan) consume to produce one cubic meter of fresh water.
S E C = E a u x V p w
  • Thermal energy consumption: the amount of thermal energy recovered by the saline water flow in the PV/T modules
T E C = E t h , s w
  • Specific thermal consumption: the amount of thermal energy recovered by the saline water flow in the PV/T modules to produce one cubic meter of fresh water.
S T C = E t h , s w V p w
Although the experiments were conducted only during the day with good irradiation forecasts, some instances of unstable conditions occurred during the experiments. Thus, the data exploited in the remainder of this paper is grouped into two main batches where environmental conditions enabled a stable operation of the experimental setup throughout the whole day: a first set of data (8 days) from summer–autumn 2023, and a second set of data (11 days) from summer 2024, whose solar irradiance conditions are shown in Figure 12. The weather characteristics of Milan inherently limit the experimental activities to summer (late spring or early autumn) months to ensure reliable sunny conditions with high values of GHI/DNI.
Each of the 19 days considered for the analysis is listed in Table 4. Data about experiment duration, volumetric flow rate of saline water and dry air V ˙ s w and V ˙ d a , mass flow rate of saline water and dry air, the mass flow ratio MR, solar irradiance E s u n , average ambient temperature T a m b , PVT thermal energy input E t h , auxiliaries electricity consumption E a u x , mass of pure water m p w , specific thermal and electricity consumption (STC and SEC), the recovery ratio RR and the gain output ratio GOR, are reported in Table 4. Eventually, Table 5 reports the uncertainty associated with each computed parameter: one obtained by applying error propagation theory to the instantaneous values, and the other representing the average daily uncertainty, calculated following the same procedure used for the daily KPIs (i.e., based on daily aggregated or averaged quantities rather than the daily average of instantaneous ones). The daily uncertainties are therefore very small, owing to the large number of data points contributing to each daily value. It is worth noting that the instantaneous uncertainties for GOR, TEC, and STC are comparatively higher, as these quantities depend strongly on temperature measurements. Since the temperature difference between inlet and outlet is relatively small, this leads to larger propagated uncertainties.

5. Results and Discussion

The data collected at the SolarTech Lab in the summer/autumn months of 2023 and 2024 are analysed in the following section, where the impact of environmental parameters and operational choices on the performance of the system are assessed and investigated. The analysis performed focuses on the relationship between the main parameters mentioned above and their impact on the system’s performance and energy consumption. Although obtained using tap water with colorant, the trends and relationships reported below are expected to closely match those of a system using saline water, given the small differences in the main properties relevant to the HDH process.
The mass flow ratio (MR) values tested during the experiments are shown in Figure 13 for 2023 and 2024 data. The MR is varied, changing the ratio between feed saline water mass flow rate and air mass flow rate. Since the density of water and air is assumed constant in the range of temperatures and pressures experienced in this study, a variation of mass flow rate is directly proportional to the volumetric flow rate. In 2024, lower volumetric flow rates between 48 dm3/h (0.8 L/min) and 96 dm3/h (1.6 L/min) were adopted compared to higher flow rates between 150 dm3/h (2.5 L/min) and 198 dm3/h (3.3 L/min) in 2023, causing a significantly different range of MR values. This enables the evaluation of varied operating conditions at the PVT modules, whose performance is strongly affected by the heat removal impact of the saline mass flow rate. Within each year, smaller MR variations were obtained by changing both the water and the air volumetric flows roughly within ± 50 % of their maximum value.
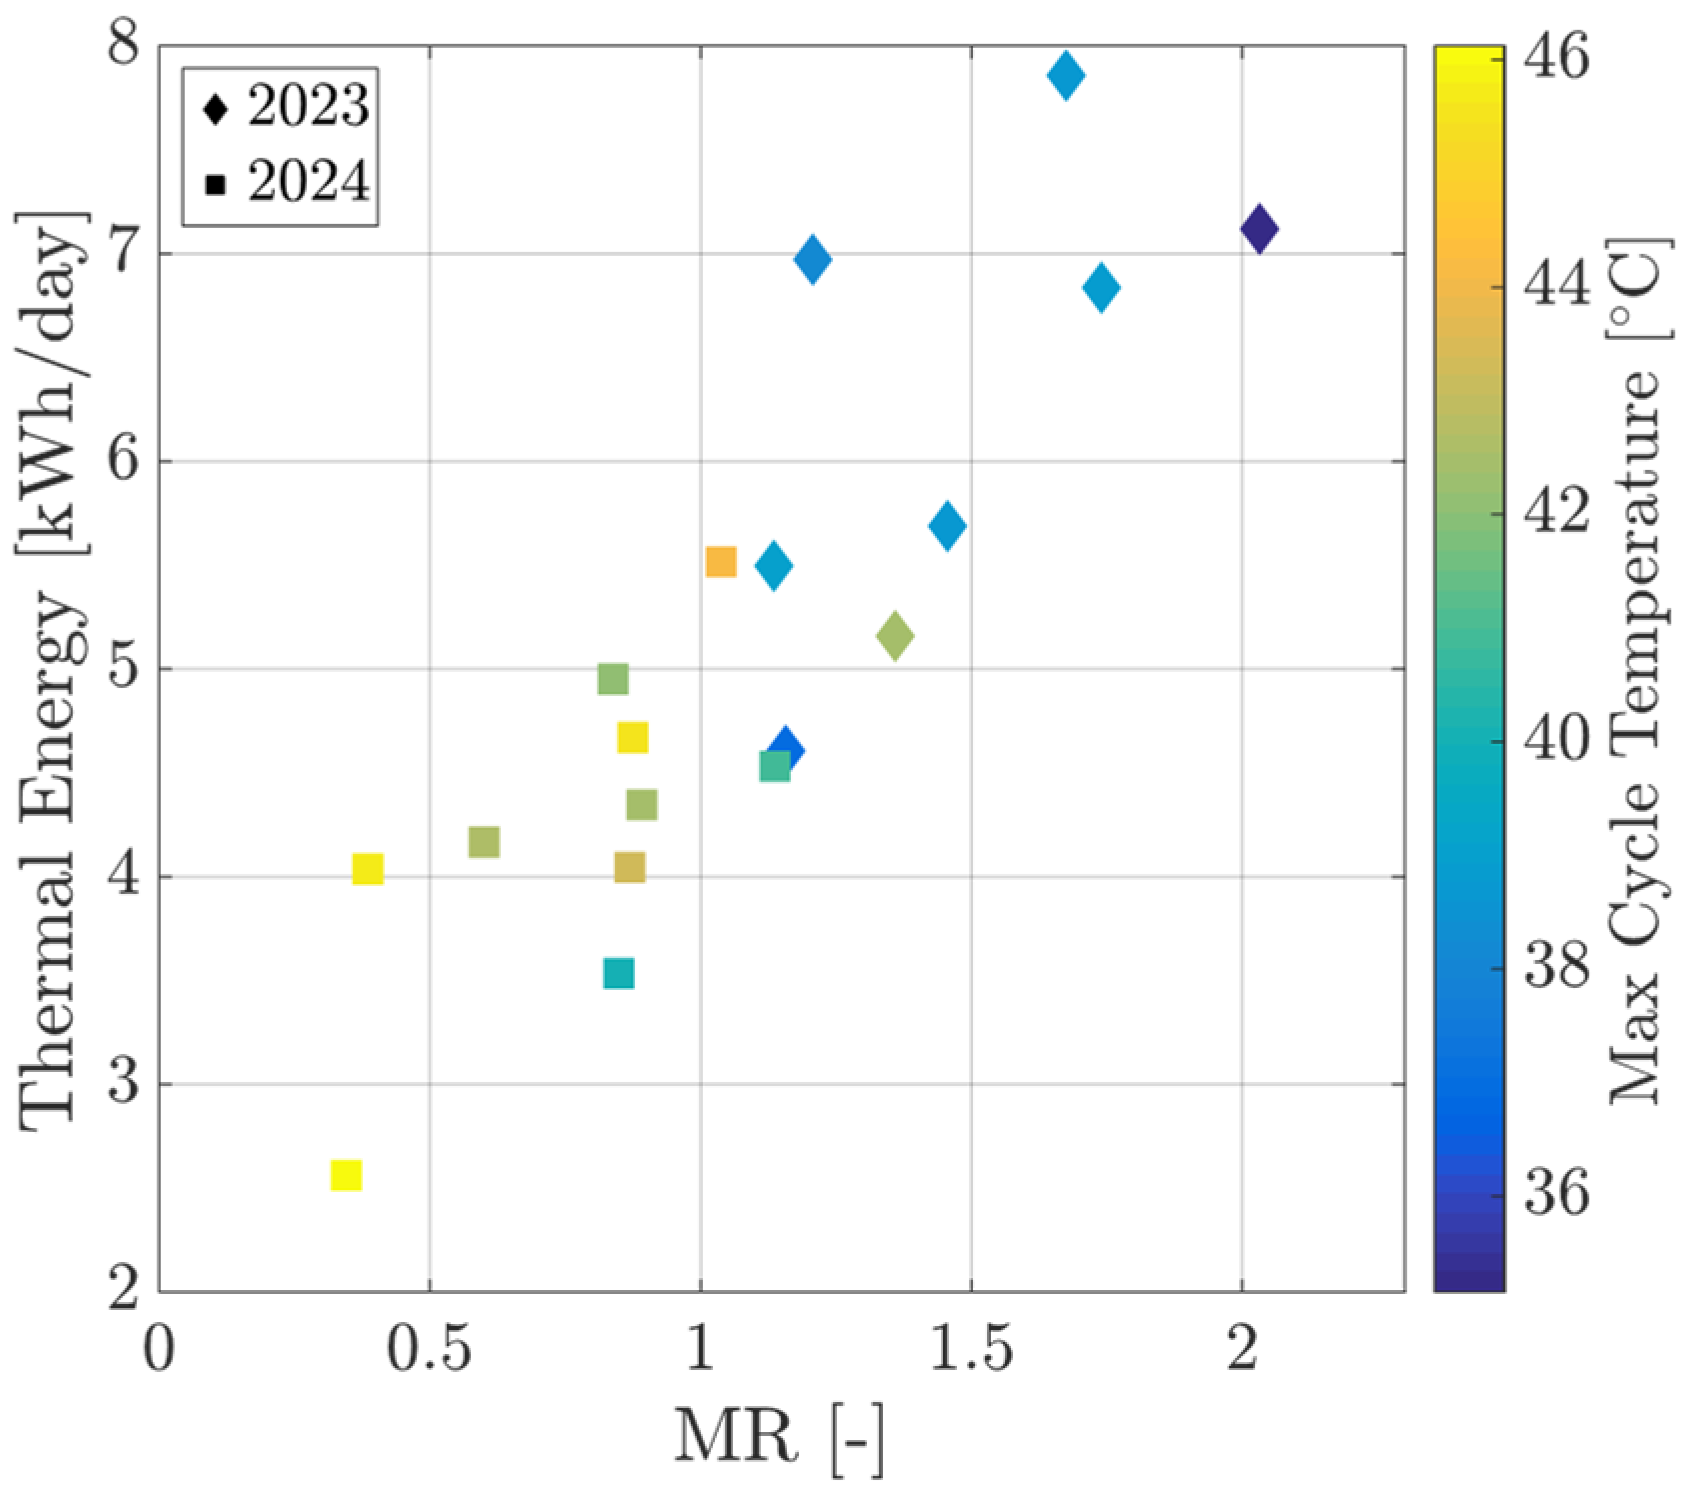
In Figure 14 the thermal energy consumption (TEC, representing the thermal energy absorbed by the PVT modules) is depicted for each day with the corresponding MR value. The colour scale represents the maximum water temperature at the outlet of the PVT modules. It is noteworthy the decrease in maximum temperature with increasing MR and high TEC, which is due to the higher water mass flow rate that enables higher heat removal.
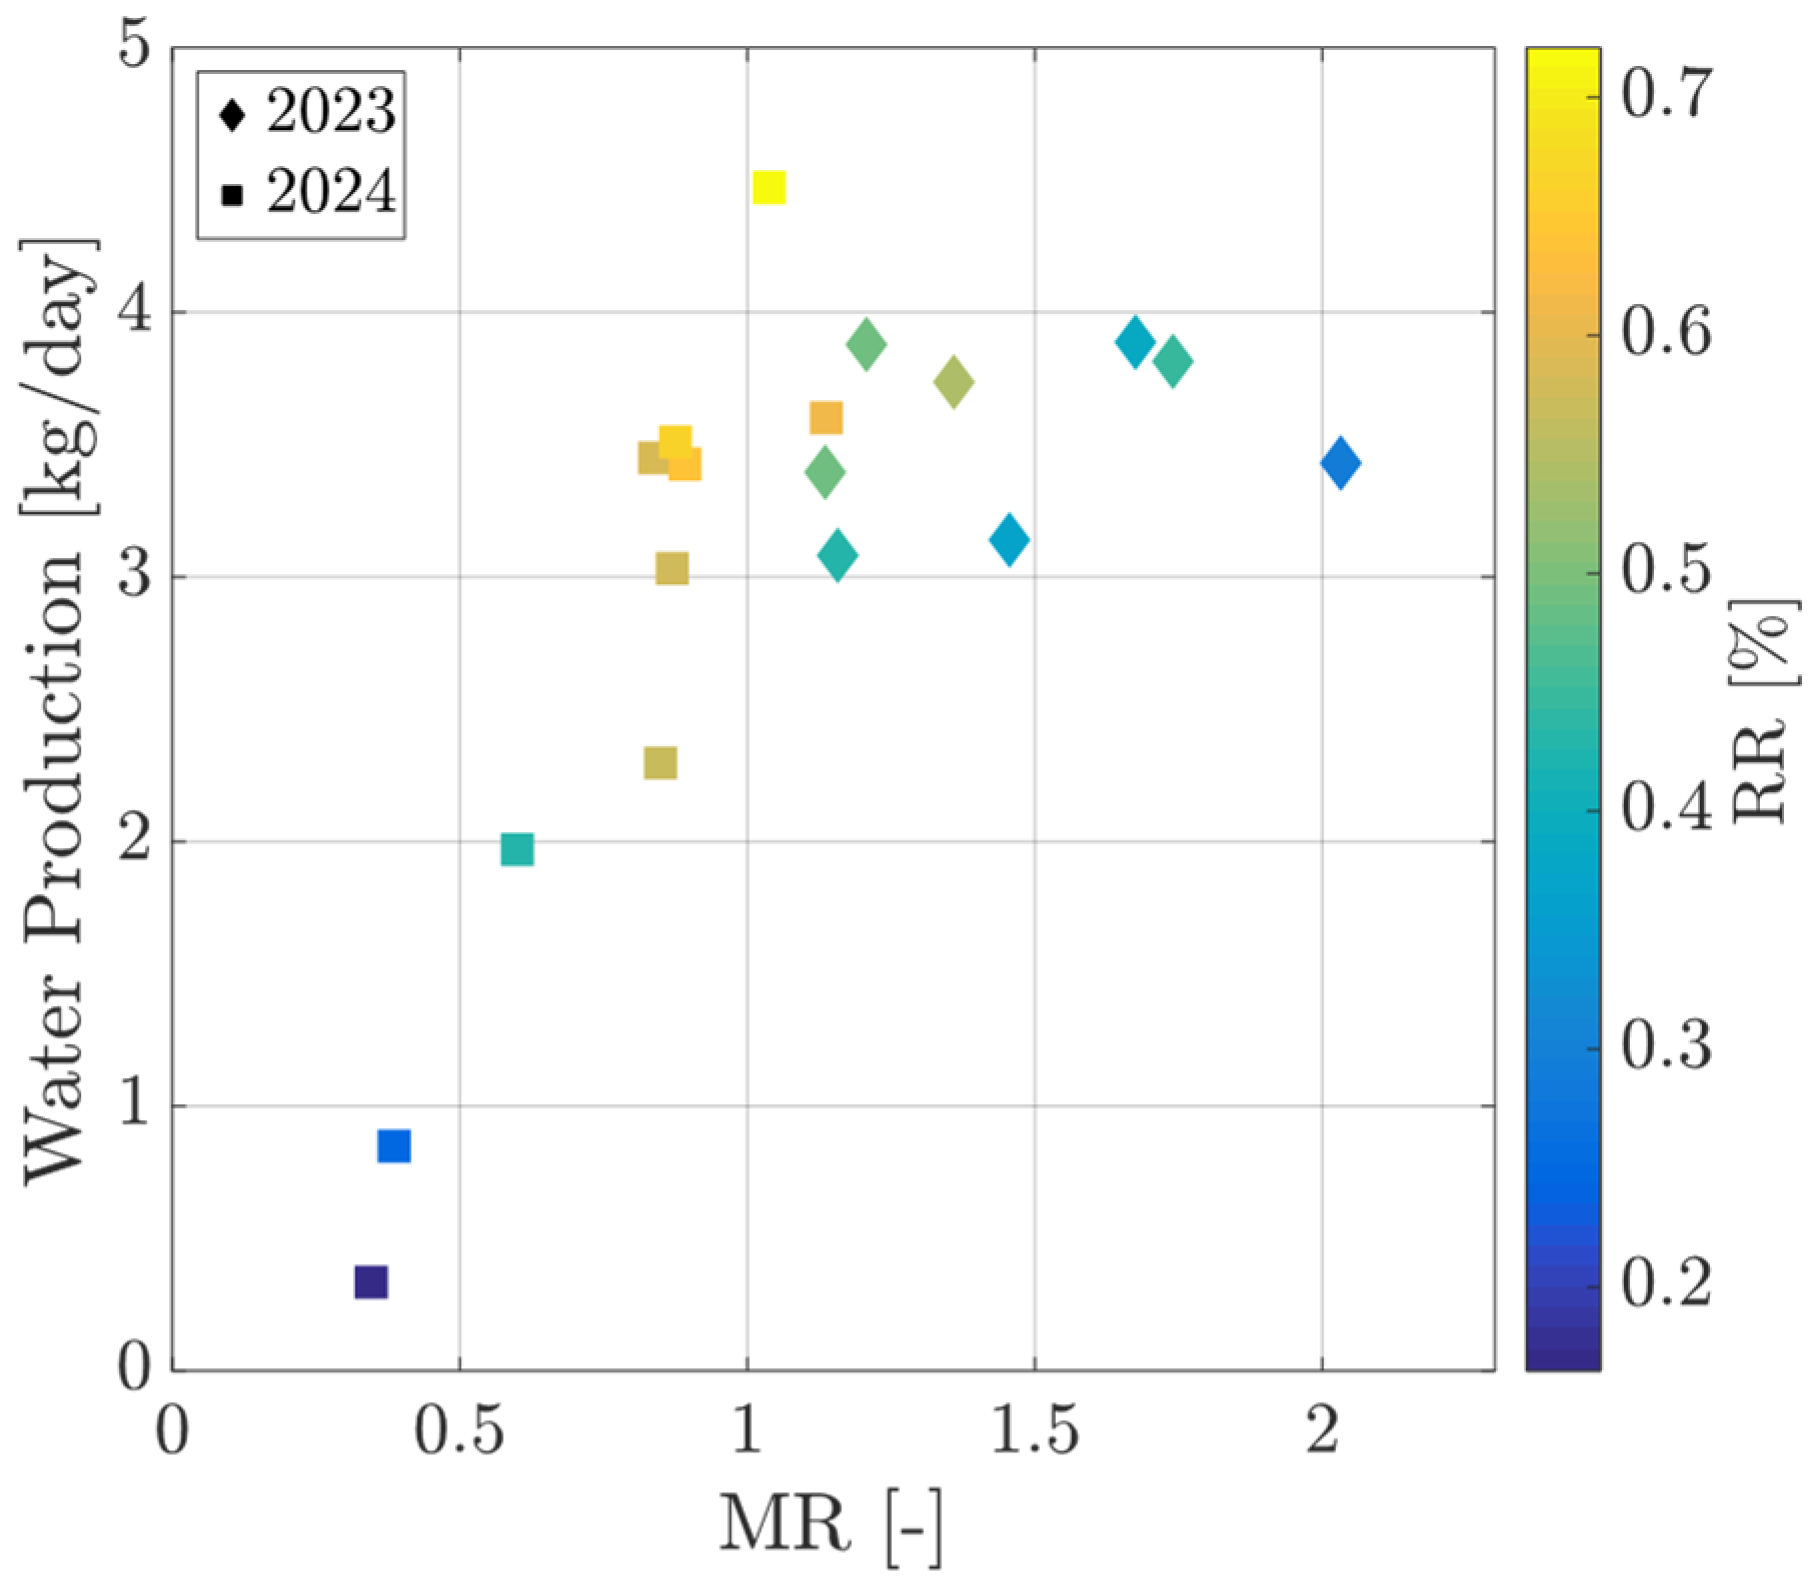
The production of pure water m ˙ p w is the main parameter that characterizes the performance of an HDH system, and it is shown in Figure 15. The graph shows an initial increase in pure water production m ˙ p w with an increasing MR, which reaches a maximum around 4 kg/day and subsequently slightly decreases for higher values of MR (and hence feed water mass flow rate in this study, as shown in Figure 13). This behaviour is explained by the reduced thermal performance enhancement of the PVT modules and lower maximum temperature obtained for increasing saline water mass flow rates. The lower maximum saline water temperature limits the temperature difference between moist (and warm) air at the outlet of the humidifier and the dry (and cold) air at the outlet of the dehumidifier. A smaller air temperature difference implies a smaller variation of humidity ratio in saturated conditions, which eventually leads to a smaller amount of water entrained in the flow of humid air. The observed trend is then verified by theoretical considerations. The graph also shows the dependence on the recovery ratio RR. Higher values of RR imply higher pure water production m ˙ p w for similar values of MR. The optimal value of RR is 0.72% that corresponds to the optimal MR for pure water production. The related maximum temperature is around 44   ° C , which is lower than the highest obtained temperature but guarantees the optimal balance between TEC and humidity ratio obtained in the humidifier. A similar optimal value at 40   ° C was obtained by a previous modelling study by Gabrielli et al. [23].
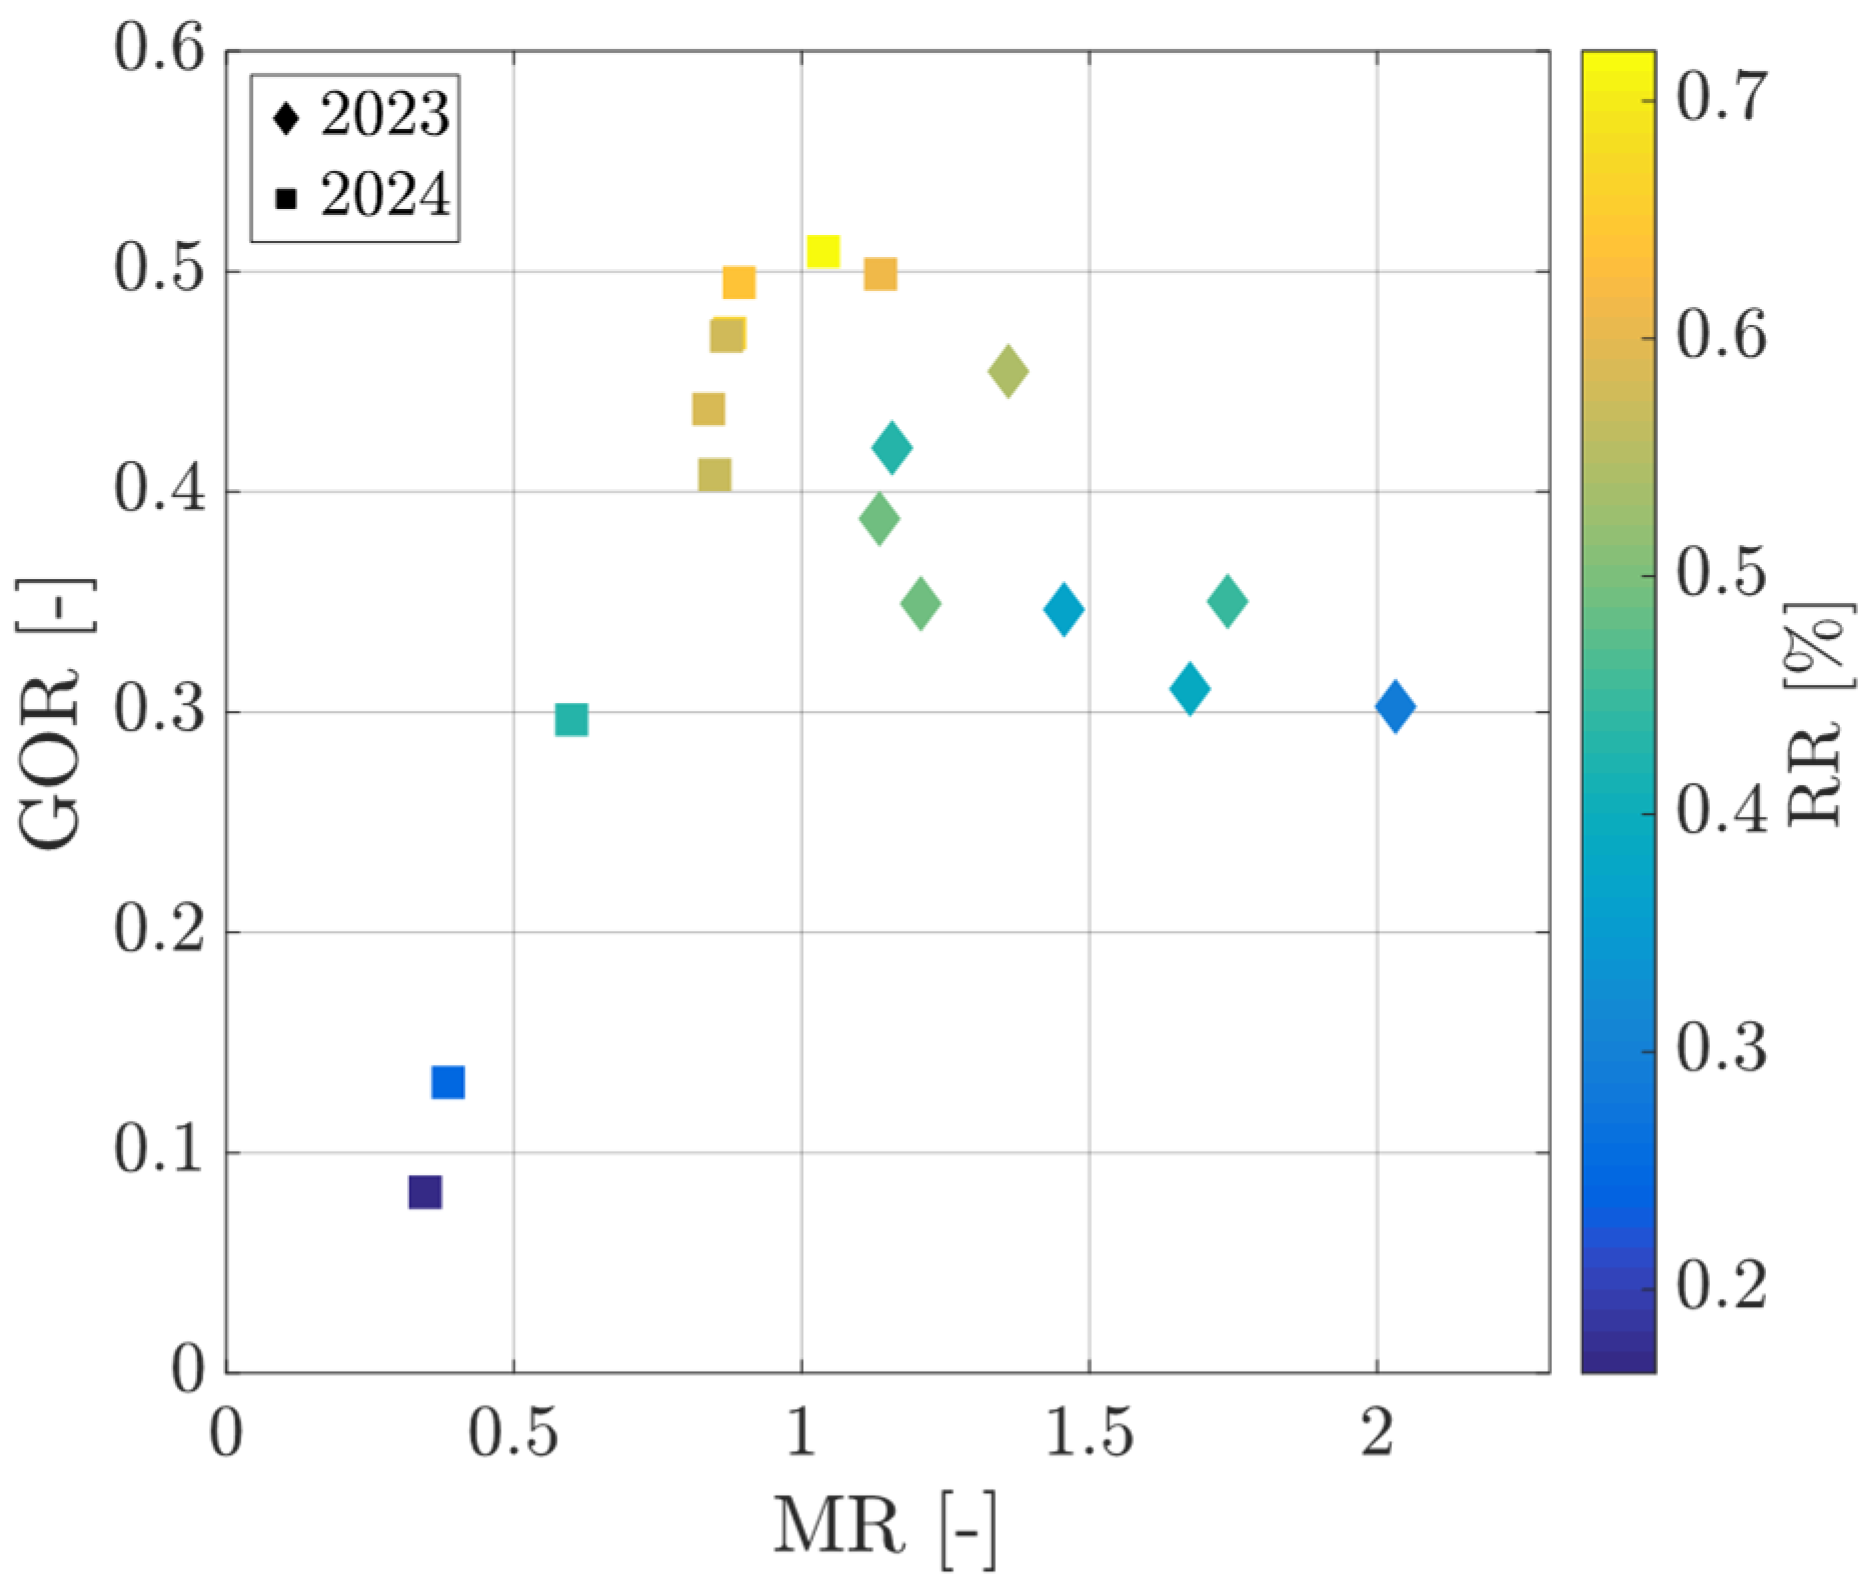
The gain output ratio GOR is represented in Figure 16. Coherently with the observed trend in Figure 15, the GOR has a maximum of 0.51 for the MR that guarantees the maximum RR and subsequently diminishes due to the slight decrease in pure water production and the concurrent increasing TEC at higher saline feed water mass flow rates. Additionally, for any value of MR, the colour scale clearly shows that higher values of RR correspond to higher values of GOR, as expected. The reported GOR and RR values in this study are lower than other solar-powered HDH systems, often employing evacuated tubes (e.g., [14,27]); however, these systems rely on additional electrical power sources while the system described in this study uses an integrated solution with PVT panels to provide both electricity and heat to the process. The only other experimental study with a similar setup [29] provided a very similar GOR of 0.48 and a higher RR of 3.15, although exploiting an additional electric heater to satisfy the demand. It should also be mentioned that the prototype realized in this study has been created using off-the-shelf components, thus optimized setup could achieve better performance closer to conventional HDH systems. Remarkably, both the electrical and thermal consumptions for the experimental setup adopted in this study are instead entirely satisfied by the PVT electricity and thermal generation, making the system totally self-sufficient, a paramount feature for clean water production in remote areas.
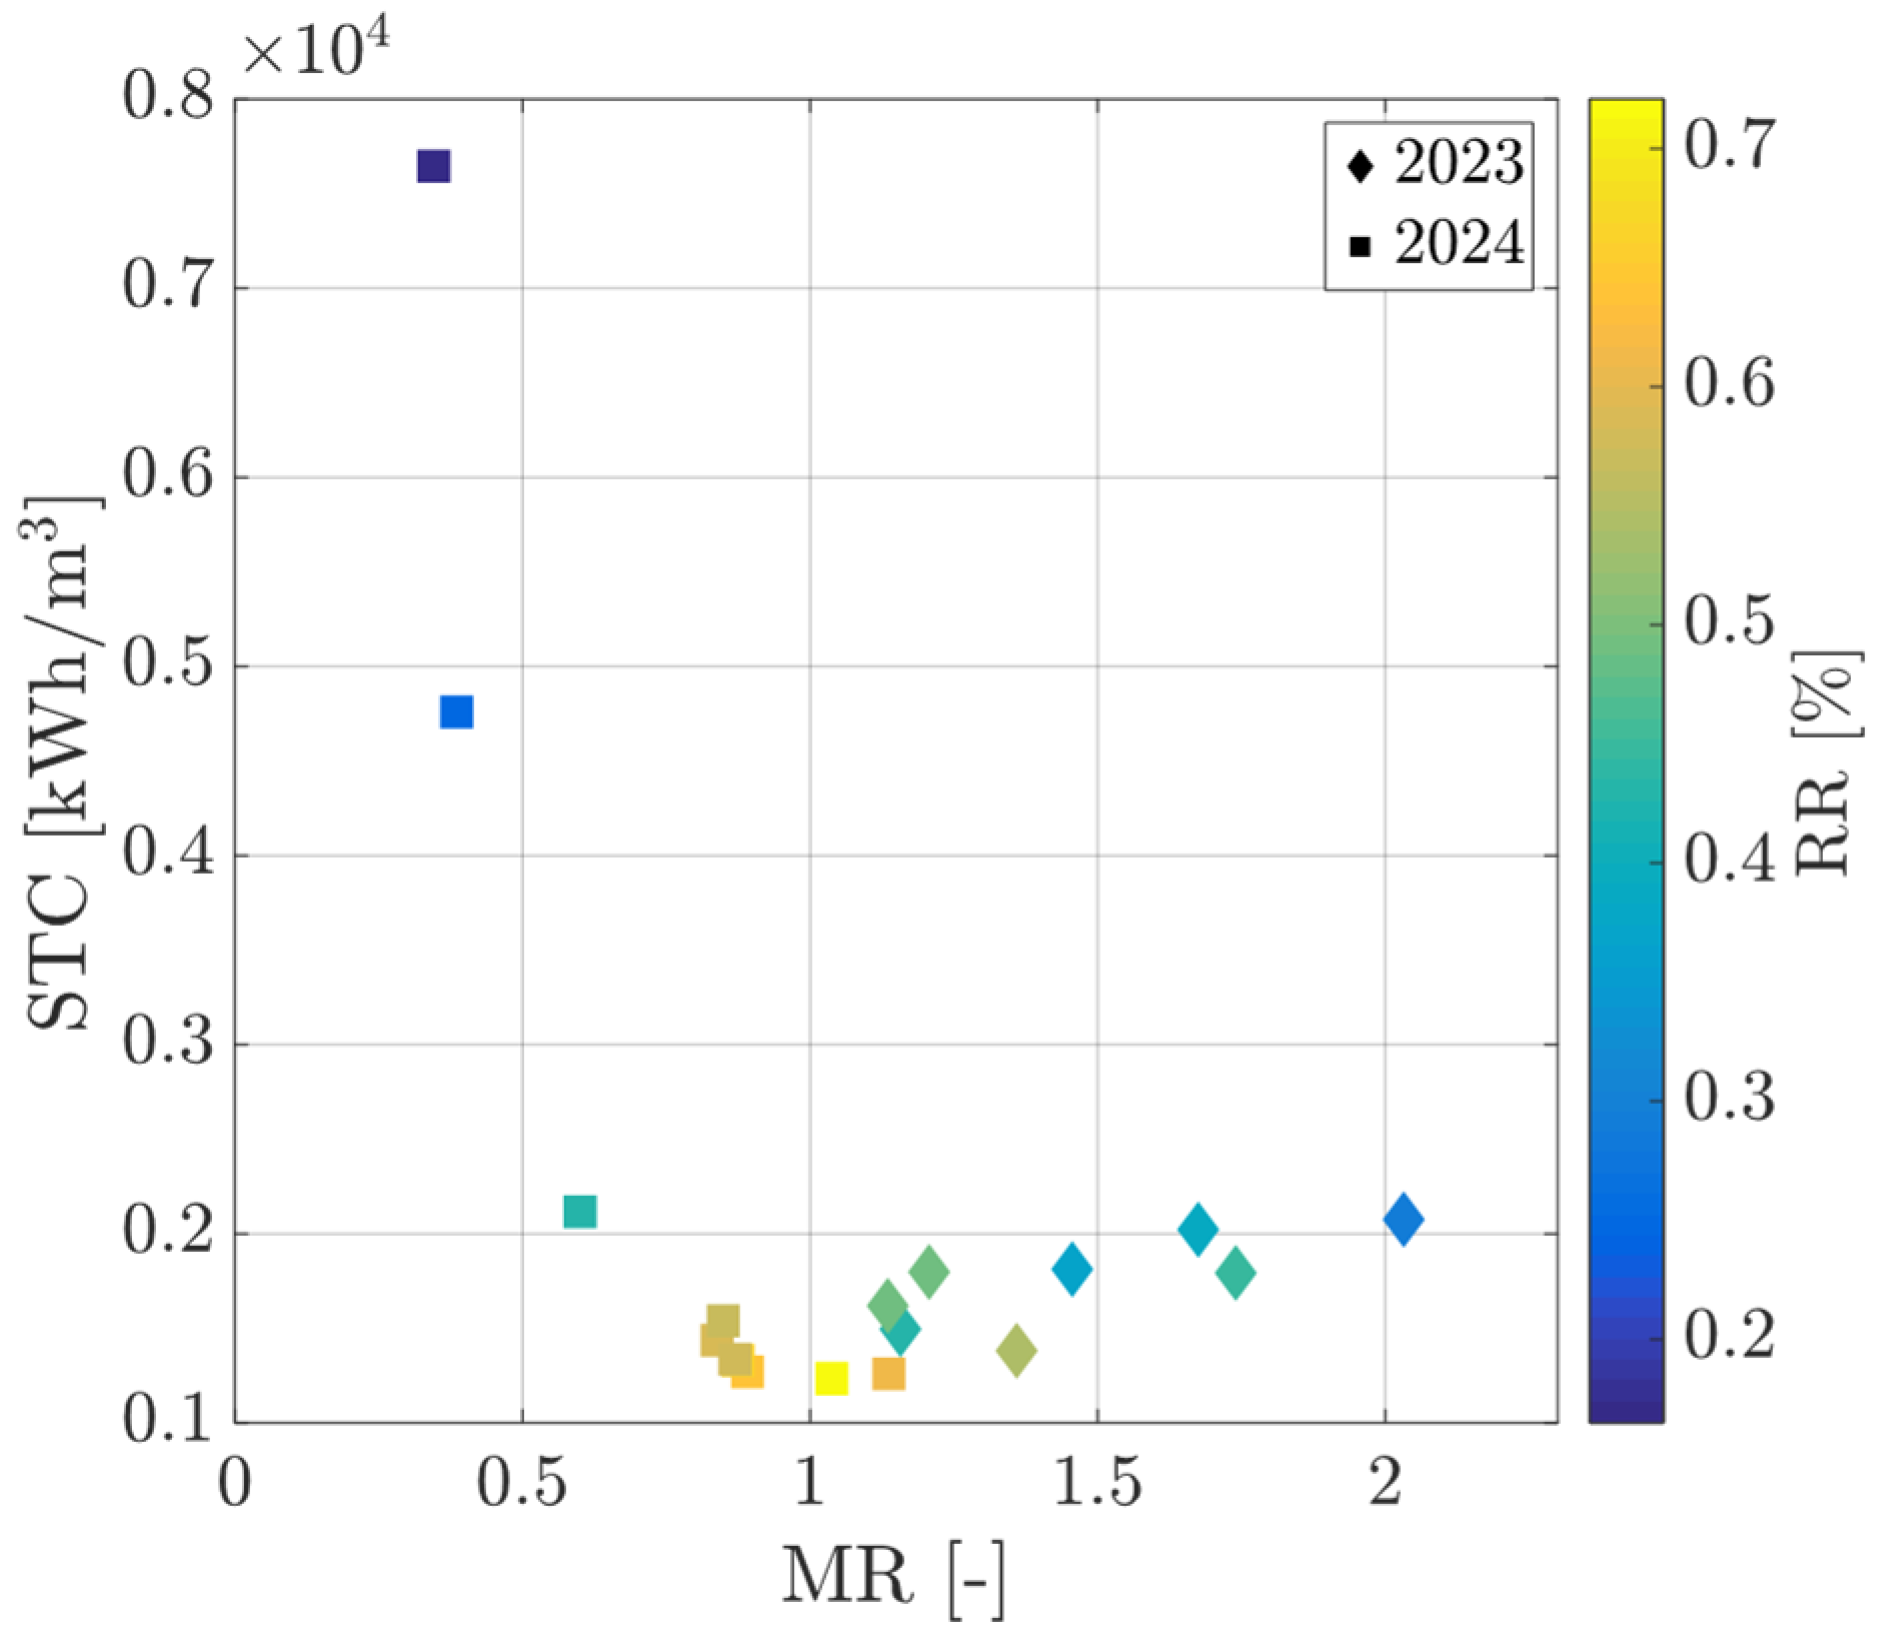
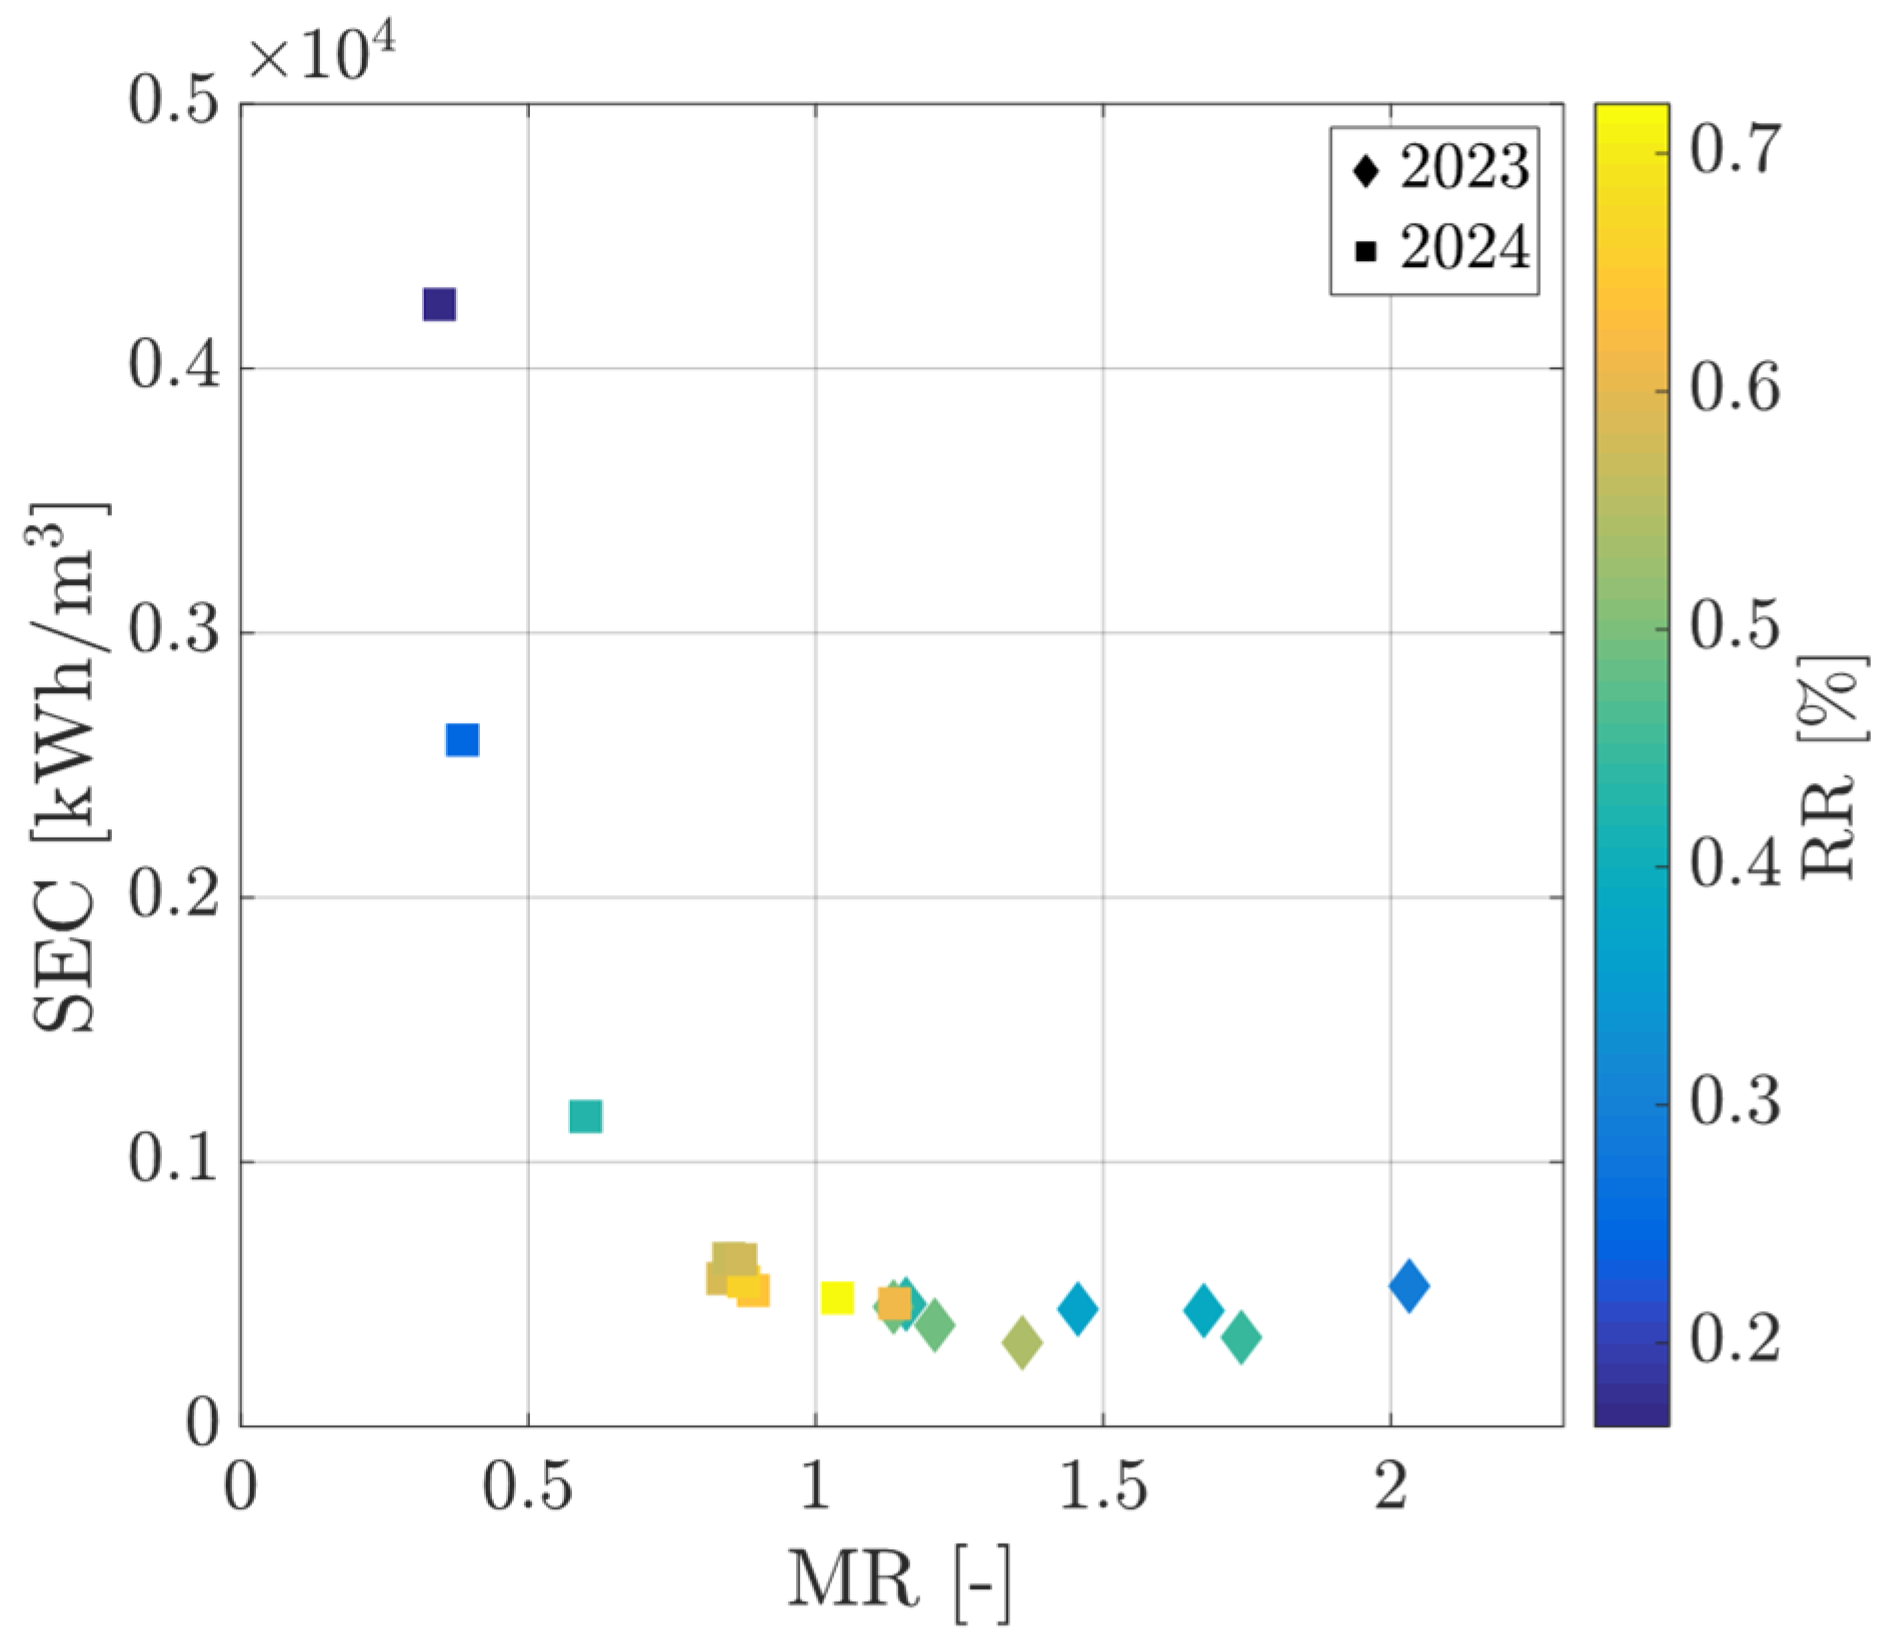
The trends of the specific thermal and electrical consumptions are depicted in Figure 17 and Figure 18, respectively. They express the amount of thermal energy and electricity required to produce one cubic meter of pure water. Both graphs show a strong initial reduction in specific consumption with increasing MR, characterized by very low pure water production. The specific thermal consumption (STC) also presents an expected minimum where the absorbed heat is properly balanced by the saline feed water mass flow rate resulting in the optimal maximum water temperature and thus optimal air temperature difference between humidifier and dehumidifier. The minimum STC corresponds also to the maximum value of RR, which is very well verified by the experimental results.

Numerical Model and Experimental Data Comparison

Eventually, the data collected through the experiments were exploited to verify the outcomes of the humidifier and the dehumidifier models. Recorded data were averaged over 5 min intervals to limit measurements noise, especially for temperature readings for air and water inlet.
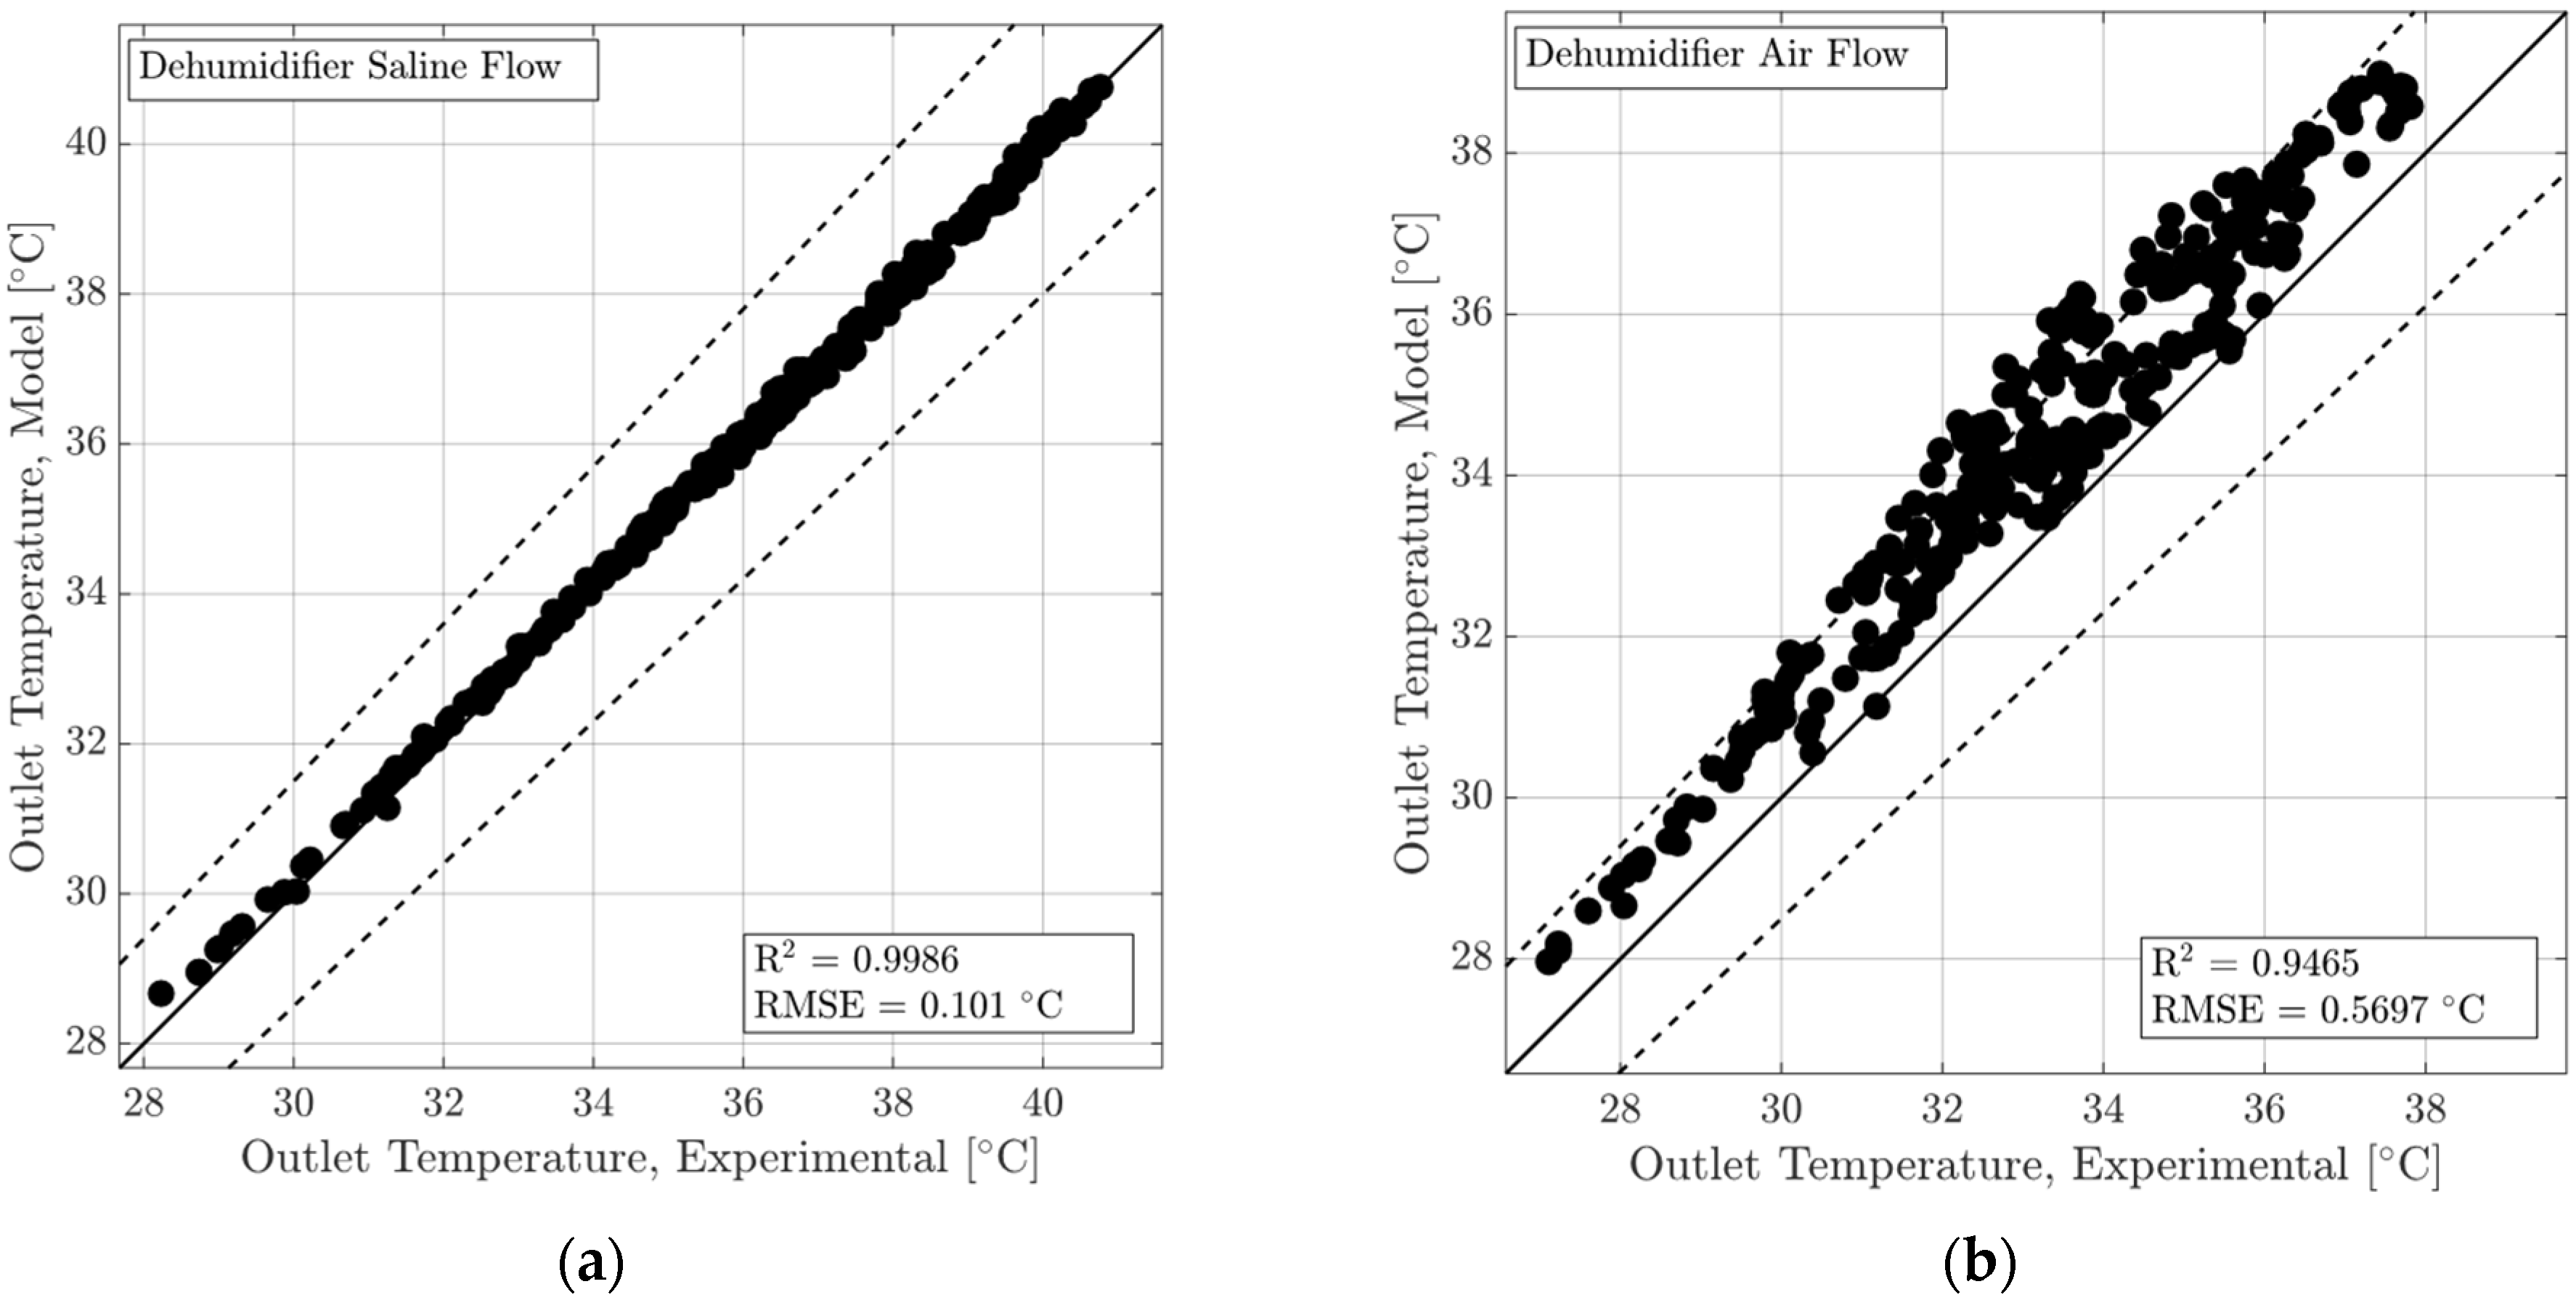
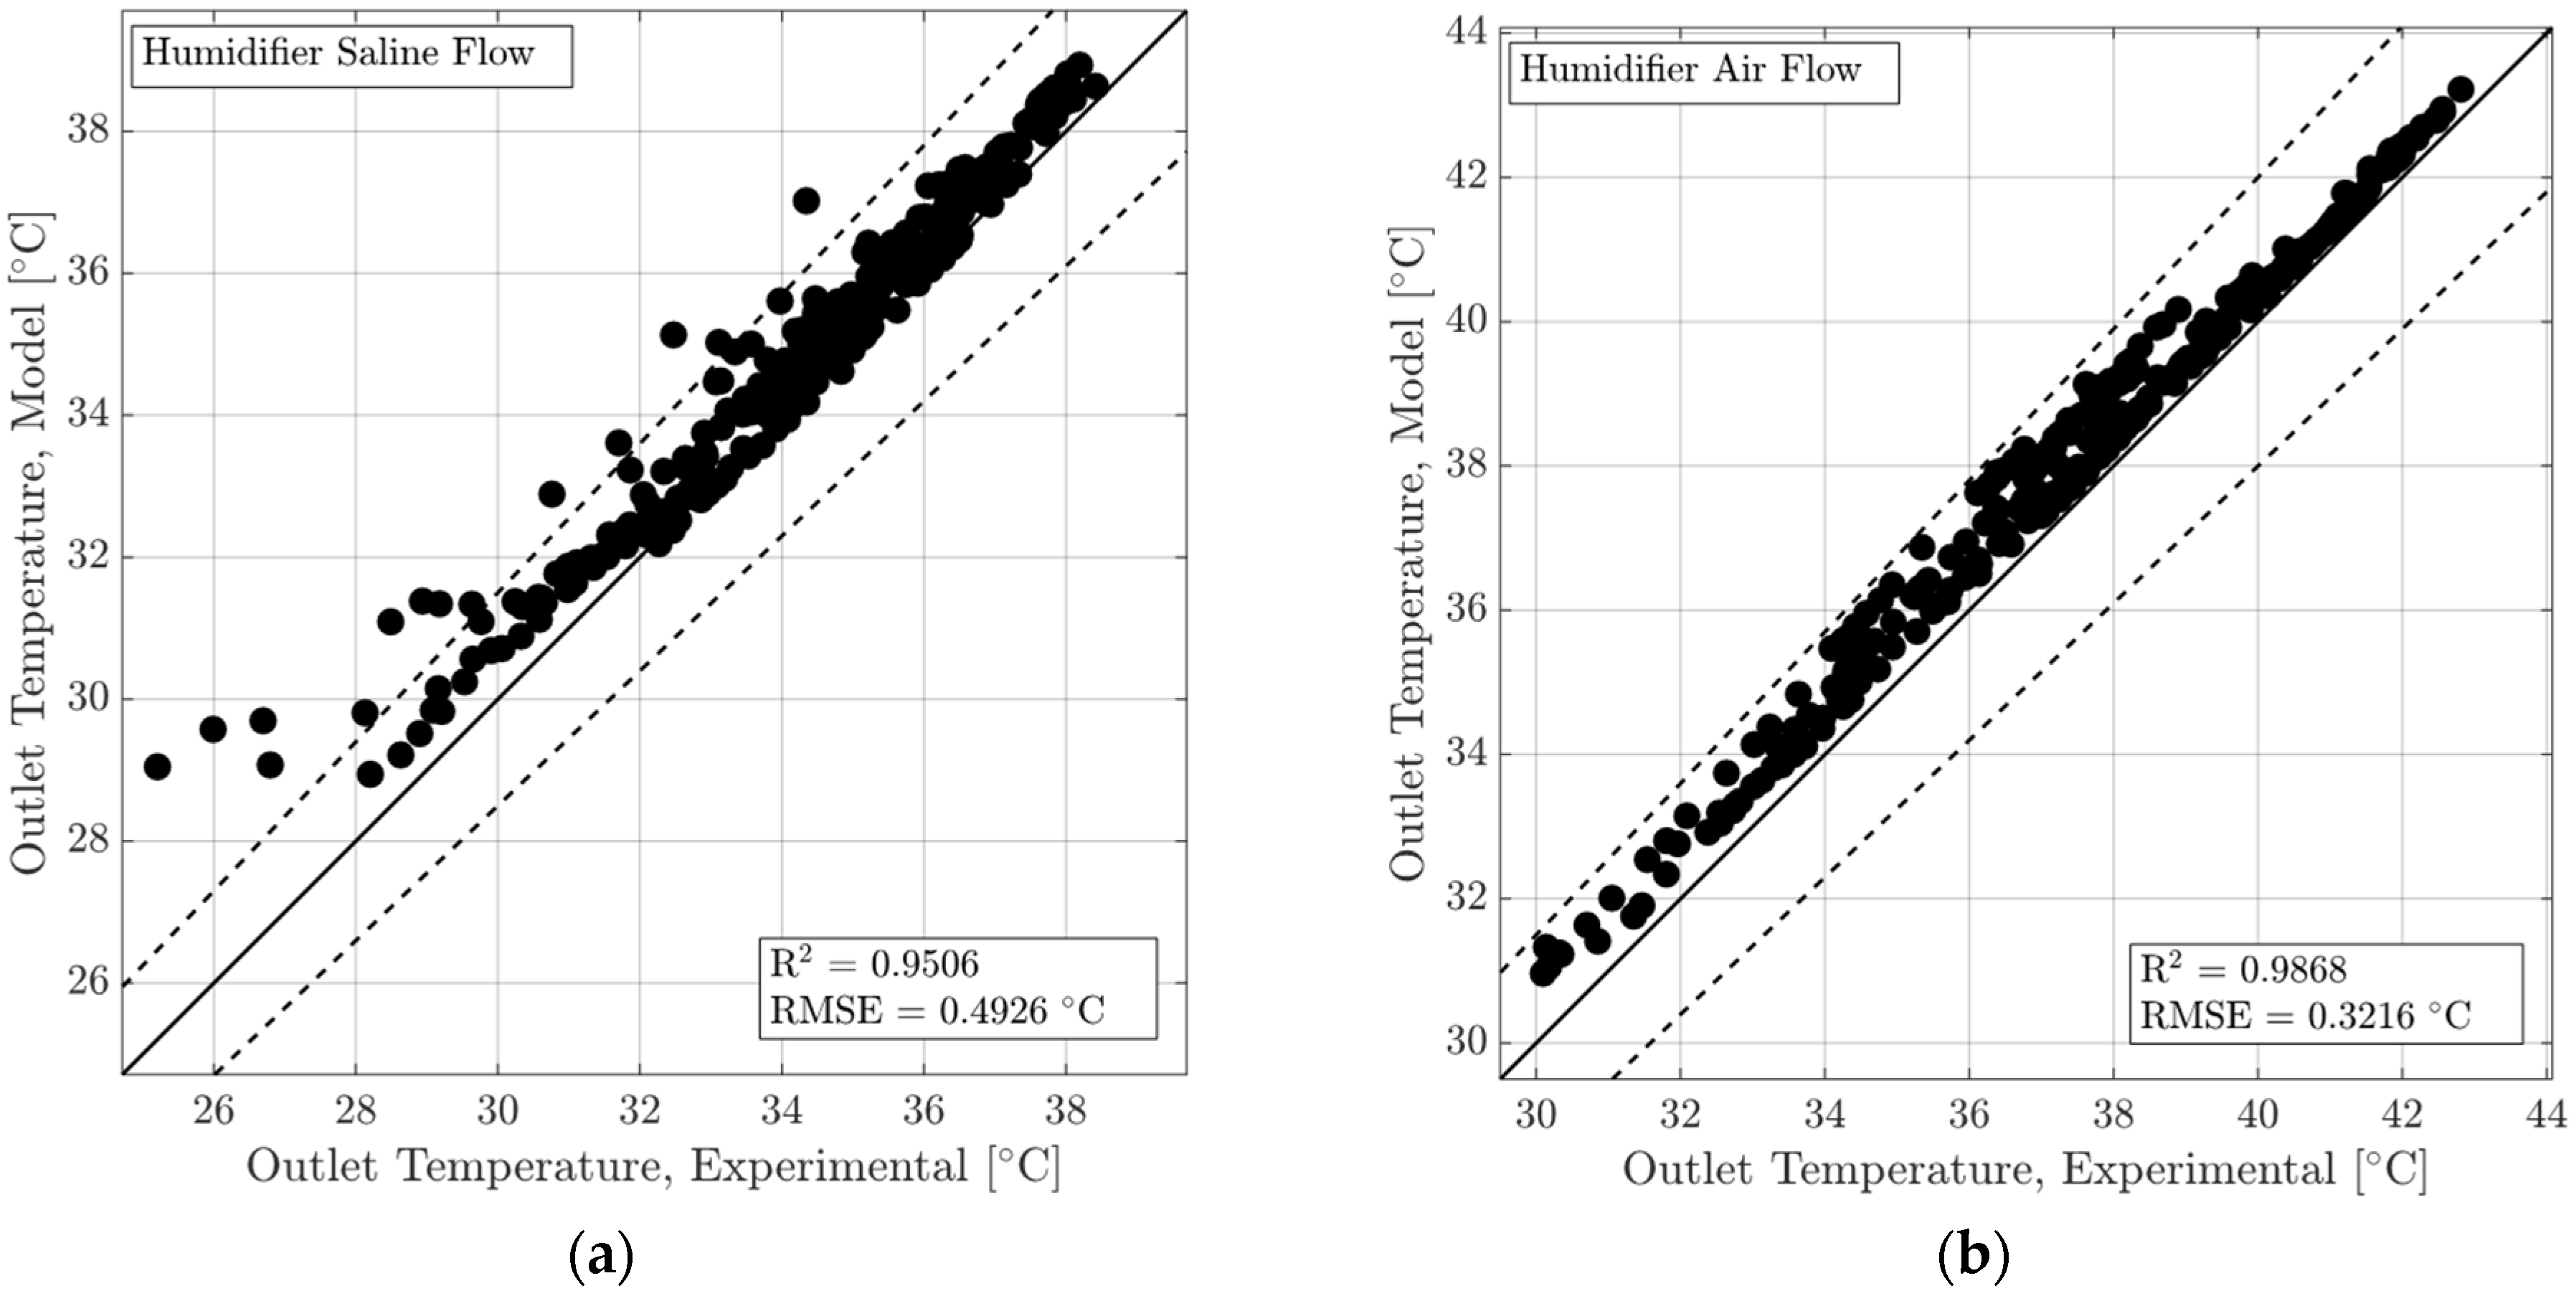
Parity plots are realized for both components, comparing the outlet temperature of air and water streams. In all instances, the model performs well with R 2 values above 0.95 and maximum RMSE around 0.53   ° C . The good agreement between experimental and simulated data supports the simplifying assumptions described in Section 2. A common relevant assumption in both models is related to the constant properties of air and water in the exchangers. This is justified by the small temperature variation within each volume, thus strongly limiting the variation of the fluids’ properties, which are largely dependent on their temperature. Overall, the model tends to overestimate the airflow outlet temperature, which is likely due to heat losses occurring in the experimental setup between the heat exchangers’ outlet and the thermocouple. The graphical representation of the parity plots for each component is depicted in Figure 19 and Figure 20. Black dots represent the experimentally obtained data points, while the dashed lines provide the ±5% error boundary from perfect predictions between modelled and experimental results (black solid line).
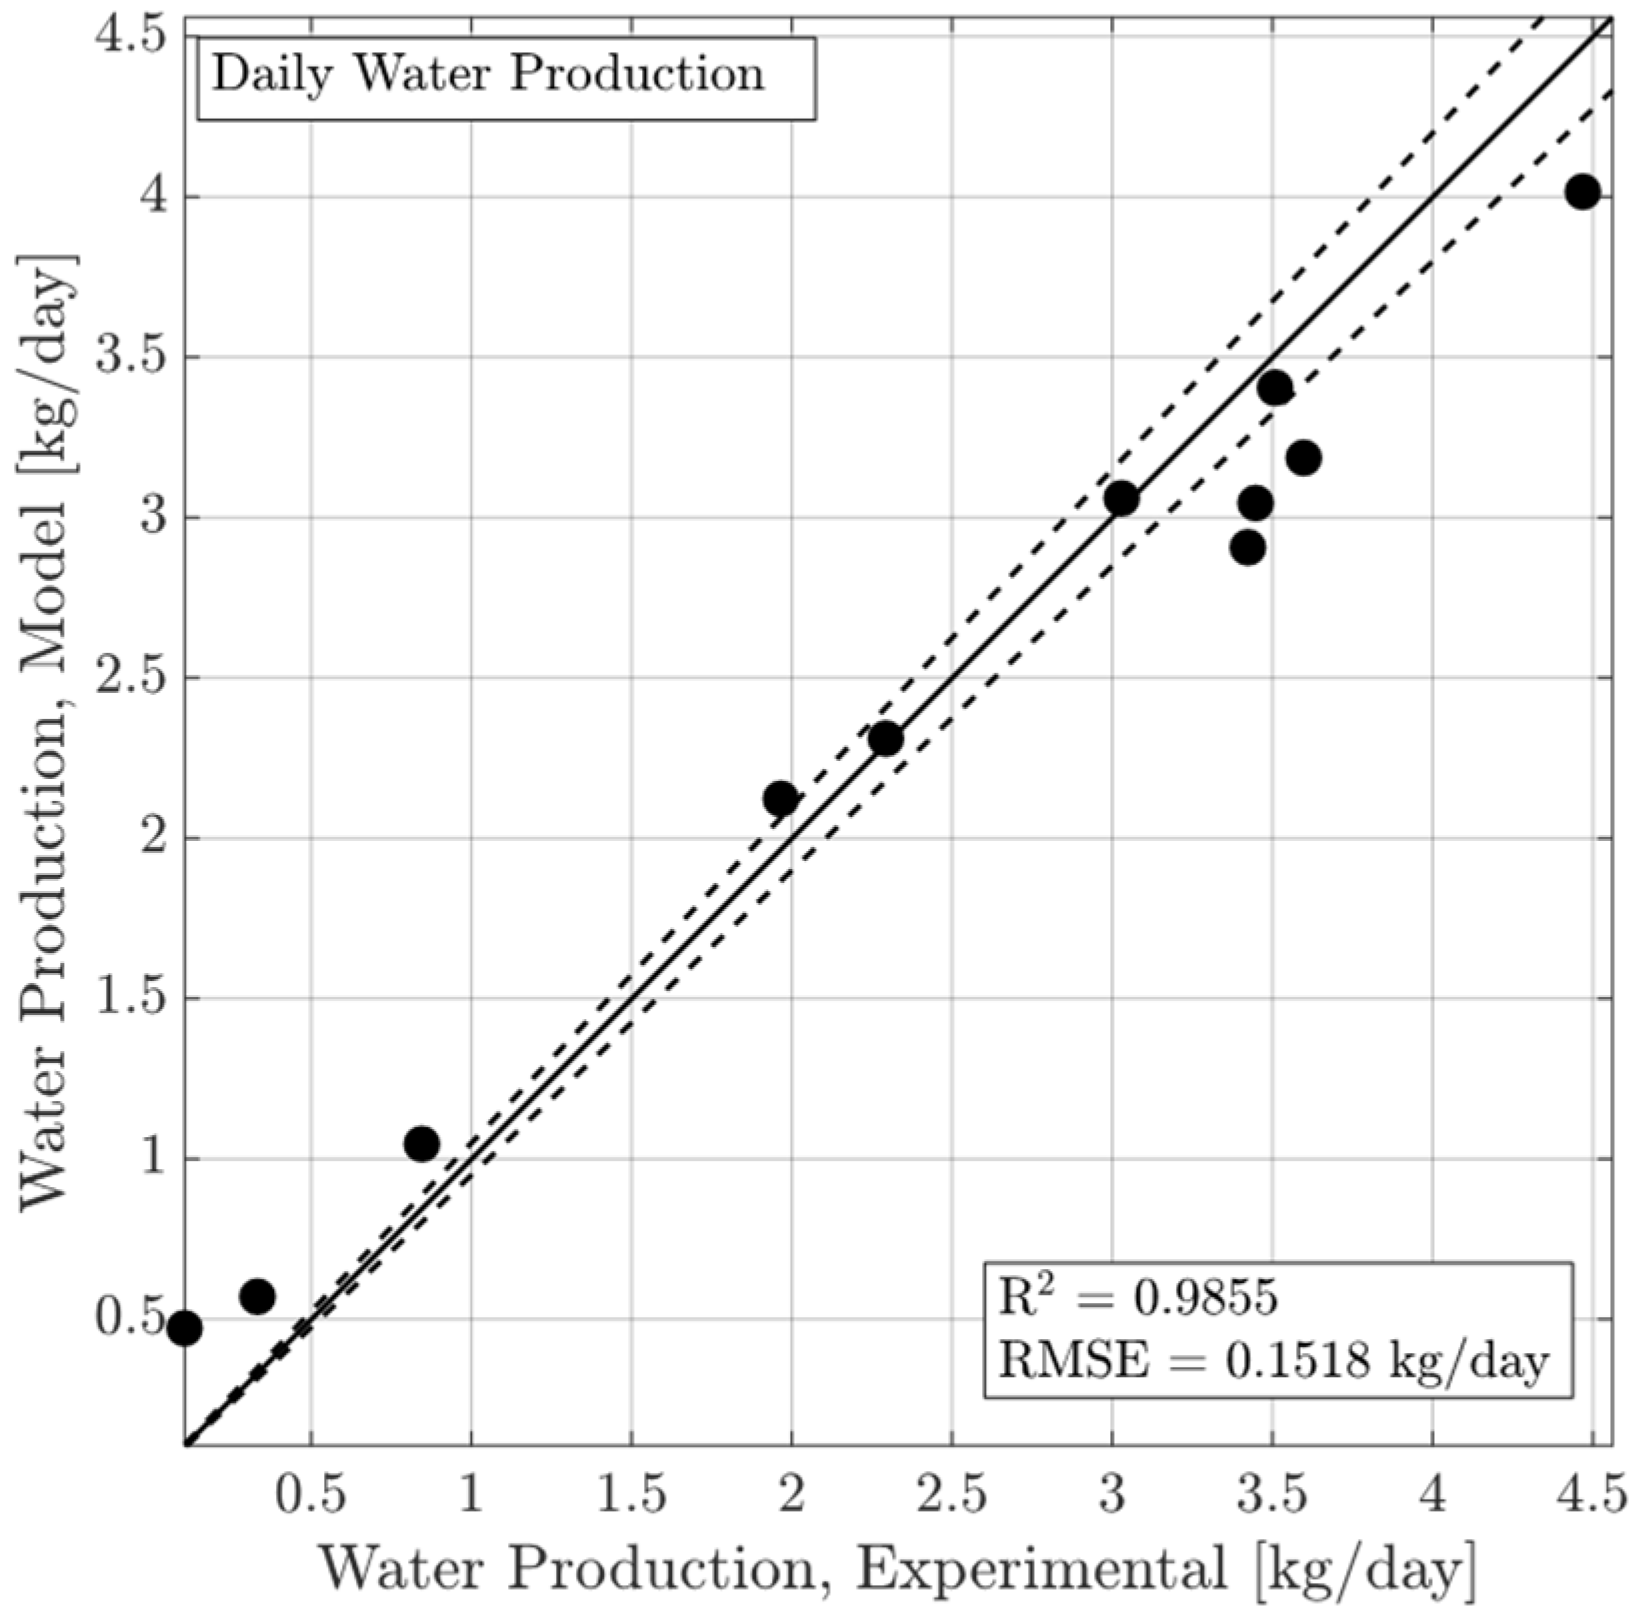
In addition to the comparison between simulated and measured outlet temperatures for the working fluids, a parity plot to evaluate the accuracy of the water production is depicted in Figure 21. There is good agreement between simulated and measured values, especially when taking into account the measuring technique of the produced water that is based on weighing a container where water droplets are collected at the dehumidifier outlet.

6. Conclusions

The exploitation of HDH systems to produce pure water is an established technique to alleviate the issues related to polluted and contaminated water sources in remote communities. Their electrical consumption is, however, a limiting factor when grid connections are not available or unreliable, especially when additional electric heaters are operated to guarantee the required thermal input. Photovoltaic modules are commonly adopted to supply electricity in remote areas, and Photovoltaic-Thermal (PVT) modules are able to supply both electricity and thermal energy simultaneously, enhancing the efficiency of electricity generation by reducing the operating temperature of the cells. This study describes an innovative experimental setup realized to test the performance of an autonomous integrated HDH-PVT system. Models have been developed to simulate the humidifier and dehumidifier components of the system and eventually verified exploiting the collected data.
The experimentally obtained data proved the feasibility of the solution with G O R 0.5 and R R 0.7 % with a small prototype producing up to 4 kg/day of pure water. Remarkably, the performance of the experimental setup enables the operation of the HDH system based entirely on the electricity and the thermal energy generated by the PVT modules. The PVT-HDH WH experimental system described in this study is hence totally self-sufficient and suitable for clean water production in remote and isolated locations. The results of the experiments also enabled the verification of theoretically expected trends for the main parameters: the pure water production m ˙ p w increases with M R until it reaches a maximum and subsequently slightly decreases due to higher TEC being compensated by lower maximum temperature of the feed water thus reducing the temperature difference of air (and hence maximum humidity ratio) between humidifier and dehumidifier. The optimal m ˙ p w production is obtained for M R 0.9 1 , corresponding to the maximum of both R R and G O R , and the minimum S T C .
The results obtained with this study prove the feasibility of the proposed PVT-HDH solution for rural communities affected by water scarcity and provide relevant insights and experimental verification of the expected behaviour of HDH systems powered by solar collectors.

Author Contributions

Conceptualization, G.M. and L.M.; methodology, L.M. and R.S., software, R.S.; validation, R.S. and G.P.; formal analysis, R.S. and G.P.; investigation, R.S. and G.P.; resources, G.M.; data curation, R.S. and G.P.; writing—original draft preparation, G.P. and R.S.; writing—review and editing, G.P., R.S., L.M. and G.M.; visualization, R.S. and G.P.; supervision, G.M. and L.M.; project administration, G.M. All authors have read and agreed to the published version of the manuscript.

Funding

This research received no external funding.

Data Availability Statement

All available data are reported in Table 4 within the manuscript. Additional information may be provided upon request.

Acknowledgments

The authors would like to acknowledge the Smart Power Division of ABB SpA for the support provided in building the HDH prototype.

Conflicts of Interest

The authors declare no conflicts of interest.

Nomenclature

The following abbreviations, symbols, and suffixes are used in this manuscript.
AHAir Heated
CACWClosed Air Closed Water
CAOWClosed Air Open Water
DHIDiffuse Horizontal Irradiance
GHIGlobal Horizontal Irradiance
GORGain Output Ratio
HDHHumidification Dehumidification
MDMembrane Distillation
MEDMulti-Effect Distillation
MRMass flow Ratio
MSFMulti-Stage Flash distillation
PVPhotovoltaic
PVTPhotovoltaic Thermal
ROReverse Osmosis
RRRecovery Ratio
SECSpecific Electrical Consumption
SDGSustainable Development Goals
STCSpecific Thermal Consumption
TECThermal Energy Consumption
VCCVapor Compression Chiller
WHWater Heated
ω Humidity ratio of air
A Cross sectional area
ϵ Dehumidifier heat exchange effectiveness
ρ Density
Q ˙ Heat
U Heat transfer coefficient
L Height
Δ h l v Latent heat of vaporization of water
L e f Lewis factor
m ˙ Mass flow rate
k G Mass transfer coefficient
M e Merkel number
p Pressure
Δ p Pressure drop
h Specific enthalpy
c p Specific heat
G Specific mass flow rate
a Specific packing area
T Temperature
a i r Air
d a Dry air
m a Moist air
p w Pure water
s w Saline water
v Vapour

References

  1. United Nations. Transforming Our World: The 2030 Agenda for Sustainable Development. 2015. Available online: https://sdgs.un.org/2030agenda (accessed on 25 August 2025).
  2. Goal 6: Ensure Access to Water and Sanitation for All. Available online: https://www.un.org/sustainabledevelopment/water-and-sanitation/ (accessed on 20 August 2025).
  3. World Bank. The Role of Desalination in an Increasingly Water-Scarce World. 2019. Available online: https://hdl.handle.net/10986/31416 (accessed on 11 July 2025).
  4. Rajesh, S.; Chiranjeevi, C. Hybrid thermal desalination systems for sustainable development—A critical review. Sol. Energy 2024, 270, 112364. [Google Scholar] [CrossRef]
  5. Curto, D.; Franzitta, V.; Guercio, A. A review of the water desalination technologies. Appl. Sci. 2021, 11, 670. [Google Scholar] [CrossRef]
  6. Mistry, K.H.; Mitsos, A.; Lienhard, J.H. Optimal operating conditions and configurations for humidification–dehumidification desalination cycles. Int. J. Therm. Sci. 2011, 50, 779–789. [Google Scholar] [CrossRef]
  7. Sonkar, M.; Kanathala, Y.; Naik, B.K. Recent developments in solar-driven adsorption and humidification-dehumidification based hybrid desalination system: A state-of-the-art review. Sol. Compass 2025, 15, 100125. [Google Scholar] [CrossRef]
  8. Urban, J.J. Emerging Scientific and Engineering Opportunities Within the Water-Energy Nexus. Joule 2017, 1, 665–688. [Google Scholar] [CrossRef]
  9. Giwa, A.; Akther, N.; Al Housani, A.; Haris, S.; Hasan, S.W. Recent advances in humidification dehumidification (HDH) desalination processes: Improved designs and productivity. Renew. Sustain. Energy Rev. 2016, 57, 929–944. [Google Scholar] [CrossRef]
  10. Shaikh, J.S.; Ismail, S. A review on recent technological advancements in humidification dehumidification (HDH) desalination. J. Environ. Chem. Eng. 2022, 10, 108890. [Google Scholar] [CrossRef]
  11. Giwa, A.; Fath, H.; Hasan, S.W. Humidification–dehumidification desalination process driven by photovoltaic thermal energy recovery (PV-HDH) for small-scale sustainable water and power production. Desalination 2016, 377, 163–171. [Google Scholar] [CrossRef]
  12. Faegh, M.; Behnam, P.; Shafii, M.B. A review on recent advances in humidification-dehumidification (HDH) desalination systems integrated with refrigeration, power and desalination technologies. Energy Convers. Manag. 2019, 196, 1002–1036. [Google Scholar] [CrossRef]
  13. Khodadadi, M.; Sheikholeslami, M. Review on poly-generation application of photovoltaic/thermal systems. Sustain. Energy Technol. Assess. 2022, 52, 102172. [Google Scholar] [CrossRef]
  14. Zubair, S.M.; Antar, M.A.; Elmutasim, S.M.; Lawal, D.U. Performance evaluation of humidification-dehumidification (HDH) desalination systems with and without heat recovery options: An experimental and theoretical investigation. Desalination 2018, 436, 161–175. [Google Scholar] [CrossRef]
  15. Sharqawy, M.H.; Antar, M.A.; Zubair, S.M.; Elbashir, A.M. Optimum thermal design of humidification dehumidification desalination systems. Desalination 2014, 349, 10–21. [Google Scholar] [CrossRef]
  16. Mahmoud, A.; Fath, H.; Ahmed, M. Enhancing the performance of a solar driven hybrid solar still/humidification-dehumidification desalination system integrated with solar concentrator and photovoltaic panels. Desalination 2018, 430, 165–179. [Google Scholar] [CrossRef]
  17. Pourafshar, S.T.; Jafarinaemi, K.; Mortezapour, H. Development of a photovoltaic-thermal solar humidifier for the humidification-dehumidification desalination system coupled with heat pump. Sol. Energy 2020, 205, 51–61. [Google Scholar] [CrossRef]
  18. Rafiei, A.; Alsagri, A.S.; Mahadzir, S.; Loni, R.; Najafi, G.; Kasaeian, A. Thermal analysis of a hybrid solar desalination system using various shapes of cavity receiver: Cubical, cylindrical, and hemispherical. Energy Convers. Manag. 2019, 198, 111861. [Google Scholar] [CrossRef]
  19. He, W.; Lu, Y.; An, H.; Zhou, X.; Su, P.; Han, D. Parametric analysis of humidification dehumidification desalination driven by photovoltaic/thermal (PV/T) system. Energy Convers. Manag. 2022, 259, 115520. [Google Scholar] [CrossRef]
  20. Elsafi, A.M. Integration of humidification-dehumidification desalination and concentrated photovoltaic-thermal collectors: Energy and exergy-costing analysis. Desalination 2017, 424, 17–26. [Google Scholar] [CrossRef]
  21. Anand, B.; Srinivas, T. Performance evaluation of photovoltaic/thermal–HDH desalination system. Appl. Sol. Energy 2017, 53, 243–249. [Google Scholar] [CrossRef]
  22. Ravajiri, E.S.; Hasanloo, M.; Jalali, A.; Houshfar, E. Techno-economic analysis and tri-objective optimization of a novel HDH desalination with PVT and vapor-compression chiller for sustainable water supply in remote areas. Sustain. Cities Soc. 2024, 101, 105211. [Google Scholar] [CrossRef]
  23. Gabrielli, P.; Gazzani, M.; Novati, N.; Sutter, L.; Simonetti, R.; Molinaroli, L.; Manzolini, G.; Mazzotti, M. Combined water desalination and electricity generation through a humidification-dehumidification process integrated with photovoltaic-thermal modules: Design, performance analysis and techno-economic assessment. Energy Convers. Manag. X 2019, 1, 100004. [Google Scholar] [CrossRef]
  24. Zhani, K.; Ben Bacha, H. Experimental investigation of a new solar desalination prototype using the humidification dehumidification principle. Renew. Energy 2010, 35, 2610–2617. [Google Scholar] [CrossRef]
  25. Nafey, A.; Fath, H.; El-Helaby, S.; Soliman, A. Solar desalination using humidification–dehumidification processes. Part II. An experimental investigation. Energy Convers. Manag. 2004, 45, 1263–1277. [Google Scholar] [CrossRef]
  26. Hermosillo, J.-J.; Arancibia-Bulnes, C.A.; Estrada, C.A. Water desalination by air humidification: Mathematical model and experimental study. Sol. Energy 2012, 86, 1070–1076. [Google Scholar] [CrossRef]
  27. Chang, Z.; Zheng, H.; Yang, Y.; Su, Y.; Duan, Z. Experimental investigation of a novel multi-effect solar desalination system based on humidification–dehumidification process. Renew. Energy 2014, 69, 253–259. [Google Scholar] [CrossRef]
  28. Ghazy, A. Experimental thermal and electrical performances of a PVT-air collector coupled to a humidification-dehumidification (HDH) cycle. Int. J. Renew. Energy Dev. 2023, 12, 520–527. [Google Scholar] [CrossRef]
  29. Taheri, S.; Faghih Khorasani, A.; Mozafari Shamsi, M. Evaluating the Performance of a Humidification-Dehumidification Desalination System Integrated with Photovoltaic-Thermal Collectors. J. Renew. Energy Environ. 2024, 11, 1–9. [Google Scholar] [CrossRef]
  30. Colombini, R.; Molinaroli, L.; Simonetti, R.; Colombo, L.P.M.; Manzolini, G. Numerical analysis of different designs of roll-bond absorber on PV/T module and performance assessment. Appl. Therm. Eng. 2021, 192, 116873. [Google Scholar] [CrossRef]
  31. Bombarda, P.; Di Marcoberardino, G.; Lucchini, A.; Leva, S.; Manzolini, G.; Molinaroli, L.; Pedranzini, F.; Simonetti, R. Thermal and electric performances of roll-bond flat plate applied to conventional PV modules for heat recovery. Appl. Therm. Eng. 2016, 105, 304–313. [Google Scholar] [CrossRef]
  32. Gatley, D.P. Understanding Psychrometrics, 3rd ed.; ASHRAE: Peachtree Corners, GA, USA, 2013. [Google Scholar]
  33. Kloppers, J.C. A Critical Evaluation and Refinement of the Performance Prediction of Wet-Cooling Towers. Ph.D. Thesis, University of Stellenbosch, Stellenbosch, South Africa, 2003. Available online: https://scholar.sun.ac.za/handle/10019.1/1476 (accessed on 10 July 2025).
  34. Bosnjakovic, F.; Knoche, K.F. Technische Thermodynamik Teil I; Springer: Berlin/Heidelberg, Germany, 2013. [Google Scholar]
  35. Joppolo, C.M.; Molinaroli, L.; Pasini, A. Numerical analysis of the influence of circuit arrangement on a fin-and-tube condenser performance. Case Stud. Therm. Eng. 2015, 6, 136–146. [Google Scholar] [CrossRef]
  36. Celen, A.; Dalkilic, A.S.; Wongwises, S. Experimental analysis of the single phase pressure drop characteristics of smooth and microfin tubes. Int. Commun. Heat Mass Transf. 2013, 46, 58–66. [Google Scholar] [CrossRef]
  37. Wang, C.-C.; Hsieh, Y.-C.; Lin, Y.-T. Performance of Plate Finned Tube Heat Exchangers Under Dehumidifying Conditions. 1997. Available online: http://asmedigitalcollection.asme.org/heattransfer/article-pdf/119/1/109/5507775/109_1.pdf?casa_token=VP8XVZLvIm0AAAAA:qs73IVOWvFRq__lkv31AAv6yU29ttmCCbE6ppY5OC1LBVVZv6K02AU_hdI-a7m_eODrYTWVlVzA (accessed on 10 July 2025).
  38. ESDU 98005; Design and Performance Evaluation of Heat Exchangers: The Effectiveness-NTU Method. (Part 3: Graphical and Analytical Data); Accuris: Englewood, CO, USA, 2014.
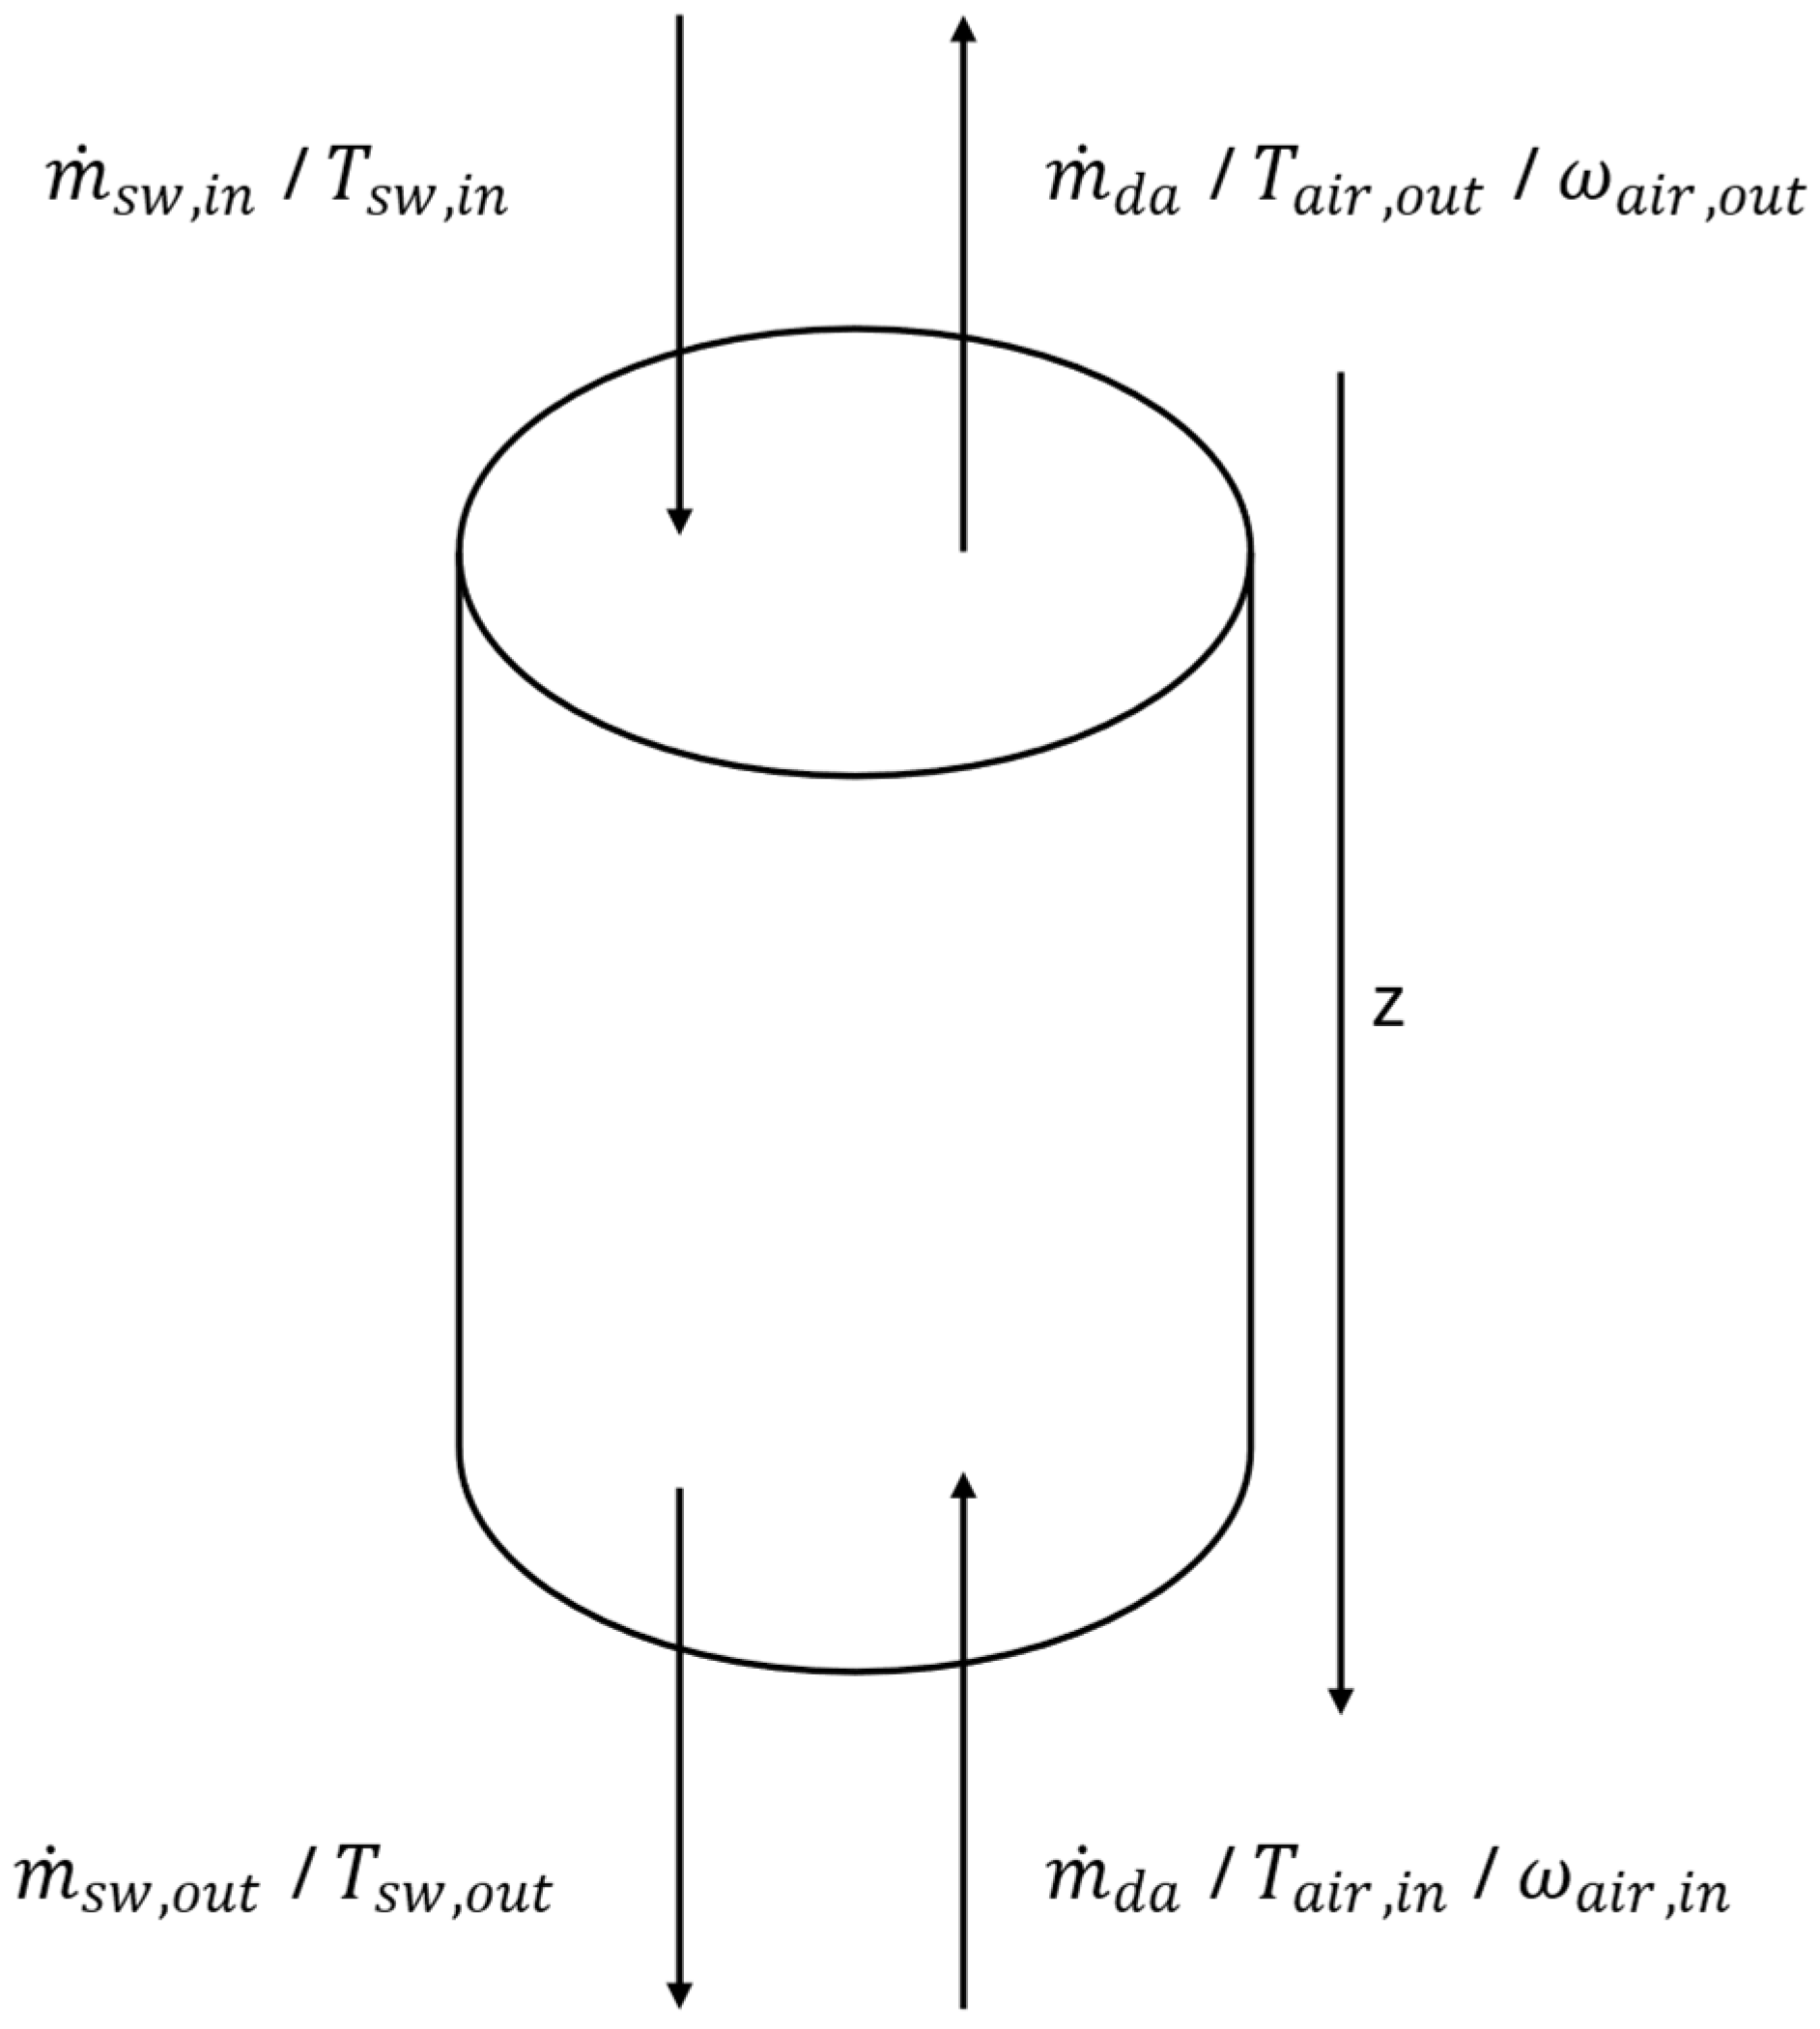
Figure 1. Schematic of the humidifier.
Energies 18 05586 g001
Figure 2. Fin-and-tube condenser [35].
Energies 18 05586 g002
Figure 3. Finite volume discretization for the dehumidifier [35].
Energies 18 05586 g003
Figure 4. HDH system scheme.
Energies 18 05586 g004
Figure 5. Main system components: (a) Humidifier; (b) Dehumidifier; (c) Pump; (d) Fan; (e) Dry cooler.
Energies 18 05586 g005
Figure 6. SolarTech Lab PVT modules at Politecnico di Milano, Milan, Italy.
Energies 18 05586 g006
Figure 7. Experimental Setup: (a) Humidifier; (b) Humidifier packing material.
Energies 18 05586 g007
Figure 8. Experimental Setup: (a) Dehumidifier, (b) Copper finned tube dehumidifier structure.
Energies 18 05586 g008
Figure 9. Experimental Setup: (a) Pump; (b) Fan.
Energies 18 05586 g009
Figure 10. Experimental Setup: (a) Dry cooler; (b) Water circuit within the air cooler.
Energies 18 05586 g010
Figure 11. LABVIEW® interface.
Energies 18 05586 g011
Figure 12. Solar irradiance at the SolarTech Lab of Politecnico di Milano.
Energies 18 05586 g012
Figure 13. Experimental values of mass flow rate ratio (MR) in 2023 and 2024 at SolarTech Lab.
Energies 18 05586 g013
Figure 14. TEC vs. MR.
Energies 18 05586 g014
Figure 15. Water production m ˙ p w vs. MR.
Energies 18 05586 g015
Figure 16. GOR vs. MR.
Energies 18 05586 g016
Figure 17. STC vs. MR.
Energies 18 05586 g017
Figure 18. SEC vs. MR.
Energies 18 05586 g018
Figure 19. Dehumidifier parity plot: (a) saline water; (b) air.
Energies 18 05586 g019
Figure 20. Humidifier parity plot: (a) saline water; (b) air.
Energies 18 05586 g020
Figure 21. Daily water production parity plot.
Energies 18 05586 g021
Table 1. Experimental instrumentation at SolarTech Lab.
InstrumentManufacturer and ModelRangeAccuracy
Water FlowmeterEndress + Hauser
Proline Promag P300,
Reinach, Switzerland
0–6 m3/h±0.5% R.V.
Air FlowmeterEndress + Hauser
Proline Prowirl R200,
Reinach, Switzerland
0–821 m3/h±1.0% R.V.
ScaleKern 572-55,
Balingen-Frommern, Germany
0–20 kg±0.25 g
ThermometerTersid PT100,
Sesto San Giovanni (MI), Italy
0–90 °CClass A
Pressure GaugeHuba Control 528,
Würenlos, Switzerland
0–4 bar±0.3% F.S.
WattmeterCewe Instrument
DPT221-441,
Segrate (MI), Italy
0–1100 W±0.5% F.S.
Table 2. Main components of experimental setup at SolarTech Lab.
ComponentManufacturer and ModelMain Characteristics
PumpWilo MHI 202-1,
Dortmund, Germany
Rated flow rate: 6 m3/h
Rated head: 23.5 m
Rated power: 0.55 kW
FanFläkt W20-160-2-1,
Herne, Germany
Rated flow rate: 2000 m3/h
Rated pressure: 1000 Pa
Rated power: 1.1 kW
PVTEclipse ECL250P,
Nozza di Vestone (BS), Italy
Electrical peak power: 250 W
InverterSolarEdge SE3500,
Munich, Germany
Rated output power: 3.5 kW
Table 3. Characteristics of humidifier and dehumidifiers columns.
HumidifierDehumidifier
Column height2.8 mFrontal tube length0.25 m
Column width0.2 mInner tubes diameter0.0085 m
Surface area to volume ratio300 m2/m3Tube transversal
distance
0.025 m
Tube longitudinal
distance
0.025 m
Fin distance0.0032 m
Fin thickness0.0005 m
Fin TypeCorrugated
Rows tubes number16
Frontal tubes
number
6
Table 4. Experimental data.
D a y Duration V ˙ s w V ˙ d a m ˙ s w m ˙ d a M R E s u n E t h E a u x m p w S T C S E C R R G O R
h:mm:ss d m 3 h m 3 h k g s k g s [ ] k W h m 2 [ k W h ] [ k W h ] [ k g ] k W h m 3 k W h m 3 [ % ] [ ]
11/09/20234:01:33171.03102.720.04750.03501.3593.3175.1591.1853.7371380.7317.10.5430.455
14/09/20234:34:14157.16110.880.04370.03771.1572.6444.6061.4283.0821494.8463.40.4290.420
25/09/20234:46:40164.59111.320.04570.03791.2074.2666.9721.4873.8791797.3383.40.4930.349
28/09/20235:12:51193.2094.170.05370.03201.6753.9477.8581.7053.8882021.4438.50.3860.311
02/10/20235:09:35166.3478.040.04620.02661.7403.8766.8361.2863.8151792.1337.20.4440.350
03/10/20236:04:14193.1377.590.05360.02642.0323.7737.1191.8243.4312075.0531.60.2930.303
09/10/20235:06:13167.8794.130.04660.03201.4563.9345.6891.3953.1401811.5444.20.3670.347
10/10/20233:48:17183.20131.750.05090.04481.1353.0915.4971.5373.3961618.7452.50.4870.388
18/06/20246:00:0097.4169.920.02710.02381.1373.8654.5321.6743.6011258.7464.90.6160.499
19/06/20246:00:0098.4495.830.02730.03260.8394.1644.9511.9293.4511435.0559.00.5840.437
27/06/20247:00:0076.7570.280.02130.02390.8924.9674.3461.7633.4261268.3514.70.6380.495
28/06/20248:00:0077.5460.980.02150.02081.0386.4445.5162.1704.4721233.5485.20.7210.509
05/07/20245:00:0081.3678.220.02260.02660.8493.7353.5351.4612.2971539.4636.00.5650.408
09/07/20248:00:0057.2277.820.01590.02650.6005.2734.1672.3091.9692116.41172.60.4300.297
10/07/20246:00:0056.71119.990.01580.04080.3865.0664.0372.2010.8484758.42594.70.2490.132
11/07/20244:00:0050.81119.930.01410.04080.3463.5972.5621.4210.3357644.54240.80.1650.082
18/07/20246:00:0038.8477.560.01080.02640.4093.5931.9751.0890.10818,359.110,122.90.0460.034
22/07/20247:05:0075.0970.070.02090.02380.8755.5664.6701.9233.5111329.9547.70.6600.472
23/07/20247:00:0074.5970.030.02070.02380.8694.8074.0451.9143.0321334.0631.20.5810.471
Table 5. KPIs uncertainty summary.
KPIInstantaneous, %Daily, %
MR1.120.0067
RR0.680.0041
Eth4.820.0266
GOR4.840.0389
SEC0.780.0047
STC4.840.0268
Disclaimer/Publisher’s Note: The statements, opinions and data contained in all publications are solely those of the individual author(s) and contributor(s) and not of MDPI and/or the editor(s). MDPI and/or the editor(s) disclaim responsibility for any injury to people or property resulting from any ideas, methods, instructions or products referred to in the content.