Article

Analyzing the Influence of Load Current on the Thermal RC Network Response of Melting-Type Fuses Used in Battery Electric Vehicles

1
Daimler Truck AG, Mercedesstraße 120, 70372 Stuttgart, Germany
2
Electrical Energy Storage Systems, Institute for Photovoltaics, University of Stuttgart, Pfaffenwaldring 47, 70569 Stuttgart, Germany
*
Author to whom correspondence should be addressed.
Energies 2025, 18(21), 5583; https://doi.org/10.3390/en18215583
Submission received: 15 September 2025 / Revised: 6 October 2025 / Accepted: 15 October 2025 / Published: 23 October 2025
(This article belongs to the Collection "Electric Vehicles" Section: Review Papers)

Abstract

High-voltage fuses are critical safety components in electric vehicle (EV) battery systems, yet their thermal behavior under charging currents remains insufficiently characterized. This study develops and validates a physics-based thermal resistor-capacitor (RC) network model of a high-voltage melting fuse, accounting for copper elements, quartz sand filling, and polyester casing. Experimental accelerated life tests and current step load profiles were performed in a climate chamber at 70 °C, with temperature measurements at the fuse terminals. The RC model was constructed using material properties and geometry-derived parameters, including three copper element sections, one quartz sand node, and one case node. A discretized state–space formulation was implemented to simulate the transient thermal behavior. The results reveal distinct dynamic and stationary characteristics, with thermal time constants varying strongly between fuse sections. Comparisons with experimental data demonstrate that the proposed model captures both rise time and steady-state behavior, with deviations attributable to contact resistances and parasitic effects. The findings highlight that charging currents in practical profiles typically remain below 50% of fuse current ratings, leaving optimization potential for higher permissible currents, faster charging, and reduced downtime while maintaining safety. The outcome of this model is highly relevant for lifetime prediction models.

1. Introduction

Since its invention in 1774, the fuse has evolved continuously, finding applications in countless modern electrical systems [1]. Nowadays, fuses are an important part of the rapidly growing battery electric vehicle (BEV) sector, protecting from electrical faults, ensuring safety, reliability, and performance as a part of the safety architecture of the system. In such applications, fuses are often combined with contactors to form part of the main protection path for the high-voltage (HV) battery. As battery electric vehicles continue to evolve, the demands on fuse behavior increase significantly—particularly due to high-power charging and varying load currents [2].
However, the thermal behavior of these fuses under such dynamic load conditions is a key aspect of understanding and predicting fuse behavior and accurately modeling the thermal dynamics leading up to the melting of the fuse element. In particular, the internal temperature rise caused by Joule heating under repeated cycling is a key aging factor, yet it cannot be directly measured during operation. Here, given the system requirements regarding current-limiting characteristics, especially during short circuit operation, the design of the fuse shows restriction areas as breaking points, resulting in unequal spatial temperature gradients that develop internally [3,4]. A precise and reliable thermal modeling is essential to ensure plausible simulation results. The thermal equivalent circuit (TEC) approach offers a simplified yet powerful simulation approach of these thermal processes to illustrate dynamic thermal effects in real-time applications [5,6,7,8]. Divided into the use of the Foster-type and Cauer-type models, the fundamental idea of this simulation approach lies in the analogy between thermal and electrical systems.
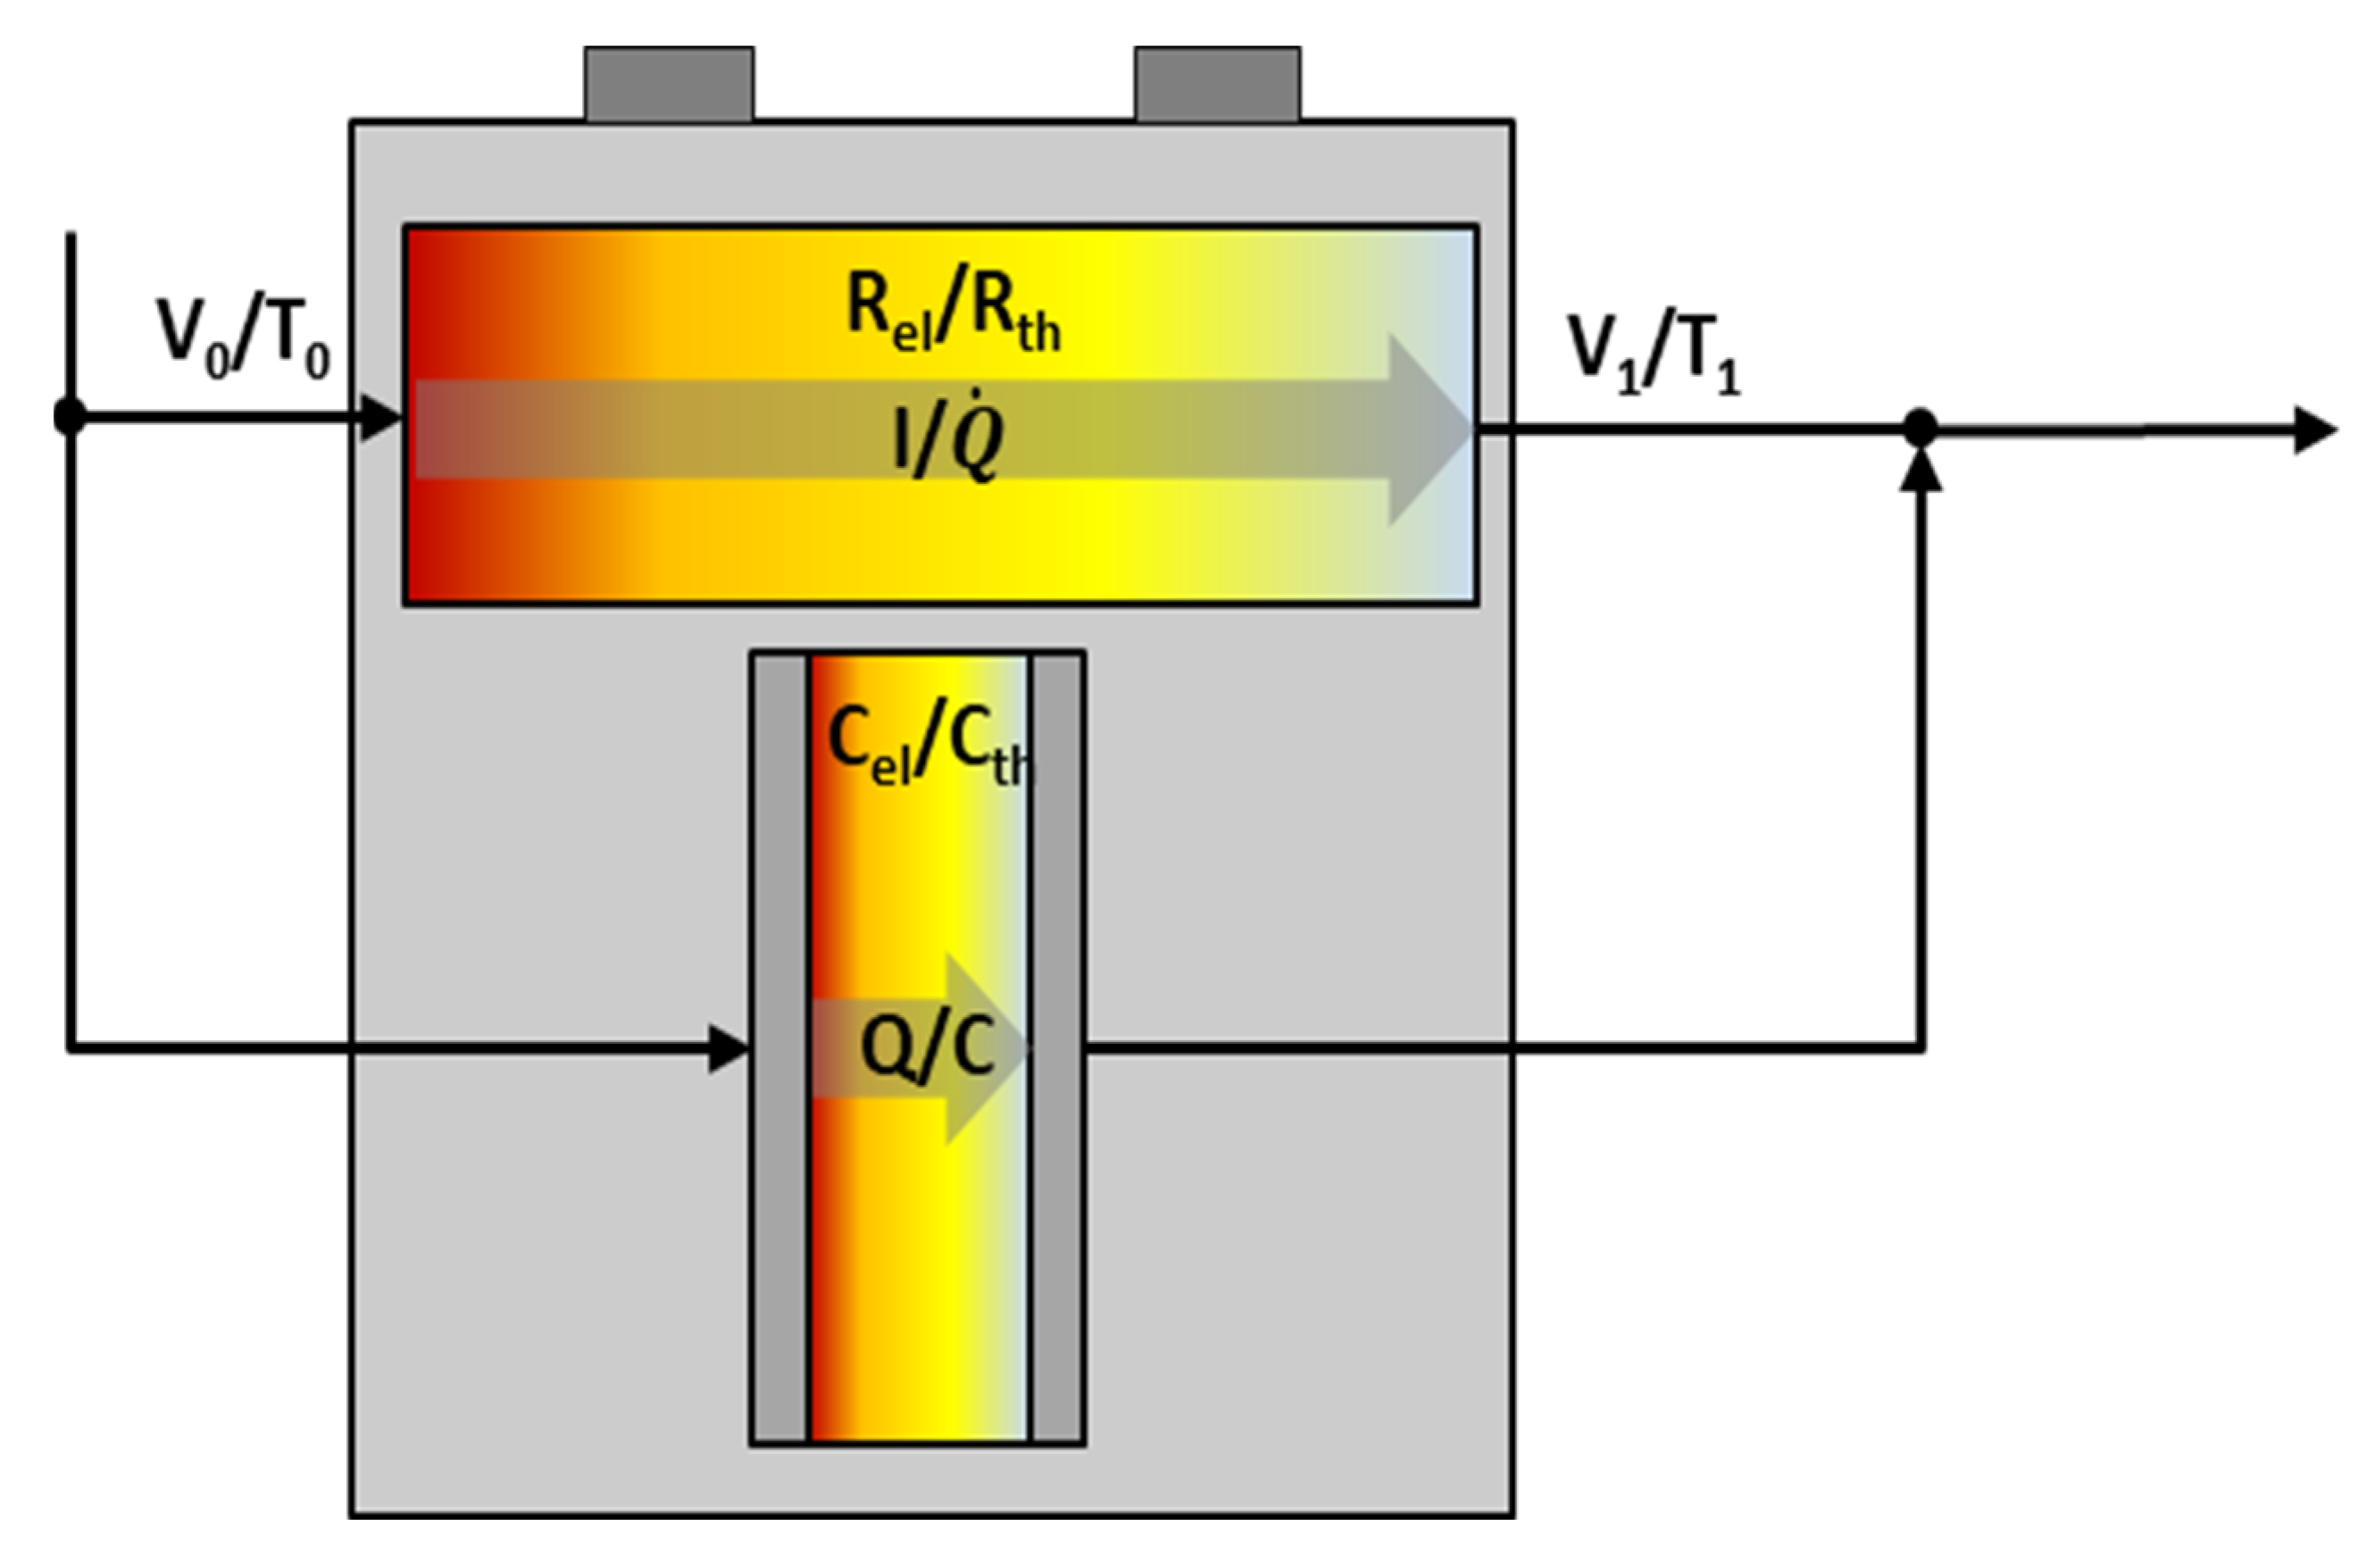
To better understand the internal thermal behavior of the fuse under operational stress, it is useful to first consider the basic physical principles governing heat flow in such a component. As illustrated in Figure 1, the thermal behavior of a fuse can be analogized using an equivalent circuit, where current-induced Joule heating is modeled as a localized heat source within a conductive path. Thermal resistance represents the conduction of heat through surrounding materials, while thermal capacitance reflects the ability of the fuse body to store heat. This abstraction provides a conceptual basis for developing lumped-element models that simulate transient temperature behavior within the device. While prior research on fuse modeling has predominantly relied on static or empirically fitted models to characterize thermal behavior under limited operating conditions, these approaches often neglect the internal thermal structure and do not account for varying current profiles. Furthermore, many of these models assume linear thermal properties—i.e., constant thermal resistance and capacitance—despite the fact that real fuses exhibit strongly nonlinear behavior, particularly near the melting point. This nonlinearity arises from temperature-dependent material properties such as thermal conductivity and electrical resistivity, as well as from phase-change effects and localized thermal gradients.
In contrast, this study proposes a physically motivated Cauer-type thermal equivalent circuit model in which the thermal elements correspond directly to structural and material regions of the fuse. By applying functional tests and the exact geometrical attributes, the model enables more accurate prediction of the thermal response across a wide range of current levels and operating conditions, especially in BEV applications. Here, Section 2 provides an overview of the fuse structure and the thermal modeling methodology. Section 3 shows the experimental setup used for temperature measurements under current pulses, as well as thermal imaging for model validation. Finally, the precision of results for the model is verified and discussed comparatively with the actual data.

2. Methodology

Electro-thermal modeling leverages Kirchhoff’s analogy between heat flow and electrical circuits, mapping thermal conduction to resistance and heat storage to capacitance, based on the principle that “two different forms of energy behave in an analogous manner when the fundamental differential equations that describe them have the same form and share common boundary and initial conditions” [9]. This principle forms the basis of the electro-thermal analogy, in which thermal conduction and heat storage are modeled analogously to electrical resistance and capacitance, respectively.
As shown in Table 1, heat flow within a component such as a fuse can be represented using an equivalent thermal circuit. Here, the thermal parameter is equivalent to its electrical parameter. This abstraction allows the transient temperature behavior of the system to be described using a lumped-parameter RC network. The analogy is also mathematically described using the transmission line equation compared to the one-dimensional heat transfer equation, where the main heat transfer mode in electronic components is defined by conduction, making Kirchhoff’s classical observation more obvious [10,11]:
2 T x 2 = c · ρ λ t h · T t
2 U x 2 = R C · U t
Out of this relationship, a thermal equivalent circuit can be constructed using RC elements to represent the transient thermal behavior of a physical system. In such networks, resistors model the resistance to heat flow (thermal resistance as Rth), while capacitors represent the ability of a body to store thermal energy (thermal capacitance as Cth). This allows temperature distributions and time-dependent thermal responses to be analyzed using techniques familiar from electrical circuit theory.
Two standard approaches for constructing these networks are the Foster model and the Cauer model as illustrated in Figure 2. The Foster model represents the system’s thermal response as a series of parallel RC branches and is typically derived through curve-fitting or system identification methods. It provides an accurate mathematical description of the observed thermal impedance but lacks a direct physical mapping to the structure of the component [13,14]. In contrast, the Cauer model uses a ladder-type structure in which each RC pair corresponds to a specific material layer or thermal path within the component. This makes it more suitable for modeling heat propagation through physical structures, as it allows spatial temperature gradients and layer-specific properties to be represented [15]. In this work, a Cauer model is constructed based on the geometry and material properties of the fuse, enabling a physically interpretable and nonlinear thermal model that captures internal heating effects under varying electrical loads. Derived from the Fourier equation,
Q ˙ = k · A · d T d x
the geometrical specifications play an essential role in the build-up of a plausible thermal model. Here, the rate of heat conduction depends on the thickness, the material of the medium, the geometry of the medium, and the temperature difference, deriving the equation of the thermal resistance and the thermal capacitance for heat transfer through a planar wall with [16]:
R t h = d λ t h · A
C t h = c · ρ · d · A
These equations form the basic structure of the lumped thermal elements in the equivalent circuit model, particularly suitable for layered materials like ceramic walls or metal strips.
For fuse geometries involving cylindrical or tubular elements, such as wire-shaped fuse links or enclosed fuse housings, a different approach is needed. According to [17], the radial thermal resistance of a cylindrical structure is:
R t h , c y l = l n ( r 2 r 1 ) 2 π · λ t h · l
C t h , c y l = c · ρ · V = c · ρ · 2 π · l · ( r 2 2 r 1 2 )
Additionally, with the premises that radiation is negligible and steady-state conditions are reached, heat transfer at the fuse terminals is mainly caused through convection. Expressed by Newton’s law of cooling:
Q ˙ c o n v = h · A · ( T F T A )
For steady state operation with the calculated shunt voltage U over the fuse, the thermal resistance Rconv for the convective heat loss Q ˙ c o n v is:
Q ˙ c o n v = Q ˙ e l = U · I
h = Q ˙ c o n v A · ( T F T A )
R t h = 1 h · A
These analytical expressions enable the parameterization of thermal resistance and capacitance for different fuse sections, whether planar (e.g., ceramic housing) or cylindrical (e.g., fuse element or terminals). By using this geometry-aware method, the thermal RC model accurately reflects heat conduction paths and thermal masses within the fuse structure.

3. Experimental Setup and Simulation Model

3.1. Experimental Test Setup

The purpose of the experimental setup was to characterize the thermal response of a high-voltage fuse under defined electrical loading conditions and to extract thermal impedance profiles out of it. Several current step cycles were applied, beginning at 150 A and a 100% current rating of the fuse, with an incremental increase of 20 A per cycle reaching the failure event and the melting of the fuse. The pulse duration was set to 30 min to reach thermal equilibrium. For each step, the system’s temperature evolution and shunt voltage were recorded. These data enabled the calculation of the dissipated power and corresponding temperature rise across the fuse body. The aim of the test procedure was to capture the thermal dynamics of the system in response to abrupt power changes, effectively representing a thermal step response as defined in [18] and analyzing the influence of load profile cycling on the thermal behavior of a fuse used in an HV battery.
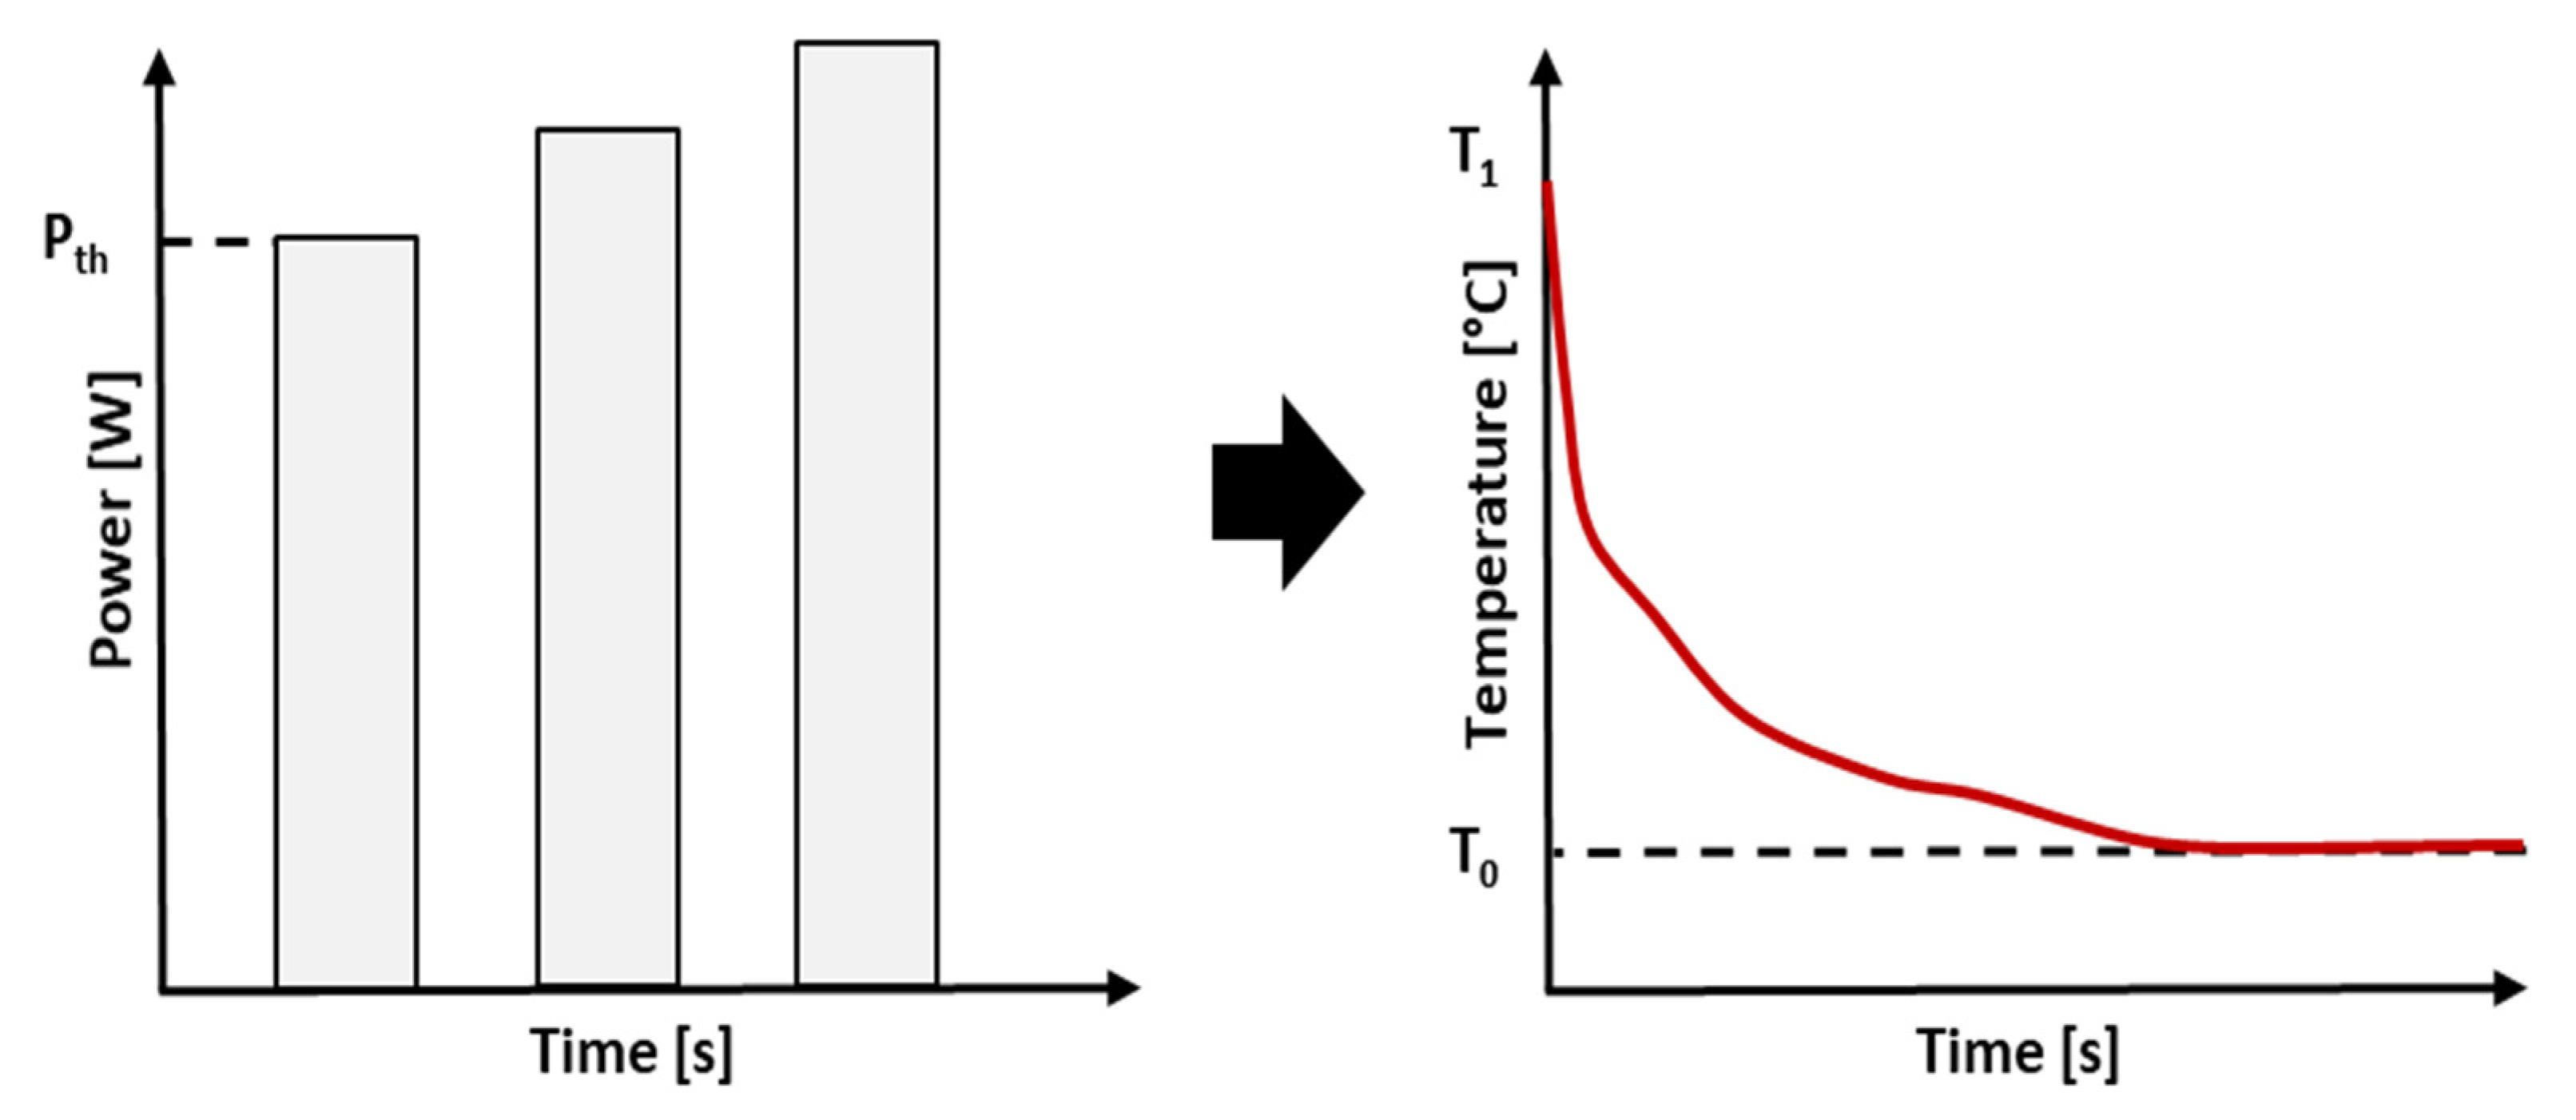
Figure 3 illustrates the structure of the test cycles. The left graph shows a sequence of discrete power inputs representing stepped current cyclization, while the right graph displays the typical thermal relaxation behavior of the system, characterized by Newton’s law of cooling. Several temperature sensors were implemented into the fuse to track the temperature behavior of certain areas.
For each current step, the thermal impedance Zth was calculated using:
Z t h ( t ) = T 0 T ( t ) P t h
The resulting thermal impedance curves served as the basis for extracting time constants and calibrating the RC network model described in Section 4. The influence of increasing current on the dynamic thermal behavior was explicitly considered in the parameterization of Rth and Cth. Additionally, certain boundary conditions, derived from specific function tests, are applied for model build-up.
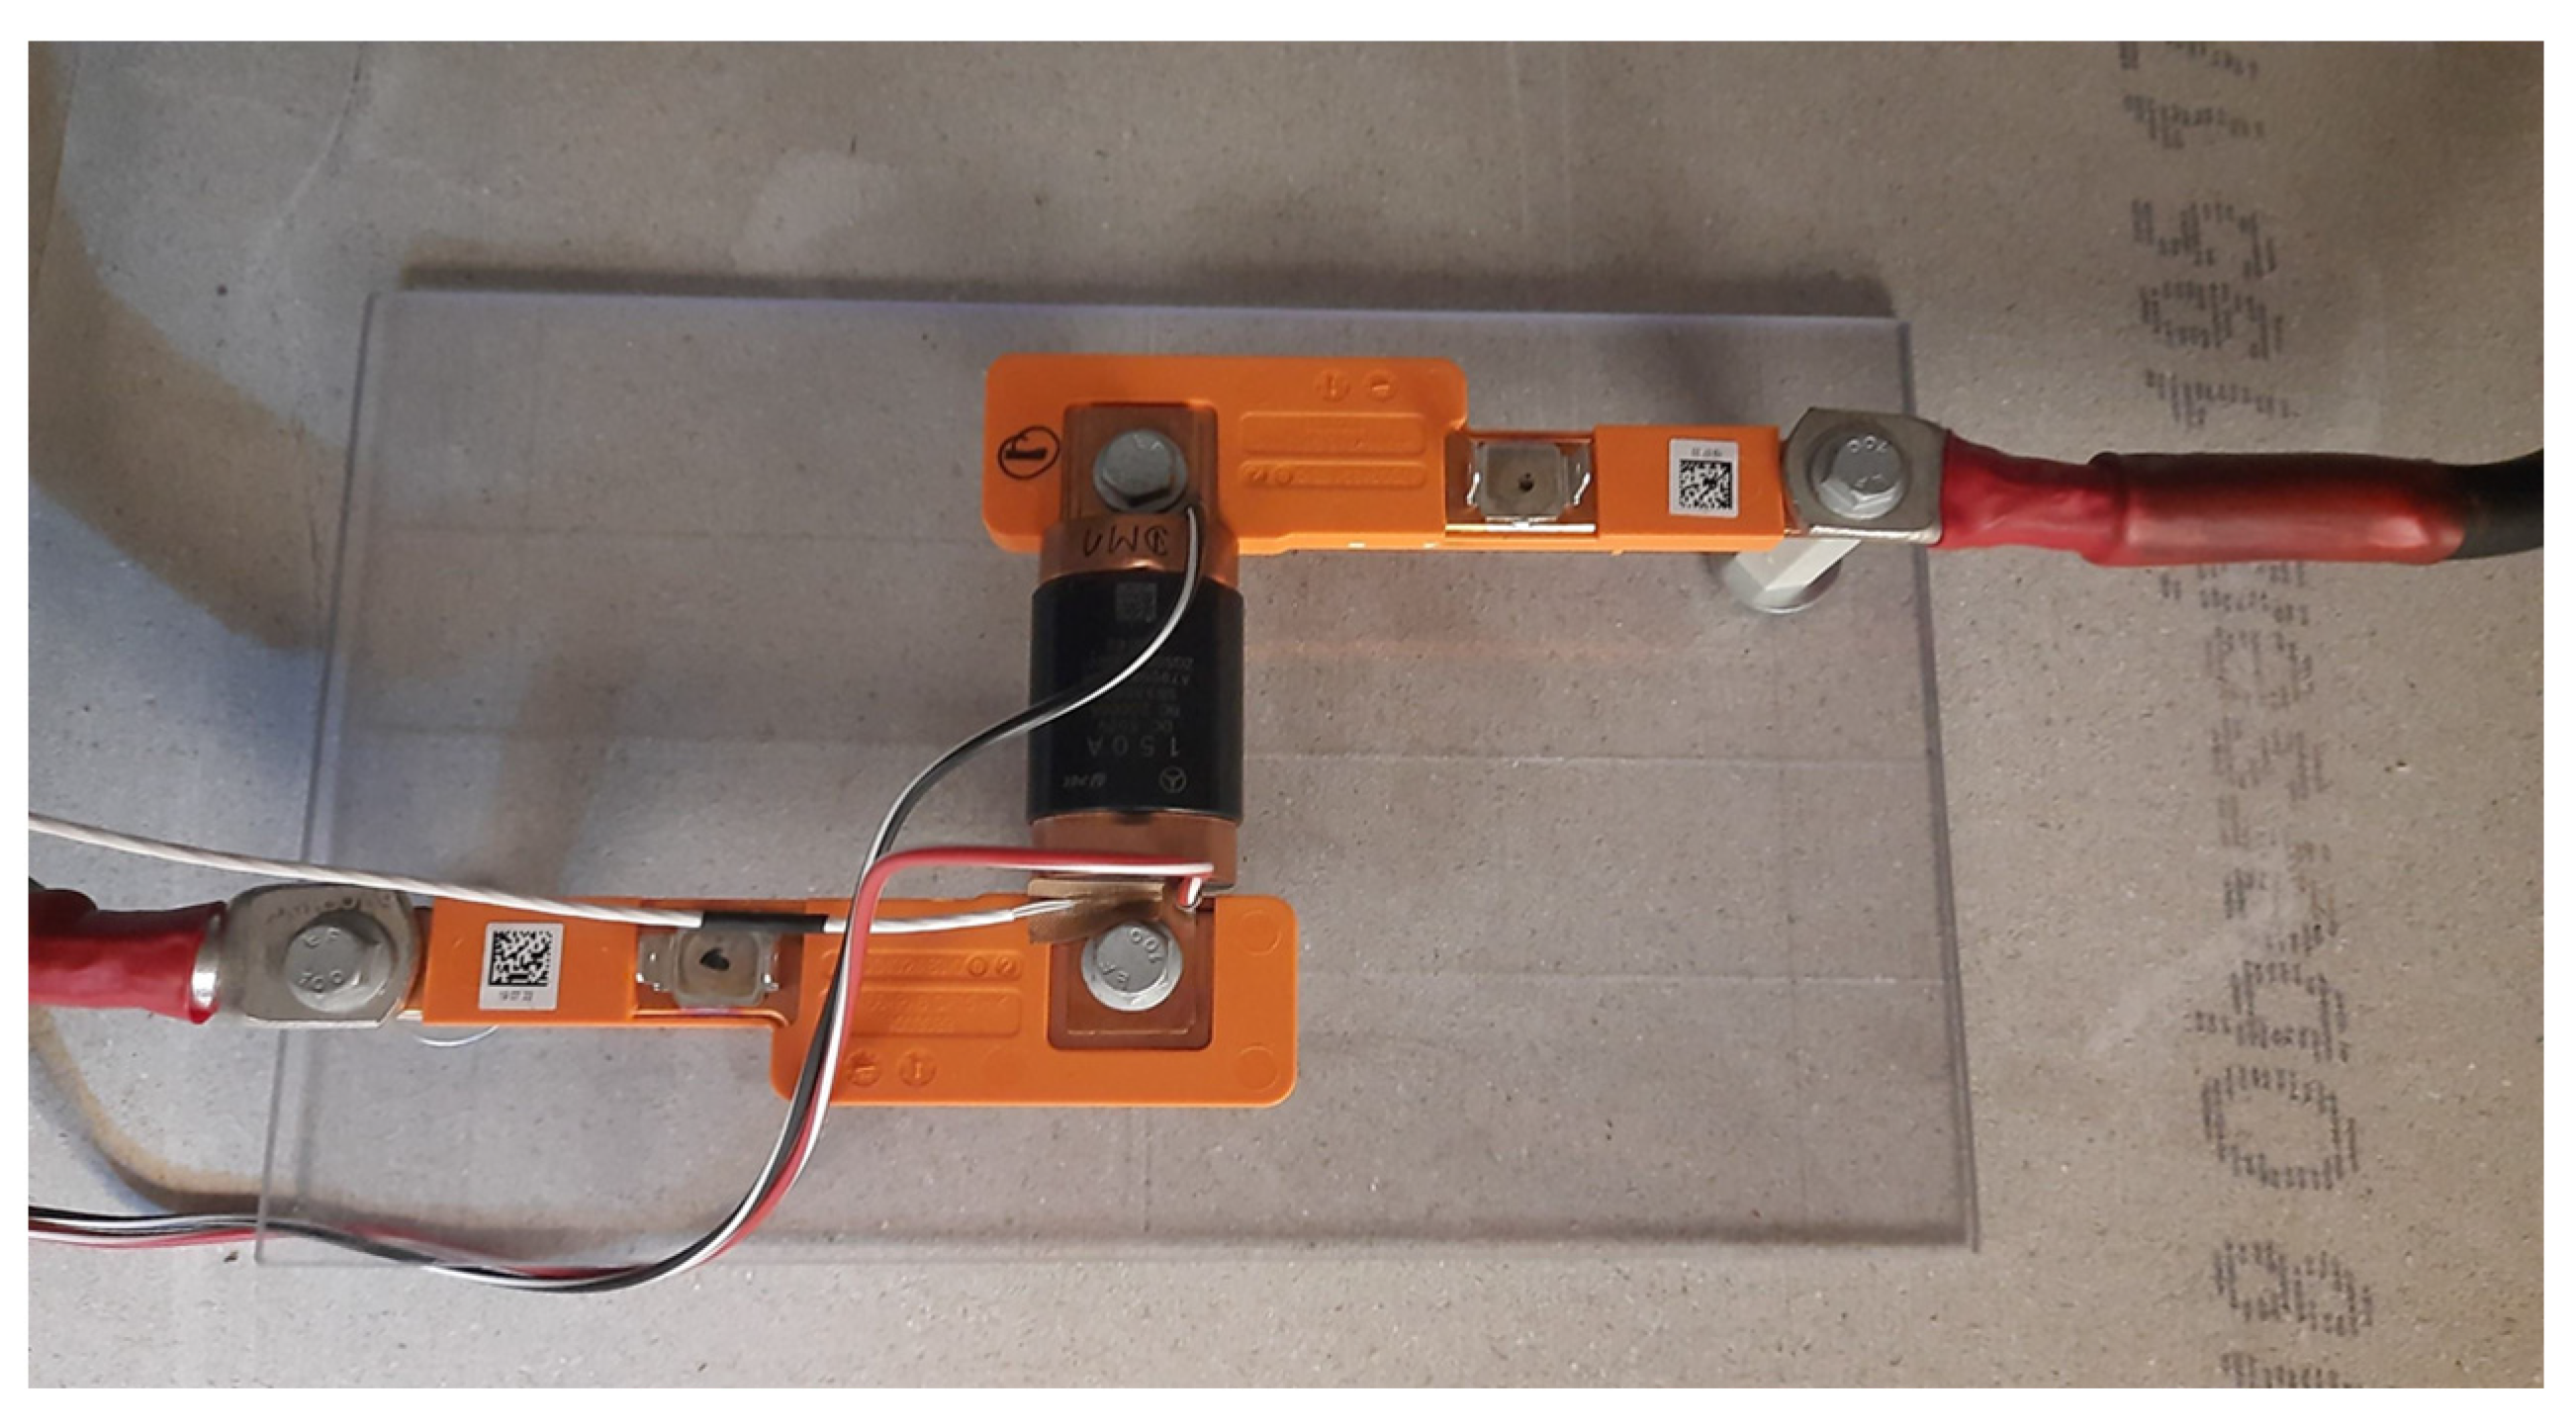
The outtakes from the thermal imaging and measurement test directly influence the topology and parameterization of the thermal RC network shown in Figure 4 and Figure 5. For real-life application behavior, the fuse was mounted on busbars, which are also in use for this specific component. Here, the fixation plays an essential role for the thermal model by representing a second thermal path with high thermal capacitance and a non-negligible thermal resistance representing the fixation area and conduction through the busbars.
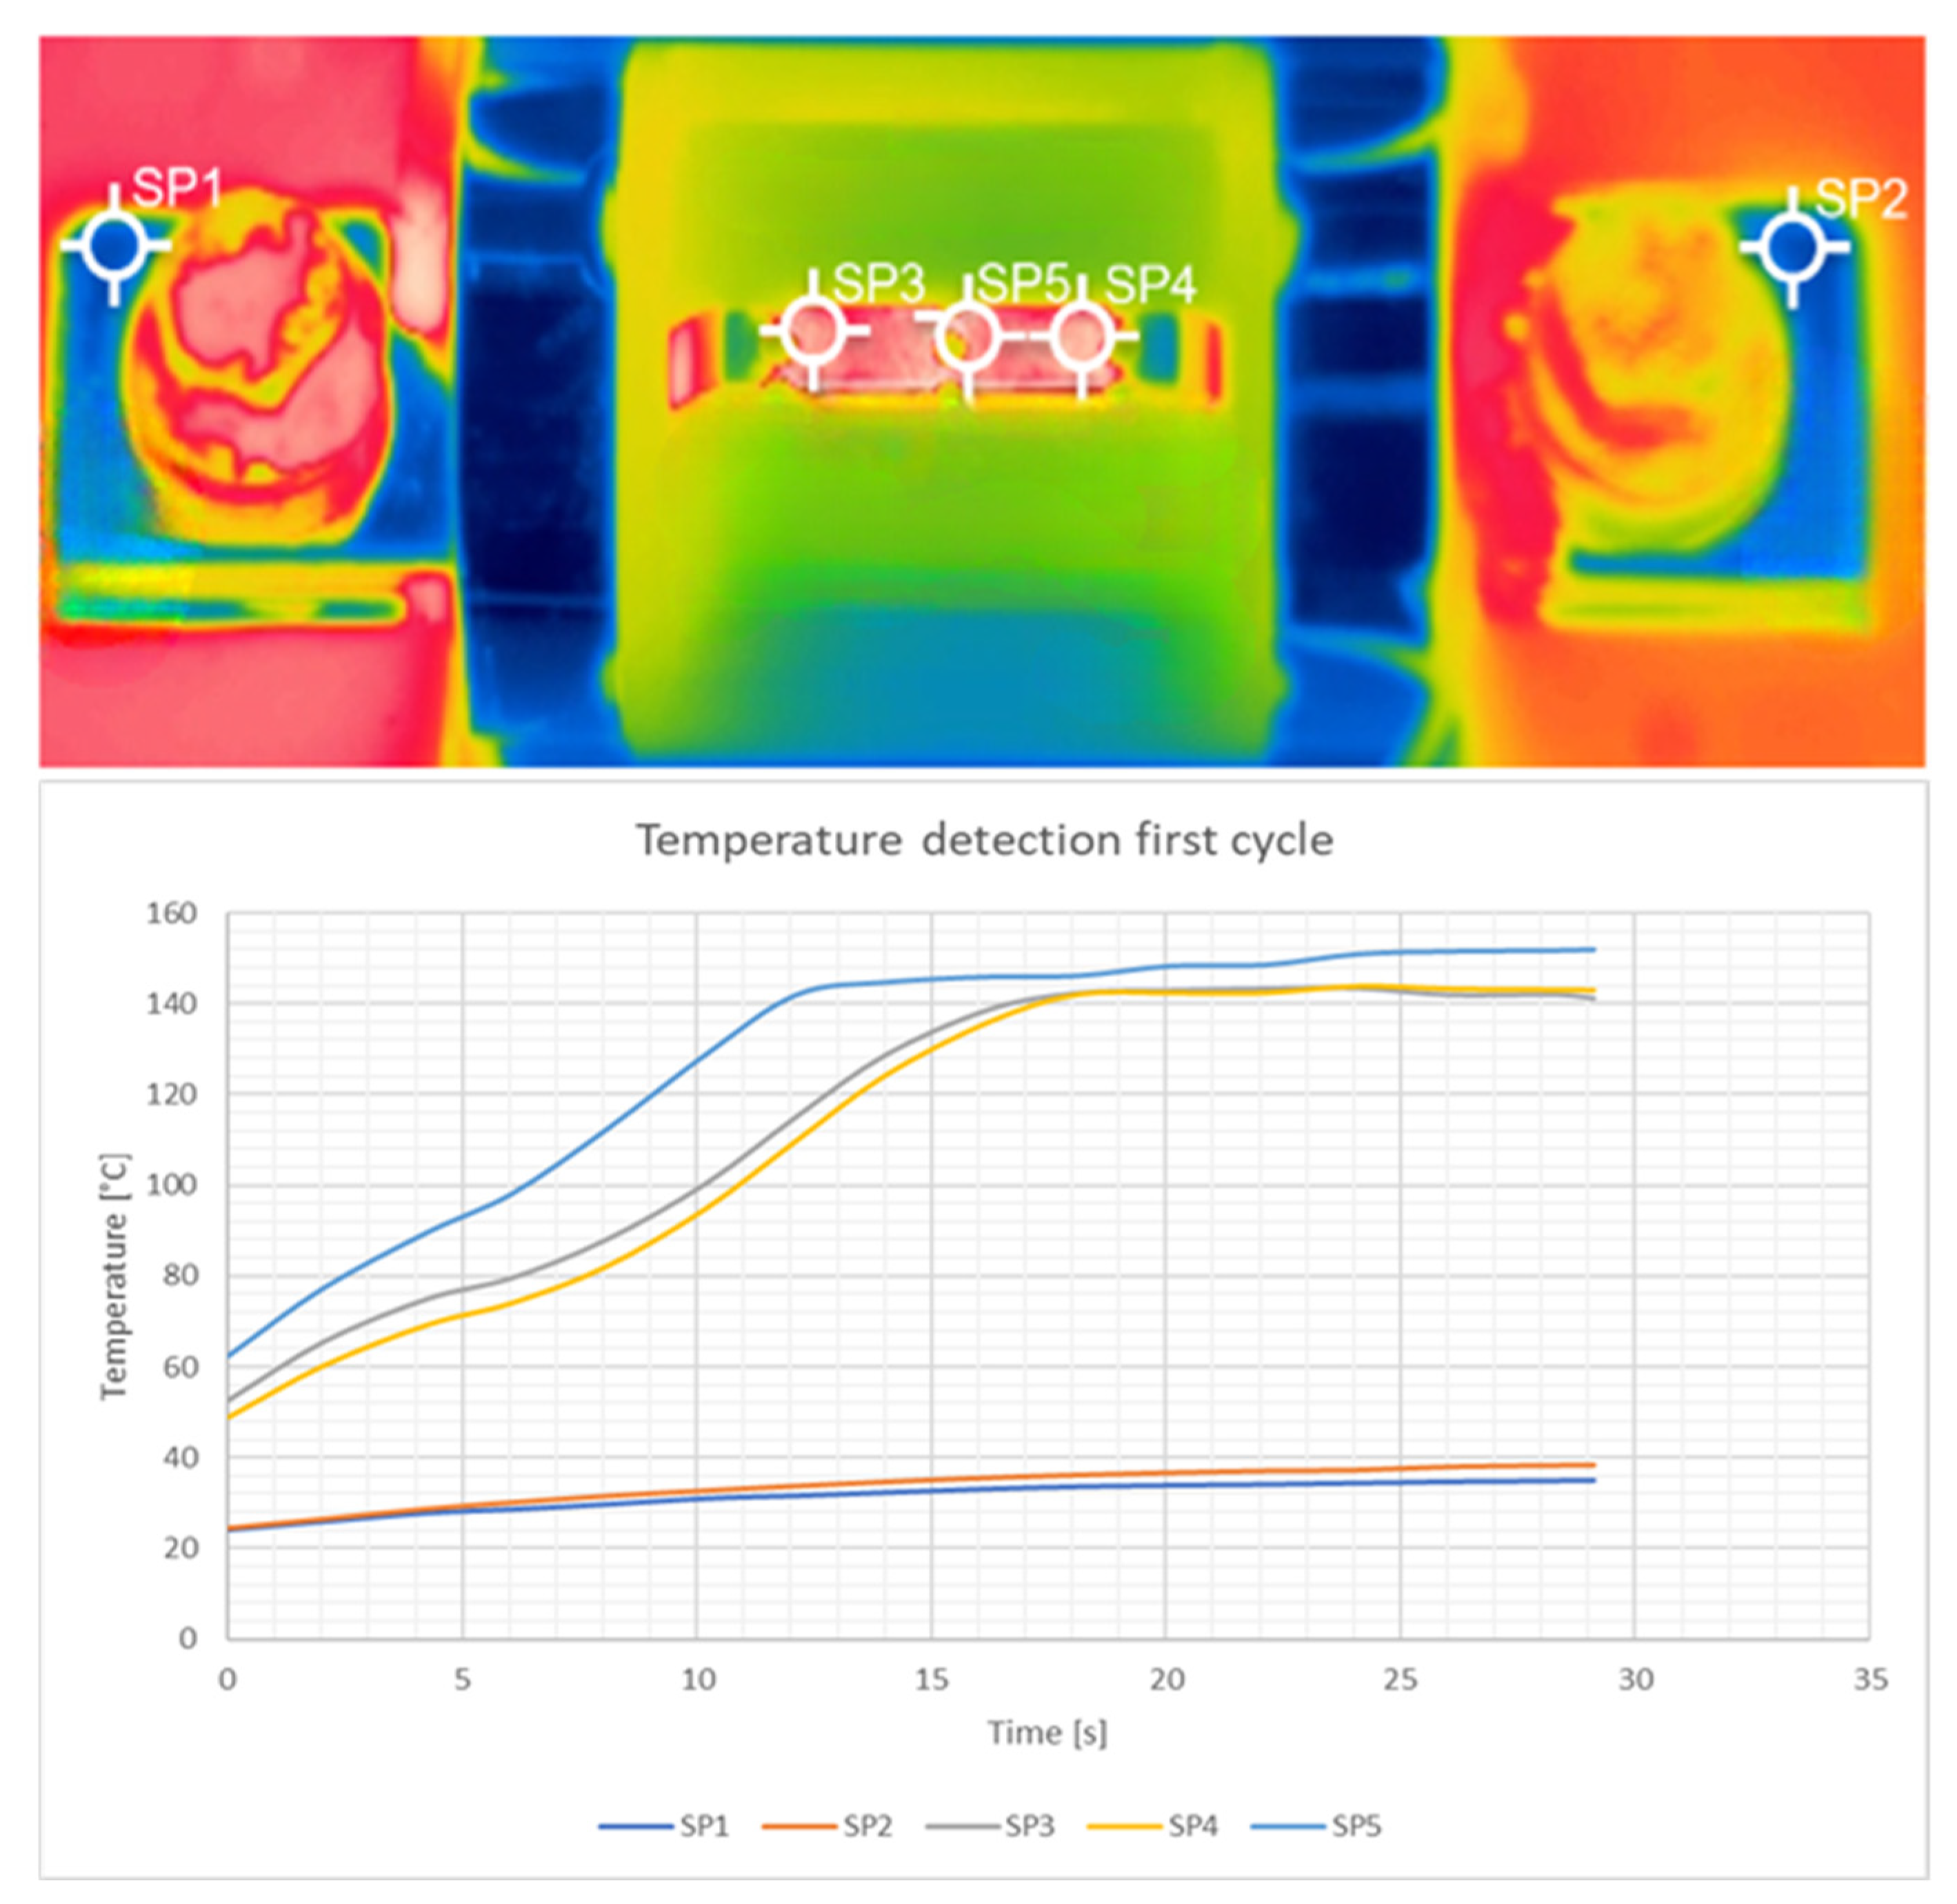
The infrared tests show a negligible temperature difference between measurement points SP3 and SP4, as well as between SP1 and SP2, indicating symmetrical thermal behavior on either side of the fuse’s central region. Therefore, only one thermal node is required to represent each side, while the center region is modeled as a distinct thermal section due to its significantly higher temperature and steeper gradient.
Additionally, Accelerated Lifetime Testing (ALT) reveals that the fuse element within the housing develops spatially inhomogeneous temperature distributions, particularly in regions of geometric restriction. While a uniform wire tends to melt in the middle due to end-cap heat sinking, practical fuse elements are not uniform. As shown in the literature and manufacturer design guides, constrictions are intentionally introduced near the ends of the element and in the middle, so that melting and breaking occur at these engineered weak points [19]. Among these, the central restriction zone exhibits the highest thermal stress and axial pressure during operation and therefore behaves as the component’s weak spot, as illustrated in Figure 6, resulting in the melting of the fuse element in the majority of the testing results. The test was also conducted to investigate the design border out of the range of the specification border to quantize the maximum load current carrying capability of the fuse. This behavior is driven by localized Joule heating, which induces thermal expansion and results in axial deformation, which is referred to as thermal buckling. The combination of uneven heating and constrained geometry leads to significant mechanical stress concentrations, which are critical to understanding fuse aging and triggering behavior under cyclic electrical loading.
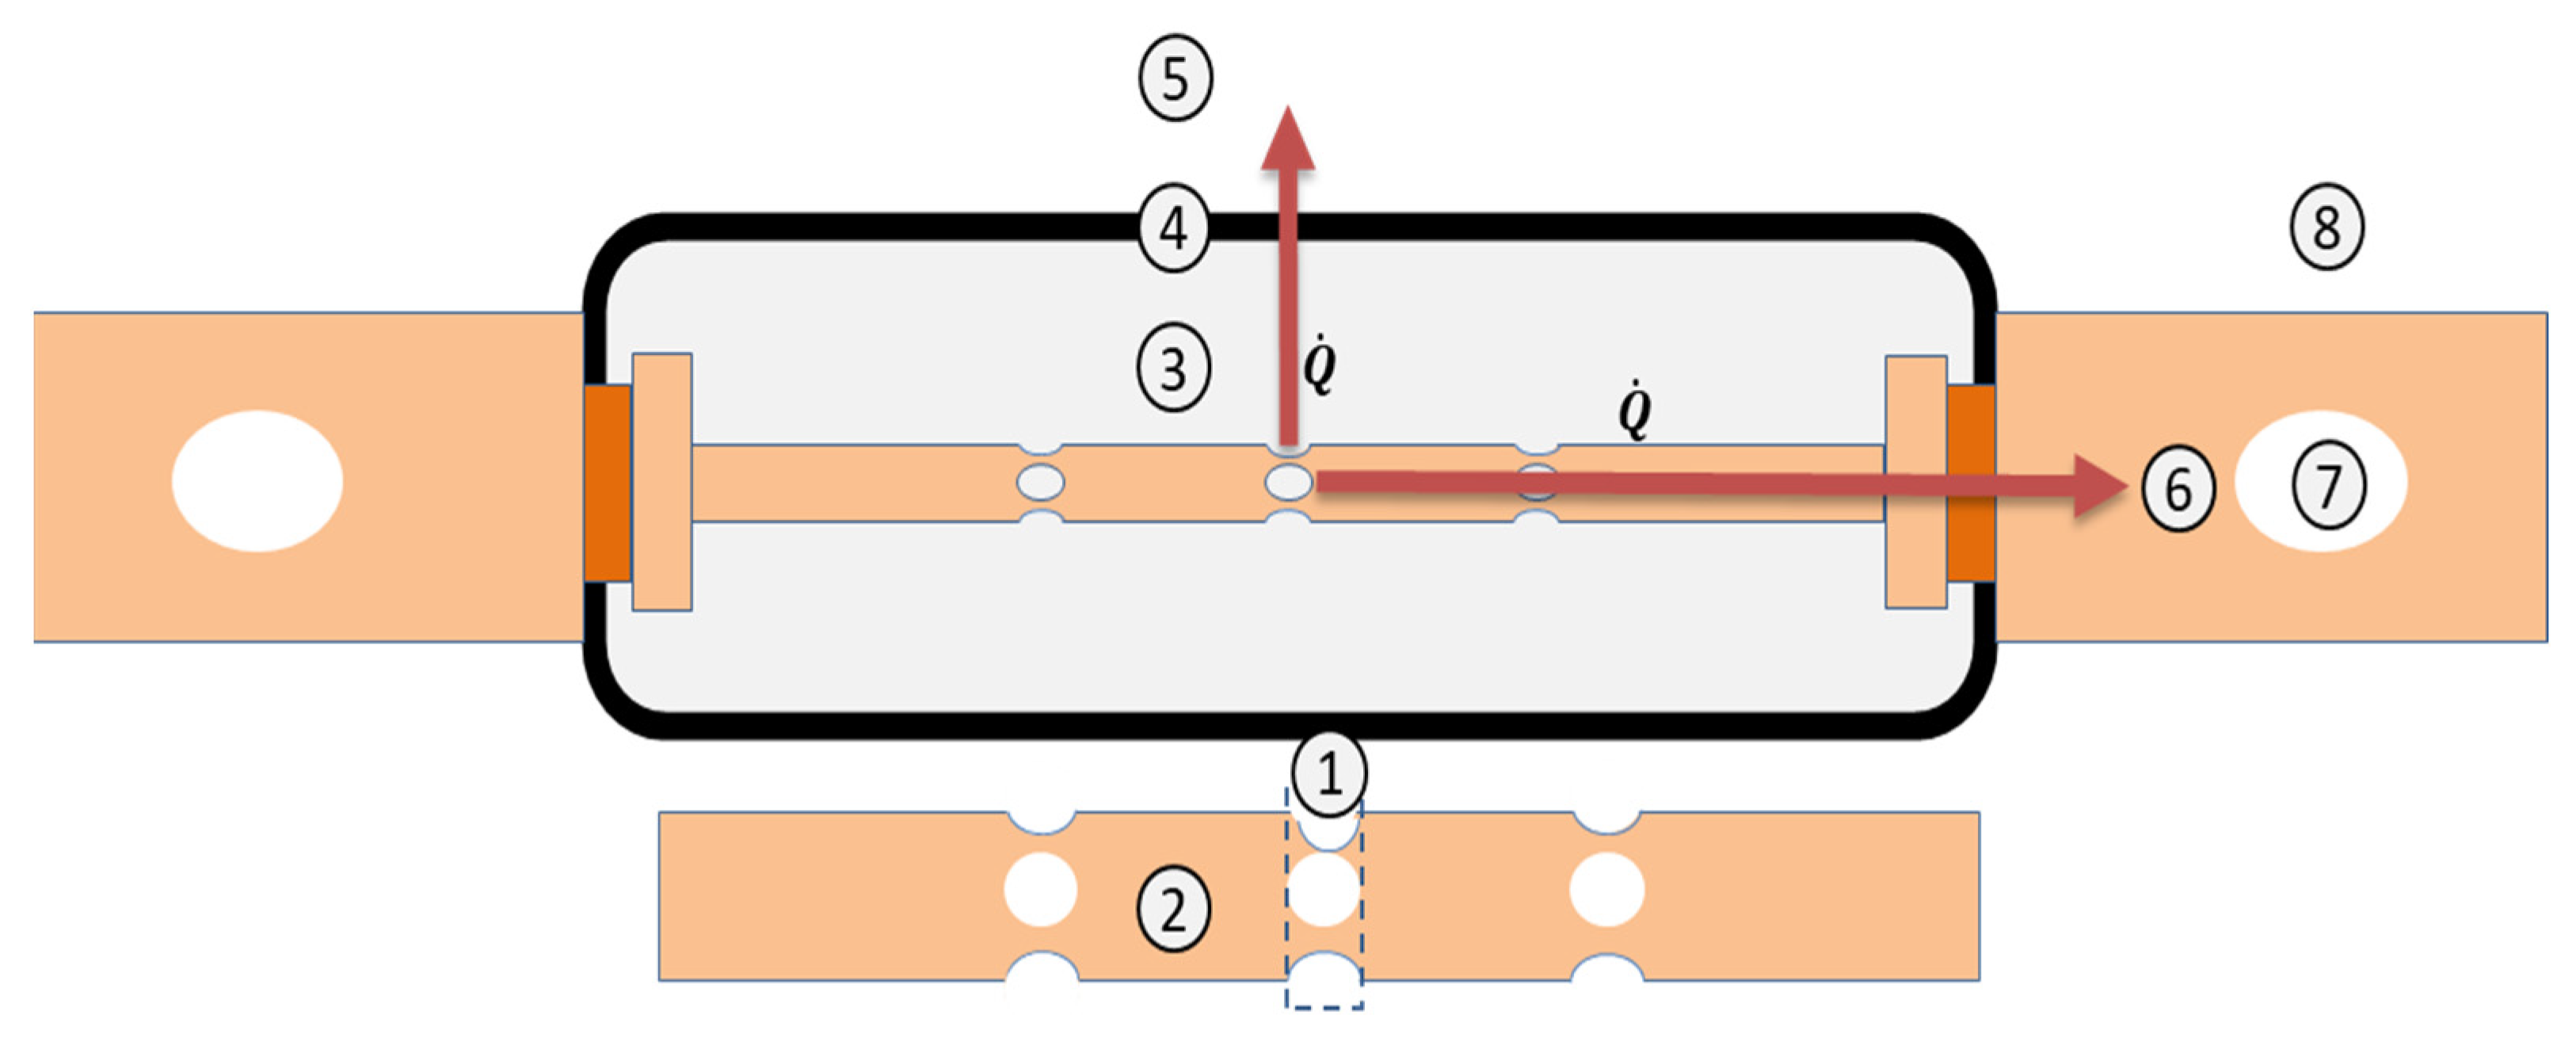
As a result of these observations, the fuse element is represented by a multi-thermal node model. Here, it is divided into two heat flow paths with the discrete sections 1 and 2 for the fuse element, 3 and 4 for the quartz sand and the fuse case, and 5 for the ambient representing the vertical heat flow path and the interface, the terminals, the busbar mounting, and the ambient representing the horizontal heat flow path illustrated in Figure 7. Each section is assigned its own thermal resistance and capacitance, allowing the model to capture localized heat generation, transient thermal behavior, and spatial gradients more accurately.

3.2. Simulation Model

To simulate the transient thermal behavior of the fuse, a thermal equivalent circuit was constructed, where the fuse structure was segmented into thermally distinct regions, and each was represented by a combination of thermal resistances and thermal capacitances based on geometry and material properties illustrated in Figure 7, starting with the smallest thermal time constant, resulting in a circuit model shown in Figure 8 [20].
The thermal model is based on a Cauer-type RC network, including three different material properties, stated in Table 2: The fuse element is made of copper (Cu), which exhibits very high thermal conductivity compared to the quartz sand filler and polyester case. For the calculation of the thermal resistance and capacitance using Equations (4)–(7), the material properties for the different sections are as shown below.
For the different areas, the thermal resistances and capacitances are represented in Table 3 and Table 4. Additionally, the time constants are calculated for the build-up of the model. Especially for the fuse element, made out of copper, a fast thermal response representing the internal fuse dynamics is obvious. A fast reaction, especially during an overcurrent event, is critical, while also allowing it to survive short transient currents. The quartz sand acts as a thermal buffer with long warm-up and cool-down phases, holding the heat after a fuse blow. The fuse case slowly absorbs and releases heat, making it important for system-level safety. The overall heat transfer coefficient to the ambient was used as an effective, experimentally calibrated parameter representing combined convection and linearized radiation at the mean operating temperature of the tested fuse. This simplification allows the use of Newton’s law of cooling for the modeled temperature range and was calibrated against experimental data.
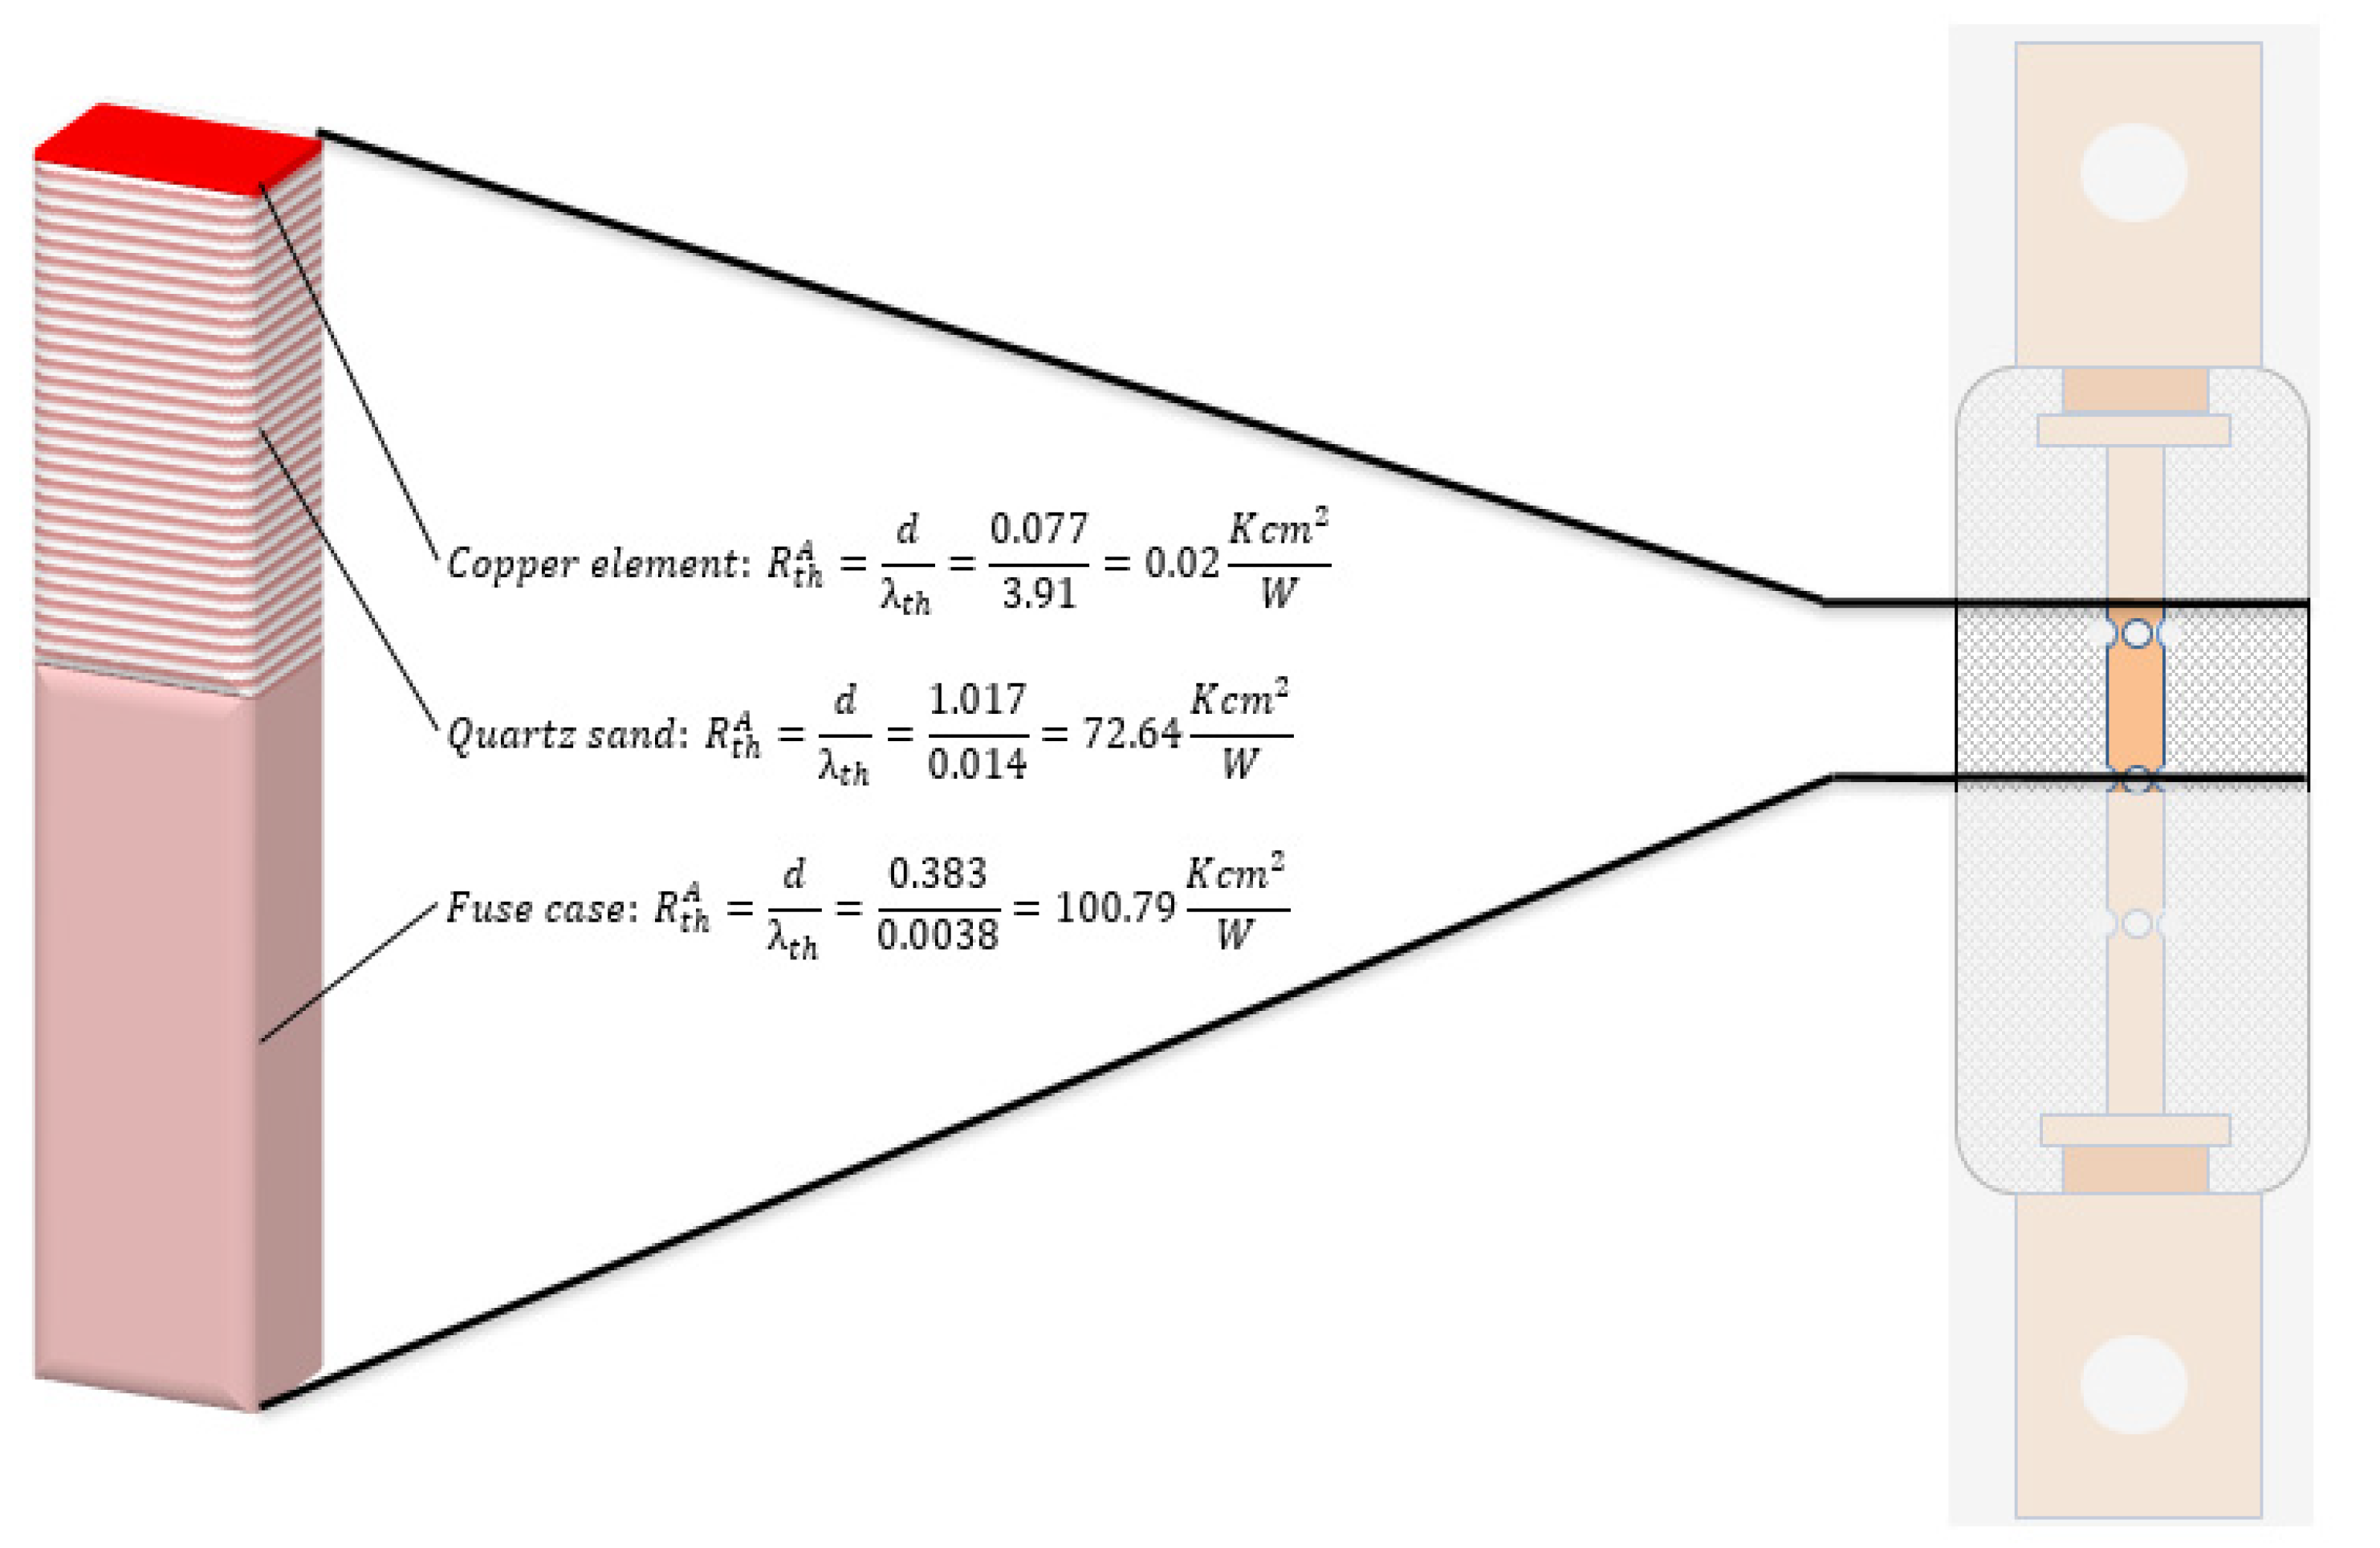
The influence of the material properties on the vertical heat flow path plays an essential role in the characterization of the thermal resistance of the overall system. A qualitative comparison of the different materials is performed by a surface-related thermal resistance comparison using:
R t h A = R t h · A = d λ t h
Figure 9 shows the contribution of each layer to the overall thermal resistance in the vertical path. The influence of the material properties on the behavior of the system shows the high thermal resistance of the fuse case isolating the joule heating from the ambient. The copper element, as a good conductor, has a small share to conduct heat immediately and prevent thermal damage.
The material properties listed in Table 2 and Equations (4)–(7) result in the values of the thermal resistances and thermal capacitances for the vertical heat flow path shown in Table 3. The analyzed fuse has the following geometrical dimensions: length of the fuse is 5.1 cm, radius is 1.4385 cm, the surface of the fuse terminal is 3.4 cm2, and the thickness is 0.276 cm. The copper element inside the fuse has an overall length of 4.2 cm and a thickness of 0.077 cm.
The increasing time constant of the different layers gives a valid indication of the realistic behavior of the thermal model. The restricted area in the middle of the fuse element shows a relatively high thermal resistance for a copper element because of its proportions regarding the thickness and the surface area, making it a bottleneck for possible degradation effects due to Joule heating. The quartz sand also shows a high thermal resistance, hindering the heat from transferring to the fuse case during a short-circuit event. As already illustrated in Figure 9, despite its lower value in absolute numbers because of its geometrical properties, the fuse case has the reference-wise highest thermal resistance.
The horizontal heat path consists of the fuse caps or interface, the fuse terminal, the fixation area with the busbar fixation, and the ambient condition.
The fixation area is the busbar connection of the fuse defining the heat path from the terminal over the screw connection to the busbar. Ref. [24] shows the influence of busbar connections on the overall heat distribution of fuse terminals working as an additional thermal resistance. The thermal resistance of different contact surfaces is defined using:
R t h = 1 h · A e f f
Surface texture and torque force of the connector influence the thermal transition and the transition coefficient of the fixation area. Considering the torque force of the screw connection, connecting both copper surfaces, the effective surface area of the fuse is calculated with
A e f f = α · min A b u s , A t e r m = 1.36   c m 2
considering the contact factor α as 0.2, representing rough metal surfaces and the minimum of the busbar and terminal surface. Using a heat transition coefficient h of 6000 representing copper-copper contact, the thermal resistance is
R t h = 1 h · A e f f = 1.22   K W
The stationary behavior of the model gives back the finally reached temperature of the system and is defined through (16). The formula shows the two different heat paths through the fuse case and the fuse terminal.
R t h , s t a t = R e l e m , 1 + R e l e m , 2 + R s a n d + R c a s e + R c o n v , 1 R t e r m i n a l + R f i x R c o n v , 2 ) )
The dynamic behavior of the model gives back the reaction of the system to any impulse and is calculated by discretizing the thermal system via Kirchhoff’s law:
T 1 1 t τ 1 t τ 1 0000 T 1 t C 1
T 2 t τ 12 1 t τ 12 t τ 2 t τ 2 000 T 2 0
T 3 0 t τ 23 1 t τ 23 t τ 3 t τ 3 00 T 3 0
T 4 =00 t τ 34 1 t τ 34 t τ 4 C 6 · ( 1 R 5 R 6 R x ) t τ 4 C 6 · R 4 R 5 R x 0 ° T 4 +0 P n
T 5 000 t τ 56 · R 5 R 6 R x 1 t τ 6 t τ 56 · ( 1 R 4 R 5 R x ) t τ 6 T 5 0
T 6 0000 t τ 67 · R 4 R 5 R x 1 t τ 78 t τ 67 · ( 1 R 5 R 6 R x ) T 6 0
n + 1 n
With:
τ 1 = R 1 C 1 τ 12 = R 1 C 2 τ 2 = R 2 C 2 τ 23 = R 2 C 3 τ 3 = R 3 C 3 τ 34 = R 3 C 4 τ 4 = R 4 C 4 τ 56 = R 5 C 6 τ 6 = R 6 C 6 τ 67 = R 6 C 7 τ 78 = R 7 C 8
R 1 = R e l , 1 R 2 = R e l , 2 R 3 = R s a n d R 4 = R c a s e R 5 = R c o n v , 1 R 6 = R t e r m R 7 = R f i x R 8 = R c o n v , 2
The discrete-time state–space matrix represents the lumped thermal RC network of the fuse, where each node corresponds to a physical region of the device (copper, sand, case, terminal, fixation, convection). The diagonal elements combine the influence of each node on the next, whereas the off-diagonal values show the correspondent behavior of the node. This formulation allows the model to capture both localized temperature rises in the fuse element and slower dynamics in the case and ambient path.

4. Results and Discussion

The results presented in this section address both the dynamic and steady-state thermal behavior of the investigated high-voltage fuse. Transient step-response tests reveal how the internal temperature rises and distributes across the fuse element, filler, and housing under sudden load conditions, while steady-state measurements provide insight into the thermal balance achieved during prolonged operation. Together, these perspectives form the basis for understanding the thermal limits and safety margins of the device. Of particular relevance is the evaluation under realistic battery charging profiles. In typical automotive and stationary applications, the load current rarely exceeds 50% of the fuse’s nominal rating, meaning that the fuse operates with substantial thermal headroom. This observation opens a pathway for optimization toward higher current utilization, enabling faster charging processes without compromising fuse reliability. By explicitly capturing the nonlinear dependence of thermal impedance on current magnitude, the proposed RC model allows a more accurate prediction of internal temperature evolution under such varying conditions.
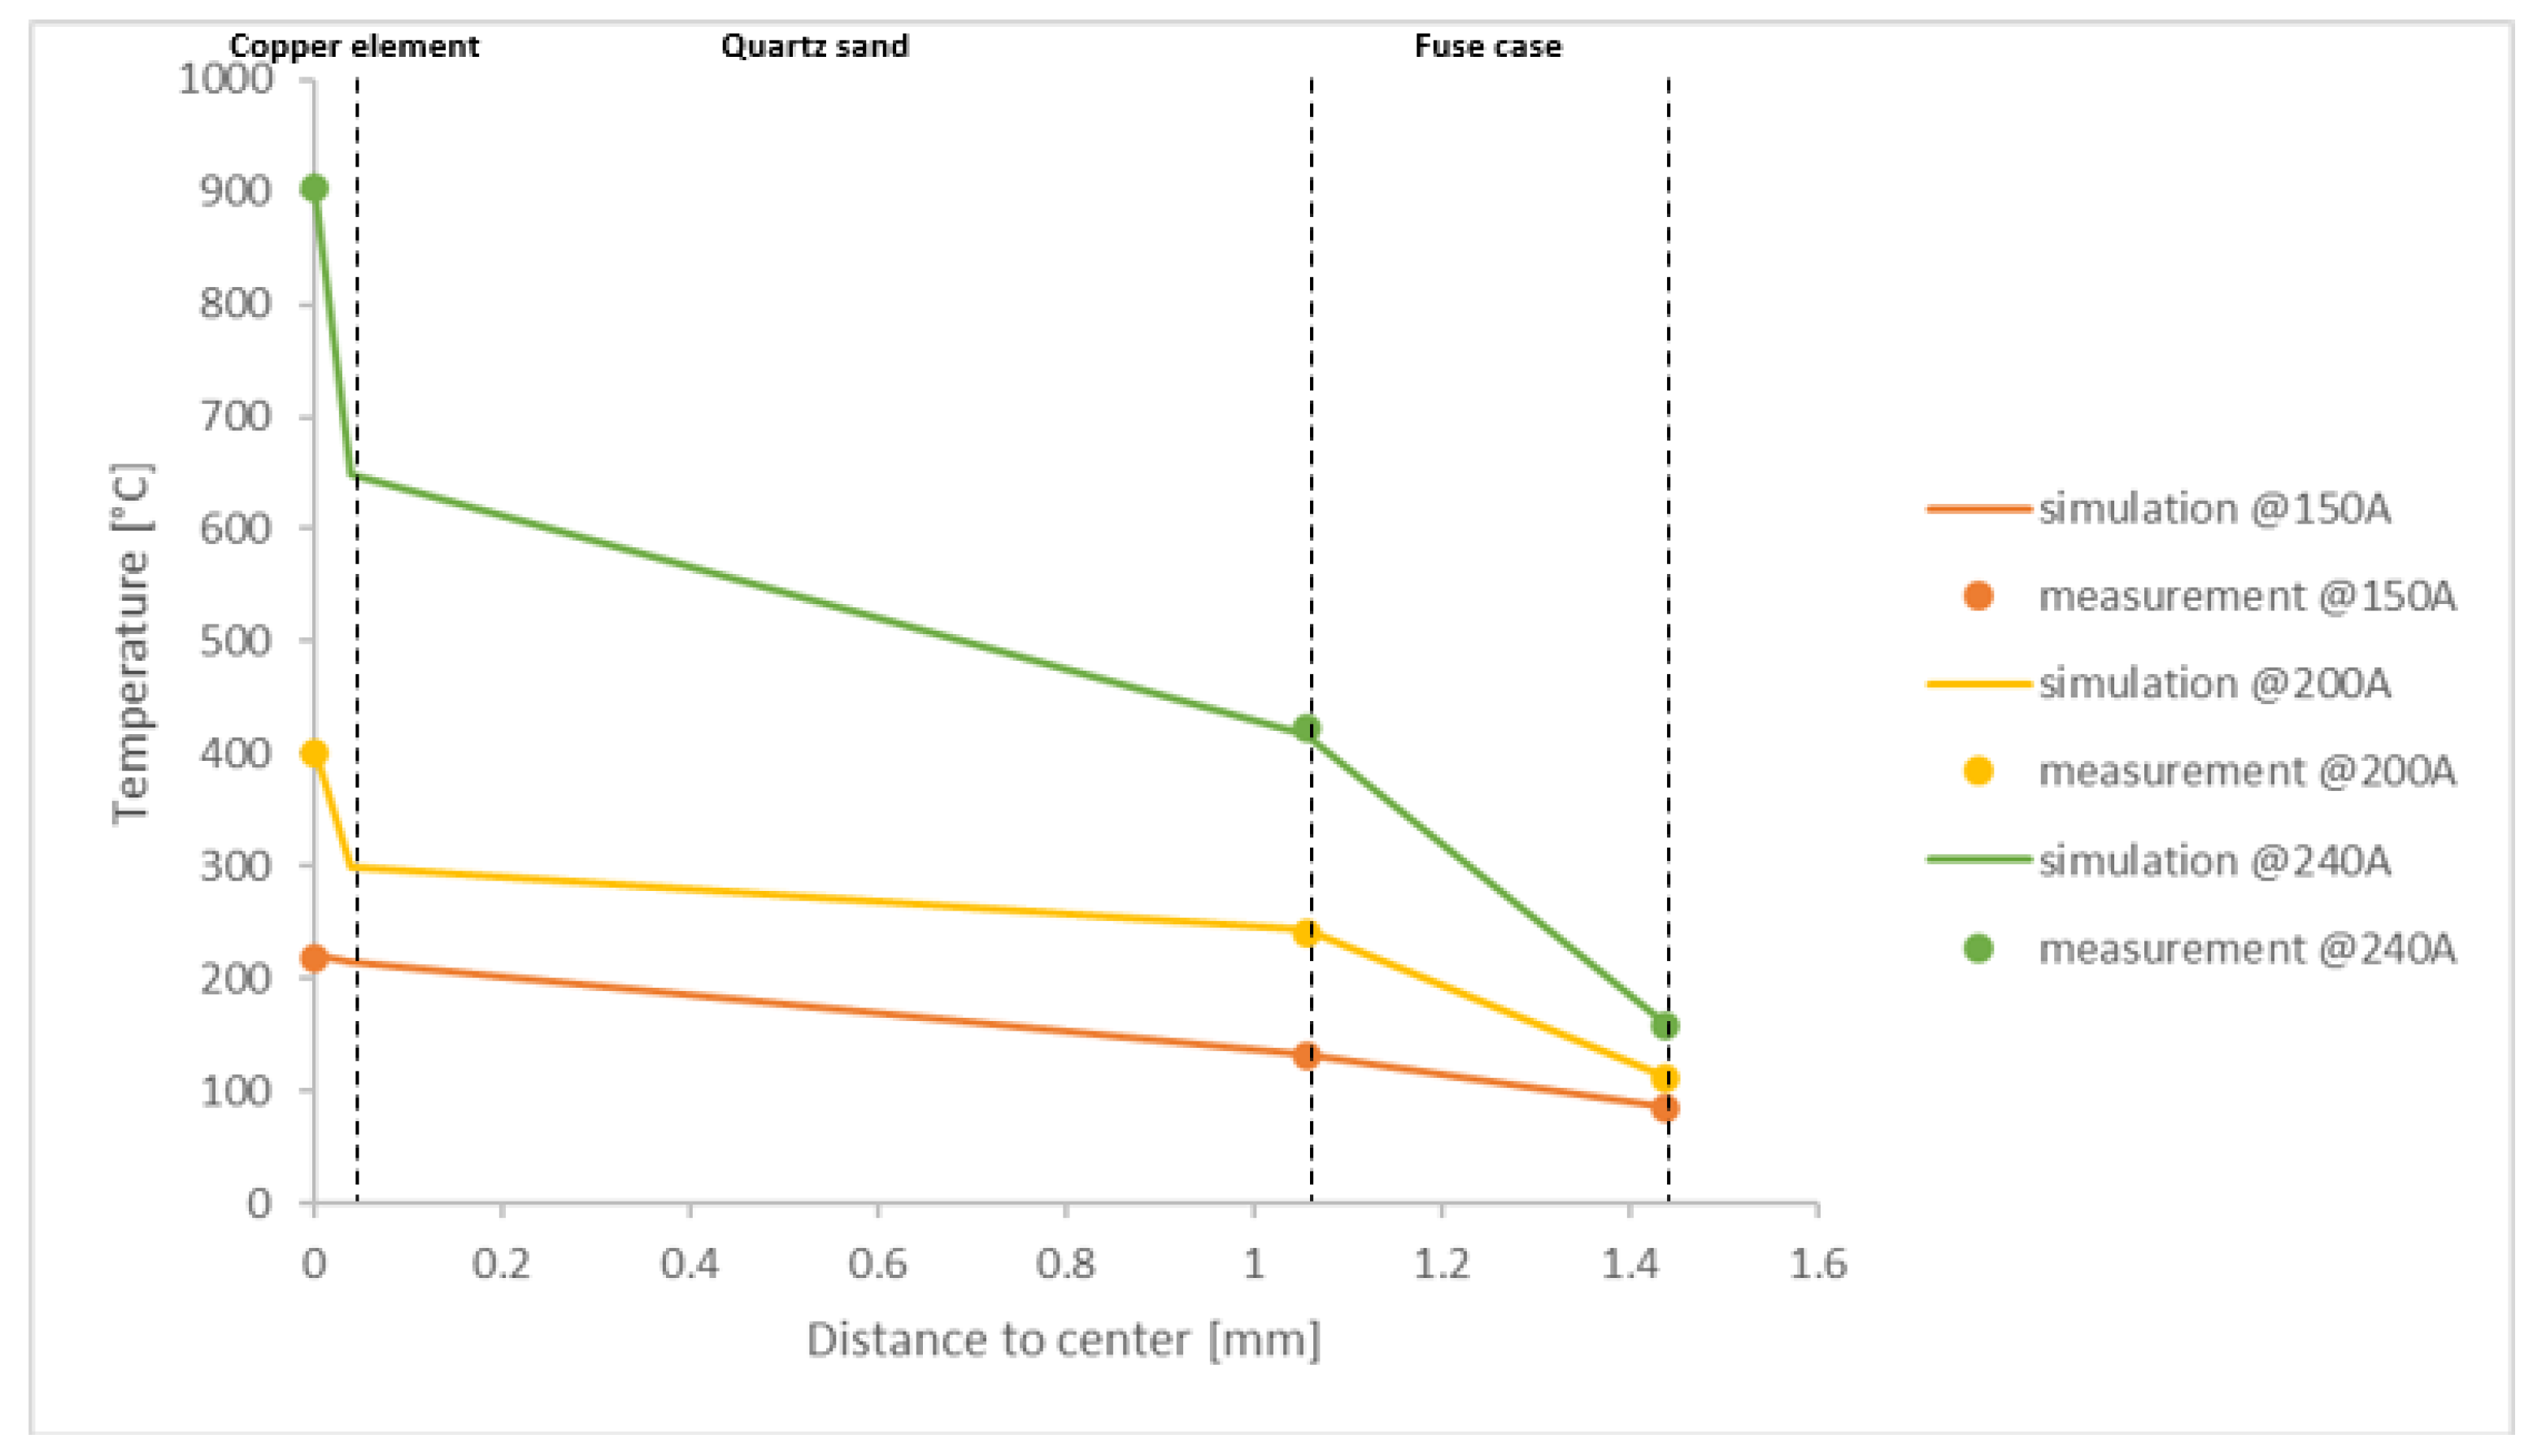
The steady-state temperature profiles in Figure 10 reveal a clear stratification of heat within the fuse assembly. At all three current levels (150 A, 200 A, and 240 A), the highest temperature is reached at the copper element, followed by a pronounced drop across the quartz sand layer, and a further decline through the ceramic fuse case. The peak copper temperatures scale almost linearly with current. Quartz sand acts as an effective thermal buffer. Between the copper and the case, the sand layer sees a temperature reduction of roughly 300 K at 240 A, evidencing its role in smoothing out thermal gradients. The polyester case remains below 300 °C even at the highest load, highlighting its insulating properties and protecting the outer housing.
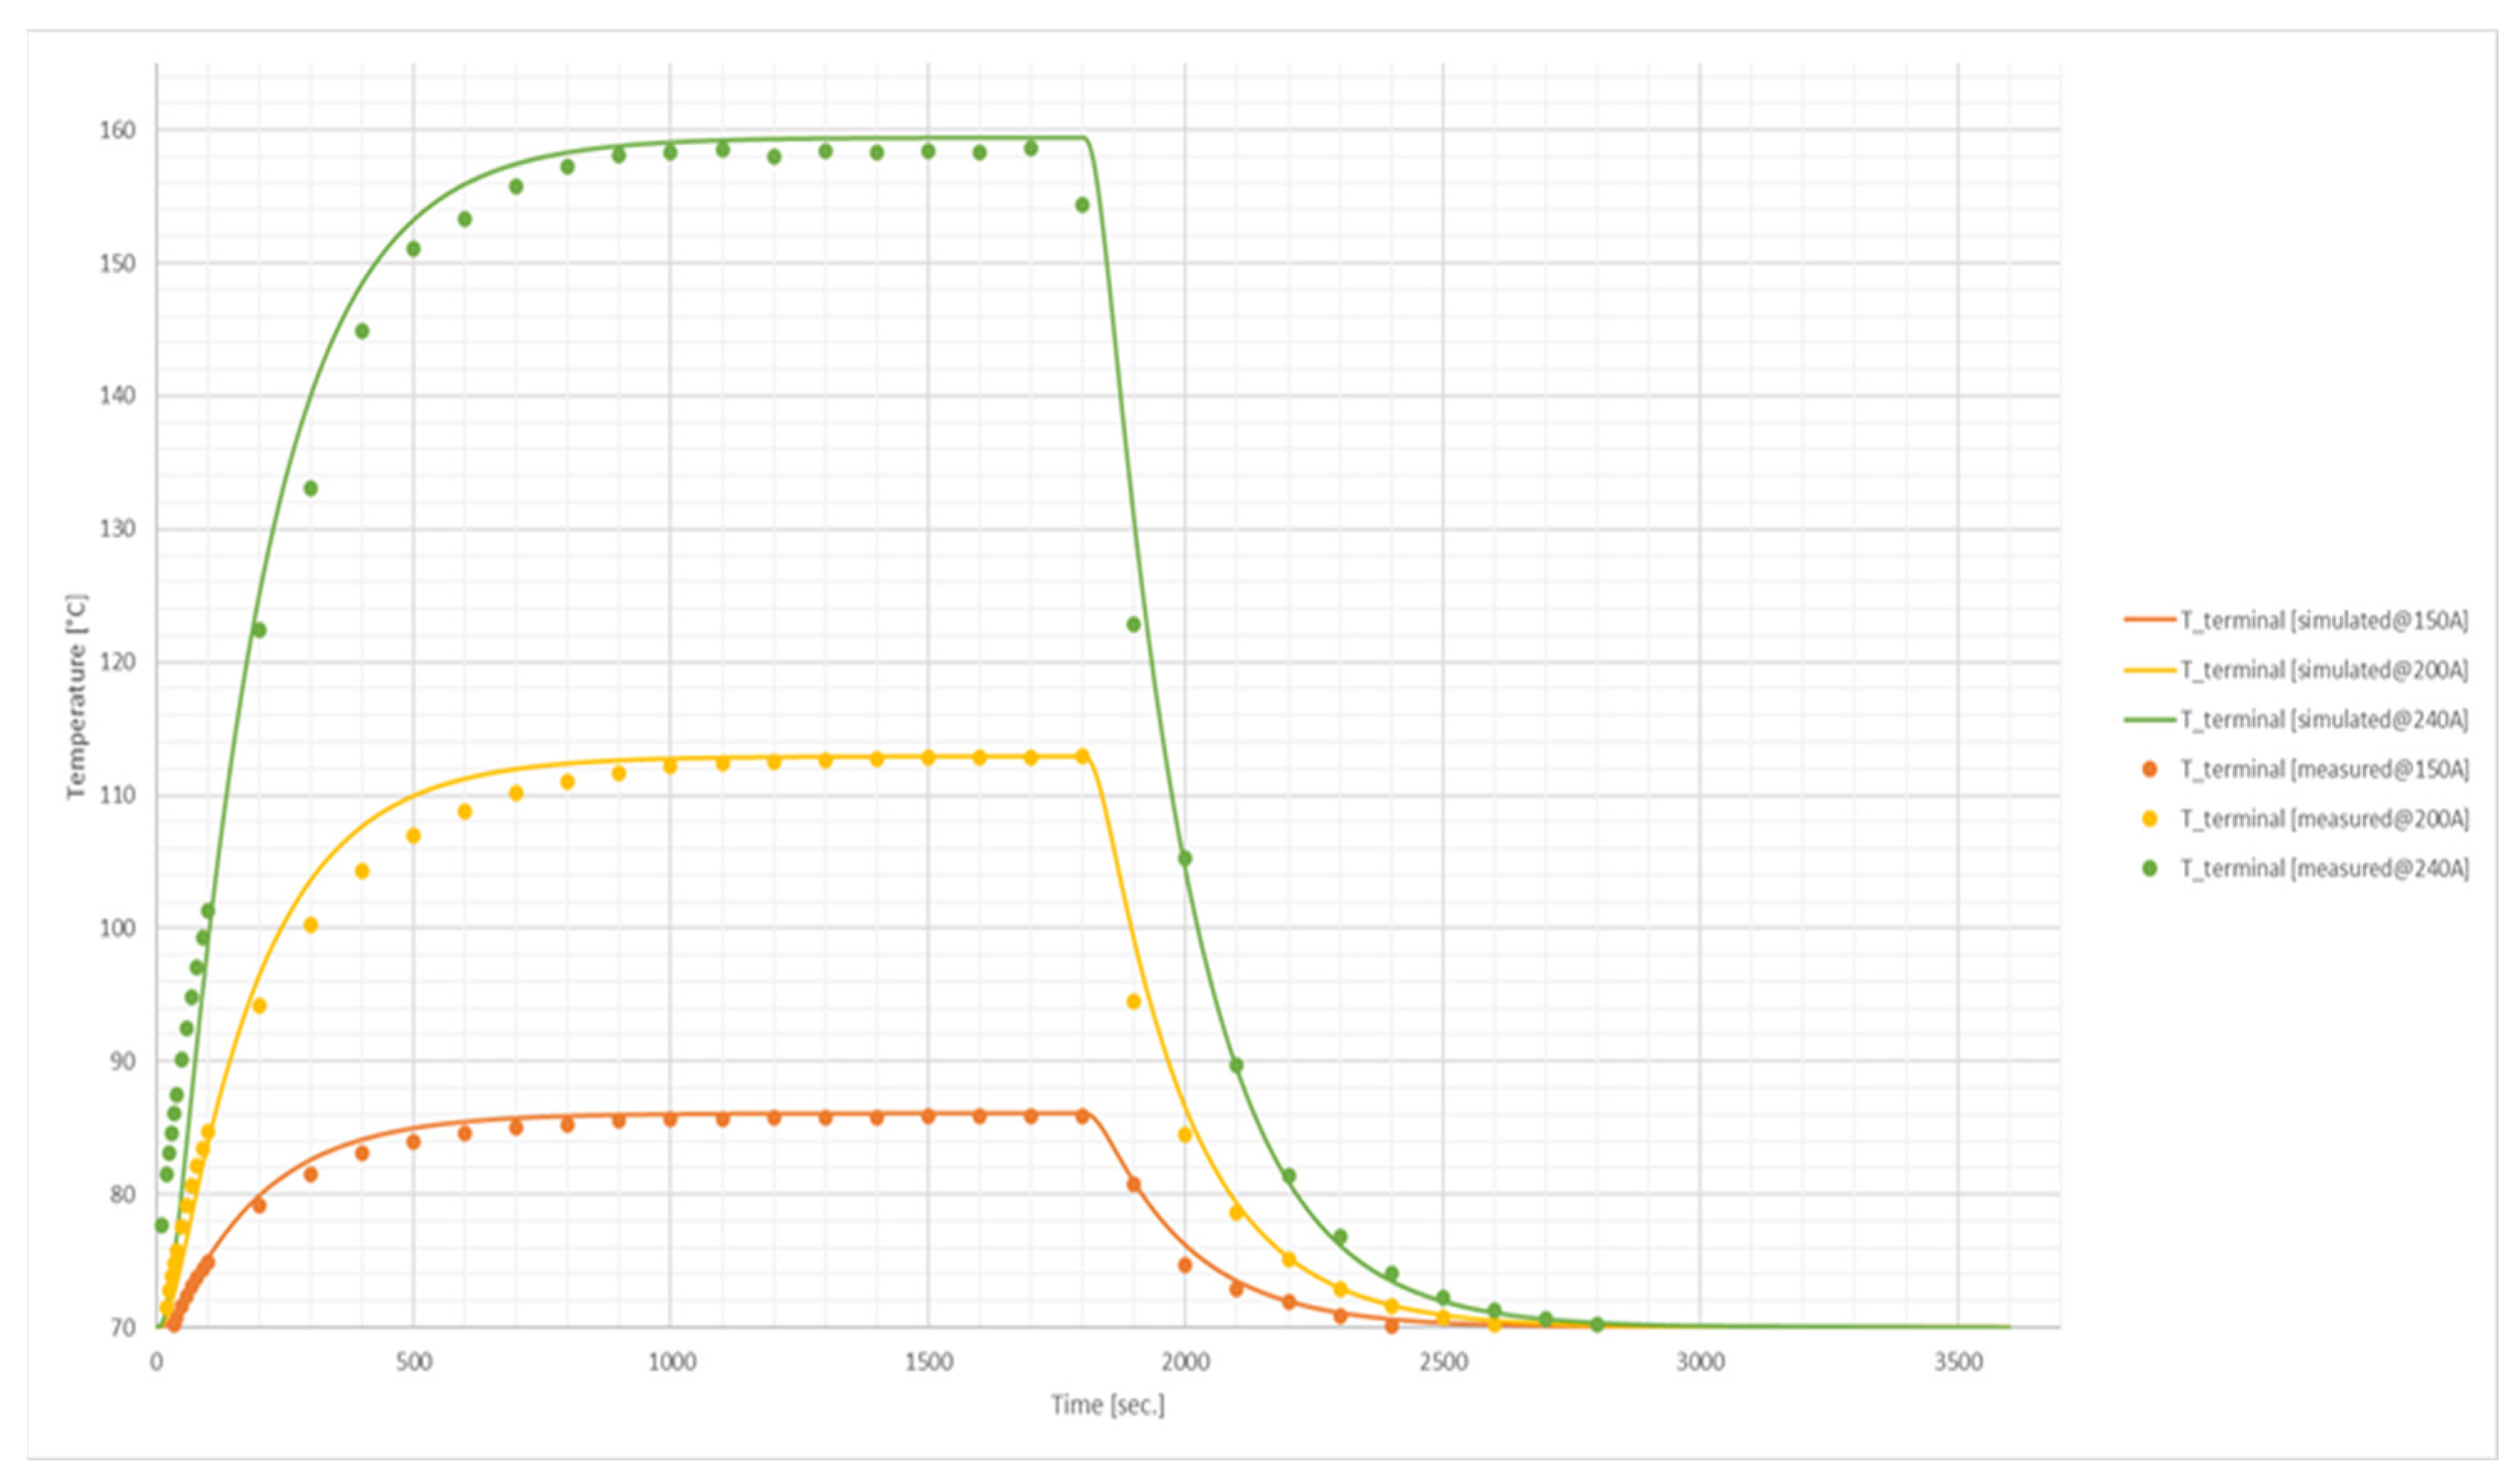
For the dynamic thermal behavior, the simulation and measurement curves lie within less than 5% deviation across all regions and currents, considering an ambient temperature of 70 °C within the E/E-Box. This close agreement confirms that the RC-network parameters accurately capture the material conductivities and heat capacities. Figure 11 illustrates the temperature curve at the fuse terminal. The dynamic terminal temperatures at 150 A, 200 A, and 240 A show very close arrangement between the simulated and measured curves. The model reproduces both the rapid temperature rise during current application and the cooling curve after interruption, with deviations of only a few degrees. The results highlight that terminal heating is governed mainly by conduction through the fixation area and busbars, leading to moderate temperature levels compared to the copper element. Even under the highest applied current, terminal temperatures remain below 160 °C, indicating sufficient thermal margins in practical operation.
The transient thermal response of the fuse case illustrated in Figure 12 also shows a strong correlation between simulation and experimental measurements. The dynamic behavior of the fuse case demonstrates its role as a thermal buffer. Compared to the copper element and terminals, the case shows a delayed and much smaller temperature rise, confirming its high thermal resistance and low conductivity. At each applied current, the case temperature exhibits a characteristic rise toward a quasi-steady state, followed by a rapid decline reaching the thermal equilibrium at approximately 150 °C for 150 A, 250 °C for 200 A, and exceeding 400 °C at 240 A. The observed time constants highlight the significant thermal inertia of the fuse case, which delays the external temperature response relative to the internal element heating, ensuring mechanical stability and protection of the outer housing. This behavior is of particular importance for predicting fuse performance under transient or pulsed load conditions, as it governs both the thermal stress distribution and the onset of failure.
The simulation reproduces the slower heating and extended cooling phase observed in the measurements, which is governed by the case’s relatively large thermal capacitance. This validates that the model accurately captures the long-term heat storage and release properties of the polyester material, highlighting the importance of the fuse case in system-level safety and thermal insulation.
The copper element in Figure 13 shows the steepest and most critical temperature rise, as expected from its direct exposure to Joule heating. At 240 A, the peak copper temperature reaches ~870 °C, approaching the material’s structural stress range but remaining below its melting threshold. The RC network captures both the fast heating and subsequent cooling phases with high fidelity, reflecting the element’s low thermal resistance and capacitance. The dynamic behavior confirms that the copper element dominates short-term fuse heating, while the surrounding sand and case act as buffers that slow down thermal relaxation.
Overall, the results show that a slight over-prediction in the sand region at 200 A suggests a minor adjustment in the sand’s effective thermal conductivity could further improve model fidelity. A closer analysis highlights the sensitivity of the case temperature to the effective thermal conductivity of the sand. Increasing the quartz packing density or selecting sand with higher λ would reduce R_th and lower the case temperature. In contrast, the copper temperature is largely insensitive to sand conductivity and is dominated by I2R heating. These findings emphasize that fuse thermal design is governed by two regimes: copper temperature by electrical losses, and case temperature by material selection and geometry. The dynamic heating curves confirm the predictive capability of the thermal RC network for all applied currents. The time constants observed experimentally are reproduced with high fidelity in the simulation model. Similarly, the cooling curves after current interruption demonstrate the correct thermal inertia of the case and sand, which dominate heat dissipation during relaxation. Importantly, the deviation between simulation and measurement remains within a few degrees across all tested current levels, validating the physical plausibility of the parameterized resistances and capacitances. This agreement underscores the ability of the model to capture not only steady-state distributions but also the transient dynamics relevant for overload and cycling conditions.
In electric vehicle applications, the thermal behavior of fuses is strongly influenced by a fast charge rate, which causes large temperature swings in shorter time intervals. Fast charging involves high C-rates, driving rapid ohmic losses and large temperature swings over short time periods. These temperature swings lead to more severe stress in the fuse element than similar currents applied more slowly. Therefore, modeling and validation of fuse thermal behavior under fast charge profiles are essential to ensure reliable performance under real EV use. Under standard operating conditions, charging profiles typically do not exceed 50% of the fuse’s rated current, which ensures safe operation but also leaves a significant thermal margin unused. Here, the concept of a conventional fuse/contactor/pyro-fuse safety architecture is the current state of the art practice for EV battery safety architectures, placing a fuse and a contactor in the charging path and a pyro fuse and a contactor in the discharging path [25], so that the fuse is exposed to charging current. Additionally, discharge events, which do not affect the fuse directly, still impose critical thermal and mechanical loads on downstream hardware. Understanding how different current levels affect the fuse’s temperature distribution is therefore essential for assessing both reliability and optimization potential. By characterizing the dynamic and steady-state thermal responses, it becomes possible to evaluate whether higher charging currents could be applied without compromising safety, thus enabling faster charging times while maintaining fuse integrity. However, the impact of degradation effects on the component is not applicable to the model to ensure a safe recommendation. Thus, it provides valuable information usable for lifetime model predictions, resulting in a better prediction of the impact of charging current increase on the lifetime. Applying the below load profile, depending on the architecture of the HV battery system and the number of batteries and layers in use, the load current is divided into a certain amount of current flow into each battery layer and fuse. In this application, the system consists of three batteries built up in two layers, so that the resulting load profile and a fast charge profile can be seen in Figure 14. The standard charging profile charges the battery with a system voltage of 400 V from 5% State-of-charge (SoC) to 86% SoC in about 100 min, whereas the fast charge profile charges the battery 12 to 15 min faster.
A uniform ambient temperature of 50 °C was applied during simulations to represent elevated internal heating conditions typical of battery enclosures and worst-case service environments. Using 50 °C as the boundary condition ensures the reported peak temperatures and temperature-swing metrics reflect realistic, high-stress operating scenarios and provides a consistent basis for comparing charge profiles and for supplying thermal boundary conditions. By applying both current profiles, the thermal response of the fuse is analyzed and evaluated towards the applicability of the fast charge profile regarding aging and critical temperature range within the copper element. Figure 14 below shows the thermal step response of the fuse on both applied current profiles. It is evident that under both conditions the fuse does not reach thermal equilibrium, as the applied current duration is shorter than the system’s thermal time constant. For the fast-charging profile, the maximum copper temperature reaches approximately 200 °C under a worst-case ambient condition of 50 °C. This value remains far below the copper melting temperature (1085 °C) and significantly below critical annealing thresholds where long-term material degradation accelerates (>250–300 °C). The results highlight that charging currents at ~50–60% of the fuse’s nominal rating do not pose a thermal risk, but rather demonstrate a large unused thermal margin, considering the maximum reached temperature. Such a conservative margin ensures operational reliability and minimizes the risk of thermal overstress or secondary ignition under fault conditions. However, this finding raises a relevant question regarding the potential optimization of this safety margin, considering the precise characterization of thermal dynamics and fuse material stability. This also suggests potential for operating at higher currents to shorten charging times, provided that repetitive cycling effects and contact interface aging are properly considered in the system design.
The results demonstrate that the thermal response of the fuse is strongly dependent on the applied load profile. Under constant high current steps, the fuse element exhibits distinct dynamic and stationary behaviors, with time constants on the order of several hundred seconds. However, in realistic EV charging conditions, the applied load rarely exceeds 50% of the nominal current rating of the fuse. This observation is critical, as it highlights a large margin between standard charging operation and the thermal limits of the device. The simulations indicate that when subjected to partial-load profiles (≤50% rating), the terminal temperatures remain significantly below the critical thresholds, and the overall thermal stress accumulated per cycle is relatively small. In contrast, when higher current pulses approach or exceed 100% of the rating, the transient heating leads to elevated terminal temperatures, narrowing the safe operating margin. The nonlinear character of the fuse is particularly evident in these cases, as thermal resistance and capacitance are no longer constant but vary with temperature and interface effects (contact resistance, sand conductivity, and case conduction). This behavior implies that the fuse does not operate in a thermally saturated state under typical charging scenarios. Therefore, there is untapped potential to optimize charging strategies by allowing higher peak currents or dynamic current shaping. By exploiting the available thermal headroom, charging times could be significantly reduced while maintaining safe operation. The proposed RC model, validated against experimental data, provides a predictive tool to evaluate such scenarios and design charging profiles that make more efficient use of the fuse’s thermal capacity.
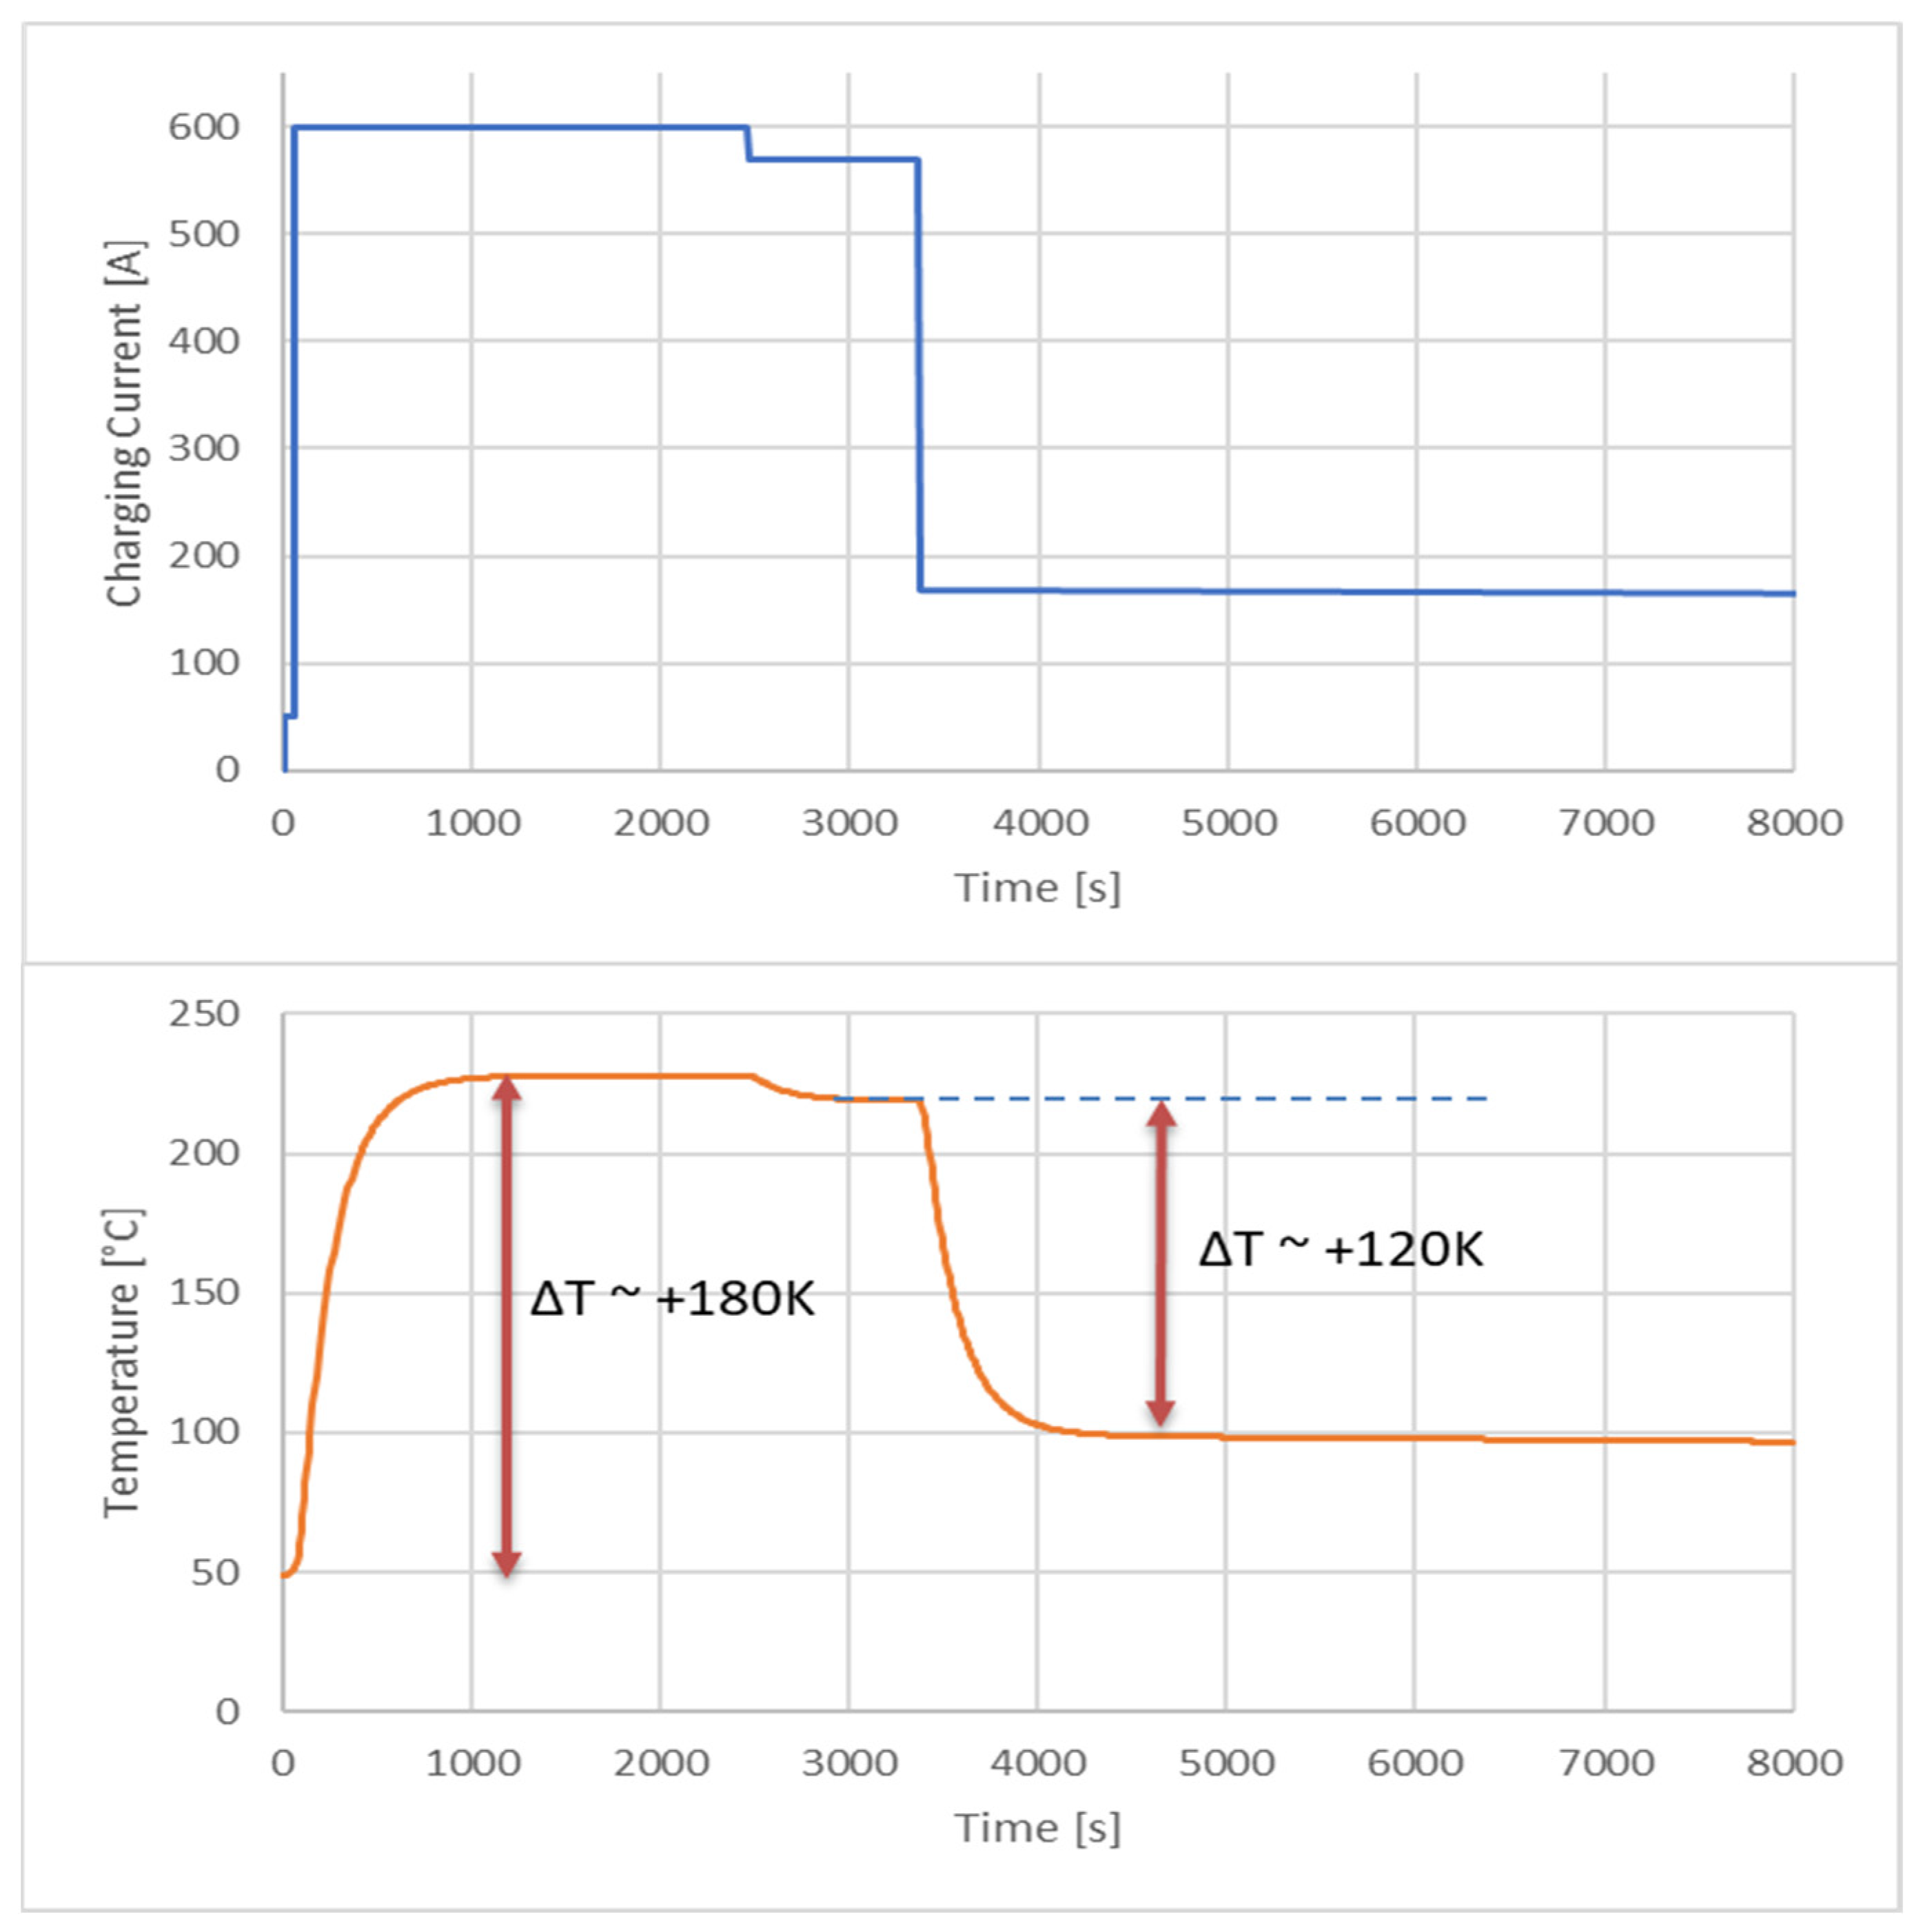
Another use case to address is the fast charging as a more critical key to the thermal behavior of the fuse and the influence of the temperature swing as the main degradation effect, to also investigate the development of higher current charging profiles up to Megawatt charging as the next key innovation to decrease charging time. The temperature swing as the main stress factor implies thermo-mechanical strain as a consequence of different material parameters regarding the coefficient of thermal expansion (CTE). A majority of 65% of electronic failures are thermo-mechanically related [26]. Therefore, an additional synthetic charging profile, consistent with recent literature and application use cases on HV architectures was implemented [27,28]. A 350 kW fast-charging profile for a 400 V battery system was applied, consisting of an initial constant-current (CC) phase, followed by a constant-power (CP) phase, and a constant-voltage (CV) phase as illustrated in Figure 15. This charging concept reflects the charging strategies of current 400 V EV platforms and ensures both rapid energy intake and protection against overvoltage and thermal stress.
The calculated temperature swings of 120–180 K in the copper fuse element imply thermo-mechanical stress. Considering the CTE and the E-modulus of copper, the transition from elastic to plastic stress in the relevant temperature range is likely to occur during each thermal cycle. From a materials perspective, cyclic exposure to 200–250 °C also induces microstructural changes in copper, including grain growth and annealing softening, which reduce yield strength and hardness. The combined effects of thermal strain and creep at such temperatures therefore represent a critical reliability concern for copper conductors subjected to repeated high-amplitude temperature swings. Considering an application lifetime of 10 years and an estimated 2100 charging cycles, the impact of large temperature swings on the copper fuse element becomes critical. With each cycle, thermo-mechanical strain is imposed due to differential expansion and contraction. Even if the element operates far below its melting point, repeated cycling at this amplitude is known to accelerate fatigue and creep damage in copper.
From a systems perspective, the findings suggest that the conservative design margins typically applied to fuses in battery packs may be revisited considering the impact of temperature swing on the lifetime. The ability to model and predict temperature rise under arbitrary load profiles enables manufacturers to balance safety and performance more effectively. This approach can also extend fuse lifetime by avoiding unnecessary thermal cycling while still achieving faster charging.

5. Conclusions

The developed RC network model and the corresponding experimental validation provide not only a precise description of the thermal behavior of high-current fuses but also an essential foundation for charging profile optimization and lifetime prediction models. The results demonstrate that the thermal capacity of the fuse is far from being fully utilized under standard charging conditions, considering the maximum reached temperature regarding the material properties. With typical charging profiles rarely exceeding 50% of the nominal current rating, the fuse experiences only moderate temperature rises, remaining well below critical thresholds for material degradation or melting. This underutilization opens a clear optimization potential. By systematically analyzing the dynamic and stationary responses of the fuse, it becomes evident that higher charging currents can be introduced in a controlled manner without exceeding safe operational limits. However, the impact of the temperature swing on the lifetime is unclear. The model only shows the thermal response of a charging profile on the fuse, excluding degradation and aging behavior. It gives back information regarding the temperature swing and the maximum reached temperature, to apply for physics-based degradation models like Coffin–Manson for low-cycle thermal fatigue or Arrhenius-type models, using local stress–strain relationships inferred from the measured or simulated thermal transients. Any recommendation to increase charging currents must consider the degradation induced by thermal cycling.
In particular, the modeled and measured step responses show that the fuse does not reach its thermal equilibrium within the applied charging durations. The surrounding quartz sand and the case material act as significant thermal buffers, absorbing and redistributing the heat generated in the copper element. This thermal buffering effect enables the short-term application of higher current pulses without driving the element to its failure temperature. When applying accelerated charging profiles, the maximum measured copper element temperature remains around 200 °C even under a worst-case ambient condition of 50 °C. Compared to the melting point of copper at 1085 °C and the onset of severe material degradation above 250–300 °C, this value provides a substantial safety margin. Consequently, charging strategies can be optimized to exploit this thermal headroom. By allowing short-duration current peaks significantly above 50% of the rated current, charging times can be reduced without compromising fuse reliability or safety.
Furthermore, the validated RC network model offers a predictive tool to evaluate the thermal impact of arbitrary load profiles. This means that charging currents can be adapted dynamically depending on system-level constraints such as ambient temperature, battery state of charge, and cooling availability. Such adaptability enables the tailoring of load profiles to individual charging events while maintaining compliance with fuse safety requirements. The results further indicate that although the fuse can safely tolerate high charging currents, the results can be used to adapt the thermal time constant of fuses to fast charging profiles to generate a current profile, which minimizes excessive temperature gradients and mechanical stress. A gradual increase in current allows the fuse element and surrounding materials to follow the natural thermal time constant of the system. In summary, the model reveals the opportunity to use the results of the thermal response for lifetime models that can be harnessed for faster charging cycles, reduced downtime, and improved operational efficiency in electric vehicle charging systems. The proposed RC model therefore not only serves as a tool for failure prediction but also as a basis for optimization of charging strategies, bridging the gap between component-level safety margins and system-level performance goals.
Author Contributions

Conceptualization, O.M.; methodology, O.M.; validation, O.M.; formal analysis, O.M.; investigation, O.M.; resources, K.-P.B.; data curation, O.M.; writing—original draft preparation, O.M.; writing—review and editing, O.M.; visualization, O.M.; supervision, K.-P.B.; project administration, K.-P.B. All authors have read and agreed to the published version of the manuscript.

Funding

This research received no external funding.

Data Availability Statement

The original contributions presented in this study are included in the article. Further inquiries can be directed to the corresponding author.

Conflicts of Interest

Author Oliver Makan was employed by the company Daimler Truck AG. The remaining authors declare that the research was conducted in the absence of any commercial or financial relationships that could be construed as a potential conflict of interest.

Abbreviations

The following abbreviations are used in this manuscript:
BEVBattery Electric Vehicle
CCConstant Current
CTECoefficient of Thermal Expansion
CthThermal Capacitance
CPConstant Power
CVConstant Voltage
CuCopper
EVElectric Vehicle
HVHigh Voltage
RCResistance Capacitance
RthThermal Resistance
SOCState of Charge
TECThermal Equivalent Circuit

References

  1. Newberry, P.; Wright, A. Electric Fuses; The Institution of Engineering and Technology: London, UK, 2004. [Google Scholar]
  2. Technologies, S. How Advanced Electrical Protection Enables DC Fast Charging. 2022. Available online: https://www.mtlc.co/how-advanced-electrical-protection-enables-dc-fast-charging/ (accessed on 30 June 2025).
  3. Bussmann, C. Fuseology Overcurrent Protection Fundamental. 2018. Available online: https://www.eaton.com/content/dam/eaton/products/electrical-circuit-protection/fuses/technical-literature/bus-ele-br-10892-csa-fuseology.pdf (accessed on 8 August 2025).
  4. Meng, X.; Sloot, J.; Haas, H. Aging Mechanism of Fuses for Semiconductor Protection; Research Portal Eindhoven University of Technology: Eindhoven, The Netherlands, 1995. [Google Scholar]
  5. Morel, C.; Morel, J.-Y. Power Semiconductor Junction Temperature and Lifetime Estimations: A Review. Energies 2024, 17, 4589. [Google Scholar] [CrossRef]
  6. Qian, C.; Gheitaghy, A.; Fan, J.; Tang, H.; Sun, B.; Ye, H.; Zhang, G. Thermal Management on IGBT Power Electronic Devices and Modules. IEEE Access 2018, 6, 99. [Google Scholar] [CrossRef]
  7. Sheng, K.; Williams, B.; Finney, S. A review of IGBT models. IEEE Trans. Power Electron. 2000, 15, 1250–1266. [Google Scholar] [CrossRef]
  8. Yun, C.; Malberti, P.; Ciappa, M.; Fichtner, W. Thermal component model for electrothermal analysis of IGBT module systems. IEEE Trans. Adv. Packag. 2001, 24, 401–406. [Google Scholar] [CrossRef]
  9. Kirchhoff, G.R. Ueber den Durchgang eines elektrischen Stromes durch eine Ebene, insbesondere durch eine kreisförmige. Ann. Der Phys. Und Chem. 1845, 140, 497–514. [Google Scholar] [CrossRef]
  10. März, M.; Nance, P. Thermal Modeling of Power-Electronic Systems; Infineon: Neubiberg, Germany, 2000. [Google Scholar]
  11. Henke, A.; Frei, S. Potentials of the Application of the Electrical Transmission Line Theory for Thermal Investigations on Cables. Adances Radio Sci. 2021, 19, 31–40. [Google Scholar] [CrossRef]
  12. Hou, Z.; Lv, X.; Yang, B.; Liu, H.; Liu, S.; Yu, C. Application of Transformer Heat Circuit Model in Power Substation Station Area. IOP Conf. Ser. Earth Environ. Sci. 2021, 804, 032050. [Google Scholar] [CrossRef]
  13. Nexperia. AN11261 RC Thermal Models. 2020. Available online: https://www.mouser.com/pdfDocs/AN112613.pdf?srsltid=AfmBOopT7m4sCWIdweascPw8U82gpJj2gum9Lxpa69Jud8sEQmhPbsDp (accessed on 9 April 2025).
  14. Hoffmann, G.; Kaltenborn, U. Thermal Modeling of High Voltage H. R. C. Fuses and Simulation of Tripping Characteristics; Corporate Research; ABB Switzerland Ltd.: Zurich, Switzerland, 2022. [Google Scholar]
  15. Schütze, T. AN2008-03 Thermal Equivalent Circuit Models; Infineon Technologies AG: Neubiberg, Germany, 2008. [Google Scholar]
  16. Cengel, Y.A. Heat Transfer: A Practical Approach; McGraw-Hill: Columbus, OH, USA, 1997. [Google Scholar]
  17. Akram, S.; Bertilsson, K.; Siden, J. LTspice Electro-Thermal Model of Joule Heating in High Density Polyethylene Optical Fiber Microducts. Electronics 2019, 8, 1453. [Google Scholar] [CrossRef]
  18. Infineon Technologies AG. Thermal Modeling of Power Electronic Systems. 2024. Available online: https://www.infineon.com/gated/infineon-thermal-modeling-of-power-electronic-systems-3.0.pdf-applicationnotes-en_94a64b0e-39d2-4660-a589-47a66e6a22ef (accessed on 8 August 2025).
  19. März, M. Thermisches Management in der Leistungselektronik. 2022. Available online: https://www.researchgate.net/profile/Martin-Maerz/publication/324227497_Thermisches_Management_in_der_Leistungselektronik_-_Lecture_Notes/links/62651f281b747d19c2a33357/Thermisches-Management-in-der-Leistungselektronik-Lecture-Notes.pdf (accessed on 8 August 2025).
  20. Calcutt, V. Copper Develpment Association Inc. 2001. Available online: https://www.copper.org/publications/newsletters/innovations/2001/08/intro_fac.html#:~:text=Thermal%20conductivity%20at%2020%C2%B0C%20W%2Fm%C2%B7K,397%20230 (accessed on 30 June 2025).
  21. Stanford Advanced Materials. 2025. Available online: https://www.samaterials.com/quartz-ingot.html#:~:text=Thermal%20Conductivity%20 (accessed on 30 June 2025).
  22. Netzsch Polymers. 2025. Available online: https://polymers.netzsch.com/Materials/Details/66#:~:text=Thermal%20Conductivity%200,26%20g%2Fcm%C2%B3 (accessed on 30 June 2025).
  23. Plesca, A. The influence of busbars connection on fuselink temperature at fast fuses. Electron. Energetics 2019, 32, 303–314. [Google Scholar] [CrossRef]
  24. Wang, J.; Xie, J.; Liu, Z.W.A.; Wang, W. Effects of Aging Temperature on the Mechanical Properties and Precipitation Behavior of a Pre-strained Al-Cu-Mg-Ag Alloy. Met. Mater. Int. 2023, 29, 293–302. [Google Scholar] [CrossRef]
  25. Lau, M.; Calzeda, K. Breaktor™ Battery Disconnect Unit Advanced Protection and Power Distribution for High Voltage Circuits in Electric Vehicles. In 22. Internationales Stuttgarter Symposium; Springer: Berlin/Heidelberg, Germany, 2022; pp. 195–206. [Google Scholar]
  26. Wunderle, B.; Michel, B. Progress in Reliability Research in Micro and Nano Region. Microelectron. Reliab. 2006, 46, 1685–1694. [Google Scholar] [CrossRef]
  27. CharIN. Recommendations and Requirements for MCS Related Standards Bodies and Solution Suppliers; CharIN: Berlin, Germany, 2024. [Google Scholar]
  28. Yaseen, W. Post-800V Electric Vehicles; LUT University: Lappeenranta, Finland, 2025. [Google Scholar]
Figure 1. Analogy between electrical and thermal behavior, showing how voltage corresponds to temperature, current to heat flow, resistance to thermal resistance, and capacitance to thermal capacitance as parts of each physical component.
Energies 18 05583 g001
Figure 2. Comparison between the Cauer and Foster thermal models. The Cauer model (left) represents physical layers through a ladder of thermal resistances and capacitances, while the Foster model (right) uses parallel RC branches to capture system time constants.
Energies 18 05583 g002
Figure 3. Several current pulses are applied during the test (left), and the cooling curve of the system is detected (right). The pulses reach the thermal power level Pth, resulting in a thermal response of the system from temperature T1 cooling down to T0 relevant for the thermal impedance calculation.
Energies 18 05583 g003
Figure 4. Experimental setup showing the Device Under Test (DUT) mounted between busbars, illustrating the test environment used for thermal and electrical measurements. The busbars are also the same components used in the HV battery system to connect the fuse to the periphery.
Energies 18 05583 g004
Figure 5. Thermal imaging of the fuse during operation with four measurement points (SP1–SP4) and corresponding temperature detection during the first cycle. The thermal image highlights localized heating, while the graph shows the temperature rise over time at each point.
Energies 18 05583 g005
Figure 6. Open fuse with a melted element after an accelerated life test, showing the thermal failure point where the conductor has blown. The applied current was far beyond the 100% current rating, as the current reached nearly 270 A. The test was conducted to observe the design border of the component and to investigate the weak spot of the design.
Energies 18 05583 g006
Figure 7. Geometrical properties of the thermal fuse model showing the fuse element, terminals, housing, and ambient temperature (1–8) as parts of the TEC within the defined heat flow paths Q ˙ .
Energies 18 05583 g007
Figure 8. Thermal equivalent circuit model of the melting fuse, representing heat generation from electrical power input conduction through thermal resistances, storage in thermal capacitances, and dissipation to the ambient via convection paths.
Energies 18 05583 g008
Figure 9. Proportion of surface-related thermal resistance for each material layer in the fuse model. The copper element contributes minimally while quartz sand and the fuse case dominate the overall thermal resistance, highlighting the insulating role of the surrounding materials.
Energies 18 05583 g009
Figure 10. Stationary thermal behavior of the fuse comparing simulated and measured temperature profiles at 150 A, 200 A, and 240 A. The results show good agreement across the copper element, quartz sand, and fuse case, validating the accuracy of the thermal model under different load conditions.
Energies 18 05583 g010
Figure 11. Dynamic thermal behavior of the fuse compares the simulated and measured temperature values of the fuse terminal under multiple load conditions defined at current levels of 150 A, 200 A, and 240 A.
Energies 18 05583 g011
Figure 12. Dynamic thermal behavior of the fuse compares the simulated and measured temperature values of the fuse case elements under multiple load conditions defined at current levels of 150 A, 200 A, and 240 A.
Energies 18 05583 g012
Figure 13. Dynamic thermal behavior of the fuse compares the simulated and measured temperature values of the fuse copper elements under multiple load conditions defined at current levels of 150 A, 200 A, and 240 A.
Energies 18 05583 g013
Figure 14. Comparison of standard and fast charging profiles (top) and the corresponding thermal step response of the fuse (bottom). The fast-charging profile delivers more energy within the same time window (276 kWh vs. 240 kWh in 90 min), resulting in a higher thermal load on the fuse compared to the standard profile.
Energies 18 05583 g014
Figure 15. Charging current profile (top) and corresponding fuse temperature response (bottom). The stepwise reduction in charging current leads to distinct thermal transients, with different temperature deltas.
Energies 18 05583 g015
Table 1. The relationship between thermal and electrical parameters [12].
Electrical ParametersThermal Parameters
Voltage U [V]Temperature T [°C or K]
Current I [A]Heat flow rate Q ˙ [W]
Electrical charge Q [As]Heat capacity [J/K]
Electrical resistance R [Ω]Thermal resistance R [K/W]
Electrical capacitance C [F]Thermal capacitance C [Ws/K]
Current density J [A/m2]Heat flux rate [W/m2]
Table 2. Material properties of each section.
Copper [21]Quartz Sand [22]Unsaturated Polyester [23]
Thermal Conductivity Λ [W/M·K]39110.2
Specific Heat Capacitance C [J/(G·K]0.38511.2
Material Density Ρ [G/CM3]8.921.71.1
Table 3. Thermal RC values of the Cauer network for the horizontal path, listing resistances, capacitances, and corresponding time constants for each section.
Thermal Resistance [K/W]Thermal Capacitance [J/K]Time Constant Tau
SECTION 10.615410.008470.00521
SECTION 20.079310.073400.00521
SECTION 39.2690011.30200104.654
SECTION 45.158.25342.504
SECTION 55000
Table 4. Thermal RC values of the Cauer network for the vertical path, listing resistances, capacitances, and corresponding time constants for each section.
Thermal Resistance [K/W]Thermal Capacitance [J/K]Time Constant Τau
SECTION 60.083.2260.2576
SECTION 71.846.6712.273
SECTION 85000
Disclaimer/Publisher’s Note: The statements, opinions and data contained in all publications are solely those of the individual author(s) and contributor(s) and not of MDPI and/or the editor(s). MDPI and/or the editor(s) disclaim responsibility for any injury to people or property resulting from any ideas, methods, instructions or products referred to in the content.