Abstract
Deep-Cycle Lead-Acid Batteries (DCLA) are widely known in stationary applications such as backup power and off-grid systems. However, their faster capacity decline compared to emerging batteries limits their efficiency and lifespan. This research investigates the potential of ultrasonication to enhance the performance of DCLA by reducing sulfation and internal resistance, thereby improving capacity retention and state of health (SOH). A system-level MATLAB/Simulink model was created to simulate a photovoltaic (PV) system under three load conditions: constant, variable, and realistic load. An ultrasonic device operating at 1700 kHz was implemented during the charging phase, and simulations were conducted to evaluate systems before and after ultrasonication. State of charge (SoC) and battery voltage were performance measures over 31 days. The results showed that the ultrasonication system maintained an average SoC up to twice that of the control system (78.8% vs. 37.9%) and sustained a higher average voltage (13.2 V vs. 12.6 V). Under realistic light-load conditions, the test system retained energy better and had a 38.37% percentage improvement. These findings indicate that ultrasonic integration is a viable retrofitting strategy to improve DCLA operation, particularly for off-grid and renewable energy storage applications.
1. Introduction
Deep-cycle lead-acid (DCLA) batteries continue to play a central role in stationary energy storage. They are widely used for backup power in critical facilities such as telecommunication hubs and data centers [1,2], and they remain indispensable in off-grid solar systems that supply affordable electricity to rural and remote communities [3,4]. Their resilience in the market is largely due to two factors: cost and recyclability. Compared to newer chemistries, DCLAs are inexpensive, and they benefit from a recycling chain that has been refined over decades. As much as 80% of their components—lead, plastics, and electrolytes—can be recovered and reused, making them one of the most circular and sustainable battery technologies available today [5,6,7]. This strong recycling loop further supports their role in sustainable energy practices [8].
Yet, this long-standing reliability comes with trade-offs. DCLAs degrade faster than newer batteries, losing capacity with each cycle [9]. The main causes are sulfation, corrosion, and a gradual increase in internal resistance [10]. Among these, sulfation is the most critical: it produces hard crystals on the plates that reduce active material and accelerate irreversible capacity loss [11]. By contrast, lithium-ion and sodium-ion batteries offer higher energy density and a much longer service life [12,13]. Even so, their adoption remains constrained by higher upfront costs, limited recycling systems, and dependence on critical raw materials [6,14]. For many off-grid settings, where cost and recycling matter as much as performance, extending the usable life of lead-acid batteries remains a practical and cost-effective path.
One way to tackle these limitations—without replacing existing DCLA infrastructure—is through ultrasonic excitation. Prior studies suggest that ultrasonic waves can improve electrolyte mixing, slow the buildup of sulfates, and reduce internal resistance, allowing batteries to hold their charge more effectively [15,16]. Similar benefits have been reported in other electrochemical systems [17], but their specific potential for DCLAs operating under realistic photovoltaic (PV) conditions has not been fully explored.
To address this gap, the present study develops a system-level MATLAB/Simulink model to evaluate the effect of ultrasonic excitation on DCLA batteries in standalone PV systems. This work contributes in several ways:
- A developed mathematical model that captures the effect of ultrasonic waves on the lifecycle of DCLA batteries, addressing a critical gap in existing battery research using MATLAB Simulink.
- A comparative evaluation of battery efficiency, capacity retention, and service life under scenarios with and without ultrasonic excitation, providing quantitative insights into performance differences.
- It explores ultrasonic excitation as a potential retrofit strategy to enhance durability and energy efficiency, particularly in off-grid PV systems where lead-acid batteries remain widely used.
By testing these contributions, this study highlights ultrasonics as a potential bridge technology—one that strengthens the performance of existing lead-acid systems.
2. Purpose/Problem Description
2.1. Problem Context
Deep-Cycle Lead-Acid Batteries (DCLA) are widely known in stationary applications such as backup power and off-grid systems. However, these batteries tend to suffer from degraded performance over time caused by sulfation, internal resistance accumulation, and other factors, particularly under different load conditions. This degradation causes their degradation and retarded capacity, and shortens their life [9,10].
2.2. Research Gap and Study Objectives
While the use of ultrasonic waves has been found to enhance the performance of other battery types, the behavior of DCLA batteries under acoustic waves, especially for use in PV applications, has yet to be investigated [15,16].
This study aims to address that gap by assessing the possible advantages of ultrasonic waves in DCLA battery performance in the context of real-time PV system deployment, offering perspectives for enhanced efficiency and durability of off-grid energy storage systems. The purpose of the present study is to investigate the effect of ultrasonic acoustic waves on the performance and charging characteristics of Deep-Cycle Lead Acid (DCLA) batteries of two independent Photovoltaic (PV) systems under different loads. In this research, a system-level simulation is performed to explore the effect of ultrasonic waves on the battery performance.
2.3. System Designs
PV systems can be designed as standalone or grid-connected systems [18]. Standalone photovoltaic (PV) systems refer to off-grid systems that generate electricity from solar panels and store it in batteries for later use [19]. To simulate a conventional off-grid system, the system should consist of a PV array, a DC-DC converter, a solar charge controller, and a lead-acid battery [20,21,22].
2.3.1. Modified Standalone Photovoltaic (PV) System
The modified standalone photovoltaic system is based on a conventional off-grid solar system enhanced by the integration of an ultrasonic device connected to the lead-acid battery, as shown in Figure 1.
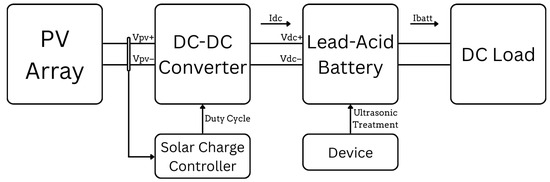
Figure 1.
Photovoltaic System with Ultrasonic Device.
The PV system’s main basic component is the solar cell. The current-voltage (I-V) characteristics of a PV module are characterized and can be expressed by:
corresponds to the solar cell’s voltage output, to the solar cell’s current output, to the series resistance of the cell, and to the shunt resistance of the cell. In addition, q is the charge of electrons, is the light-generated current, and is the reverse saturation current, is a dimensionless junction material factor, is the Boltzmann constant, is the temperature, and and are the number of parallel and series connected cells, respectively [23].
2.3.2. Charge Controller
Implements Maximum Power Point Tracking (MPPT) while implementing transition logic, mathematically modeled using thresholds:
where corresponds to the Maximum Power Point Tracking mode, corresponds to Boost mode, and corresponds to the Float mode.
2.3.3. DC-DC Converter
A DC-DC converter regulates the PV output voltage to match the battery voltage. Assuming an ideal converter, the duty cycle can be obtained by:
where is the lead-acid battery’s current, is the solar cell’s current output, and is the duty cycle.
2.3.4. Ultrasonic Device
Recent studies have identified the application of ultrasound from piezoelectric transducers as a method for dislodging sulfate crystals in battery plates through physical agitation [24]. This ultrasonic effect primarily involves the formation of cavitation bubbles and solid turbulence induced by acoustic wave vibrations [25].
The ultrasonic device was introduced into the simulation as an external sinusoidal excitation, representing an ultrasonic transducer operating at 1700 kHz. This was applied during the charging phase to simulate agitation within the electrolyte, aiming to disrupt the formation of large lead sulfate crystals and enhance ion mobility. The influence of acoustic excitation was indirectly modeled by adjusting the charge transfer resistance and double layer capacitance in response to ultrasonic activation. These modifications were based on performance gains reported in experimental studies on acoustic wave treatments in electrochemical systems [26].
The ultrasonic device influences the electrochemical and physical state of the lead-acid battery by agitating the electrolytes, which disrupts sulfate crystal buildup on the battery plates while enhancing ion transfer. Hence, the sulfate crystal buildup can be expressed by:
where corresponds to the sulfation level, is the sulfation rate, is the discharge current, is the natural desulfation rate, is the ultrasonic activation signal (1 = ON, 0 = OFF), and is the additional desulfation rate due to ultrasonic treatment.
where is the internal resistance of the lead-acid battery, is the base resistance, and is the resistance gain per unit of sulfation.
2.3.5. Lead-Acid Battery
The Simulink battery block implements a generic battery model for the most popular battery types. The lead-acid battery’s terminal voltage can be expressed as follows:
corresponds to the lead-acid battery’s terminal voltage, to the lead-acid battery’s current, to the lead-acid battery’s internal resistance, and is the open circuit voltage.
2.3.6. DC Load
The load current affects the charge/discharge rate of the battery and the overall power balance of the system. The load current can be obtained by:
3. Methodology
3.1. Simulation Procedure of the PV System
The simulation of the PV system model was implemented in MATLAB/Simulink (version R2025a, MathWorks Inc., Natick, MA USA). The simulated system, illustrated in Figure 2, consists of one setup with an ultrasonic device and both setups with a photovoltaic (PV) array, a solar charge controller, a DC-DC converter, a lead-acid battery, and a DC load with varying load demands. The solar irradiance input, as shown in Figure 3, is modeled after the environmental data of May 2025 obtained via the Open-Meteo Satellite Radiation API, a publicly accessible web-based API that provides weather and climate variables derived from satellite and model-based sources [27]. Additional parameters of the system components are presented in Table 1.
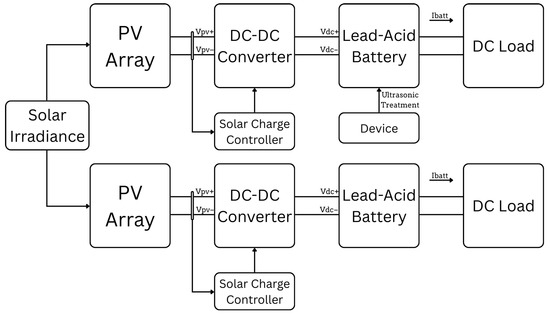
Figure 2.
Equivalent Model of the modified and conventional PV system.
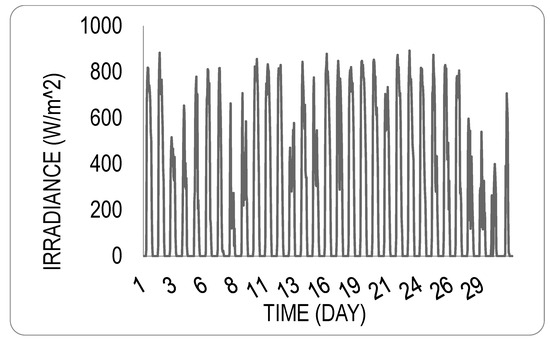
Figure 3.
Solar Irradiance Profile of May 2025 [27].

Table 1.
Simulation Parameters.
Six scenarios were simulated within the Simulink model to evaluate the performance of the modified standalone photovoltaic system. These scenarios were designed to represent off-grid consumption patterns. Figure 4 shows the varying load demands to be simulated for 31 days.
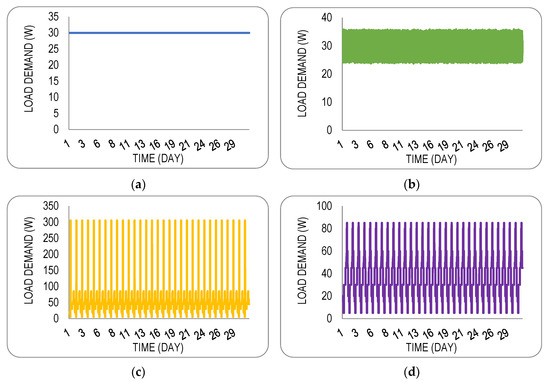
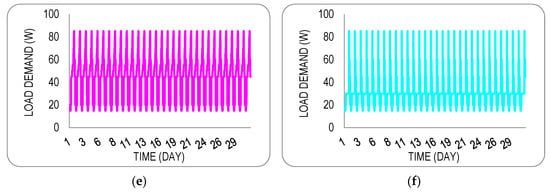
Figure 4.
Varying Load Demand. (a) Constant Load of 30 W; (b) Uniform Random Load between 24 W and 36 W; (c) Estimated Household DC Load with Sudden Load Spikes; (d) Estimated Household DC Load Profile without Sudden Load Spikes; (e) Estimated Household DC Load Profile with Gradual Load Increase; (f) Estimated Intermittent Household DC Load Profile.
3.1.1. Constant Load
In this baseline scenario, a constant DC load of 30 watts was applied to represent a stable and predictable power demand. This setup simulates applications such as low-power lighting systems.
3.1.2. Uniform Random Load
This scenario introduces variability within the system by applying a uniformly random load fluctuating between 24 watts and 36 watts. This setup is designed to emulate more realistic and unpredictable behavior in low-power lighting system applications.
3.1.3. Estimated Household DC Load Profile with Sudden Load Spikes
This scenario integrates a realistic DC load profile derived from typical light usage of appliances in households, aligned with the implementation of a 12 V 100 Ah lead-acid battery in the simulation. The profile incorporates constant daily activities corresponding to common usage of appliances while having sudden load spikes due to certain appliance usage to represent common energy consumption patterns. This scenario provides insight into the long-term performance of the modified standalone photovoltaic system that closely resembles real-world usage within the battery’s discharge limitations.
3.1.4. Estimated Household DC Load Profile Without Sudden Load Spikes
In this scenario, the estimated household DC load profile was modified to eliminate abrupt load surges. The load varies smoothly within typical household consumption levels, representing a more stable energy consumption pattern. This approach reflects conditions where the usage of appliances is limited due to energy conservation, enabling an evaluation of the system’s performance under predictable but still realistic load conditions.
3.1.5. Estimated Household DC Load Profile with Gradual Load Increase
This scenario models a progressive rise in household demand over time, which simulates situations where appliances are sequentially turned on throughout the day. The load profile starts at a low baseline and increases steadily until it reaches its peak demand. This setup provides insight into how the system and the DCLA battery respond to incremental stress and prolonged operation under increasing energy consumption.
3.1.6. Estimated Intermittent Household DC Load Profile
This scenario reflects the daily energy consumption of a working household. During daytime hours, the primary load is the refrigerator, which maintains a relatively constant baseline demand. In the evening, when occupants return home, additional appliances are switched on, causing a noticeable increase in power consumption. This load profile, therefore, alternates between low daytime consumption and higher evening peaks, creating an intermittent pattern of load demand. This setup provides insight into how the system performs under real-world household conditions where usage is highly dependent on occupancy and daily routines.
3.2. Experimental Data Collection (Microgrid Measurements)
Microgrid operating data were collected with an SRNE solar station monitor, set to record values every five minutes. The system measured the three main parts of the standalone PV setup. For the PV array, it logged current, voltage, and power. For the battery, it tracked voltage, temperature, current, and the state of charge (SoC). For the load, it monitored current, voltage, and power. The monitor also stored information on the system’s working state, the total charge and discharge in ampere-hours (Ah), and the energy output in kilowatt-hours (kWh). This information gave a continuous picture of how the system behaved throughout the day.
The dataset served two key purposes. First, it allowed us to observe how the battery behaved under real operating conditions, both modified and conventional setups. In both cases, the systems were operated at the same site and subjected to identical load conditions, so that any differences in performance could be attributed to the ultrasonic intervention rather than external factors. Second, the measurements provided the basis for building and validating the simulation model. Because deep-cycle lead-acid (DCLA) batteries typically require hundreds of charge–discharge cycles to reach end-of-life, long-term testing is impractical within the timeframe of this study. Using the collected data made it possible to model and predict battery behavior across its useful life without waiting for a physical unit to degrade fully in real-time experiments.
3.3. DC House Set-Up for DCLA Battery Testing
The experimental work was carried out using a DC House system designed to represent a small standalone photovoltaic installation (see Figure 5). To make the comparison fair, both the conventional setup and the modified setup were built with the same core components: 1000 W of PV panels, an SRNE charge controller, and a set of equal DC loads. Each system used a 12 V, 100 Ah deep-cycle lead-acid (DCLA) battery as the storage unit.
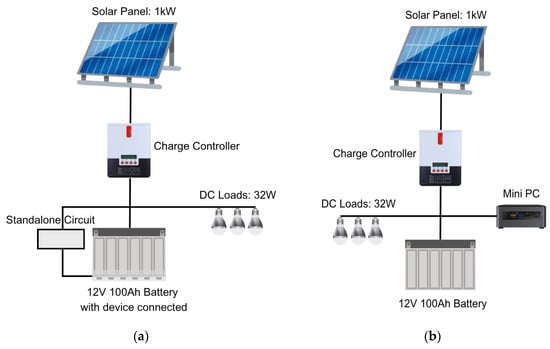
Figure 5.
Comparison of solar-powered systems with different device integrations. (a) Standalone circuit integrated with a 12 V 100 Ah battery for direct device connection. (b) Mini PC integrated system powered by a 12 V 100 Ah battery. Both setups use a 1 kW solar panel and 32 W DC loads, managed by a charge controller.
The difference between the two systems lies in the addition of an ultrasonic device. In the modified setup, a custom-built ultrasonication device operating at 1700 kHz was installed on the battery. This device was programmed to run only during the charging phase, so that the ultrasonic excitation would directly influence the processes linked to sulfation and resistance buildup. The conventional setup ran under the same conditions but without the ultrasonic module, serving as the baseline for comparison.
During testing, the systems were monitored for voltage, current, and state of charge (SoC), which were logged every five minutes using the same monitoring system described in Section 3.2. Both setups were operated for 31 days, at the same site and under identical load conditions, so that any differences in behavior could be attributed to the ultrasonic modification rather than changes in load or environment.
3.4. Evaluation and Verification Process
The accuracy of the simulation model was verified by comparing its outputs with experimental data obtained from the DC House setup described in Section 3.3. This validation step ensured that the MATLAB/Simulink model reliably represented the behavior of both the control and ultrasonic-assisted DCLA battery systems.
Three indicators were selected as validation benchmarks: state of charge (SoC), terminal voltage, and a composite performance score that integrated efficiency, stability, and overall energy delivery. To capture long-term behavior, the Area Under the Curve (AUC) method was also applied. The following equations can express the calculations:
where is the composite performance score per day, is the daily average state of charge, and is the daily average battery voltage.
where is the daily percentage improvement per scenario, is the daily performance score of the test system, and is the daily performance score of the control system.
where is the performance score at time , is the initial performance score at time , is the decay rate constant, and is the time.
In practice, SoC quantified the usable battery capacity, voltage stability reflected resistance buildup and sulfation, and the composite score provided an integrated measure of daily performance. The AUC method complemented these by showing cumulative capacity retention trends.
4. Results and Discussion
4.1. Results
This study compared the performance of the modified PV system or test system, and the conventional PV system or control system on the six load demand scenarios. The comparative data from the scenarios reveal consistent trends and behaviors of both systems.
Figure 6 provides a visual representation of the lead-acid battery’s state of charge (SoC) comparison for both systems. The data depicted in the figures clearly indicates that the test system is consistently maintaining a higher SoC or comparable performance level relative to the control system throughout the six scenarios.
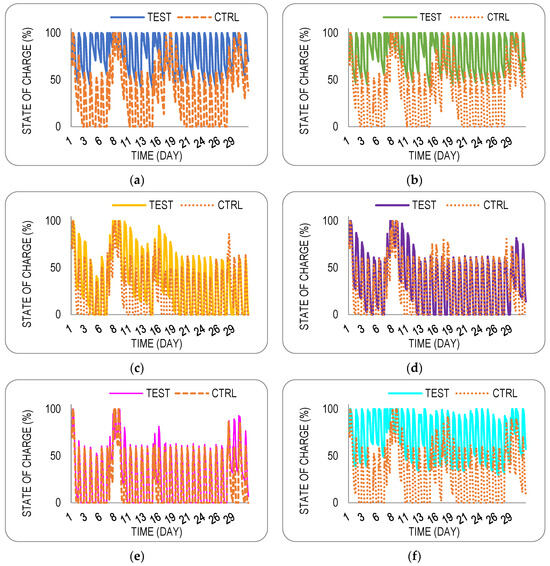
Figure 6.
Lead-acid Battery State of Charge. (a) Constant Load of 30 W; (b) Uniform Random Load between 24 W and 36 W; (c) Estimated Household DC Load with Sudden Load Spikes; (d) Estimated Household DC Load Profile without Sudden Load Spikes; (e) Estimated Household DC Load Profile with Gradual Load Increase; (f) Estimated Intermittent Household DC Load Profile.
The summary of the data for the state of charge is presented in Table 2. In scenario 1, the SoC of the test system ranges from 100% to 41.8%, averaging 78.5% while the control system has a range of 100% to 0% which averages 37.4% throughout the 31 days. On the other hand, in scenario 2, the SoC of the test system ranges from 100% to 42.7%, averaging 78.8% while the control system ranges from 100% to 0% with an average of 37.9%. In scenarios 3–6, the test and control systems have both 100% to 0% range, while the test system averages 38.0%, 36.3%, 30.2%, 71.0%, and the control system averages 24.6%, 28.6%, 22.2%, and 33.2%.
Table 2.
Data Summary for SoC.
The comparison of both battery voltages obtained in the simulations is presented in Figure 7. The data depicted in the figures clearly indicates that the test system consistently maintains a higher voltage, remaining above 12.3 V in scenarios 1 and 2, while both the control and test systems experienced voltage declines in scenario 3.
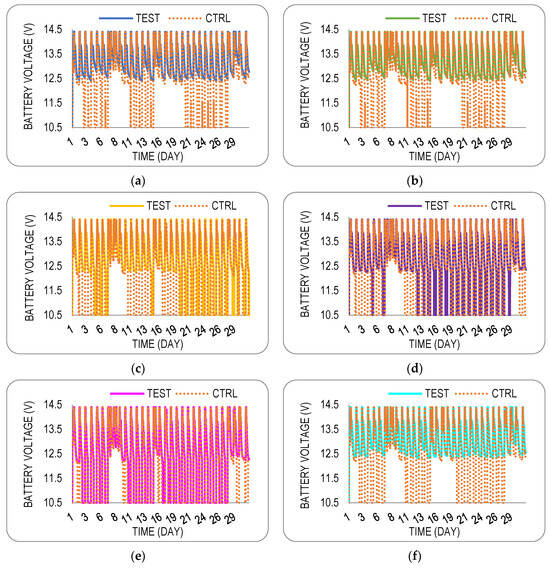
Figure 7.
Lead-acid Battery Voltage. (a) Constant Load of 30 W; (b) Uniform Random Load between 24 W and 36 W; (c) Estimated Household DC Load with Sudden Load Spikes; (d) Estimated Household DC Load Profile without Sudden Load Spikes; (e) Estimated Household DC Load Profile with Gradual Load Increase; (f) Estimated Intermittent Household DC Load Profile.
The summary of the data for the battery voltage is presented in Table 3. In scenario 1, the test system has a range of 14.4 V to 12.4 V with an average of 13.2 V, while the control system has a full range of 14.4 V to 10.5 V with an average of 12.6 V. On the other hand, scenario 2 has the test system’s range of 14.4 V to 12.4 V with an average of 13.2 V, while the control system also has a full range of 14.4 V to 10.5 V with an average of 12.6 V. In scenarios 3, 4, 5, both the test and control systems have a full range of 14.4 V to 10.5 V, while the test system averages 12.7 V, 12.7 V, and 12.3 V, and the control system averages 12.1 V, 12.3 V, and 12.0 V. Lastly, scenario 6 has the test system a range of 14.4 V to 12.3 V with an average of 13.1 V, while the control system has a full range of 14.4 V to 10.5 V with an average of 12.5 V.
Table 3.
Data Summary for Battery Voltage.
4.2. Evaluation and Verification
The comparative analysis between the ultrasonic-assisted test system and the conventional control system revealed consistent performance advantages across all scenarios. The test system generally retained a higher state of charge (SoC) and exhibited improved voltage stability, demonstrating that ultrasonic excitation produced measurable gains in battery behavior.
Daily performance improvements, summarized in Table 4, exceeded 390% under steady-load conditions, while dynamic scenarios showed smaller but steady gains. For example, Scenario 3 produced daily peaks of 259.81%, though its variable load profile occasionally caused regressions. These variations are shown in Figure 8.
Table 4.
Daily percentage improvement in the ultrasonic-assisted system compared to the control across all scenarios.
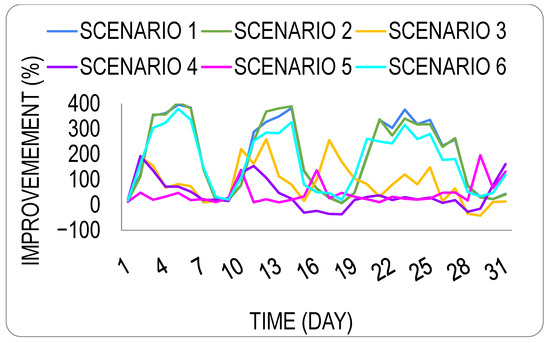
Figure 8.
Daily variation in performance improvements across scenarios.
Long-term performance was evaluated using the accumulated performance score defined in Equation (10). The results in Table 5 indicate that the ultrasonic system consistently outperformed the control, with improvements ranging from 29.32% (Scenario 4) to 124.53% (Scenario 6). Experimental validation from the DC House microgrid confirmed these improvements, recording a 49.30% gain. The projected degradation trends over a five-year horizon, illustrated in Figure 9, further demonstrate that the ultrasonic system sustained higher performance levels compared to the control.
Table 5.
Data Summary for Forecasted Accumulated Performance Score.
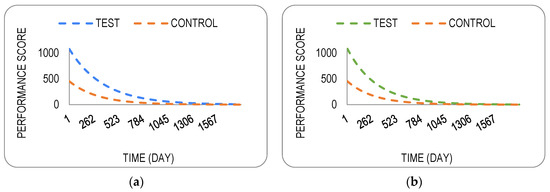
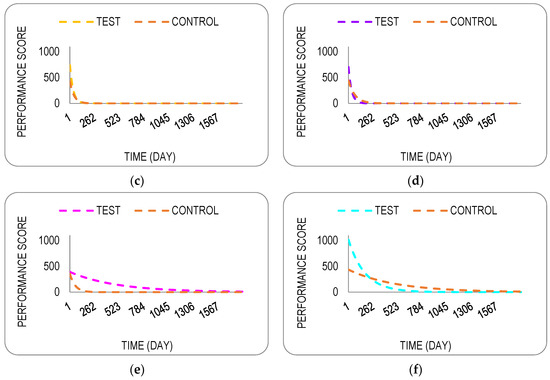
Figure 9.
5-Year Battery Degradation Forecast. (a) Constant Load of 30 W; (b) Uniform Random Load between 24 W and 36 W; (c) Estimated Household DC Load with Sudden Load Spikes; (d) Estimated Household DC Load Profile without Sudden Load Spikes; (e) Estimated Household DC Load Profile with Gradual Load Increase; (f) Estimated Intermittent Household DC Load Profile.
Verification against experimental data is presented in Table 6. Static load scenarios (Scenarios 1, 2, and 6) produced larger errors (>140%), reflecting the limitations of static assumptions. In contrast, dynamic load scenarios (Scenarios 3 and 5) more closely matched the experimental benchmark, with errors as low as 22%. The degradation behavior observed in the DC House measurements, shown in Figure 10, confirmed that ultrasonic excitation consistently slowed the rate of decline.
Table 6.
Data Summary for Percentage Error.
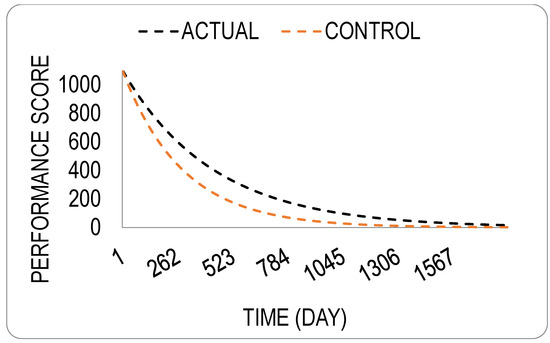
Figure 10.
5-Year Battery Degradation Forecast of Actual Data.
The evaluation confirmed that the simulation framework effectively captured the beneficial effects of ultrasonic excitation. Improvements in SoC retention, voltage stability, and degradation rate observed in simulations were consistent with experimental results. These findings demonstrate trend agreement and proof of concept, rather than exact predictions of battery lifetime. Although static load scenarios tended to overestimate improvements, dynamic cases showed strong alignment with experimental behavior, supporting the reliability of the model as a validation tool. Within the limits of parameter constraints, the results establish a sound foundation for future refinement and predictive studies.
4.3. Discussion
The results in Figure 6 and Figure 7 highlight the significant advantage of the test system in maintaining higher SoC and voltage levels throughout the scenarios.
The comparison of the battery SoC between the test and control systems across the six scenarios reveals clear trends favoring the test system; on the other hand, the control system shows how quickly the SoC drops. Specifically, in Table 2, scenario 1, the test system shows an average SoC of 78.5%, while the control system averages only 37.4%, a significant difference of over 40%. In scenario 2, the average SoC of the test system, 78.8% is similarly much higher than the control system 37.9%. In scenario 3–6, while the SoC for both systems drops to 0%, the test system still maintains a higher average SoC, 38.0%, 36.3%, 30.2%, and 71.0% compared to the control system’s average SoC, 24.6%, 28.6%, 22.2%, and 33.2%.
The integration of the ultrasonic device highlights the improved energy retention capability of the test system. Previous research has suggested that ultrasonication improves overall battery performance by introducing electrolyte agitation, which can reduce the internal resistance and increase the effective surface area of the electrodes [16,17,29,30]. The formation of lead sulfate uses sulfate from the sulfuric acid electrolyte surrounding the battery. As a result, the electrolyte becomes less concentrated, which permanently reduces battery capacity [31]. The higher SoC in the test system across all scenarios suggests that the ultrasonic device contributes to maintaining a more consistent charge, eventually improving the performance of the battery.
Battery voltage is another factor in evaluating the performance of the PV system. As illustrated in Figure 7, the test system maintains consistently a higher battery voltage than the control system. In Table 3, scenario 1, the test system has an average of 13.2 V while the control system has an average of 12.6 V. Similarly, in scenario 2, the test system has an average of 13.2 V while the control system has an average of 12.6 V. In scenario 3, the test system has an average of 12.7 V while the control system has an average of 12.1 V. In scenario 4, the test system has an average of 12.7 V while the control system has an average of 12.3 V. In scenario 5, the test system has an average of 12.3 V while the control system has an average of 12.0 V. Lastly, in scenario 6, the test system has an average of 13.1 V while the control system has an average of 12.5 V. These may suggest that the battery was operating at a relatively higher SoC, aligning with the results shown in the SoC plots.
In contrast, under scenarios 3–6, both the control and test systems resulted in voltage decline, which eventually reached the cutoff voltage for a lead-acid battery. However, the control system reached this critical voltage faster than the test system, indicating that the test system provided better battery performance.
The maintenance of higher battery voltages in the test system suggests a more stable and efficient energy storage process. This stability is crucial during times of high energy demand or when the energy from the PV array is lower, such as during the idle mode. Previous studies have shown that improved voltage stability in batteries results in fewer charge–discharge cycles and, consequently, a longer battery life [32,33].
The data summary in Table 4 highlights that in scenarios 1 and 2, the test system demonstrates consistent superiority, with improvements peaking at 395% and 405%, respectively. In scenario 3, improvements are more irregular, with a notable maximum of 259% including negative values toward the end of the cycles. For scenarios 4 and 5, the improvement trend is less stable, with moderate gains but also multiple days of negative improvement. Meanwhile, scenario 6 shows the most balanced result, while sustaining improvement above 300%. This study incorporates both optimized and realistic load scenarios to evaluate system performance comprehensively [34].
The results presented in Table 5 indicate that the test system significantly reduces long-term degradation in comparison with the control system, specifically in scenario 1 with 121.12% improvement, in scenario 2 with 119.42% improvement, in scenario 3 with 61.87% improvement, in scenario 4 with 29.32% improvement, in scenario 5 with 38.37% improvement, in scenario 6 with 124.53% improvement, and in the actual data with 49.30% improvement. These degradation models, fitted using the exponential decay function, align closely with established modeling practices in lead-acid battery systems [35]. Literature pointed out that ultrasonication reduces the sulfation and internal resistance while improving electrolyte mixing, which directly correlates with the enhanced SoC and voltage stability observed in this study [15,16]. This consistency with the results data, between simulated results and prior experimental findings, strengthens the validity of the model and confirms the reliability of the observed improvements.
The results in Table 6 demonstrate that simulation accuracy is highly dependent on the load profile considered. Scenario 1 produced a relative error of 145.68%, indicating that static demand assumptions significantly overestimate system performance. Similarly, scenario 2 showed a high error of 142.23%, suggesting that unstructured fluctuations are insufficient to reflect actual consumption patterns. By contrast, scenarios 3 and 5 yielded the lowest errors at 25.50% and 22.17%, respectively. These results highlight the value of incorporating realistic peak and off-peak demand variations. Scenario 4 resulted in a moderate error of 40.53%, demonstrating that smoothed demand profiles, while predictable, underrepresent the abrupt load changes. Lastly, scenario 6 produced the highest error of 152.60%, reflecting the difficulty of accurately modeling occupancy-driven load demand consumption patterns.
4.4. Practical Implications
The results not only highlight comparative trends but also suggest a number of technical points worth considering for both validation and application. The static load simulations helped to show relative improvements with ultrasonic excitation, although they only capture part of the picture. Real PV systems rarely operate in neat, predictable ways; their loads are dynamic and can shift unexpectedly. For that reason, the simulations should be taken as proof of concept, useful for direction but not for full-scale prediction. The DC House experiments in Section 3 moved in the same direction, showing improvements in state of charge and voltage, but not at the same scale. This difference underlines the need to keep refining the model against experimental evidence. From an application angle, the results imply that ultrasonic excitation could be added to existing DCLA systems as a retrofit rather than a full redesign, which may be appealing for off-grid settings. At the same time, whether this becomes practical will still depend on factors like cost, how durable the devices are, and how smoothly they can be built into PV–battery systems. These are questions for future work to explore more fully.
5. Conclusions
As demonstrated in this study, adding an ultrasonic device to a standalone photovoltaic (PV) system improved the performance of deep-cycle lead-acid (DCLA) batteries. Across the different demand scenarios, the system with ultrasonic assistance consistently held a higher state of charge (SoC) and showed more stable voltage compared with the control. Under constant and variable loads, for instance, the ultrasonic setup averaged 78.8% SoC—more than double the control’s 37.9%—and sustained a voltage of 13.2 V compared to 12.6 V. Even with the most demanding household load, the system still performed 29.32% better. These outcomes suggest that ultrasonic excitation can slow sulfation and resistance buildup, leading to stronger energy retention and more stable operation.
From a technical point of view, this means ultrasonics can boost charge–discharge efficiency, lengthen service life, and make DCLA batteries more reliable. In off-grid PV systems, where storage is critical, these gains could help keep lead-acid technology relevant. There are also broader benefits: batteries that last longer mean fewer replacements and less waste, while lead-acid already has an established recycling chain. Nevertheless, it is important to recognize the limitations of this approach. Newer chemistries like lithium-ion and sodium-ion remain superior in terms of energy density and cycle life. Lithium-ion, for example, typically delivers 150–250 Wh/kg, compared with only 30–50 Wh/kg for lead-acid [36], and its longer cycle life often makes it more cost-effective over time [37]. But their higher upfront costs and uneven availability limit their use in many off-grid settings. In such contexts, ultrasonic retrofits will not erase the gap, but they can narrow it, offering a practical way to extend the usefulness of lead-acid where advanced chemistries are still out of reach.
This work established a proof of concept by combining simulation and experimental benchmarking. The results showed clear agreement in trends between the MATLAB/Simulink model and the DC House experiments, particularly under dynamic load conditions. At the same time, this study has limitations: the simulations relied on averaged inputs and static load profiles, which made it easier to highlight relative improvements but did not reflect the variability in actual household PV demand. This explains why static cases sometimes overstated performance, while dynamic cases came much closer, with errors as low as 22%.
Looking forward, the next steps should include testing with dynamic and seasonal load profiles, refining the simulation parameters, and extending the trials to longer periods. Comparisons with lithium-ion and sodium-ion systems will also be needed to better understand whether ultrasonic-enhanced lead-acid batteries are mainly a transitional option or a practical bridge technology for off-grid energy systems.
Overall, this study provides encouraging evidence that ultrasonic excitation can improve both the performance and the usable life of DCLA batteries. By showing agreement between modeled and experimental trends, it lays the groundwork for future research and for the practical use of ultrasonic desulfation as a tool to improve battery reliability in renewable energy applications.
Author Contributions
Conceptualization, N.R.A.P. and G.F.D.G.A.; methodology, N.R.A.P.; software, N.R.A.P.; validation, A.A.A.; formal analysis, A.A.A., N.R.A.P. and G.F.D.G.A.; investigation, A.A.A. and N.R.A.P.; resources, A.A.A.; data curation, A.A.A.; writing—original draft preparation, A.A.A. and N.R.A.P.; writing—review and editing, A.A.A., N.R.A.P. and G.F.D.G.A.; visualization, N.R.A.P.; supervision, G.F.D.G.A.; project administration, G.F.D.G.A.; funding acquisition, G.F.D.G.A. All authors have read and agreed to the published version of the manuscript.
Funding
This research and APC were funded by the Department of Science and Technology Grants in Aid (DOST-GIA), grant number 10047 under the Accelerated R&D Program for Capacity Building of Research and Development Institutions and Industrial Competitiveness: Niche Centers in the Region for R&D (NICER): R&D Center for Advanced Batteries.
Data Availability Statement
The data presented in this study are available on request from the corresponding author. The data are not publicly available due to privacy issues.
Acknowledgments
The authors acknowledge the funding support from the DOST’s Science for Change Program under the Niche Centers for R&D in the Regions (NICER) Program. The authors also extend appreciation to the Technological Institute of the Philippines (T.I.P.) and Aboitiz Power for its support of this research endeavor. The authors would also like to thank the editors and reviewers for their valuable insight and suggestions on this paper. During the preparation of this work, after completing a draft manuscript, the author(s) used ChatGPT-4.5 and Gemini 2.0 to refine and suggest alternative wording for certain sentences. Some suggestions were incorporated, others were not. All analysis and results presented in this manuscript are solely the author(s)’ own work. The author(s) take full responsibility for the content of the published article.
Conflicts of Interest
The authors declare no conflicts of interest.
References
- Skyllas-Kazacos, M. Electro-chemical energy storage technologies for wind energy systems. Stand-Alone Hybrid Wind. Energy Syst. 2010, 10, 323–365. [Google Scholar] [CrossRef]
- Byrne, R.H.; Nguyen, T.A.; Copp, D.A.; Chalamala, B.R.; Gyuk, I. Energy Management and Optimization Methods for Grid Energy Storage Systems. IEEE Access 2018, 6, 13231–13260. [Google Scholar] [CrossRef]
- Chua, K.H.; Lim, Y.S.; Morris, S. Peak Reduction for Commercial Buildings Using Energy Storage. IOP Conf. Ser. Earth Environ. Sci. 2017, 93, 012008. [Google Scholar] [CrossRef]
- Hau, L.C.; Lim, Y.S.; Chua, K.H. Active Control Strategy of Energy Storage System for Reducing Maximum Demand Charges under Limited Storage Capacity. J. Energy Eng. 2017, 143, 04017010. [Google Scholar] [CrossRef]
- Varshney, K.; Varshney, P.K.; Gautam, K.; Tanwar, M.; Chaudhary, M. Current trends and future perspectives in the recycling of spent lead acid batteries in India. Mater. Today Proc. 2020, 26, 592–602. [Google Scholar] [CrossRef]
- Sommerville, R.; Zhu, P.; Rajaeifar, M.A.; Heidrich, O.; Goodship, V.; Kendrick, E. A qualitative assessment of lithium-ion battery recycling processes. Resour. Conserv. Recycl. 2020, 161, 105219. [Google Scholar] [CrossRef]
- Jolly, R.; Rhin, C. The recycling of lead-acid batteries: Production of lead and polypropylene. J. Power Sources 1994, 54, 77–82. [Google Scholar] [CrossRef]
- Radja, K.; Selami, N.; Khadra, K.; Abdelkader, F.; Laid, G. Sustainable practices in lead acid battery recycling. Braz. Appl. Sci. Rev. 2025, 9, e76719. [Google Scholar] [CrossRef]
- Delgado-Sanchez, J.-M.; Lillo-Bravo, I. Influence of degradation processes in lead–acid batteries on the technoeconomic analysis of photovoltaic systems. Energies 2020, 13, 4075. [Google Scholar] [CrossRef]
- Spiers, D. Chapter IIB-2—Batteries in PV Systems. In Practical Handbook of Photovoltaics: Fundamentals and Applications, 2nd ed.; Elsevier: Amsterdam, The Netherlands, 2012; pp. 721–776. [Google Scholar] [CrossRef]
- Catherino, H.A.; Feres, F.F.; Trinidad, F. Sulfation in lead–acid batteries. J. Power Sources 2004, 129, 113–120. [Google Scholar] [CrossRef]
- Casey, A.J.; D’Arpino, M. Performance of Sodium-Ion and Lithium-Ion Batteries for Energy Storage System Applications. In Proceedings of the 2025 IEEE Electrical Energy Storage Applications and Technologies Conference (EESAT), Charlotte, NC, USA, 20–21 January 2025. [Google Scholar] [CrossRef]
- Wang, Y.; Yu, T.; Chen, J.; Gao, B.; Yu, M.; Zhu, J. Advances in safety of lithium-ion batteries for energy storage: Hazard characteristics and active suppression techniques. Energy Rev. 2025, 4, 100117. [Google Scholar] [CrossRef]
- Bullock, K.R. Lead-acid battery research and development—A vital key to winning new business. J. Power Sources 2003, 116, 8–13. [Google Scholar] [CrossRef]
- Deveau, J.; White, C.; Swan, L.G. Lead-acid battery response to various formation levels—Part A: Recommended formation levels for off-grid solar and conventional applications. Sustain. Energy Technol. Assess. 2015, 11, 1–10. [Google Scholar] [CrossRef]
- Naidenov, V.; Markov, U. Influence of ultrasonic waves on the formation of lead-acid batteries. J. Power Sources 2012, 217, 236–242. [Google Scholar] [CrossRef]
- El Filali, A.; Laadissi, E.M.; Khalfi, J.; Zazi, M. Lead-acid battery desulfation using a high-frequency pulse desulfator in standalone PV systems. Int. J. Appl. Power Eng. 2024, 13, 853–861. [Google Scholar] [CrossRef]
- Al Riza, D.F.; Gilani, S.I.U.H. Standalone photovoltaic system sizing using peak sun hour method and evaluation by TRNSYS simulation. Int. J. Renew. Energy Res. 2014, 4, 109–114. [Google Scholar]
- Habeeb, A.; Hizam, H.; Othman, M.L.; AbdulWahab, N.I.; Rohouma, W. Design Simulation and Performance Evaluation of a Standalone Photovoltaic System for a Health Care Facility in Malaysia. Energies 2023, 16, 5342. [Google Scholar] [CrossRef]
- Tan, R.H.G.; Er, C.K.; Solanki, S.G. Modeling of Photovoltaic MPPT Lead Acid Battery Charge Controller for Standalone System Applications. In Proceedings of the 2020 10th International Conference on Power, Energy and Electrical Engineering (CPEEE 2020), E3S Web of Conferences, Tokyo, Japan, 19–21 June 2020; Volume 182, p. 03005. [Google Scholar] [CrossRef]
- Vignesh, S.; Megalingam, R.K. Design & simulation of a PV system under varying temperatures for maximum power by considering the variation of efficiency with temperature in Simulink. In Proceedings of the 2022 IEEE IAS Global Conference on Emerging Technologies (GlobConET), Arad, Romania, 20–22 May 2022; pp. 349–354. [Google Scholar] [CrossRef]
- Balasubramanian, M.S.; Dheeban, S.S.; Kumar, C.S. Design of standalone PV system. Int. J. Sci. Technol. Res. 2019, 8, 684–688. [Google Scholar]
- Rivadulla, G.A.T.; Apolinario, G.F.D.G.; Pacis, M.C. Optimizing Hybrid Microgrid Power Systems for Local Power Distribution: A Study on Combined Photovoltaic and Fuel Cell Systems in the Philippines. Energies 2023, 16, 5906. [Google Scholar] [CrossRef]
- Singh, A.; Karandikar, P.B. A broad review on desulfation of lead-acid battery for electric hybrid vehicle. Microsyst. Technol. 2016, 22, 1679–1685. [Google Scholar] [CrossRef]
- Alvarado, M.; Bulfa, A., Jr.; Aquino, A. Ultrasonic influence on germination and early growth of bell pepper seeds. In Proceedings of the International Exchange and Innovation Conference on Engineering & Sciences (IEICES), Fukuoka, Japan, 17–18 October 2024; Volume 10, pp. 19–25. [Google Scholar] [CrossRef]
- Kumar, M.S.; Mayavan, S.; Ganesan, M.; Ambalavanan, S. Effect of using sonicated sulphuric acid as an electrolyte in a lead acid battery. RSC Adv. 2015, 5, 76065–76067. [Google Scholar] [CrossRef]
- Zippenfenig, P. Open-Meteo.com Weather API [Computer Software], version 1.4.0; Zenodo: Geneva, Switzerland, 2024. [Google Scholar] [CrossRef]
- Trina Solar. Available online: https://static.trinasolar.com/sites/default/files/AU_Datasheet_Vertex_DEG18MC.20(II)_2020C.pdf (accessed on 4 August 2025).
- Klima, J. Application of ultrasound in electrochemistry. An overview of mechanisms and design of experimental arrangement. Ultrasonics 2011, 51, 202–209. [Google Scholar] [CrossRef]
- Wang, H.; Cui, X.; Zhang, C.; Gao, H.; Du, W.; Chen, Y. Promotion of Ionic Conductivity of PEO-Based Solid Electrolyte Using Ultrasonic Vibration. Polymers 2020, 12, 1889. [Google Scholar] [CrossRef] [PubMed]
- Kitaronka, S. Lead-Acid Battery. Bachelor’s Thesis, Siirt University, Siirt, Türkiye, 2022. [Google Scholar] [CrossRef]
- Charlangsut, N.; Rugthaicharoencheep, N. Enhancing Voltage and Power Stability in Distribution System with Photovoltaic from the Benefits of Battery Energy Storage. Energies 2025, 18, 577. [Google Scholar] [CrossRef]
- Li, G.; Kong, J.; Song, L.; Zhu, Y.; Liu, M.; Liu, C.; Wang, J. Study on voltage consistency characteristics of lithium-ion battery energy storage system. J. Phys. Conf. Ser. 2024, 2788, 012050. [Google Scholar] [CrossRef]
- Law, A.M. Simulation Modeling and Analysis, 5th ed.; McGraw-Hill: New York, NY, USA, 2014. [Google Scholar]
- Vicari, L.A.; de Lima, V.A.; de Moraes, A.S.; Lopes, M.C. Remaining Capacity Estimation of Lead-acid Batteries Using Exponential Decay Equations. Orbital Electron. J. Chem. 2021, 13, 392–398. [Google Scholar] [CrossRef]
- Reddy, T.B.; Linden, D. Linden’s Handbook of Batteries, 4th ed.; McGraw-Hill: New York, NY, USA, 2011; ISBN 978-0-07-162419-0. [Google Scholar]
- Kebede, A.A.; Coosemans, T.; Messagie, M.; Jemal, T.; Behabtu, H.A.; Van Mierlo, J.; Berecibar, M. Techno-Economic Analysis of Lithium-Ion and Lead-Acid Batteries in Stationary Energy Storage Application. J. Energy Storage 2021, 40, 102748. [Google Scholar] [CrossRef]


Disclaimer/Publisher’s Note: The statements, opinions and data contained in all publications are solely those of the individual author(s) and contributor(s) and not of MDPI and/or the editor(s). MDPI and/or the editor(s) disclaim responsibility for any injury to people or property resulting from any ideas, methods, instructions or products referred to in the content. |
© 2025 by the authors. Licensee MDPI, Basel, Switzerland. This article is an open access article distributed under the terms and conditions of the Creative Commons Attribution (CC BY) license (https://creativecommons.org/licenses/by/4.0/).