Article

Can Hydrogen Be Produced Cost-Effectively from Heavy Oil Reservoirs?

by
Chinedu J. Okere
1,* and
James J. Sheng
2,*
1
Department of Petroleum Engineering, University of Houston, Houston, TX 77004, USA
2
Bob L. Herd Department of Petroleum Engineering, Texas Tech University, Lubbock, TX 79409, USA
*
Authors to whom correspondence should be addressed.
Energies 2025, 18(20), 5539; https://doi.org/10.3390/en18205539
Submission received: 26 August 2025 / Revised: 10 October 2025 / Accepted: 14 October 2025 / Published: 21 October 2025
(This article belongs to the Section B: Energy and Environment)

Abstract

The potential for hydrogen production from heavy oil reservoirs has gained significant attention as a dual-benefit process for both enhanced oil recovery and low-carbon energy generation. This study investigates the technical and economic feasibility of producing hydrogen from heavy oil reservoirs using two primary in situ combustion gasification strategies: cyclic steam/air and CO2 + O2 injection. Through a comprehensive analysis of technical barriers, economic drivers, and market conditions, we assess the hydrogen production potential of each method. While both strategies show promise, they face considerable challenges: the high energy demands associated with steam generation in the steam/air strategy, and the complexities of CO2 procurement, capture, and storage in the CO2 + O2 method. The novelty of this work lies in combining CMG-STARS reservoir simulations with GoldSim techno-economic modeling to quantify hydrogen yields, production costs, and oil–hydrogen revenue trade-offs under realistic field conditions. The analysis reveals that under current technological and market conditions, the cost of hydrogen production significantly exceeds the market price, rendering the process economically uncompetitive. Furthermore, the dominance of oil production as the primary revenue source in both methods limits the economic viability of hydrogen production. Unless substantial advancements are made in technology or a more cost-efficient production strategy is developed, hydrogen production from heavy oil reservoirs is unlikely to become commercially viable in the near term. This study provides crucial insights into the challenges that must be addressed for hydrogen production from heavy oil reservoirs to be considered a competitive energy source.

1. Introduction

Hydrogen is increasingly recognized as an important energy carrier in the transition to a low-carbon global economy, particularly due to its versatility in decarbonizing sectors such as transportation, power generation, and industrial processes [1,2,3,4]. As governments and industries strive to meet climate targets, hydrogen has emerged as a critical component of energy systems due to its potential for zero-emission fuel generation. Despite its promising attributes, hydrogen production faces significant challenges due to the high environmental footprint of traditional methods like steam methane reforming (SMR) and coal gasification, which emit approximately 9–12 kg and 19–22 kg of CO2 per kilogram of hydrogen, respectively [5,6,7]. Currently, the dominant method of hydrogen production, SMR, is heavily reliant on fossil fuels, emitting large amounts of CO2 [8,9]. Consequently, there has been growing interest in exploring alternative, cleaner hydrogen production techniques, particularly those that utilize existing infrastructure in oilfields.
In situ hydrogen production from petroleum reservoirs presents a potentially transformative solution to this challenge [9,10,11,12,13]. By generating hydrogen directly within the reservoir through high-temperature reactions between hydrocarbons, rocks, and water, this method offers the possibility of harnessing the energy-rich hydrocarbons in place while simultaneously sequestering CO2 and other byproducts in the reservoir. The key advantage of this process lies in its potential to leverage existing oilfield infrastructure, reducing the costs typically associated with building new facilities. Notably, the in situ combustion gasification method, which has gained significant interest in recent years, stands out as a promising technique for hydrogen production in heavy oil and bitumen reservoirs [14,15]. This method, particularly when combined with gas injection strategies such as steam/air or CO2 + O2 injection, has been shown to generate hydrogen while enhancing oil recovery, thus providing a dual benefit: the extraction of both oil and hydrogen from the same resource.
While in situ hydrogen production from petroleum reservoirs offers considerable promise, there are significant technical and economic challenges that must be addressed before this method can be scaled to meet global hydrogen demand. Several field studies have investigated hydrogen production from heavy oil and bitumen reservoirs, reporting varying results in terms of hydrogen yield (Table 1).
Table 1 presents a summary of key field projects that have validated the feasibility of hydrogen production from heavy oil reservoirs. These projects, conducted in various locations, report significant variability in hydrogen yield, with maximum hydrogen concentrations ranging from 7 mol.% to 33 mol.% in the produced gas phase. Notably, these projects, while successful in producing hydrogen as a byproduct, were originally designed for enhanced oil recovery (EOR) processes. Thus, the variations in hydrogen yield across these projects point to several factors that influence the efficiency of the process, such as reservoir characteristics, injection methods, and operational conditions. Additionally, the fact that these projects prioritize oil recovery rather than hydrogen production suggests that, despite some success in hydrogen generation, there are still economic barriers that should be overcome for in situ hydrogen production to become commercially viable.
The current state of research highlights a critical gap in understanding the full technical and economic feasibility of hydrogen production from heavy oil reservoirs [22,23]. While there has been some investigation into the process, few studies have comprehensively addressed both the technical barriers and economic challenges of scaling up in situ hydrogen production. Most prior work has focused on isolated aspects, such as the technical processes involved in combustion gasification or the potential for EOR, without fully exploring the broader economic implications. This gap is significant, as the viability of hydrogen production from heavy oil reservoirs relies not only on overcoming technical challenges but also on developing a cost-effective business model that can compete with other hydrogen production methods.
This study aims to address this gap by providing an in-depth analysis of the technical and economic analysis of hydrogen production from heavy oil reservoirs using two primary in situ combustion gasification strategies: steam/air and CO2 + O2 injection. By evaluating these methods in terms of hydrogen yield, energy consumption, economic drivers, and market conditions, we seek to provide a comprehensive assessment of whether hydrogen production from heavy oil reservoirs can be cost-effective and commercially viable. The insights gained from this analysis will be instrumental in determining whether hydrogen production from petroleum reservoirs can contribute to the global transition to a low-carbon hydrogen economy.

2. Methodology

2.1. Reservoir Modeling

The reservoir modeling investigates in situ hydrogen production through combustion gasification, utilizing detailed simulations within CMG-STARS 2024 version. Each component of the reservoir modeling process is defined, including the reservoir model specification, fluid composition, reaction kinetics, injection strategies, and grid size selection. The goal is to provide a comprehensive framework for predicting hydrogen yield from heavy oil reservoirs.

2.1.1. Reservoir Model

To evaluate in situ hydrogen generation from heavy oil formations, we adapted a full-field reservoir model based on [24] using data from the Marguerite Lake project (BP Resources, 1979). The 3-D grid model (10 × 10 × 5) with 500 active blocks (each 304.8 m × 304.8 m × 15.24 m) involves two injectors and one producer well (Figure 1). One injector handles steam, the other air or gas, and a production well operates under a minimum bottom hole pressure constraint of 137.9 kPa. The physical and chemical characteristics of the modeled reservoir, including porosity, permeability, depth, temperature, and heavy-oil composition, are identical to those described in [25].
The reservoir model includes four phases: mobile gas, water, oil, and immobile solid (coke). Detailed reservoir and injection parameters are provided in Table S1.

2.1.2. Fluid Model

The fluid model comprises heavy oil divided into four pseudo-components: saturate, aromatic, resin, and asphaltene. Their properties are derived using the Peng-Robinson EOS in the CMG-WinProp package. Additionally, seven non-hydrocarbon components are included: Water, CO2, N2, O2, H2, CO, and Coke. Table S2 summarizes the properties of all eleven pseudo-components. The detailed SARA fractions and thermophysical properties are consistent with those reported in [25].

2.1.3. Reaction Kinetics Model

Hydrogen generation from heavy crude oil involves complex chemical reactions across various temperatures. For field feasibility and reproducibility, we balanced the number of reactions and components while maintaining energy and mass balance. The model, considering reservoir conditions, incorporated eleven SARA-based components and fourteen reactions, including cracking, combustion, gasification, and hydrogen-based reactions, with stoichiometric coefficients adjusted for mass balance in SARA fractions. Table S3 summarizes the reaction kinetics. The reaction network, kinetic parameters (activation energies and pre-exponential factors), and temperature-dependent formulations follow exactly the methodology of [25].

2.1.4. Injection Strategy

The injection strategy selected for this study includes two main approaches: CO2 + O2 and cyclic steam/air injection. These strategies are based on established methods in the literature for hydrogen production through in situ combustion gasification in heavy oil reservoirs [26,27,28,29]. The CO2 + O2 injection approach enhances gasification reactions by adding CO2 as a reactive component, which can alter the composition and yield of produced gases. Cyclic steam/air injection supports sustained combustion and introduces steam, which promotes further gasification reactions. Each injection strategy is assessed within the model to evaluate its effect on hydrogen production.
In the model, each cycle follows a four-month injection period, adapted from the BP Resources Marguerite Lake EOR project that successfully demonstrated hydrogen generation. The injection stop time aligns with this four-month cycle, and thermodynamic equilibrium is achieved during ongoing cyclic operations without a dedicated resting phase, thereby ensuring sustained hydrogen production throughout the project timeline. Operational constraints were also specified: in the injector, a maximum surface water rate of 5 m3/day, a maximum bottomhole pressure of 20,000 kPa, and a maximum gas injection rate of 10,000 m3/day were imposed. At the producer, the model was constrained by a minimum bottomhole pressure of 137.9 kPa and a maximum liquid rate of 200 m3/day.

2.1.5. Grid Configuration Selection Justification

To ensure accurate modeling of in situ hydrogen generation from heavy oil reservoirs, a grid sensitivity analysis is conducted across various grid configurations to determine the most effective grid resolution that balances computational efficiency and model precision. The analysis examined five grid resolutions—5 × 5 × 3, 7 × 7 × 3, 10 × 10 × 5, 12 × 12 × 7, and 15 × 15 × 10—with each configuration evaluated over a five-year simulation using the cyclic steam/air injection strategy. The primary metrics evaluated include cumulative hydrogen and carbon dioxide production, along with temperature profiles near the combustion front.
The results in Table 2 indicate that the 10 × 10 × 5 grid configuration produced cumulative hydrogen generation of 310,245 kg and cumulative CO2 generation of 2482.56 m3. Notably, when transitioning to the 12 × 12 × 7 and 15 × 15 × 10 grid configurations, the cumulative hydrogen production increased marginally to 310,812 kg (a 0.18% increase) and 311,025 kg (a 0.07% increase), respectively. Similarly, cumulative CO2 production showed slight increases to 2485.76 m3 and 2486.98 m3, reflecting percentage changes of only 0.13% and 0.05%.
Average temperatures at the combustion front were also consistent, stabilizing around 710.2 °C for the 10 × 10 × 5 grid, with minimal variations noted in the finer grids (711.1 °C for 12 × 12 × 7 and 712.3 °C for 15 × 15 × 10), where each grid block in the 10 × 10 × 5 configuration measures 304.8 m × 304.8 m × 15.24 m, for a total of 500 active blocks, indicating that the grid accurately captures essential thermal dynamics without further refinement.
Given these results, the 10 × 10 × 5 grid configuration is selected to be the optimal choice for subsequent simulations. It provides reliable predictions of key parameters while ensuring efficient computational performance. The marginal gains observed in both hydrogen and CO2 production at finer grids confirm that the 10 × 10 × 5 grid is sufficiently accurate for modeling in situ hydrogen generation from heavy oil reservoirs, making it the preferred grid size for this study.

2.1.6. Reservoir Model Validation

The accuracy of the model’s predictions has been validated in our previous publication [25]. In that work, we employed a different validation methodology by history matching the model’s predictions with both published experimental results and independent modeling studies, thereby providing a comprehensive assessment of predictive accuracy.
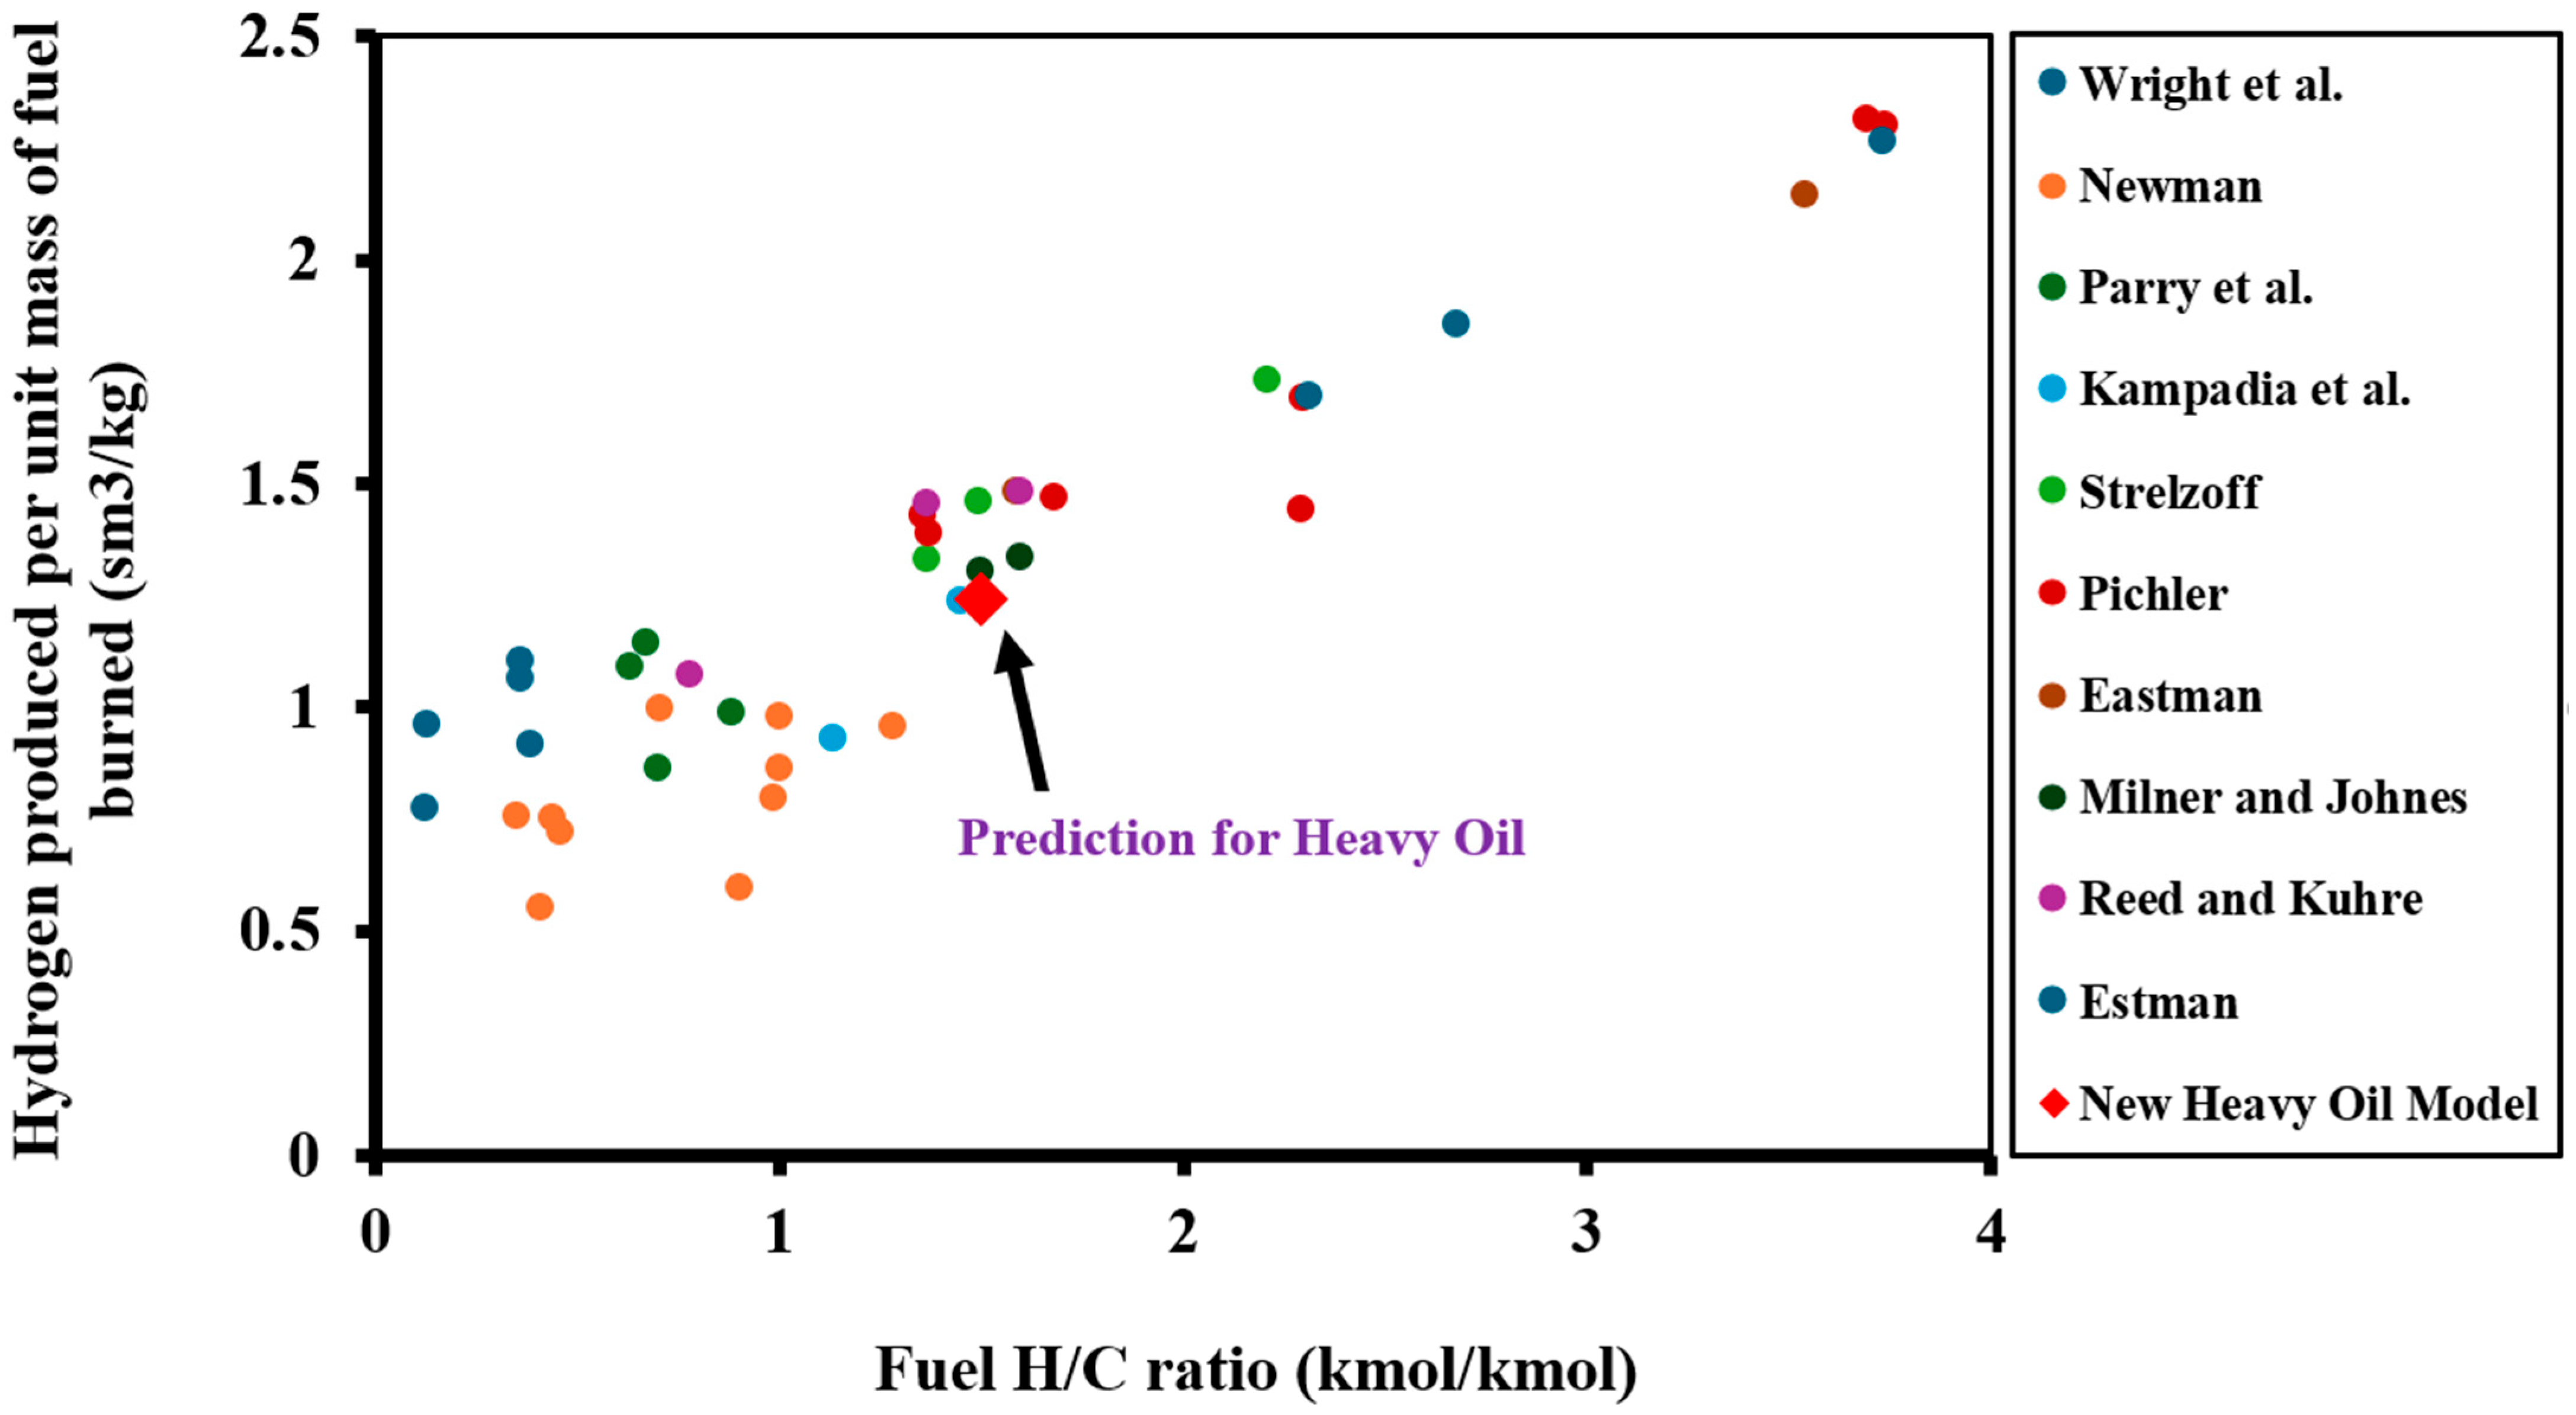
However, to verify the accuracy of the reaction schemes, we performed an integrated validation using hydrogen yield data across a range of feedstocks documented in prior studies [30,31,32,33,34,35,36,37,38]. Specifically, we gathered data on hydrogen production from uncatalyzed gasification of various fossil fuels with differing hydrogen-to-carbon (H/C) ratios, incorporating insights from experimental, pilot, and commercial operations. These data points served as a benchmark for evaluating the validity of our model predictions against established hydrogen yields from similar feedstocks (Figure 2).
The validation approach involved interpolating the hydrogen yields reported in these studies and comparing them with the expected yield ranges for heavy oil, as shown in Figure 2. Light oils, with H/C ratios typically between 1.8 and 2.1 [40], generally produce hydrogen yields in the range of approximately 1.25 to 1.75 S m3/kg of fuel burned. In contrast, heavy oils, with H/C ratios between 1.3 and 1.7 [40], yield between 1.0 and 1.5 S m3/kg.
The new heavy oil model predicted a hydrogen yield of 1.241 S m3/kg of fuel burned. This falls well within the expected ranges derived from literature, indicating that the reaction schemes in our model effectively capture the essential mechanisms of hydrogen production during in situ combustion gasification of heavy oil reservoirs. It is important to note that this value is a direct output of the integrated reaction schemes in the CMG-STARS model. The predicted yield is not derived from a single analytical formula but is obtained through model simulations validated against experimental and literature benchmarks across a range of H/C ratios.

2.2. Economic Modeling

This study develops an economic model using GoldSim version 14.0 software, which has been effective in analyzing other oilfield projects [41,42]. The model is based on common hydrogen processes in the field. Figure 3, adapted from [43], illustrates the hydrogen production process flow. CO2 is injected with oxygen into the reservoir via an injection well, yielding producer gas with over 16% hydrogen concentration via in situ combustion gasification of residual hydrocarbons [9]. Hydrogen is separated using a hydrogen-only membrane at the surface, and produced gas (including hydrogen, carbon dioxide and hydrocarbons) and water are extracted from a production well. The liquid phase undergoes water-oil separation, with oil conveyed for sale and water is reused. The gas phase is processed through a hydrogen-permeable membrane and a gas processing unit, separating hydrocarbons from CO2 and hydrogen. The CO2 is recycled, compressed, and reinjected with fresh CO2 as needed.
The economic model is divided into three main components: injection, production, and CO2 recycling (Table 3). The individual module includes submodules representing unique cost constraints.

2.2.1. Injection Cost Components

This component involves sub-components for calculating injection and injection well costs.
Lease Equipment Costs for Injection Well
The cost of injection equipment and injection wells impacts the overall running cost of the project. The U.S. Energy Information Administration provides a summary of additional costs associated with injection equipment and injection wells in West Texas for secondary oil recovery operations, covering 10 producing and 11 injection wells at various depths (Table S4). The data of the Consumer Price Index (CPI) used in this study is presented in Table S5. In this economic model, it is assumed that all investments are made prior to the commencement of the injection phase, with all associated investment costs allocated to the initial time step of the model. Additionally, the costs associated with exploration, drilling, and completion are not included as it is assumed that these infrastructures are available.
Annual Operating and Maintenance Costs
During the life of the project, periodic well workovers involving the replacement of tubing with new tubing designed to inhibit corrosion caused by CO2 will be performed. The U.S. Energy Information Administration provides a summary of the direct annual operating costs for secondary oil recovery operations in West Texas, covering 10 producing and 11 injection wells at various depths (Table S8).

CO2 Supply and Conveying Costs

In this model, we reference data from [42] and consider two main cost constraints for CO2 distribution. The fixed cost is $200,000, covering all manifolds and distribution lines on-site, which connect the production wells to the recycle plant and subsequently from the recycle plant to the injection wells. The variable cost is based on distance and flow rate, encompassing CO2 supply systems from the pipeline.
Air Source and Cost
Air injection is essential for hydrogen production from petroleum reservoirs, involving the use of compressors to supply the necessary air for in situ combustion and gasification. The cost model includes both the cost of air and the required equipment, such as compressors and their accessories.
Industrial-grade air compressors, which draw ambient air and compress it to the required pressure, are suitable for large-scale reservoir operations. These compressors cost approximately $50,000 per unit, with annual operating costs around $5000 (Industrial Air Compressors). The compressors ensure the required injection pressure and flow rates, which are critical for effective hydrogen production. The air is drawn from the atmosphere, filtered to remove impurities, and then compressed to the desired pressure before being injected into the reservoir.

2.2.2. Carbon Dioxide (CO2) Cost Components

This component involves sub-components that cover the costs related to CO2 purchase and injection.
CO2 Source and Cost
The economic feasibility of hydrogen production from petroleum reservoirs heavily depends on the procurement and transportation costs of CO2, a critical component in the process. CO2 can be sourced from natural reservoirs or industrial facilities, each option carrying distinct economic implications. Natural sources typically offer lower costs due to minimal processing requirements, whereas industrial sources, such as ammonia plants or catalytic cracking units, provide CO2 with higher purity levels but may incur higher expenses due to regulatory compliance and processing.
Impurities commonly found in natural CO2 sources, such as N2, H2S, or CH4, can impact project costs by influencing minimum miscibility pressure requirements or necessitating specialized infrastructure. In contrast, industrial CO2 sources may include contaminants like N2 and CO, requiring additional processing to meet project specifications [40].
For this study, the cost of CO2 procurement includes delivery to the project site, with transportation and pipeline costs excluded. CO2 purchase prices typically correlate with oil prices, often approximating around 2.5% of the oil price based on previous studies [41,42].
The optimization of pipeline diameter based on CO2 flow rates and distances plays a crucial role in minimizing capital and transportation costs. Reference [41] outlines a method for optimizing pipeline diameter, with the following tables (Tables S11 and S12) detailing diameters for different CO2 flow rates over 100 miles (160.9 km) and estimated pipeline capital costs:
Operating and maintenance costs for a 100-mile pipeline are estimated at approximately $900,000 annually, unaffected by diameter [41]. Transportation costs are detailed in Table S13, showing that higher CO2 flow rates reduce costs per metric tonne transported, influenced by pipeline diameter and length.
This cost-efficient transportation infrastructure is essential for maintaining project profitability over its estimated 20-year lifespan, accounting for a 6% discount rate. Therefore, the strategic sourcing and efficient transportation of CO2 are critical for enhancing the economic feasibility of hydrogen production from petroleum reservoirs. This study’s model will integrate these cost components with practical insights from industry methodologies, ensuring robust financial assessments and informed decision-making.
Calculation of Injection Pressure and CO2 Pressurizing Expenses
To estimate the compression and pumping power required for CO2 injection, wellhead pressures are calculated using an iterative method from [41], based on outputs from the CMG simulation. CO2 properties such as viscosity, density, and compressibility factor, which are sensitive to temperature and pressure, are sourced from [44]. If the pressure at the wellhead is less than the CO2 pressure in the outlet (1200 psi), additional pressurization for injection is unnecessary, and the injection pressure is set to the wellhead pressure.

2.2.3. Water Cost Components

This component involves sub-components that cover the costs related to water procurement and steam/air injection.
Water Procurement Cost
The cost of water procurement is a significant consideration. Based on available data, the volume of water consumed is estimated to be approximately 20–25% of the volume of hydrogen produced. Following the assumptions made by (AEA) we will adopt a water cost of $0.14 per barrel. This cost reflects only the energy required to lift water from a well, assuming access to subsurface water resources. Consequently, this economic model will not include commodity cost for water procurement, as it assumes that subsurface water is readily accessible and that the primary expense is related to energy consumption for water extraction. This approach aligns with industry standard practices.
Steam/Air Injection Cost
For steam/air injection in in situ hydrogen production, wellhead pressure is determined by adding the wellbore pressure to the head pressure. The head pressure is calculated using Equation (S4). For steam at 150 °C and a depth of 1524 m, the head pressure is approximately 0.9 psi (0.006 MPa). For air, using a density of 1.225 kg/m3, the calculation follows similarly.

2.2.4. Production Cost Components

This component involves sub-components that cover the costs related to production equipment procurement, fluid lifting, syngas and water separations and the production revenues and taxes.
Cost of Production Equipment
The cost of the producing equipment and producing wells impacts the overall running cost of the project. The U.S. EIA provides a summary of additional equipment costs of producing wells in West Texas for water flooding process, covering 10 producing wells at various depths (Table S14).
Cost of Fluid Lifting
In the context of in situ hydrogen production from petroleum reservoirs, an artificial lift system may be necessary to bring produced gas or syngas to the surface, particularly when reservoir pressure is inadequate. This requirement is like CO2-EOR projects, where 80 percent of operations necessitate artificial lifting due to insufficient reservoir pressure (AEA). For hydrogen production, the same principle applies lifting is essential if reservoir pressure is lower than the hydrostatic pressure of the produced gas column.
Artificial lifting costs vary significantly depending on the depth of the well and the characteristics of the produced fluids. For instance, (AEA) indicated that artificial lifting requires 2–4 kWh/bbl for shallow wells and up to 25 kWh/bbl for deep wells. Reference [40] estimated a lifting cost of $0.25/bbl for total fluid produced. For hydrogen production, lifting costs can be similarly estimated. Given the depth and pressure conditions typically encountered, a lifting cost of $0.25/bbl is assumed for produced gases, aligning with the [40] assumption for fluid lifting in CO2-EOR projects.
It is important to note that the separation cost for gas and liquid phases is considered negligible compared to the overall lifting costs. This assumption simplifies the economic model and focuses on the primary expenses associated with lifting in hydrogen production from petroleum reservoirs.
Cost of Syngas and Liquid Separation
The cost of syngas and liquid separation through membrane technology is critical for assessing the economic viability of hydrogen production from petroleum reservoirs. Membrane modules typically range from $500 to $1500 per square meter [45], with annual maintenance costs averaging 10% to 15% of the initial membrane investment [46]. Ancillary equipment can increase initial capital outlay by 50% to 100% [47], while membrane lifetimes range from 3 to 5 years, necessitating periodic replacements [48]. These factors, including procurement, maintenance, ancillary equipment, and replacement cycles, constitute the core financial considerations for membrane-based syngas and liquid separation. Ongoing advancements in membrane technology are expected to further optimize costs and enhance project economics.
Cost of Separating Oil and Water Mixture
The cost of separating the oil and water mixture is a critical component in the techno-economic analysis of hydrogen production from petroleum reservoirs. Schlumberger [49] provided cost projections for water control strategies for fluid production rates from twenty thousand to two hundred thousand barrels per day. The costs in 2000 dollars are shown in Table S17.
Production Revenue, Tax and Royalty Separation
Herein, it is assumed that hydrogen price is $3/kg, aligning with current market trends [50,51]. We consider a royalty rate of 10%, reflecting typical agreements in the energy sector [52,53]. Additionally, a severance tax rate of 2% is applied, aligning with inducements often provided for innovative energy projects [54,55].
We utilize the residual income (R) as outlined in Equation (1).
R = P H × Q H × 1 τ R τ S
In Equation (1), PH is the hydrogen price ($/kg), QH is the hydrogen production rate (kg/day), τR is the royalty rate, and τS is the severance tax rate.

2.2.5. Carbon Dioxide Recycling Cost Components

This component involves sub-components that cover the costs related to production equipment procurement, fluid lifting, syngas and water separations and the production revenues and taxes.
Gas Treatment: Gas Separation and Compression
Carbon dioxide recycling is a crucial aspect of hydrogen production from petroleum reservoirs, particularly for enhancing the efficiency and sustainability of the process. During hydrogen production, a portion of the injected CO2 will be produced alongside hydrogen and other gases. This produced CO2 must be separated and re-injected to maintain reservoir pressure and optimize hydrogen recovery. Typically, 15–50% of the injected CO2 will be recycled in this manner [41].
The produced CO2, along with other gases, enters the gas processing unit. If the concentration of other gases (e.g., methane) in the produced fluid is significant, they can be separated and sold as valuable by-products. The concentration of these gases typically varies over time, being more in the initial stages of CO2 injection [56]. Gas separation can be achieved through methods highlighted in Table S18. These processes primarily consume energy for refrigeration and compression.
We assume a refrigeration method in this model, as it is a common and cost-effective method for CO2 separation [56,57,58]. Refrigeration has an estimated capital cost of $500 per Mscf/day of produced gas [58], and it typically recovers 20–50% of hydrocarbons. Membrane separation, though effective, incurs higher costs due to the need for recompression of CO2. Ryan Holmes is another method but is very expensive. For simplicity, this cost model assumes a capital cost of $500 per Mscf/day for CO2 separation from hydrocarbon gas.
After separation, the CO2 is compressed to critical pressure and then pressurized to 1200 psi (8.27 MPa) using a pumping system [58]. The compression and pumping costs are calculated separately by determining the required compression power, compressor capital, and operating and maintenance costs. This detailed approach aligns with the methodology suggested by [58], ensuring a comprehensive evaluation of the CO2 recycling process’s economic viability.
The costs of compression are significant. For the separated CO2, which is initially at atmospheric pressure (0.1 MPa), it needs to be pressurized to 1200 psi (8.27 MPa). This involves compressing it to its critical pressure (7.39 MPa) and then pumping it to the final pressure. Reference [59] suggested using five compressor stages to achieve this pressure. Equations (S6)–(S8) were used to calculate the compression power requirement at each stage.
After compression, the separated CO2 needs to be pressurized to 1200 psi (8.27 MPa) using a pump. The pump capital cost is assumed to be 20% of the compressor capital cost, operating and maintenance costs. Capital costs for compression are typically estimated based on required compression power. (AEA) assumed $2000 per horsepower (hp), while [60] mentioned costs ranging from $1060 to $3000 per hp. This research assumes $2500 per hp for determining compressor capital costs based on the maximum required compression power. Operating and maintenance costs for compressors are mainly energy costs. The average retail price of electricity for the state of Texas of 13 cents per kilowatt-hour is applied to the cost model [61].

2.2.6. Parameters Utilized in the Economic Modeling

Table 4 outlines the inputs and constraints applied in the economic model, with all values adjusted to 2024 dollars where necessary.

2.2.7. Reservoir Classification Process

For the techno-economic simulations, the heavy oil reservoir is classified based on productivity, which is closely related to the ease of fluid flow. Porosity and permeability are fundamental properties that influence how easily fluids can be stored and transmitted through the reservoir. The classification is based on these properties in Table 5.
According to sources like [62,63,64], low permeability reservoirs often have permeability values below 1 md. Moderate permeability is typically in the range of 1 to 10 md, and high permeability exceeds 10 md. Additionally, according to [65], low porosity is generally less than 10%, moderate porosity ranges from 10% to 20%, and high porosity exceeds 20%.

3. Results and Discussion

3.1. Technical Aspects of Hydrogen Generation

The technical aspects involve key factors that influence hydrogen generation under in situ conditions. The analysis focuses on critical aspects such as hydrogen and other syngas yields for different injection strategies and initial reservoir temperatures, hydrogen diffusivity and combustion front mobility efficiency, and hydrogen generation mechanisms. Subsequent sections provide a more detailed exploration of these aspects.

3.1.1. Analysis of Hydrogen Yield and Gas Composition

This section focuses on cumulative hydrogen yield, gas composition, and impact of injection strategies, reservoir temperature, and the technical challenges posed by oil recovery and syngas generation. The analysis highlights the significant differences between the hydrogen generated within the reservoir and the hydrogen produced at the surface, which raises important questions about the long-term viability of hydrogen as a clean energy source from heavy oil reservoirs.
Impact of Injection Strategy on Hydrogen Generation
Herein, we used the parameters specified in Section 2.1 to study the impacts of the two injection strategies on hydrogen yield (Figure 4). The cyclic steam/air injection strategy yields the highest cumulative hydrogen. This finding is consistent with prior research, which indicates that cyclic steam/air injection strategies are more efficient in controlling oxygen supply, thus enhancing hydrogen production while reducing hydrogen-consuming reactions [27].
While cyclic steam/air generates the highest hydrogen, it also results in significant cumulative oil recovery and gas generation (Figure 4). This raises an important consideration: the high oil recovery observed suggests that the reservoir is not only a potential candidate for hydrogen generation but could also continue to serve as a significant source of crude oil for conventional fossil-based energy production. The simultaneous oil recovery presents a challenge for the sustainability of hydrogen production. Heavy oil reservoirs with high oil recovery rates face the issue of competing priorities: crude oil extraction for fossil-based energy versus hydrogen generation for clean energy. The oil produced could be used for traditional energy generation or refined into various fossil fuels, which complicates the feasibility of transforming such reservoirs into hydrogen-only generators for clean energy.
In contrast, the CO2 + O2 injection strategy generates lower hydrogen, and the lower oil recovery rates suggest that it might not be as efficient in both hydrogen generation and crude oil production. The higher hydrogen yields from cyclic steam/air do not entirely downplay the possibility of using these reservoirs for conventional energy extraction, but the efficiency of hydrogen generation is reduced compared to oil extraction.
Thus, the choice of injection strategy is not only important for hydrogen generation but also affects the overall energy output, potentially leading to a conflict between utilizing the reservoir for hydrogen production and extracting crude oil for traditional energy uses.
Temperature Dependence of Hydrogen Generation
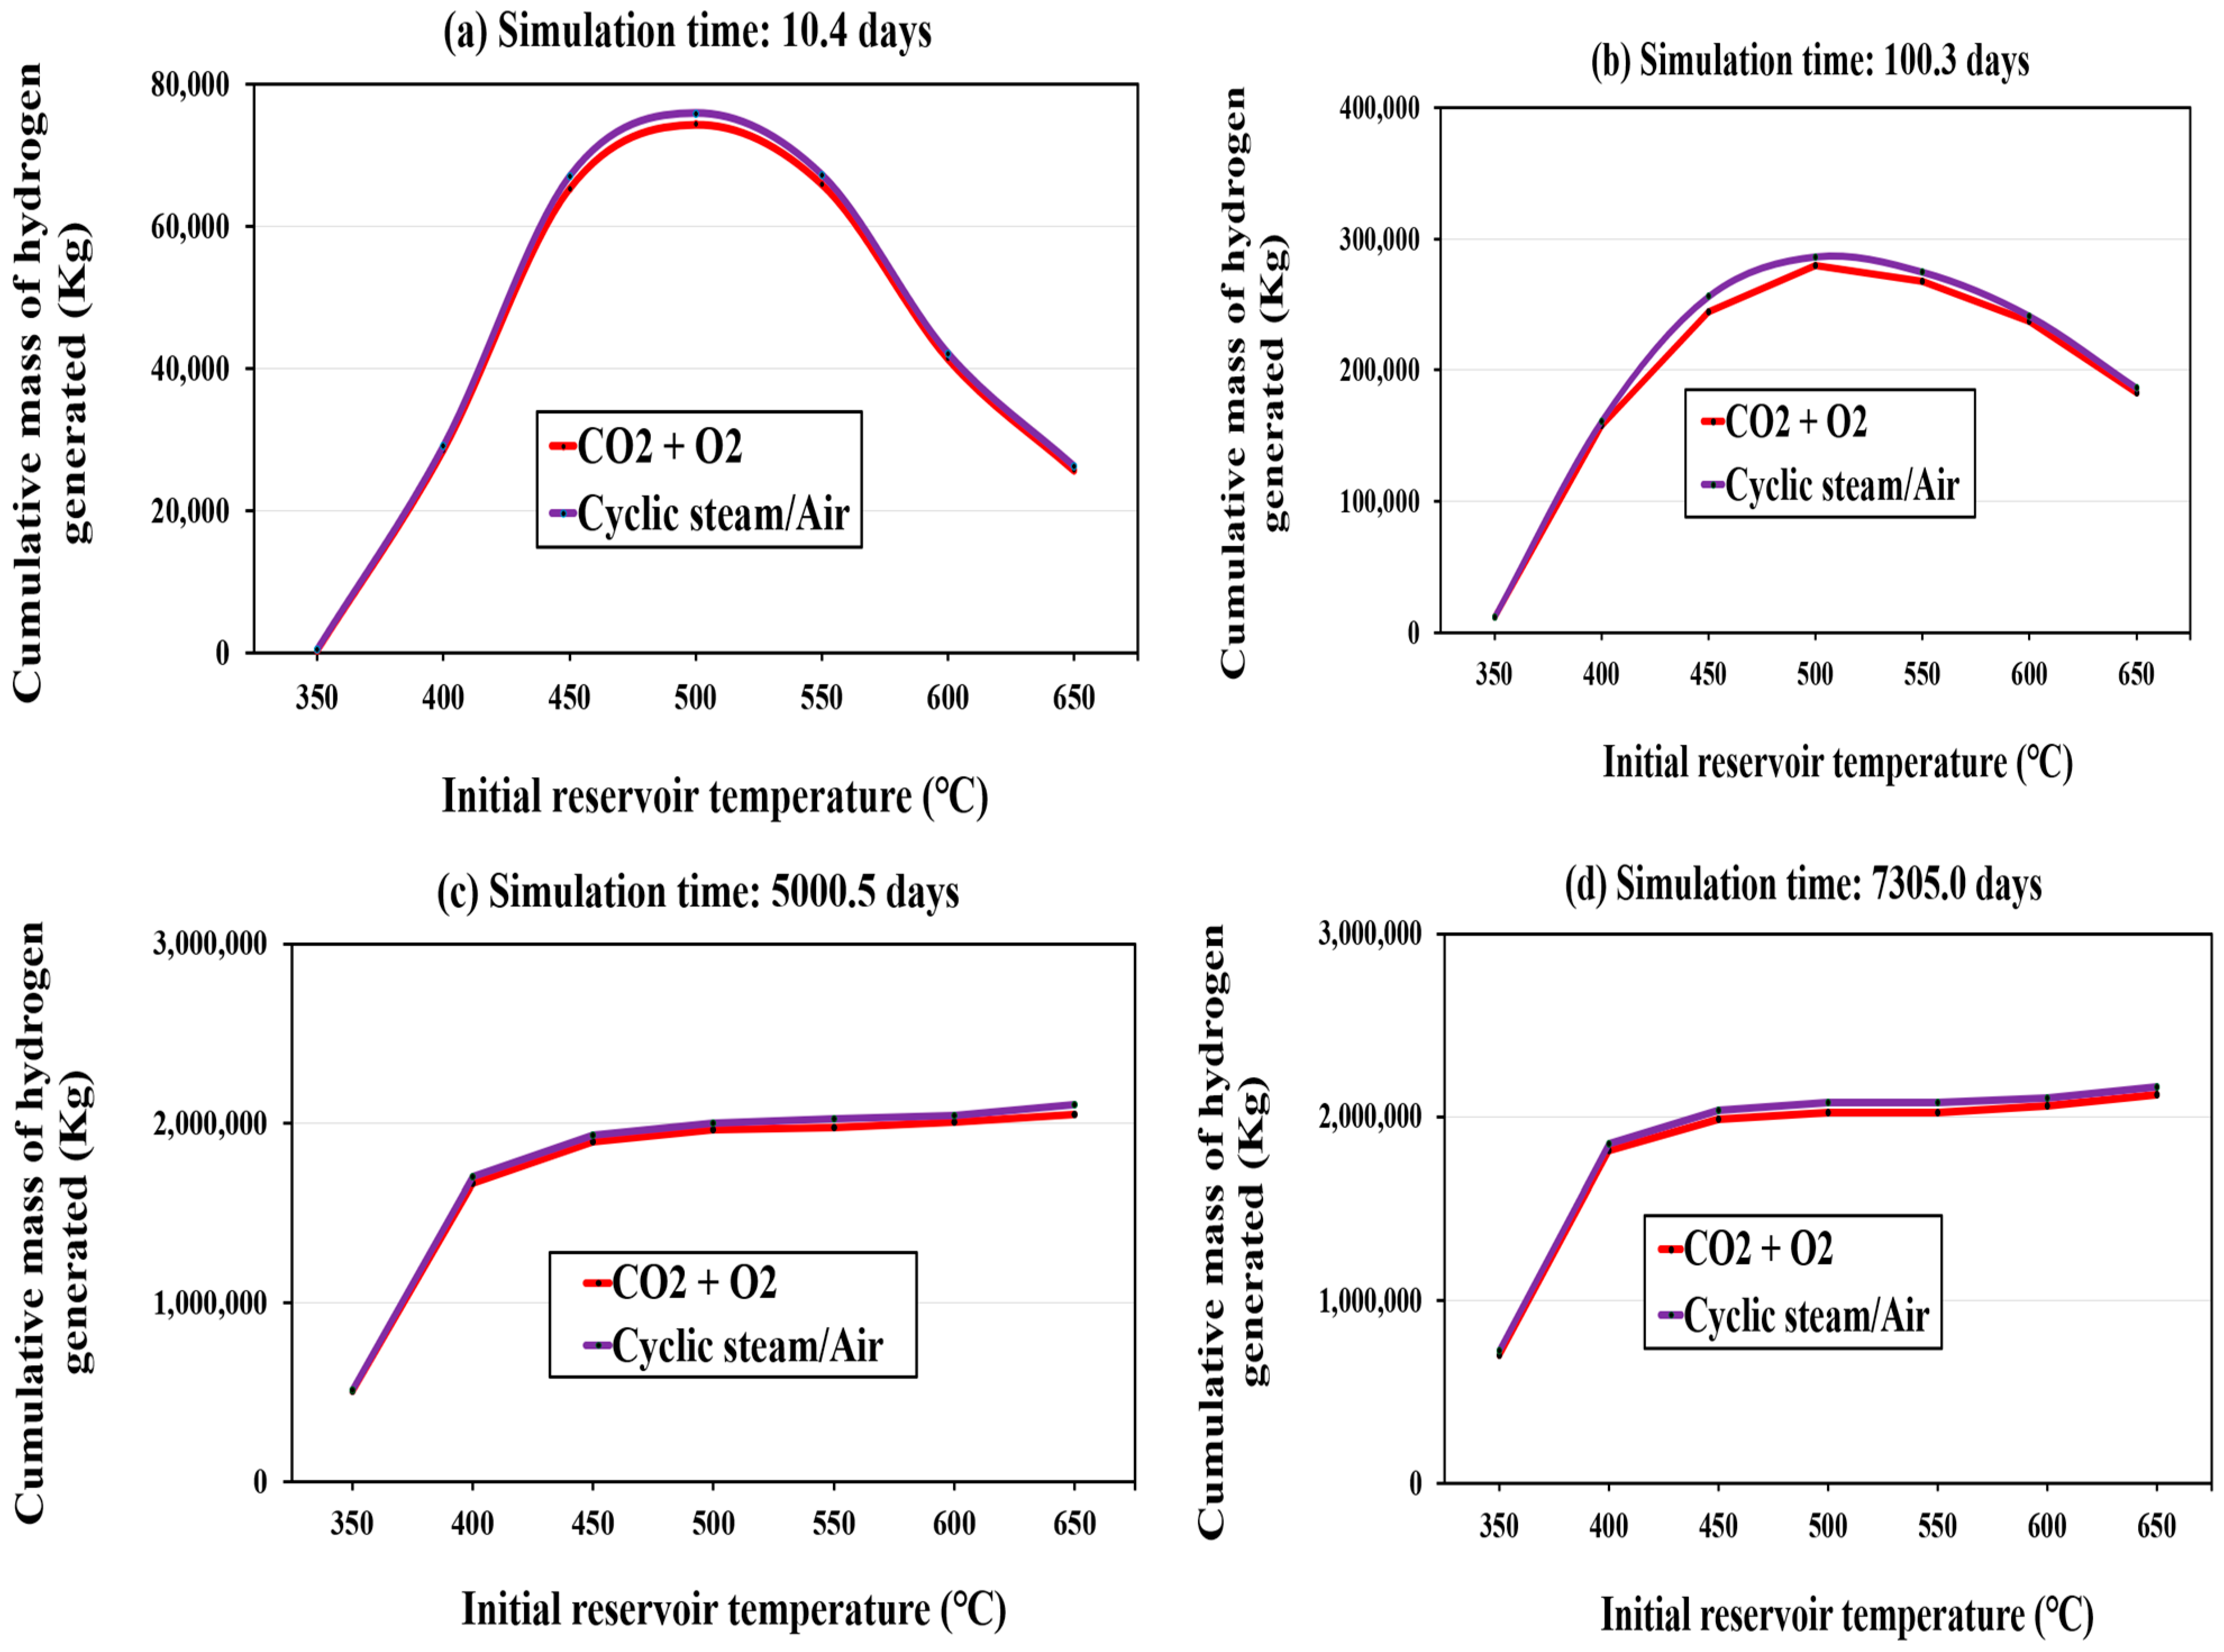
Initial reservoir temperature plays an important role in determining feasibility of hydrogen generation from petroleum reservoirs. This is the minimum temperature the reservoir temperature should attain before hydrogen can be generated. This is achieved through heating the reservoir using either the injection of combustible gas or electromagnetic process [9,66]. Figure 5 shows the critical role of the initial reservoir temperature in determining the feasibility of hydrogen generation. The cumulative hydrogen yield for different injection strategies is strongly influenced by initial reservoir temperature, with a peak observed between 450 °C and 500 °C, particularly in the early time periods (10.4–100.3 days). Within this temperature range, reactions such as coke gasification and water-gas shift dominate, promoting the generation of hydrogen [67]. These reactions become increasingly favorable as the temperature rises, with thermal cracking and high-temperature coke oxidation playing a key role in enhancing hydrogen generation [17,25].
However, below 350 °C hydrogen generation becomes less feasible. At temperatures lower than 350 °C, hydrogen generation reactions slow down significantly because the thermal energy available is insufficient to overcome the activation energy for endothermic reactions, such as coke gasification, which are essential for sustained hydrogen generation. Although exothermic reactions like the water-gas shift can occur at lower temperatures, the overall rate of hydrogen-generating reactions decreases due to limited thermal activation [68]. For a short-term production plan, the temperature range between 450 °C and 500 °C represents the optimal condition for hydrogen generation (Figure 5a,b), where hydrogen production reactions are maximized, and hydrogen-consuming reactions are minimized. This balance is critical to maintaining high hydrogen yields during the process.
At the late time periods (5000.5 to 7305.0 days), the interplay between combustion and gasification becomes more significant. Initially, the combustion processes, driven by the injection of air or oxygen, help ignite the reservoir and initiate the gasification of heavy oil. However, as time progresses, the contribution of gasification reactions increases, while combustion reactions continue to support the overall energy balance and hydrogen generation.
The cumulative hydrogen yield in the long term continues to increase, as seen in Figure 5c,d, particularly at higher initial reservoir temperatures, where cyclic steam/air injection shows the highest cumulative hydrogen generation. This can be attributed to the influence of spontaneous ignition within the reservoir, overcoming the initial delays between injection and ignition [12,69]. Over time, the hydrogen generation reactions, such as water-gas shift and coke gasification, prevail over the hydrogen-consuming reactions. This shift results in a more sustained and uniform hydrogen generation rate, contributing to the continuous rise in cumulative hydrogen yield [39].
The balance between combustion and gasification is crucial in ensuring sustained hydrogen generation. Combustion provides the necessary heat to maintain the required reservoir temperature, while gasification facilitates the conversion of heavy oil into hydrogen-rich gases. Achieving a balance between these two processes is essential for maximizing hydrogen generation.

3.1.2. Analysis of Combustion Front Propagation and Hydrogen Diffusion

Impact of Combustion Front Propagation on Hydrogen Generation
This section investigates the propagation of the combustion front from the injection well to the production well and its impact on hydrogen generation and diffusion under different injection strategies. During combustion recovery processes, three key activities occur simultaneously: fluid displacement, heat transfer, and oxidation/gasification reactions. Air injection into the reservoir initiates combustion, either through spontaneous ignition when sufficient air permeability exists or by applying external heat using electromagnetic devices, gas burners, or reactive chemicals [70,71,72,73]. Once ignition is achieved, continuous air or steam injection drives the combustion front outward from the injection well toward the production well [72,74].
The combustion front transfers heat to the surrounding reservoir fluids and rock, promoting oxidation and gasification reactions at high temperatures near the front. These reactions generate hydrogen and syngas. Conversely, the cooler regions behind the combustion front promote condensation and hydrogen-consuming processes [9]. Sustained hydrogen generation in the reservoir requires the hydrogen generation process to progress faster than the advancing combustion front. A slow hydrogen generation rate or significant hydrogen loss during the in situ combustion gasification process may result in reduced hydrogen yields at the production well. Thus, optimizing combustion front mobility and hydrogen diffusion could maximize hydrogen recovery efficiency.
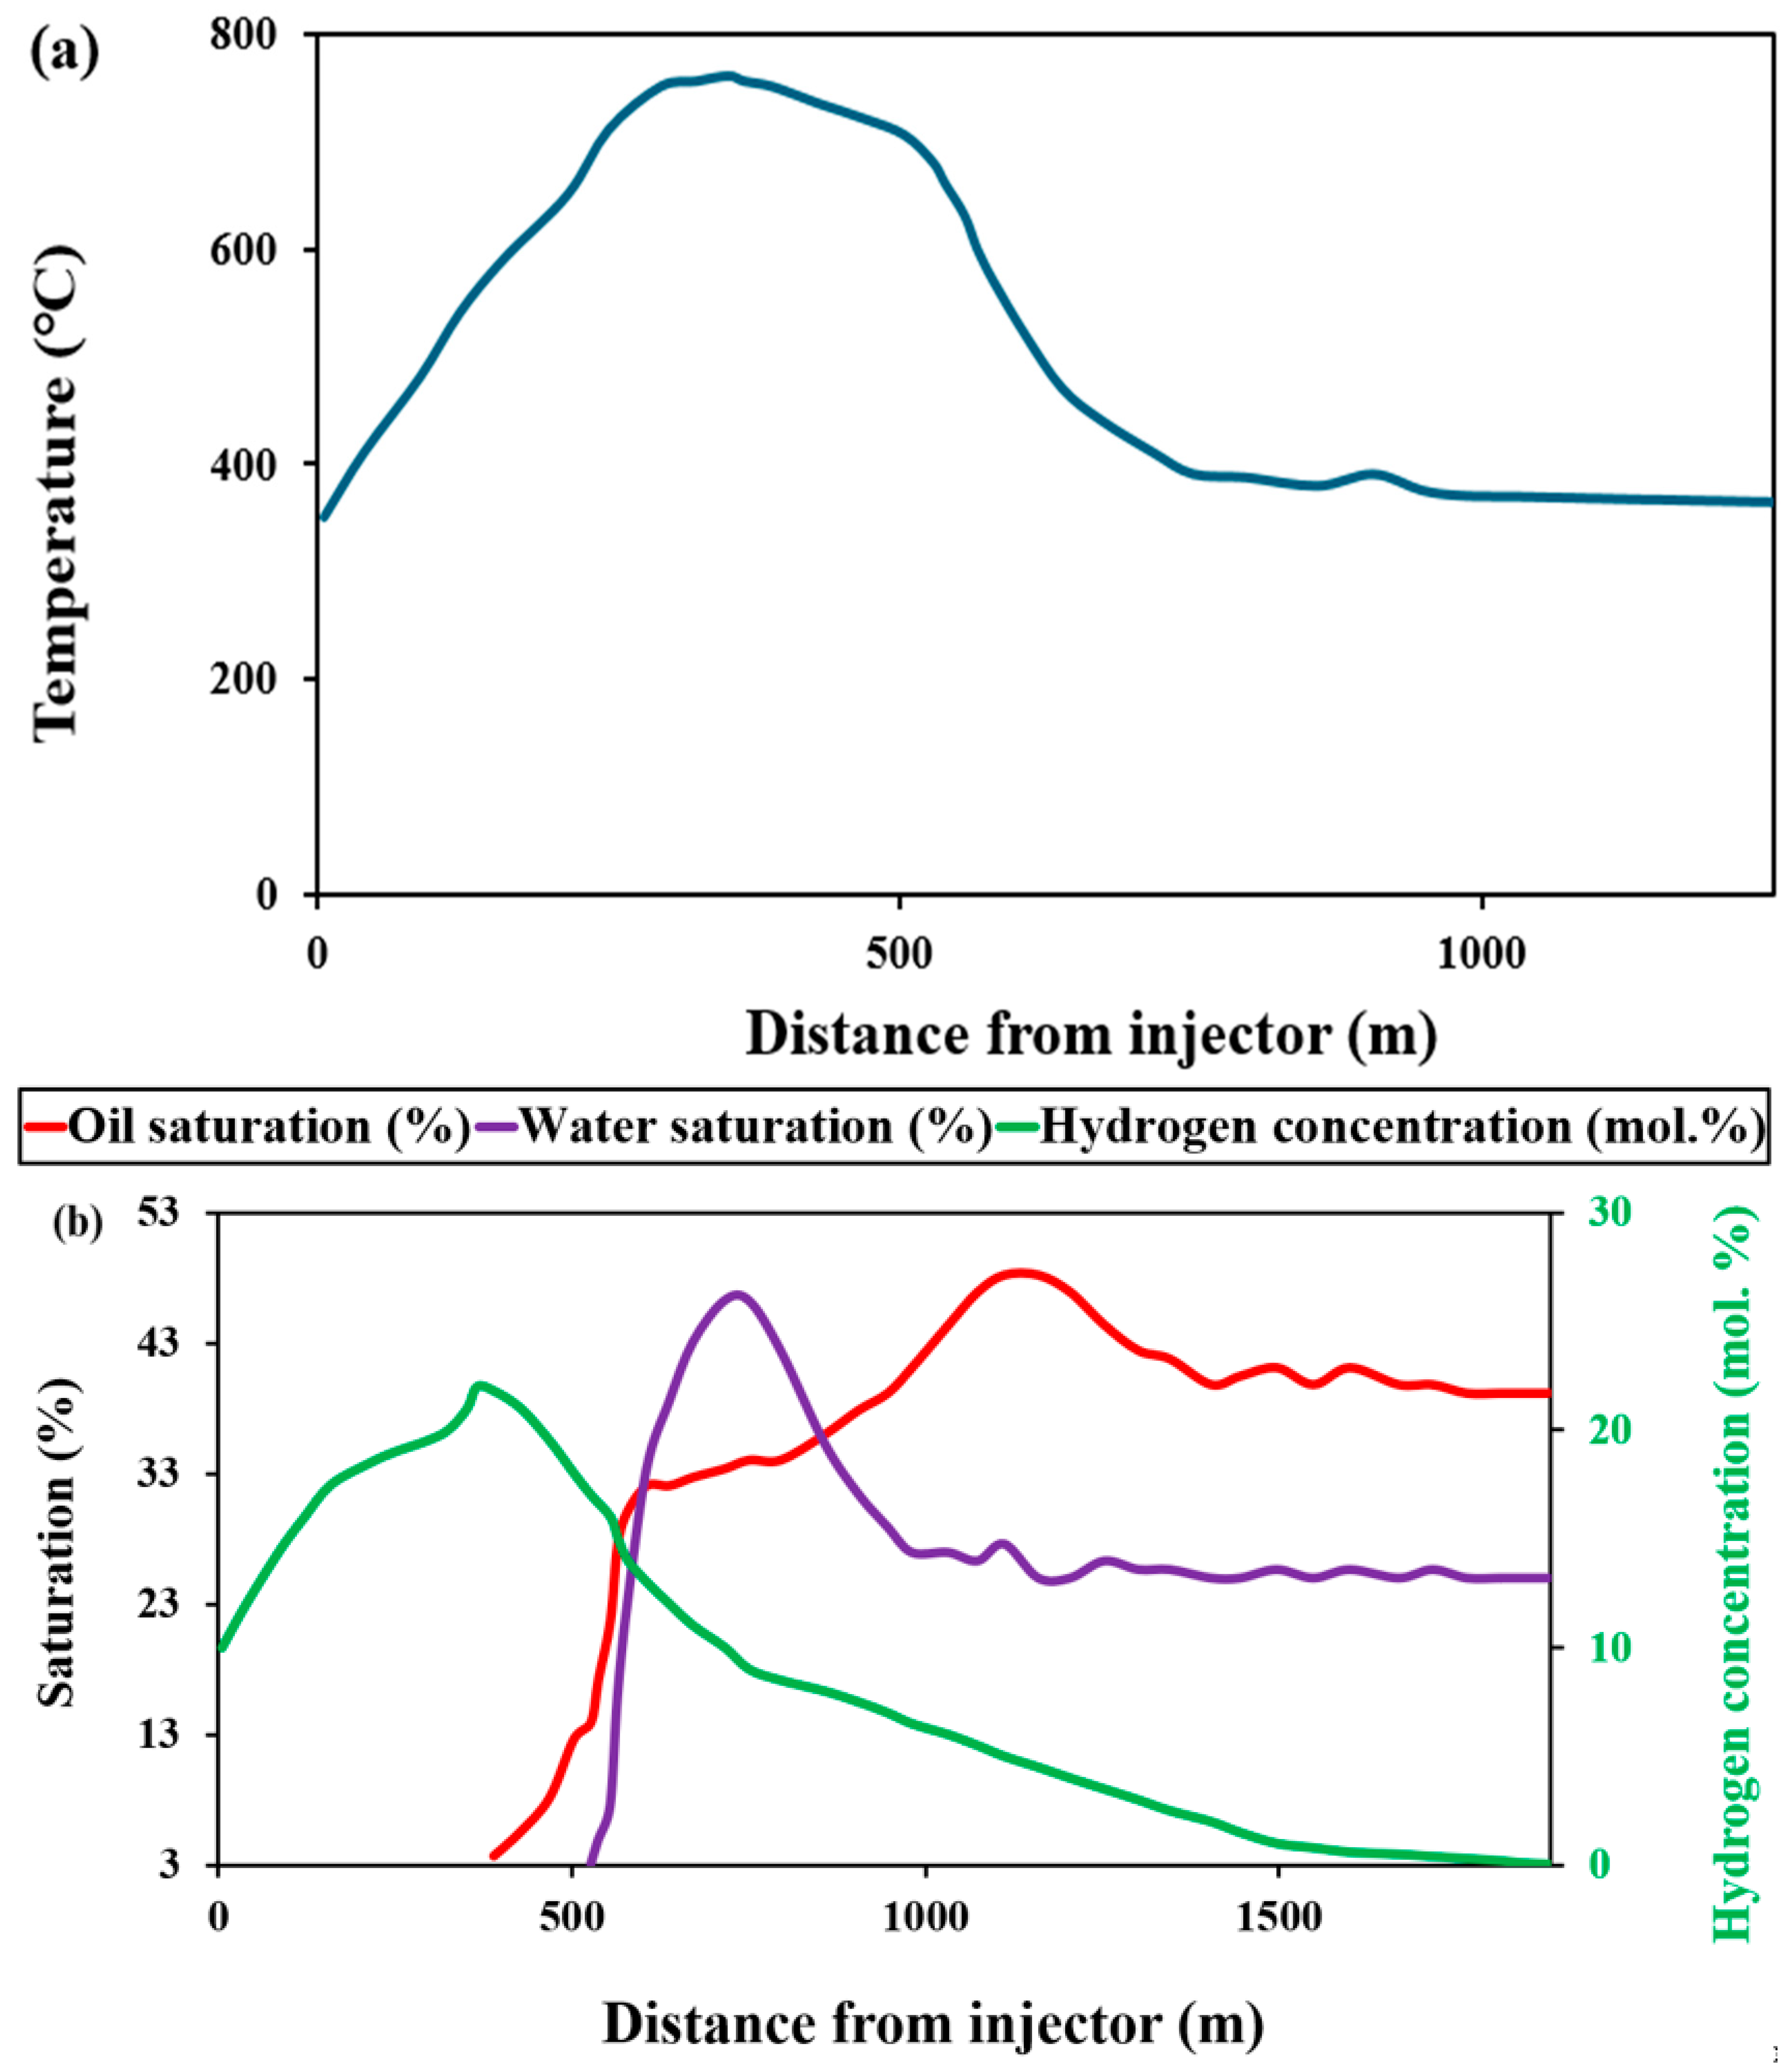
To investigate the impact of combustion front propagation from the injection well to the production well on hydrogen generation, we simulated the best-case injection strategy (i.e., cyclic steam/air) and initial reservoir temperature (350 °C) for long-term production (7305 days) from previous sections, and determine the propagation of the combustion front using oil saturation, water saturation, hydrogen concentration, and temperature distribution profiles along the injection well to the production well as shown in Figure 6.
As the combustion front advances through the reservoir, different thermal and compositional zones emerge, significantly influencing hydrogen generation and fluid saturations. The zone swept by the burning front is characterized by high temperatures, often exceeding 371 °C [75,76], leading to the evaporation of liquids, of which significant syngas, including hydrogen, gaseous hydrocarbons, and coke residues, could be present (Figure 6a). In this region, miscibility between the injected air and steam promotes oil displacement toward the production well (Figure 6b).
Immediately ahead of the burning front lies the “steam plateau,” a region with temperatures ranging from 93 °C to 204 °C [75]. Heat is transmitted forward by conduction through the reservoir rock and by convection due to the movement of vapors, gases, and steam from the combustion zone. This plateau region exhibits a steam-flooding effect, characterized by increased and stabilized water saturation and significant oil displacement. Hydrogen concentrations in this region gradually decline due to condensation and potential hydrogen-consuming reactions at low temperatures (Figure 6b).
Further ahead is the hot waterflood zone, where steam and oil condense, forming a lighter hydrocarbon bank [75]. Hydrogen generation in this region begins to decline significantly, as the lower temperatures reduce the rates of thermal cracking and gasification reactions that produce hydrogen. However, oil mobilization remains substantial, driven by the combined effects of heat transfer and steam-assisted displacement (Figure 6b). Beyond this zone lies the oil bank, composed of oil displaced from upstream zones and swept forward by the combustion front [75]. In this region, hydrogen concentrations are minimal, as thermal and hydrogen generation-reactions are not efficient. Finally, the unaffected reservoir oil is found ahead of the oil bank, remaining insulated from the thermal and chemical processes associated with the advancing combustion front.
This demonstrates that the propagation of the combustion front is a critical driver of hydrogen generation, with its thermal profile and mobility influencing reaction rates and hydrogen diffusivity across the reservoir. At the burning zone near the injector, high hydrogen generation is observed. However, as the combustion front propagates away from the injector, hydrogen generation progressively declines. This suggests a disparity between the hydrogen generated and the potential hydrogen that could be produced at the production well, likely due to technical challenges related to the propagation dynamics of the combustion front and possible hydrogen loss due to leakages and microbial activities.
Impact of Underground Hydrogen Migration and Diffusion on Hydrogen Generation
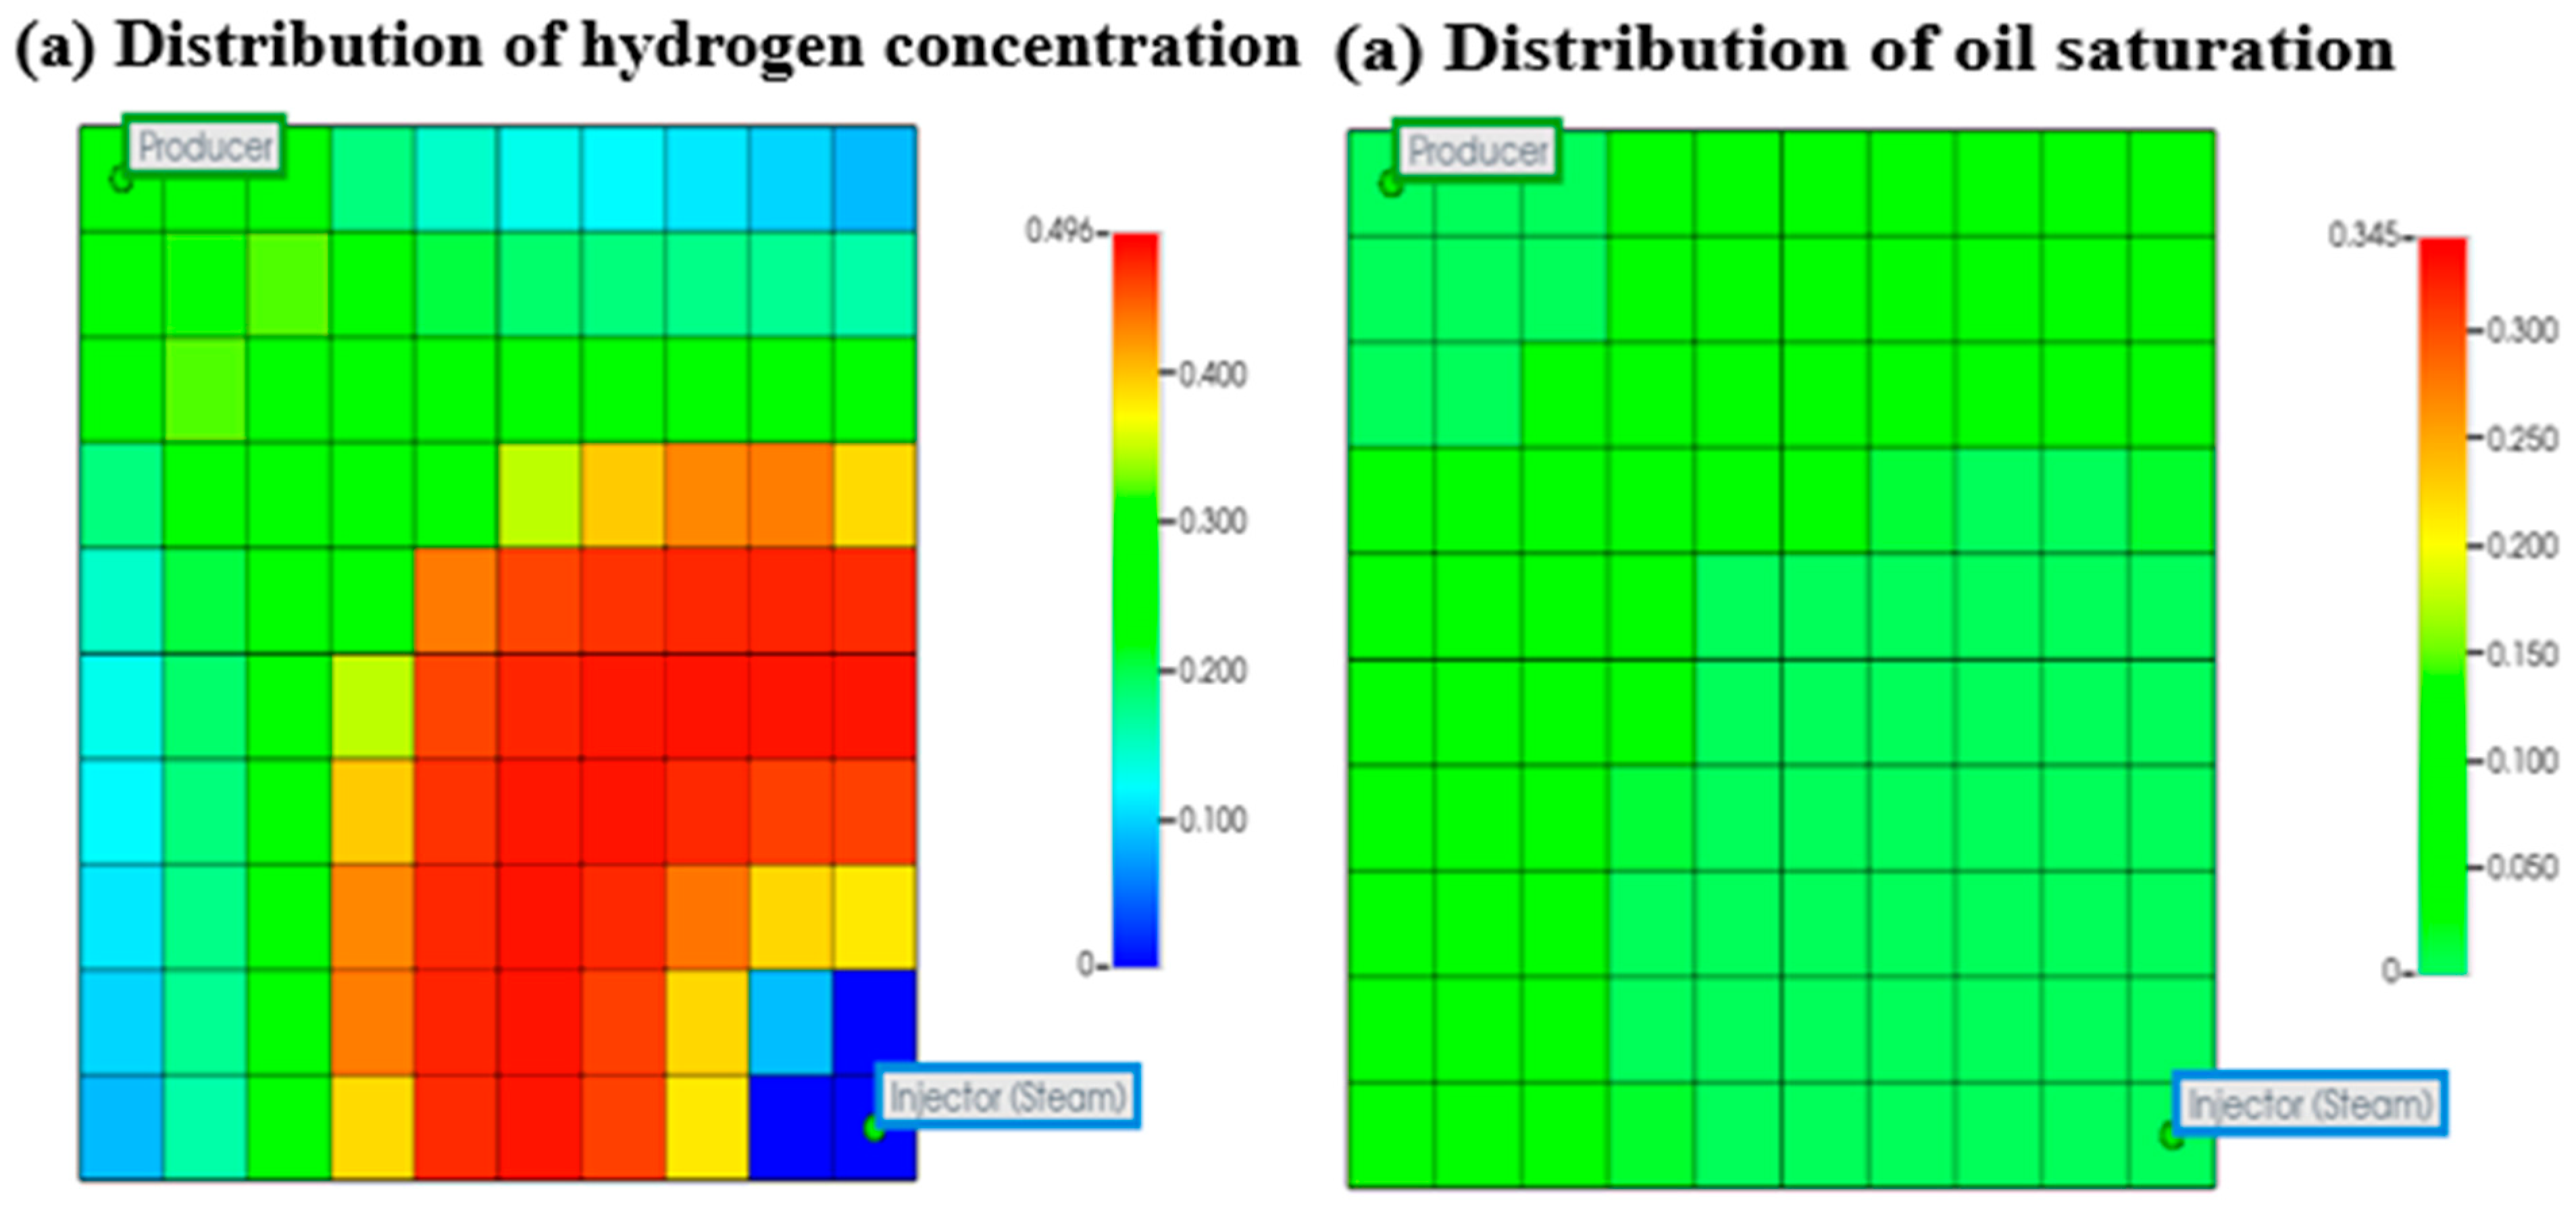
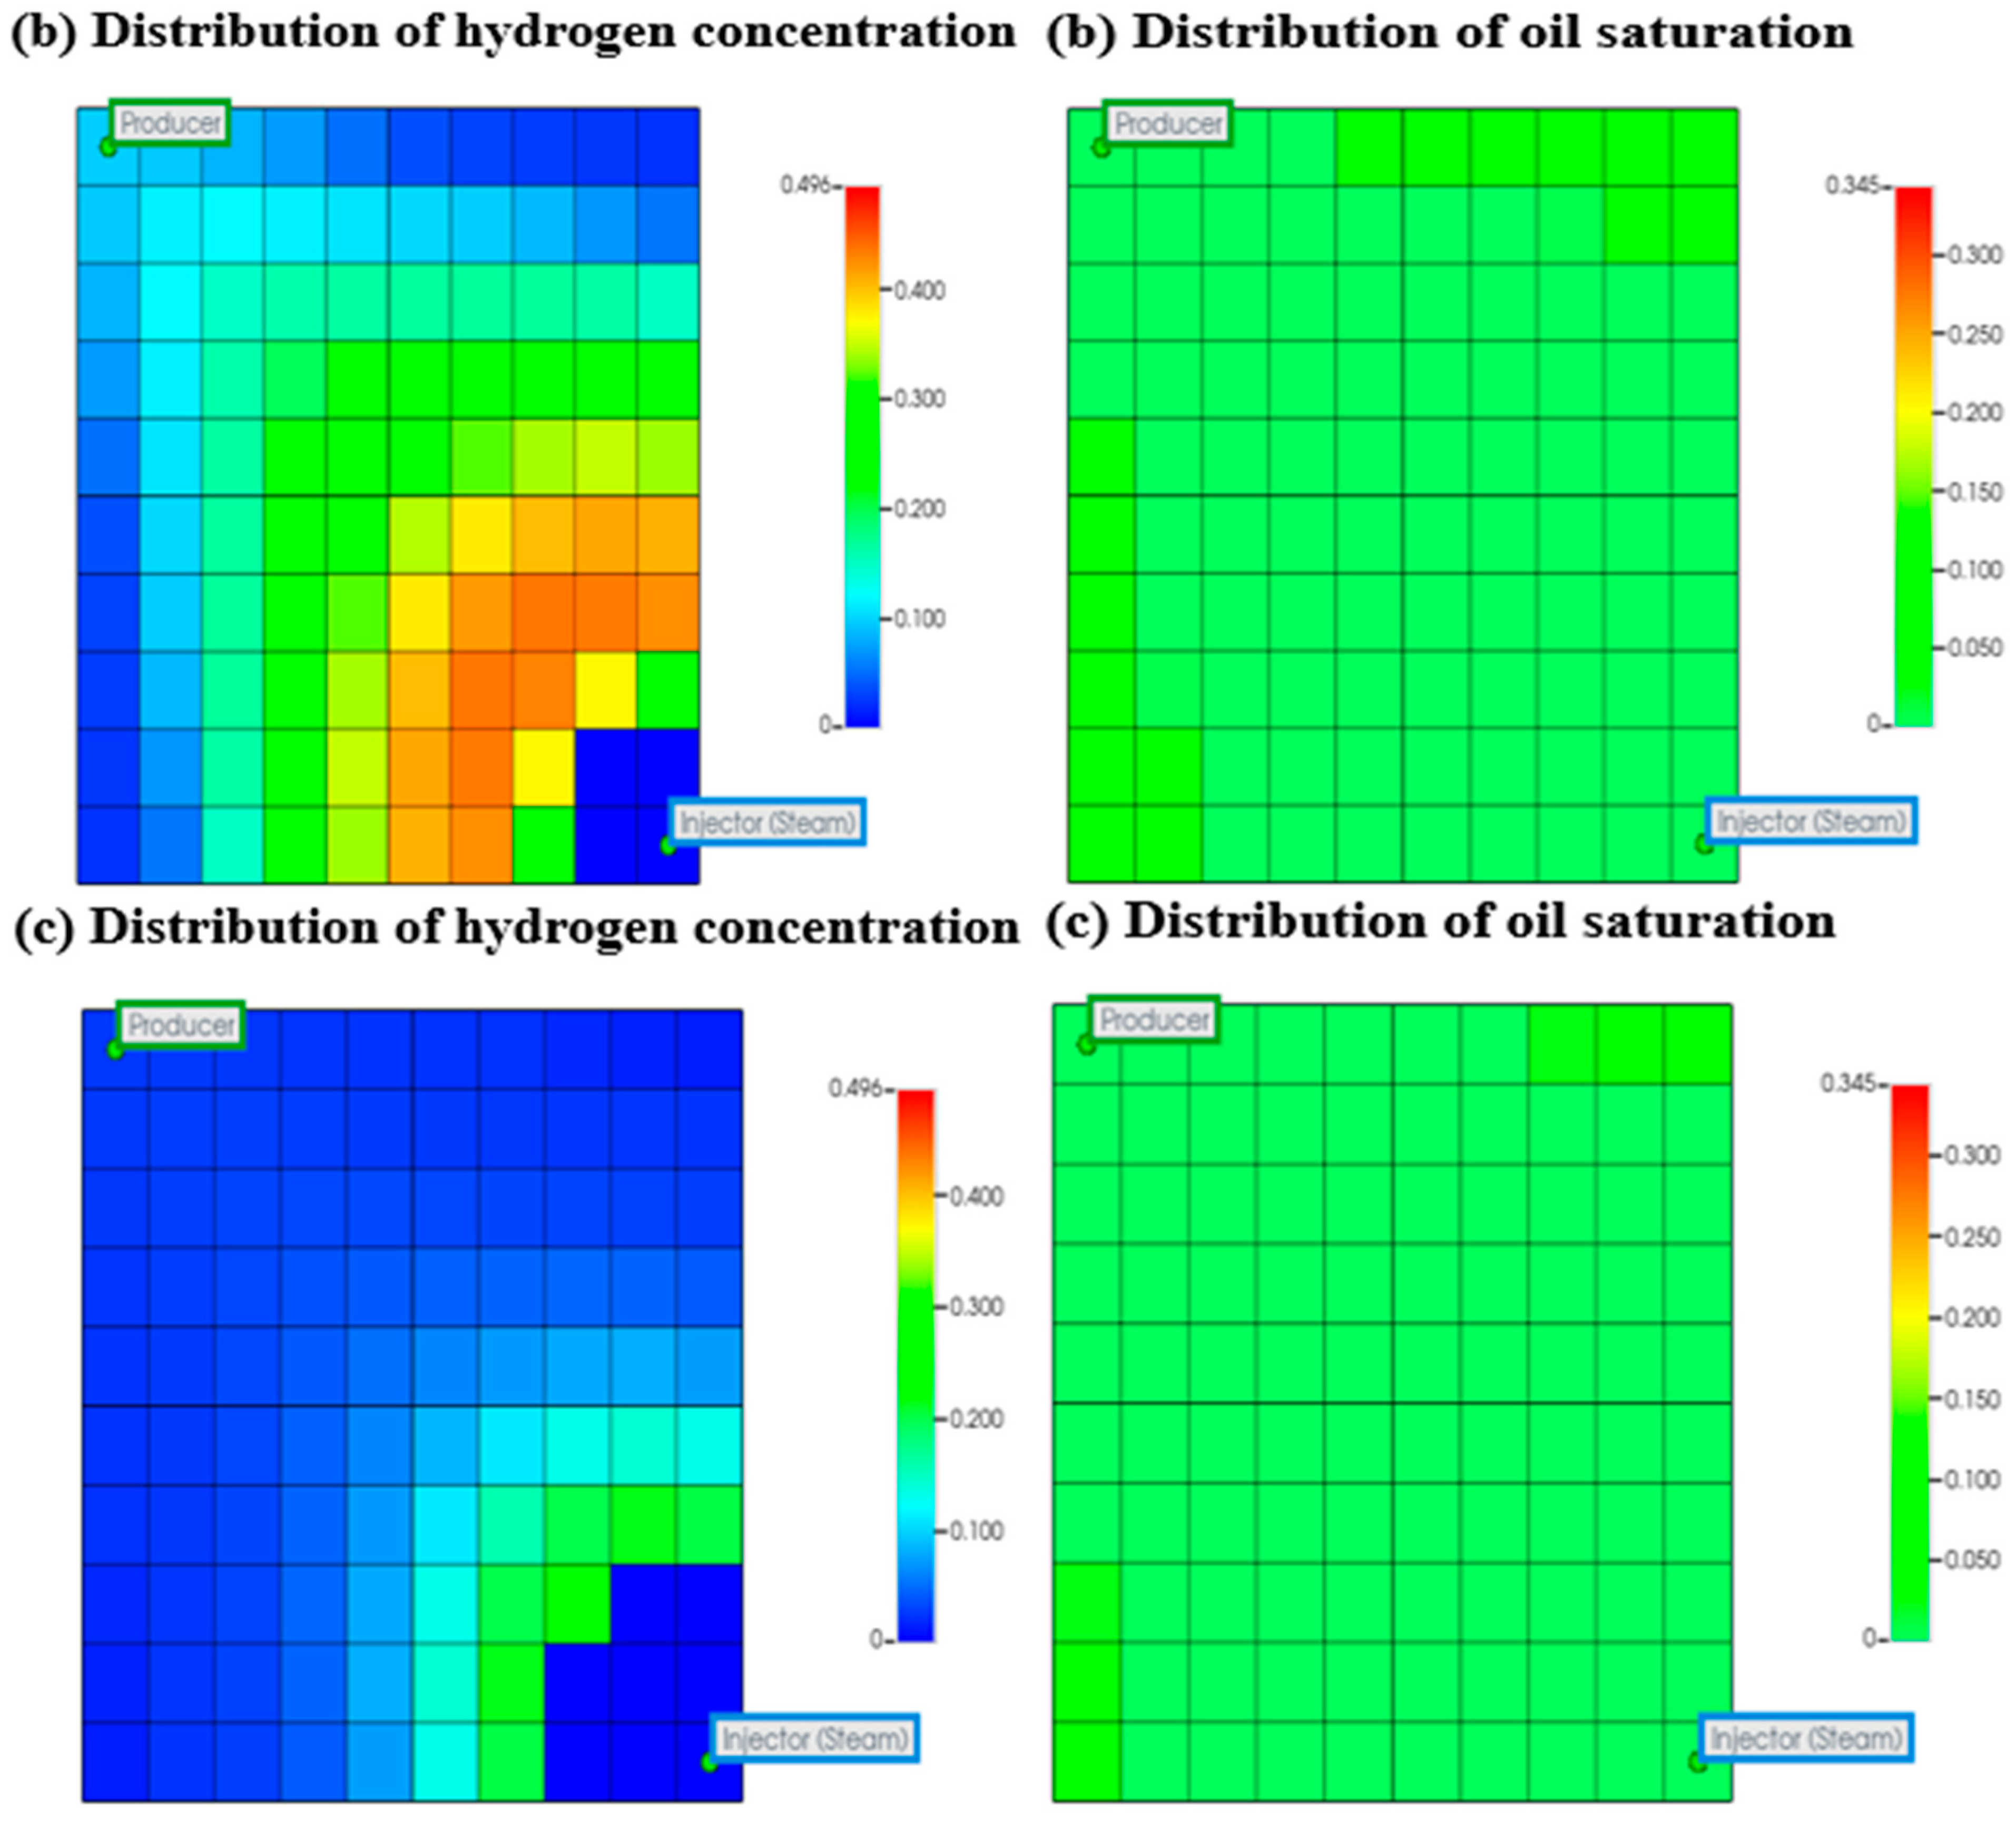
This section examines the migration and diffusion of hydrogen from the injection to production well over three annual production cycles, focusing on its influence on hydrogen generation and the role of oil saturation. The analysis was conducted using the injection strategy and parameters described in the previous section, with results presented in Figure 7.
As shown in Figure 7, hydrogen concentration is highest near the injection well for all cycles, with the first cycle showing the peak levels. This corresponds to the high hydrogen generation near the burning front close to the injector (Figure 6). Conversely, higher oil saturation is observed near the production well, which could reduce pore space availability and effective permeability for hydrogen migration. This oil saturation could increase viscous drag and lower the relative permeability of hydrogen, significantly hindering its flow toward the production well.
As production progresses from the first to the third cycle, the likelihood of hydrogen breakthrough at the producer diminishes, while oil breakthrough becomes more prominent (Figure 7). High oil saturation near the producer reduces effective permeability to hydrogen by occupying larger pores and creating a capillary barrier, which could impede hydrogen migration [77,78,79]. Because hydrogen is less wetting than oil, it will be difficult to displace oil and migrate effectively [80]. Additionally, hydrogen may be lost through leakages, microbial or chemical reactions, or become trapped, delaying or preventing its breakthrough at the production well.
Further, hydrogen can dissolve into the oil phase depending on reservoir conditions such as temperature, pressure, and the solubility characteristics of hydrogen in the oil phase [81]. Dissolved hydrogen does not contribute to the free gas phase migrating toward the producer, further delaying its recovery. This reflects the challenges of achieving efficient hydrogen production due to the interplay of hydrogen diffusion, migration, and oil saturation.

3.1.3. Impact of Formation Damage on Hydrogen Generation

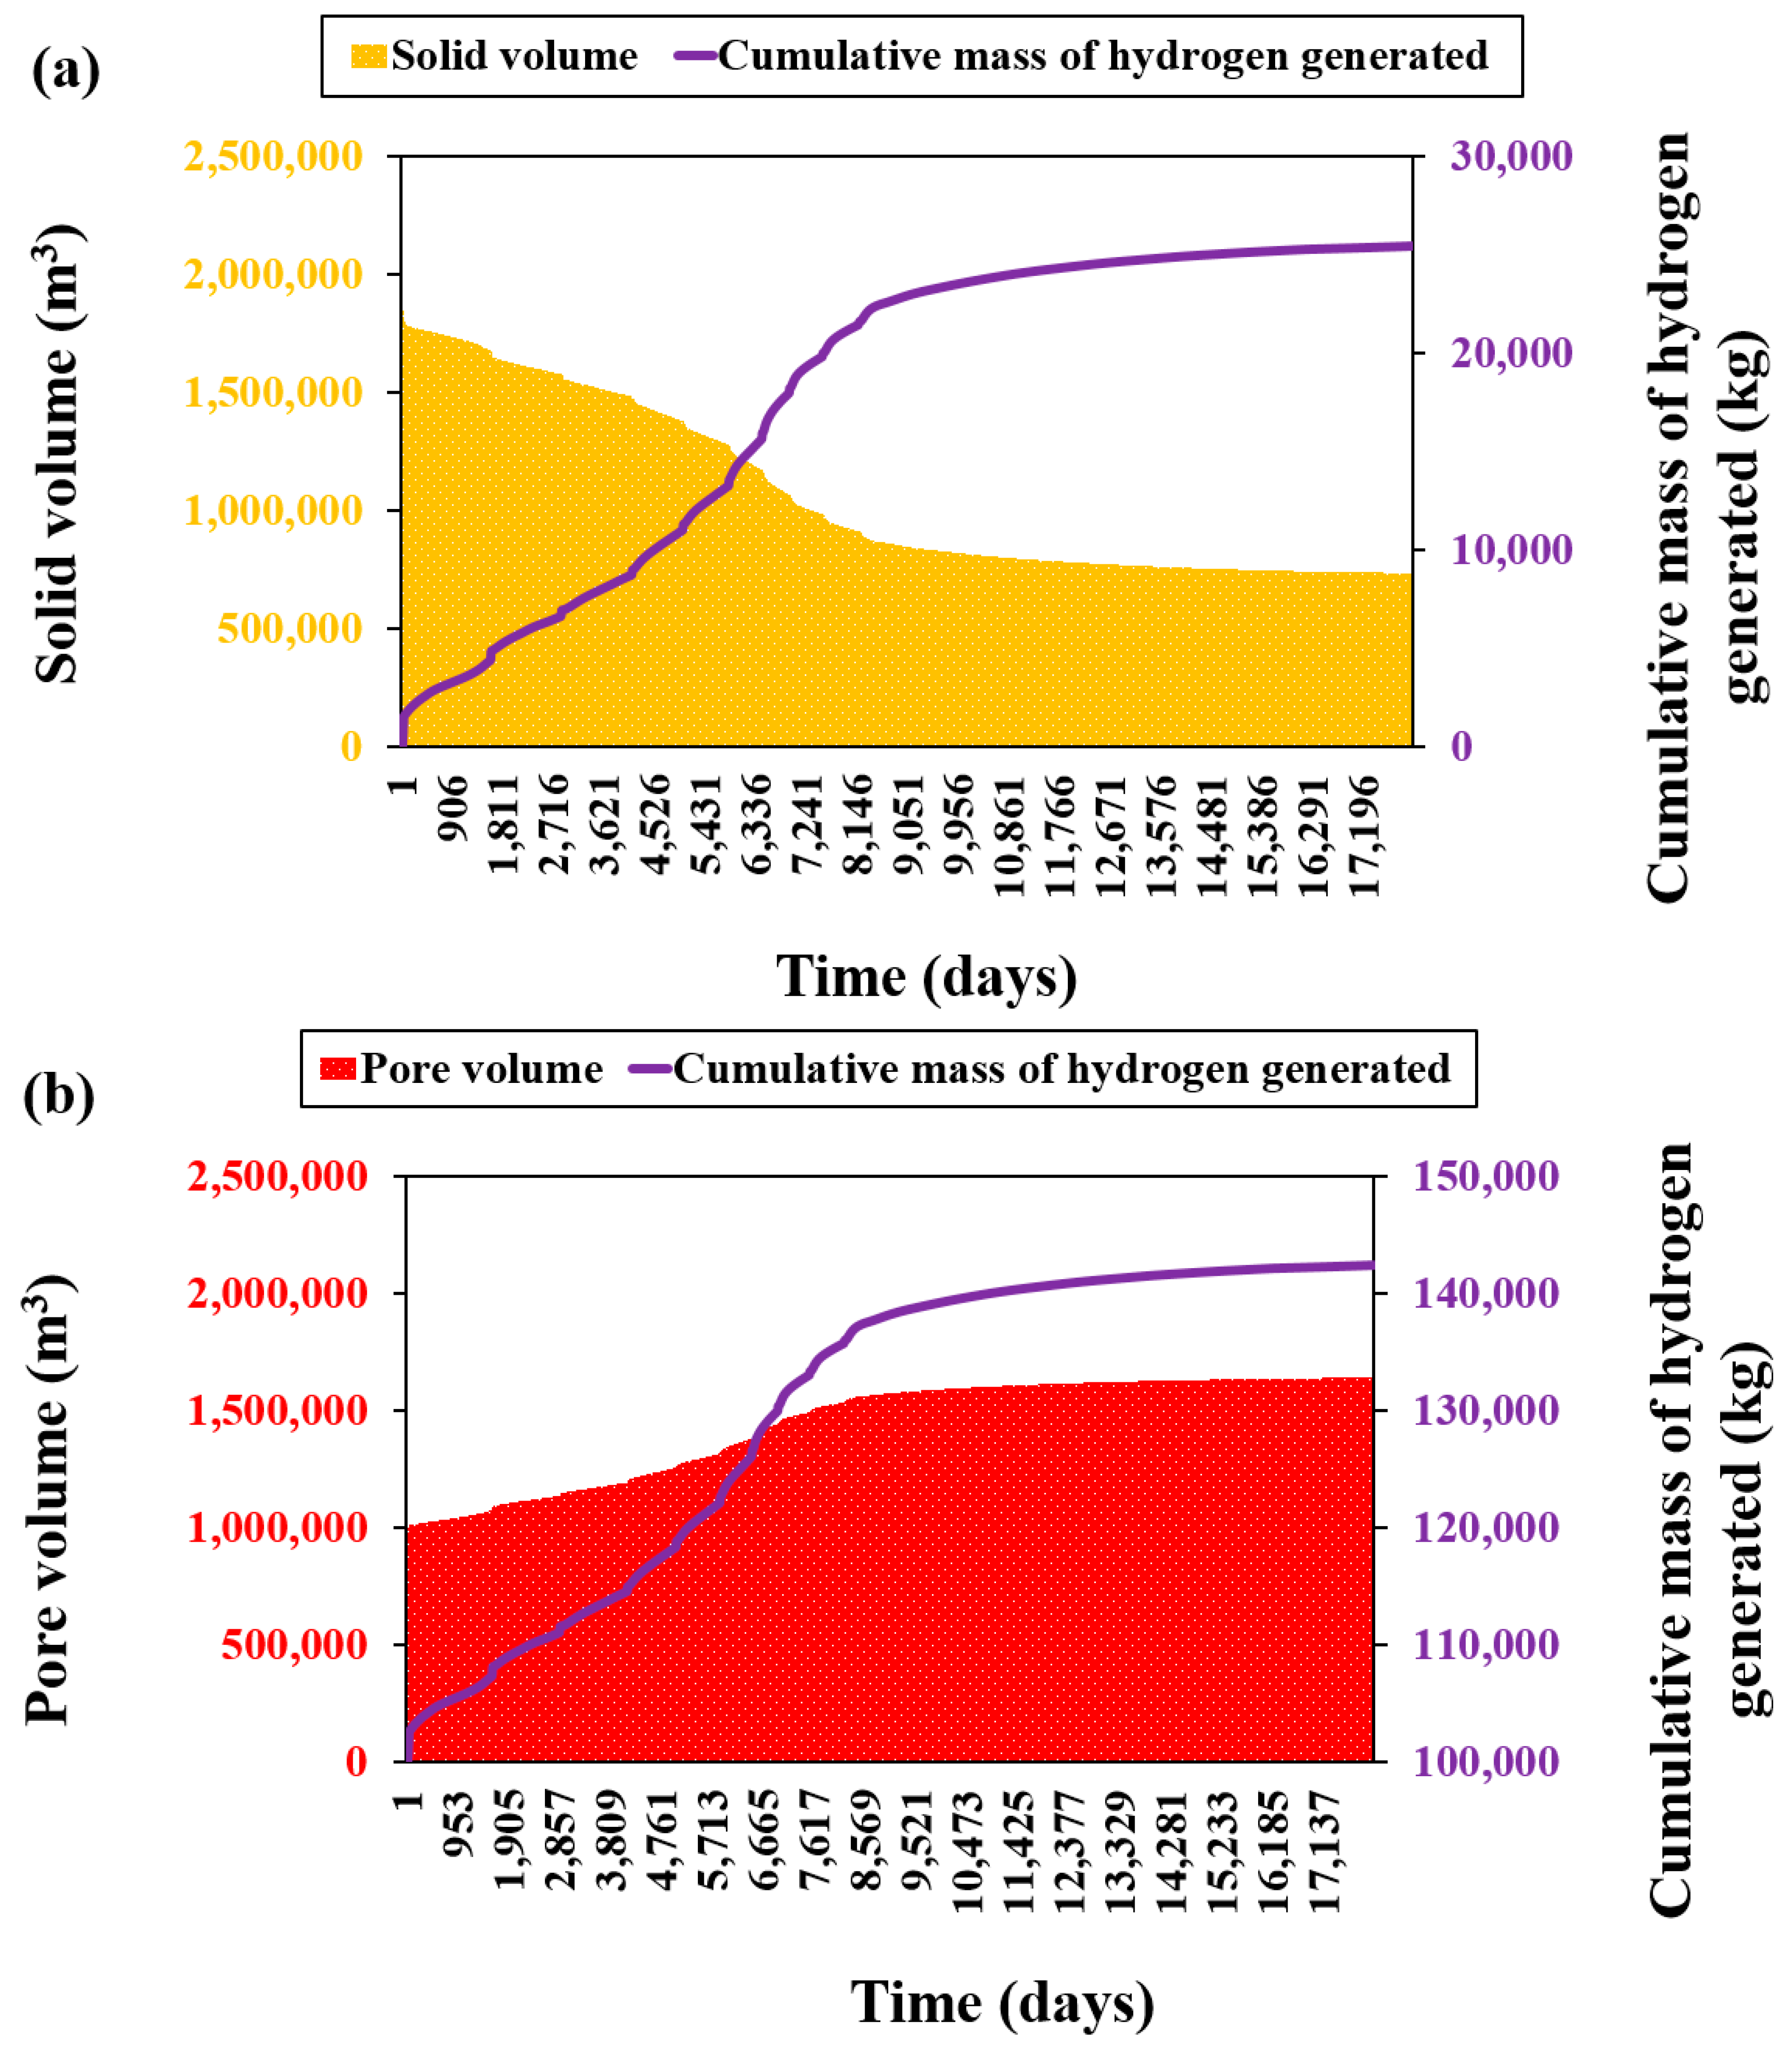
In this section, the relationship between pore volume, solid volume, and hydrogen generation was investigated under initial reservoir temperature conditions (650 °C) through simulation parameters for cyclic steam/air injection specified in previous section. The objective is to investigate the impact of formation damage on hydrogen generation due to solid deposition. Two key plots in Figure 8 were analyzed.
Figure 8 reveals an inverse correlation between solid volume and hydrogen generation, mediated by changes in pore volume. Regions of high solid volume correspond to significantly reduced pore volume and exhibit the lowest hydrogen generation rates. This behavior is consistent with the fundamental theory of formation damage, where the accumulation of solid-phase materials, such as coke and asphaltene plug pore spaces, leading to decreased permeability and limited transport of reactants (e.g., oxygen, water, and hydrocarbons) to reaction zones [82,83,84,85,86,87,88,89]. The restricted reactant flow inhibits key reactions, such as thermal cracking, gasification, and water-gas shift, which are necessary for hydrogen production.
As solid volume decreased, likely due to the progression of gasification reactions, pore volume increased, enhancing reactant transport and facilitating higher hydrogen generation rates. The observed stabilization of solid and pore volumes (Figure 8) corresponds to the establishment of a quasi-steady-state system, where the balance between solid formation (via incomplete combustion) and solid consumption (via gasification) maintains a stable pore network. Consequently, hydrogen production also stabilizes, reflecting equilibrium between reactant availability and reaction kinetics.
These findings are consistent with the principles of porous media flow and chemical reaction processes, wherein solid deposition acts as a primary factor influencing transport properties and reaction rates in thermal recovery processes [90]. Furthermore, the results represent the detrimental impact of formation damage on hydrogen recovery [14]. Regions with severe pore blockage are less effective in generating hydrogen, highlighting the importance of mitigating solid-phase accumulation during in situ gasification.
The technical investigation revealed key challenges affecting hydrogen production from heavy oil reservoirs. Issues such as injection strategies, initial reservoir temperature, combustion front propagation, hydrogen migration, diffusion, and loss mechanisms contribute to discrepancies between in situ hydrogen generation and surface production, with the former being higher. These technical hurdles may explain why companies that observed hydrogen co-production during field projects (Table 1) opted to prioritize crude oil extraction over hydrogen production. Evaluating the cost-effectiveness of produced hydrogen is thus essential to inform investment decisions. The subsequent sections will present a detailed economic analysis to address these considerations.

3.2. Economic Aspects of Hydrogen Production

3.2.1. Cost and Profitability Analysis of Hydrogen Production

In this section, we evaluate the economic feasibility of hydrogen production from heavy oil reservoirs using in situ combustion gasification, based on the simulation results in Figure 4. The cumulative hydrogen yield from our simulation over a 20-year period was 1,818,836 kg for cyclic steam/air injection and 701,928 kg for CO2 + O2 injection.
Capital and Operating Costs
For the purpose of this analysis, capital and operating costs are based on the publicly available data from Proton Technologies’ hydrogen production technology, as outlined in [91]. The capital and operating costs are as follows:
Capital expenditures (CAPEX): Total initial capital expenditures for the infrastructure required for hydrogen production are estimated at US$ 340 million. This covers:
  • US$ 245 million for the construction of air separation units (ASUs);
  • US$ 65 million for hydrogen purification systems;
  • US$ 20 million for hydrogen pipeline infrastructure;
  • US$ 10 million for production well development.
Operating expenditures (OPEX): Annual operating costs, which include labor, maintenance, and administrative expenses, are estimated at US$ 1.8 million per year, broken down as follows:
  • US$ 1.37 million for labor and staffing;
  • US$ 0.4 million for administrative and operational expenses;
  • US$ 0.03 million for facility insurance.
Revenue from Hydrogen Production
Revenue from hydrogen production is another vital component in assessing the profitability of the project. The revenue from hydrogen production is calculated by multiplying the total hydrogen produced by the price per kilogram, assumed to be US$ 3.00 per kg [92]. For the cyclic steam/air injection strategy, which produces 1,818,836 kg of hydrogen over the 20 years, the total revenue is approximately US$ 5.46 million. In contrast, the CO2 + O2 injection strategy produces 701,928 kg of hydrogen, generating US$ 2.10 million in revenue over the same period. This disparity in hydrogen yield results in significantly different costs per kilogram of hydrogen, which is a crucial factor in determining the overall economic viability of each strategy.
Cost per Kilogram of Hydrogen Produced
To evaluate the cost-effectiveness of hydrogen production, we calculate the cost per kilogram of hydrogen produced. This is derived by dividing the total capital and operating costs over the 20-year period by the cumulative hydrogen yield. The capital costs are annualized based on the initial US$ 340 million capital expenditure, resulting in an annual capital cost of US$ 17 million. Adding the annual operating costs of US$ 1.8 million results in a total annualized cost of US$ 18.8 million.
The cost per kilogram of hydrogen for each strategy is then calculated:
Cyclic steam/air injection: With a total hydrogen production of 1,818,836 kg, the cost per kilogram of hydrogen is:
C o s t   p e r   k g = 18.8   m i l l i o n   U S D 1,818,836   k g   10.3   U S D / k g
CO2 + O2 injection: With a total hydrogen production of 701,928 kg, the cost per kilogram of hydrogen is:
C o s t   p e r   k g = 18.8   m i l l i o n   U S D 701,928   k g   26.8   U S D / k g
The higher cost per kilogram of hydrogen produced using the CO2 + O2 injection method is primarily attributed to the lower hydrogen yield compared to cyclic steam/air injection. The cumulative yield from CO2 + O2 injection over 20 years is far lower than the cyclic steam/air injection. This disparity results in a higher allocation of capital and operating costs to each unit of hydrogen produced, thus increasing the cost per kilogram.
Additionally, the CO2 + O2 injection method may be less efficient in terms of combustion, which could lead to inefficient hydrogen generation. This inefficiency likely increases energy consumption and operational costs, further increasing the overall production cost. The need for specialized equipment and monitoring systems to handle the complexities of CO2 and oxygen injection also contributes to the higher capital and operational costs.
Another factor is the carbon management costs associated with CO2 injection. If the CO2 is not efficiently captured or stored, additional infrastructure may be required, leading to higher costs. These added expenditures likely contribute to the higher per-kilogram cost of hydrogen from the CO2 + O2 injection method compared to the cyclic steam/air injection process.
Economic Comparison with Competing Methods
When comparing the costs of hydrogen production from heavy oil reservoirs to those of conventional methods such as water electrolysis and SMR, the production costs from in situ combustion gasification are higher. The current cost of hydrogen production through electrolysis ranges from US$ 4 to US$ 7 per kg [93], while SMR typically produces hydrogen at US$ 1 to US$ 3 per kg [94]. Thus, the costs from both cyclic steam/air injection and CO2 + O2 injection are higher than those of these traditional methods.
However, in situ combustion gasification may still be economically viable in regions where oil extraction infrastructure is already in place. In such scenarios, the upfront capital costs can be mitigated by leveraging existing oil wells, pipelines, and facilities, which reduces the need for new infrastructure. This could make hydrogen production from heavy oil reservoirs more attractive in specific contexts, particularly where other hydrogen production methods are less feasible due to logistical or geographical constraints.
The significantly higher cost associated with the CO2 + O2 injection method, however, suggests that it may only be economically viable under special circumstances. This could include access to carbon credits, government incentives, or the integration of the process with EOR techniques, which could help offset the higher production costs.
Opportunities for Cost Reduction
To improve the economic feasibility of hydrogen production from heavy oil reservoirs, several strategies could be deployed. Technological improvements in air separation units, hydrogen purification systems, and combustion efficiency could help reduce both capital and operating costs. Enhancing combustion efficiency and minimizing energy losses could lower operational expenses and improve overall cost-effectiveness.
Economies of scale can also play a role in reducing production costs. As the scale of hydrogen production increases, both capital costs and operating costs per unit of hydrogen are likely to decrease. Larger production facilities can help optimize resource utilization, thereby improving the cost structure.
Moreover, carbon management innovations, such as more cost-effective CO2 capture and storage technologies, may reduce the additional costs associated with CO2 injection. Furthermore, integrating renewable energy sources into the production process, such as using wind or solar energy to power the air separation units, could lower operational costs and improve the overall environmental profile of the hydrogen production process.

3.2.2. Breakeven Analysis

Breakeven analysis is critical in determining the economic viability of hydrogen production strategies, helping to identify the price and quantity of hydrogen required to cover total costs. In this section, we calculate both the breakeven price (Pb) and the breakeven quantity (Qb), which are essential metrics for evaluating the profitability of each production strategy.
The breakeven price is the price per kilogram of hydrogen at which the total revenue from hydrogen production equals the total costs (capital and operating). It can be calculated by dividing the total annualized costs by the total hydrogen production over the project lifespan. The equation for breakeven price is given by:
P b = C t o t a l Q a n n u a l
where Ctotal is the total annualized cost (USD), and Qannual is the annual hydrogen production (kg).
For the cyclic steam/air injection strategy, the breakeven price was found to be significantly higher than the assumed market price of hydrogen (US$ 3.00 per kg), calculated at US$ 206.5 per kg. For the CO2 + O2 injection strategy, the breakeven price was calculated to be US$ 536.5 per kg, which is also well above the market price. This substantial difference indicates that both strategies would not achieve profitability at the current market price, emphasizing the need for cost reductions or efficiency improvements to make these methods commercially viable.
Additionally, the breakeven quantity represents the minimum amount of hydrogen that must be produced to cover the total costs at the market price of hydrogen. This is calculated by dividing the total annualized costs by the market price of hydrogen. The equation for breakeven quantity is expressed as:
Q b = C t o t a l P m a r k e t
where Pmarket is the market price of hydrogen (US$ per kg).
For both strategies, the breakeven quantity was found to be approximately 6.27 million kg per year. This represents the production levels needed to achieve profitability at the assumed market price of US$ 3.00 per kilogram of hydrogen. This shortfall in hydrogen production relative to the breakeven quantity illustrates a considerable gap between the required and actual production levels, which would prevent either strategy from being profitable under current conditions.
These results highlight the challenges of achieving profitability in hydrogen production using the examined strategies. To move toward profitability, it is essential to explore opportunities for scaling up production, reducing costs, improving process efficiency, and potentially integrating additional revenue streams such as government subsidies or carbon credits. Enhancing the economic performance of these strategies could help bring the breakeven quantity within achievable production levels, thereby making them more commercially viable.

3.3. Comparative Techno-Economic Analysis of Hydrogen and Oil Recovery Strategies

A techno-economic model was developed within the GoldSim environment, organized according to the cost components outlined in Section 2.2 to facilitate the project’s economic evaluation under specified scenarios. The model integrates a time series of outputs generated by CMG STARS as inputs for the economic evaluation.
The primary cost and economic drivers vary across injection strategies. For example, CO2 + O2 injection requires the inclusion of recycling facilities and CO2 supply, whereas cyclic steam/air injection avoids these capital and input expenses. However, it typically incurs higher operational costs due to the energy required for steam generation. The techno-economic evaluation of the steam/air and CO2 + O2 injection strategies for hydrogen and oil recovery, highlighting critical differences in revenue generation, operational costs, and CO2 management requirements, is shown in Table 6.
Table 6 reveals that while both strategies show potential for hydrogen and oil co-production, the economic viability of hydrogen production remains limited, particularly when compared to oil revenue. This disparity suggests that, for new fields, oil production offers a more economical investment, while hydrogen production may only become feasible under specific conditions or as part of broader clean energy initiatives.
For the steam/air injection strategy, cumulative hydrogen production and revenue are highest in HQR, generating $11.14 million in revenue. In comparison, cumulative oil production in HQR generated $27 million in revenue, more than double the hydrogen revenue. Similarly, in MQR, hydrogen production generates $43,737, compared to $617,391 from oil. This explains the dominant economic contribution of oil revenue under this strategy, despite the absence of CO2 procurement costs and the relatively higher operational costs associated with steam generation.
The CO2 + O2 injection strategy shows a similar trend. For HQR, cumulative hydrogen production yields $8.09 million, while cumulative oil production generates $21.43 million in revenue. Fresh CO2 purchase costs further reduce the net economic benefits, with expenses reaching $8.64 million in HQR. This strategy’s reliance on CO2 procurement and recycling infrastructure also decreases its overall economic attractiveness, particularly in reservoirs of lower quality.
Reservoir quality significantly influences the economic potential of both strategies. LQR and ULQR exhibit limited production capacities and economic viability. For instance, hydrogen revenue from ULQR under the steam/air strategy is only $473.22, with oil revenue at $2589.48. In contrast, HQR under the same strategy generates over 23,000 times the revenue from hydrogen and over 10,000 times the revenue from oil. These findings suggest that LQR and ULQR offer limited potential for hydrogen, making them economically unattractive for investment.
Table 6 also reveals that the significantly higher revenue from oil production in all reservoir categories makes hydrogen production economically less favorable, particularly for new fields. Although hydrogen production aligns with clean energy goals, the current economic landscape indicates that it is not a competitive alternative to oil revenue. However, the co-production of hydrogen and oil in specific fields may require further investigation, particularly if technological advancements or policy incentives improve hydrogen’s economic feasibility.
Factors contributing to the economic disparity between hydrogen and oil production include the relatively low hydrogen yield due to the technical issues mentioned in Section 3.1, higher operational and infrastructure costs associated with hydrogen production, the relatively low market value of hydrogen compared to oil, and the capital-intensive requirements for CO2 management in the CO2 + O2 strategy. Additionally, field-specific factors such as reservoir quality, infrastructure availability, and market conditions play critical roles in determining the economic outcomes.

3.4. Discussion

The question of whether hydrogen can be produced cost-effectively from heavy oil reservoirs is central to the findings of this study. Despite the reported field projects by top energy companies that discovered hydrogen production potential from heavy oil reservoirs (Table 1), these projects have not continued with hydrogen production today. This could likely be attributed to the significant technical and economic challenges associated with the process. Our analysis indicates that, under current conditions, hydrogen production from heavy oil reservoirs is not cost-effective enough to justify its widespread adoption unless a revolutionary technology is developed to overcome the technical hurdles or a more efficient production strategy is implemented to address the economic barriers.
Technically, the major challenge lies in the efficiency of hydrogen generation. Both the steam/air and CO2 + O2 injection strategies demonstrate potential for hydrogen co-production; however, each strategy is faced with significant limitations. The steam/air injection method, while simpler and more cost-effective in terms of infrastructure requirements, leads to relatively low hydrogen yields and remains economically unattractive, especially when hydrogen production is secondary to oil recovery. The CO2 + O2 injection method, although capable of increasing hydrogen production, introduces additional complexities due to the need for CO2 procurement, capture, and storage systems. These technical challenges hinder the scaling of hydrogen production from heavy oil reservoirs and contribute to the lack of commercial viability observed in the field projects discussed in Table 1.
Economically, the analysis reveals that the cost of hydrogen production far exceeds its potential market value under current conditions. With the hydrogen market price around US$3.00 per kg, the breakeven price for both injection strategies is much higher, indicating that neither strategy can be considered economically viable at this time. In fact, the breakeven quantity of hydrogen required to cover production costs is approximately 6.27 million kg per year, which is far beyond the production levels achievable with the current technology. This suggests that, unless there is a substantial reduction in production costs or a dramatic increase in hydrogen yield, hydrogen production from heavy oil reservoirs will not be economically feasible.
Key cost drivers contributing to the high cost of hydrogen production include the energy-intensive nature of the steam generation process in the steam/air strategy and the substantial expenses related to CO2 procurement, capture, and storage in the CO2 + O2 strategy. The costs associated with operating and maintaining the infrastructure for both methods, including the need for specialized equipment and personnel, further elevate the overall cost structure. Additionally, the economic dominance of oil production in both strategies suggests that hydrogen production is a secondary consideration in terms of revenue generation, which makes it difficult to justify the investment in hydrogen production unless there are additional incentives or external revenue streams (e.g., carbon credits or government subsidies).
The comparative analysis also highlights the sensitivity of these strategies to reservoir quality. In higher-quality reservoirs, hydrogen production potential is greater, but even in these cases, oil production remains the dominant revenue source. In lower-quality reservoirs, hydrogen production is minimal and does not contribute significantly to the overall economic feasibility of the project [95]. This indicates that hydrogen production is unlikely to be the primary driver of economic returns in most heavy oil reservoirs, especially when considering the substantial upfront and operational costs required for hydrogen generation.
In conclusion, while hydrogen production from heavy oil reservoirs holds theoretical promise, the technical and economic challenges outlined in this study suggest that, under current conditions, it is unlikely to be cost-effective enough to compete with conventional oil production. Unless a breakthrough technology is introduced to overcome the technical barriers or a smarter, more cost-efficient production strategy is developed, hydrogen production from heavy oil reservoirs will remain an uncompetitive alternative to traditional oil recovery. Future research should focus on addressing these technical and economic challenges, exploring innovations in production processes, and identifying ways to improve hydrogen yield and reduce costs, potentially through integration with renewable energy sources or government support mechanisms.

4. Concluding Remarks

The production of hydrogen from heavy oil reservoirs holds significant theoretical promise, offering a potential pathway to both EOR and the generation of clean energy. However, as demonstrated in this study, there are substantial technical and economic challenges that currently prevent this process from being a commercially viable alternative to conventional oil recovery. Both steam/air and CO2 + O2 injection strategies, while showing potential for hydrogen co-production, are hindered by high production costs, limited hydrogen yields, and the complex infrastructure requirements associated with each method.
The simulations show that hydrogen yields from in situ combustion gasification of heavy oil remain below 1.5 Sm3/kg of fuel burned, with production costs more than double the current market price. The techno-economic analysis further highlights that oil revenues are consistently higher than hydrogen revenues across all scenarios, confirming oil as the primary economic driver. Even in higher-quality reservoirs, where hydrogen production potential is greater, oil recovery remains the primary focus.
Key achievements of this work include: (i) establishing validated simulation workflows that couple reservoir and techno-economic models, (ii) quantifying the economic thresholds at which hydrogen might become competitive, and (iii) identifying priority areas, such as cost reduction in steam generation and CO2 capture, that require innovation before commercial deployment is feasible.
In conclusion, unless breakthrough technologies emerge to address the technical barriers or more efficient production strategies are developed, hydrogen production from heavy oil reservoirs will likely remain an uncompetitive option. Future research should focus on innovative solutions to enhance hydrogen yields, reduce operational costs, and explore the integration of renewable energy sources or government incentives to support the commercialization of this process.

Supplementary Materials

The following supporting information can be downloaded at: https://www.mdpi.com/article/10.3390/en18205539/s1. References [11,12,24,26,41,42,59,60,61,95] are cited in the Supplementary Materials.

Author Contributions

Conceptualization, C.J.O.; Methodology, C.J.O.; Validation, C.J.O. and J.J.S.; Formal analysis, J.J.S.; Data curation, C.J.O.; Writing—original draft, C.J.O. and J.J.S.; Writing—review & editing, C.J.O.; Visualization, J.J.S.; Supervision, J.J.S. All authors have read and agreed to the published version of the manuscript.

Funding

This research received no external funding.

Data Availability Statement

The original contributions presented in the study are included in the article, further inquiries can be directed to the corresponding author.

Acknowledgments

The authors would like to express their gratitude for the technical assistance offered by the Computer Modelling Group. Appreciation is also extended to the GoldSim Technology Group for their support in providing the economic software and licensing. Special thanks to Farid Tayari for providing the template economic model and offering invaluable technical advice.

Conflicts of Interest

The authors declare no conflict of interest.

References

  1. Zhang, Q.; Wang, L.; Chen, W.; Zhang, C. Assessing the impact of hydrogen trade towards low-carbon energy transition. Appl. Energy 2024, 376, 124233. [Google Scholar] [CrossRef]
  2. Hille, E. Europe’s energy crisis: Are geopolitical risks in source countries of fossil fuels accelerating the transition to renewable energy? Energy Econ. 2023, 127, 107061. [Google Scholar] [CrossRef]
  3. Zaiter, I.; Ramadan, M.; Bouabid, A.; El-Fadel, M.; Mezher, T. Potential utilization of hydrogen in the UAE’s industrial sector. Energy 2023, 280, 128108. [Google Scholar] [CrossRef]
  4. Okere, C.J.; Sheng, J.J.; Ejike, C. Evaluating reservoir suitability for large-scale hydrogen storage: A preliminary assessment considering reservoir properties. Energy Geosci. 2024, 5, 100318. [Google Scholar] [CrossRef]
  5. Megia, P.J.; Vizcaino, A.J.; Calles, J.A.; Carrero, A. Hydrogen Production Technologies: From Fossil Fuels toward Renewable Sources. A Mini Review. Energy Fuels 2021, 35, 16403–16415. [Google Scholar] [CrossRef]
  6. Moosazadeh, M.; Ajori, S.; Taghikhani, V.; Moghanloo, R.G.; Yoo, C.K. Sustainable hydrogen production from flare gas and produced water: A United States case study. Energy 2024, 306, 132435. [Google Scholar] [CrossRef]
  7. Sadeq, A.M.; Homod, R.Z.; Hussein, A.K.; Togun, H.; Mahmoodi, A.; Isleem, H.F.; Patil, A.R.; Moghaddam, A.H. Hydrogen energy systems: Technologies, trends, and future prospects. Sci. Total Environ. 2024, 939, 173622. [Google Scholar] [CrossRef] [PubMed]
  8. Sharma, S.; Ghoshal, S.K. Hydrogen the future transportation fuel: From production to applications. Renew. Sustain. Energy Rev. 2015, 43, 1151–1158. [Google Scholar] [CrossRef]
  9. Okere, C.J.; Sheng, J.J. Review on clean hydrogen generation from petroleum reservoirs: Fundamentals, mechanisms, and field applications. Int. J. Hydrogen Energy 2023, 48, 38188–38222. [Google Scholar] [CrossRef]
  10. Smith, E.K.; Barakat, S.M.; Akande, O.; Ogbaga, C.C.; Okoye, P.U.; Okolie, J.A. Subsurface combustion and gasification for hydrogen production: Reaction mechanism, techno-economic and lifecycle assessment. Chem. Eng. J. 2023, 480, 148095. [Google Scholar] [CrossRef]
  11. Ikpeka, P.; Alozieuwa, E.; Duru, U.I.; Ugwu, J. A parametric study on in-situ hydrogen production from hydrocarbon reservoirs—Effect of reservoir and well properties. Int. J. Hydrogen Energy 2024, 80, 733–742. [Google Scholar] [CrossRef]
  12. Okere, C.J.; Sheng, J.J. Probing the Mechanism and Impact of Light Oil Oxidation on In Situ Hydrogen Production from Petroleum Reservoirs: A Combined SARA-Based Experimental and Numerical Investigation. Energy Fuels 2024, 38, 17649–17661. [Google Scholar] [CrossRef]
  13. Okere, C.J.; Sheng, J.J.; Ikpeka, P.M. Comparative Numerical Study on the Optimization of Double-Simultaneous Gas Injection Techniques for Enhanced Hydrogen Production from Depleted Light Oil Reservoirs. Energy Fuels 2024, 38, 16358–16370. [Google Scholar] [CrossRef]
  14. Hanfi, M.A.; Alade, O.S.; Tanimu, A.; Mahmoud, M.; Alarifi, S.A. Catalytic and Noncatalytic in Situ Hydrogen Production from Heavy Oil: A Review of Experimental Studies. ACS Omega 2024, 9, 50118–50133. [Google Scholar] [CrossRef]
  15. Alkan, H.; Bauer, J.F.; Burachok, O.; Kowollik, P.; Olbricht, M.; Amro, M. Hydrogen from Depleted/Depleting Hydrocarbon Reservoirs: A Reservoir Engineering Perspective. Appl. Sci. 2024, 14, 6217. [Google Scholar] [CrossRef]
  16. Johnson, L.A.; Fahy, L.J.; Romanowski, L.J.; Barbour, R.V.; Thomas, K.P. An Echoing In-Situ Combustion Oil Recovery Project in a Utah Tar Sand. J. Pet. Technol. 1980, 32, 295–305. [Google Scholar] [CrossRef]
  17. Hajdo, L.E.; Hallam, R.J.; Vorndran, L.D.L. Hydrogen Generation During In-Situ Combustion. In Proceedings of the Society of Petroleum Engineers—SPE California Regional Meeting, CRM, Bakersfield, CA, USA, 27–29 March 1985; pp. 675–689. [Google Scholar] [CrossRef]
  18. Hallam, R.J.; Hajdo, L.E.; Donnelly, J.K.; Baron, R.P. Thermal Recovery of Bitumen at Wolf Lake. SPE Reserv. Eng. 1989, 4, 178–186. [Google Scholar] [CrossRef]
  19. Innovative Energy Technologies Program Project 01-019: Whitesands Experimental Project—Open Government. n.d. Available online: https://open.alberta.ca/dataset/ietp-project-01-019 (accessed on 21 June 2024).
  20. Kerrobert THAI Public Data. n.d. Available online: https://petrobank.ca/sf/thai/thai.htm (accessed on 21 June 2024).
  21. Turta, A.; Singhal, A.; Sierra, R.; Greaves, M.; Islam, M. Evaluation of the First Field Piloting of the THAI Process: Athabasca Pilot. In Proceedings of the Society of Petroleum Engineers—SPE Canadian Energy Technology Conference and Exhibition, CET, Calgary, AB, Canada, 15–16 March 2023; pp. 15–16. [Google Scholar] [CrossRef]
  22. Sheng, J.J. Techno-Economic Analysis of Hydrogen Generation in Hydrocarbon Reservoirs. SPE J. 2024, 29, 5752–5760. [Google Scholar] [CrossRef]
  23. Alkan, H.; Fabian Bauer, J.; Burachok, O.; Kowollik, P.; Olbricht, M.; Amro, M. Hydrogen from Depleted/Depleting Hydrocarbon Reservoirs: Is it feasible? In Proceedings of the Fourth EAGE Global Energy Transition Conference and Exhibition, Paris, France, 14–17 November 2023; Volume 2023, pp. 1–5. [Google Scholar] [CrossRef]
  24. Belgrave, J.D.M.; Moore, M.G.; Ursenbach, M.G.; Bennion, D.W. A Comprehensive Approach to In-Situ Combustion Modeling. SPE Adv. Technol. Ser. 1993, 1, 98–107. [Google Scholar] [CrossRef]
  25. Okere, C.J.; Sheng, J.J. A new modelling approach for in-situ hydrogen production from heavy oil reservoirs: Sensitivity analysis and process mechanisms. Energy 2024, 302, 131817. [Google Scholar] [CrossRef]
  26. Yang, S.; Huang, S.; Jiang, Q.; Yu, C.; Zhou, X. Experimental study of hydrogen generation from in-situ heavy oil gasification. Fuel 2022, 313, 122640. [Google Scholar] [CrossRef]
  27. Afanasev, P.; Smirnov, A.; Ulyanova, A.; Popov, E.; Cheremisin, A. Experimental Study of Catalytically Enhanced Cyclic Steam-Air Stimulation for In Situ Hydrogen Generation and Heavy Oil Upgrading. Catalysts 2023, 13, 1172. [Google Scholar] [CrossRef]
  28. He, H.; Li, Q.; Tang, J.; Liu, P.; Zheng, H.; Zhao, F.; Guan, W.; Guo, E.; Xi, C. Study of hydrogen generation from heavy oil gasification based on ramped temperature oxidation experiments. Int. J. Hydrogen Energy 2023, 48, 2161–2170. [Google Scholar] [CrossRef]
  29. Song, P.; Li, Y.; Yin, Z.; Ifticene, M.A.; Yuan, Q. Simulation of hydrogen generation via in-situ combustion gasification of heavy oil. Int. J. Hydrogen Energy 2024, 49, 925–936. [Google Scholar] [CrossRef]
  30. Newman, L.L. Oxygen in Production of Hydrogen or Synthesis Gas. Ind. Eng. Chem. 2002, 40, 559–582. [Google Scholar] [CrossRef]
  31. Parry, V.F.; Wagner, E.; Koth, A.; Goodman, J. Gasification of Subbituminous Coal and Lignite in Externally Heated Retorts. Ind. Eng. Chem. 2002, 40, 627–641. [Google Scholar] [CrossRef]
  32. Wright, C.C.; Barclay, K.M.; Mitchell, R.F. Production of Hydrogen and Synthesis Gas by Oxygen Gasification of Solid Fuel. Ind. Eng. Chem. 2002, 40, 592–600. [Google Scholar] [CrossRef]
  33. Eastman, D. Synthesis Gas by Partial Oxidation. Ind. Eng. Chem. 2002, 48, 1118–1122. [Google Scholar] [CrossRef]
  34. Eastman, D. 13. The Production of Synthesis Gas by Partial Oxidation 1959. In Proceedings of the 5th World Petroleum Congress, New York, NY, USA, 30 May–5 June 1959. [Google Scholar]
  35. Pichler, H. The Oil Gasification by Internal Heating in Continuous Process 1967. In Proceedings of the 7th World Petroleum Congress, Mexico City, Mexico, 2–9 April 1967. [Google Scholar]
  36. Jones, J.M. Hydrogen Production by Partial Oxidation 1971. In Proceedings of the 8th World Petroleum Congress, Moscow, Russia, 13–18 June 1971. [Google Scholar]
  37. Strelzoff, S. Partial Oxidation for Syngas and Fuel. Hydrocarb. Process 1974, 53, 79–87. [Google Scholar]
  38. Reed, C.L.; Kuhre, C.J. Hydrogen Production from Partial Oxidation of Residual Fuel Oil. ACS Symp. Ser. 1980, 116, 95–121. [Google Scholar] [CrossRef]
  39. Kapadia, P.R.; Kallos, M.S.; Leskiw, C.; Gates, I.D. Potential for Hydrogen Generation during In Situ Combustion of Bitumen. In Proceedings of the 71st European Association of Geoscientists and Engineers Conference and Exhibition 2009: Balancing Global Resources Incorporating SPE EUROPEC, Amsterdam, The Netherlands, 8–11 June 2009. [Google Scholar] [CrossRef]
  40. Sadeghbeigi, R. Fluid Catalytic Cracking Handbook: An Expert Guide to the Practical Operation, Design, and Optimization of FCC Units, 3rd ed.; Butterworth-Heinemann: Oxford, UK, 2012; 361p. [Google Scholar] [CrossRef]
  41. Tayari, F.; Blumsack, S.; Dilmore, R.; Mohaghegh, S.D. Techno-economic assessment of industrial CO2 storage in depleted shale gas reservoirs. J. Unconv. Oil Gas. Resour. 2015, 11, 82–94. [Google Scholar] [CrossRef]
  42. Tayari, F.; Blumsack, S.; Johns, R.T.; Tham, S.; Ghosh, S. Techno-economic assessment of reservoir heterogeneity and permeability variation on economic value of enhanced oil recovery by gas and foam flooding. J. Pet. Sci. Eng. 2018, 166, 913–923. [Google Scholar] [CrossRef]
  43. ProtonH2’s Patented ISHGTM Process—ProtonH2. n.d. Available online: https://protonh2.com/our-process/ (accessed on 10 June 2024).
  44. Thermophysical Properties of Fluid Systems. n.d. Available online: https://webbook.nist.gov/chemistry/fluid/ (accessed on 15 June 2024).
  45. Sigurdardottir, S.B.; DuChanois, R.M.; Epsztein, R.; Pinelo, M.; Elimelech, M. Energy barriers to anion transport in polyelectrolyte multilayer nanofiltration membranes: Role of intra-pore diffusion. J. Memb. Sci. 2020, 603, 117921. [Google Scholar] [CrossRef]
  46. Lee, J.E.; Kim, M.K.; Lee, J.Y.; Lee, Y.M.; Zoh, K.D. Degradation kinetics and pathway of 1H-benzotriazole during UV/chlorination process. Chem. Eng. J. 2019, 359, 1502–1508. [Google Scholar] [CrossRef]
  47. Ling, H.; Liu, S.; Gao, H.; Liang, Z. Effect of heat-stable salts on absorption/desorption performance of aqueous monoethanolamine (MEA) solution during carbon dioxide capture process. Sep. Purif. Technol. 2019, 212, 822–833. [Google Scholar] [CrossRef]
  48. Wang, Y.; Wang, S.; Fang, J.; Ding, L.X.; Wang, H. A nano-silica modified polyimide nanofiber separator with enhanced thermal and wetting properties for high safety lithium-ion batteries. J. Memb. Sci. 2017, 537, 248–254. [Google Scholar] [CrossRef]
  49. Oil & Gas Market Analysis and Trends|S&P Global. n.d. Available online: https://www.spglobal.com/commodityinsights/en/ci/industry/oil-gas.html (accessed on 16 June 2024).
  50. U.S. Department of Energy. DOE National Clean Hydrogen Strategy and Roadmap. Available online: https://www.hydrogen.energy.gov/docs/hydrogenprogramlibraries/pdfs/clean-hydrogen-strategy-roadmap.pdf?Status=Master (accessed on 20 December 2024).
  51. Vickers, J.; Peterson, D.; Randolph, K.; Irwin, L.; Desantis, D.; Hamdan, M. DOE Hydrogen and Fuel Cells Program Record Title: Cost of Electrolytic Hydrogen Production with Existing Technology 2000. Available online: https://www.hydrogen.energy.gov/docs/hydrogenprogramlibraries/pdfs/20004-cost-electrolytic-hydrogen-production.pdf?Status=Master (accessed on 20 December 2024).
  52. Mulder, M. Economic Analysis of Energy Markets: An Introduction. Lect. Notes Energy 2021, 80, 1–11. [Google Scholar] [CrossRef]
  53. Marbán, G.; Valdés-Solís, T. Towards the hydrogen economy? Int. J. Hydrogen Energy 2007, 32, 1625–1637. [Google Scholar] [CrossRef]
  54. Bölük, G.; Kaplan, R. Effectiveness of renewable energy incentives on sustainability: Evidence from dynamic panel data analysis for the EU countries and Turkey. Environ. Sci. Pollut. Res. 2022, 29, 26613–26630. [Google Scholar] [CrossRef] [PubMed]
  55. Qadir, S.A.; Al-Motairi, H.; Tahir, F.; Al-Fagih, L. Incentives and strategies for financing the renewable energy transition: A review. Energy Rep. 2021, 7, 3590–3606. [Google Scholar] [CrossRef]
  56. Dilmore, R.M. An Assessment of Gate-To-Gate Environmental Life Cycle Performance of Water-Alternating-Gas CO2-Enhanced Oil Recovery in the Permian Basin; National Energy Technology Laboratory (NETL): Pittsburgh, PA, USA; Morgantown, WV, USA; Albany, OR, USA, 2010. [CrossRef]
  57. Ferguson, R.C.; Nichols, C.; Van Leeuwen, T.; Kuuskraa, V.A. Storing CO2 with enhanced oil recovery. Energy Procedia 2009, 1, 1989–1996. [Google Scholar] [CrossRef]
  58. Maja, A.; Domagoj, V.; Gabriela, G.L.; Lucija, J. Simulation Analysis of CO2-EOR Process and Feasibility of CO2 Storage during EOR. Energies 2021, 14, 1154. [Google Scholar] [CrossRef]
  59. McCollum, D.L.; Ogden, J.M. UC Davis Research Reports Title Techno-Economic Models for Carbon Dioxide Compression, Transport, and Storage and Correlations for Estimating Carbon Dioxide Density and Viscosity Permalink. Available online: https://escholarship.org/uc/item/1zg00532 (accessed on 20 December 2024).
  60. Chen, F.; Morosuk, T. Exergetic and Economic Evaluation of CO2 Liquefaction Processes. Energies 2021, 14, 7174. [Google Scholar] [CrossRef]
  61. Electricity Cost in Texas: 2024 Electric Rates|EnergySage. n.d. Available online: https://www.energysage.com/local-data/electricity-cost/tx/ (accessed on 15 June 2024).
  62. Dake, L.P. Fundamentals of Reservoir Engineering, 1st ed.; Elsevier: Amsterdam, The Netherlands, 1983; Volume 8, 464p. [Google Scholar]
  63. Ahmed, T. Reservoir Engineering Handbook, 4th ed.; Elsevier: Amsterdam, The Netherlands, 2010. [Google Scholar]
  64. Green, D.W.; Willhite, G.P. Introduction to Eor Processes. In Enhanced Oil Recovery; Society of Petroleum Engineers: Richardson, TX, USA, 2022; pp. 1–14. [Google Scholar] [CrossRef]
  65. Gluyas, J.G. Swarbrick REdward. In Petroleum Geoscience; Wiley: Hoboken, NJ, USA, 2004; p. 359. [Google Scholar]
  66. Yuan, Q.; Jie, X.; Ren, B. High-Purity, CO2-Free Hydrogen Generation from Crude Oils in Crushed Rocks Using Microwave Heating. In Proceedings of the SPE Annual Technical Conference and Exhibition 2021, Dubai, United Arab Emirates, 21–23 September 2021. [Google Scholar] [CrossRef]
  67. Song, P.; Li, Y.; Yin, Z.; Yuan, Q. Hydrogen Generation from Heavy Oils via In-Situ Combustion Gasification. In Proceedings of the SPE Western Regional Meeting Proceedings 2023, Anchorage, AK, USA, 22–25 May 2023. [Google Scholar] [CrossRef]
  68. Williams, J.M.; Bourtsalas, A.C. Assessment of Co-Gasification Methods for Hydrogen Production from Biomass and Plastic Wastes. Energies 2023, 16, 7548. [Google Scholar] [CrossRef]
  69. Zhao, J.Z.; Jia, H.; Pu, W.F.; Wang, L.L.; Peng, H. Sensitivity studies on the oxidation behavior of crude oil in porous media. Energy Fuels 2012, 26, 6815–6823. [Google Scholar] [CrossRef]
  70. Sheng, J. An analytical model to estimate the oxidation time required to reach spontaneous ignition with heat loss being considered. Pet. Sci. Technol. 2024, 43, 662–675. [Google Scholar] [CrossRef]
  71. Sheng, J.; Yang, E. An Analytical model to estimate the time delay to reach spontaneous ignition considering heat loss in oil reservoirs. Pet. Sci. 2024, 21, 2469–2474. [Google Scholar] [CrossRef]
  72. Abu-Khamsin, S.A.; Iddris, A.; Aggour, M.A. The spontaneous ignition potential of a super-light crude oil. Fuel 2001, 80, 1415–1420. [Google Scholar] [CrossRef]
  73. Zhao, S.; Xu, C.-Y.; Pu, W.-F.; Chen, Q.-Y.; Yuan, C.-D.; Varfolomeev, M.A.; Sudakov, V. Heat front propagation in shale oil reservoirs during air injection: Experimental and numerical studies. Pet. Sci. 2024, 21, 3379–3389. [Google Scholar] [CrossRef]
  74. Burger, J.G. Spontaneous Ignition in Oil Reservoirs. Soc. Pet. Eng. J. 1976, 16, 73–81. [Google Scholar] [CrossRef]
  75. Wu, C.; Fulton, P. Experimental Simulation of the Zones Preceding the Combustion Front of an In-Situ Combustion Process. Soc. Pet. Eng. J. 1971, 11, 38–46. [Google Scholar] [CrossRef]
  76. Storey, B.M.; Worden, R.H.; McNamara, D.D. The Geoscience of In-Situ Combustion and High-Pressure Air Injection. Geosciences 2022, 12, 340. [Google Scholar] [CrossRef]
  77. Lysyy, M.; Føyen, T.; Johannesen, E.B.; Fernø, M.; Ersland, G. Hydrogen Relative Permeability Hysteresis in Underground Storage. Geophys. Res. Lett. 2022, 49, e2022GL100364. [Google Scholar] [CrossRef]
  78. Zhang, Y.; Bijeljic, B.; Gao, Y.; Goodarzi, S.; Foroughi, S.; Blunt, M.J. Pore-Scale Observations of Hydrogen Trapping and Migration in Porous Rock: Demonstrating the Effect of Ostwald Ripening. Geophys. Res. Lett. 2023, 50, e2022GL102383. [Google Scholar] [CrossRef]
  79. Thaysen, E.M.; Jangda, Z.; Hassanpouryouzband, A.; Menke, H.; Singh, K.; Butler, I.B.; Heinemann, N.; Edlmann, K. Hydrogen wettability and capillary pressure in Clashach sandstone for underground hydrogen storage. J. Energy Storage 2024, 97, 112916. [Google Scholar] [CrossRef]
  80. Zeng, L.; Hosseini, M.; Keshavarz, A.; Iglauer, S.; Lu, Y.; Xie, Q. Hydrogen wettability in carbonate reservoirs: Implication for underground hydrogen storage from geochemical perspective. Int. J. Hydrogen Energy 2022, 47, 25357–25366. [Google Scholar] [CrossRef]
  81. Saajanlehto, M.; Uusi-Kyyny, P.; Alopaeus, V. Hydrogen solubility in heavy oil systems: Experiments and modeling. Fuel 2014, 137, 393–404. [Google Scholar] [CrossRef]
  82. Al-Abduwani, F.A.H.; Shirzadi, A.; van den Broek, W.M.G.T.; Currie, P.K. Formation Damage vs. Solid Particles Deposition Profile During Laboratory-Simulated Produced-Water Reinjection. SPE J. 2005, 10, 138–151. [Google Scholar] [CrossRef]
  83. Chang, F.; Civan, F. Modeling of Formation Damage Due to Physical and Chemical Interactions Between Fluids and Reservoir Rocks. In Proceedings of the SPE Annual Technical Conference and Exhibition, Dallas, TX, USA, 6–9 October 1991. [Google Scholar] [CrossRef]
  84. Tan, Q.; You, L.; Kang, Y.; Xu, C. Formation damage mechanisms in tight carbonate reservoirs: The typical illustrations in Qaidam Basin and Sichuan Basin, China. J. Nat. Gas. Sci. Eng. 2021, 95, 104193. [Google Scholar] [CrossRef]
  85. He, J.; Okere, C.J.; Su, G.; Hu, P.; Zhang, L.; Xiong, W.; Li, Z. Formation damage mitigation mechanism for coalbed methane wells via refracturing with fuzzy-ball fluid as temporary blocking agents. J. Nat. Gas. Sci. Eng. 2021, 90, 103956. [Google Scholar] [CrossRef]
  86. Liu, H.; Su, G.; Okere, C.J.; Li, G.; Wang, X.; Cai, Y.; Wu, T.; Zheng, L. Working fluid-induced formation damage evaluation for commingled production of multi-layer natural gas reservoirs with flow rate method. Energy 2022, 239, 122107. [Google Scholar] [CrossRef]
  87. Okere, C.J.; Su, G.; Zheng, L.; Cai, Y.; Li, Z.; Liu, H. Experimental, algorithmic, and theoretical analyses for selecting an optimal laboratory method to evaluate working fluid damage in coal bed methane reservoirs. Fuel 2020, 282, 118513. [Google Scholar] [CrossRef]
  88. Okere, C.J.; Sheng, J.J.; Fan, L.-K.; Huang, X.-W.; Zheng, L.-H.; Wei, P.-F. Experimental study on the degree and damage-control mechanisms of fuzzy-ball-induced damage in single and multi-layer commingled tight reservoirs. Pet. Sci. 2023, 20, 3598–3609. [Google Scholar] [CrossRef]
  89. Okere, C.J.; Zheng, L. Experimental Study on the Mechanisms and Degree of Fuzzy-Ball Induced Damage in Single and Double-Layer Tight Reservoirs: Implications for Optimal Laboratory Design and Strategic Field Application of Low-Damaging Fluids. SSRN Electron. J. 2022. [Google Scholar] [CrossRef]
  90. Shojaee, A.; Kord, S.; Miri, R.; Mohammadzadeh, O. Reactive transport modeling of scale precipitation and deposition during incompatible water injection in carbonate reservoirs. J. Pet. Explor. Prod. Technol. 2024, 14, 515–534. [Google Scholar] [CrossRef]
  91. Yu, M.; Wang, K.; Vredenburg, H. Insights into low-carbon hydrogen production methods: Green, blue and aqua hydrogen. Int. J. Hydrogen Energy 2021, 46, 21261–21273. [Google Scholar] [CrossRef]
  92. Economics—SGH2 Energy. n.d. Available online: https://www.sgh2energy.com/economics (accessed on 8 December 2024).
  93. Hydrogen Electrolysis: The Future of Cost-Effective Green Hydrogen Production|Energy Central. n.d. Available online: https://energycentral.com/c/pip/hydrogen-electrolysis-future-cost-effective-green-hydrogen-production (accessed on 8 December 2024).
  94. Katebah, M.; Al-Rawashdeh, M.; Linke, P. Analysis of hydrogen production costs in Steam-Methane Reforming considering integration with electrolysis and CO2 capture. Clean. Eng. Technol. 2022, 10, 100552. [Google Scholar] [CrossRef]
  95. Okere, C.J.; Sheng, J.J.; Ikpeka, P.M. Which Offers Greater Techno-Economic Potential: Oil or Hydrogen Production from Light Oil Reservoirs? Geoscience 2025, 15, 214. [Google Scholar] [CrossRef]
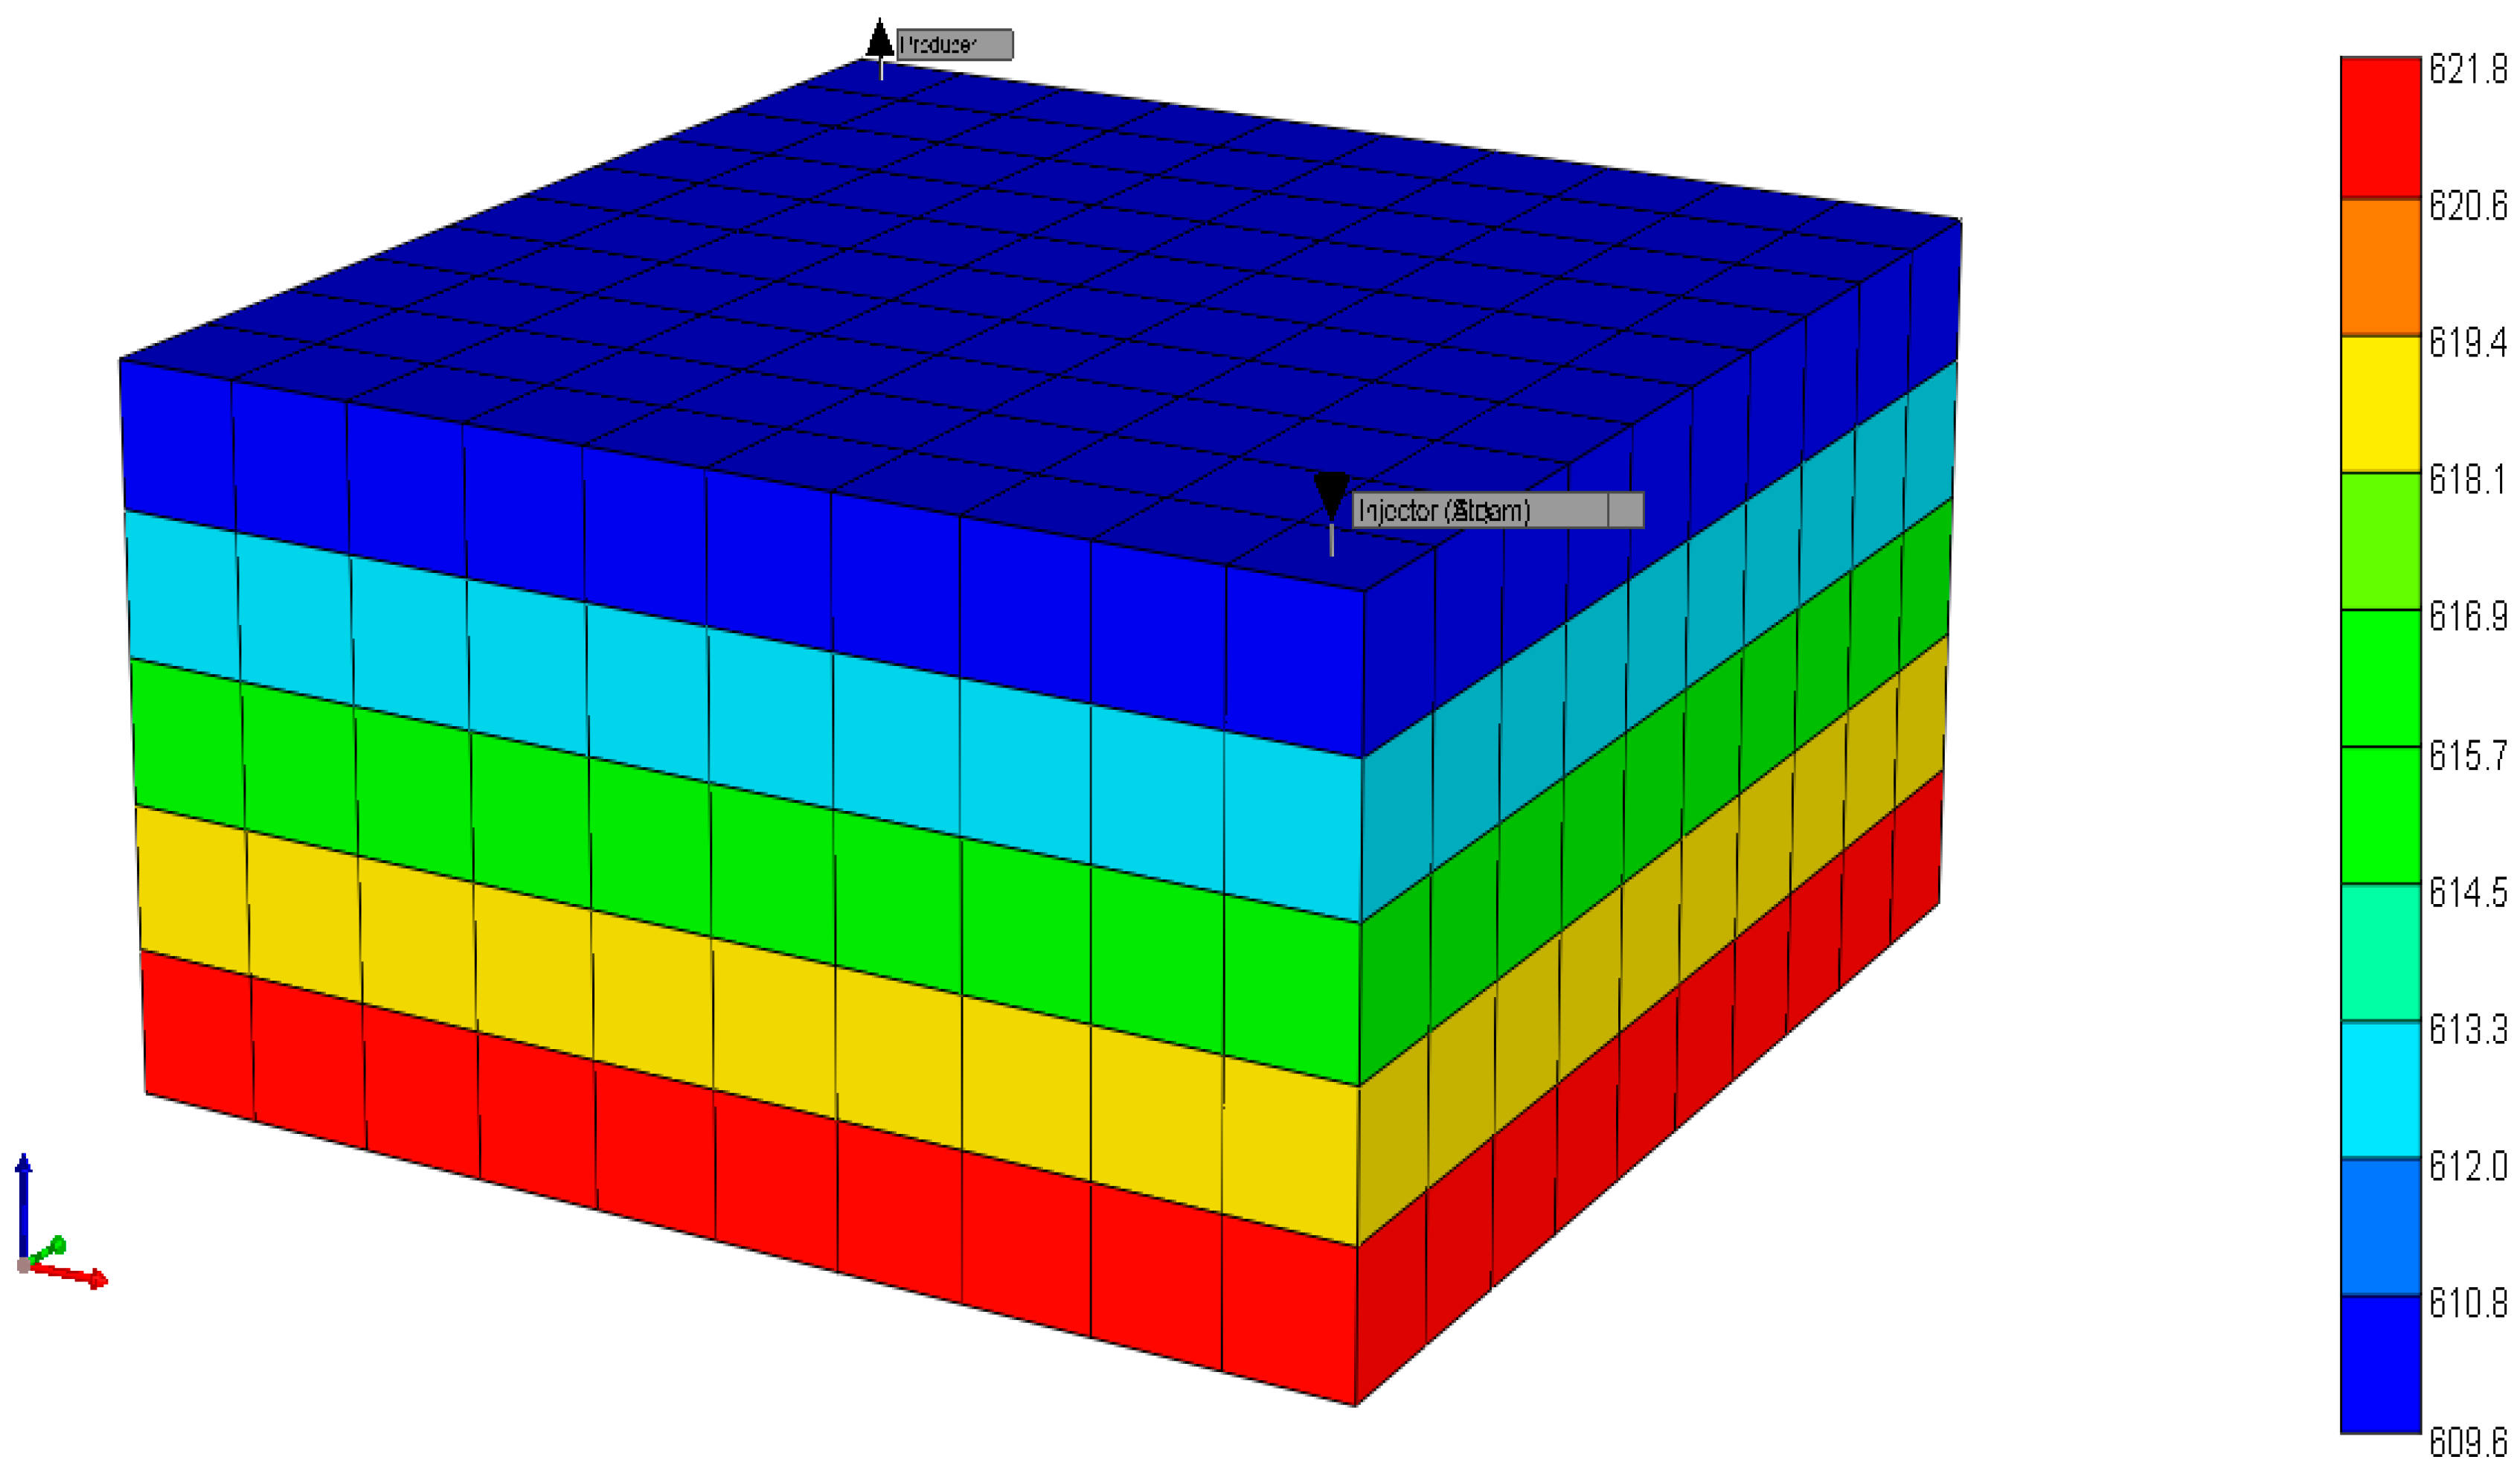
Figure 1. A 3-D representation of the reservoir simulation model (with both injectors located in the same position).
Energies 18 05539 g001
Figure 2. Hydrogen yield as a function of H/C ratio across various feedstocks, including predictions from the heavy model [30,31,32,33,34,35,36,37,38,39].
Energies 18 05539 g002
Figure 3. A typical process flow diagram of hydrogen production from petroleum reservoirs.
Energies 18 05539 g003
Figure 4. Cumulative mass of hydrogen, oil and other gas generated from heavy oil reservoir.
Energies 18 05539 g004
Figure 5. Cumulative hydrogen yield from heavy oil reservoirs at different initial reservoir temperatures over a period of 10.4, 100.3, 5000.5, and 7305.0 days.
Energies 18 05539 g005
Figure 6. (a) Reservoir temperature distribution profile along the injection production wells. (b) Oil saturation, water saturation, and hydrogen concentration distribution profiles along the injection production wells.
Energies 18 05539 g006
Figure 7. Distribution of hydrogen concentration and oil saturation between the injector and producer at: (a) First production cycle, (b) Second production cycle, (c) Third production cycle.
Energies 18 05539 g007aEnergies 18 05539 g007b
Figure 8. (a) Solid volume vs. Cumulative hydrogen generated, (b) Pore volume vs. Cumulative hydrogen generated.
Energies 18 05539 g008
Table 1. Field projects with documented hydrogen production from heavy oil and Bitumen reservoirs.
YearProject TitleLocationPorosity (%)Permeability (mD)Max. Yield (mol. %)H2 Source
1977Utah Tar SandUnited States31600–70014[16]
1979Marguerite LakeCanada301000–300033[17]
1985Wolf LakeCanada321000–300025[18]
2006WhitesandsCanada363000–12,00010[19]
2009KerrobertCanada322000–60007[20]
2023WhitesandsCanada34200–700015[21]
Table 2. Summary of grid sensitivity results.
Grid ConfigurationNumber of Active BlocksCumulative H2 Produced (kg)Cumulative CO2 Produced (m3)Average Temperature at Combustion Front (°C)
5 × 5 × 375300,2462421.85705.4
7 × 7 × 3147305,1422451.24707.9
10 × 10 × 5500310,2452482.56710.2
12 × 12 × 71008310,8122485.76711.1
15 × 15 × 102250311,0252486.98712.3
Table 3. Cost model structure.
InjectionProductionCO2 Recycling
Cost of equipment leasedCost of production (equipment and Separation costs)Cost of gas compression and processing (pumping, compression, and separation costs).
Annual operation-and-maintenance costsTax, royalty, social responsibilities, and revenue
Cost of CO2 distribution within the system
Steam cost
Air source and cost
CO2 source and cost
Table 4. Overview of inputs and cost constraints adopted in the economic model.
ComponentsComputation Technique
Injection
Equipment cost ($)60.682/ft + 85,997
Annual operating and maintenance costs
Normal daily ($/year)
0.0027/ft2–30.548/ft + 88,879
Surface repair ($/year)
0.0031/ft2–34.465/ft + 106,019
Subsurface repair ($/year)
0.0053/ft2–57.067/ft + 162,380
CO2 supply and distribution system costs$200,000
Air source and cost$50,000 with $5000 per year operating cost
CO2 purchase cost ($/Mscf)2.5 percent of oil price
CO2 pressurizing cost
Pump capital cost ($)(1.944 × 10³ × Wp) + 0.1224 × 10⁶
Pump operating and maintenance cost ($/year)
13 Cents per kWh
Water cost ($)
$0.14 per barrel
Steam/air pumping and injection cost13 Cents per kWh
Production
Cost of producing equipment32.516/ft-21,146
Cost of fluid lifting$0.25 per barrel of produced fluids
Cost of syngas and liquid separation$1000 per square meter with 10% annual maintenance cost
Cost of water/oil separation$1.917 per barrel
Production revenue, tax and royalty
Severance tax
2% of the produced hydrogen value
Royalty rate
10% of the produced hydrogen value
CO2 recycling
Gas treatment: Gas separation and compression ($)$500 of gas production rate
Compression costs
Compressor capital cost ($)
$2500 per horsepower
Compressor operating and maintenance cost ($/year)
13 Cents per kWh
Table 5. Reservoir classification.
Reservoir PropertyUltra-Low-Quality Reservoirs (ULQR)Low-Quality Reservoirs (LQR)Moderate-Quality Reservoirs (MQR)High-Quality Reservoirs (HQR)
Permeability<0.10.1–1 md1–10 md>10 md
Porosity<5%5–10%10–20%>20%
Table 6. Economic evaluation of injection strategies for hydrogen and oil production with CO2 management.
Injection StrategyReservoirCum. Mass of H2 Prod. (kg)Cum. Mass of Oil Prod. (kg)Cum. Mass of CO2 Prod. (kg)Cum. Mass of CO2 Inj. (kg)Total Revenue from H2 ($)Total Revenue from Oil ($)Total Cost for New CO2 Procurement ($)
Steam/airULQR157.745146.1755.600473.222589.480
LQR195.487106.3473.150586.443575.520
MQR14,579.031,227,232.254541.80043,737.09617,390.930
HQR3,714,91853,639,07646,950,988011,144,75427,000,0000
CO2 + O2ULQR19.581106.3493.12782.7458.74556.6918.79
LQR46.483385.06138.681472.04139.441703.5235.33
MQR13,575.511,127,300.1319,542.9824,643.4940,726.53567,764.45591.44
HQR2,697,763.7542,623,424116,356,432360,118,3568,093,291.2521,427,202.528,642,840.54
Disclaimer/Publisher’s Note: The statements, opinions and data contained in all publications are solely those of the individual author(s) and contributor(s) and not of MDPI and/or the editor(s). MDPI and/or the editor(s) disclaim responsibility for any injury to people or property resulting from any ideas, methods, instructions or products referred to in the content.