Article

Numerical Modelling of Gas Mixing in Salt Caverns During Cyclic Hydrogen Storage

Oil and Gas Institute-National Research Institute, 25 A Lubicz Str., 31-503 Cracow, Poland
*
Author to whom correspondence should be addressed.
Energies 2025, 18(20), 5528; https://doi.org/10.3390/en18205528 (registering DOI)
Submission received: 3 September 2025 / Revised: 26 September 2025 / Accepted: 11 October 2025 / Published: 20 October 2025

Abstract

This study presents the development of a robust numerical model for simulating underground hydrogen storage (UHS) in salt caverns, with a particular focus on the interactions between original gas-methane (CH4) and injected gas represented by hydrogen (H2). Using the Schlumberger Eclipse 300 compositional reservoir simulator, the cavern was modelled as a highly permeable porous medium to accurately represent gas flow dynamics. Two principal mixing mechanisms were investigated: physical dispersion, modelled by numerical dispersion, and molecular diffusion. Multiple cavern configurations and a range of dispersion–diffusion coefficients were assessed. The results indicate that physical dispersion is the primary factor affecting hydrogen purity during storage cycles, while molecular diffusion becomes more significant during long-term gas storage. Gas mixing was shown to directly impact the calorific value and quality of withdrawn hydrogen. This work demonstrates the effectiveness of commercial reservoir simulators for UHS analysis and proposes a methodological framework for evaluating hydrogen purity in salt cavern storage operations.

1. Introduction

Decarbonization of the energy sector is a cornerstone of the European Green Deal. In this way, hydrogen will play the main role as a raw material, a fuel, and, above all, an energy carrier [1], which helps balance seasonal fluctuations in supply and demand [2,3]. The European Commission, as well as national governments, including that of Poland, anticipate a rapid growth of hydrogen production, distribution, and storage infrastructure to meet these ambitions [4,5,6].
The widespread deployment of hydrogen, however, depends on the development of robust, efficient, and safe storage technologies [1]. While above-ground storage options, such as high-pressure gas tanks, are well-known, they present many limitations in terms of capacity, cost, and economic feasibility for seasonal and large-scale applications [7,8,9]. In contrast, underground storage in geological formations offers the potential for cost-effective, long-duration storage of much more energy, making it highly attractive for balancing and energy system flexibility [3,10,11,12,13].
One of the major challenges of large-scale underground gas storage (UGS) and UHS is gas mixing. In addition to mixing, other processes such as CO2 hydrate formation and clay mineral (e.g., kaolinite) alterations may also occur and affect storage performance [14,15]. The interaction between the injected hydrogen and the original or residual gases, primarily CH4, leads to dilution and reduces the purity of the withdrawn H2 [16]. In volumetric terms, admixture of CH4 increases the calorific value per unit volume [17] of the withdrawn gas, but at the same time decreases hydrogen purity, which is critical for end-use applications. Therefore, additional separation processes may be required, increasing the costs of hydrogen storage operations [4,18,19]. The phenomenon of gas mixing has been the subject of extensive theoretical and experimental studies. The classical description of dispersion in flowing systems was introduced by Taylor [20] for one-dimensional tube flow. Aris [21] later extended Taylor’s work by examining two-dimensional flow. Laboratory flow experiments demonstrated the existence of diffusion and dispersion during density-driven convection, supported by visualization techniques [22]. Arekhov [23] measured the effective diffusion coefficients of H2–CH4 gas mixtures in reservoir rocks using rock cores. The results revealed that the observed transport effects are a combination of molecular diffusion and physical dispersion, and their contribution varies with pressure conditions and rock properties. Another study by Lester, Metcalfe, and Trefry [24] utilized pore models to demonstrate that flows in real media can lead to chaotic advection, a phenomenon in which particles follow unpredictable trajectories. This chaotic flow significantly intensifies dispersion compared to classical models. The influence of this phenomenon was also described and presented through the example of modelling hydrogen storage in a porous medium [16].
Feldmann et al. [18] conducted an investigation into gas mixing processes in depleted porous gas reservoirs through numerical methods. Azin et al. [25] examined how the cyclical operation of gas stored in a partially depleted gas reservoir affected the composition of withdrawn gas through simulation approaches. In a related study, Lysyy et al. [26] analysed seasonal hydrogen storage in a depleted oil and gas reservoir, emphasizing the operational feasibility and the challenges associated with large-scale applications in porous structure. Additionally, Hogeweg et al. [19] benchmarked various simulation methodologies for porous UGS/UHS.
All of these studies share a common focus: they were conducted on porous rocks.
Salt caverns have been widely used for gas storage around the world [27,28,29]. Among the various geological storage options, salt caverns stand out due to the low permeability of their surrounding rocks and their proven tightness over decades of gas storage operations in many countries [6,30]. In addition, salt caverns offer high injection and production rates, making them particularly suitable for balancing the intermittent nature of renewable energy sources [31,32].
In Poland, Kaliski et al., Filar et al., and Zeljaś [12,33,34] documented domestic cavern operations. Other publications confirm the technical potential of salt caverns for future hydrogen storage, both domestically and across Europe [3,6,27,29,35]. In this study, we build on these existing facilities and represent the cavern as a simplified storage domain without modelling the leaching process or construction details.
In recent years, significant progress has been made in terms of modelling and analysing salt caverns as underground hydrogen storage facilities. Höpken [36] developed an operational model to assess the impact of future energy demand on cavern performance parameters. This work emphasizes the importance of adapting simulations to account for variable market scenarios [36]. Jeannin et al. [37] introduced a numerical model that integrates heat transfer and some parameters of strategy development, allowing for different scenarios of cavern cyclic performance [37]. Complementing these efforts, Ruiz-Maraggi and Moscardelli [38] launched the open-source GeoH2 Salt Storage and Cycling App, which models storage capacities with the injection/withdrawal of hydrogen cycles for salt caverns [38].
Another crucial area of research addresses the integrity and geomechanical stability of caverns, as well as potential gas storage losses. For example, Ghaedi [39] focused on salt cavern integrity, particularly concerning leakage through cavern seals, and reported that such losses are typically very small, equalling less than 0.5% of the maximum capacity over 30 years of storage operation [39]. While such geomechanical and integrity issues are critical for UHS, the present work deliberately focuses on transport processes, namely mixing by dispersion and diffusion, because they directly affect hydrogen purity and calorific value during cyclic operation.
In a wider context, Qian et al. [40] provided a comprehensive review of hydrogen storage and its technological benefits, limitations, and critical aspects related to safety, microbiology, and operational constraints [40].
One of the most important areas is gas mixing in salt caverns. It is a critical challenge for maintaining hydrogen purity or for predicting calorific value during the withdrawal of stored gas. From a Polish perspective, Budak and Szpunar [4] examined the changes in hydrogen–methane gas composition during cavern operations, revealing that mixing processes can significantly affect the calorific value profile and, more importantly, reduce hydrogen purity. As a result, additional separation may be required before the gas can be sent out to the gas system [4]. More recently, Wallace et al. [41] conducted numerical studies comparing hydrogen and gas mixtures in salt cavern storage. Their findings indicated that hydrogen has greater fluctuations in pressure and temperature as well as a lower effective energy storage capacity compared to any other gas composition with methane [41]. These operational characteristics increase the risks associated with gas mixing during cyclic injection and withdrawal. In addition to this, Hu et al. [42] examined the effects of cushion gas pressure and operating storage parameters on hydrogen storage capacity in lined rock caverns (LRC) [42]. They found that lower cushion gas pressure increases the hydrogen injection total, while higher injection rates accelerate temperature increases. These factors can indirectly affect mixing dynamics by altering thermal and pressure gradients.
In addition to mixing processes, UHS in salt caverns also involves a range of other challenges, such as geomechanical stability, cavern shape evolution, and safety management [43,44,45]. These aspects are crucial for long-term operation but remain outside the scope of this study. Here, we focus exclusively on modelling physical dispersion by numerical dispersion and diffusion that directly influence the purity and calorific value of the withdrawn H2. Classical transport models such as the Maxwell–Stefan equations, the Presentation-De-Buthane theory, and the dusty gas model [46,47] provide the theoretical foundation for gas mixing. Experimental approaches, including the capillary and point–source methods, have also been applied to quantify binary diffusion. The present work complements these efforts by demonstrating how commercial reservoir simulators can be used to parametrize dispersion–diffusion processes under cyclic cavern operation.
Overall, these studies indicate that the phenomenon of gas mixing plays a crucial role in accurately predicting the composition of gas during UGS/UHS. Salt caverns are particularly suitable for the purpose as they offer proven tightness, a high rate of injection/withdrawal, and extensive operational experience from decades of gas storage. However, despite these advancements, there has been no systematic investigation, to the best of the authors’ knowledge, on the combined effects of dispersion and diffusion in salt caverns and their impact on the composition of the withdrawn gas during storage operations. The issue of gas mixing has not been adequately addressed in the commercially available reservoir simulators used to model multiple processes occurring during the transport of reservoir fluids (oil, gas, water). The best example proving the validity of this thesis is the world’s most popular reservoir simulator, Eclipse by GeoQuest (Schlumberger), in both the Black Oil and Compositional versions. Since numerical modelling of reservoir processes (including the production and operation of underground gas storage, UGS) has become a widely accepted standard, its users, including the authors of this work, are forced to use special methods based on the unique features of standard reservoir simulators, which cause the appearance of phenomena analogous to the physical mixing processes of gases flowing through a porous medium. The phenomenon in question that occurs in nature is physical dispersion, while the numerical mechanism used to model it is numerical dispersion. Previous works [48,49] presented the determination of a difficult-to-measure reservoir parameter, physical dispersion [20] for a porous medium, while in the present work, research and analyses will be carried out for salt caverns [19,31,50,51]. In addition to a systematic analysis of the effects of physical dispersion modelled by controlling numerical dispersion, the impact of molecular diffusion [18] on the simulation results will also be investigated.
The aim of this article is to present the challenges and methodological approaches associated with modelling hydrogen storage in salt caverns, with particular emphasis on the processes of gas mixing and the simulation of physical dispersion and molecular diffusion. The analyses presented here are intended to contribute to the development of more accurate and reliable modelling tools supporting the safe and efficient storage of natural gas and hydrogen in the context of the energy transition.

2. Materials and Methods

2.1. Salt Cavern Model

For a better understanding and description of the phenomena occurring during the H2 storage process in a salt cavern, a three-dimensional model of such a structure was used, built based on data from domestic and foreign literature [4,5,29,52]. The base model is based on a grid of blocks with dimensions of 60 × 60 × 300, composed of 235,792 active blocks that form a cylinder with hemispheres at the bottom and top (Figure 1a). A single simulation block has a cross-section of 1 × 1 m, and the height of each block is also 1 m. All active model blocks are characterized by a uniform porosity of ≈100% and a permeability of 10,000 mD. Due to the specific properties of the salt cavern, a uniform distribution of these parameters was assumed. The model blocks form a volume with a total height of 200 m, while the radius of the cylinder is 20 m, so the resulting volume of the salt cavern model is 237,375 Rm3 (reservoir cubic meters). A cross-sectional view of the model used in the following procedures is shown in Figure 1b.

2.2. Fluid Properties

To model the mixing of the original gas, i.e., CH4, with the injected gas, i.e., H2, the fluid model described by the Peng–Robinson (PR) equation of state (EOS) was used. In this study, the PR EOS was applied as a simplified two-component CH4-H2 system, with all parameters kept at their default values (Table 1). No additional calibration was performed, as the focus of this study was on transport phenomena (dispersion and diffusion) rather than on detailed phase equilibrium modelling.
The initial cavern content was assumed to be 100% CH4 (cushion gas), representing a typical case of converting an existing UGS facility into UHS.

2.3. Phase Permeability

For the modelling of gas flows in the salt cavern, the absence of water in the model (Sw = 0, Sg = 1) and the gas relative permeability Krg(Sg) = 1 was assumed.

2.4. Model Initialization

Based on the literature data [4,5,52], the initial pressure Pini = 140 bar was assumed and T = 57 °C.

2.5. Simulation Model Validation

The Eclipse commercial reservoir simulator was created to model flows in a porous medium that take place following Darcy’s law. By being careful about the limitations of this program, it can also be used to model flows in a salt cavern [19,31,32,50,51] described in the same way as a porous medium, but with a very high porosity value (100%) and a very high permeability value at which flow resistance will be negligible. Therefore, to determine the value of permeability, for which the flow resistance will be negligible (i.e., no resistance, as in a cavern), a forecast of the H2 storage operation was carried out for five models of the salt cavern (differing in permeability, from k = 10 mD to k = 100,000 mD), consisting of the following:
  • Precycle, i.e., original gas withdrawal (CH4),
  • H2 injection phases,
  • Withdrawal of gas from the cavern (H2 with CH4).
The daily injection and withdrawal rates applied in this study (500,000 and 600,000 Nm3/d, respectively) were estimated to represent the filling and emptying of a single cavern of typical size reported in the Polish literature [5,33].
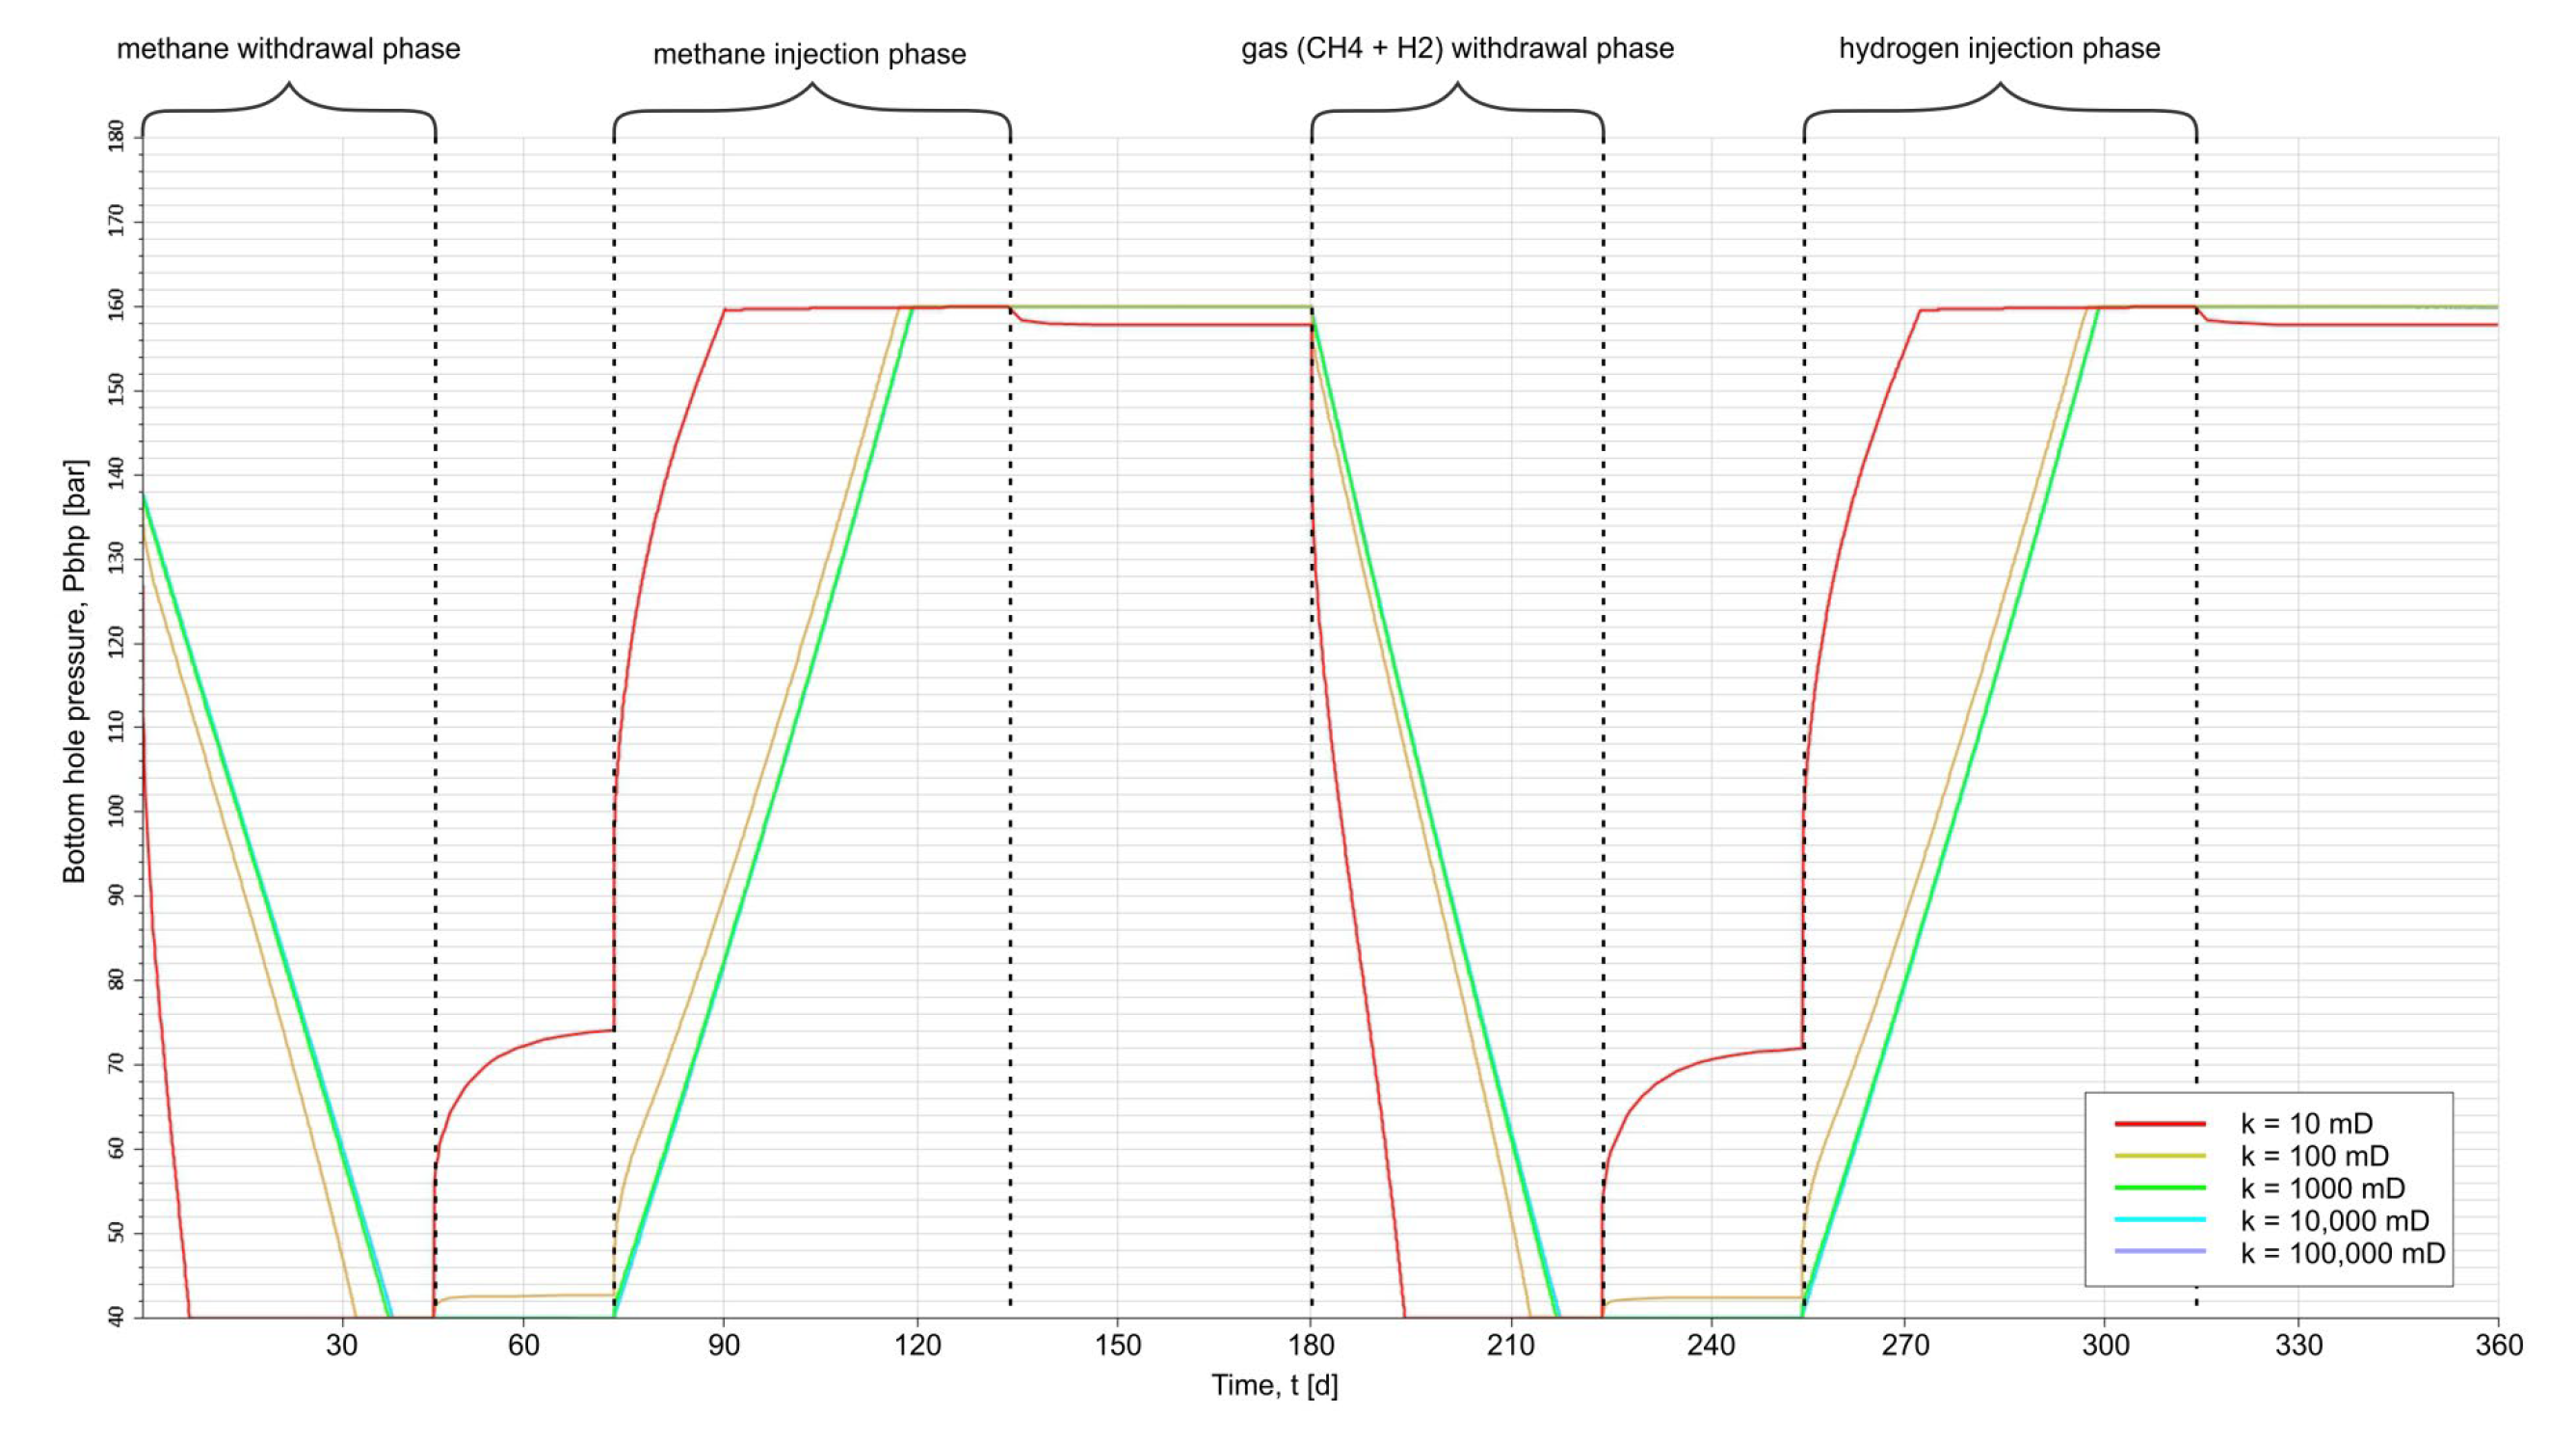
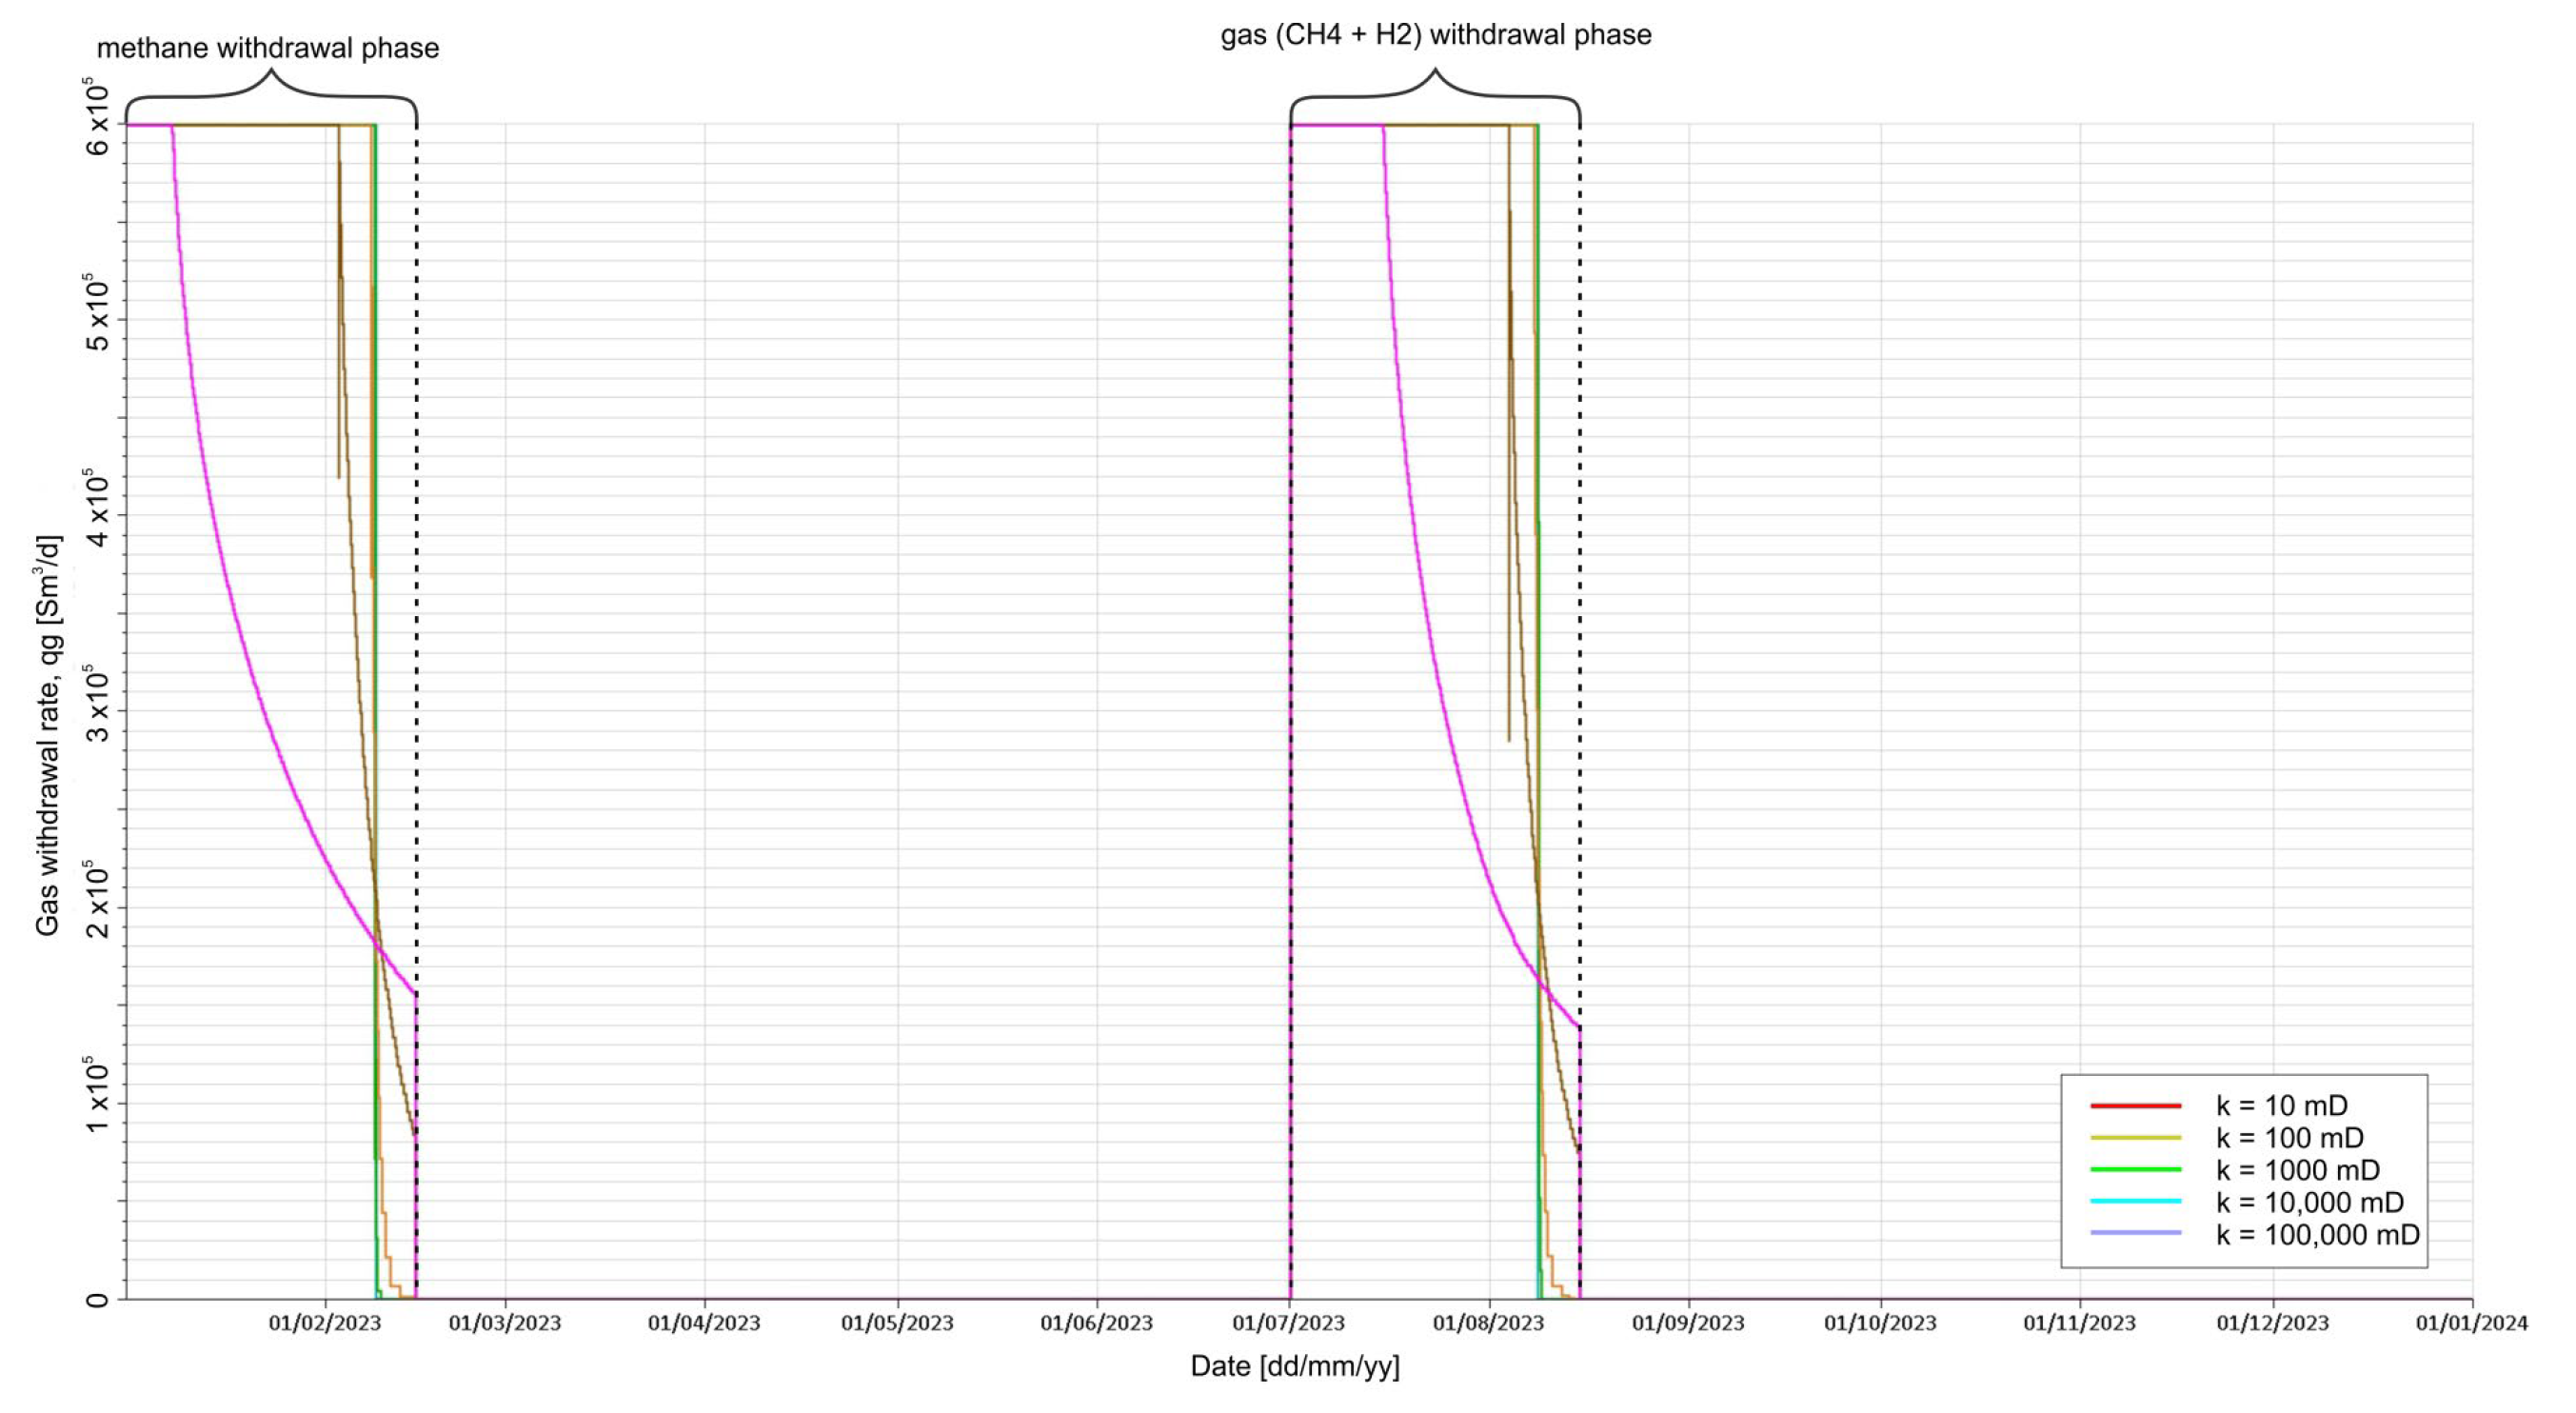
Figure 2 shows the bottom pressure in the injection–production (IP) well, where it is possible to observe, among others, a pressure drop in the CH4 withdrawal phase, which is much faster for models with a permeability of 10 and 100 mD than for other models, which means that the CH4 withdrawal rate decreases faster (Figure 3). Therefore, the use of a model with a permeability of 1000 mD is sufficient to achieve flow conditions in the cavern.
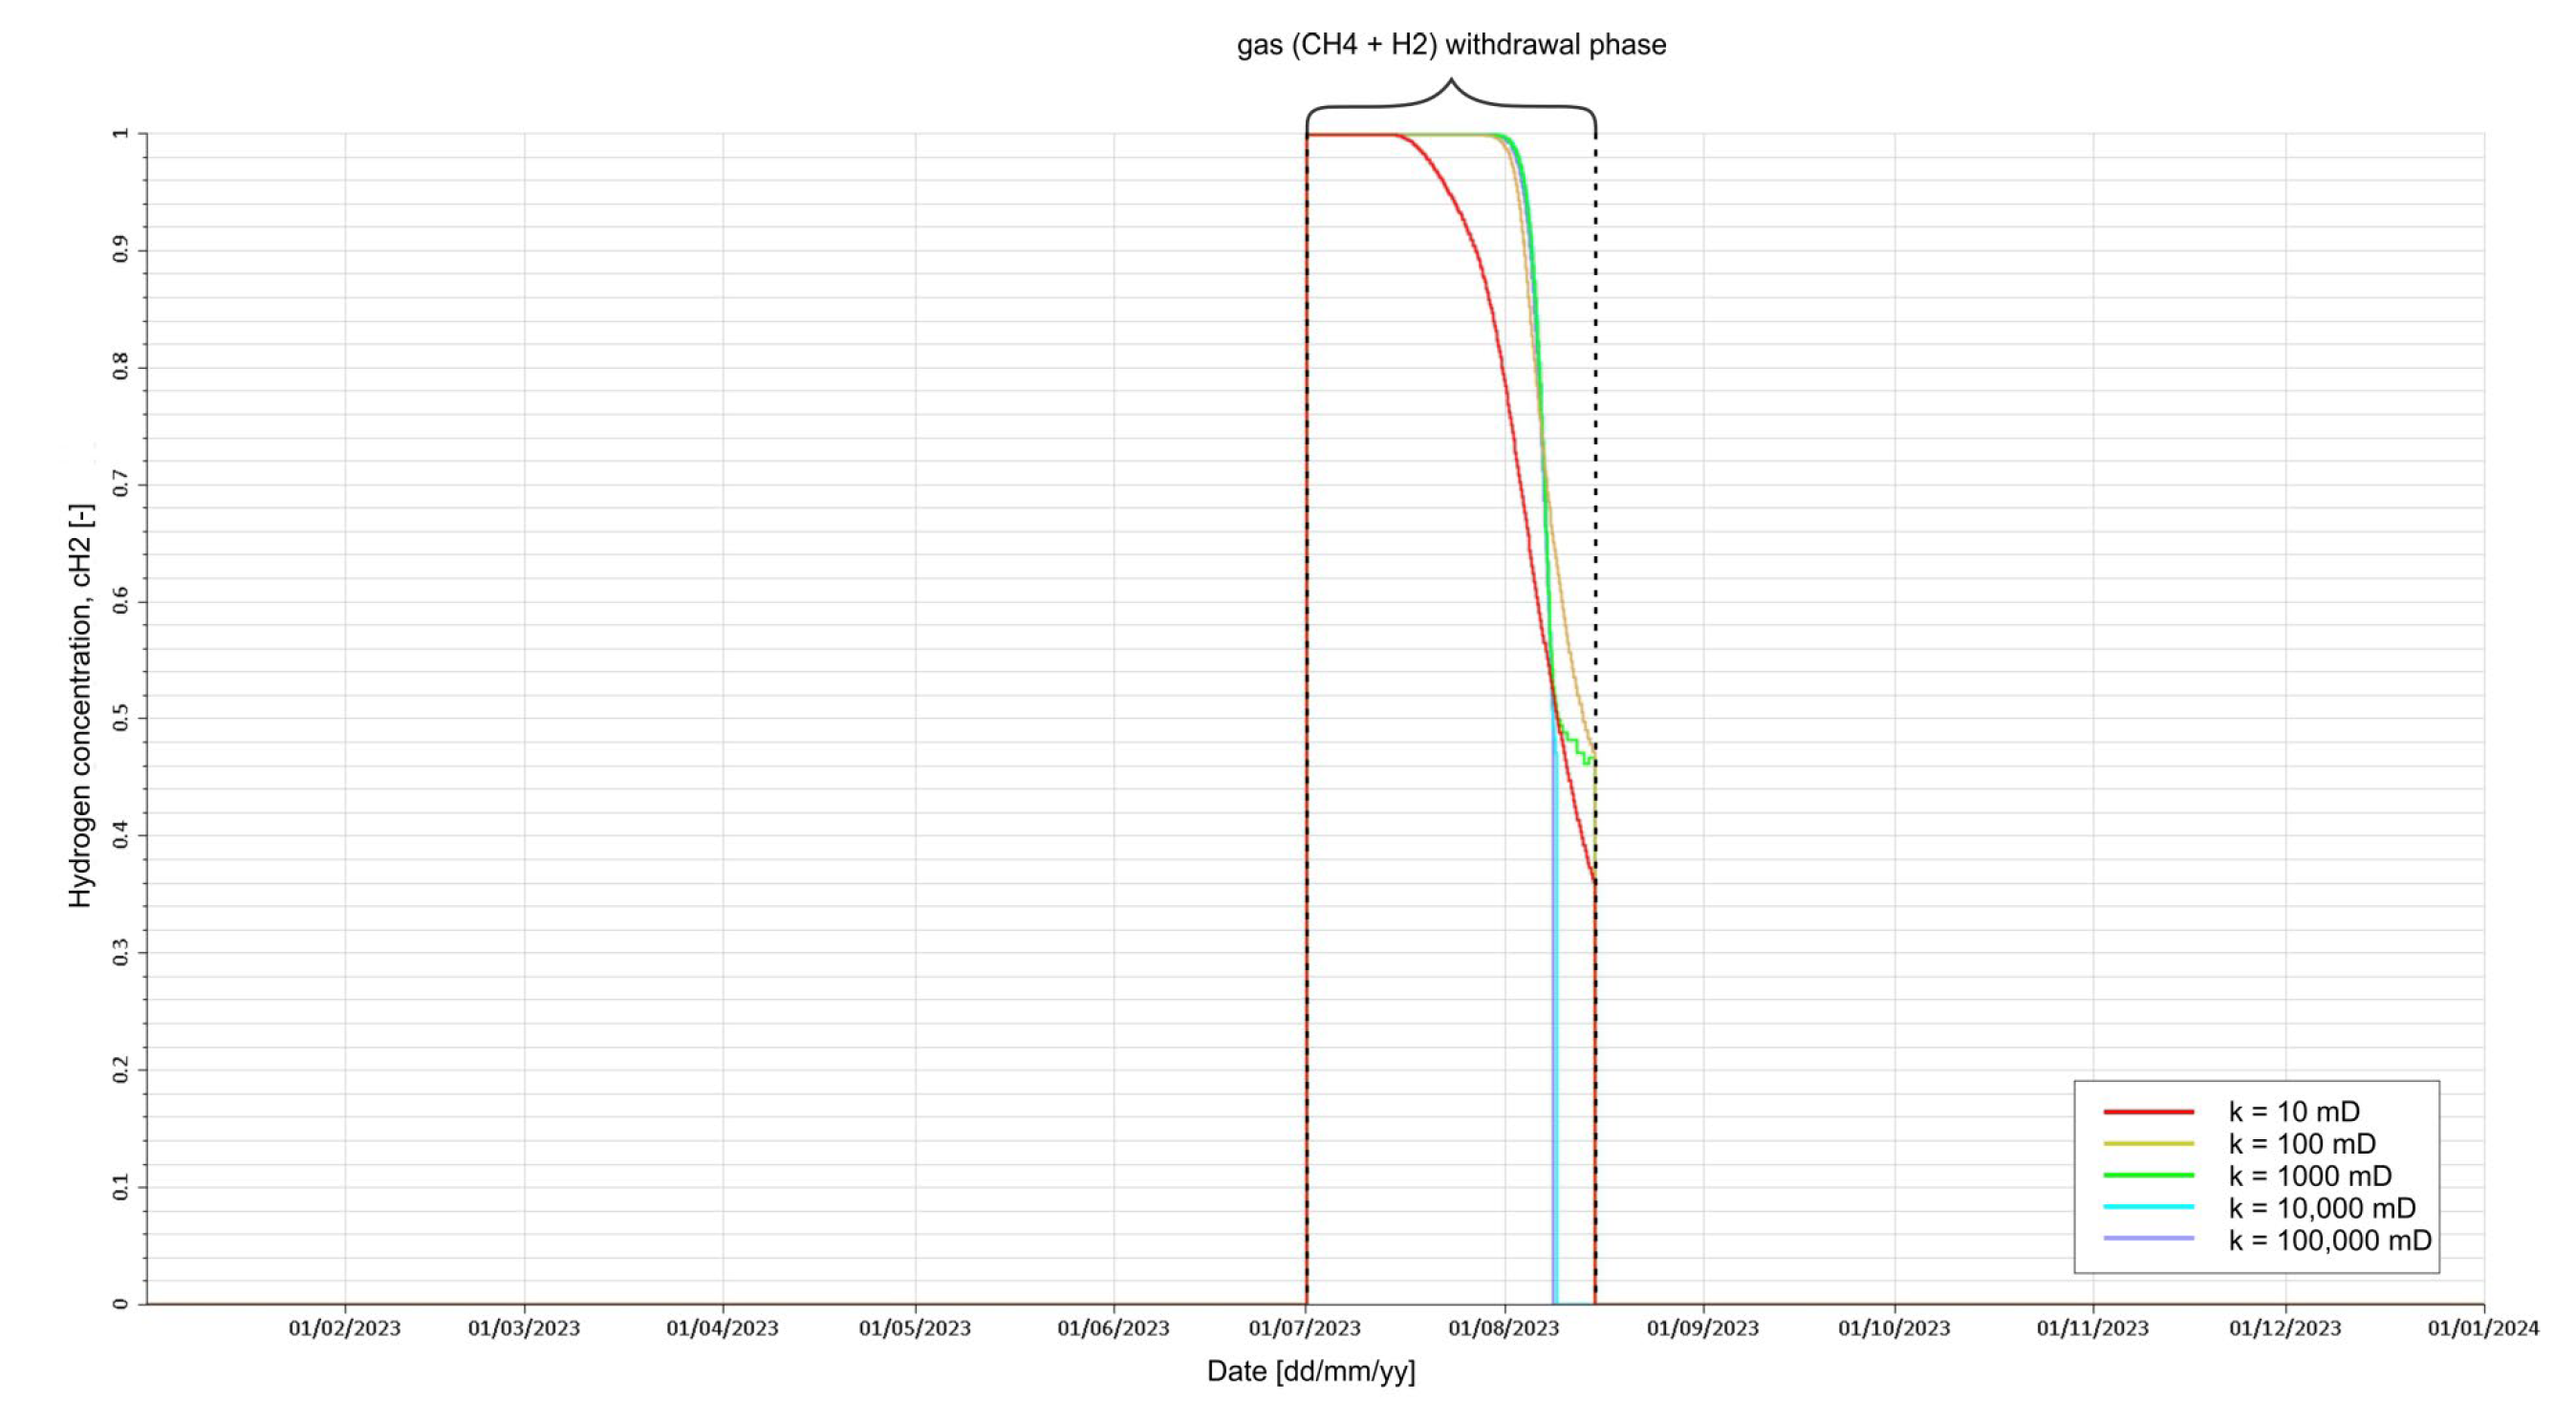
On the other hand, as a result of the analysis of the concentration of H2 in the withdrawn gas (Figure 4), differences of this magnitude were observed between the models with a permeability of 1000 and 10,000, which resulted from a relatively small, but longer-lasting gas extraction withdrawal for models with a permeability of 10, 100, and 1000 mD (the condition of extraction withdrawal at Pbhp, min = 40 bar).
Taking into account the differences in the course of the gas withdrawal efficiency, bottom pressures, and H2 concentration of the extracted gas, which resulted from the applied permeability of selected models, we decided to use a model with a permeability of 10,000 mD for further research. It should be noted that the upper permeability value of 100,000 mD does not correspond to natural reservoir rocks but was introduced as a numerical abstraction to reproduce the negligible flow resistance characteristic of an open cavern volume. Similar approaches have been reported in the literature, where the cavern volume is represented as an artificial domain with porosity ≈ 1.0 and very high permeability, effectively mimicking an open space with negligible flow resistance [53]. Lower permeability values (e.g., 10–100 mD) were included only to demonstrate the artificial effect of flow resistance and are not intended to represent cavern conditions. This simplification does not explicitly resolve turbulence and boundary-layer phenomena; instead, their effect on mixing is approximated implicitly through numerical dispersion of the finite-difference scheme. A more detailed resolution would require Computational Fluid Dynamics (CFD) modelling.
The selected cycle frequency and daily injection/withdrawal rates were chosen to ensure methodological clarity in the numerical simulations. These values were estimated based on the reported injection and withdrawal gas volume of a specific underground gas storage facility that uses salt caverns in Poland, as well as the assumed duration of the injection and withdrawal periods [5,33,54]. It is important to note that the actual operating parameters of salt caverns can vary depending on local conditions and the design of the facility. A detailed analysis of these parameters is beyond the scope of this study.

2.6. Dispersion

2.6.1. Physical and Numerical Dispersion

Physical dispersion occurring in hydrocarbon structures [55] is the process of blurring the concentration profile of reservoir fluids caused by the inhomogeneity of the convection velocity field, resulting from the complex flow through a porous medium. An analogous effect is also the result of the occurrence of molecular diffusion, resulting solely from the concentration gradient.
The vast majority of commercially available reservoir simulators using the finite difference method are burdened with the problem of numerical dispersion. On the one hand, it requires a detailed analysis and evaluation of the magnitude of numerical dispersion effects in the results of calculations with such simulators for most processes where physical dispersion does not occur. On the other hand, it makes it possible to take into account the effects of physical dispersion by modelling them through numerical dispersion in the processes in which it occurs. In this case, the problem boils down to the quantitative control of numerical dispersion in a situation where it is not a simple result of changing the relevant parameter, because it does not exist, but depends in a complex way on other parameters of the model, such as the size of its blocks [49].

2.6.2. Numerical Dispersion Analysis

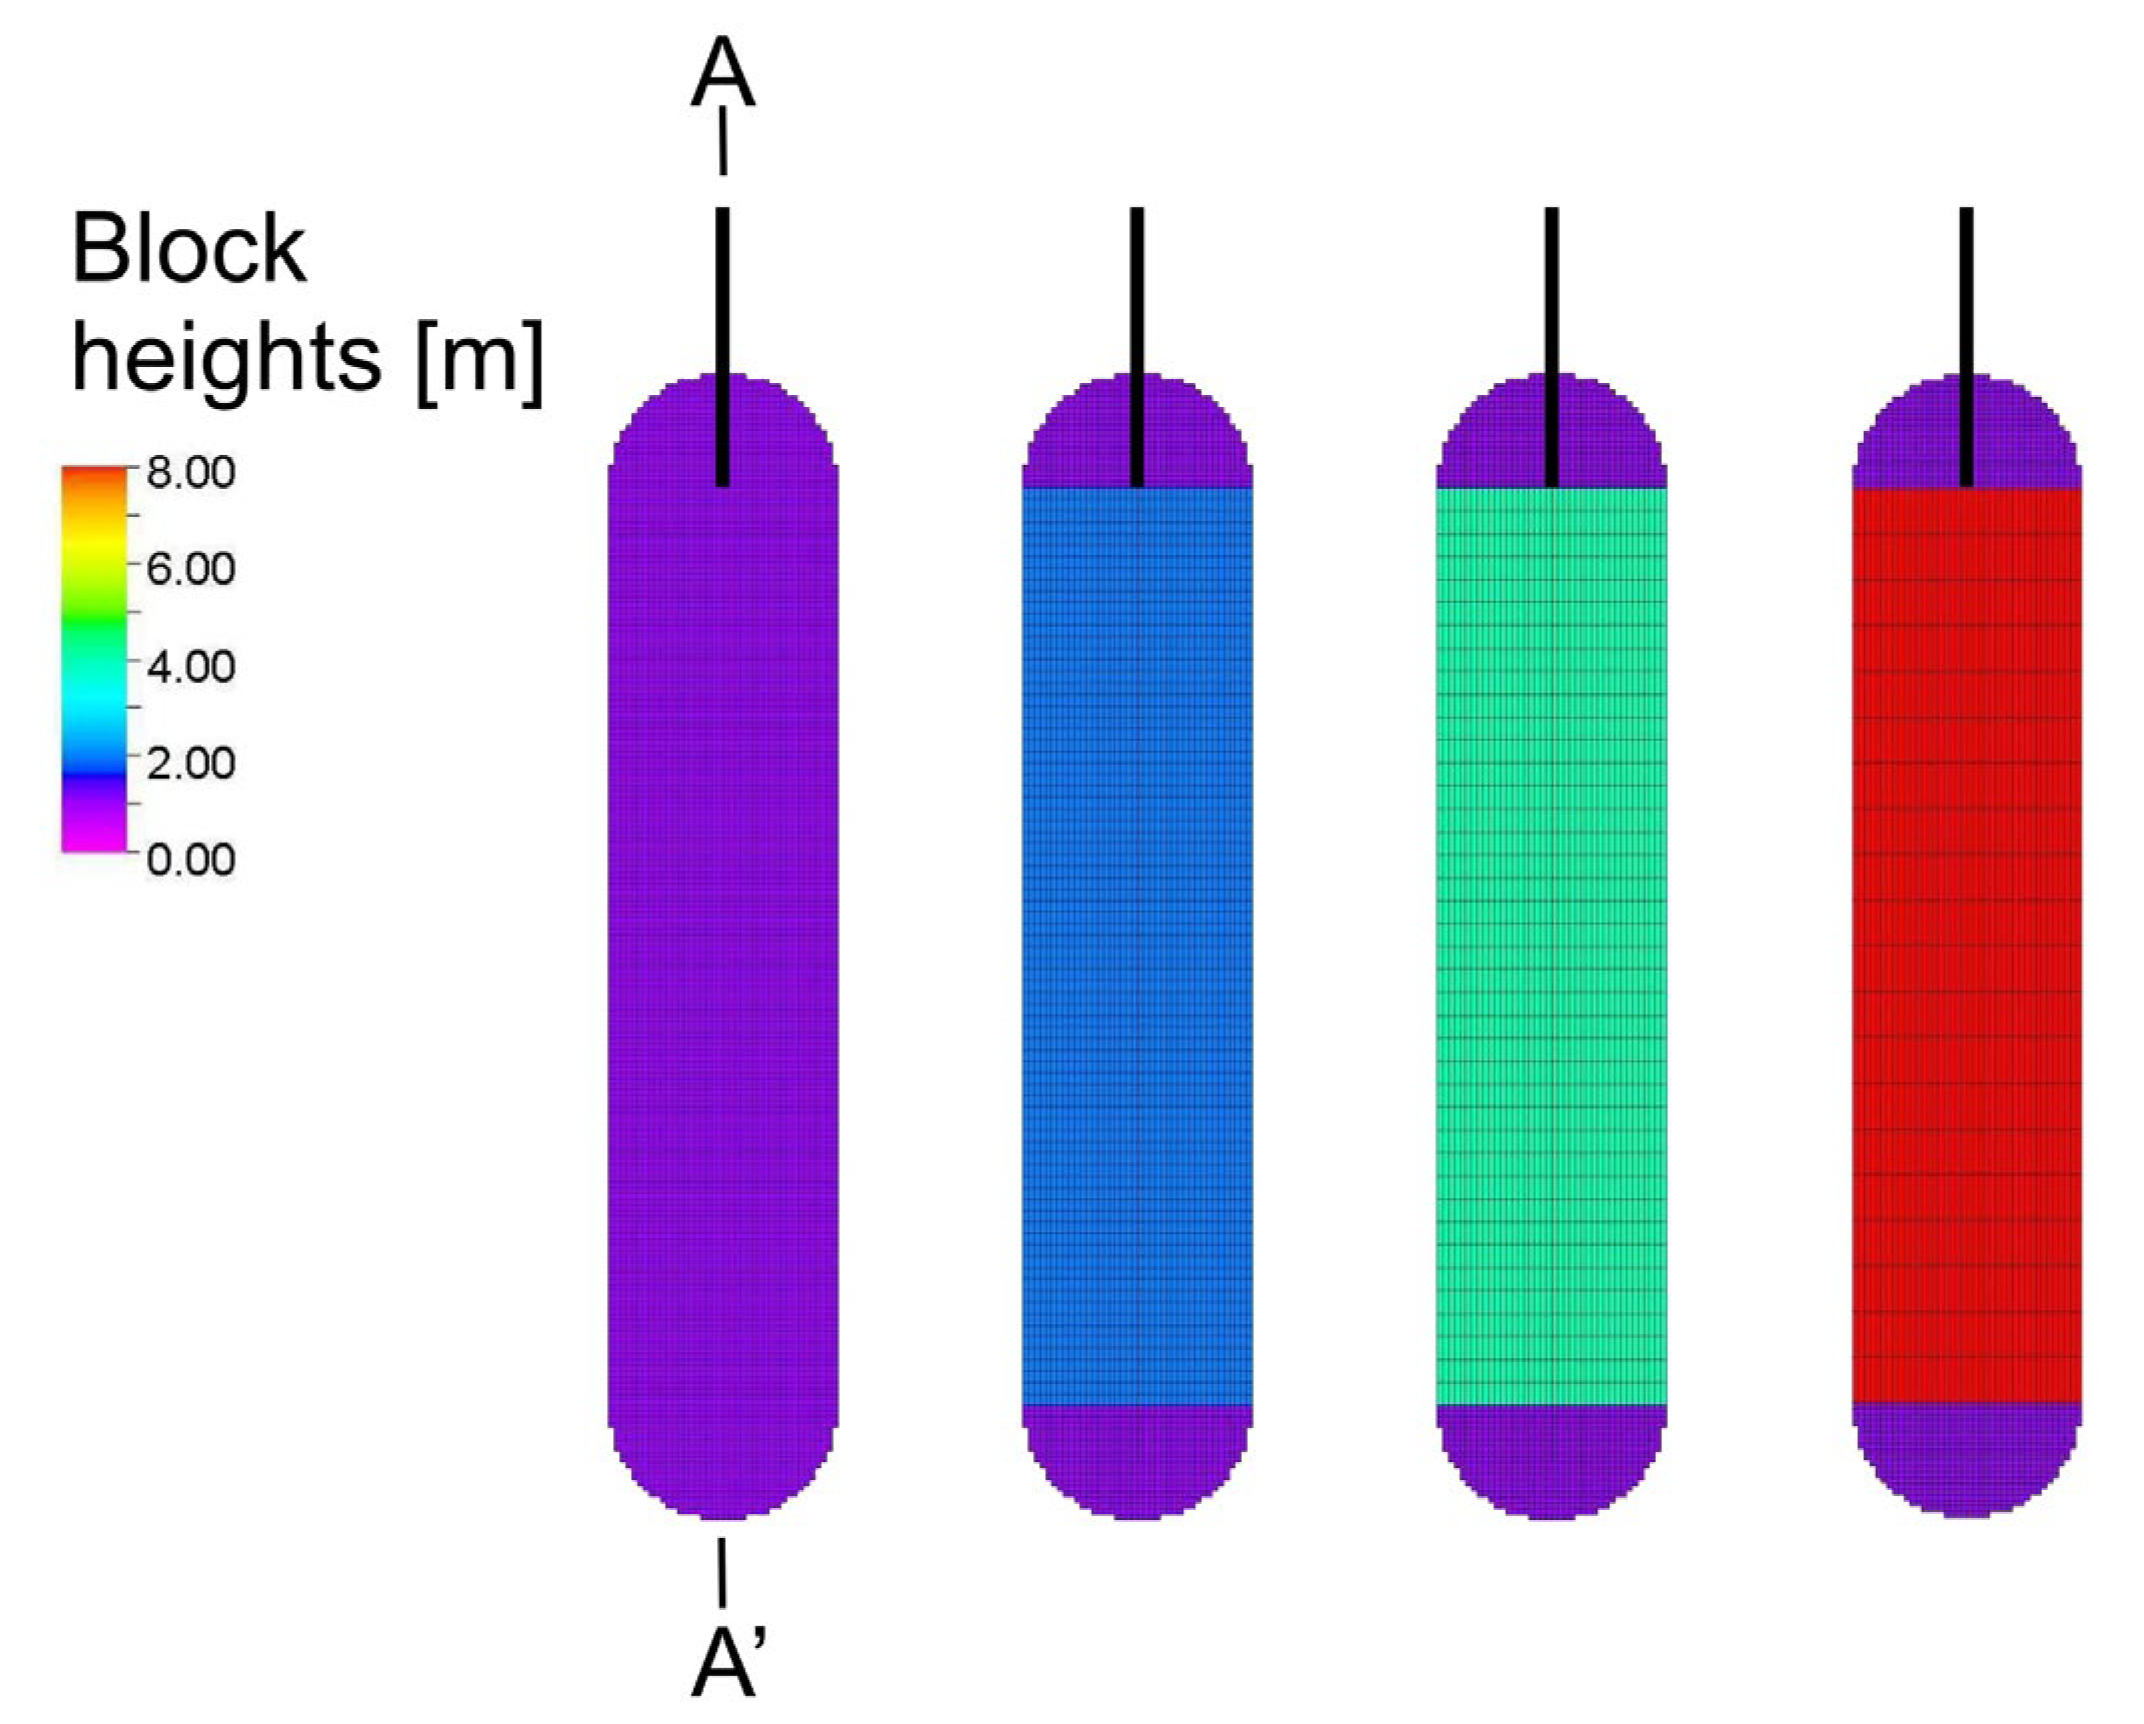
To find the dependence of the numerical dispersion intensity on the flow velocity and the size of the model blocks, the distribution of H2 concentration along the axis of symmetry of the salt cavern was analysed. Since the flow and, thus, the concentration of H2 in the part of the cavern described by the cylinder was studied, the height of the blocks was modified in this part of the model, so that the volume of the salt cavern was identical in all models (Figure 5). H2 was injected into a CH4-filled UGS with a constant injection rate (qg,inj = 600,000 Nm3/d) through an IP well providing access to the cavern in its upper part (Figure 5). Due to the closed nature of the storage operation, it was not possible to maintain the conditions of stationary H2 flow along the analysed A-A’ cross-section (Figure 5).
The results of the simulation in the form of the distributions of H2 concentration along the analysed model axis for different times, t, were confronted with the analytical model described below.
Due to the complex nature of the flow of injected H2 in the cavern, the convection–dispersion equation was used, having an analytical solution in one dimension for the following boundary and initial conditions [56]:
u x , t = 0 = 0   for   x 0 ,
u x = 0 ,   t = 1 , for   t 0 ,
u x = ,   t = 0 , for   t 0 .
This solution takes the form of [56]:
u x , t = 1 2 e r f c x v t 2 D t + 1 2 e x p v x D e r f c x + v t 2 D t ,
where erfc is the so-called complementary error function:
  • v—velocity of convection [m/d],
  • x—distance from the structure ceiling [m],
  • D—dispersion–diffusion coefficient [m2/d],
  • t—time [d].
For further analysis, due to the high values of the argument of the complementary error value function, a modified solution of this equation was used:
u x , t = 1 2 e r f c x v t 2 D t + 1 2 e x p v x 2 D x 2 4 D t v 2 t 4 D 1 π 1 z 1 1 2 z 2 + 3 4 z 4 15 8 z 6 ,
where z = x + v t 2 D t .
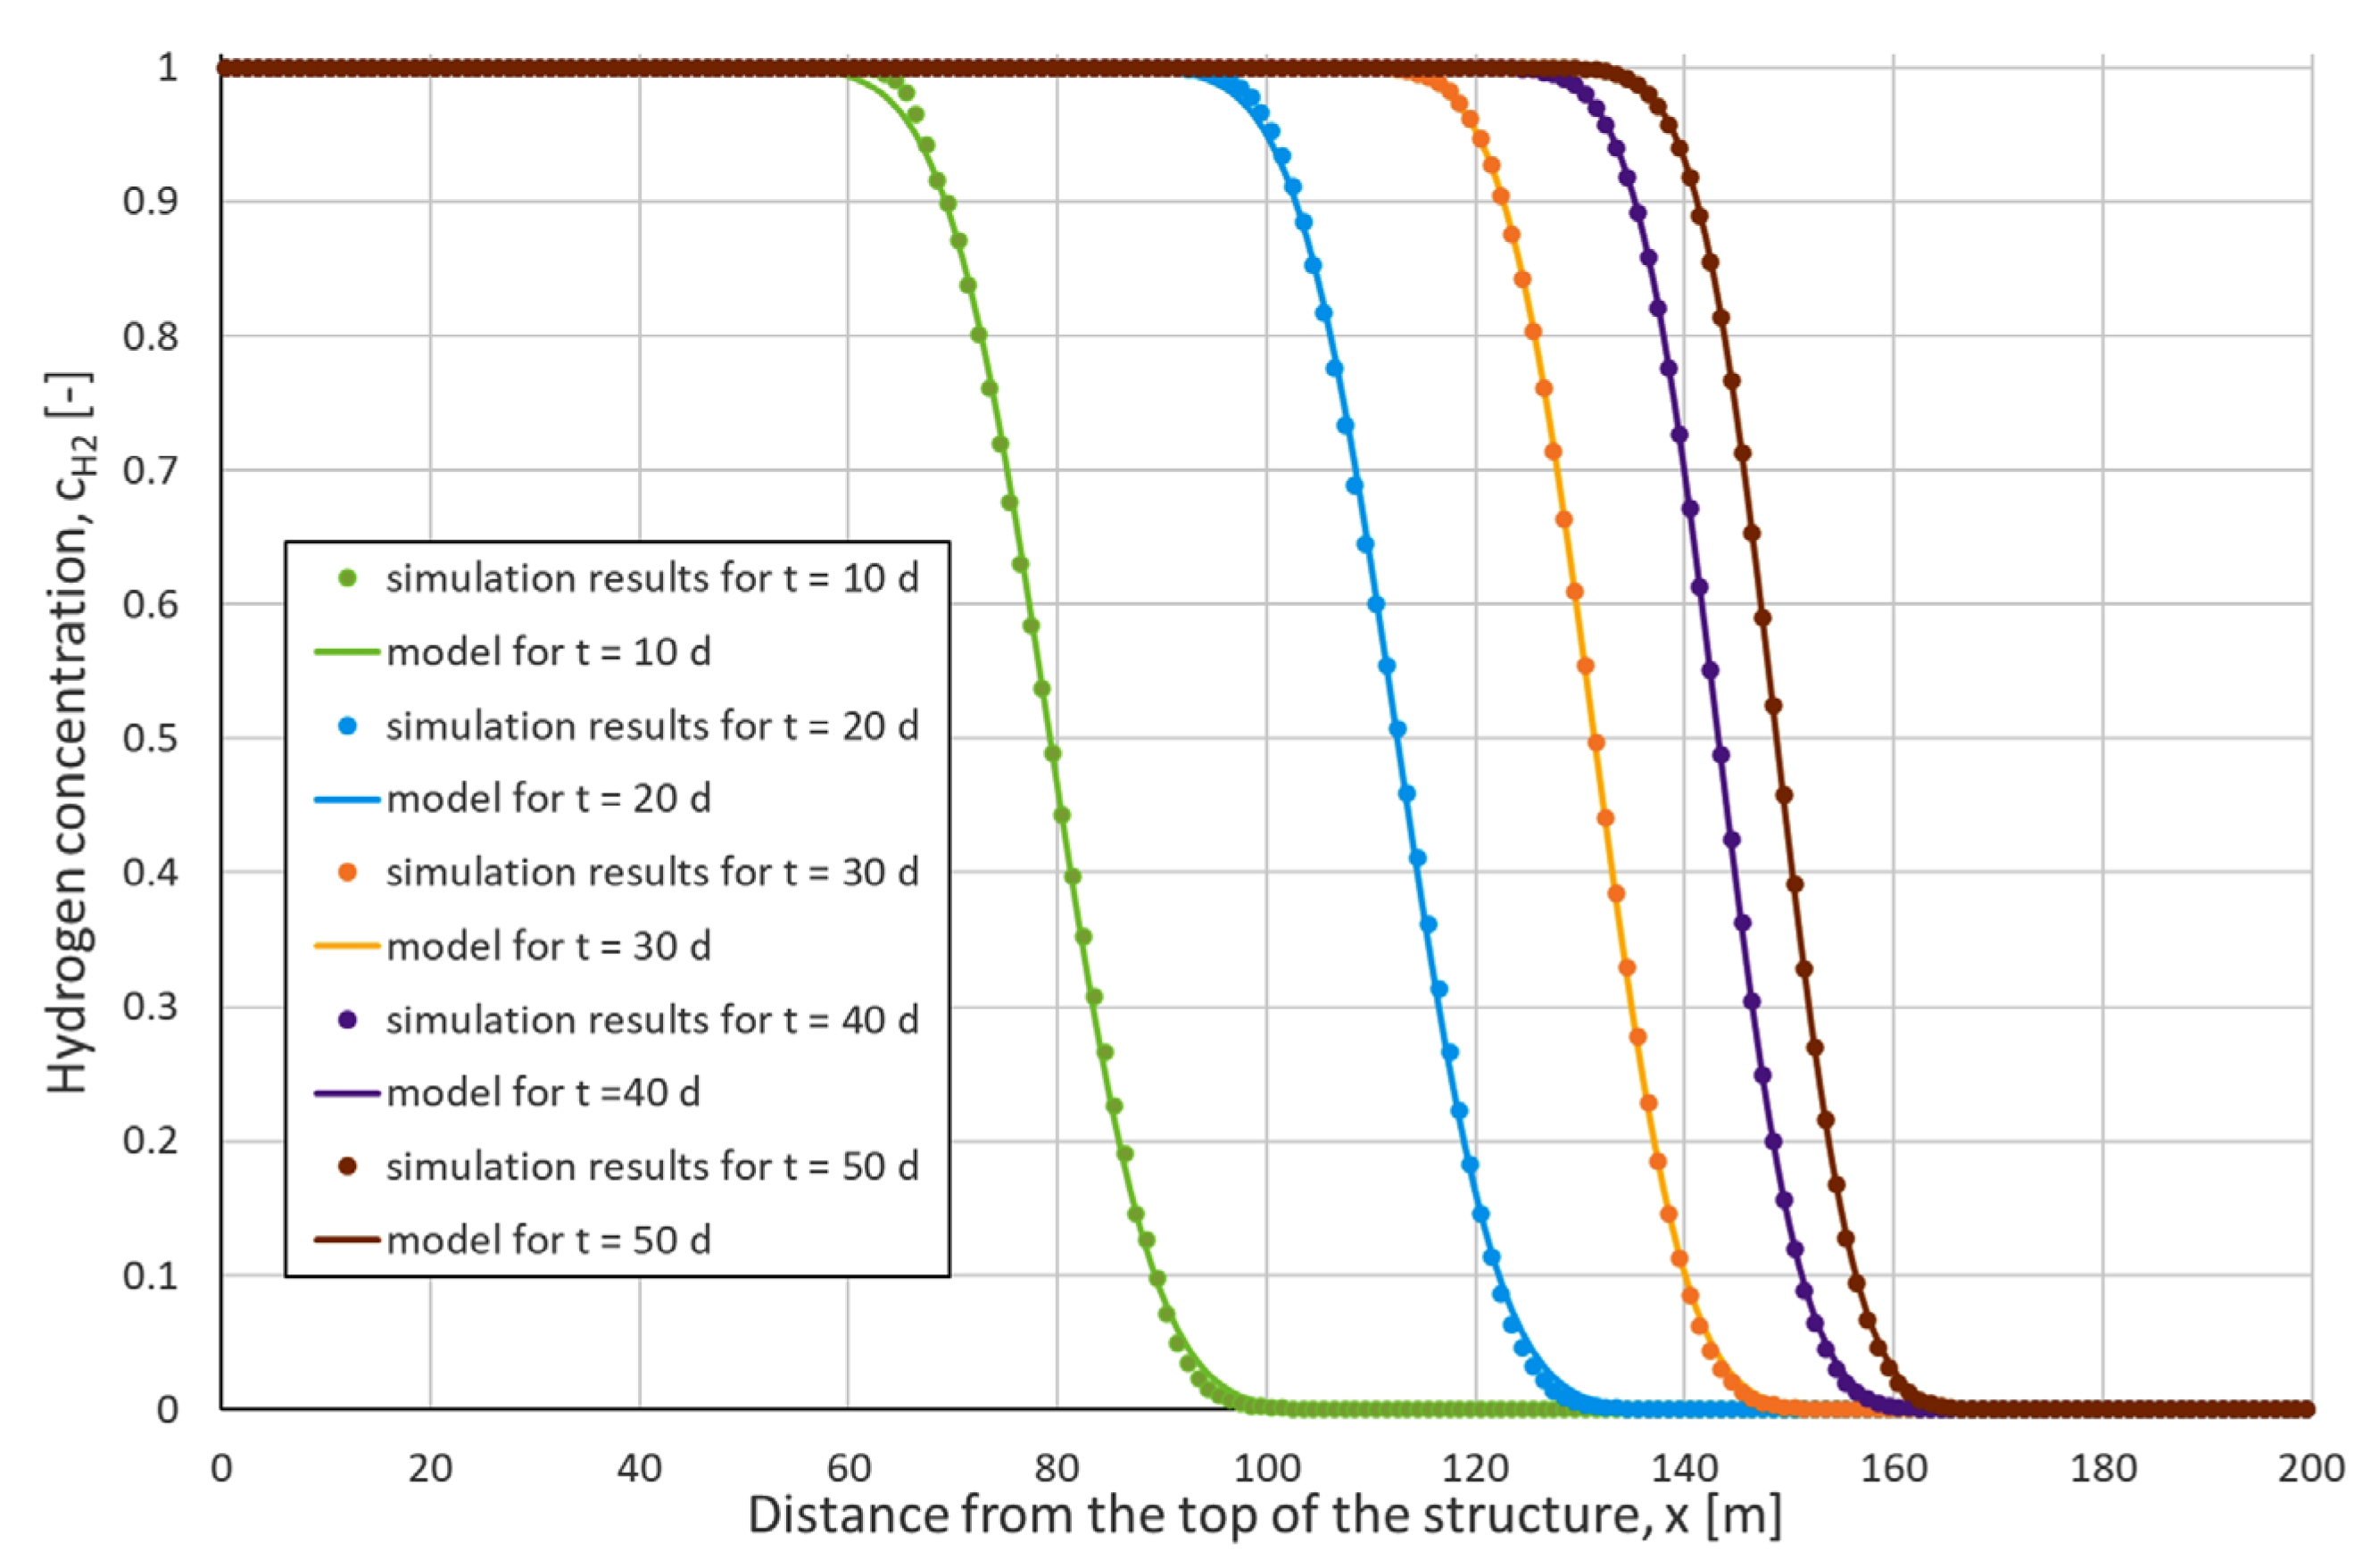
Figure 6 shows examples of fitting the above model to the simulation results in the form of H2 concentration, with cH2 as a function of position, x along the A-A’ profile (Figure 5) for selected time steps, and t = 10, 20, 30, 40, and 50 days from the start of injection.
The very good fit of the model to the simulation results described above justifies the correctness of the adopted procedure. As illustrated in Figure 6, the numerical dispersion reproduced by the simulation results effectively mimics physical dispersion, which is described by the one-dimensional convection–dispersion equation used in the analytical model.
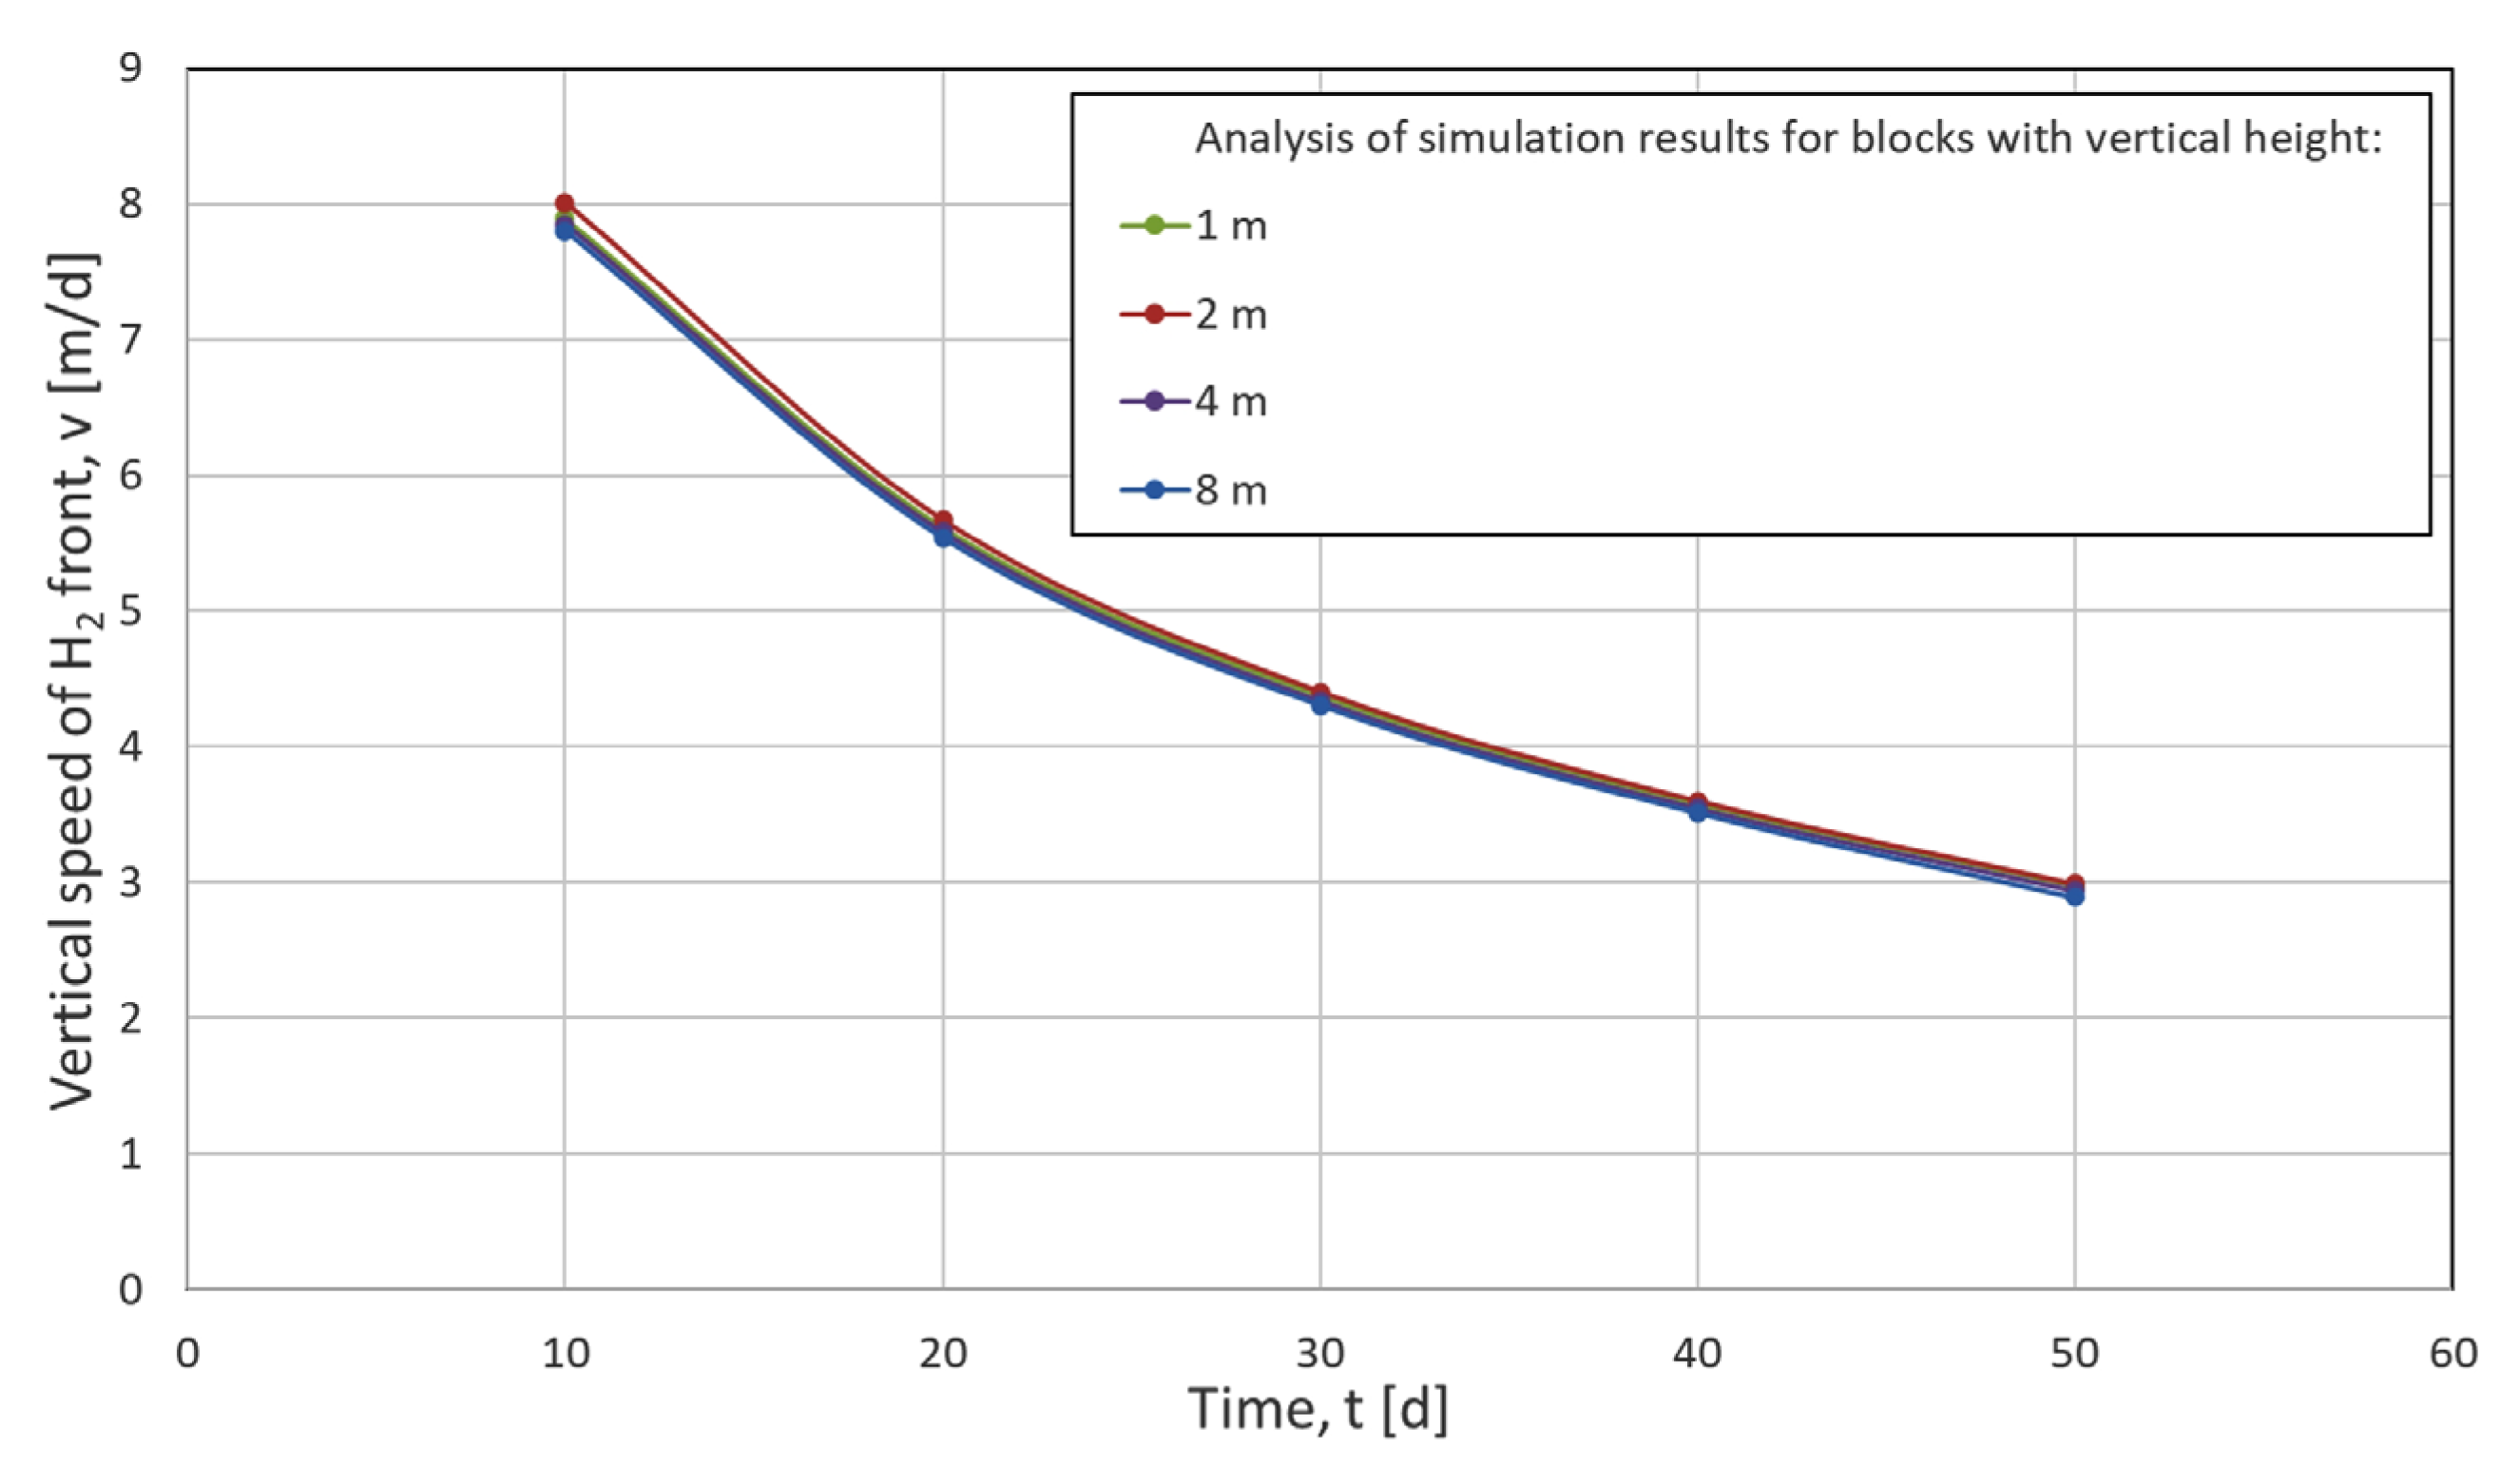
The procedure of fitting the model to the simulation results was repeated for the three other models differing in block heights (Figure 5). For each of these models and for each time step, the convection velocity coefficient, v, and the dispersion–diffusion coefficient, D, were adjusted. Figure 7 shows the decreasing dependence of the adjusted vertical velocity component, v, for the subsequent time steps, i.e., 10, 20, 30, 40, and 50 days from the start of injection. The decrease in the value of the speed of H2 movement over time can be explained primarily by the increasing pressure in the UHS. It should be noted that the different block sizes in the analysed models have a relatively small effect on the convection velocity.
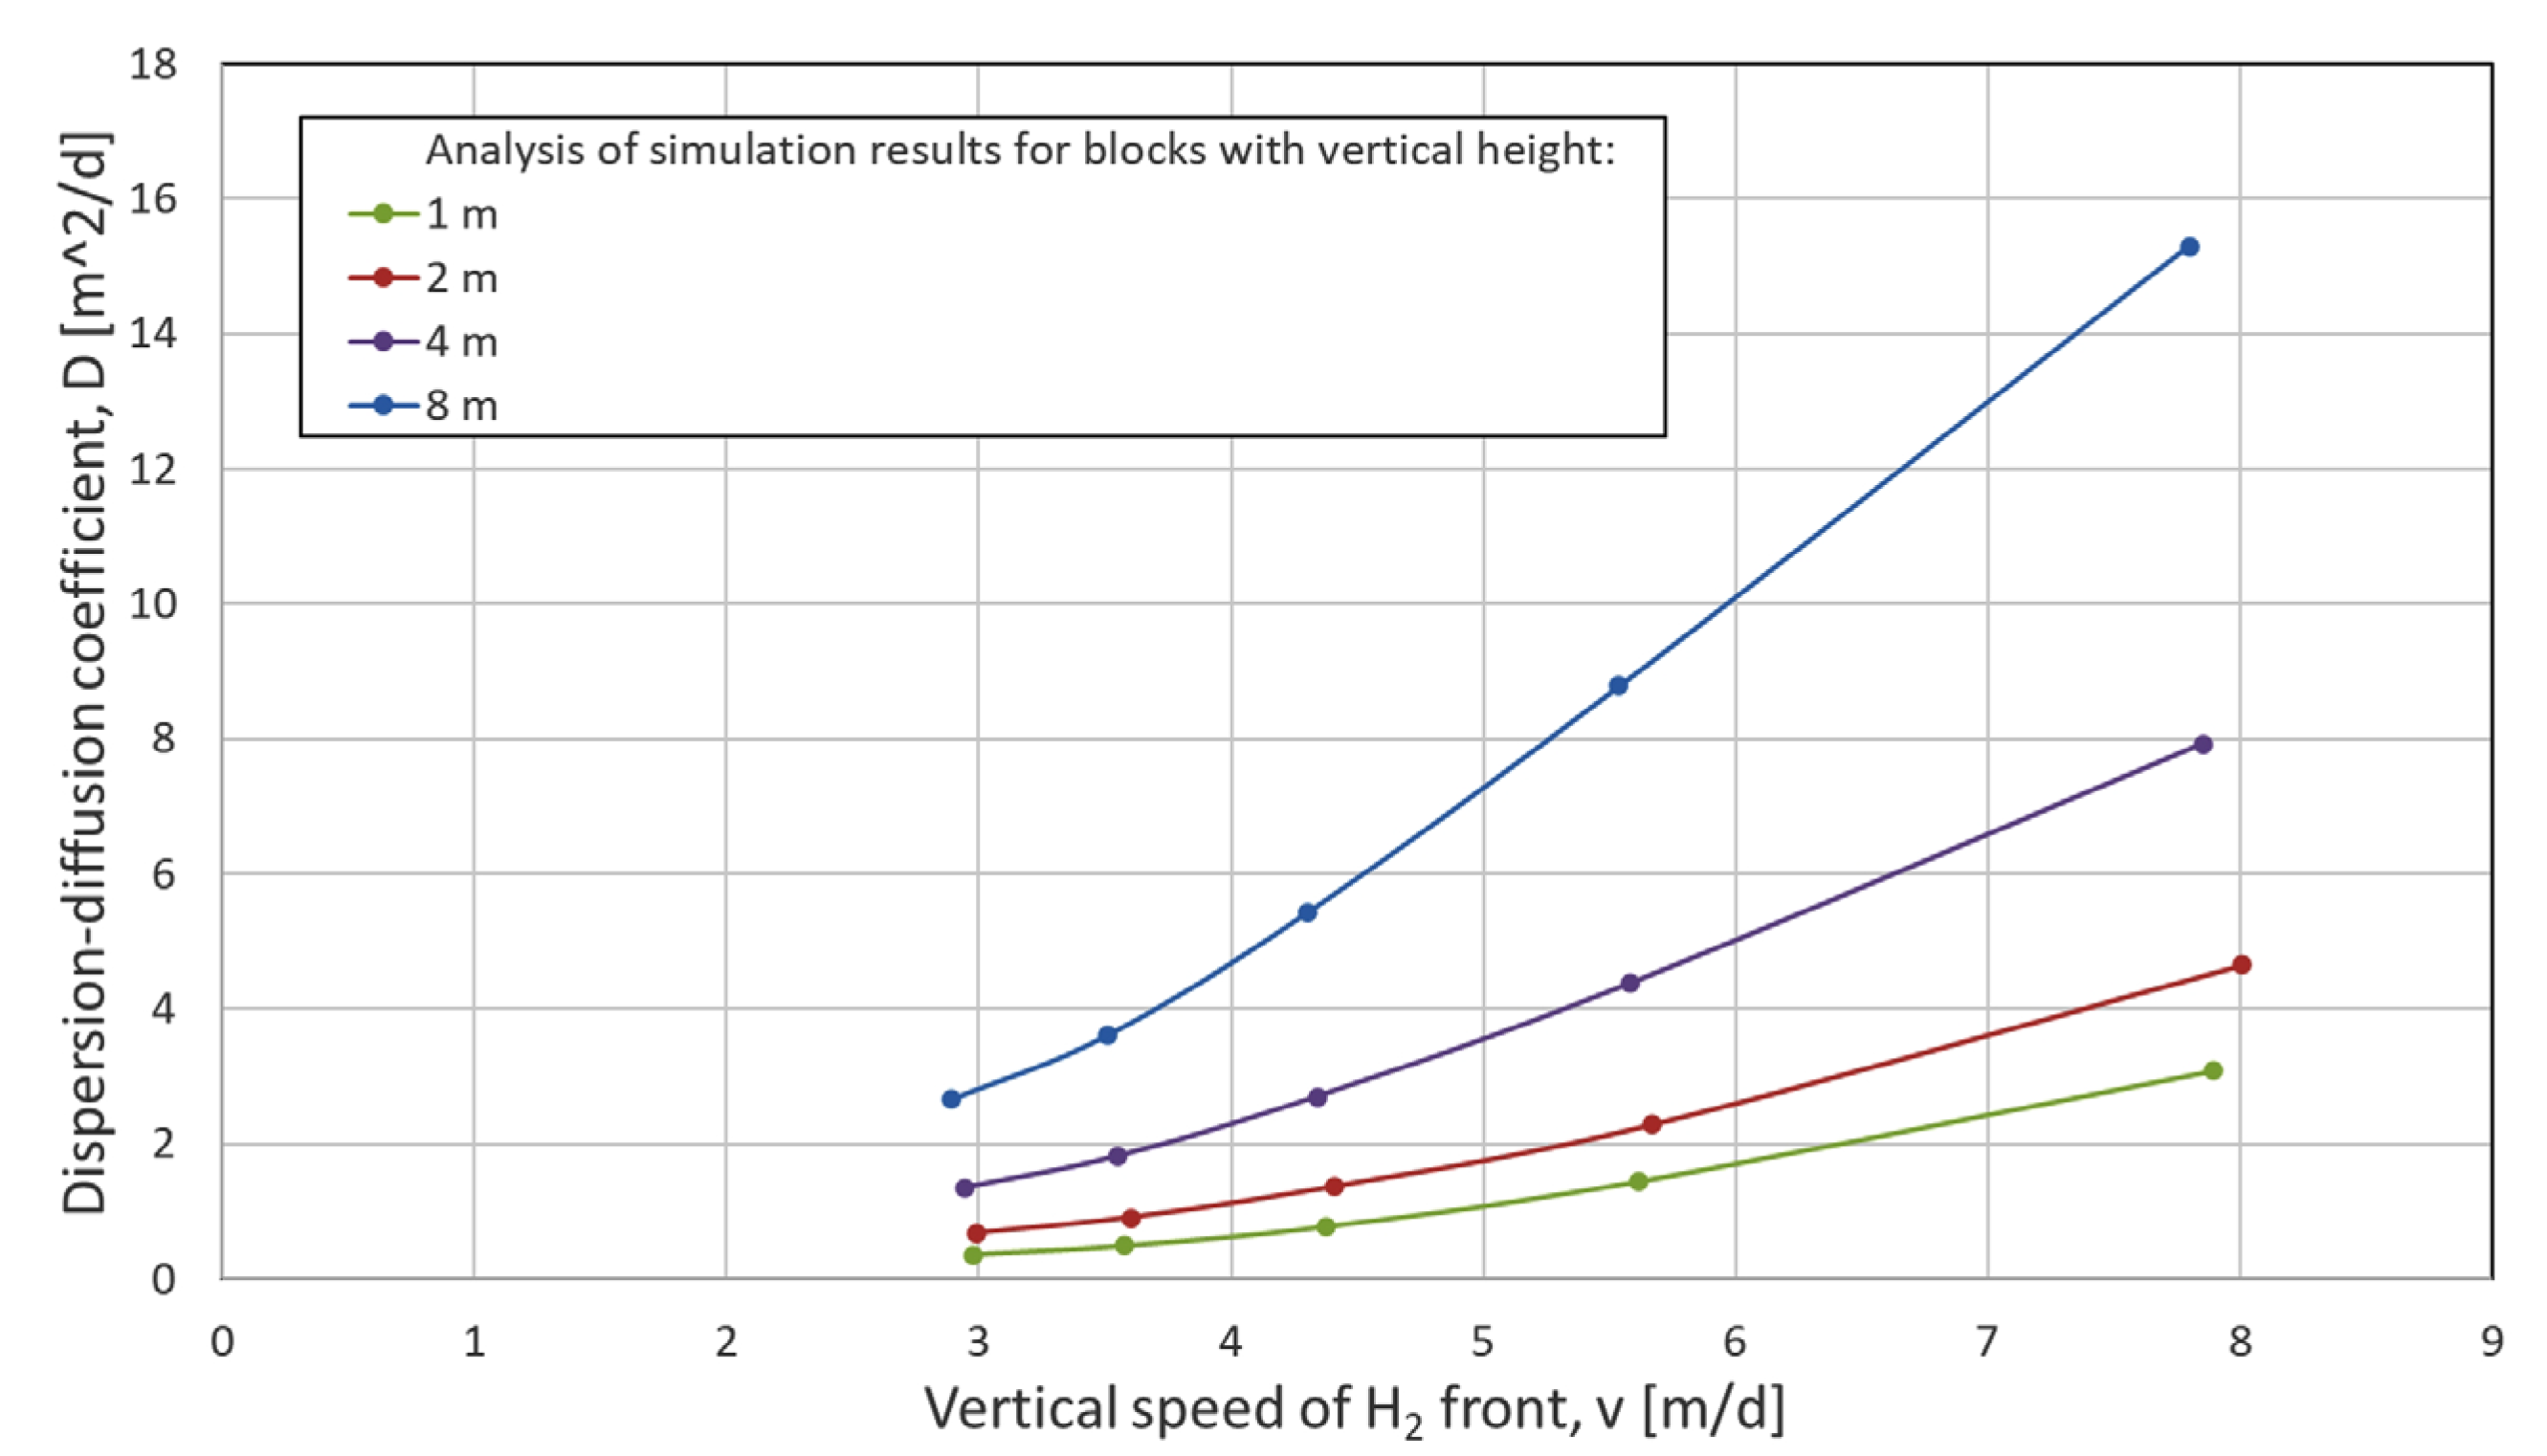
The second adjusted quantity is the dispersion–diffusion coefficient, the value of which decreases nonlinearly at lower and lower velocities, which may be due to the lack of stationarity of the flows due to the varying pressure in the cavern (Figure 8).

2.7. Diffusion

2.7.1. Molecular Diffusion

Diffusion is a special case of dispersion at zero fluid flow velocity. The two fundamental components of dispersive mixing are molecular diffusion and physical dispersion. Molecular diffusion takes place due to the concentration gradient, regardless of the presence or absence of flow. In the phenomenon of gas displacement by another gas under typical conditions of porous media and for the vast majority of the flow velocities of these fluids, physical dispersion is the dominant process responsible for the observed mixing of gases, while molecular diffusion may be important (from the point of view of reservoir engineering) during stand-ups performed between the gas injection and withdrawal phases.

2.7.2. Diffusion Coefficients

The analytical Chapman–Enskog formula was used to determine the binary diffusion coefficients for both gases [23]:
D d i f f , i j = 0.0018583 P σ i j 2 Ω i j T 3 1 M w , i + 1 M w , j
where Ddiff—binary diffusion coefficient [cm2/s],
  • P—pressure [bar],
  • σ—medium molecular size,
  • Ω—Lennard-Jones potential,
  • T—temperature [°C],
  • Mw—molecular mass [g/mol].
Thanks to the binary diffusion coefficients in the CH4-H2 system (for fixed conditions P, T) taken from the literature [23], the above formula has been reduced to the following form:
D d i f f , i j = A P T 3 B
where A and B are fixed coefficients.
Table 2 presents the diffusion coefficients in the CH4-H2 system, the first value is an example from the literature, while the next one is estimated for the reservoir temperature and selected pressures according to the above formula:
Similar to the models with different vertical block sizes, a simulation forecast of H2 injection was made for the selected model (with blocks with vertical dimensions, h = 1 m) to which binary diffusion coefficients were implemented, Ddiff = 0.1 m2/d.
In contrast to numerical physical dispersion, which is modelled indirectly in the simulator by numerical dispersion, the molecular diffusion coefficient can be explicitly specified as an input parameter in Eclipse 300. This allows users to have direct control over gas mixing during simulations.

2.7.3. Gas Diffusion Analysis

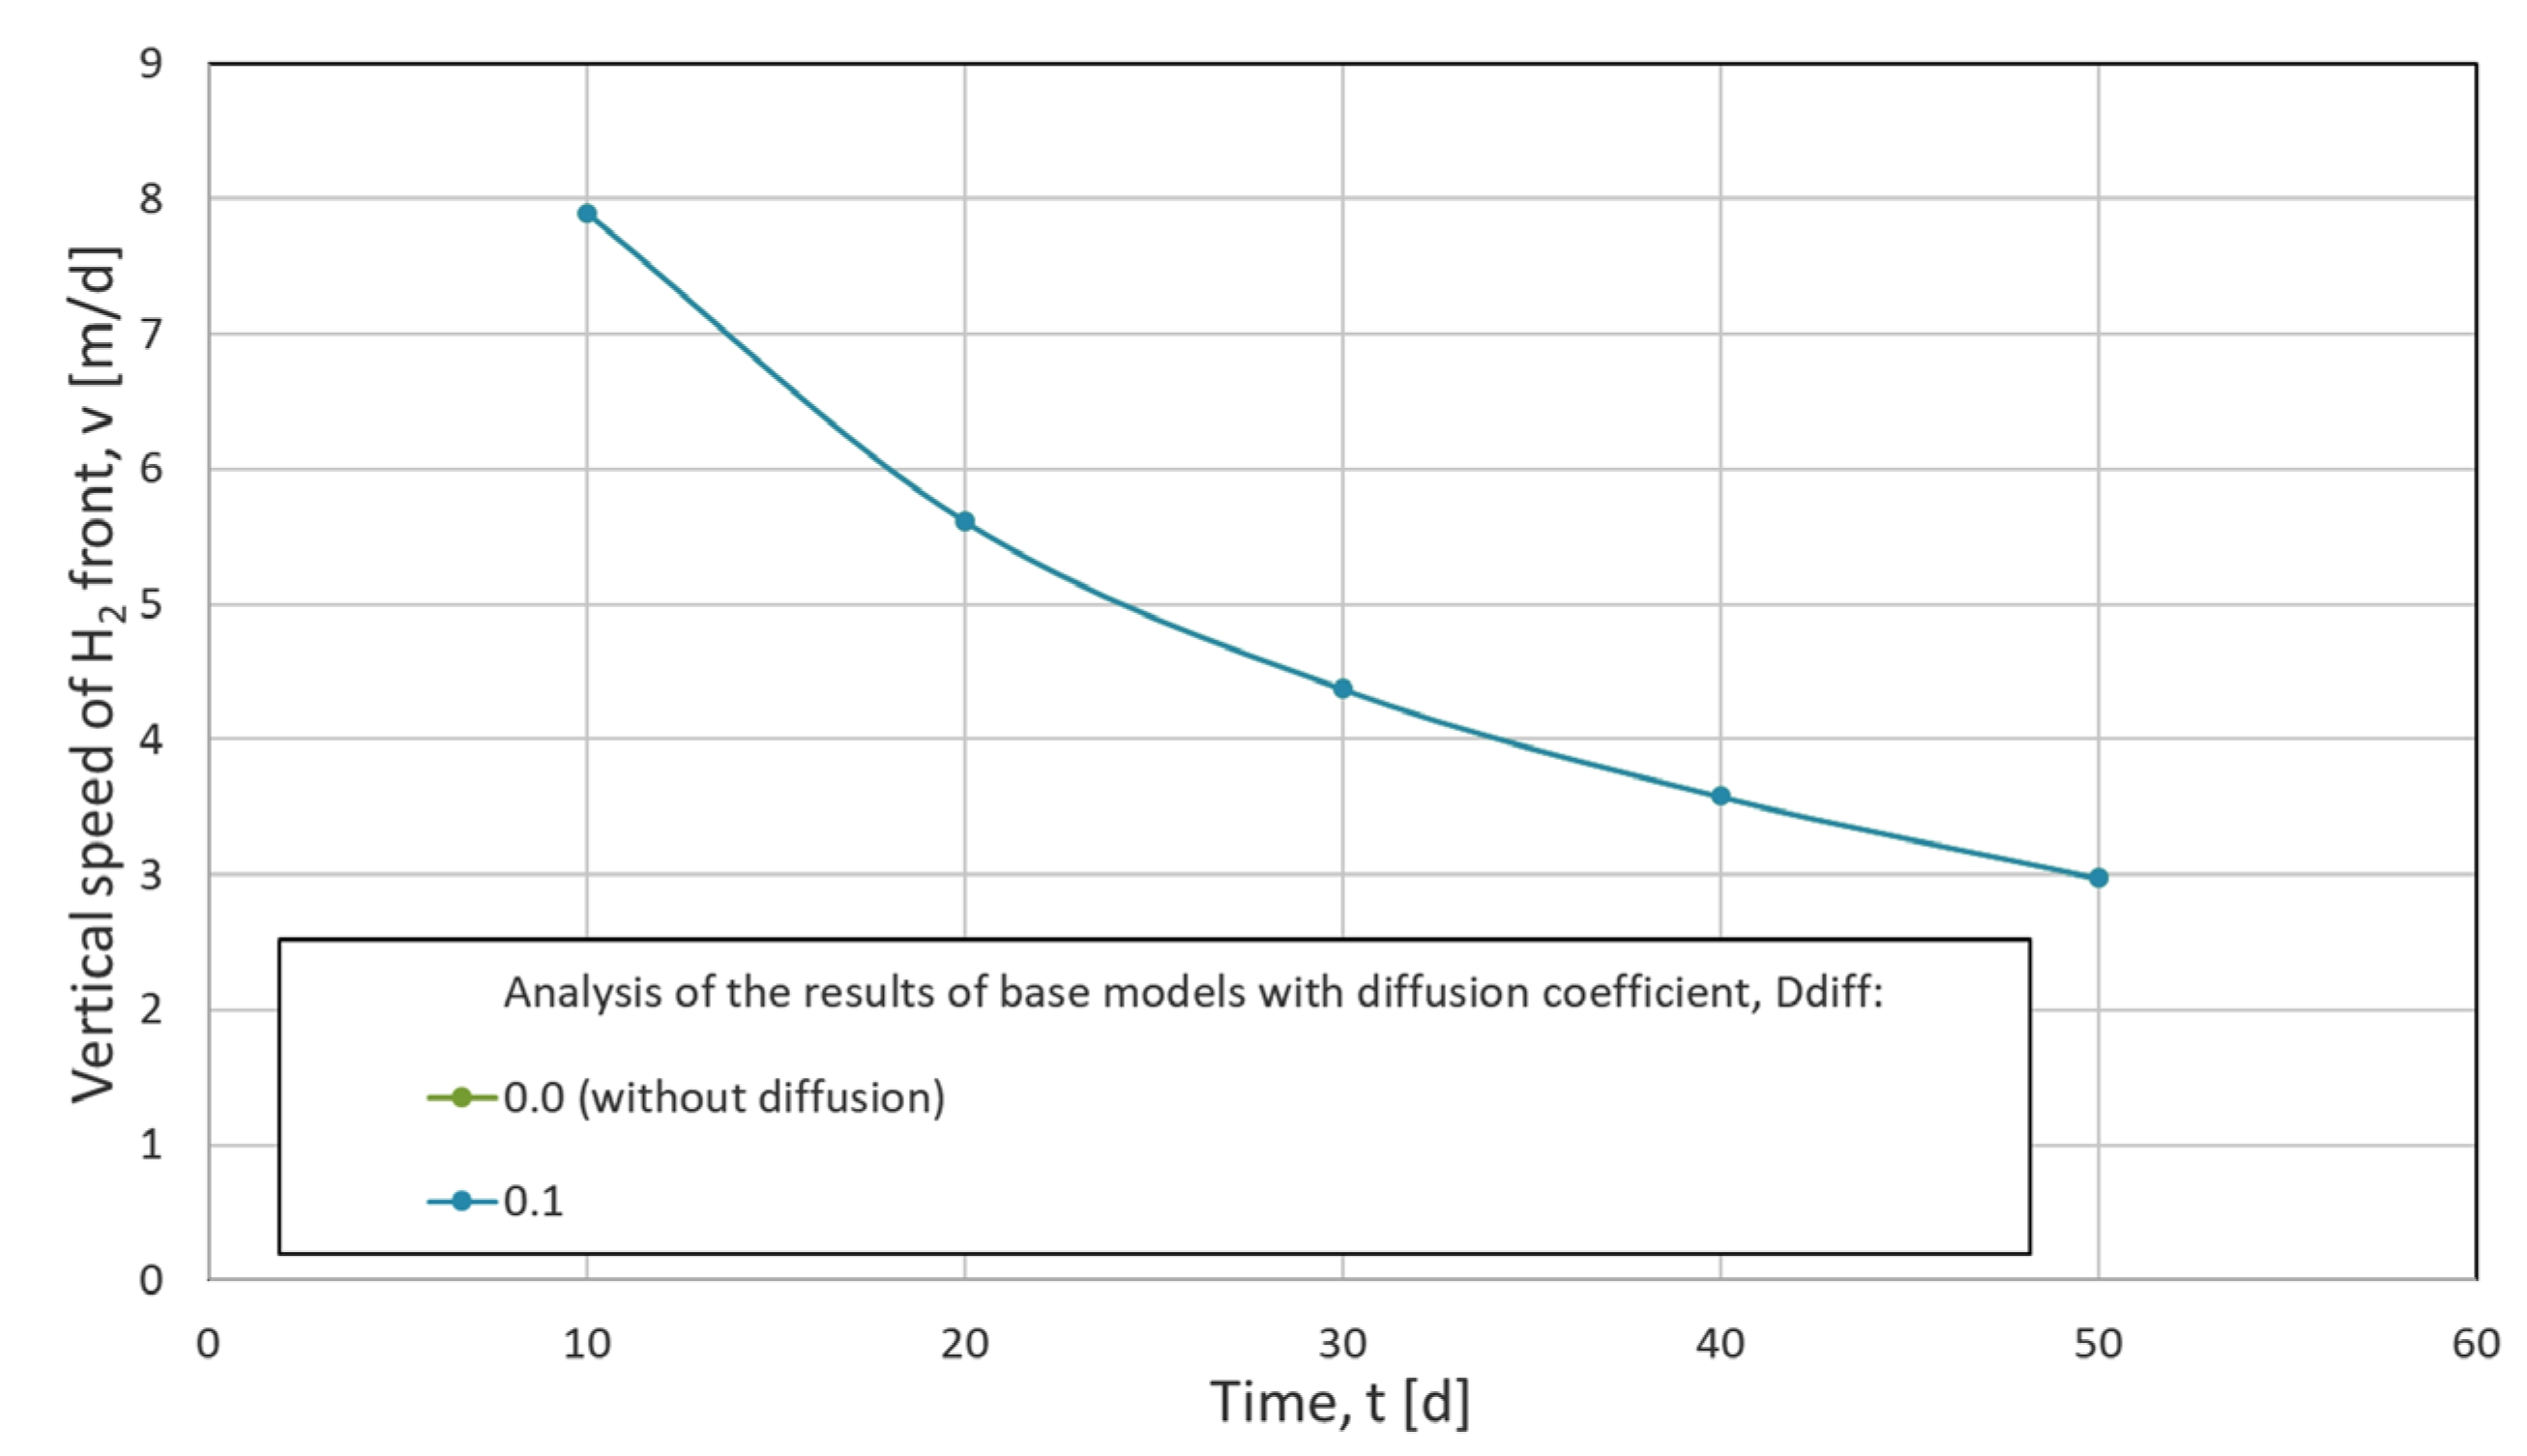
Based on the results of the simulation, the concentration profile of injected H2 was adjusted to the UHS for the same time steps as in the previous models. The values of the convection velocity obtained as a result of fitting the convection–dispersion model to the results of the simulation were compared with the values obtained from the model without diffusion (Figure 9). No significant differences were found.
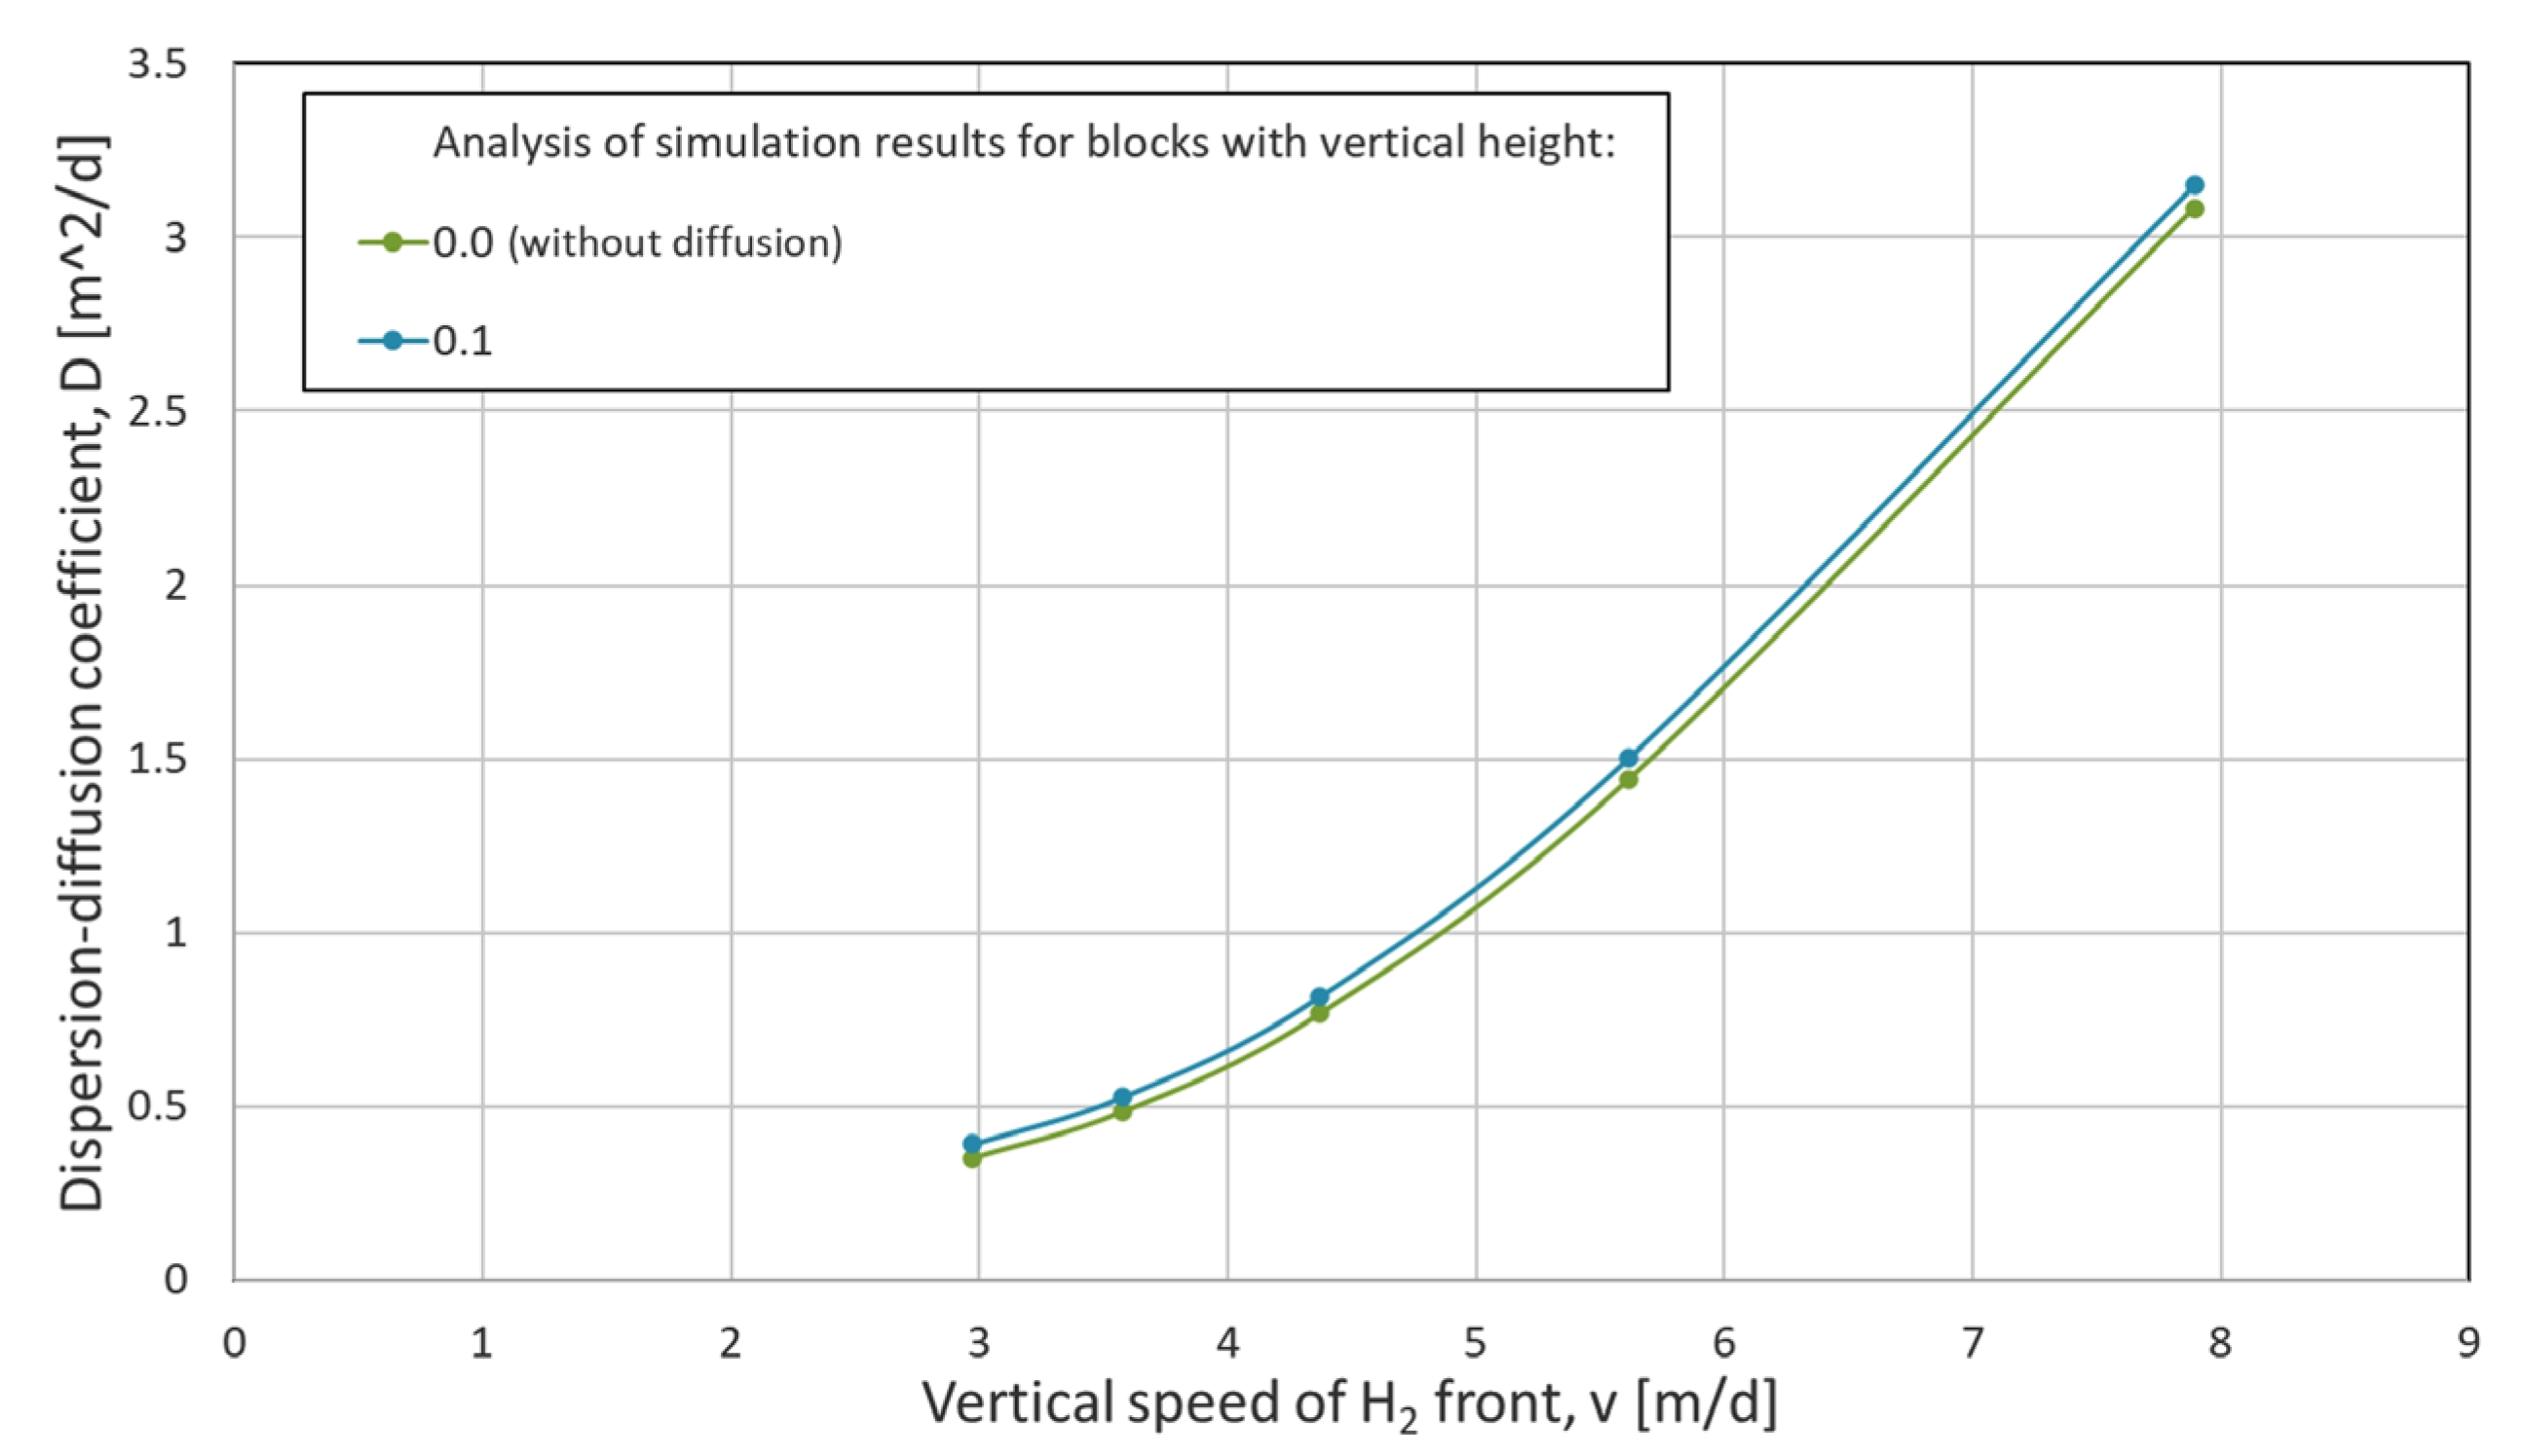
While the introduction of diffusion did not affect the speed of movement of the injected H2 front, its inclusion affected its blurring, which is expressed by an increase in the dispersion–diffusion coefficient, D, determined from the convection–dispersion model (Figure 10).

2.7.4. Diffusion Effects During Stand-Ups

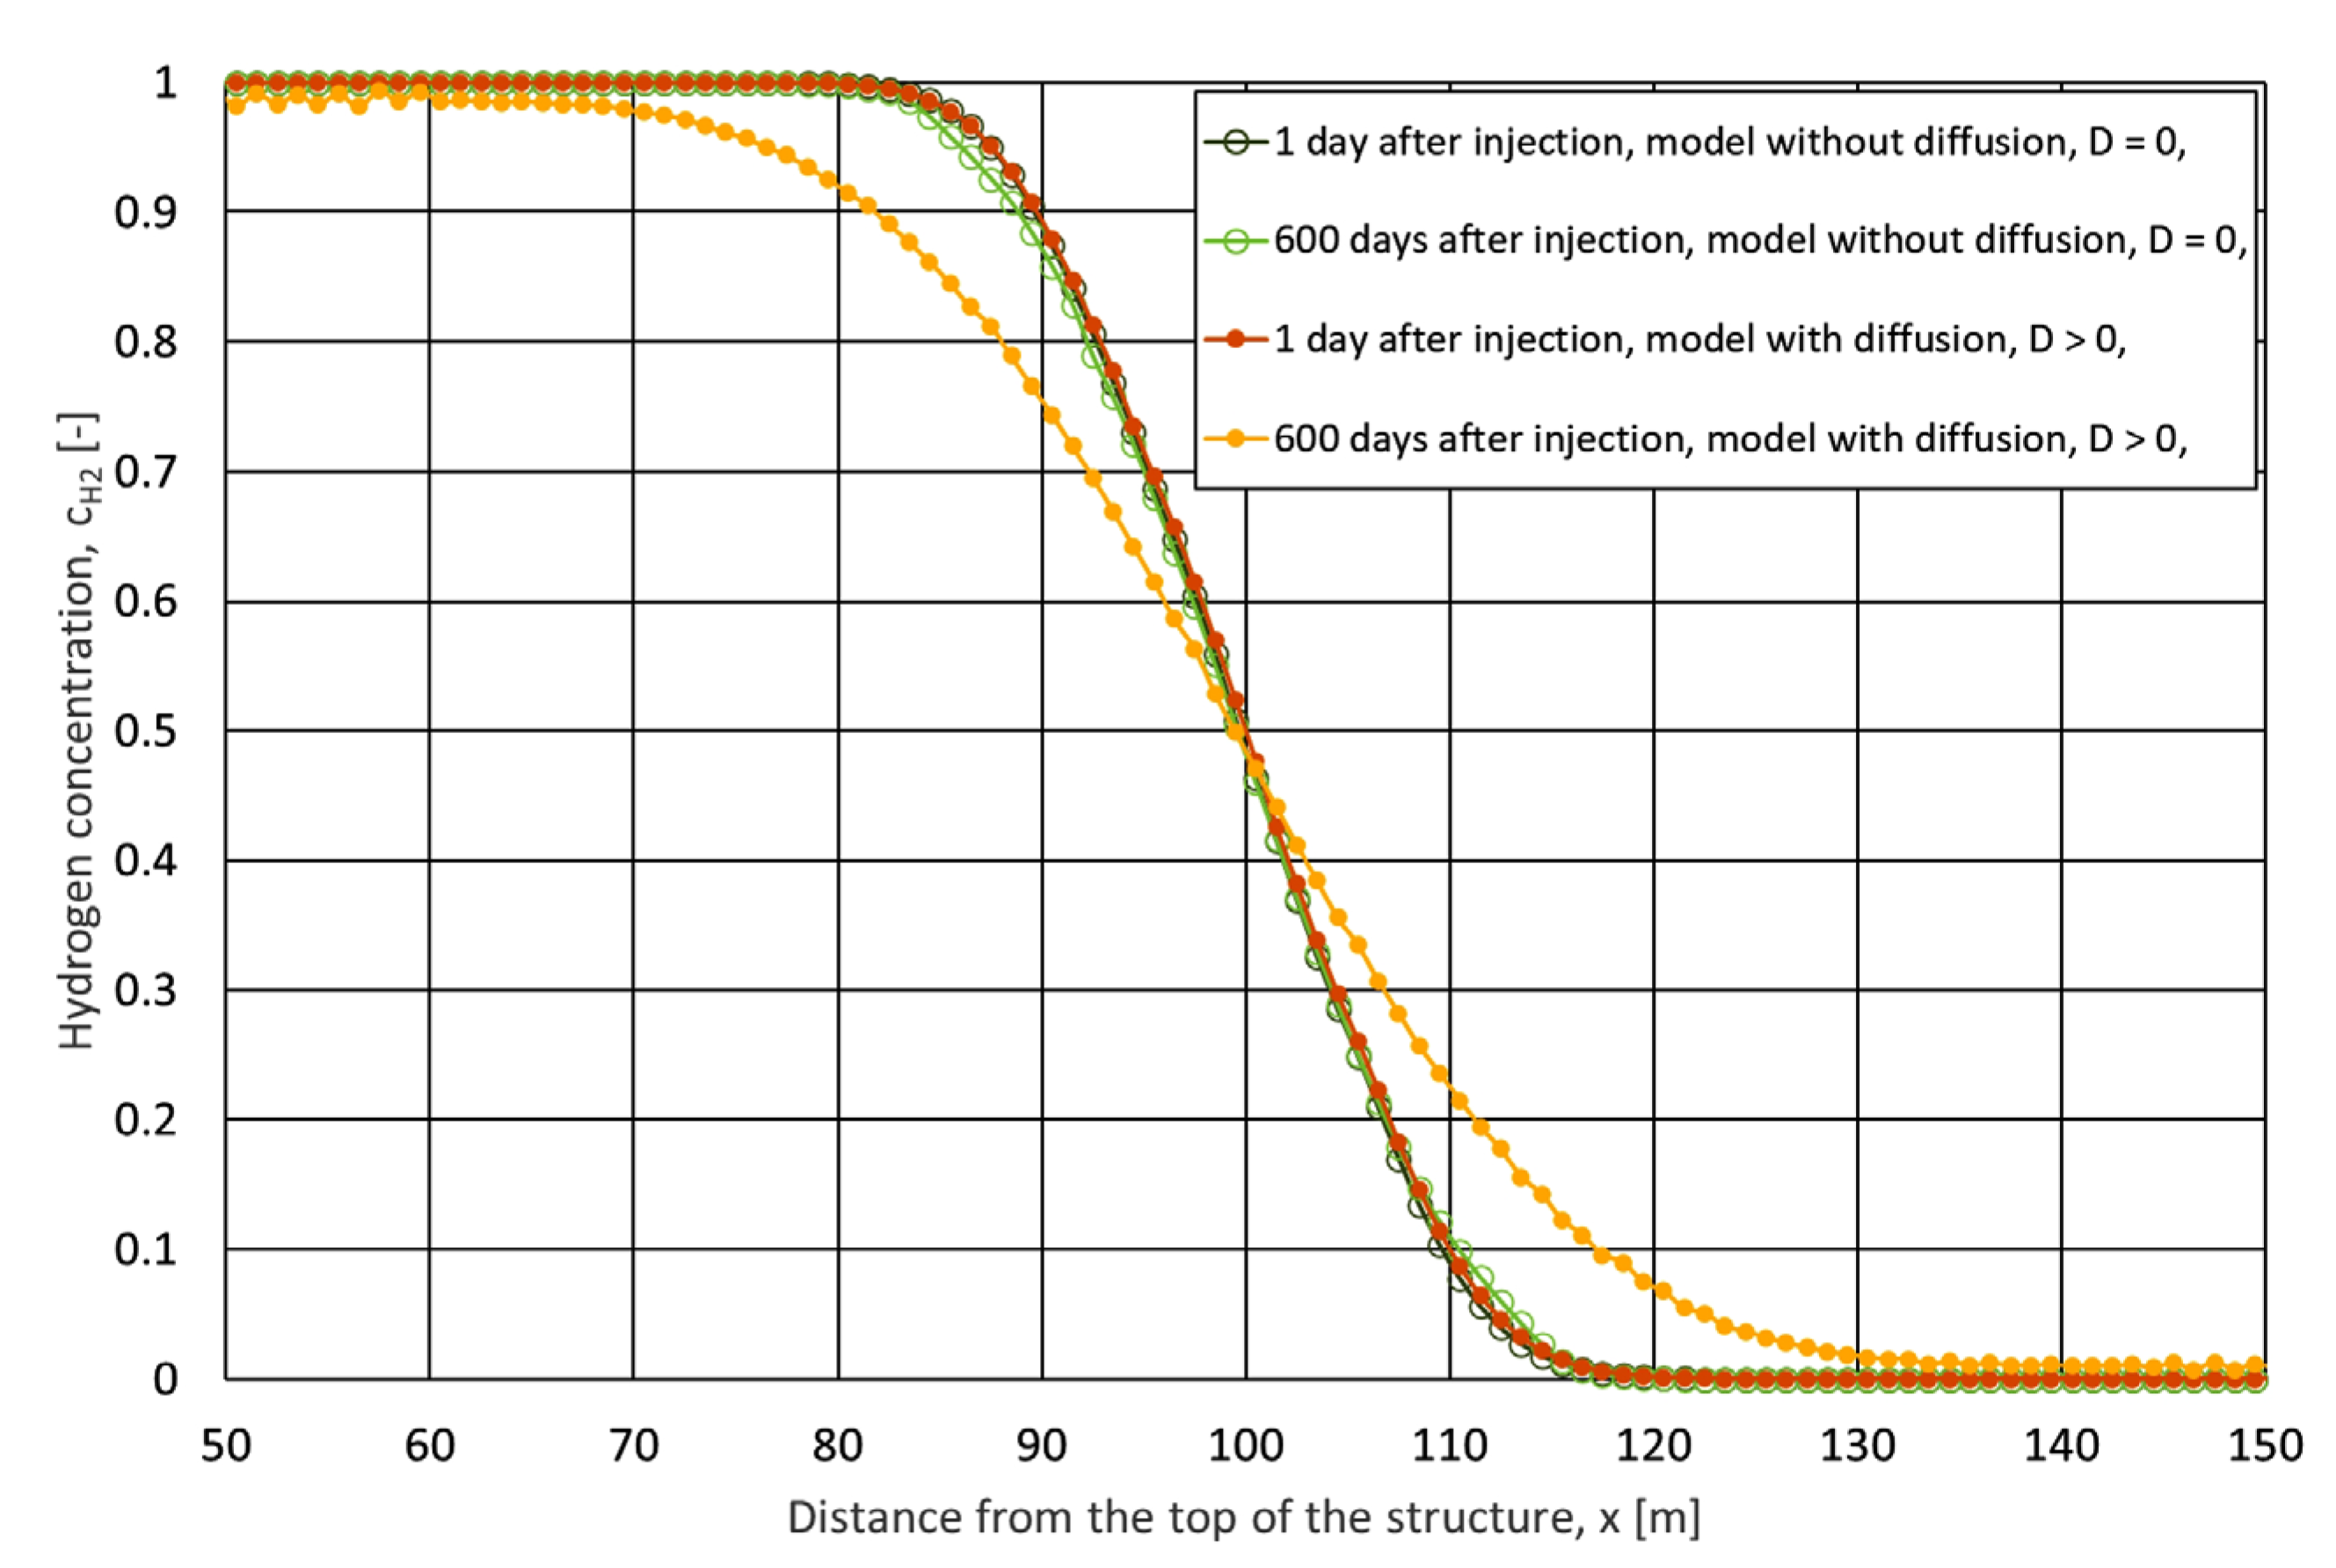
Since the dominant phenomenon determining the blurring of the front during the flow (injection of H2 into the UHS) is physical dispersion, simulation models were prepared to show the effect of diffusion on the blurring of this front, in which the course of operation of the cavern consisted of an injection phase lasting until the H2 front moved to the middle of the cavern height, followed by the so-called stand-up for about 600 days.
For the results of simulations of models differing in diffusion, the H2 concentration profile during stand-up after injection was analysed for selected time steps (Figure 11).
The above analysis confirmed the small effect of diffusion on the simulation results during flows caused by pressure changes in UHS, with its high significance for gas mixing during the so-called stand-ups (no flows caused by the pressure gradient). The analysis of the concentration course for the non-diffusion model additionally showed the lack of significant influence of phenomena related to gravitational segregation on selected gas components. However, in some cases diffusion can play a decisive role, as demonstrated by Miłek, Szott, and Gołąbek [57], who indicated that CH4 displacement by injection of acid gas into water influenced the composition of the withdrawn gas.

3. Results

3.1. Assumptions of Storage Operation

To present the effects of mixing of selected gases on the purity of H2 received from the salt cavern, simulation forecasts were prepared consisting of the so-called precycle, i.e., the preparation of UHS by collecting previously stored CH4, and nine subsequent cycles of H2 injection and withdrawal.
Other basic assumptions of storage operation are as follows:
Composition of the injected gas, cH2 = 100%,
Injection and production (withdrawn) well providing access to the cavern top (Figure 5),
Two phases of H2 injection per year, i.e., 1.01–14.02, 1.07–14.08,
Two phases of H2 withdrawal per year, i.e., 15.03–14.05, 15.09–14.11,
Stand-ups between the above-mentioned phases,
H2 injection rate, qg,inj = 500,000 Nm3/d,
H2 withdrawal rate, qg,prod = 600,000 Nm3/d,
Initial pressure in UHS, Pini = 140 bar,
Storage temperature, Tres = 57 °C,
Maximum bottom pressure in the pumping phase, Pbhp,inj,max = 160 bar,
Minimum bottom pressure in the gas withdrawal phase, Pbhp,prod,min = 40 bar.
It should be emphasized that the applied rates correspond to a single Polish cavern case. UGS facilities, however, often consist of multiple caverns, or in some cases, very large individual caverns. This explains why the Western European literature frequently reports much higher injection and withdrawal capacities, in the range of several million Nm3/d (where Nm3 denotes gas volume at normal conditions: 0 °C, 1.01325 bar) at the facility scale [35]. The values used in this study are, therefore, consistent with domestic cavern-scale operation.

3.2. Results of Simulation Forecasts

The dispersion–diffusion coefficient utilized in the simulations represents the combined effects of numerical dispersion, which models physical dispersion (Section 2.6), and molecular diffusion (Section 2.7). This approach ensures that the results take into account both mixing mechanisms that are relevant to H2-CH4 interactions in the cavern model.
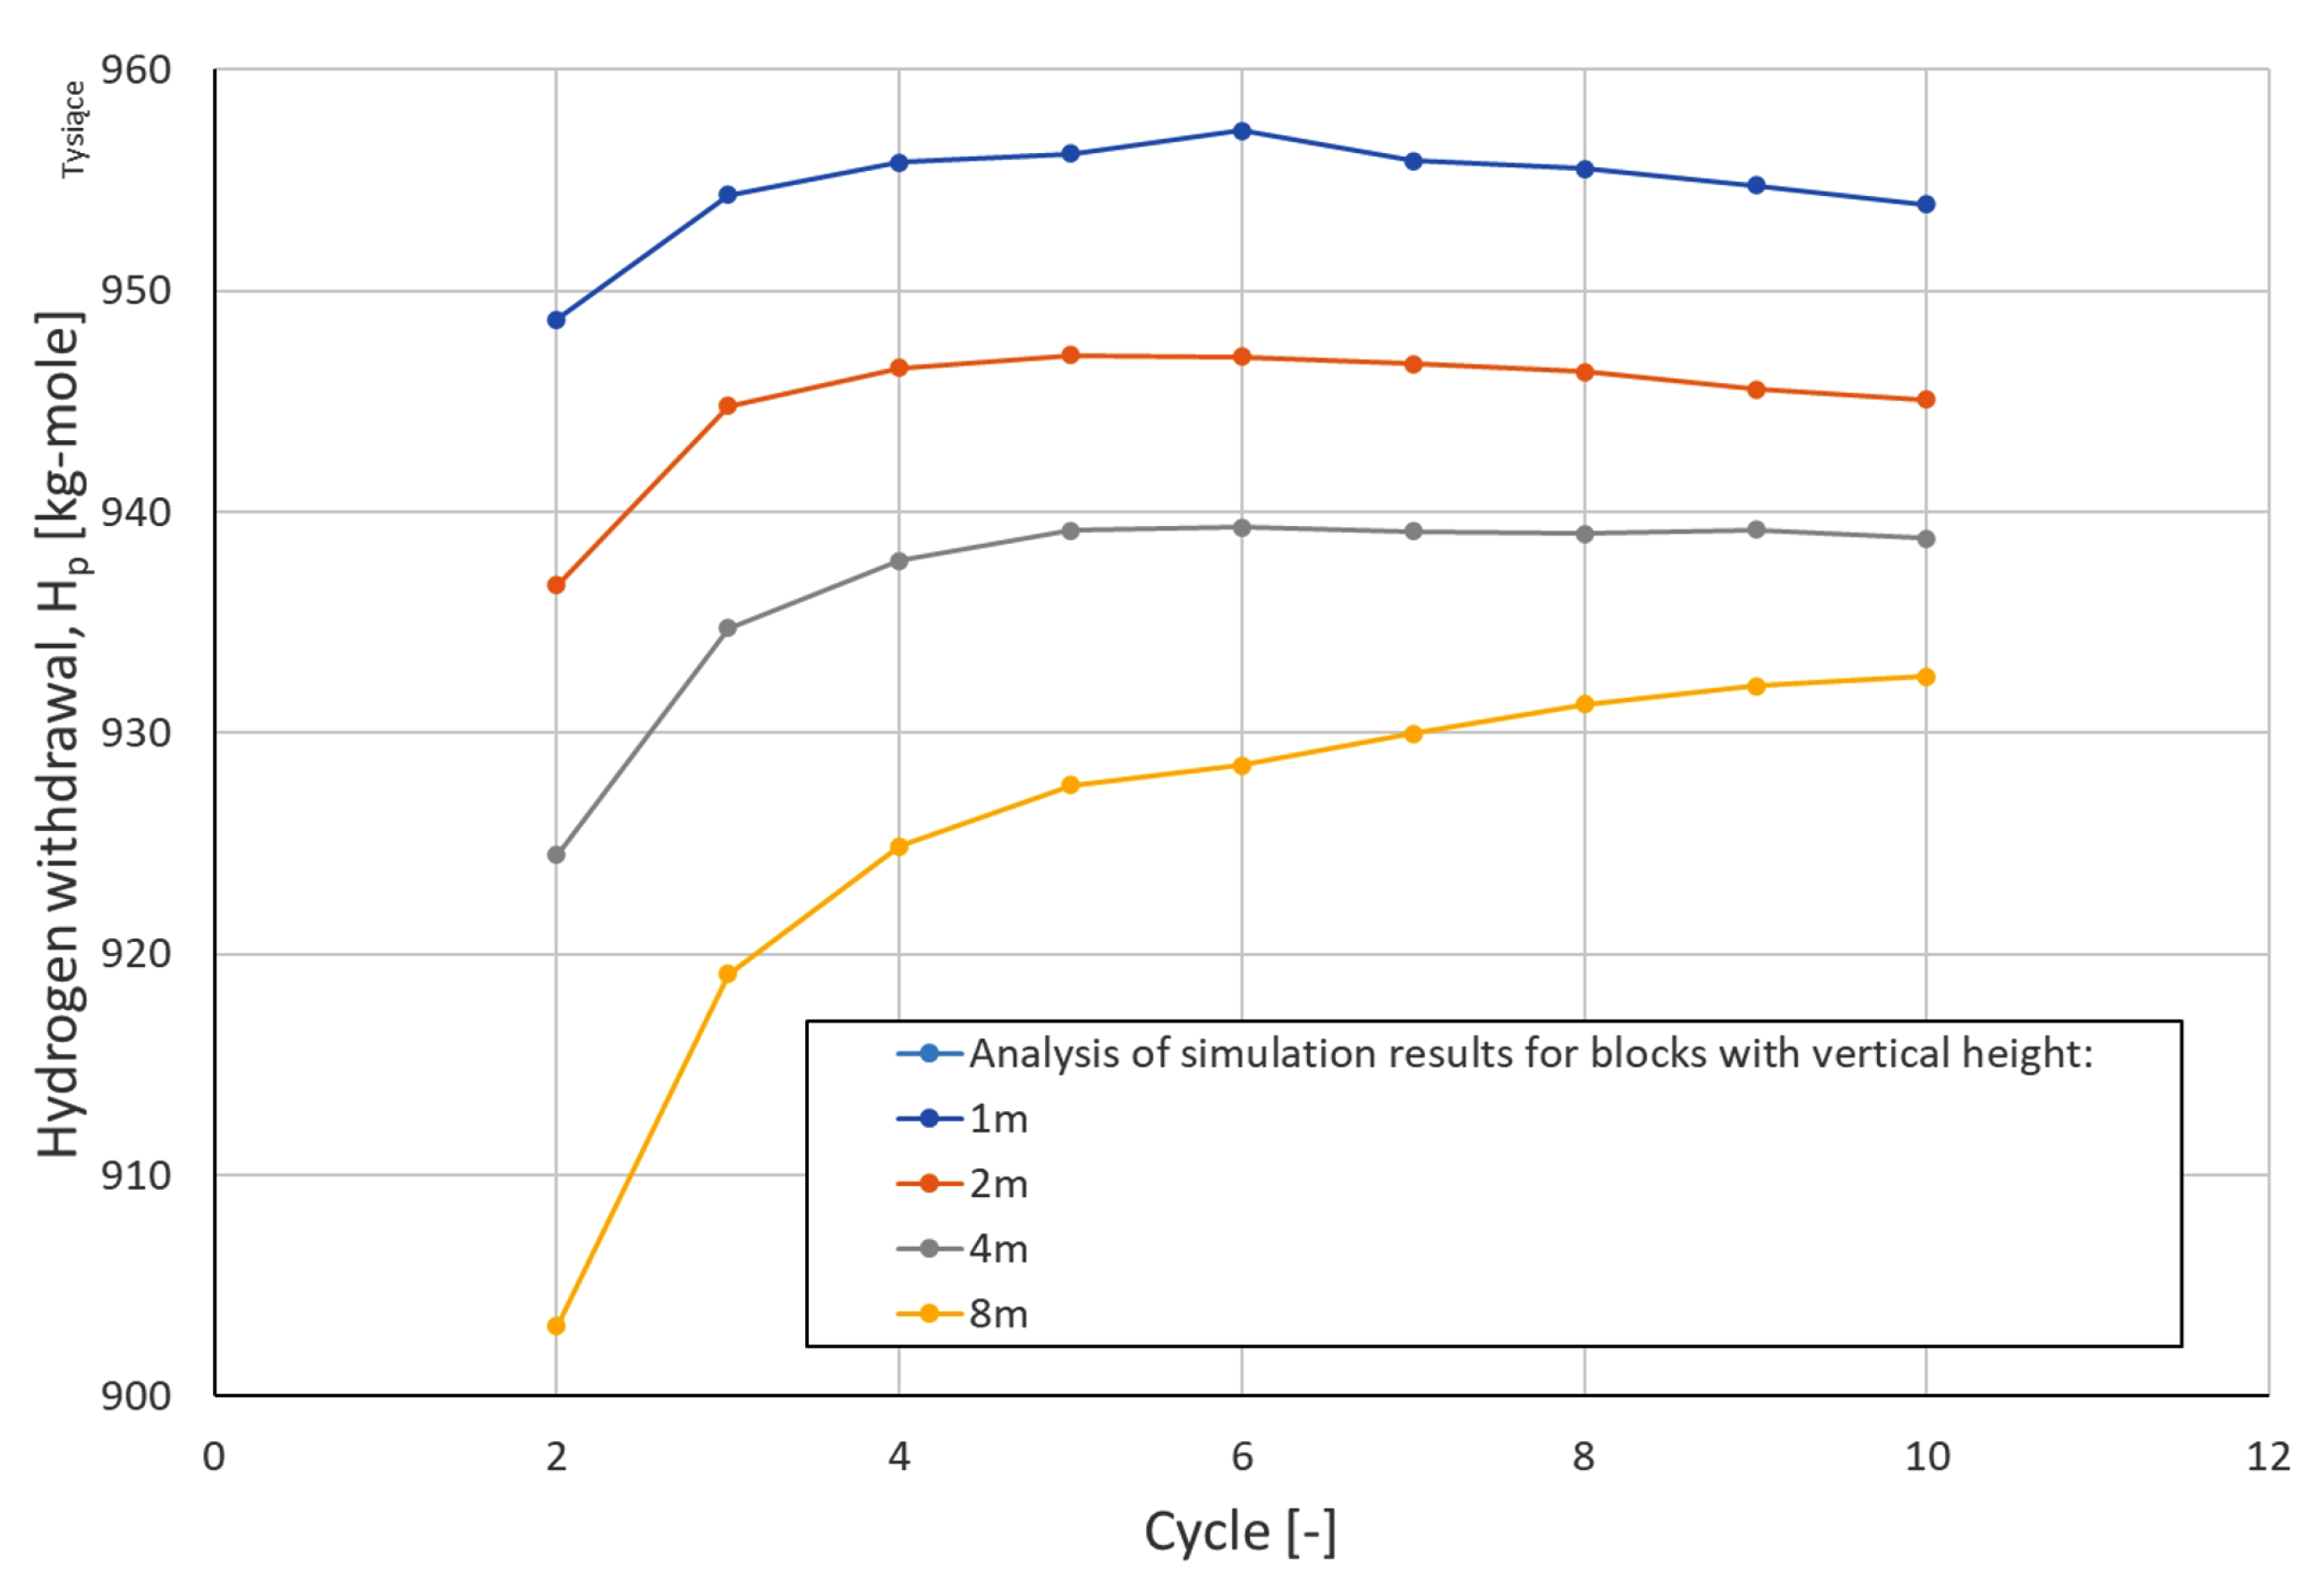
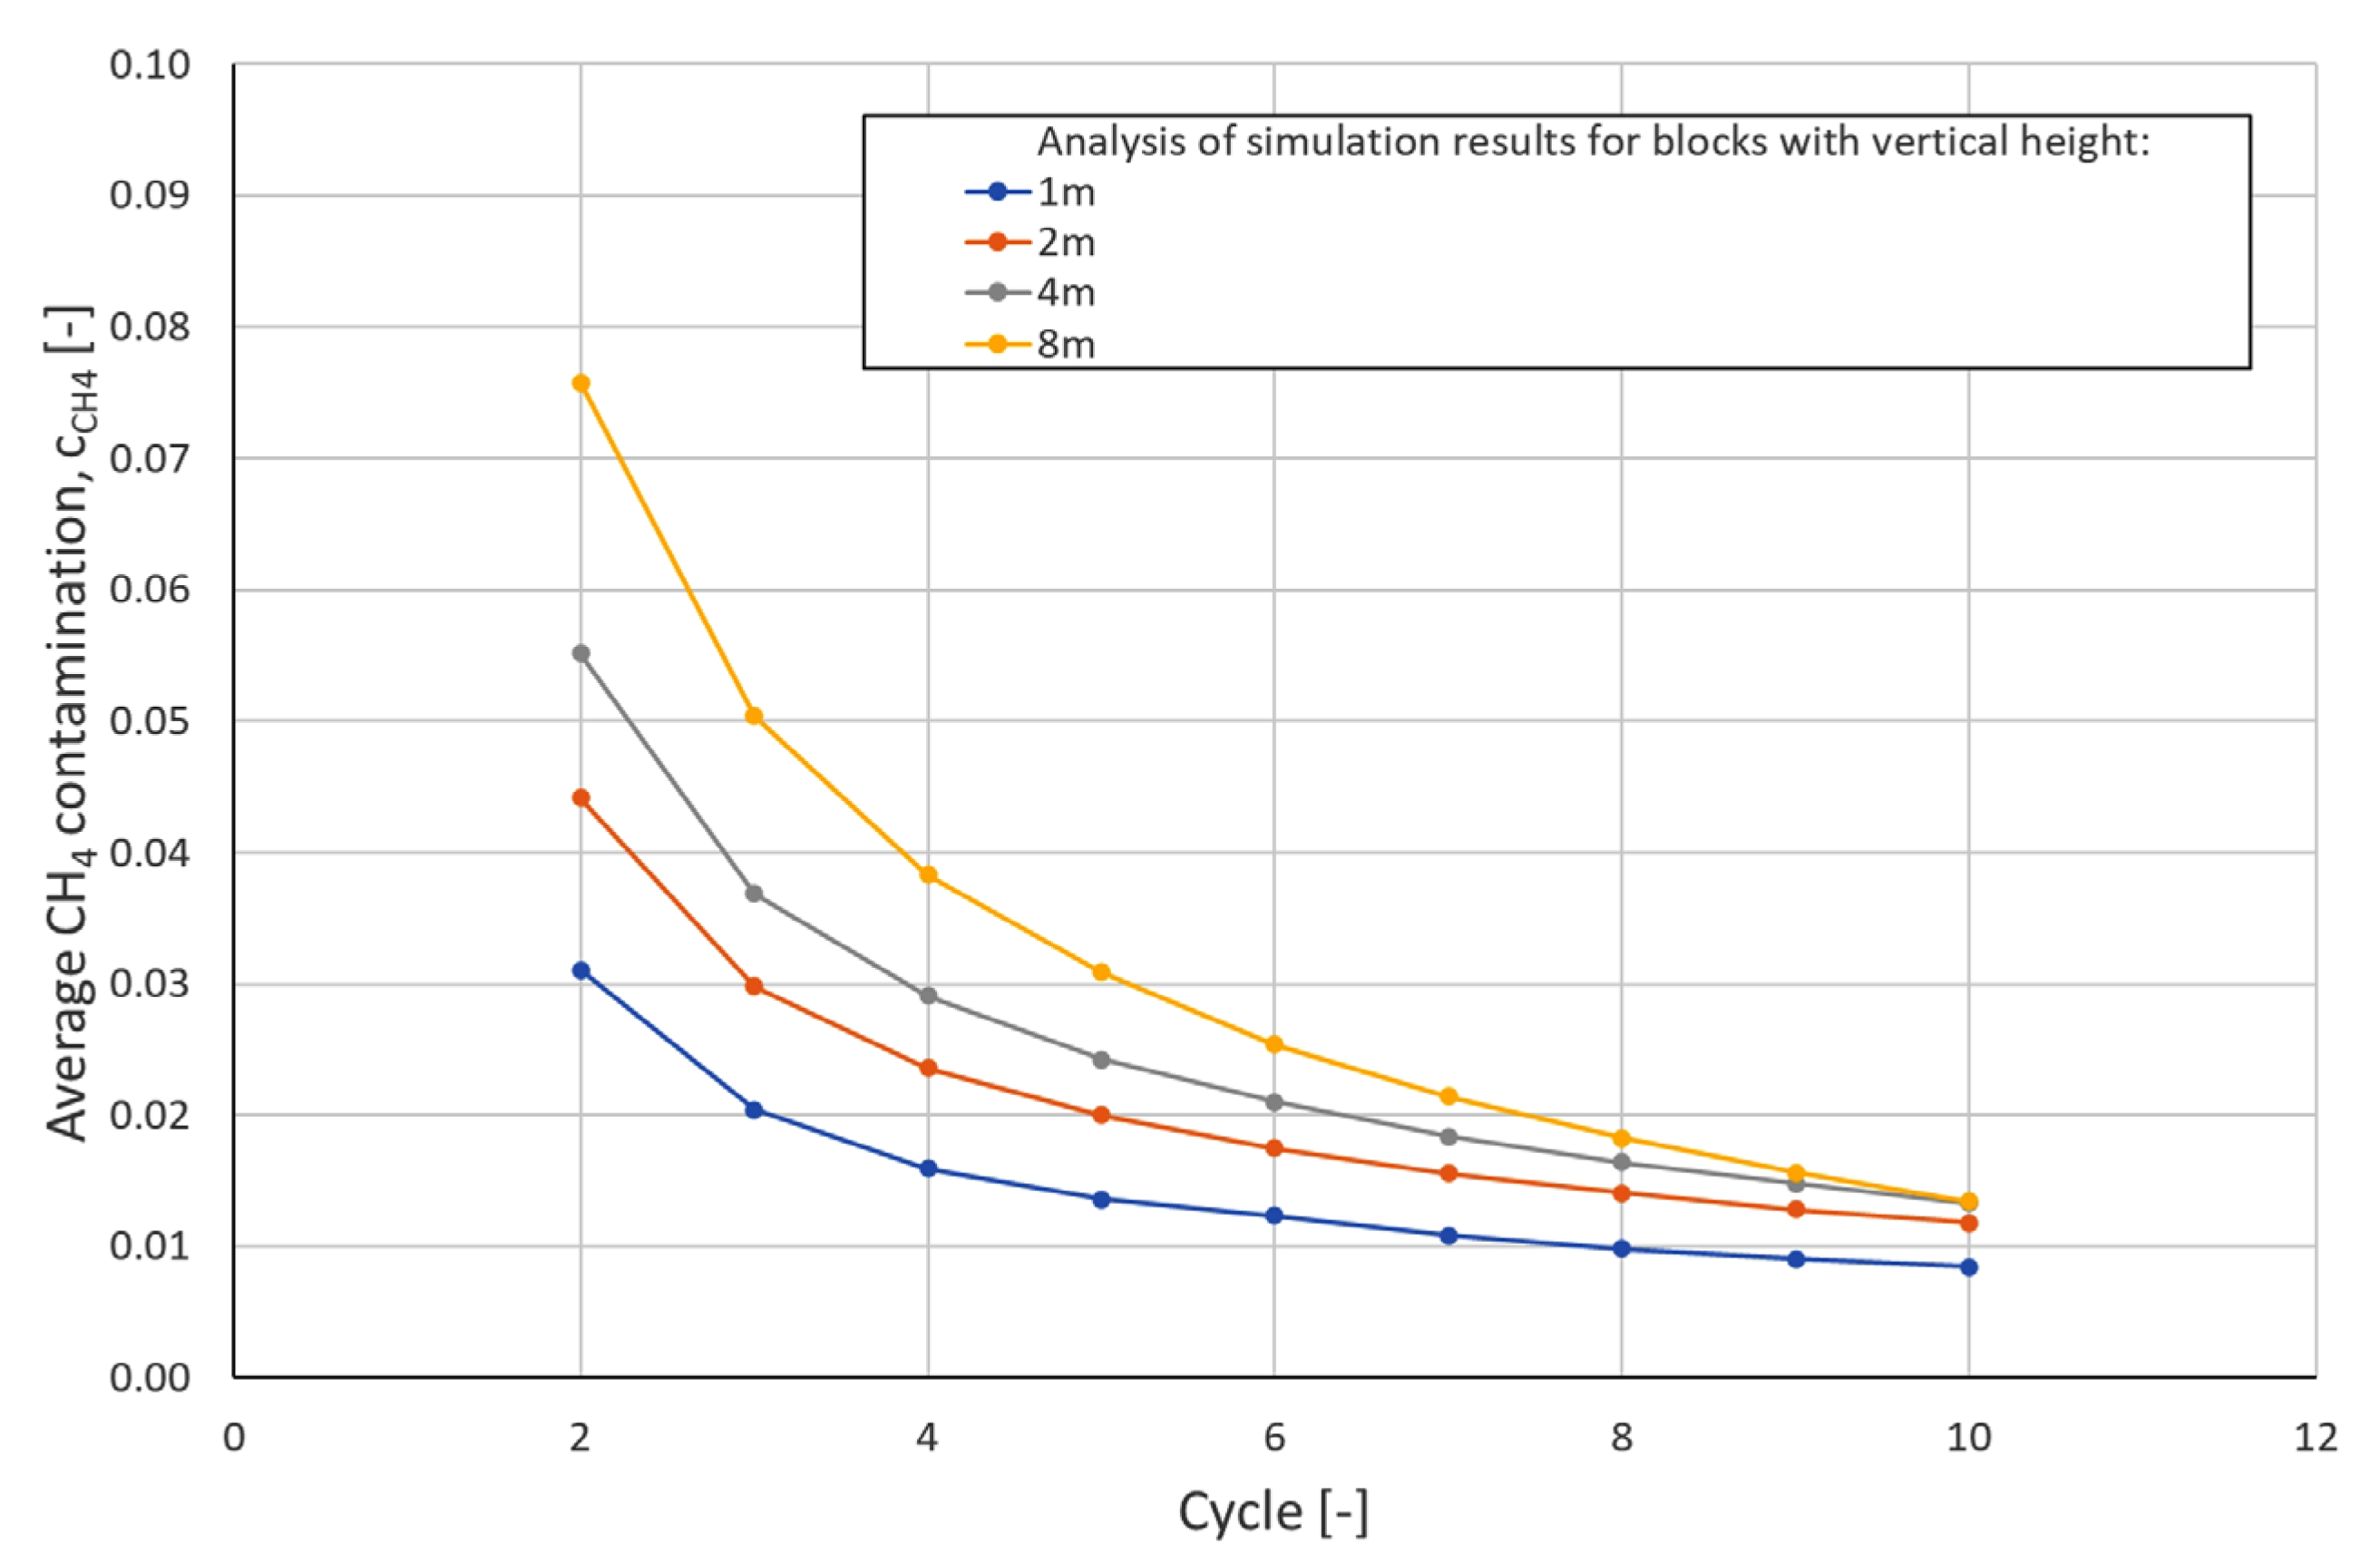
Based on the above assumptions, multivariate simulation forecasts were made for models differing in terms of the dispersion–diffusion coefficient and the predetermined molecular diffusion coefficient (Ddiff(P = 160 bar, T = 57 °C) = 0.11). Figure 12 illustrates that greater numerical dispersion (higher block of simulation grid) leads to stronger front blurring of the H2 and, consequently, to more intensive mixing with the CH4. As a result of greater numerical dispersion, the amount of H2 withdrawn in each subsequent cycle decreases and the CH4 contamination of the withdrawn gas increases (Figure 13).
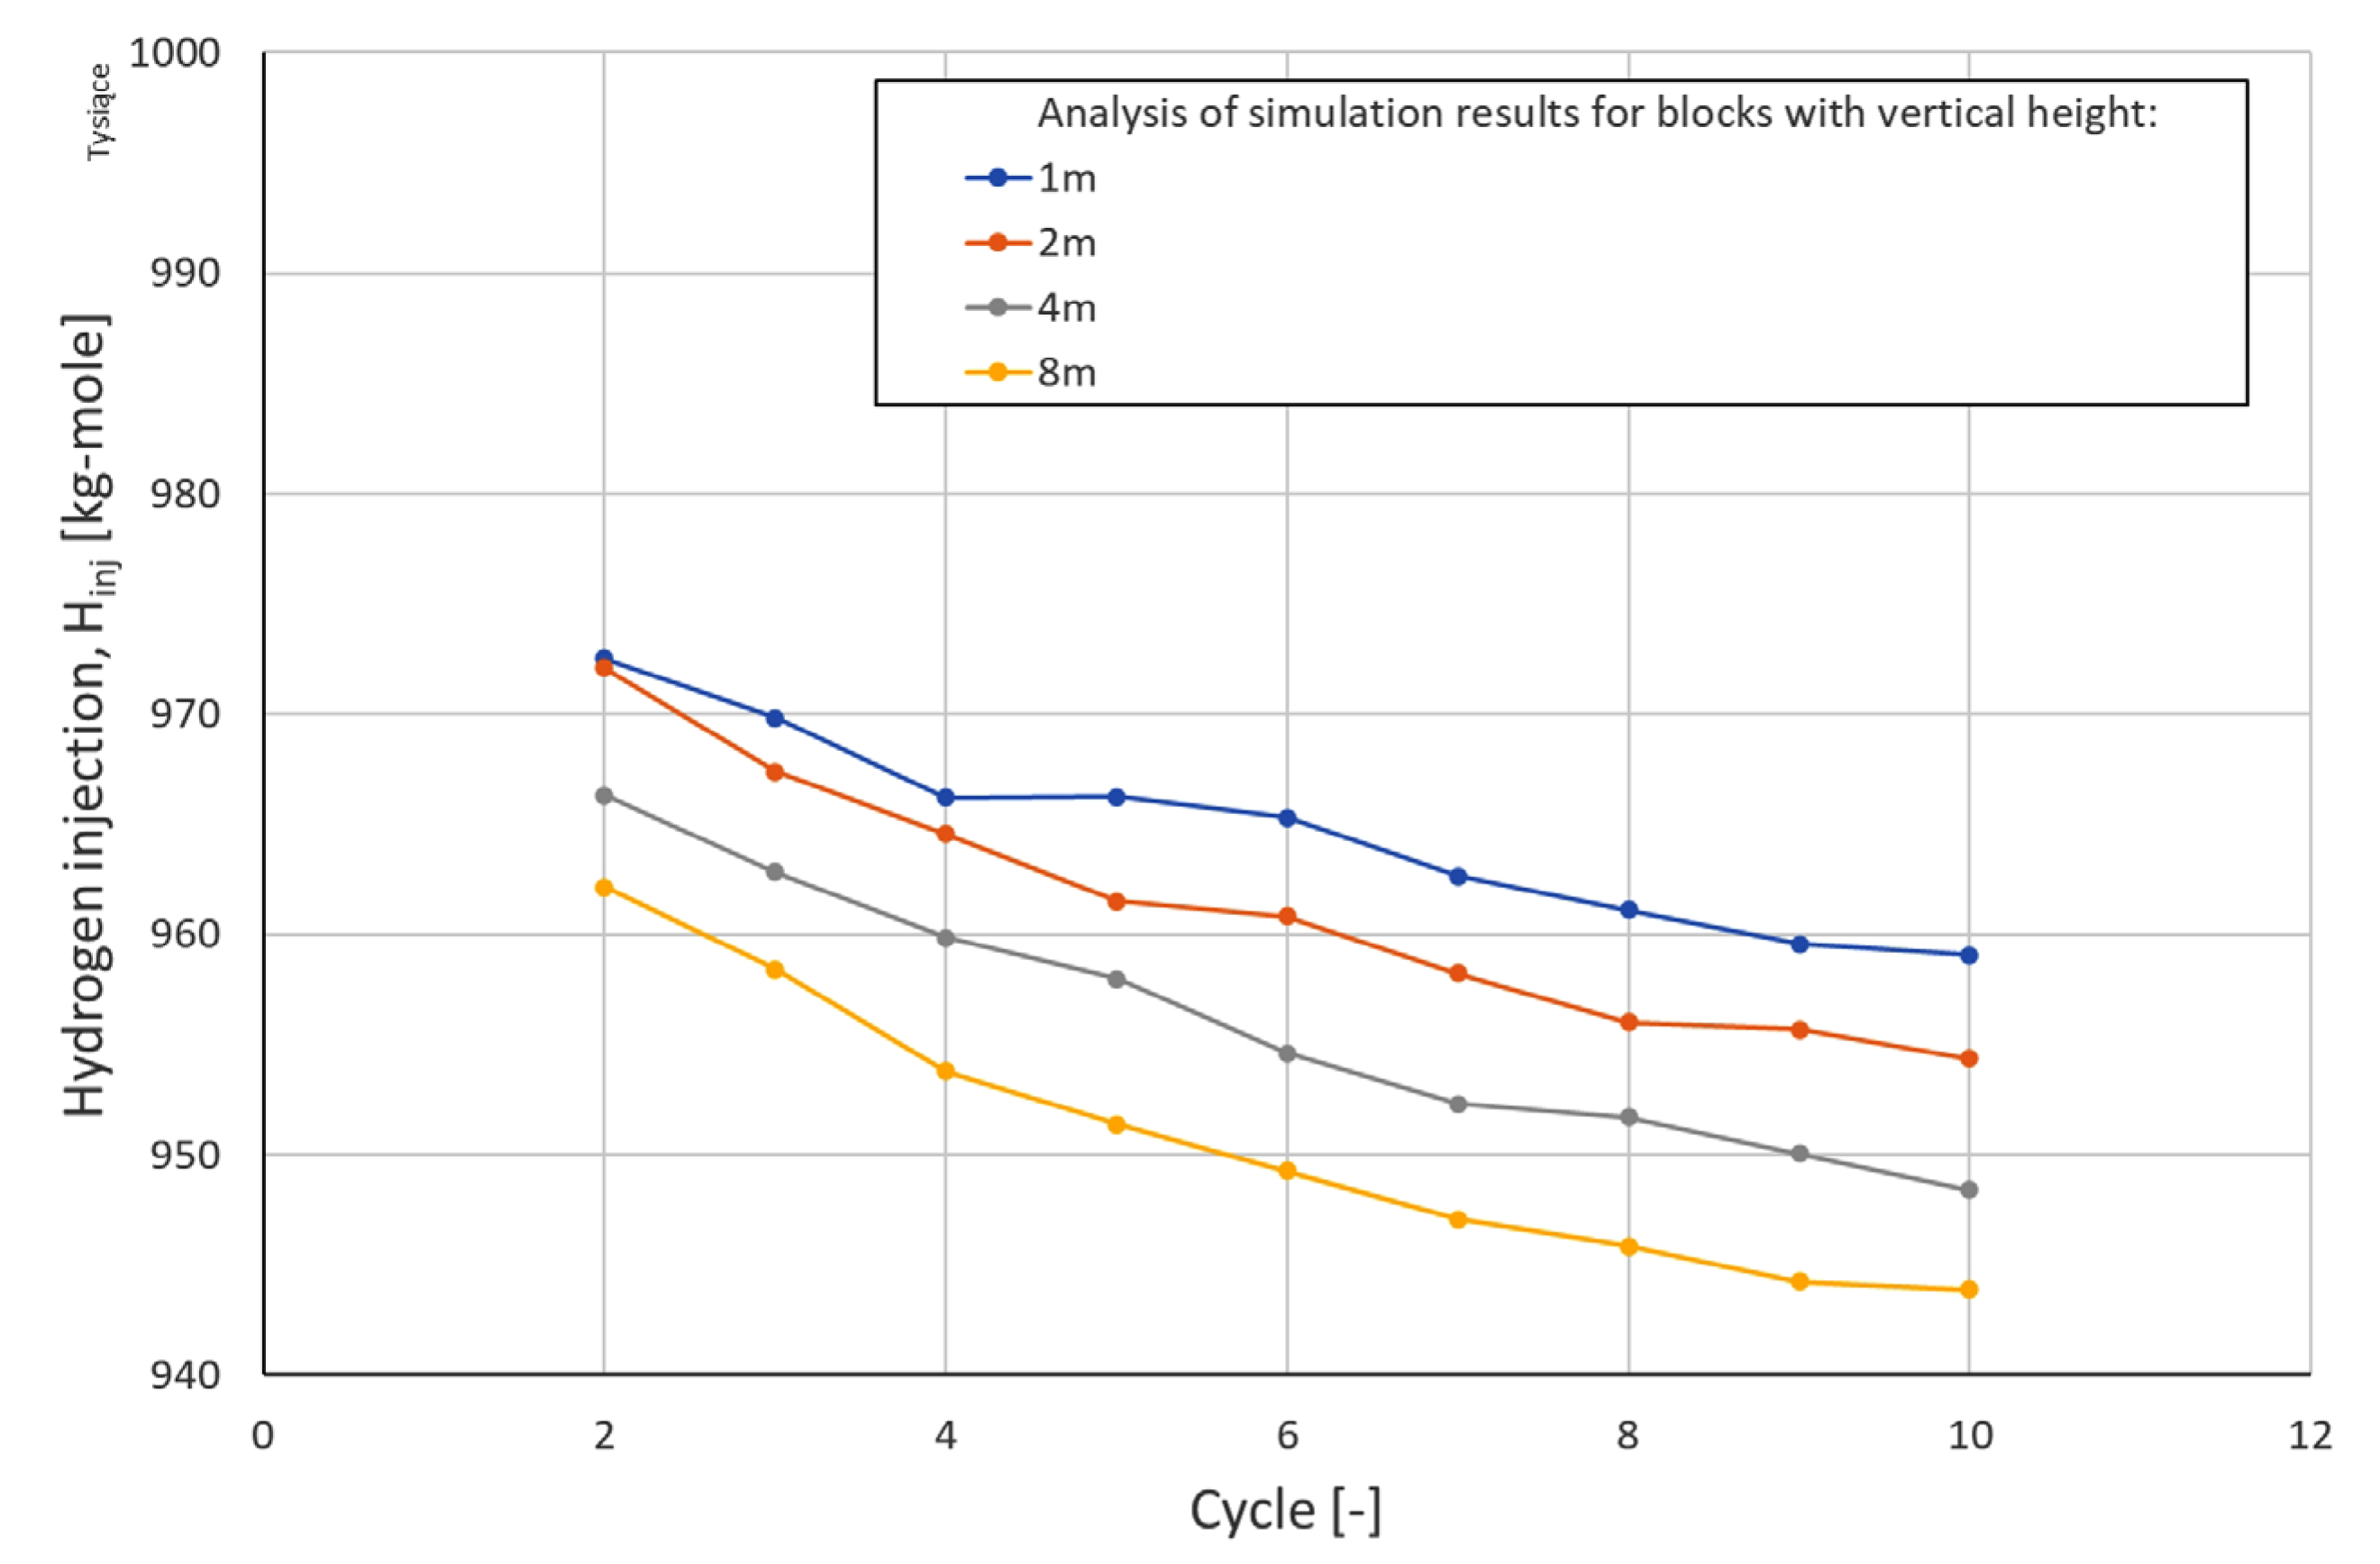
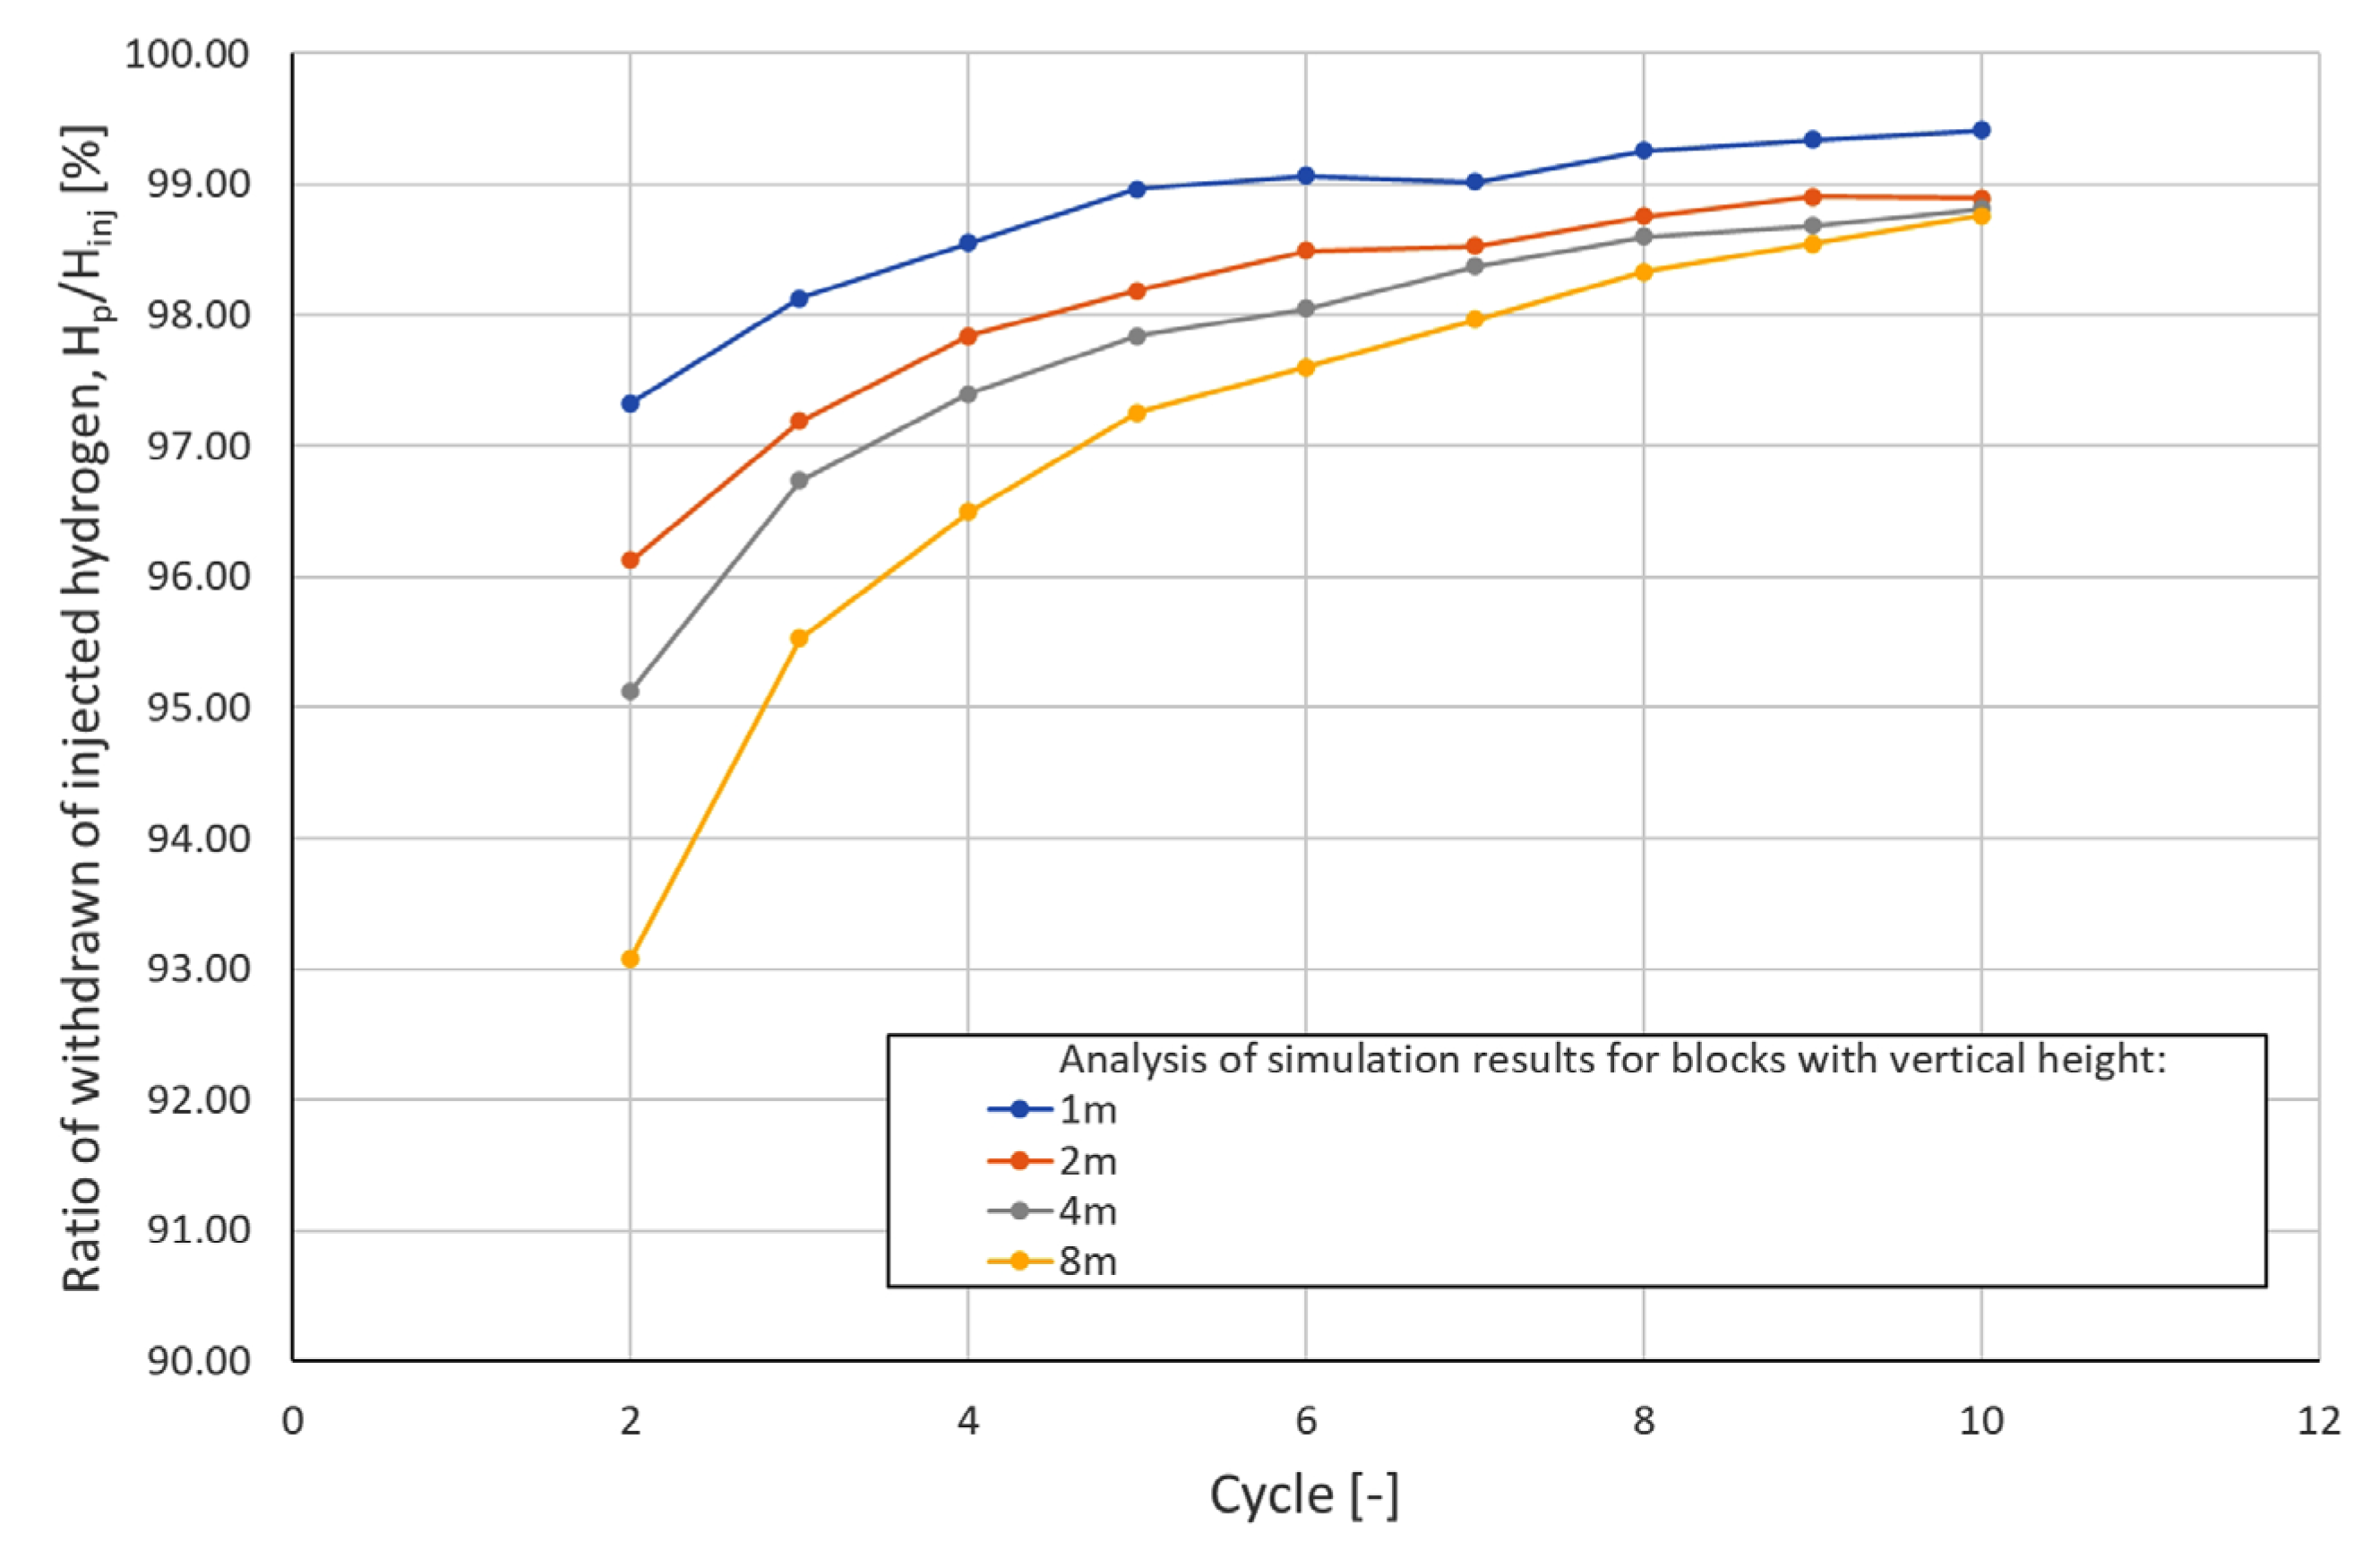
As a result of the lower amount of H2 that was withdrawn and, thus, the larger amount of H2 remaining in the cavern, the amount of H2 injected decreased in the subsequent cycles of each of the models (Figure 14). On the other hand, as a result of the decreasing amount of CH4 remaining in the UHS, the capacity to receive previously injected H2 gradually increased (Figure 15).
Detailed results are presented in Table 3, Table 4, Table 5 and Table 6, which present the amount of H2 withdrawn and injected in each cycle, the contamination of the received H2, and an indicator displaying the proportion of injected H2 in each cycle that was withdrawn in the next phase of its extraction.

3.3. Analysis of H2 Saturation Distributions

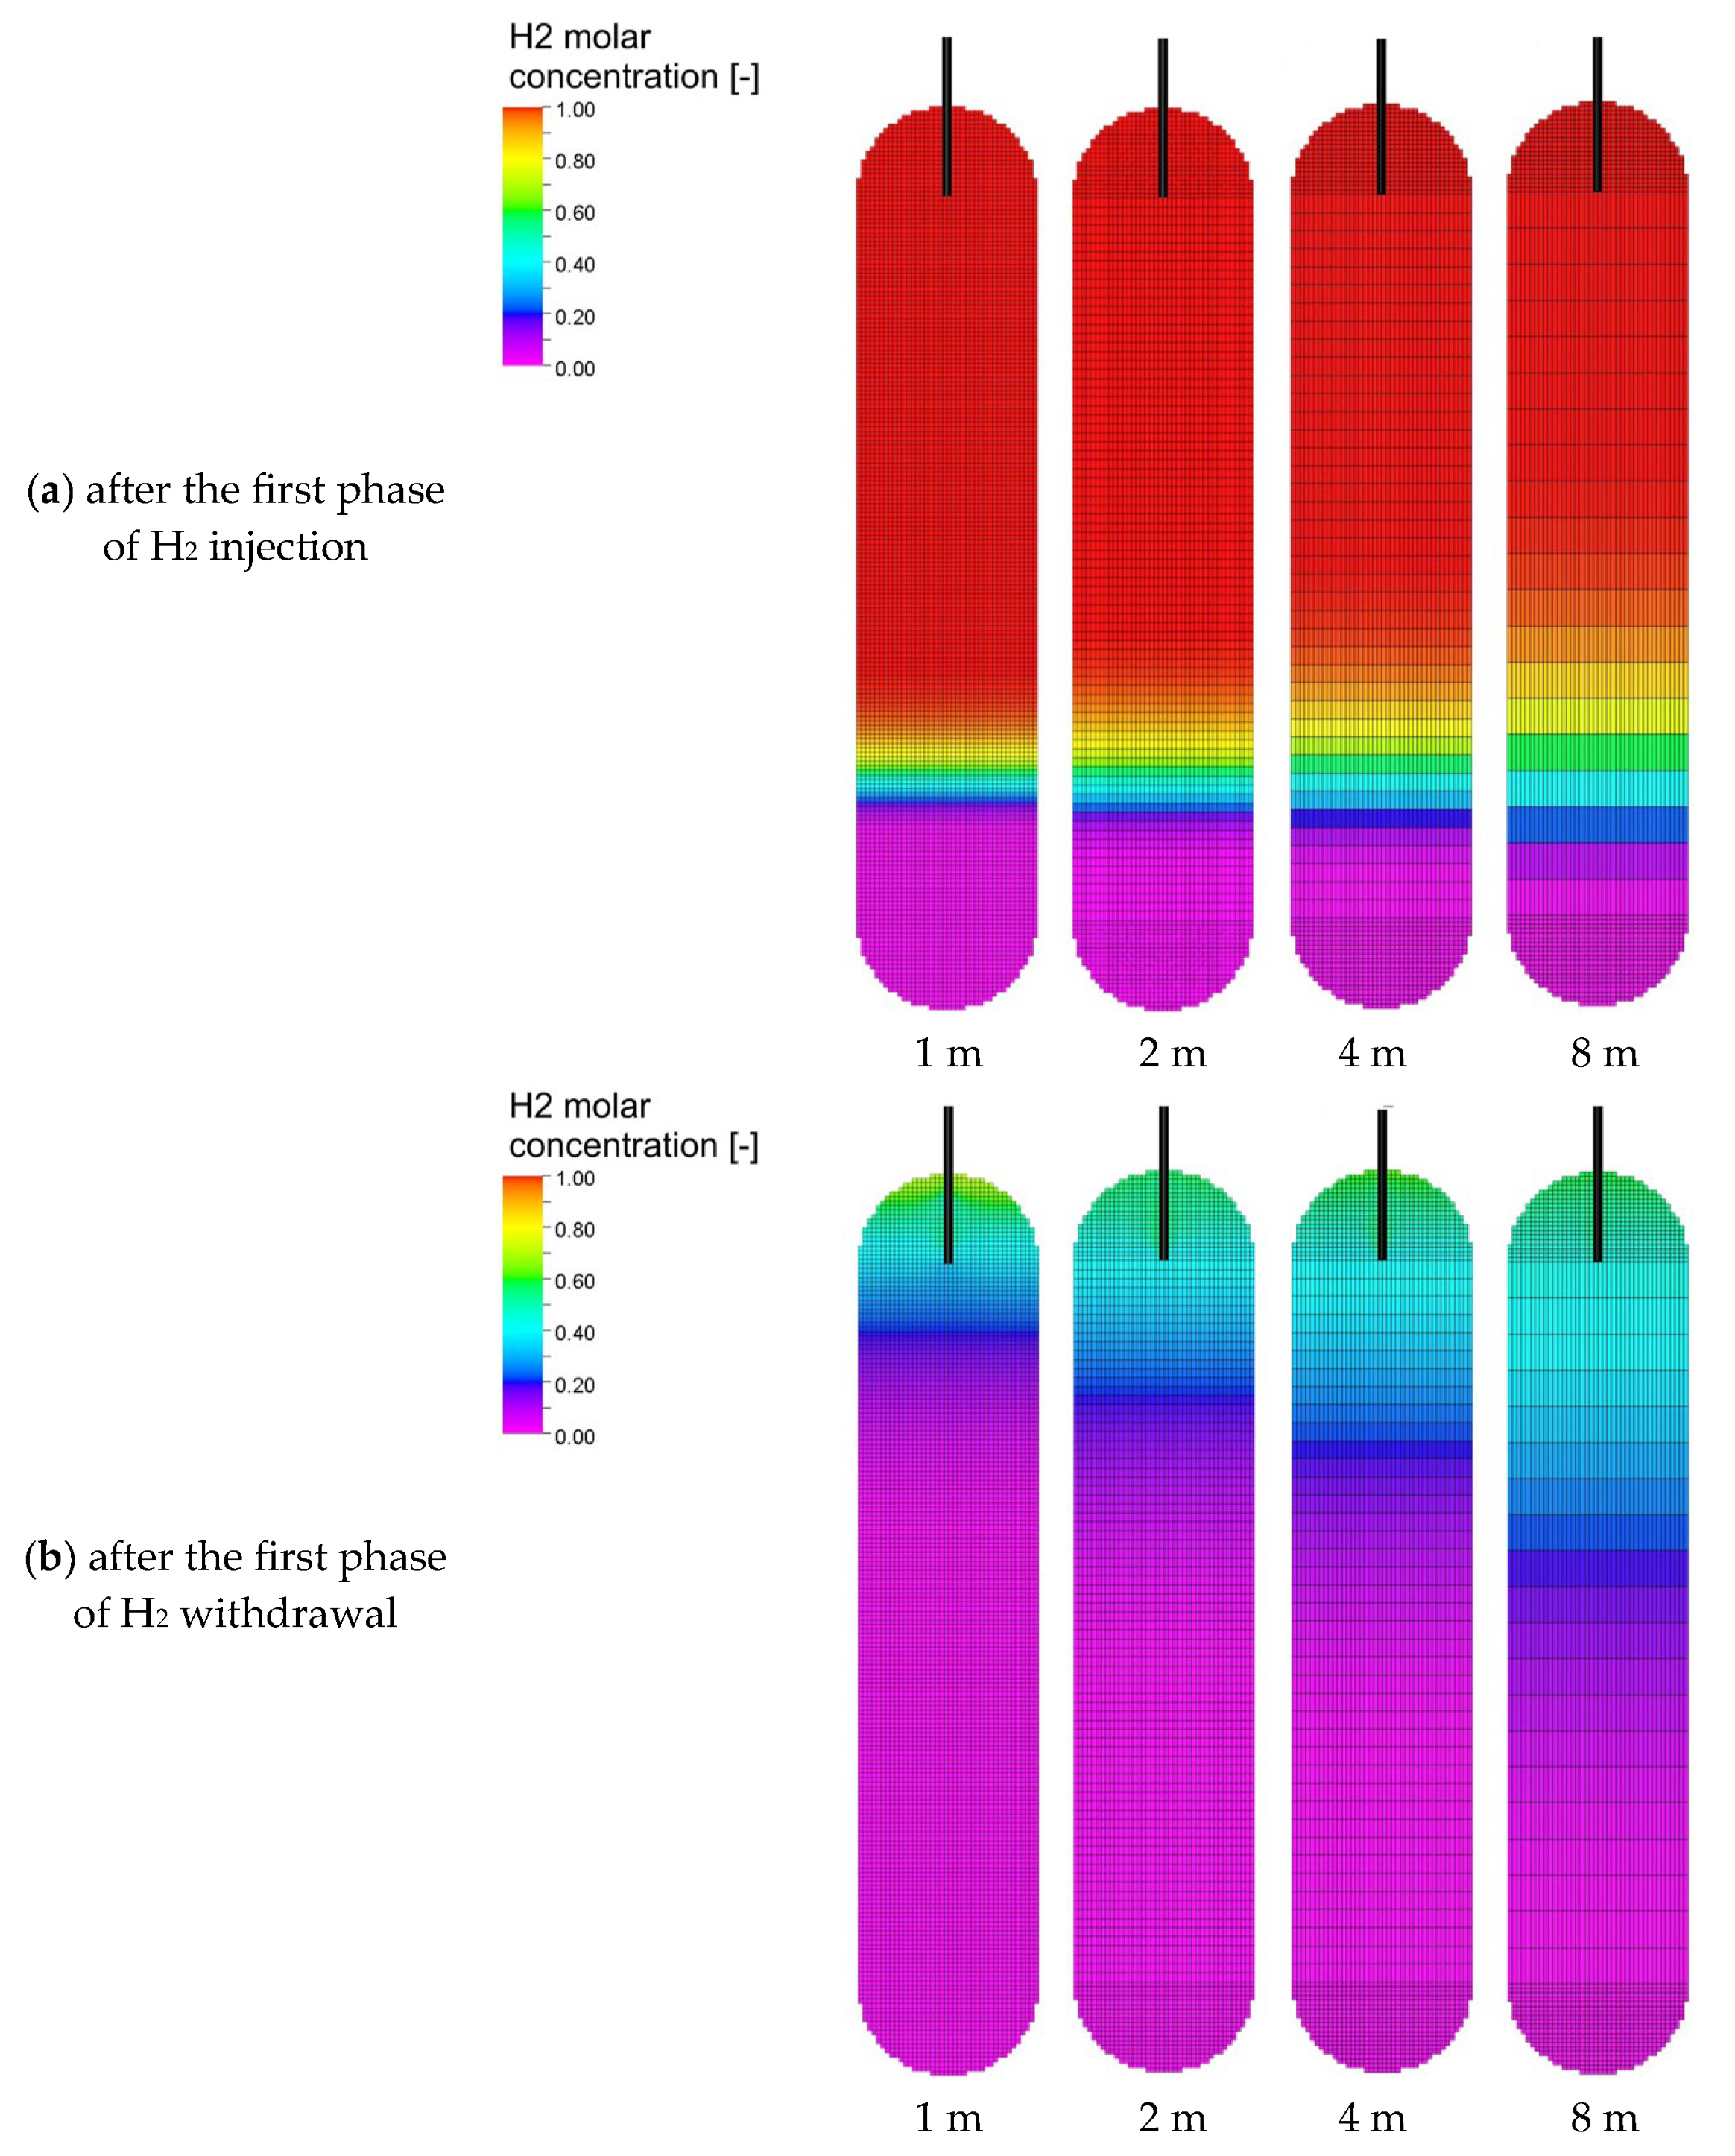
During the first injection phase, the injected H2 first fills the structure near the IP well, filling the top of the structure (Figure 16a). For models with smaller dispersion–diffusion coefficient values, the blurred front zone is relatively narrow, whereas a higher value of that coefficient results in a much wider blurred zone. During H2 withdrawal the H2 saturation zone decreases until the end of production, caused by a pressure drop in the production IP well (Pbhp,prod,min = 40 bar). As a result of gas mixing, some of the previously injected H2 remains in the UHS (Figure 16b), most of it in the model with the highest dispersion, which is also confirmed by the results in the form of high CH4 contamination of the withdrawn H2 (Figure 13).
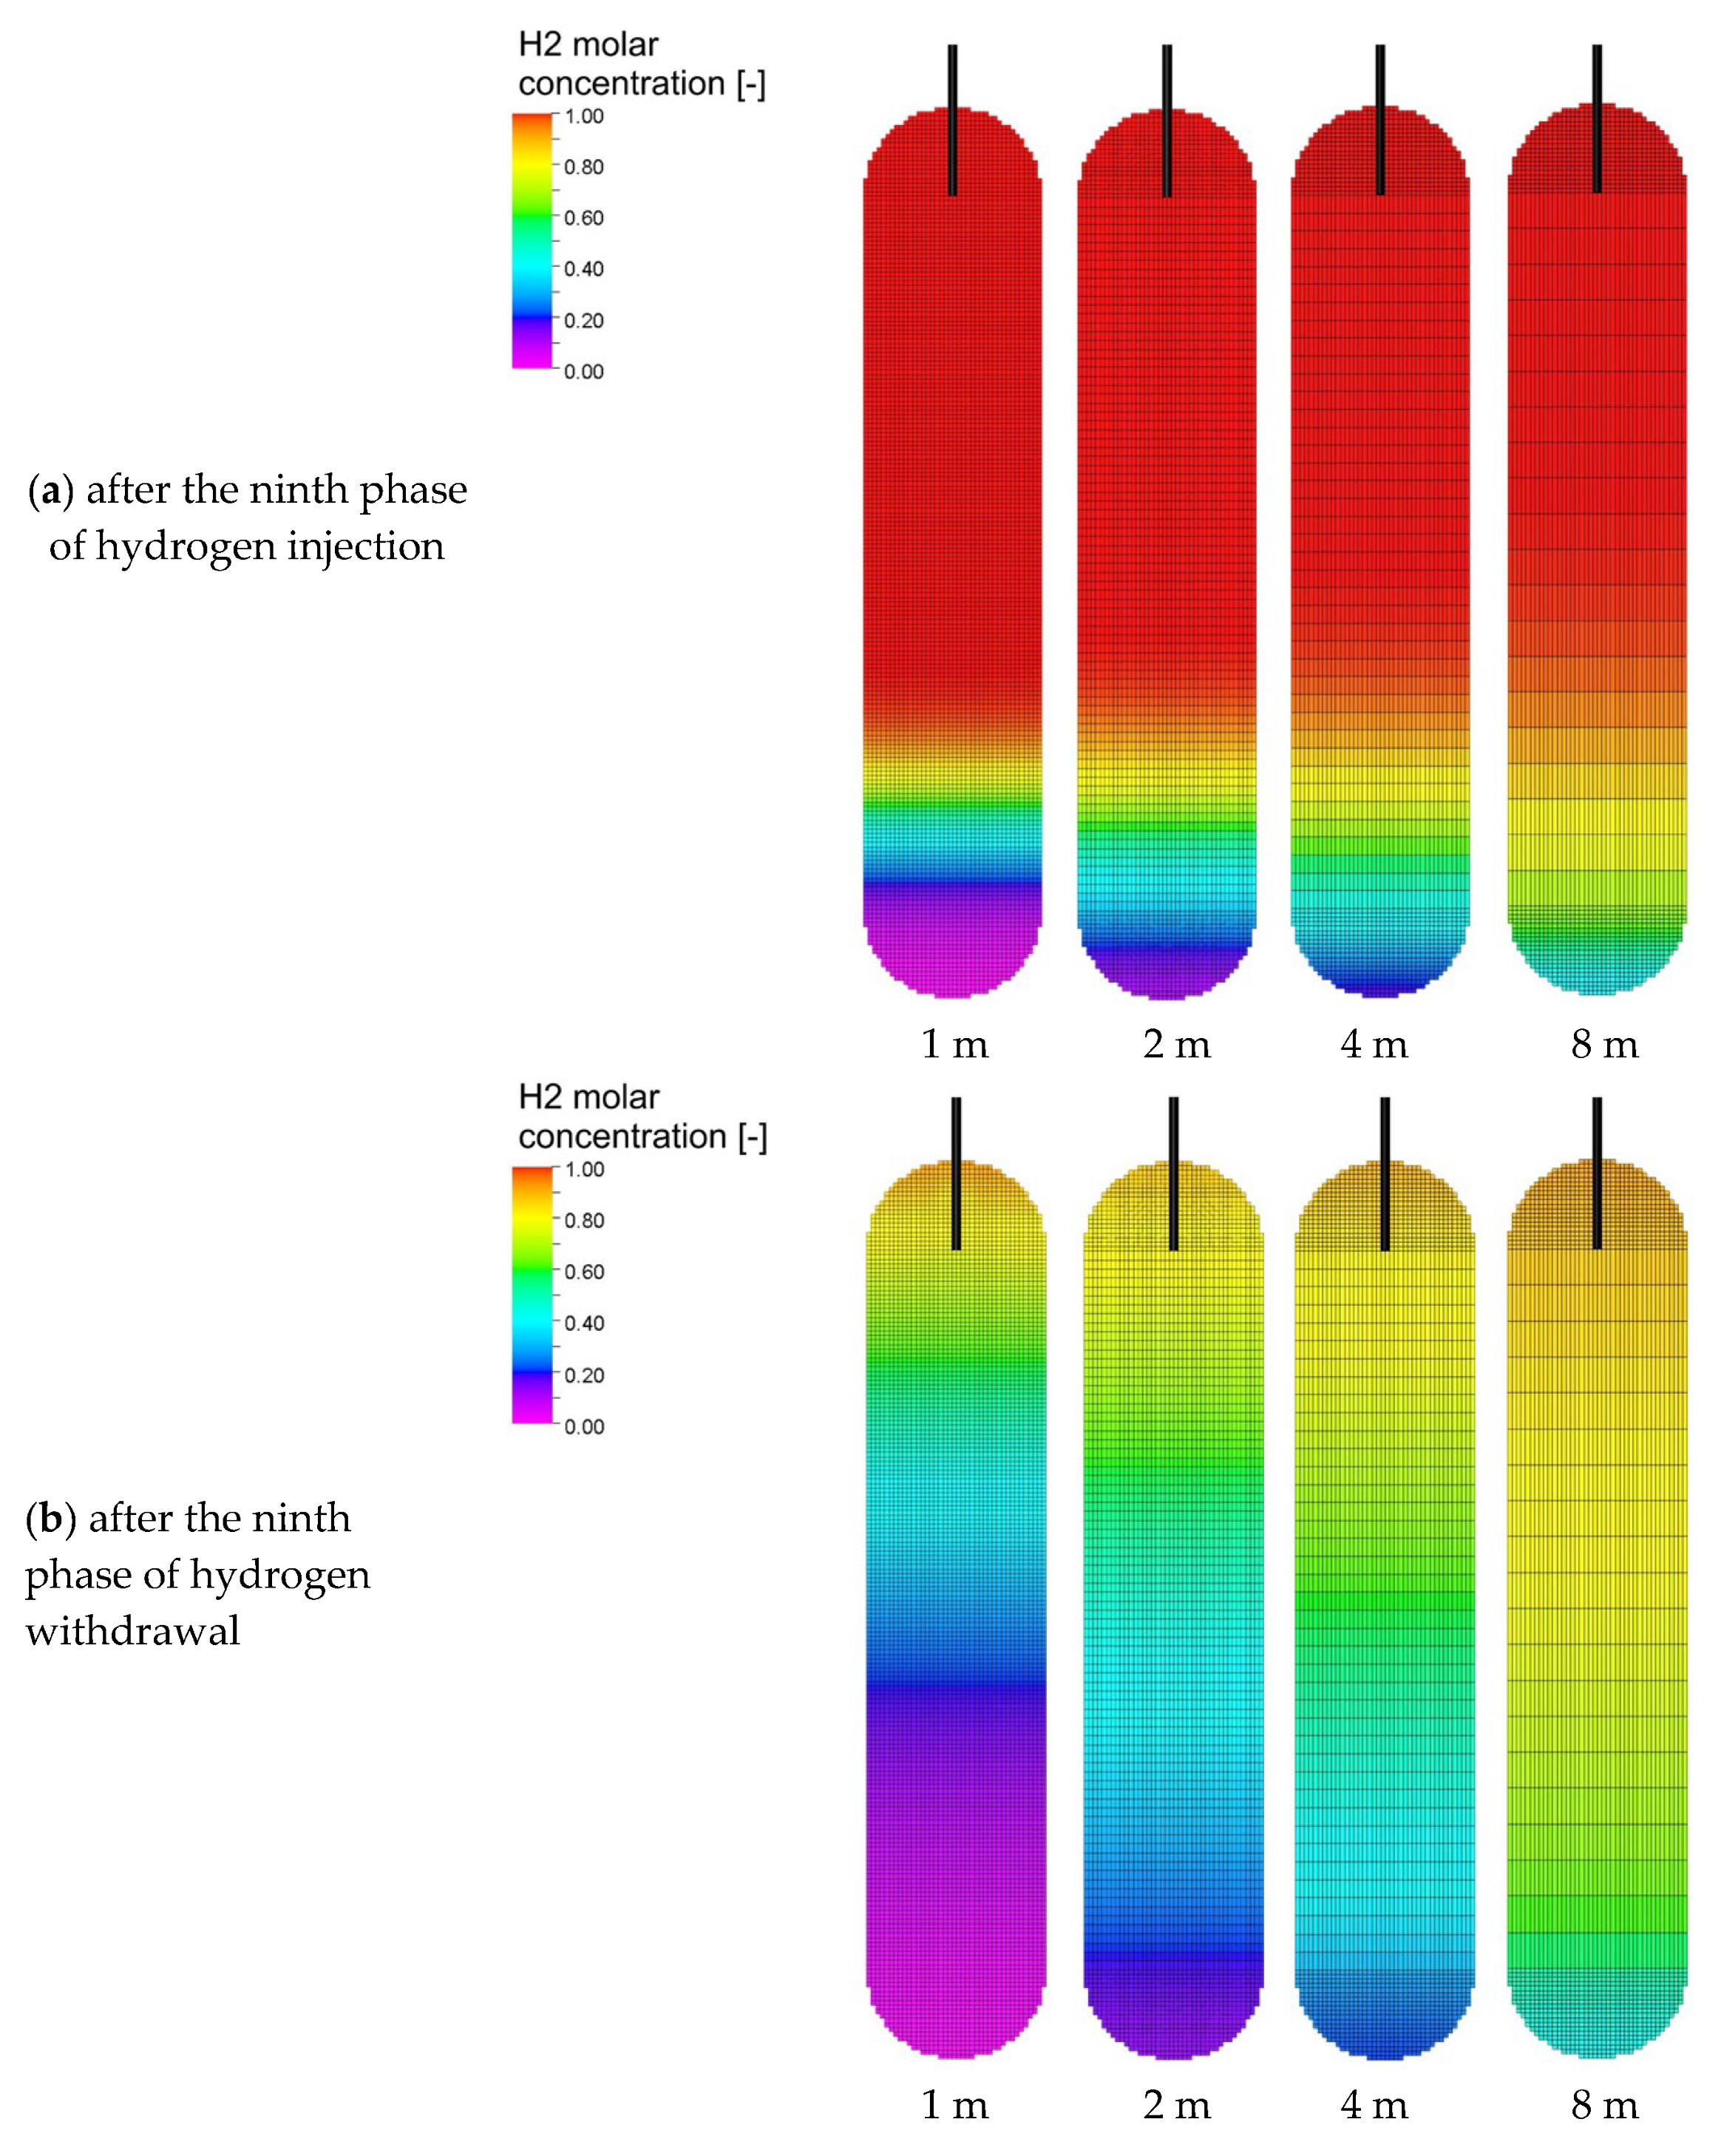
With each cycle, an increasing volume of H2 remains in the cavern, which leads to a progressively advancing H2 front (Figure 17a). In addition, the front becomes increasingly blurred, especially after the withdrawal phase (Figure 17b). In the case analysed, the position of the front and the extent of its blurring become less critical, primarily due to the purity and quantity of the H2 withdrawn (Figure 12 and Figure 13). However, in the model with the highest dispersion, a pronounced shift in the position of the front as well as an extensive blurred zone could be significant if the IP well was located on the opposite side, i.e., at the bottom of the cavern (other uses of the cavern). The above observations indicate that the block size sensitivity can be interpreted as a practical control of numerical dispersion, applied here as a proxy for physical dispersion.

4. Discussion

The simulation results demonstrate that dispersion is the dominant mechanism governing gas mixing in a salt cavern during the operation of H2 storage, while molecular diffusion plays a secondary but non-negligible role during stand-up phases. Physical dispersion, modelled numerically in the Eclipse 300 simulator, caused significant blurring of the hydrogen front and, in effect, an increase of CH4 contamination of the withdrawn hydrogen. This directly impacts the calorific value and economic feasibility of hydrogen storage. In addition, additional separation processes may be needed [4,17,41]. The novelty of this study lies in its quantitative assessment of these phenomena under cyclic operation of the cavern. The simulations provide numerical estimates of hydrogen purity losses and their dependence on cycle number and numerical dispersion (as a proxy for physical dispersion), which, to our knowledge, have not previously been reported. These results are directly relevant for engineering practice, offering input for optimizing the completion of well placement and cycle design in order to maintain H2 purity and storage efficiency.
The analysis demonstrates that the intensity of mixing depends strongly on the dispersion–diffusion coefficient. Higher values led to a broader front of H2 spreading (Figure 16 and Figure 17) and greater dilution of H2 with CH4 (Figure 13). This observation aligns with classical theories of dispersion in porous media [20,21,55] as well as other numerical studies of underground hydrogen storage in porous formations [18,19].
The effect of gas mixing due to molecular diffusion had a very small influence on the purity of withdrawn gas, especially during active injection and withdrawal, but became noticeable during extended stand-up periods. In these cases, diffusion contributed to additional blurring even in the absence of flow, confirming earlier experimental observations by Arekhov et al. [23]. This indicates that extended stand-up periods may gradually degrade hydrogen purity. Generally, the diffusion coefficient is more sensitive to temperature (Table 2) and also varies with pressure. However, in the Eclipse simulator applied here, diffusion coefficients are treated as constant and were derived from Chapman–Enskog correlations at reference cavern conditions (57 °C, 140 bar). The operating pressure changes during stand-up periods also remained relatively stable between cycles. Under more variable storage conditions, pressure and temperature changes could further affect the diffusion coefficient and change the purity of the withdrawn gas, but this cannot be captured with the present model and should be addressed in future work.
Another key finding is the cycle-dependent evolution of gas composition. CH4 contamination in the withdrawn gas progressively decreased from cycle to cycle, as the ratio of H2 to CH4 in place increased. This implies that the initial operational cycles are very important for maintaining the purity of hydrogen. Strategies such as precycling or just the use of cushion gas may help maintain H2 purity, as highlighted by Wallace et al. [41].
From a modelling point of view, this study demonstrated both the strengths and limitations of using a reservoir simulator for salt cavern applications. Modelling the cavern as an ultra-permeable porous medium and controlling dispersion effects through numerical block size allowed for effective alignment with analytical convection–dispersion solutions (Section 2.6.2). However, this approach relies on artificial representation of mixing processes, rather than explicitly resolving cavern-scale turbulent or chaotic advection phenomena [24]. Therefore, benchmarking for cavern simulators [37,38] should be considered in future studies to improve the reliability of predictions. Moreover, this and every simulation model should be verified based on operational data in order to confirm its usefulness for future simulation forecasts.
Finally, the operational utility of the results of this work is significant. The configurations of wells, particularly the relative placement of injectors and producers in the field, called the well pattern, can significantly influence mixing intensity, as indicated by the differences in front propagation observed in Section 3.3. Moreover, operational parameters such as cycle frequency, injection and withdrawal rates, and their duration directly affect the extent of dispersion and diffusion. Therefore, systematic optimization of these factors is essential to minimize hydrogen contamination, improve storage efficiency, and ensure the reliable performance of salt cavern facilities in the context of the energy transition. It should be emphasized that while the economic feasibility and scale of H2 production and storage are crucial for large-scale deployment, these are system-level issues beyond the scope of this study. Instead, the present work provides a methodological framework for quantifying mixing processes and their impact on the purity of withdrawn H2. These issues, particularly the optimization of well placement and operational parameters, will be investigated in future work. In addition, while this study focused on the H2-CH4 system, other gases such as N2 or CO2 may also be present in underground storage. Their concentrations in operational gas storage are generally negligible compared to CH4, and their presence would not increase contamination of the withdrawn hydrogen. In the case of CO2, biomethanation could even occur, which is currently being investigated by the authors in parallel research.

Limitations and Outlook

The present study has several limitations. Geomechanical effects such as deformation of the salt cavern’s shape and volume were not considered, nor were hydro-chemical processes such as salt dissolution at varying brine levels. Turbulent mixing phenomena, which can occur in open cavern geometries, were also not explicitly modelled. Their influence on gas mixing was only approximated indirectly through numerical dispersion of the finite-difference scheme used in the reservoir simulator. While this provides a practical approximation, it does not capture turbulence and boundary-layer processes explicitly. A comprehensive representation of such effects would require high-resolution CFD modelling, which is planned as a part of future research.
Another limitation is the lack of direct validation against laboratory or field data. This prevents an immediate assessment of model adequacy under real operating conditions. The present work should, therefore, be regarded as methodological, providing a systematic framework that can later be validated and complemented with laboratory-scale experiments and operational UGS/UHS data.
The presented methodology is intended as a first step, providing quantitative insights into dispersion–diffusion impacts that can be integrated with geomechanical and CFD-based models in subsequent studies.

5. Conclusions

  • The Eclipse 300 commercial compositional simulator, developed by Schlumberger, has been confirmed to be effective for modelling the operation of UHS located in a salt cavern, represented as an ultra-permeable porous rock.
  • For the simulations carried out, no significant influence of gravitational segregation on the modelling results was found.
  • Physical dispersion modelled as numerical dispersion is identified as the primary driver of mixing during the operation of UHS. This phenomenon has a significant influence on the composition of withdrawn gas.
  • Molecular diffusion does not have a significant impact on the modelling of flows caused by the pressure gradient in the cavern, but it may be important in a situation where there are no such flows, i.e., during the so-called stand-ups.
  • Both of the above phenomena should be taken into account to properly model the operation of the UHS, especially to calibrate such a model before it is applied to forecast the future performance of a cavern as a UHS facility.
  • The location of the injection and production wells, along with the well pattern, may be important for the simulation results, and should be the subject of further research.
  • A research gap has been identified: to the authors’ best knowledge, no prior publication has systematically quantified the combined effects of dispersion and diffusion on the modelling of UHS operation or their impact on the composition of withdrawn gas during cyclic operations. This work provides a methodological framework for these assessments and practical guidance for forecasting the composition of withdrawn gas, which is crucial for the gas calorific value.
  • From an operational perspective, the results offer valuable insights for cavern management, such as minimizing stand-up phases and optimizing well completion to maintain the purity of the withdrawn H2 (Figure 16 and Figure 17).
  • The study is subject to limitations (no geomechanical coupling, turbulence, or experimental validation), which will be addressed in future work by integrating dispersion–diffusion modelling with geomechanical analysis, CFD simulations, and laboratory/field data.

Author Contributions

Conceptualization, K.M.; methodology, K.M. and W.S.; software, K.M.; validation, K.M. and W.S.; formal analysis, K.M. and W.S.; investigation, K.M.; resources, K.M.; data curation, K.M. and W.S.; writing—original draft preparation, K.M.; writing—review and editing, K.M. and W.S.; visualization, K.M.; supervision, K.M. and W.S.; project administration, K.M. All authors have read and agreed to the published version of the manuscript.

Funding

This research was carried out as part of the project “Modelling the phenomenon of gas mixing in a salt cavern”, which is funded by the Polish Ministry of Science and Higher Education, Grant No. DK-4100-26/23. The authors would like to express their gratitude to the Polish Ministry of Science and Higher Education for funding this research.

Data Availability Statement

The data presented in this study are available on request from the corresponding author.

Conflicts of Interest

The authors declare no conflicts of interest.

References

  1. Ciechanowska, M. Hydrogen Strategy for a Climate-Neutral Europe. Naft.-Gaz 2020, 2020, 951–954. [Google Scholar] [CrossRef]
  2. Liléo, S.; Berge, E.; Undheim, O.; Klinkert, R.; Bredesen, R.E.; Vindteknikk, K. Long-Term Correction of Wind Measurements State-of-the-Art, Guidelines and Future Work; Elforsk Report 13:18; Elforsk AB: Stockholm, Sweden, 2013. [Google Scholar]
  3. Miziołek, M.; Filar, B.; Kwilosz, T. Hydrogen Storage in Depleted Natural Gas Fields. Naft.-Gaz 2022, 2022, 219–239. [Google Scholar] [CrossRef]
  4. Budak, P.; Szpunar, T. How Does the Composition of Natural Gas/Hydrogen Mixture Fluctuates during Exploitation of a Gas Cavern. Naft.-Gaz 2020, 2020, 799–806. [Google Scholar] [CrossRef]
  5. Blicharski, J. Analytical Modelling of the Gas Storage Process in Partially Depleted Natural Gas Deposits—Selected Issues. In AGH Disserations Monographs; AGH University of Science and Technology: Krakow, Poland, 2018; Available online: https://winntbg.bg.agh.edu.pl/skrypty4/0633/modelowanie.pdf (accessed on 28 November 2023).
  6. Caglayan, D.G.; Weber, N.; Heinrichs, H.U.; Linßen, J.; Robinius, M.; Kukla, P.A.; Stolten, D. Technical Potential of Salt Caverns for Hydrogen Storage in Europe. Int. J. Hydrog. Energy 2020, 45, 6793–6805. [Google Scholar] [CrossRef]
  7. Tarkowski, R.; Uliasz-Misiak, B. Towards Underground Hydrogen Storage: A Review of Barriers. Renew. Sustain. Energy Rev. 2022, 162, 112451. [Google Scholar] [CrossRef]
  8. Such, P. Magazynowanie Wodoru w Obiektach Geologicznych. Naft.-Gaz 2020, 76, 794–798. [Google Scholar] [CrossRef]
  9. Zivar, D.; Kumar, S.; Foroozesh, J. Underground Hydrogen Storage: A Comprehensive Review. Int. J. Hydrogen Energy 2021, 46, 23436–23462. [Google Scholar] [CrossRef]
  10. Filar, B.; Miziołek, M.; Kwilosz, T. Assessment of Hydrogen Production Costs with the Use of Energy from a Photovoltaic Installation Build in Poland. Naft.-Gaz 2022, 2022, 451–459. [Google Scholar] [CrossRef]
  11. Gahleitner, G. Hydrogen from Renewable Electricity: An International Review of Power-to-Gas Pilot Plants for Stationary Applications. Int. J. Hydrog. Energy 2013, 38, 2039–2061. [Google Scholar] [CrossRef]
  12. Zeljaś, D. Magazyny Gazu Ziemnego w Cechsztyñskich Formacjach Solnych Elementem Bezpieczeñstwa Energetycznego Polski. Przegląd Geol. 2020, 68, 824–832. [Google Scholar]
  13. Amid, A.; Mignard, D.; Wilkinson, M. Seasonal Storage of Hydrogen in a Depleted Natural Gas Reservoir. Int. J. Hydrog. Energy 2016, 41, 5549–5558. [Google Scholar] [CrossRef]
  14. Li, Q.; Han, Y.; Liu, X.; Ansari, U.; Cheng, Y.; Yan, C. Hydrate as a By-Product in CO2 Leakage during the Long-Term Sub-Seabed Sequestration and Its Role in Preventing Further Leakage. Environ. Sci. Pollut. Res. 2022, 29, 77737–77754. [Google Scholar] [CrossRef]
  15. Li, Q.; Li, Q.; Wang, F.; Xu, N.; Wang, Y.; Bai, B. Settling Behavior and Mechanism Analysis of Kaolinite as a Fracture Proppant of Hydrocarbon Reservoirs in CO2 Fracturing Fluid. Colloids Surf. A Physicochem. Eng. Asp. 2025, 724, 137463. [Google Scholar] [CrossRef]
  16. Szott, W.; Miłek, K. Numerical Procedure to Effectively Assess Sequestration Capacity of Geological Structures. Naft.-Gaz 2021, 77, 783–794. [Google Scholar] [CrossRef]
  17. Jaworski, J.; Kułaga, P.; Kukulska-Zając, E. Wybrane Zagadnienia Dotyczące Wpływu Dodatku Wodoru Do Gazu Ziemnego Na Elementy Systemu Gazowniczego. Naft.-Gaz 2019, 75, 625–632. [Google Scholar] [CrossRef]
  18. Feldmann, F.; Hagemann, B.; Ganzer, L.; Panfilov, M. Numerical Simulation of Hydrodynamic and Gas Mixing Processes in Underground Hydrogen Storages. Environ. Earth Sci. 2016, 75, 1165. [Google Scholar] [CrossRef]
  19. Hogeweg, S.; Strobel, G.; Hagemann, B. Benchmark Study for the Simulation of Underground Hydrogen Storage Operations. Comput. Geosci. 2022, 26, 1367–1378. [Google Scholar] [CrossRef]
  20. Taylor, G.I. Dispersion of Soluble Matter in Solvent Flowing Slowly through a Tube. Proc. R. Soc. Lond. A Math. Phys. Sci. 1953, 219, 186–203. [Google Scholar] [CrossRef]
  21. Aris, R. On the Dispersion of a Solute in Pulsating Flow through a Tube. Proc. R. Soc. Lond. A Math. Phys. Sci. 1960, 259, 370–376. [Google Scholar] [CrossRef]
  22. Kneafsey, T.J.; Pruess, K. Laboratory Flow Experiments for Visualizing Carbon Dioxide-Induced, Density-Driven Brine Convection. Transp. Porous Media 2010, 82, 123–139. [Google Scholar] [CrossRef]
  23. Arekhov, V.; Zhainakov, T.; Clemens, T.; Wegner, J. Measurement of Effective Hydrogen-Hydrocarbon Gas Diffusion Coefficients in Reservoir Rocks. In Proceedings of the SPE Europe C—Europe Energy Conference featured at the 84th EAGE Annual Conference & Exhibition, Vienna, Austria, 5 June 2023; SPE: London, UK, 2023. [Google Scholar]
  24. Lester, D.R.; Metcalfe, G.; Trefry, M.G. Is Chaotic Advection Inherent to Porous Media Flow? Phys. Rev. Lett. 2013, 111, 174101. [Google Scholar] [CrossRef]
  25. Azin, R.; Nasiri, A.; Entezari, A.J.; Montazeri, G.H. Investigation of Underground Gas Storage in a Partially Depleted Gas Reservoir. In Proceedings of the CIPC/SPE Gas Technology Symposium 2008 Joint Conference, Calgary, AB, Canada, 16 June 2008; SPE: London, UK, 2008. [Google Scholar]
  26. Lysyy, M.; Fernø, M.; Ersland, G. Seasonal Hydrogen Storage in a Depleted Oil and Gas Field. Int. J. Hydrog. Energy 2021, 46, 25160–25174. [Google Scholar] [CrossRef]
  27. Bauer, S. Underground Sun Conversion; RAG Austria AG: Vienna, Austria, 2021. [Google Scholar]
  28. Ozarslan, A. Large-Scale Hydrogen Energy Storage in Salt Caverns. Int. J. Hydrog. Energy 2012, 37, 14265–14277. [Google Scholar] [CrossRef]
  29. Londe, L. Underground Storage of Hydrocarbons: Advantages, Lessons Learnt and Way Forward. In Proceedings of the Abu Dhabi International Petroleum Exhibition & Conference, Abu Dhabi, United Arab Emirates, 13–16 November 2017; p. SPE-188218-MS. [Google Scholar]
  30. Siekierski, M.; Majewska, K.; Mroczkowska-Szerszeń, M. Metody Efektywnego i Bezpiecznego Magazynowania Wodoru Jako Warunek Powszechnego Jego Wykorzystania w Transporcie i Energetyce. Naft.-Gaz 2023, 79, 114–130. [Google Scholar] [CrossRef]
  31. Huang, Y.; Chen, H.S.; Zhang, X.J.; Keatley, P.; Huang, M.J.; Vorushylo, I.; Wang, Y.D.; Hewitt, N.J. Techno-Economic Modelling of Large Scale Compressed Air Energy Storage Systems. In Proceedings of the Energy Procedia, Berlin, Germany, 7–9 April 2017; Elsevier Ltd.: Amsterdam, The Netherlands, 2017; Volume 105, pp. 4034–4039. [Google Scholar]
  32. Huang, Y.; Rolfe, A.; Vorushylo, I.; Keatley, P.; Byrne, R.; Macartain, P.; Flynn, D.; Hewitt, N. Integration of Compressed Air Energy Storage with Wind Generation into the Electricity Grid. In Proceedings of the IOP Conference Series: Earth and Environmental Science, Tomsk, Russia, 30 October 2018; Institute of Physics Publishing: Bristol, UK, 2018; Volume 188. [Google Scholar]
  33. Kaliski, M.; Janusz, P.; Szurlej, A. Podziemne magazyny gazu jako element krajowego systemu gazowego. Naft.-Gaz 2010, 66, 325–332. [Google Scholar]
  34. Filar, B.; Miziołek, M.; Cicha-Szot, R.; Moska, A.; Kwilosz, T.; Szpunar, T. Analysis of the Possibility of Increasing the Working Capacity of Underground Gas Storage Facilities in Poland. Naft.-Gaz 2024, 80, 571–580. [Google Scholar] [CrossRef]
  35. Groenenberg, R.; Koornneef, J.; Sijm, J.; Janssen, G.; Morales-Espana, G.; Van Stralen, J.; Hernandez-Serna, R.; Smekens, K.; Juez-Larré, J.; Goncalvez, C.; et al. Large-Scale Energy Storage in Salt Caverns and Depleted Fields (LSES)-Project Findings; TNO: Den Haag, The Netherlands, 2020. [Google Scholar]
  36. Höpken, L.; Bekebrok, H.; Pluta, A.; Langnickel, H.; Savchenko, I.; Ohm, M.; Steinmann, O.; Zobel, M.; Dyck, A.; Agert, C. Modelling Green Hydrogen Storage in Salt Caverns: Implications of Future Storage Demands on Cavern Operation. J. Energy Storage 2025, 119, 116150. [Google Scholar] [CrossRef]
  37. Jeannin, L.; Myagkiy, A.; Vuddamalay, A. Modelling the Operation of Gas Storage in Salt Caverns: Numerical Approaches and Applications. Sci. Technol. Energy Transit. (STET) 2022, 77, 6. [Google Scholar] [CrossRef]
  38. Ruiz Maraggi, L.M.; Moscardelli, L.G. Modeling Hydrogen Storage Capacities, Injection and Withdrawal Cycles in Salt Caverns: Introducing the GeoH2 Salt Storage and Cycling App. Int. J. Hydrog. Energy 2023, 48, 26921–26936. [Google Scholar] [CrossRef]
  39. Ghaedi, M.; Gholami, R. Characterization and Assessment of Hydrogen Leakage Mechanisms in Salt Caverns. Sci. Rep. 2025, 15, 185. [Google Scholar] [CrossRef]
  40. Qian, X.; You, S.; Wang, R.; Yue, Y.; Liao, Q.; Dai, J.; Tian, S.; Liu, X. Underground Hydrogen Storage in Salt Cavern: A Review of Advantages, Challenges, and Prospects. Sustainability 2025, 17, 5900. [Google Scholar] [CrossRef]
  41. Wallace, R.L.; Cai, Z.; Zhang, H.; Guo, C. Numerical Investigations into the Comparison of Hydrogen and Gas Mixtures Storage within Salt Caverns. Energy 2024, 311, 133369. [Google Scholar] [CrossRef]
  42. Bowen, H.; Xianzhen, M.; Yu, L.; Shuchen, L.; Wei, L.; Chao, W. Effects of Cushion Gas Pressure and Operating Parameters on the Capacity of Hydrogen Storage in Lined Rock Caverns (LRC). Renew. Energy 2024, 235, 121317. [Google Scholar] [CrossRef]
  43. Tackie-Otoo, B.N.; Haq, M.B. A Comprehensive Review on Geo-Storage of H2 in Salt Caverns: Prospect and Research Advances. Fuel 2024, 356, 129609. [Google Scholar] [CrossRef]
  44. Ramesh Kumar, K.; Honorio, H.; Chandra, D.; Lesueur, M.; Hajibeygi, H. Comprehensive Review of Geomechanics of Underground Hydrogen Storage in Depleted Reservoirs and Salt Caverns. J. Energy Storage 2023, 73, 108912. [Google Scholar] [CrossRef]
  45. Speirs, D.C.D.; Bere, A.; Roberts, D. Geomechanical Modelling of Salt Caverns under Operational Loading from Hydrogen Storage. In Proceedings of the International Geomechanics Symposium, Abu Dhabi, United Arab Emirates, 7 November 2022; The American Rock Mechanics Association: Alexandria, VA, USA, 2022. [Google Scholar]
  46. Fu, Y.; Jiang, Y.; Dutta, A.; Mohanram, A.; Pietras, J.D.; Bazant, M.Z. Multicomponent Gas Diffusion in Porous Electrodes. J. Electrochem. Soc. 2015, 162, F613–F621. [Google Scholar] [CrossRef]
  47. Vaartstra, G.; Lu, Z.; Grossman, J.C.; Wang, E.N. Numerical Validation of the Dusty-Gas Model for Binary Diffusion in Low Aspect Ratio Capillaries. Phys. Fluids 2021, 33, 121701. [Google Scholar] [CrossRef]
  48. Szott, W.; Gołąbek, A. Symulacyjne modelowanie procesów mieszania się gazów w warunkach złożowych. Naft.-Gaz 2014, 3, 151–161. [Google Scholar]
  49. Szott, W.; Miłek, K. Numerical Simulations of Hydrogen Storage in a Partially Depleted Gas Reservoir. Naft.-Gaz 2022, 78, 41–55. [Google Scholar] [CrossRef]
  50. Schlumberger-Private An Internal Documentation on General Considerations for Modelling Hydrogen Storage with Eclipse; Unpublished Internal Documentation; Schlumberger: Houston, TX, USA, 2023.
  51. Neumiller, J. Feasibility of Using Wind Energy and CAES Systems in a Variety of Geologic Systems. In Proceedings of the EUROPEC/EAGE Conference and Exhibition, Amsterdam, The Netherlands, 8–11 June 2009; p. SPE-121934-MS. [Google Scholar]
  52. Branch of KPMG Mogilno. Available online: https://pgnig.pl/podziemne-magazyny-gazu (accessed on 28 November 2023).
  53. Fang, Y.; Hou, Z.; Yue, Y.; Chen, Q.; Liu, J. Numerical Study of Hydrogen Storage Cavern in Thin-Bedded Rock Salt, Anning of China. In Mechanical Behavior of Salt; CRC Press: Boca Raton, FL, USA, 2022. [Google Scholar]
  54. Stopa, J.; Stanislaw, R.; Kosowski, P. The Role of Salt Caverns in Underground Gas Storage. Miner. Resour. Manag. 2008, 24, 11–23. [Google Scholar]
  55. Bijeljic, B.; Blunt, M.J. A Physically Based Description of Dispersion in Porous Media. In Proceedings of the SPE Annual Technical Conference and Exhibition, New Orleans, LA, USA, 24 September 2006; SPE: London, UK, 2006. [Google Scholar]
  56. Ogata, A.; Banks, R.B. A Solution of the Differential Equation of Longitudinal Dispersion in Porous Media; USGS: Reston, VA, USA, 1961. [Google Scholar]
  57. Miłek, K.; Szott, W.; Gołąbek, A. Simulation Study of Displaced Methane Displaced in Formation Waters by Injecting Acid Gases as Part of Their Sequestration. Naft.-Gaz 2013, 69, 112–122. Available online: https://inig.pl/magazyn/nafta-gaz/NAFTA-GAZ-2013-02-02.pdf (accessed on 16 October 2025).
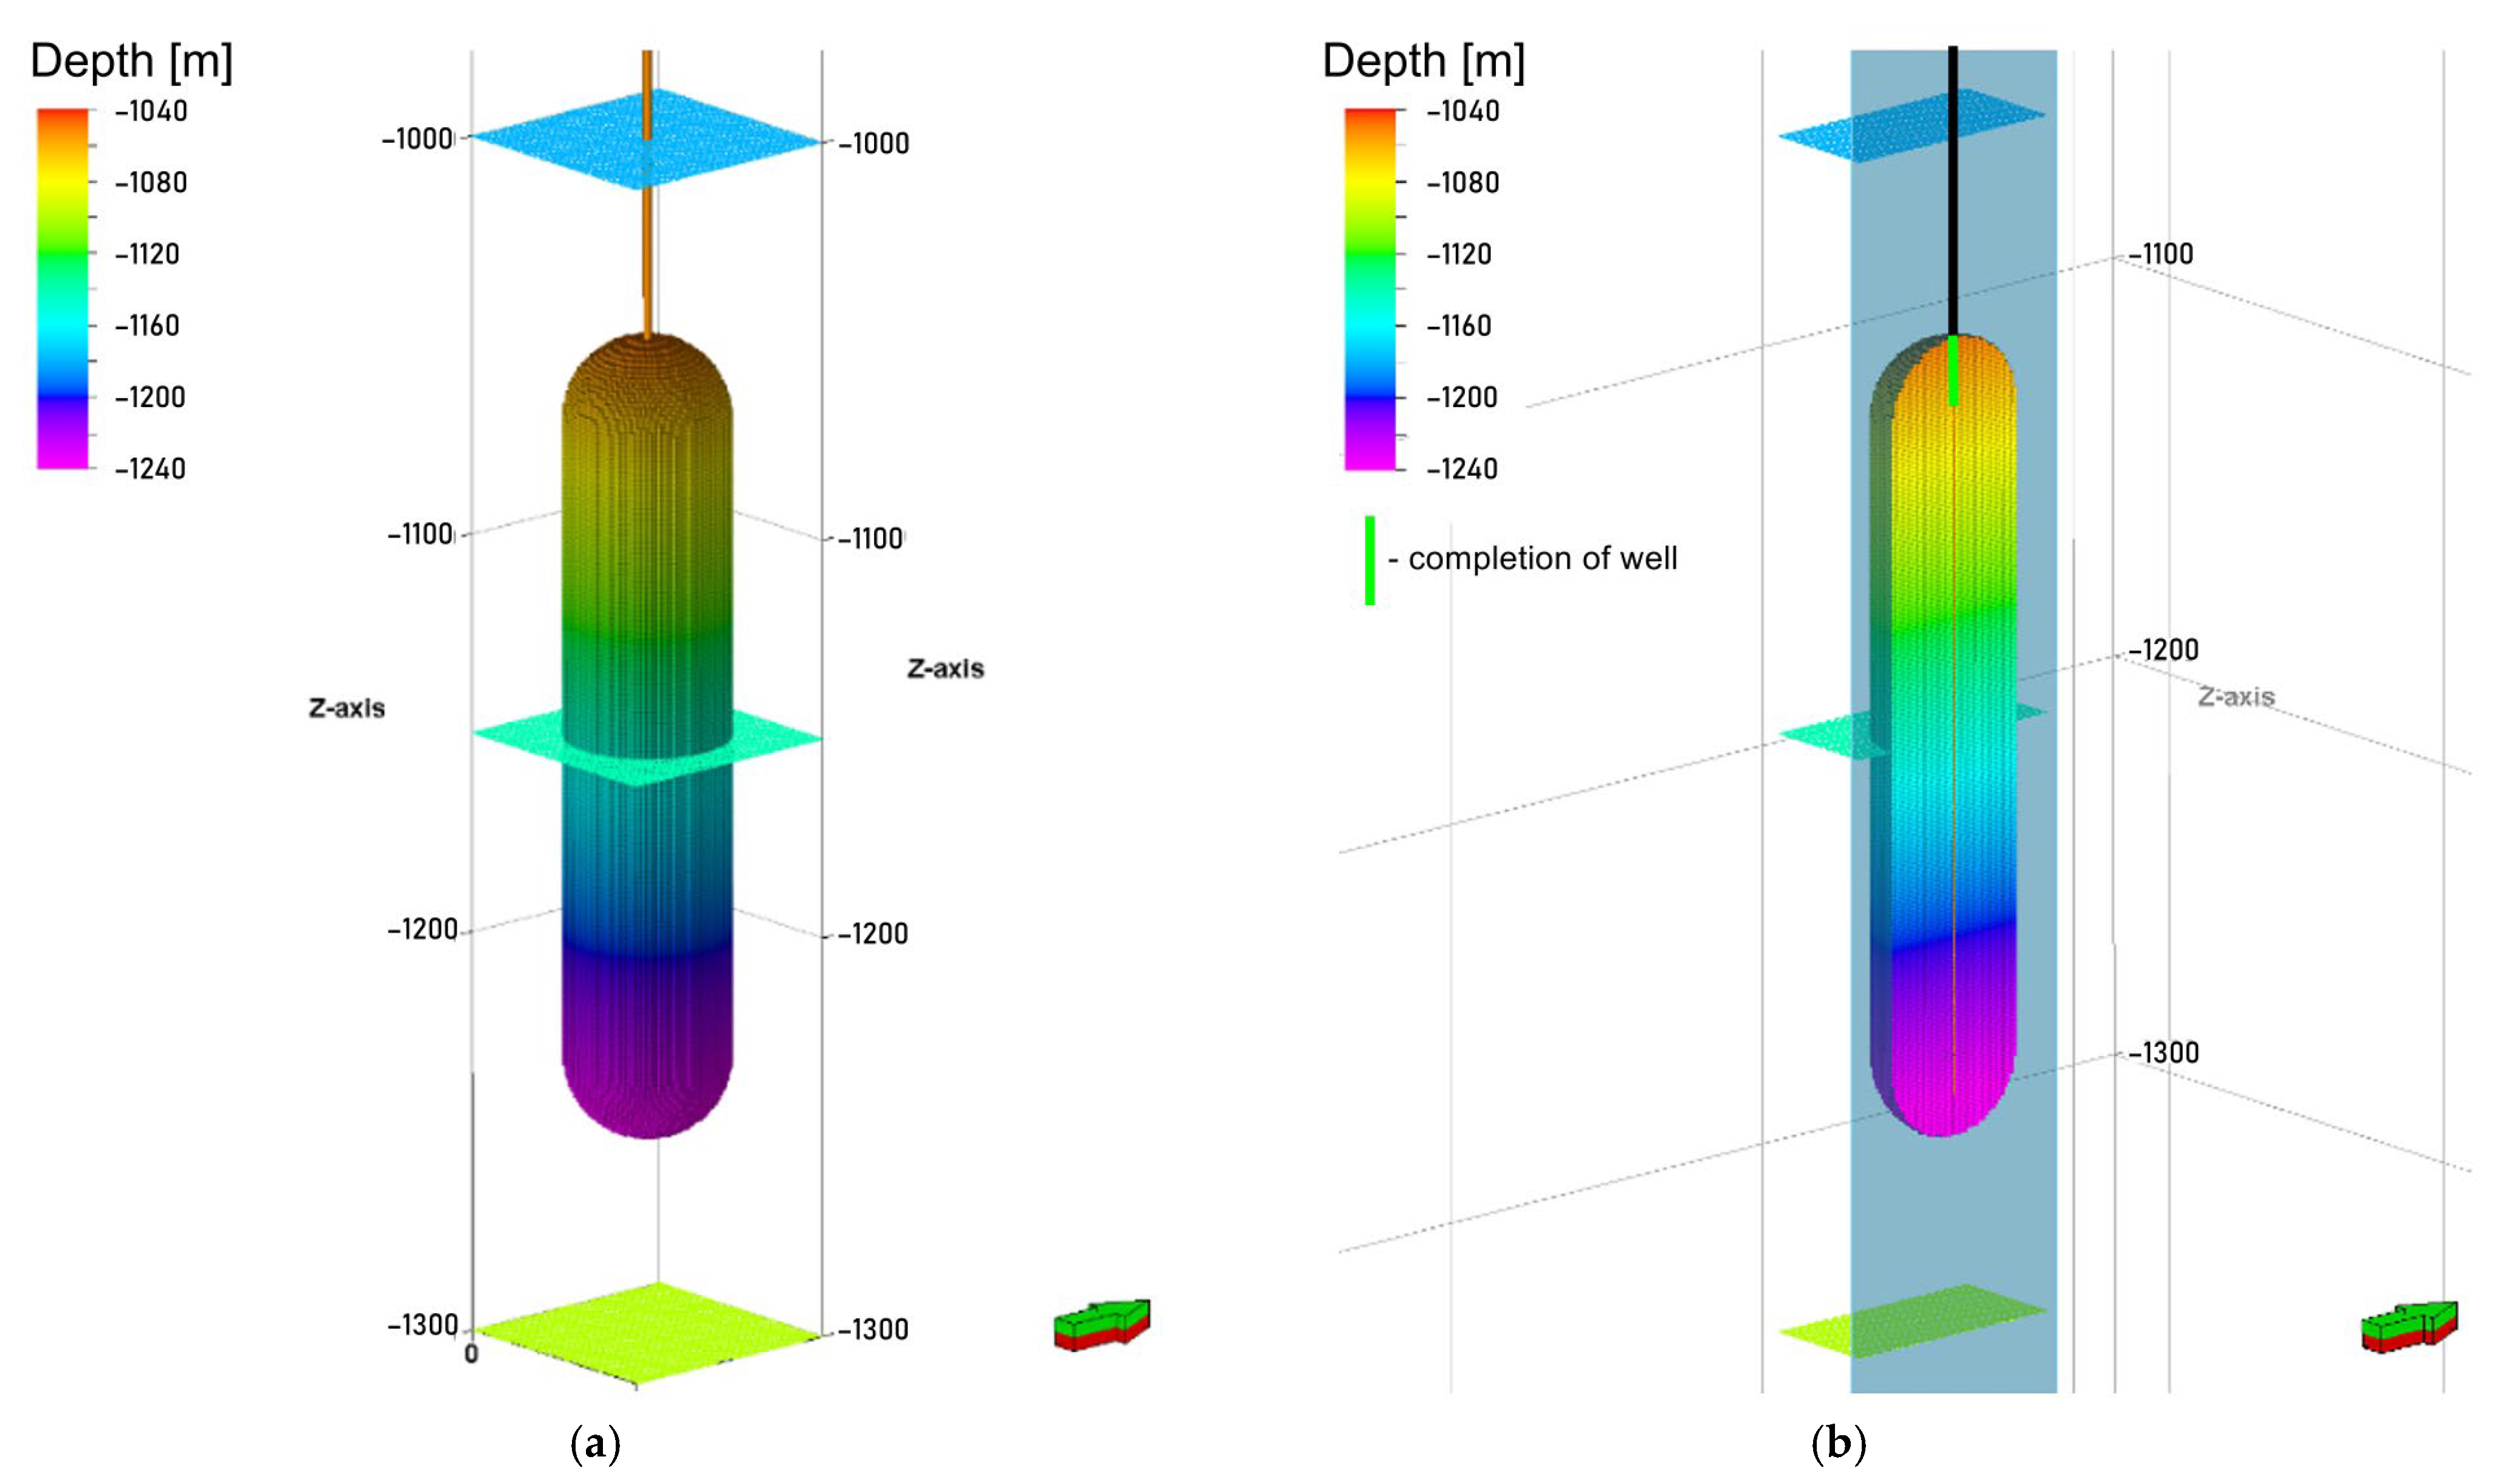
Figure 1. A model of a salt cavern: (a) 3D view, (b) vertical cross-section.
Energies 18 05528 g001
Figure 2. The pressure at the bottom of the IP well, Pbhp.
Energies 18 05528 g002
Figure 3. The gas production/withdrawal efficiency, qp.
Energies 18 05528 g003
Figure 4. The molar concentration of H2 in the extracted withdrawn gas, cH2.
Energies 18 05528 g004
Figure 5. A cross-section of simulation models with different block heights, H (1, 2, 4, 8 m).
Energies 18 05528 g005
Figure 6. The base model. The H2 concentration along profile A-A’ for t = 10, 20, 30, 40, 50 days. Mixing is represented in the simplified cavern model, where numerical dispersion in the simulator is used as a surrogate for the physical dispersion.
Energies 18 05528 g006
Figure 7. The convection velocity coefficient, v, depending on the time of movement of the front for different sizes of vertical blocks, H.
Energies 18 05528 g007
Figure 8. The vertical dispersion component, where D is the dispersion-diffusion coefficient, and v is the speed of movement of the front, for different sizes of the vertical blocks, H.
Energies 18 05528 g008
Figure 9. The vertical component of the velocity, v, depending on the time of movement of the front for the models without diffusion (Ddiff = 0.0) and with diffusion (Ddiff = 0.1). The two curves overlap, indicating that diffusion has no significant effect on the velocity.
Energies 18 05528 g009
Figure 10. The dispersion–diffusion coefficient, D, depending on the speed of movement of the front, vs. the model without diffusion (Ddiff = 0.0) vs. the model with diffusion (Ddiff = 0.1).
Energies 18 05528 g010
Figure 11. The diffusion and non-diffusion models. The concentration of H2 along the A-A’ profile at the end of the injection and after 600 days from the end of the injection.
Energies 18 05528 g011
Figure 12. The total H2 withdrawal in subsequent cycles of UHS operation.
Energies 18 05528 g012
Figure 13. The average CH4 contamination of the received gas in subsequent cycles of UHS operation.
Energies 18 05528 g013
Figure 14. The total H2 injection in subsequent UHS work cycles.
Energies 18 05528 g014
Figure 15. The ratio of withdrawn to injected H2 in subsequent cycles of UHS operation.
Energies 18 05528 g015
Figure 16. The distributions of H2 saturation in UHS for models differing in the dispersion–diffusion coefficient (the vertical height of the blocks). The first phase of H2 injection and withdrawal.
Energies 18 05528 g016
Figure 17. The distributions of H2 saturation in UHS for models differing in the dispersion–diffusion coefficient (vertical height of the blocks). The ninth phase of H2 injection and withdrawal.
Energies 18 05528 g017
Table 1. Parameters of Peng–Robinson equation of state for fluid of variable composition.
ComponentMolecular Weight [kg/kmole]Tcrit [K]Pcrit
[bar]
Vcrit
[m3/kg-mole]
Zcrit
[-]
Vol Shift
[-]
Acentric Factor [-]Parachor [dyne/cm]Omega A [-]Omega B
[-]
H22.01633.212.970.0650.30540−0.22340.45730.0778
C116.043190.646.000.0990.287400.013770. 45730.0778
Table 2. Estimated values of binary diffusion coefficients in CH4-H2 system.
T [°C]P [bar]D [m2/d]
28400.1547
57400.4492
57155.140.1158
57221.10.0811
57301.890.0595
Table 3. H2 withdrawal in subsequent UHS cycles for models differing in dispersion–diffusion coefficient (block height).
Cycle\Block HeightHydrogen Withdrawal [kg mole]
1 m2 m4 m8 m
2948,717936,696924,471903,182
3954,342944,787934,760919,090
4955,813946,493937,789924,867
5956,214947,087939,170927,630
6957,226946,999939,294928,545
7955,878946,672939,113929,974
8955,521946,315939,005931,303
9954,779945,546939,193932,127
10953,913945,088938,802932,545
Table 4. H2 injection in successive UHS cycles for models differing in dispersion–diffusion coefficient (block height).
Cycle\Block HeightHydrogen Injection [kg mole]
1 m2 m4 m8 m
2974,788974,448971,842970,326
3972,519972,091966,308962,151
4969,844967,395962,818958,425
5966,208964,552959,864953,802
6966,246961,505957,996951,384
7965,321960,804954,627949,282
8962,665958,235952,327947,089
9961,115956,023951,722945,857
10959,554955,680950,075944,233
Table 5. H2 contamination in subsequent UHS cycles for models differing in dispersion–diffusion coefficient (block height).
Cycle\Block HeightHydrogen Contamination [mol/mol]
1 m2 m4 m8 m
20.03110.04410.05520.0758
30.02040.02980.03680.0504
40.01590.02360.02910.0383
50.01360.02000.02420.0309
60.01230.01750.02100.0254
70.01080.01560.01840.0214
80.00980.01410.01640.0183
90.00910.01280.01480.0156
100.00850.01180.01330.0134
Table 6. Ratio of withdrawn to injected H2 in subsequent cycles of UHS operation for models differing dispersion–diffusion coefficient (block height).
Cycle\Block HeightRatio of Withdrawn to Injected Hydrogen in Subsequent Cycles [%]
1 m2 m4 m8 m
297.3396.1395.1393.08
398.1397.1996.7495.52
498.5597.8497.4096.50
598.9798.1997.8497.26
699.0798.4998.0597.60
799.0298.5398.3797.97
899.2698.7698.6098.33
999.3498.9098.6898.55
1099.4198.8998.8198.76
Disclaimer/Publisher’s Note: The statements, opinions and data contained in all publications are solely those of the individual author(s) and contributor(s) and not of MDPI and/or the editor(s). MDPI and/or the editor(s) disclaim responsibility for any injury to people or property resulting from any ideas, methods, instructions or products referred to in the content.