Experimental and Numerical Evaluation of CO2-Induced Wettability Alteration in Carbonate Reservoir CCUS
Abstract
1. Introduction
1.1. Background
1.2. Wettability Alteration
1.3. Objective of Study
2. Materials and Methods
2.1. Core Preparation
- A 12-inch core was divided into several 2-inch core plugs for the measurement of porosity and permeability utilizing the Core Measurement System (CMS-300).
- The core plugs were dried in an oven at 240 °F for 24 h.
- After drying, each core plug’s diameter and length were measured with a digital caliper, and the bulk volume and grain density were recorded by weighing.
- The CMS-300 system was used to determine the porosity and gas permeability through helium expansion and gas flow techniques. The operational procedure was as follows:
- Verification of gas supply, followed by opening the nitrogen valve and then the helium valve.
- Execution of a helium leak test.
- Input of the core sample dimensions and confining pressure of 1500 psia into the software and the insertion of core sample into the measurement holder.
- Calibration to determine the pore volume, porosity, and permeability.
- The core disks were first trimmed to 1.5 inches in diameter and 0.5 inches in length to fit in the Drop Shape Analyzer (DSA-100).
- The disks underwent Soxhlet extraction, initially with toluene for 24 h to eliminate organic contaminants, followed by methanol for another 24 h to remove residual water and reduce potential clay swelling.
- After cleaning, the samples were vacuum-dried for 24 h to eliminate any trapped air.
- The disks were centrifuged at 3000 rpm for 24 h while immersed in brine to achieve full brine saturation.
- The core disks were centrifuged at 3000 rpm for 24 h while fully immersed in each hydrocarbon fluid systems. Disks from all core samples were distributed among the fluid systems to maintain consistency and reduce sample bias.
- The core disks were left in the oven for 6 weeks at 240 °F to complete the aging process.
2.2. Fluid System Compositions
2.3. Experimental Design and Setup
- Viscosity measurement: The viscosities of the four fluid systems were measured at ambient conditions using a rotational viscometer (Section 2.2). The results are presented in Table 2 (Section 2.2).
- pH Measurement: The surrounding brine phase’s pH was measured using the colorimetric method with pH indicator paper:
- -
- The pH of the surrounding brine phase (50,000 ppm salinity with sodium chloride) was 7.6.
- -
- The pH of the surrounding carbonated brine phase (50,000 ppm salinity with sodium chloride) was 4.5.
- Preparation of carbonated brine: The carbonated brine was prepared by mixing the brine with CO2 gas (supplied from a pressurized tank). The carbonation process was carried out immediately prior to each experimental measurement to ensure proper, consistent, and reliable measurements at ambient temperature. The carbonated brine was then immediately transferred to an isolated storage tank that was connected to the experimental chamber.
- Rock characterization: The porosity and permeability of the Indiana Limestone core disks were measured using the Core Measurement System (CMS-300); the details are provided in Table 1 (Section 2.1).
- Core aging: The core disks were aged in contact with each fluid system for six weeks at 240 °F in sealed containers to simulate long-term exposure under reservoir conditions (see Section 2.1 for details).
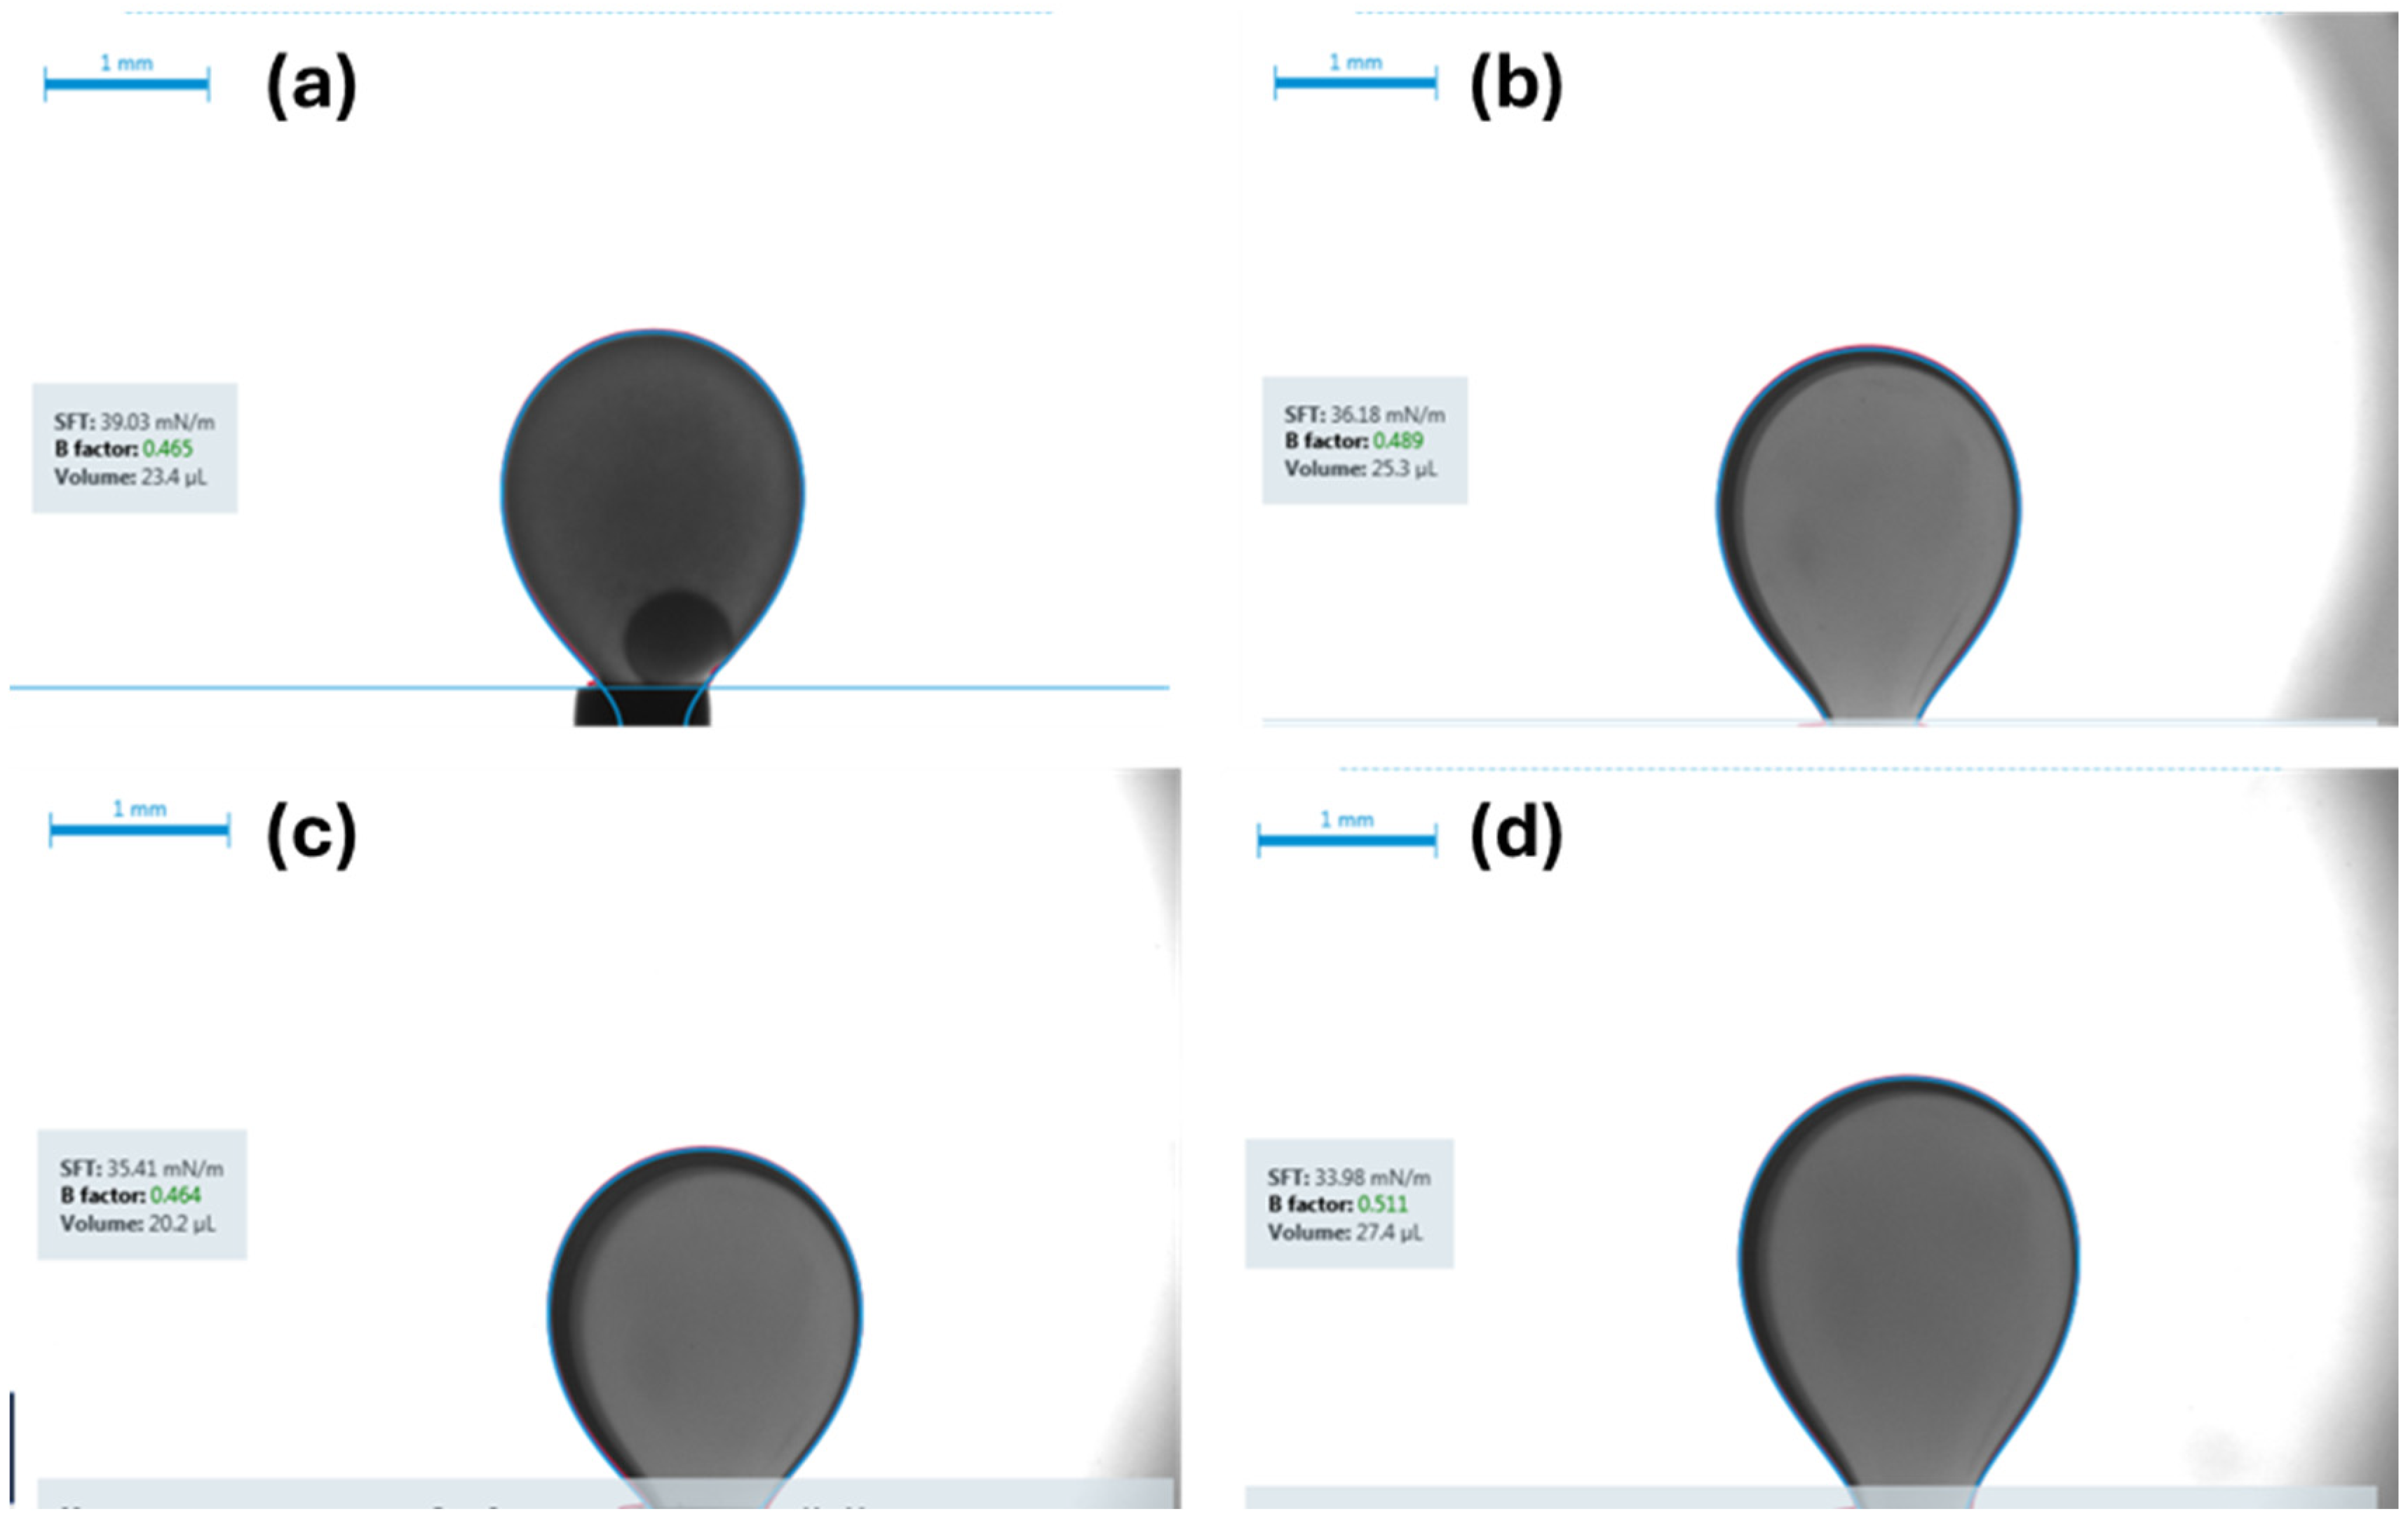
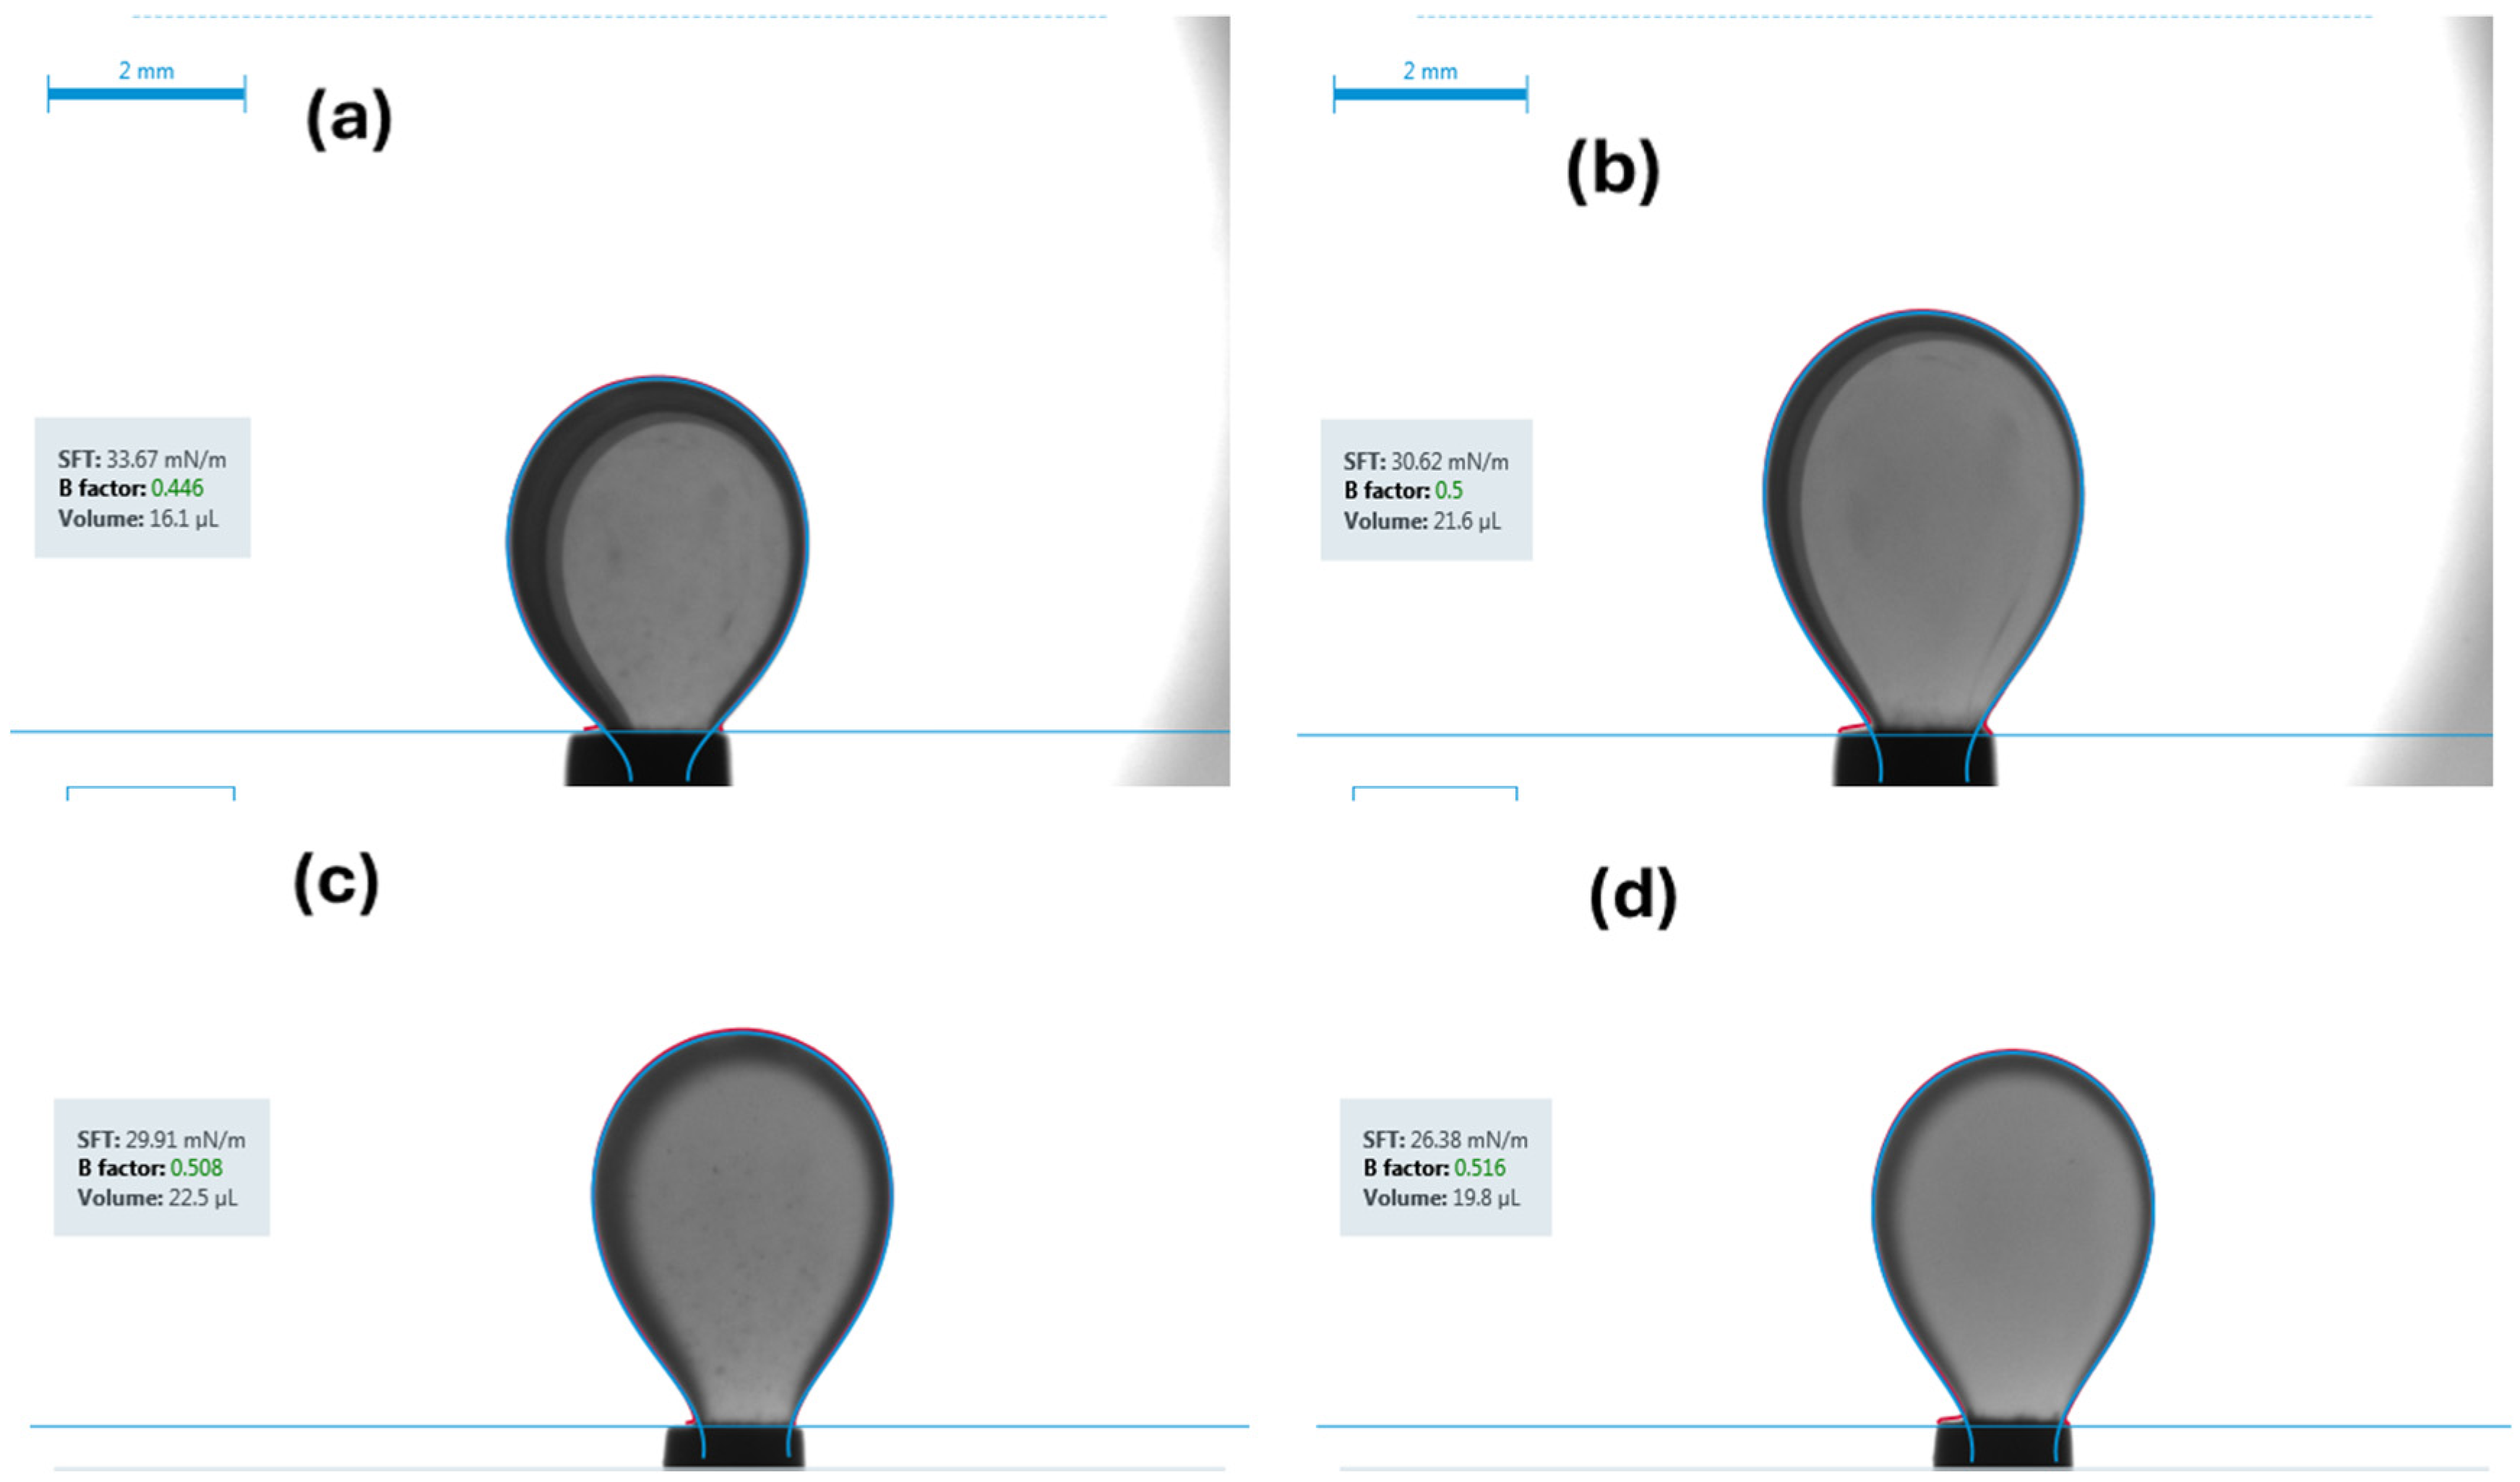
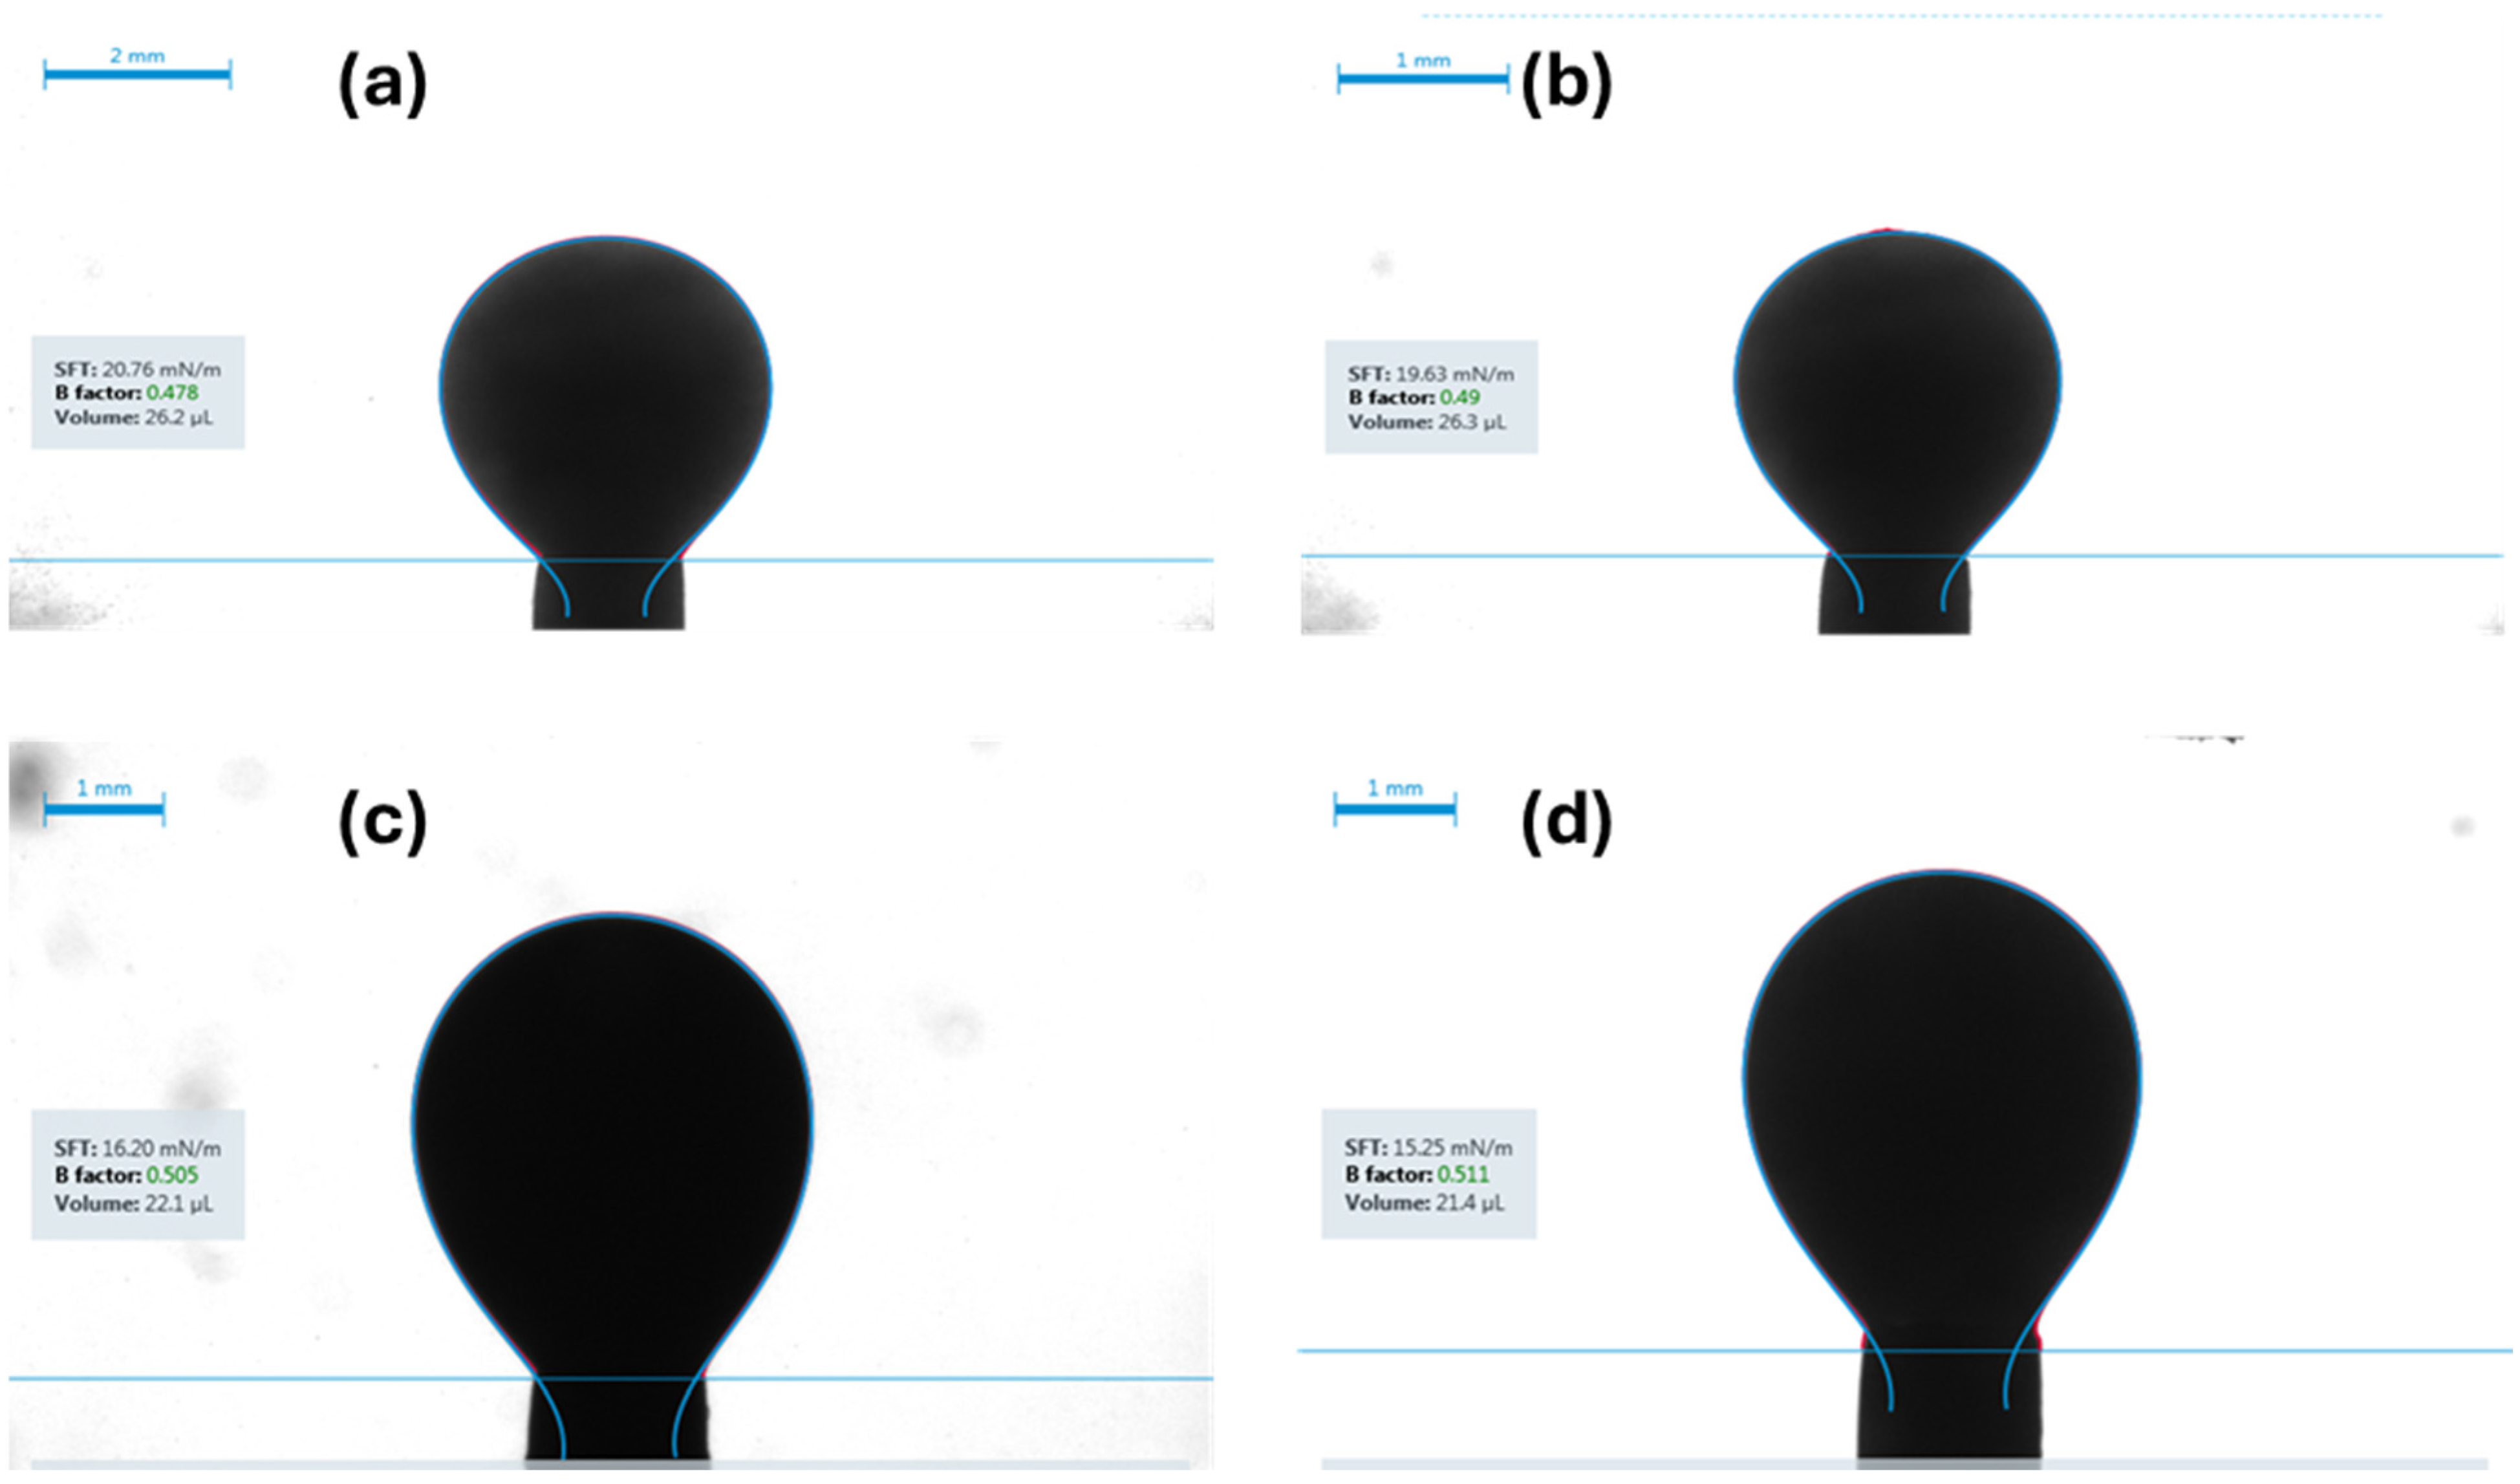
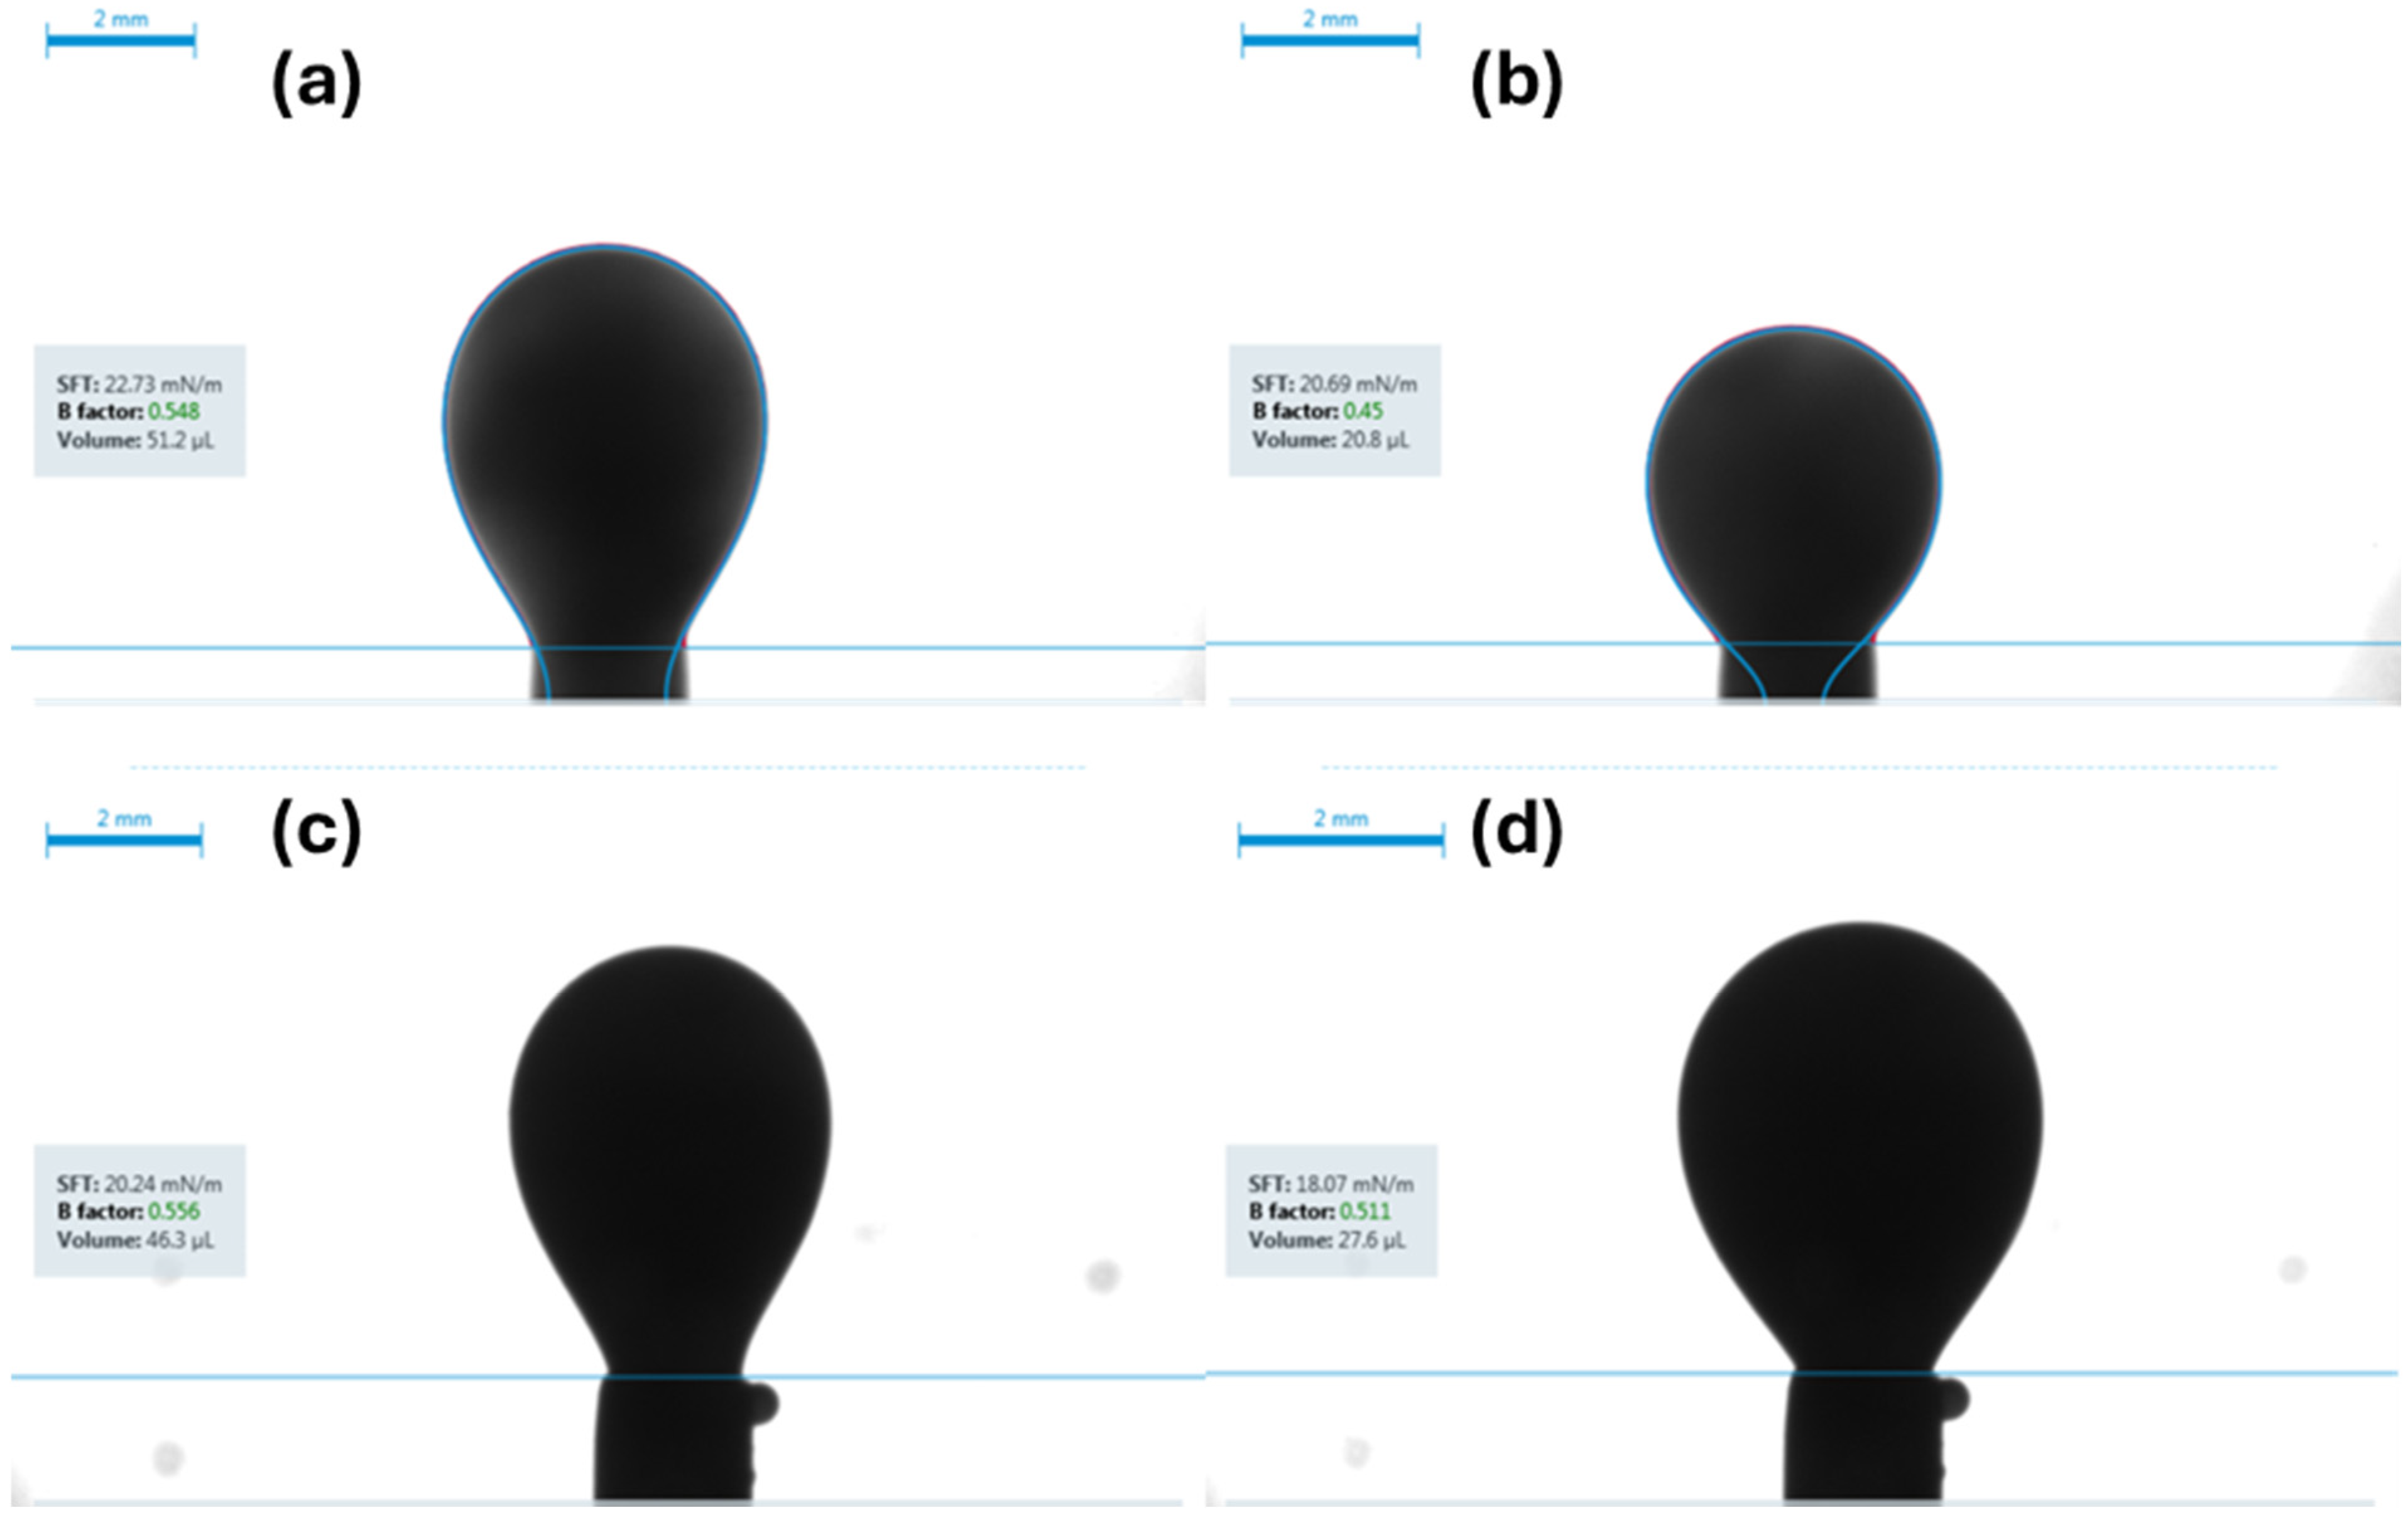
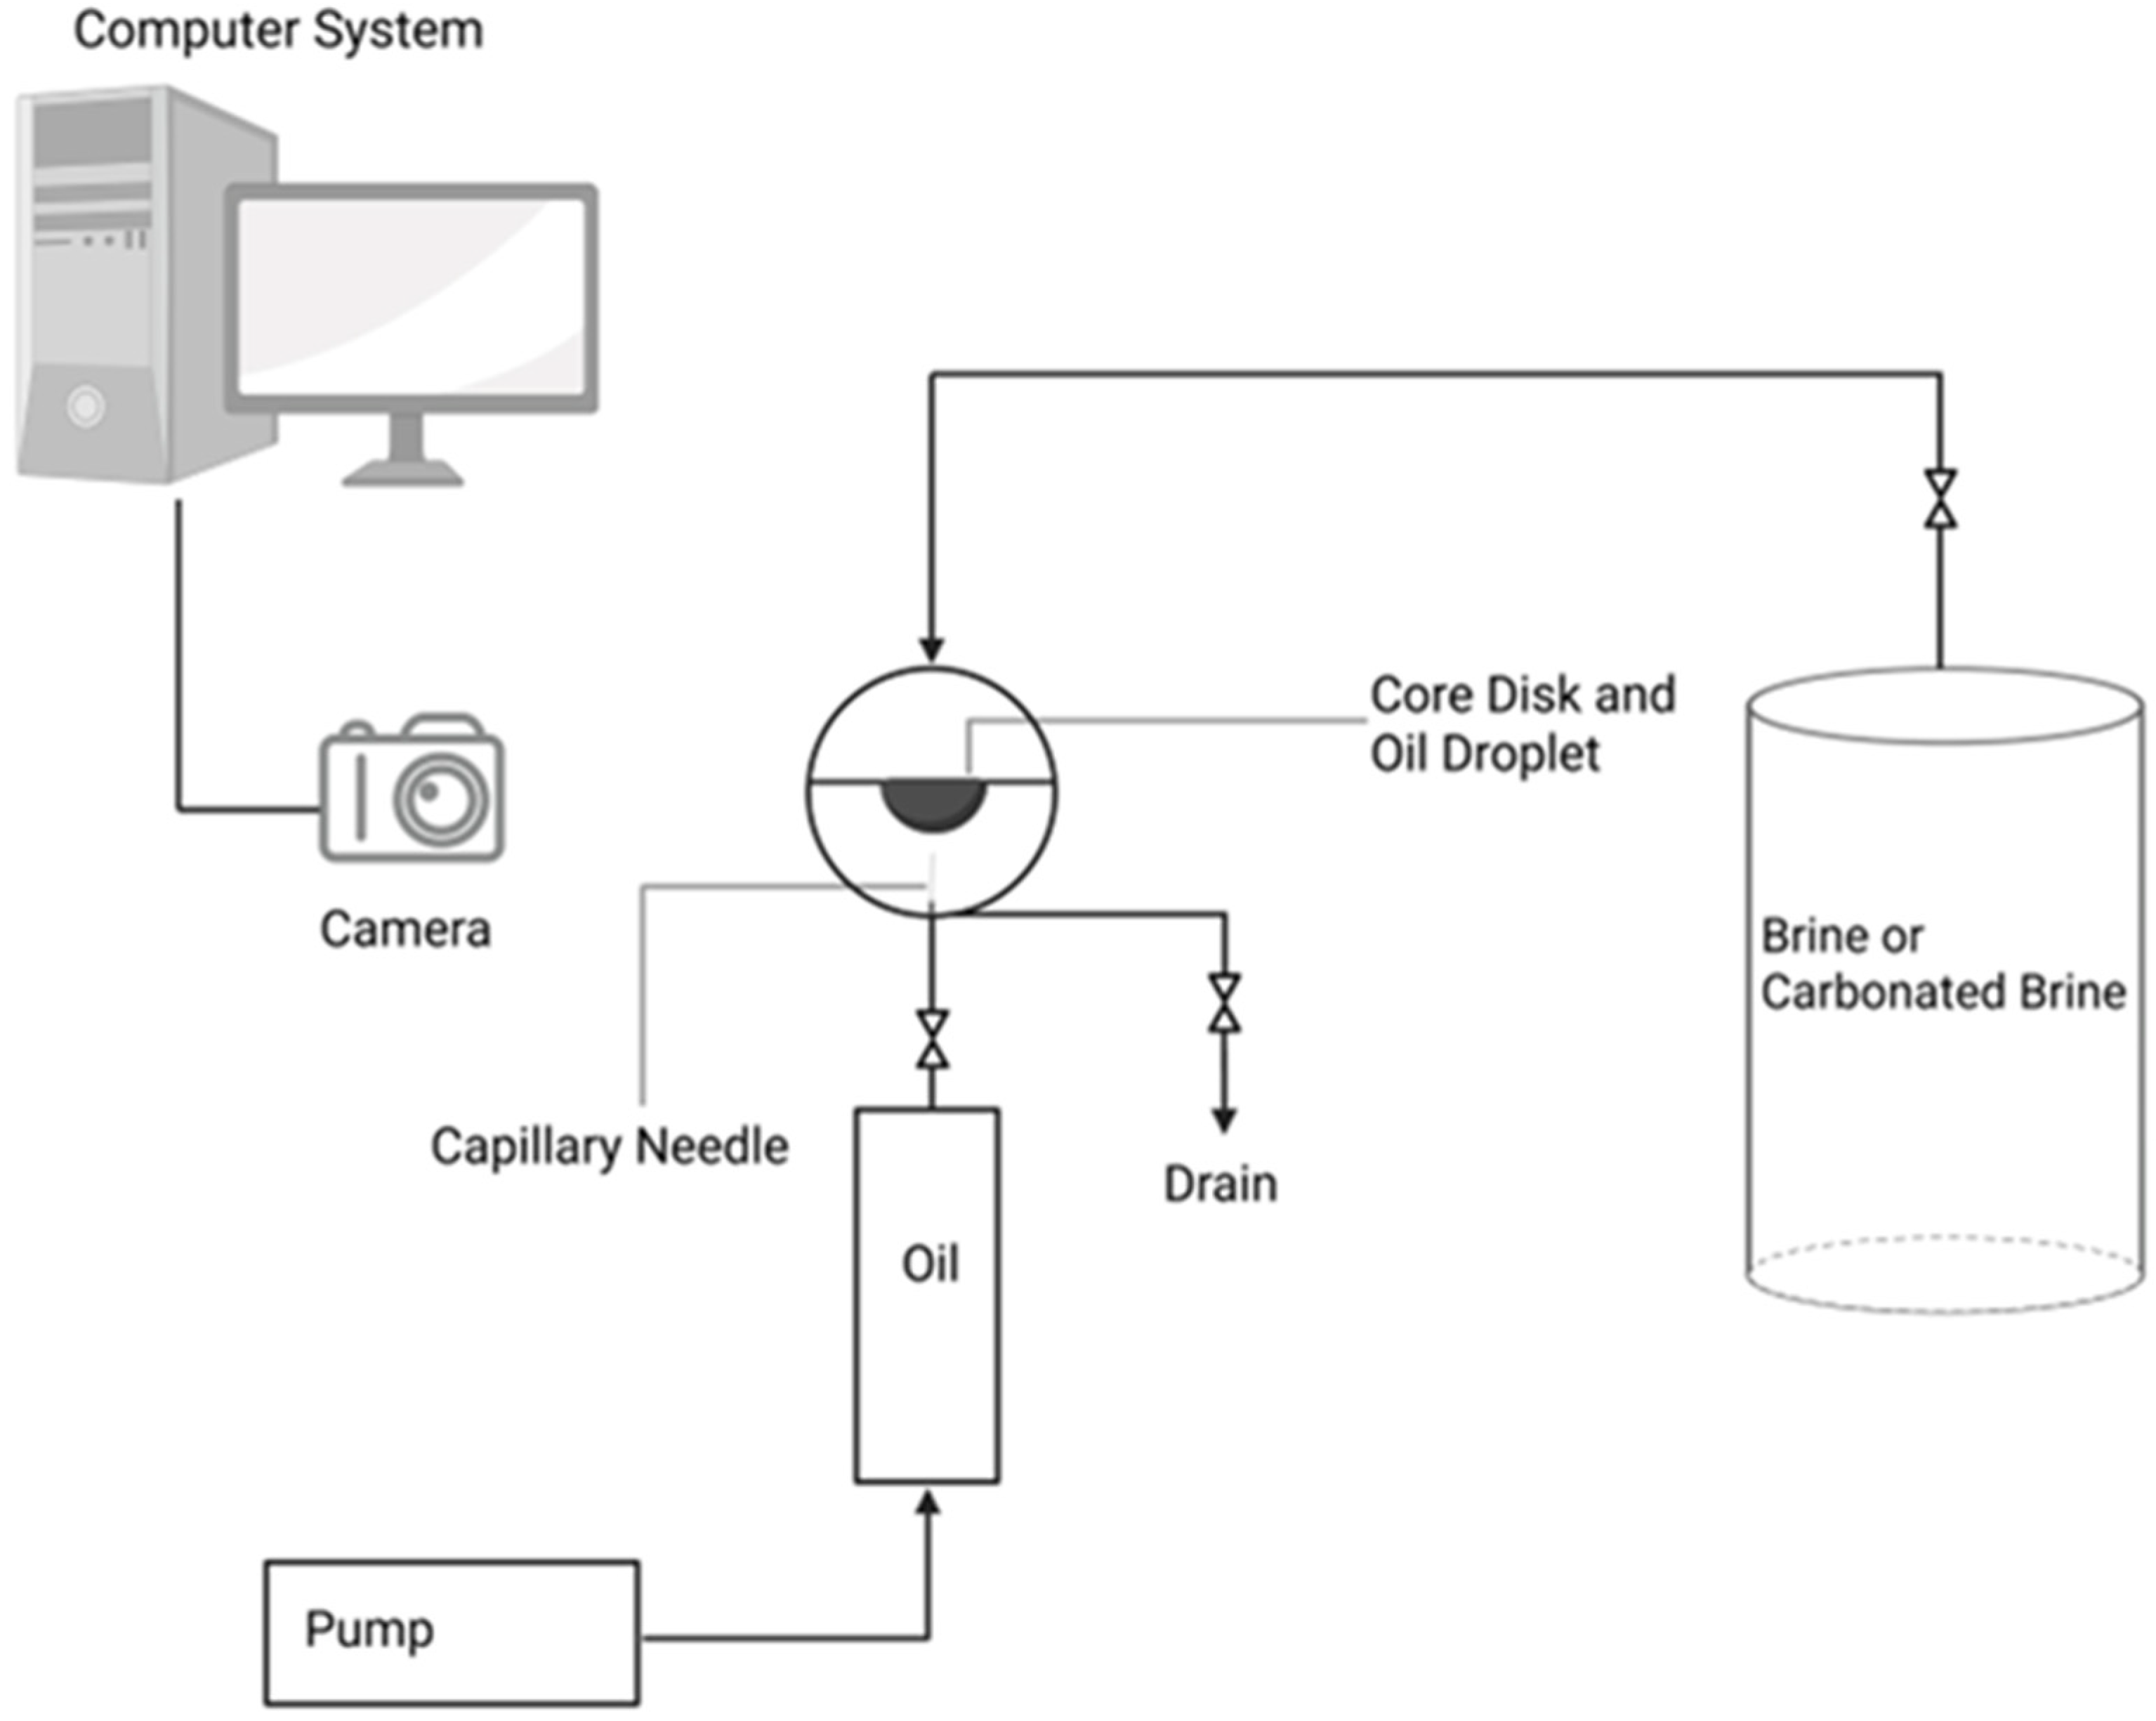
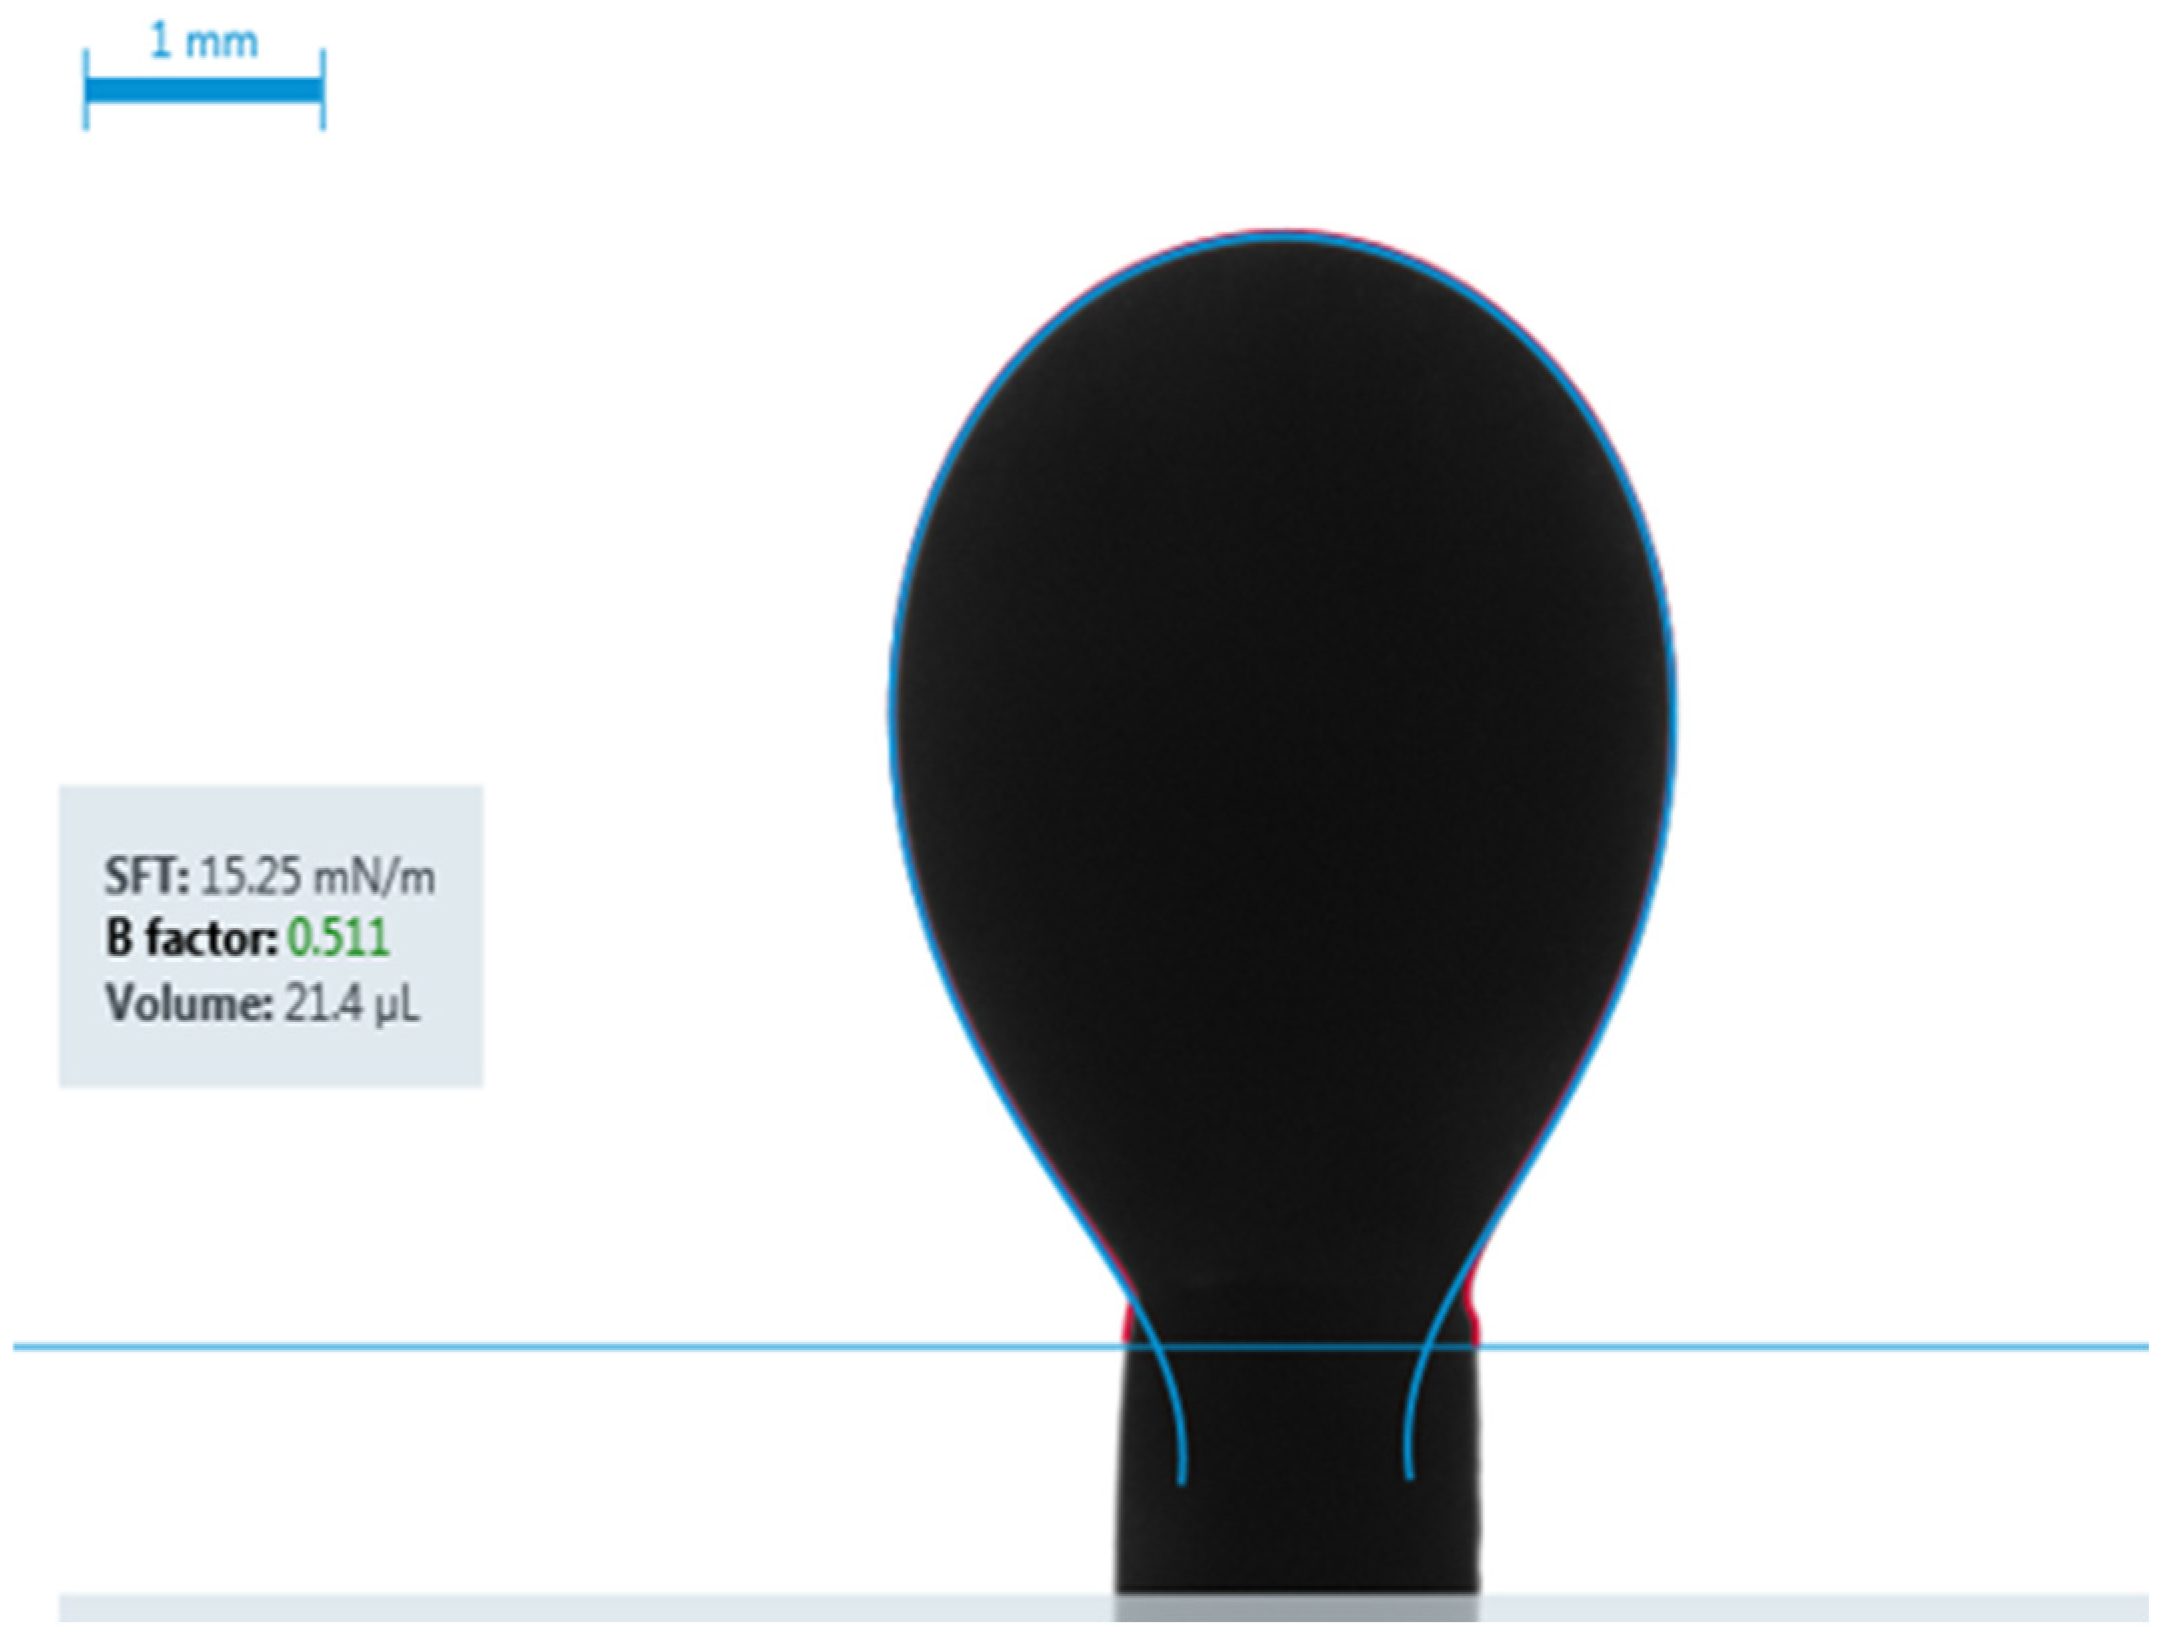
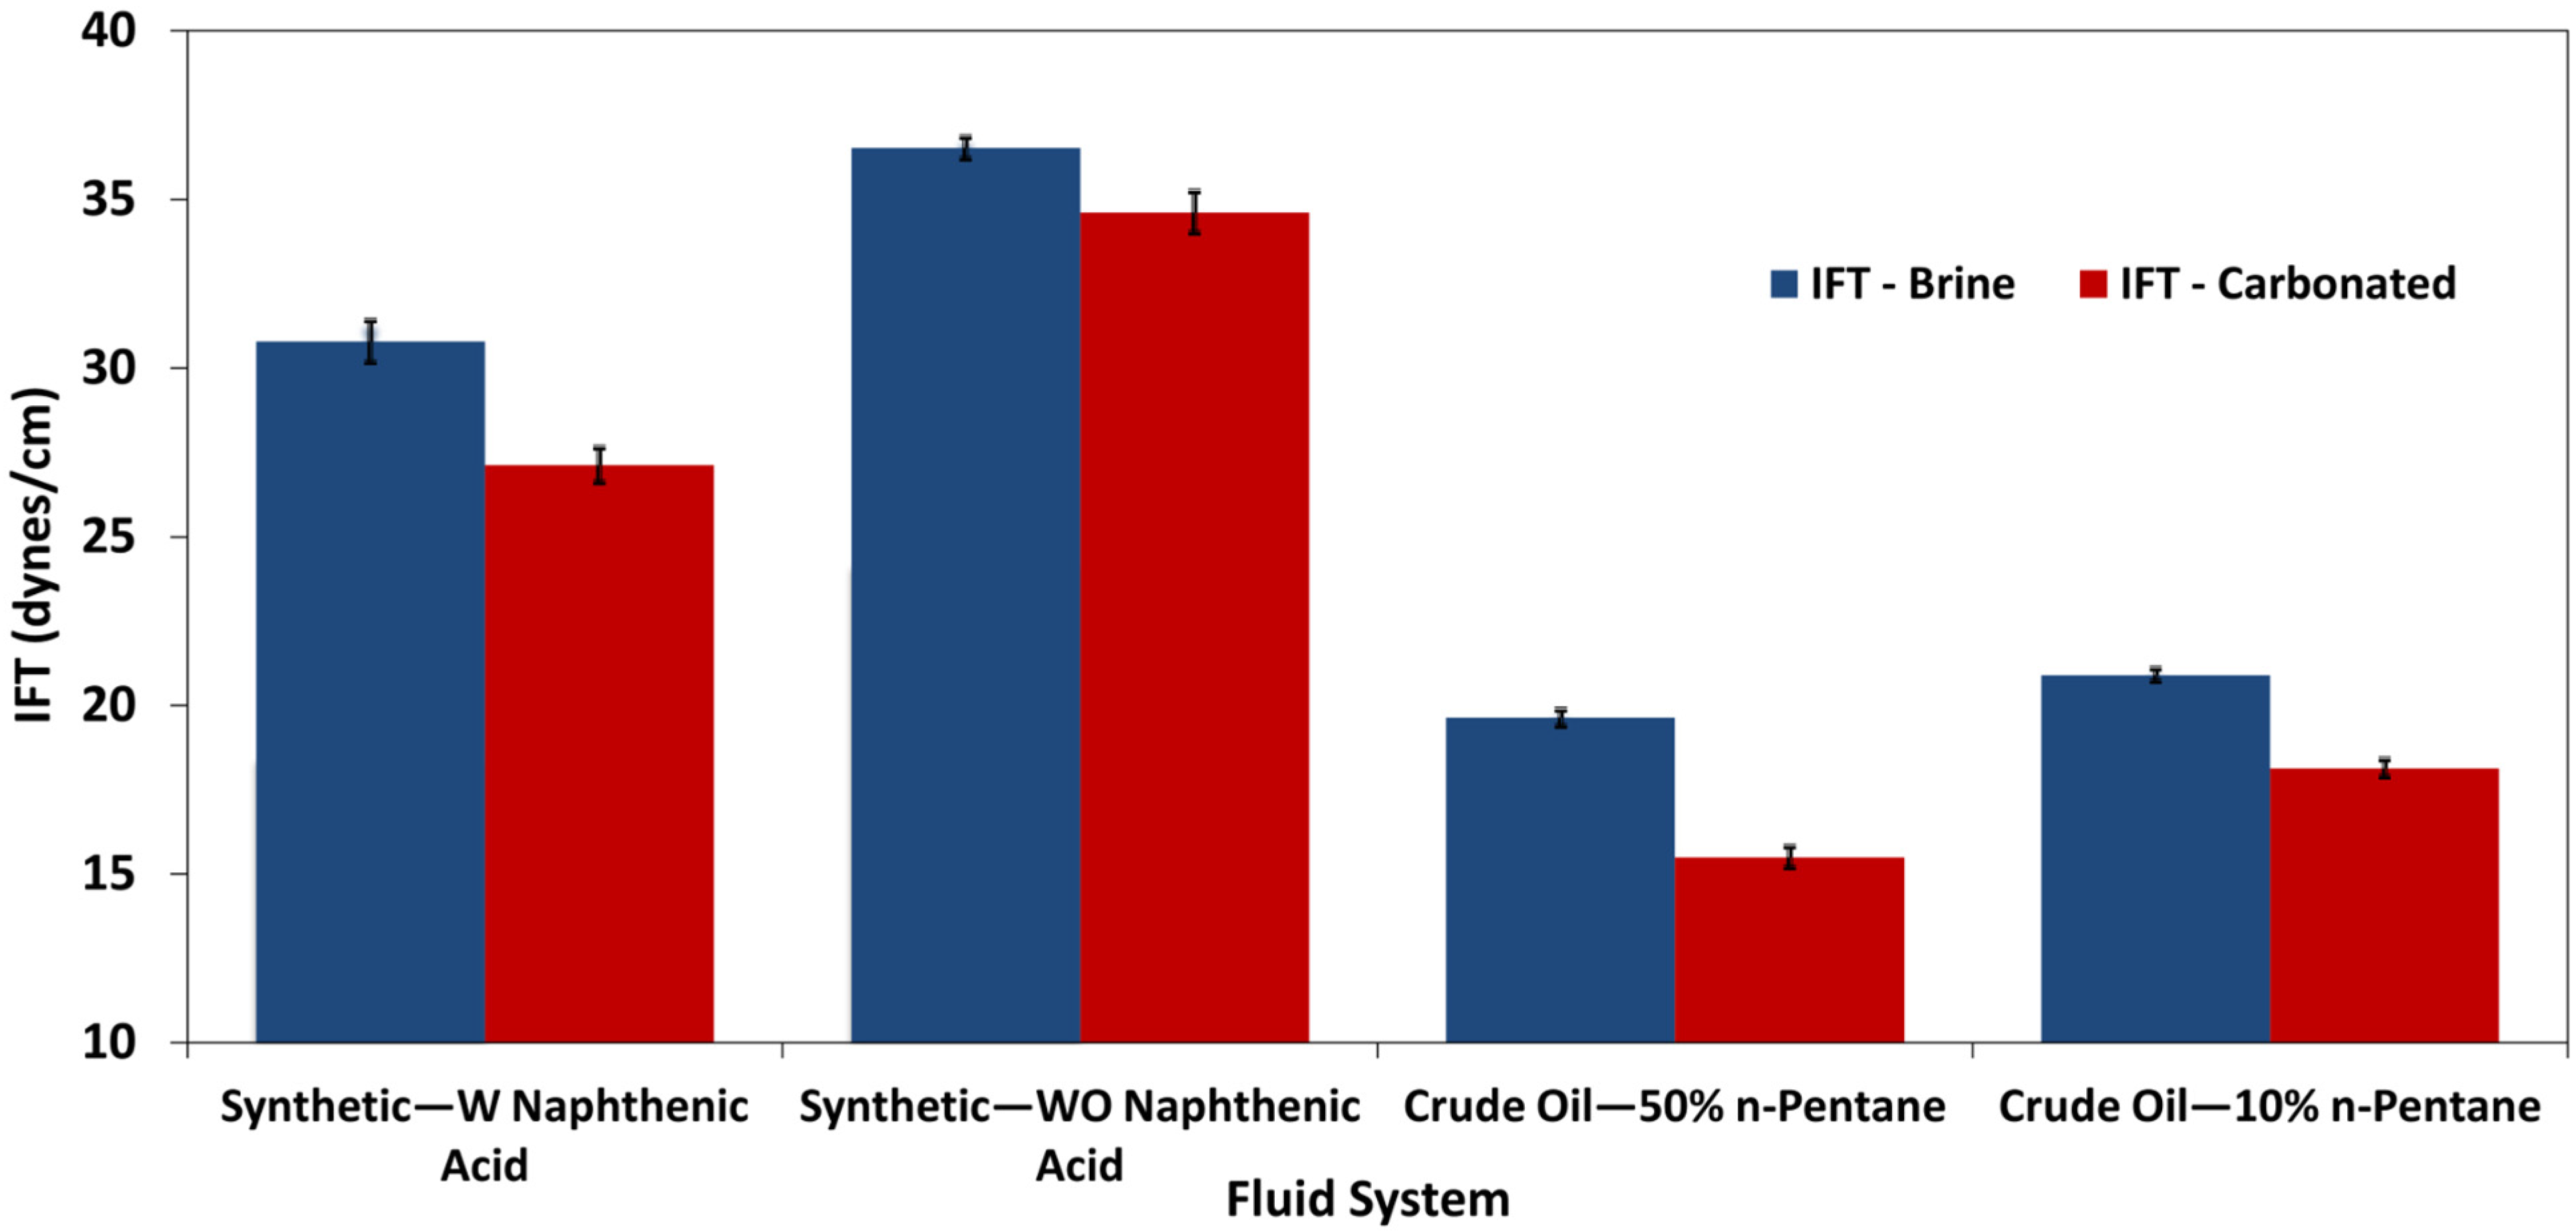
- IFT measurements: The IFT was measured using the pendant drop method for each of the four fluid systems while in contact with both brine and carbonated brine under both ambient and reservoir conditions.
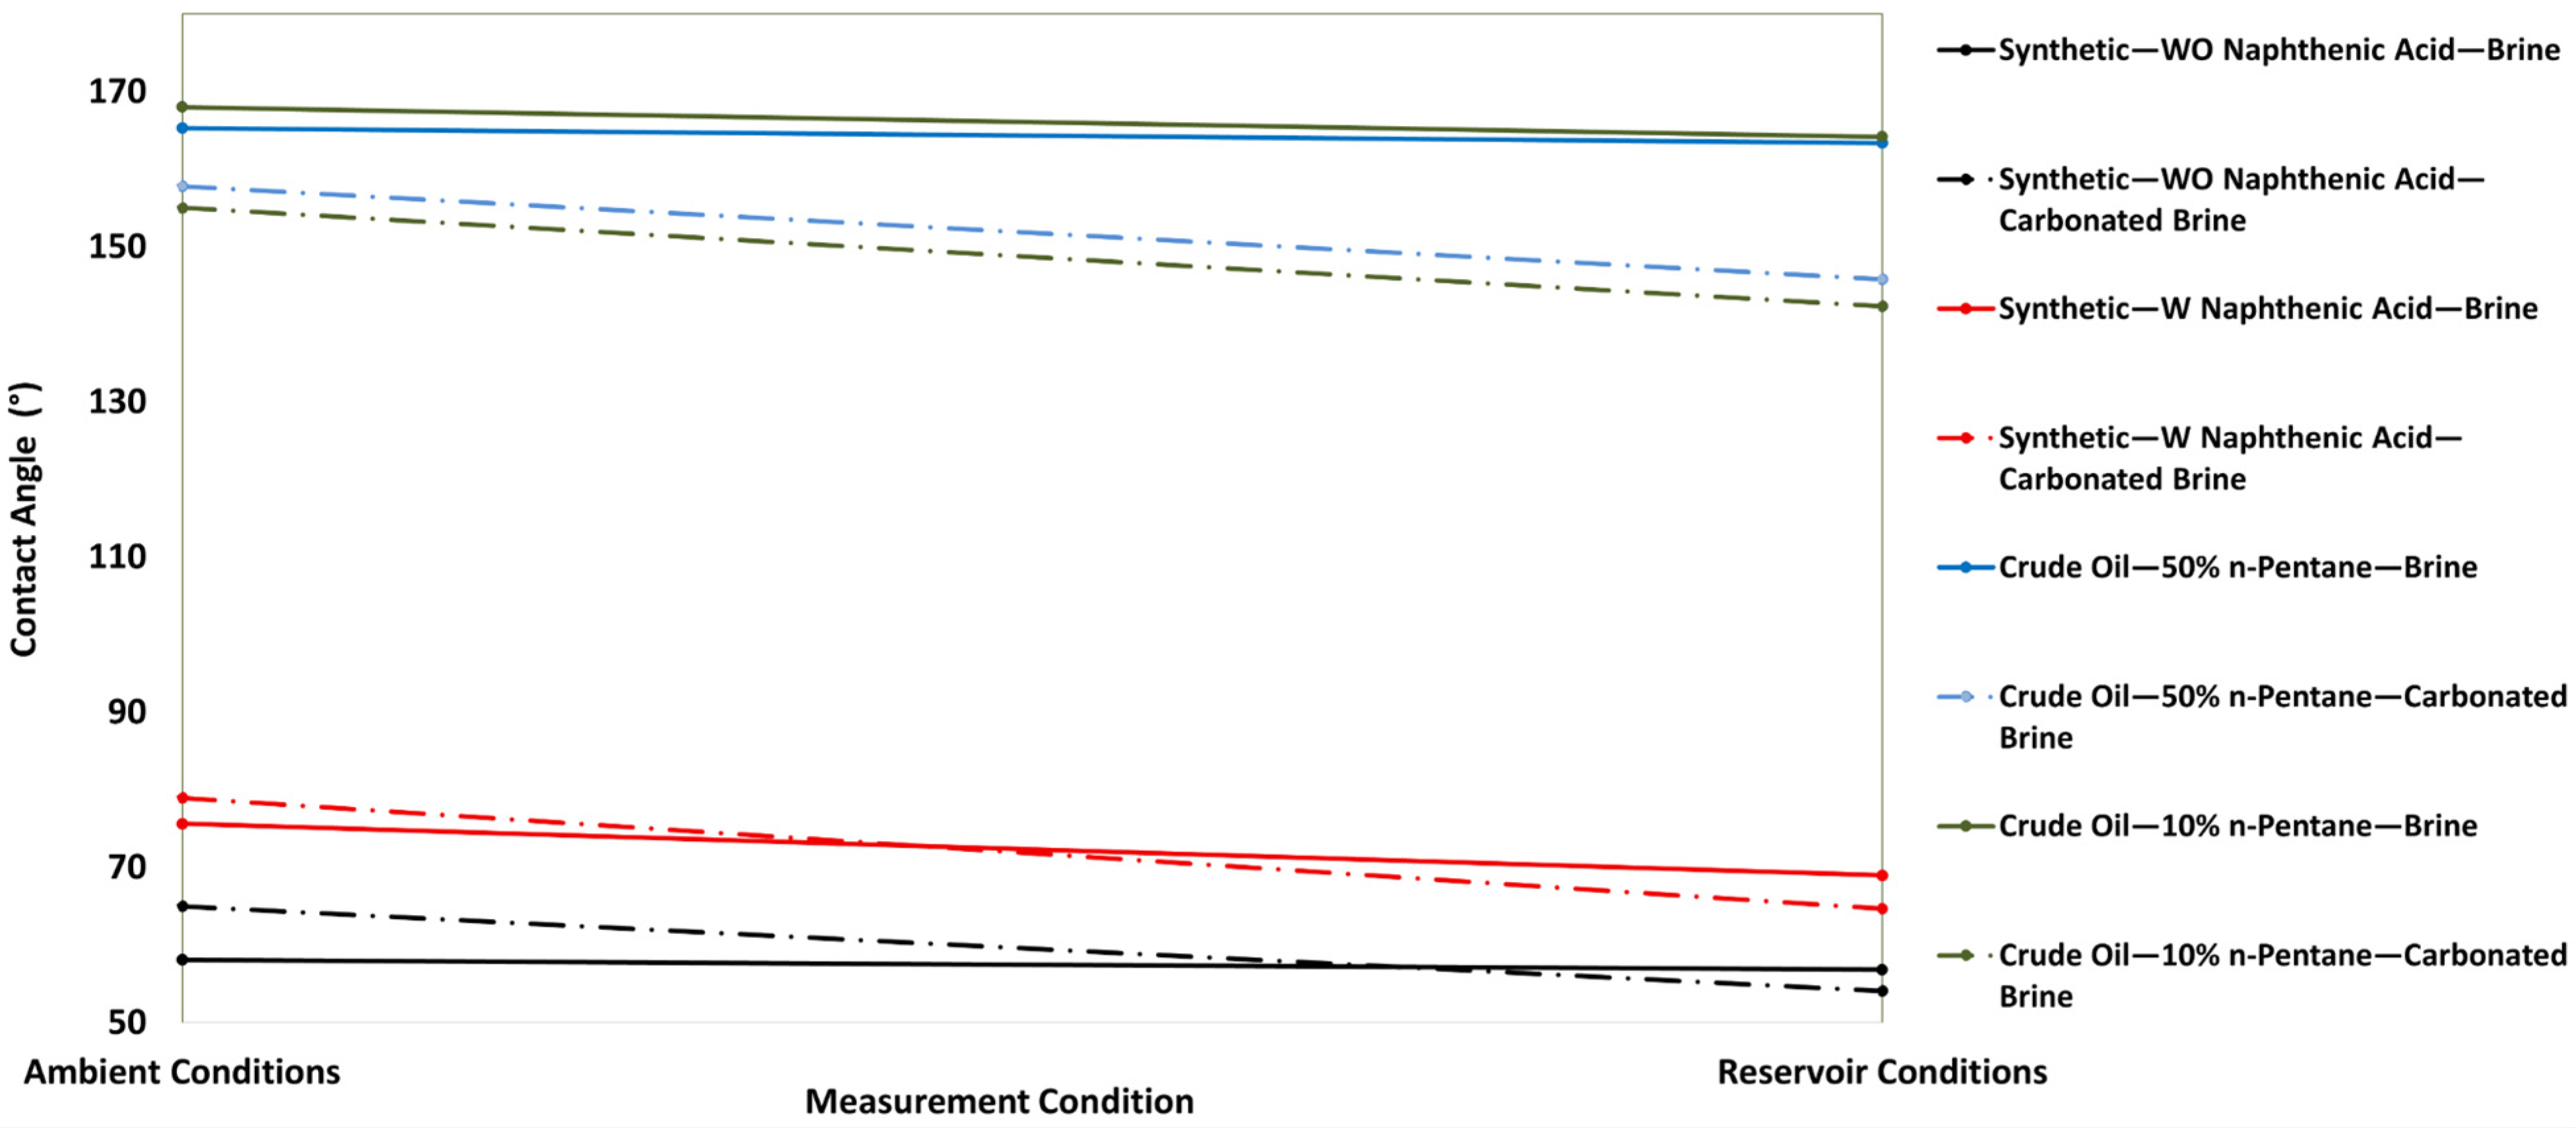
- Contact angle measurements: Fluid-system droplets were placed on a core disk surrounded by the designated surrounding phase, and the contact angle was measured using the captive droplet method under both ambient and reservoir conditions.
2.4. Experimental Measurement Procedures
2.5. Repeatability and Quality Control
3. Results
3.1. Visualization of Results
3.2. Numerical Model: Purpose of Experimental Validation
3.3. Transfering Experimental Results to Numerical Simulation
4. Discussion
5. Conclusions
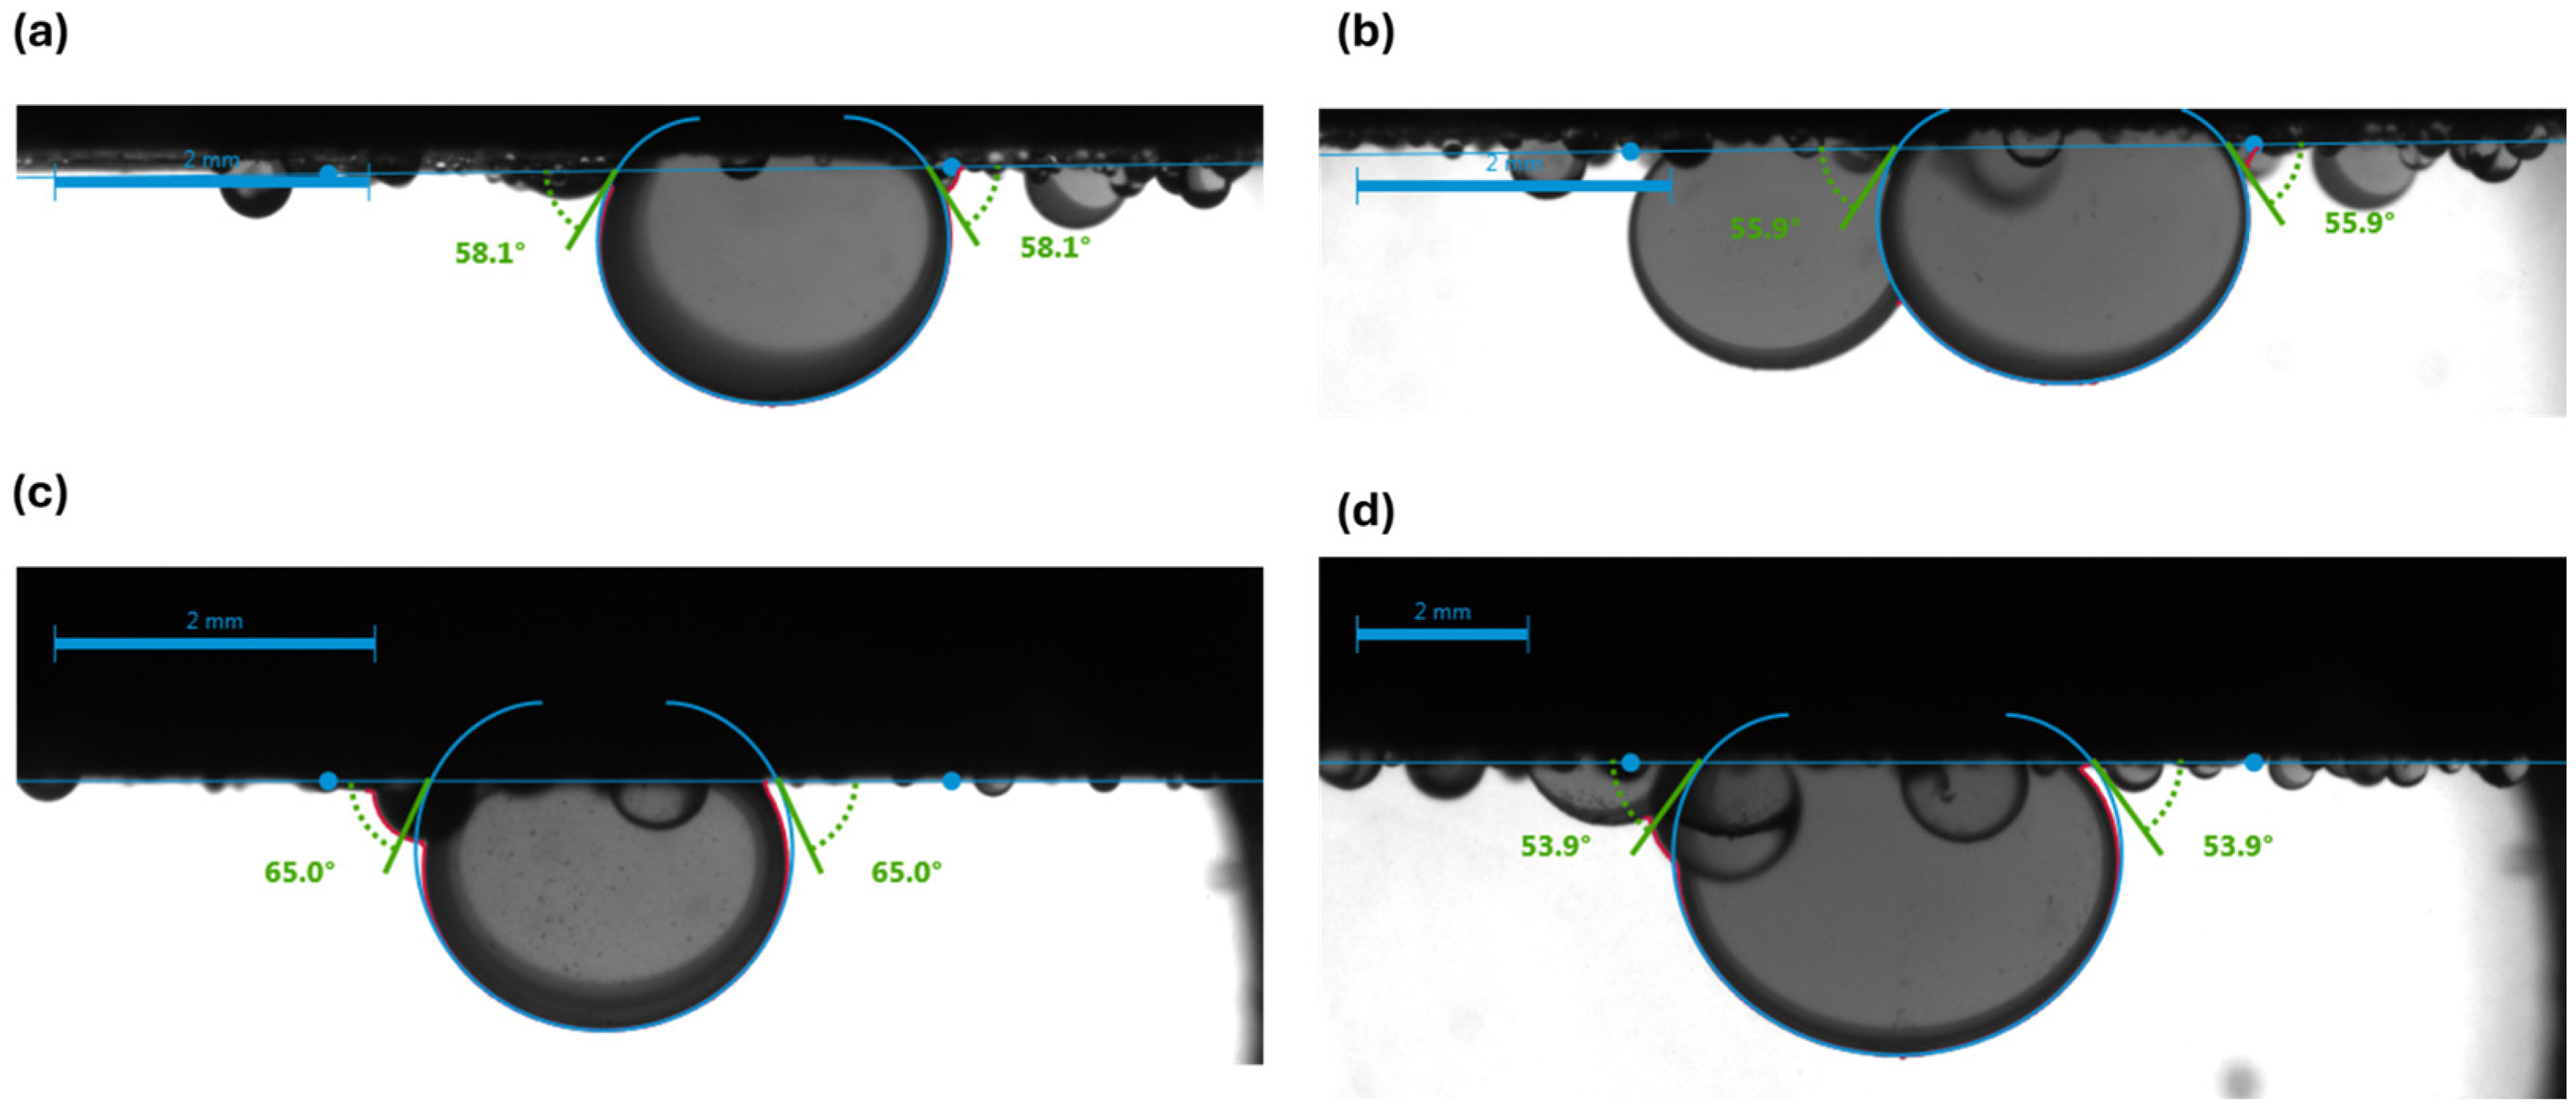
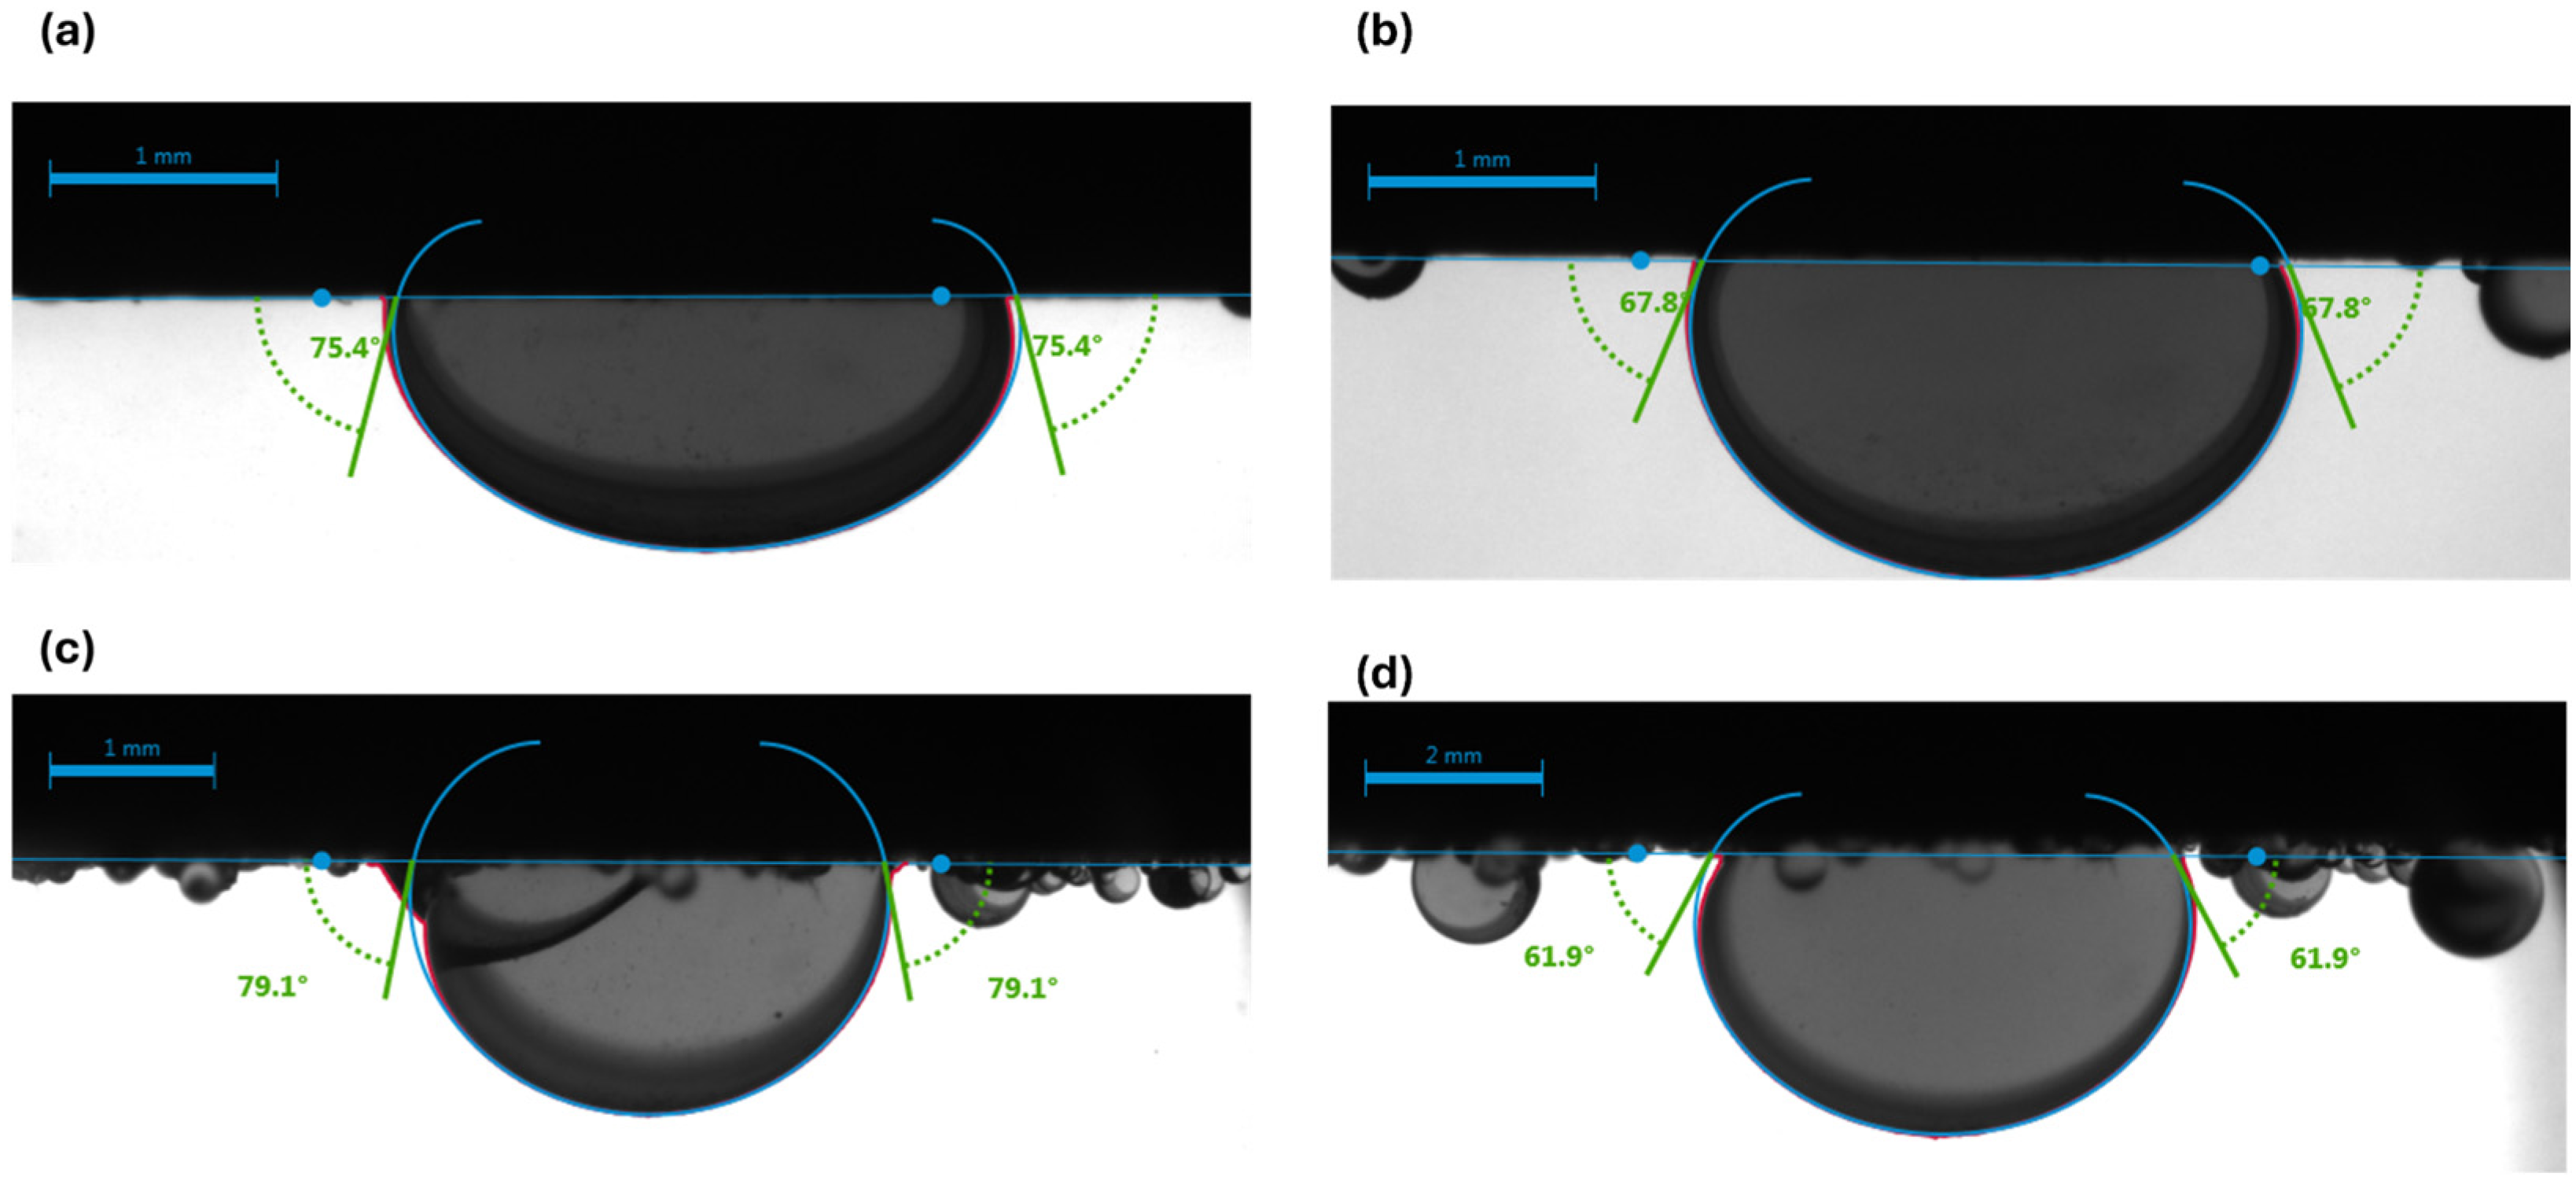
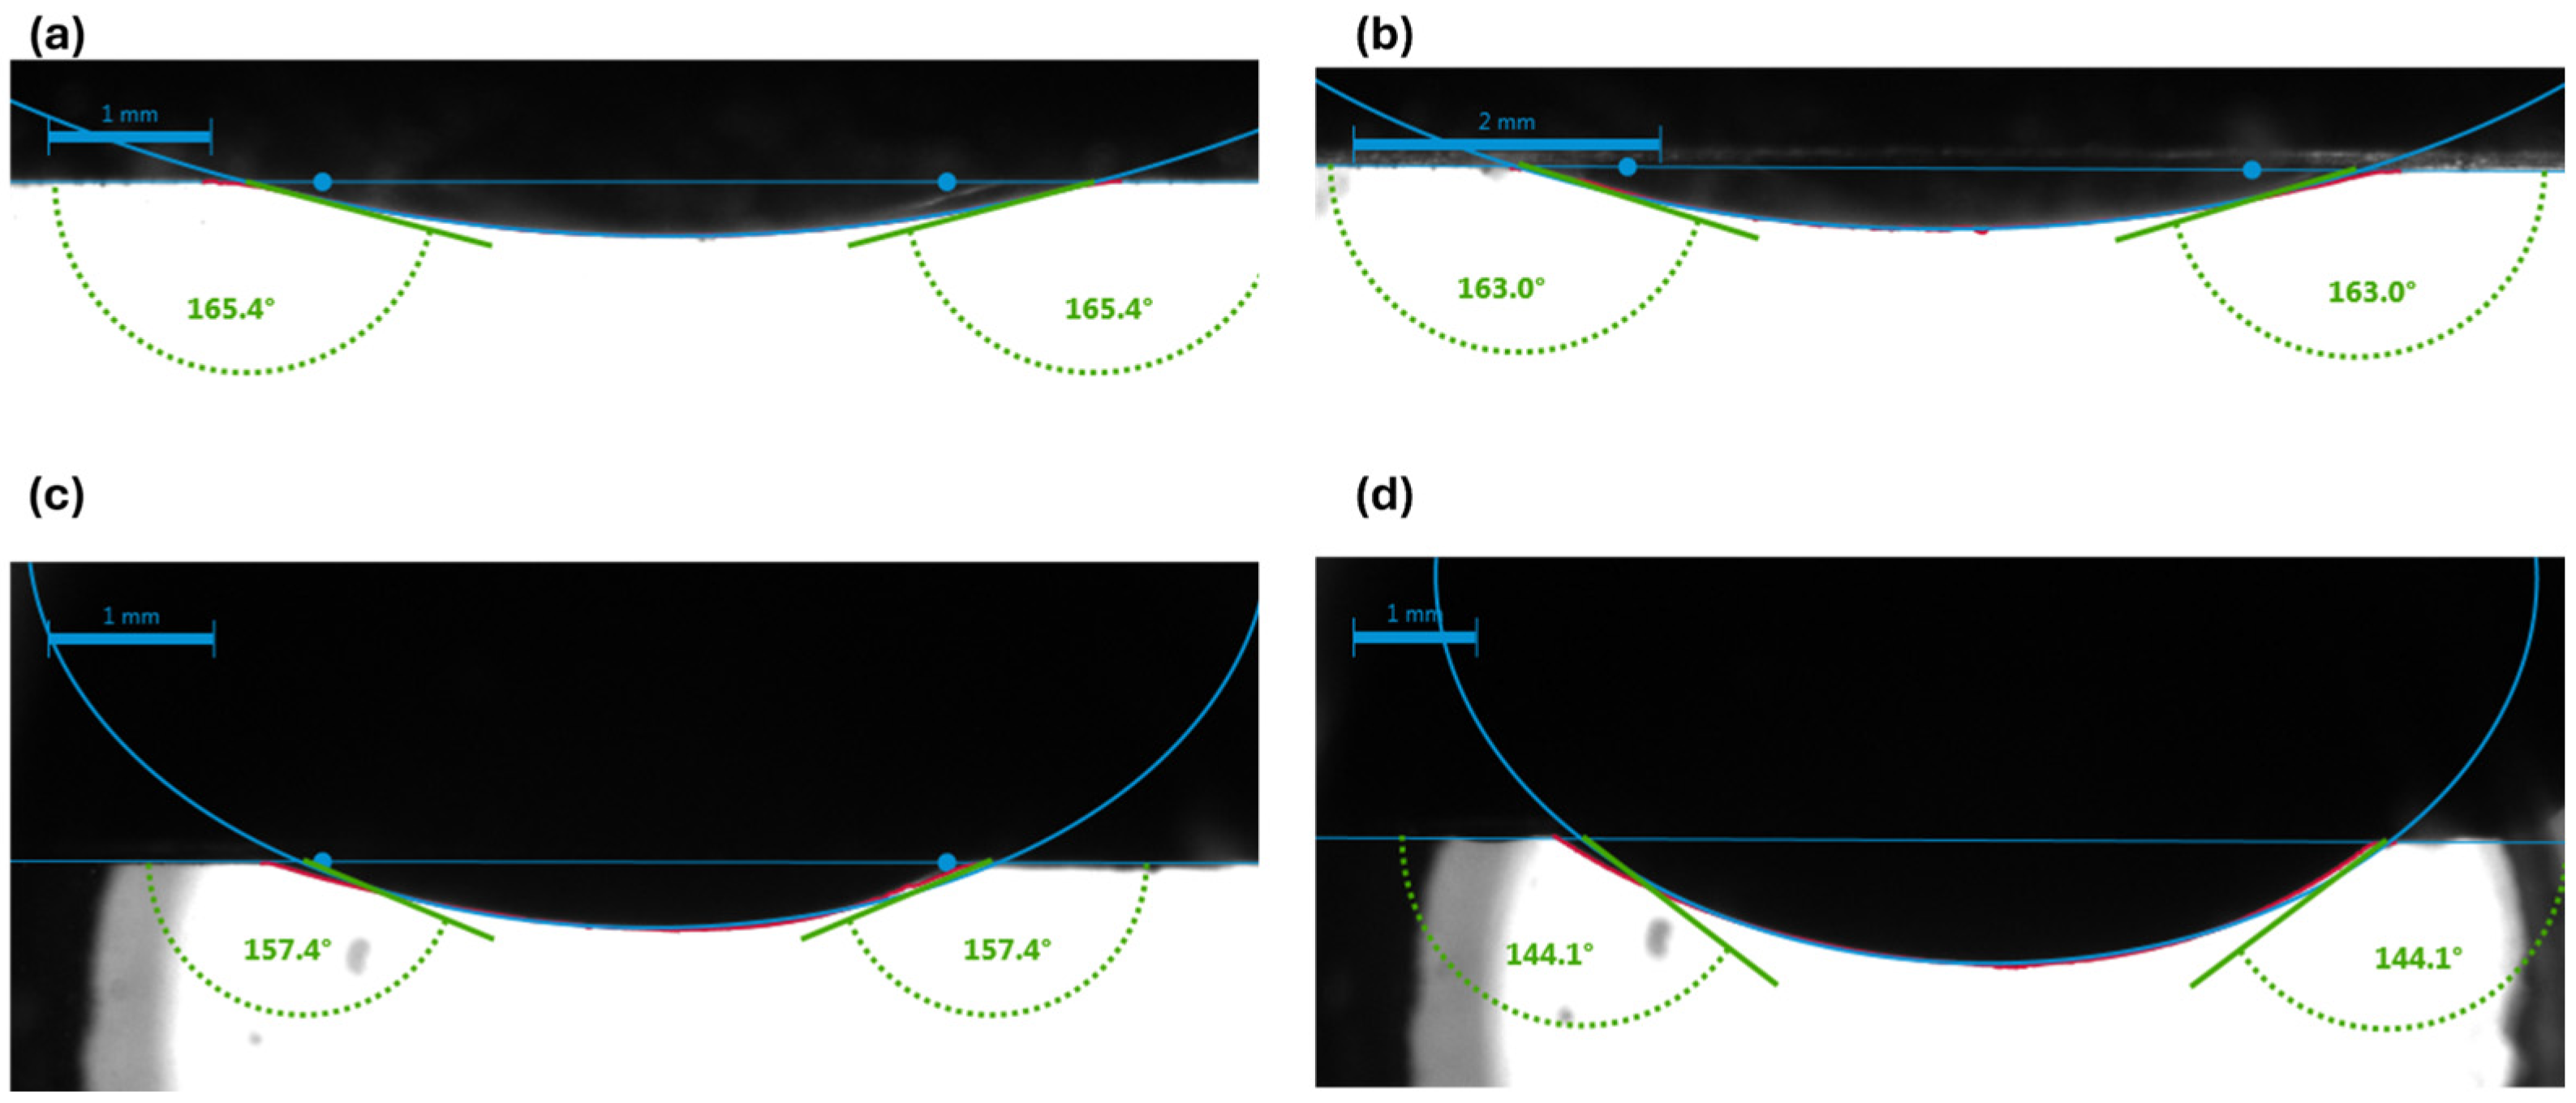
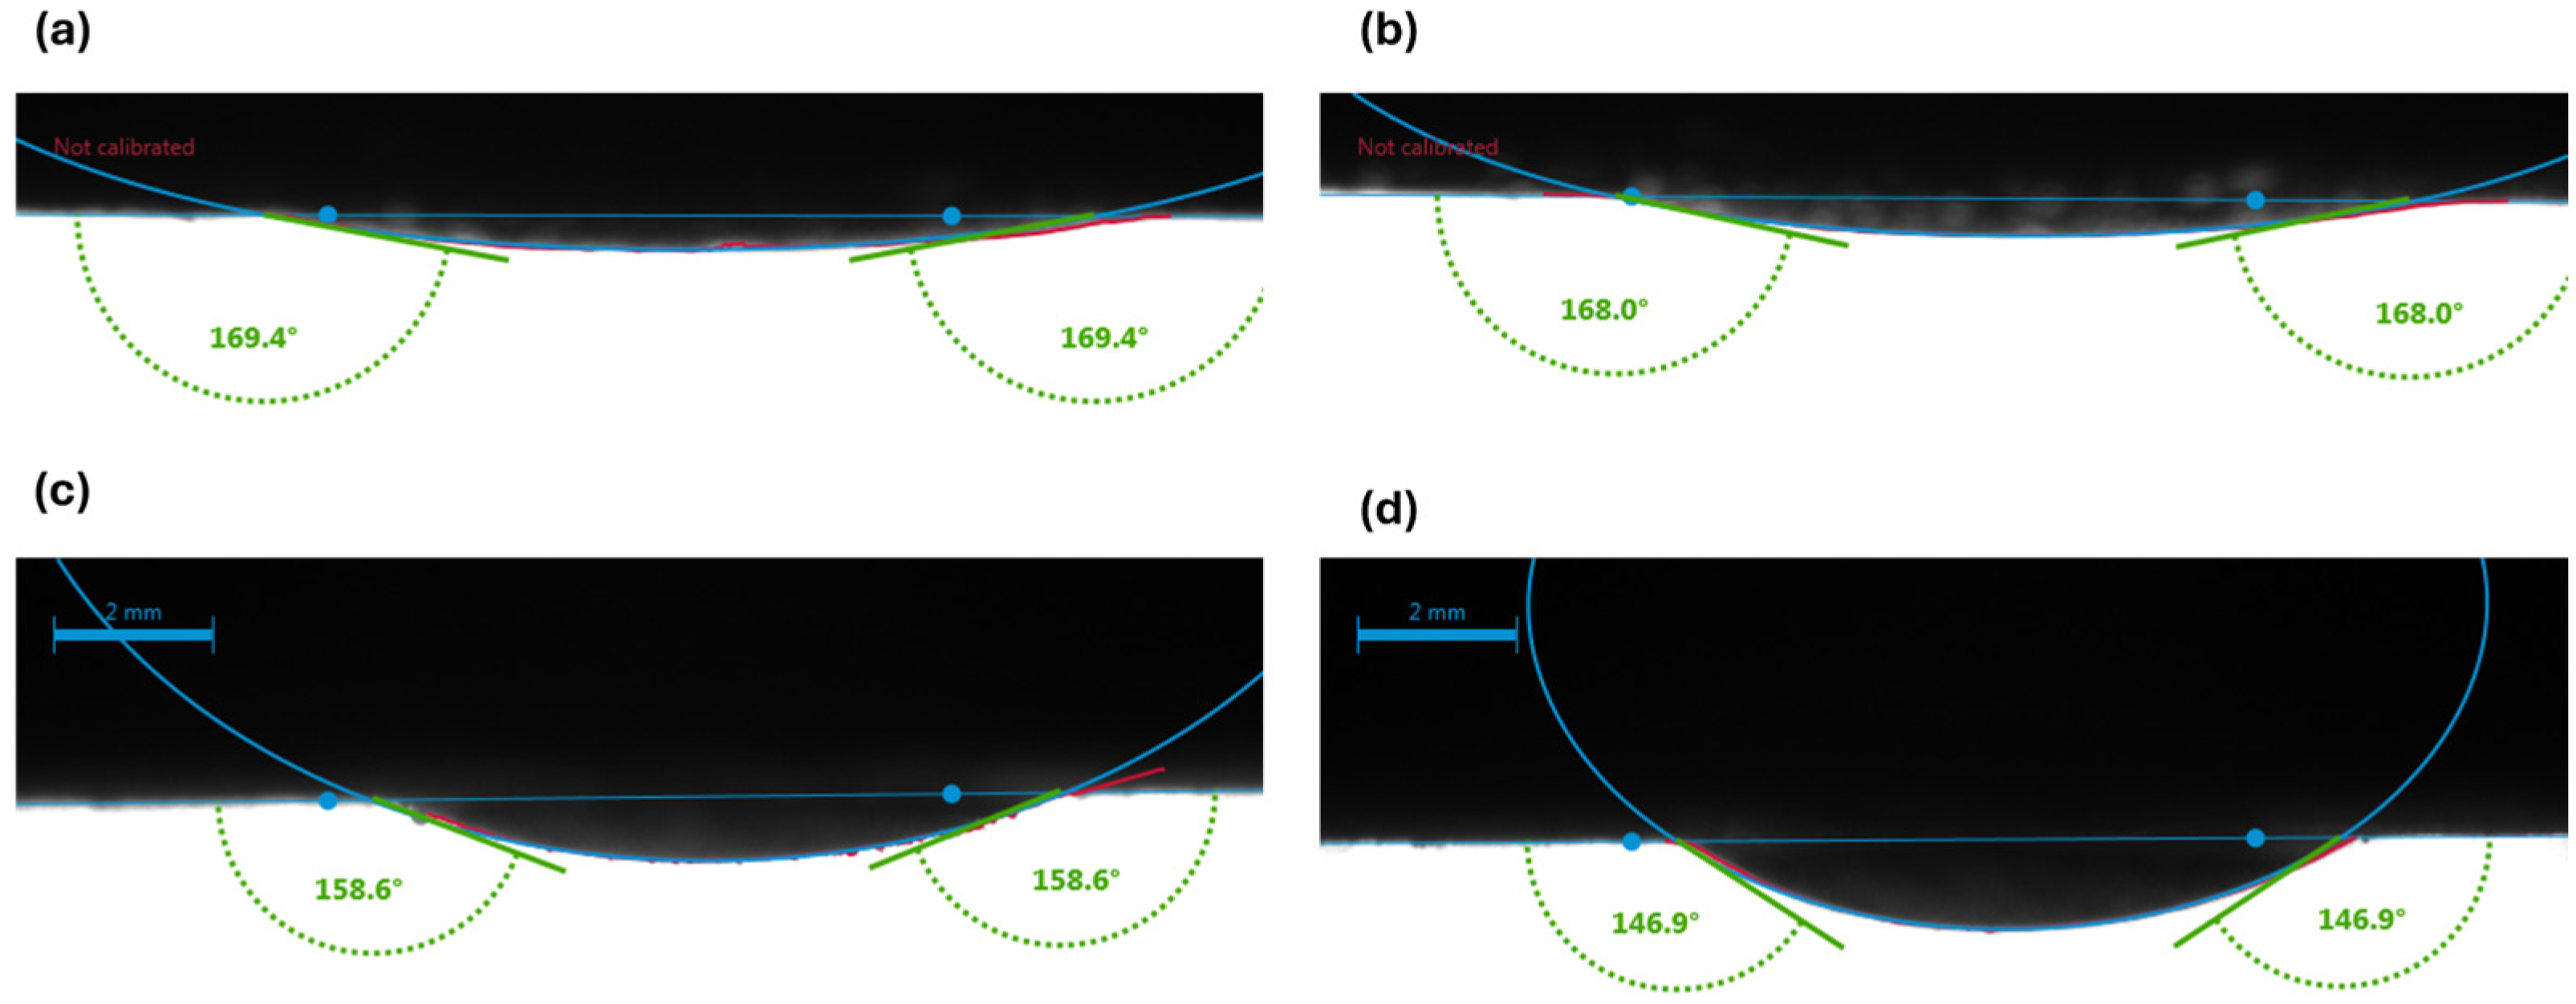
- Carbonated brine reduced the contact angle by 16.0–11.9° and interfacial tension by 2.0–4.1 dynes/cm, while standard brine caused only modest changes (1.6–6.7° and 1.3-3.32 dynes/cm but at a higher initial IFT. These measurements confirm wettability shifts under reservoir conditions.
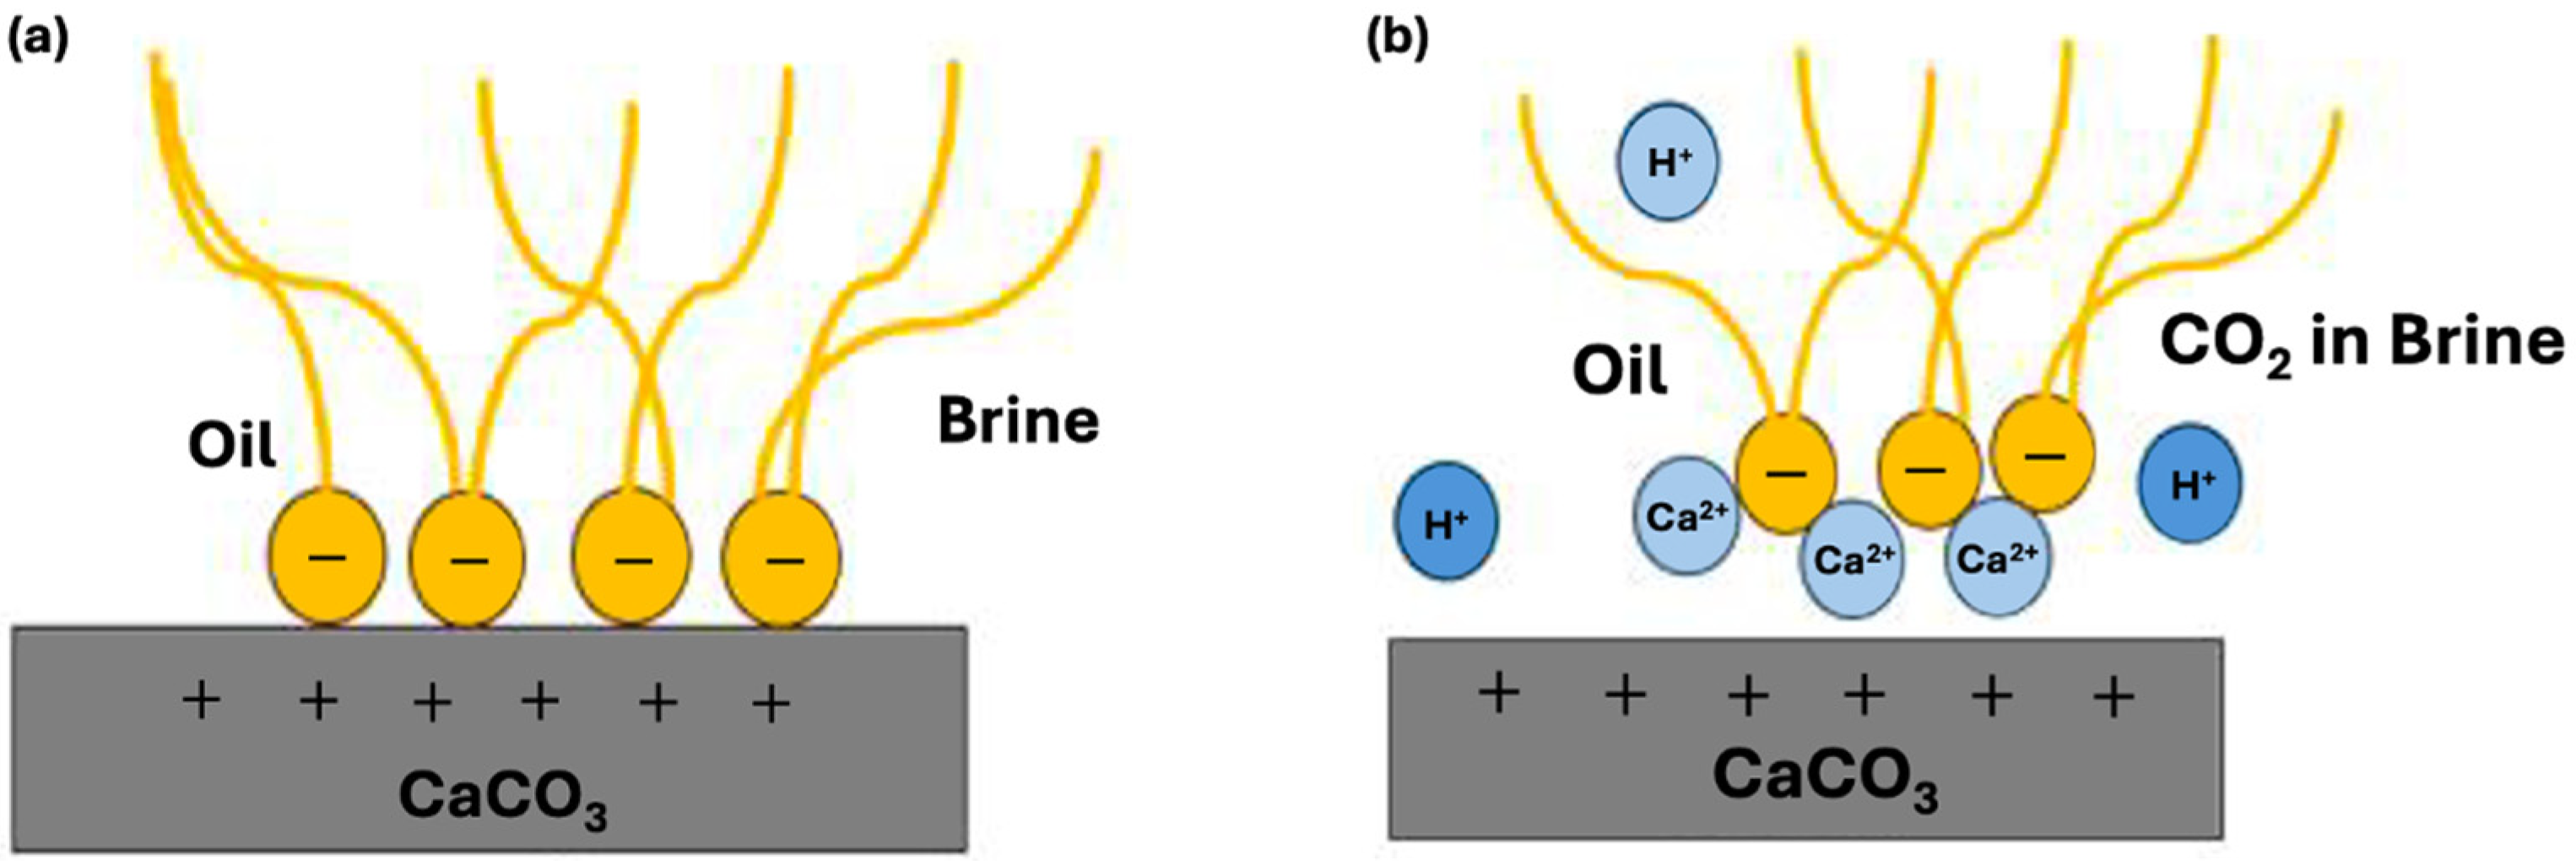
- Synthetic fluid containing naphthenic acid exhibits more oil-wet behavior initially, with a contact angle of 75.6 ± 0.20° in brine, compared with 58.6 ± 0.77° for synthetic fluid without naphthenic acid. This favorable shift is attributed to the adsorption of the acidic group from the carbonate surface, which enhances oil-wetness.
- Synthetic fluid with naphthenic acid also exhibits a greater wettability shift toward water-wetness when exposed to carbonated brine (a reduction of 16° vs. 12.8° in systems without naphthenic acid). Furthermore, naphthenic acid promotes alterations in wettability, which is consistent with the observed increase in acidity in our crude oil measurements.
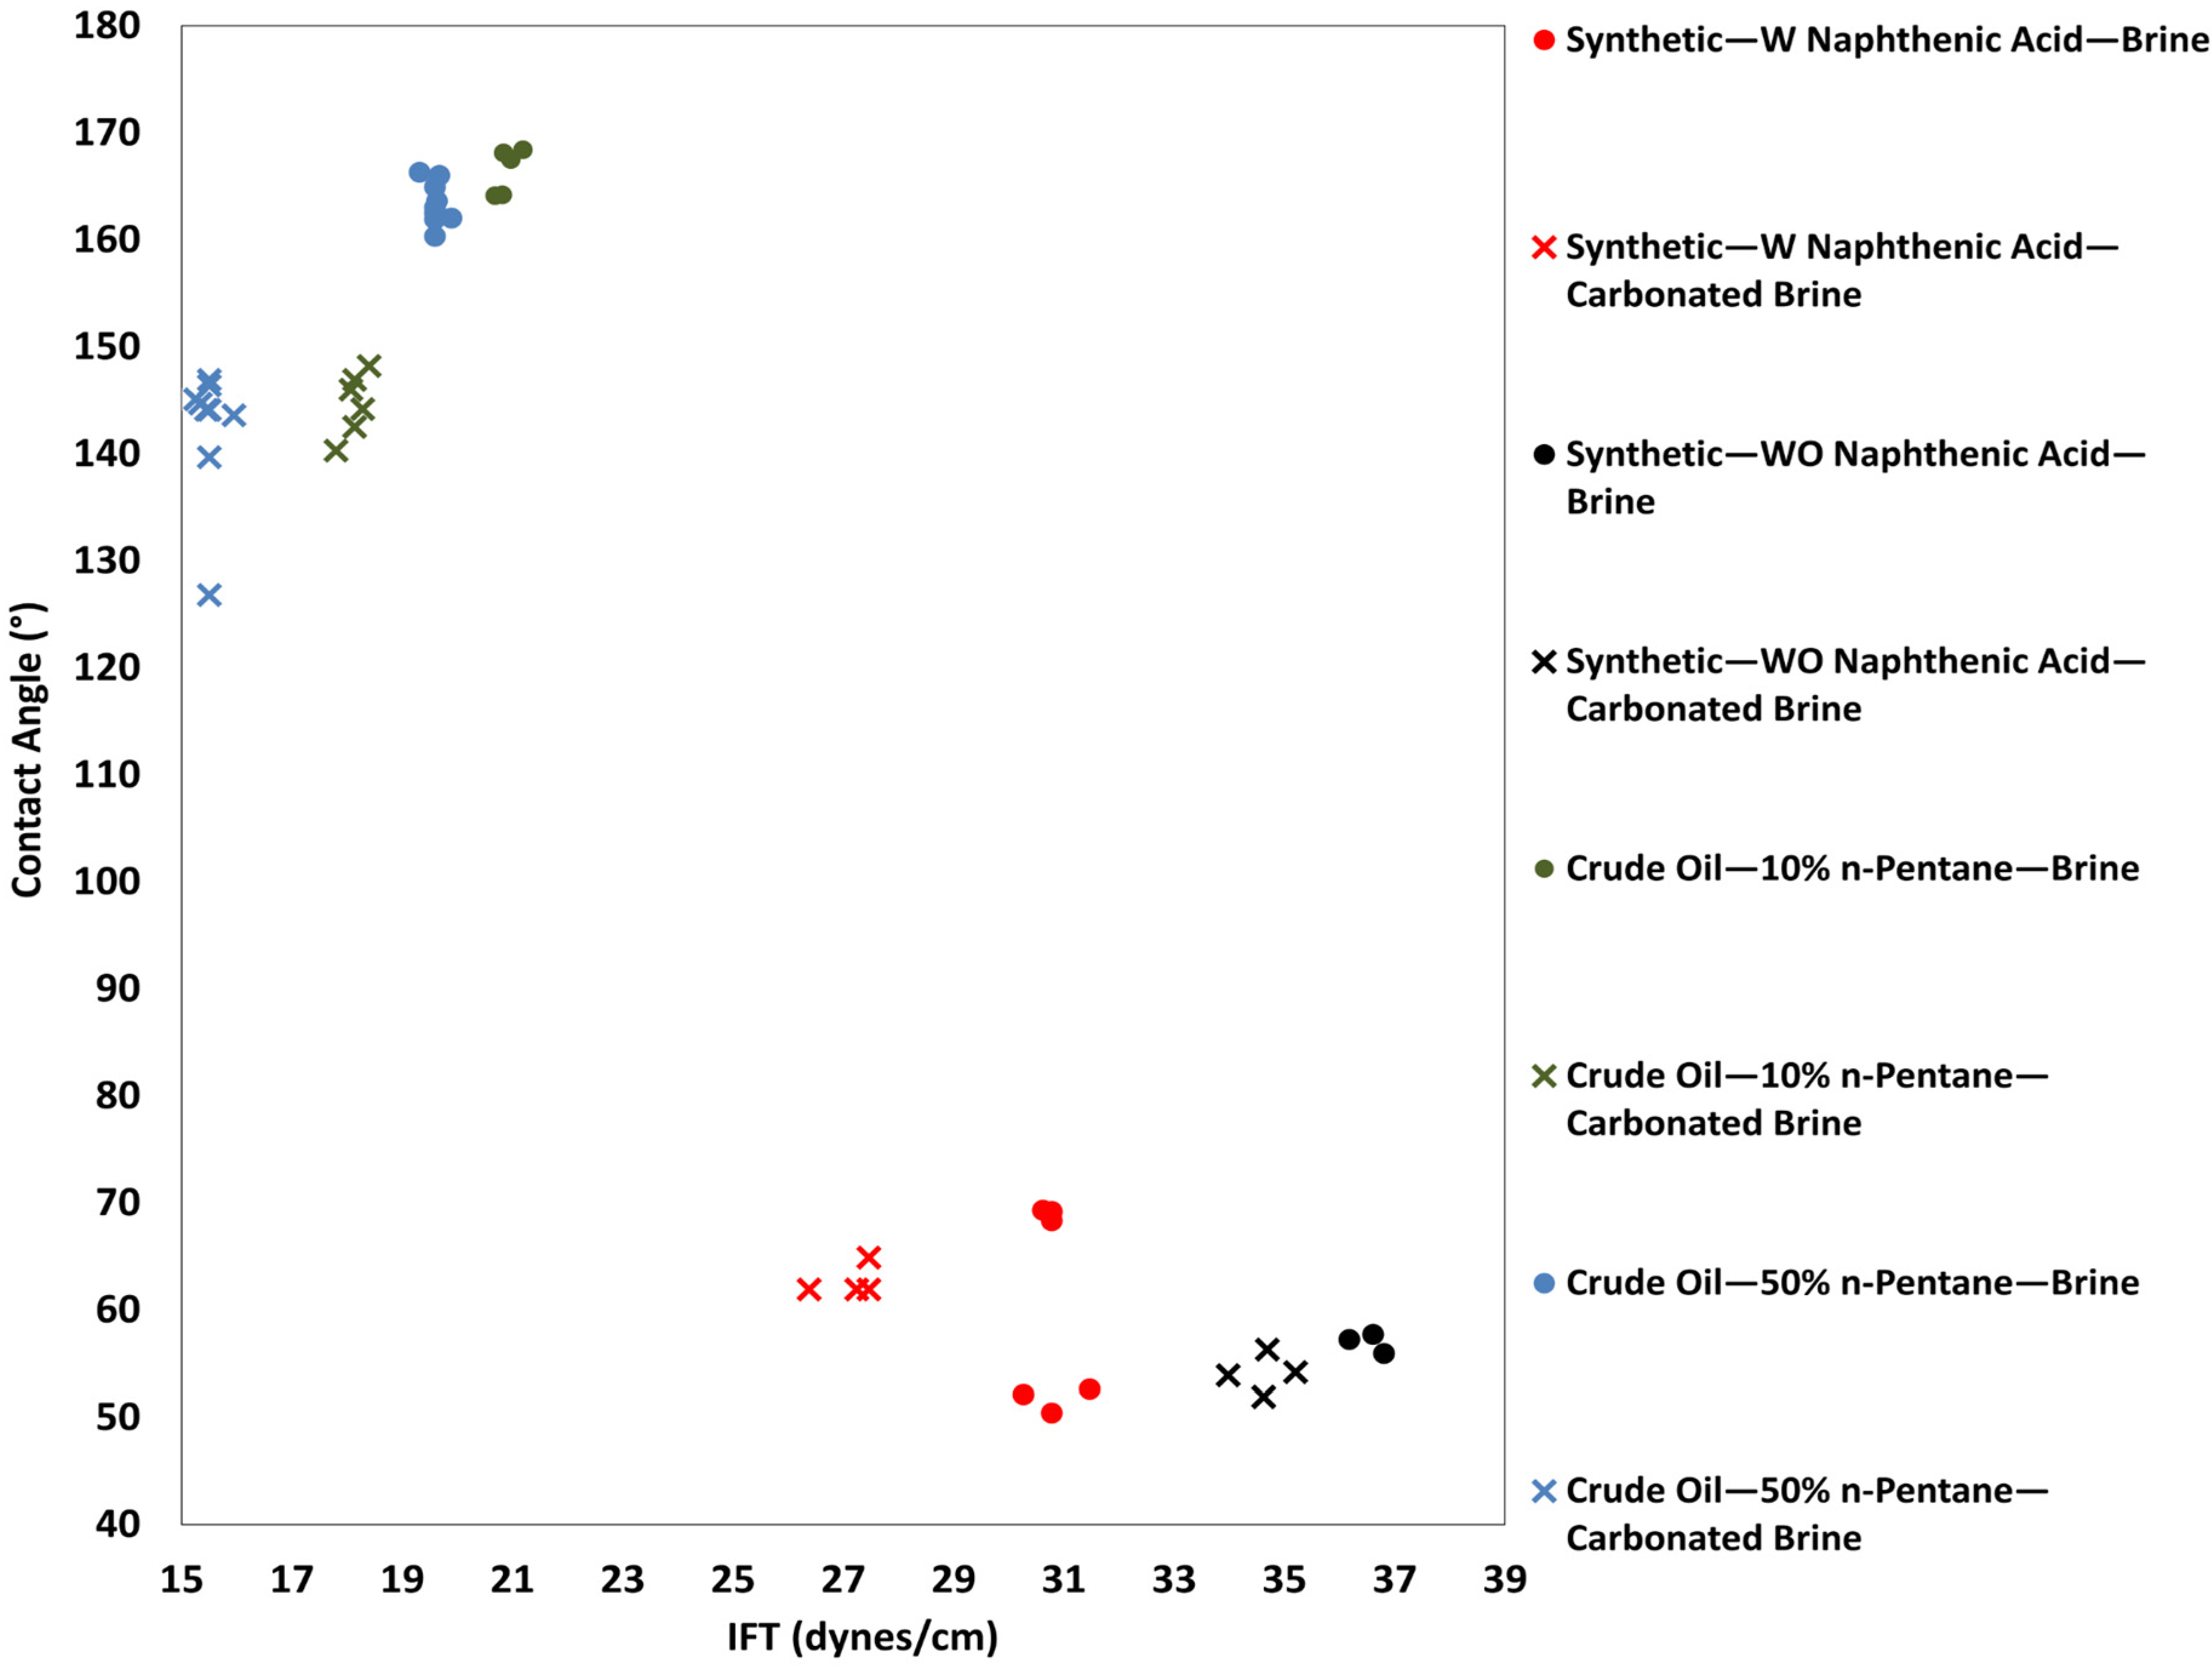
- A clear correlation between IFT reduction and contact angle decrease was observed, validating that CO2-induced wettability alterations lead to more water-wet conditions.
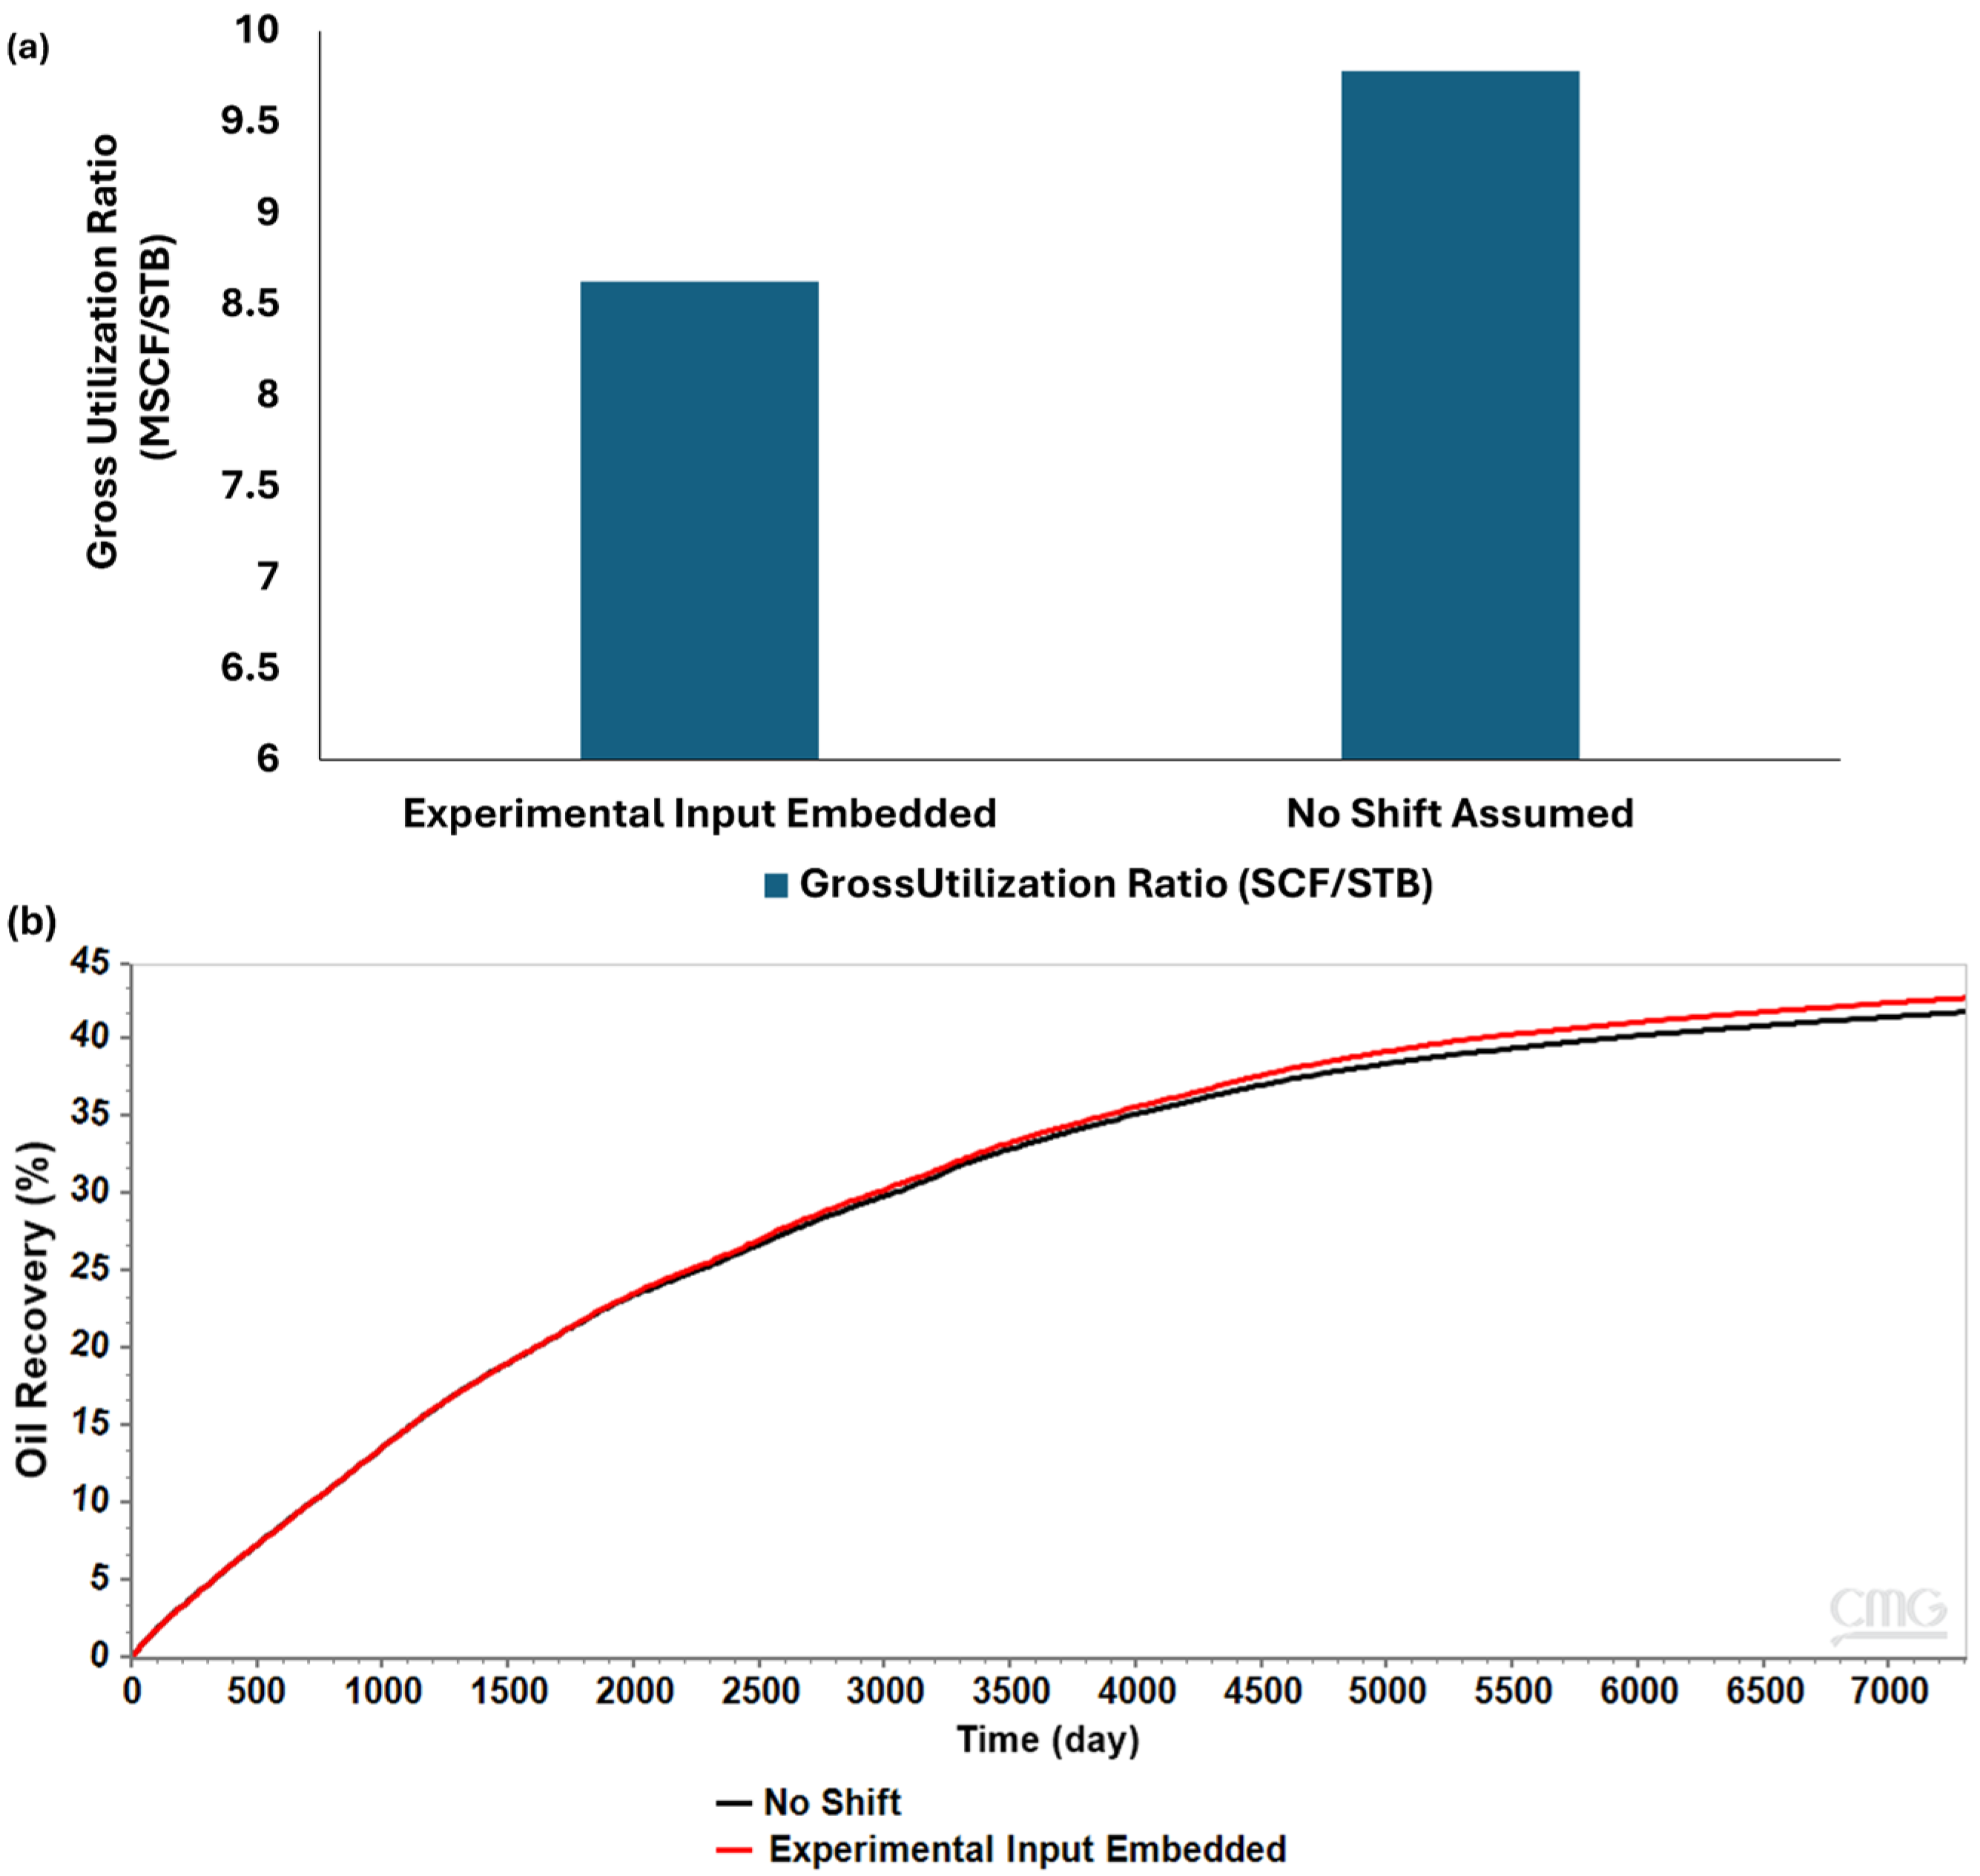
- Incorporating experimental wettability measurements into the reservoir simulation model resulted in a 5.2% reduction in residual oil saturation, 2% increase in recovery factor, and 12% improvement in CO2 utilization efficiency (9780 in comparison to 8620 SCF/STB).
Author Contributions
Funding
Data Availability Statement
Acknowledgments
Conflicts of Interest
Appendix A
| Quantity | Field Unit | SI Unit | Conversion |
|---|---|---|---|
| Interfacial Tension | Dynes/cm | mN/m | 1 dynes/cm = 1 mN/m |
| Contact Angle | degrees (°) | degrees (°) | Same unit |
| Pressure | psia | MPa | 1 psia = 0.006895 MPa |
| Temperature | °F | °C | (°F − 32) × 5/9 |
| Length | inch (in.) | cm | 1 in. = 2.54 cm |
| Length | foot (ft) | m | 1 ft = 0.3048 m |
| Volume | cm3 (cc) | m3 | 1 cc = 1 × 10⁻⁶ m3 |
| Volume | STB (Stock Tank Barrel) | m3 | 1 STB = 0.158987 m3 |
| Gas Volume | SCF (Standard Cubic Foot) | m3 | 1 SCF = 0.0283168 m3 |
| Utilization Ratio | SCF/STB | m3/m3 | (SCF × 0.0283168)/(STB × 0.158987) |
| Permeability | md (millidarcy) | m2 | 1 md = 9.869 × 10⁻¹⁶ m2 |
| Viscosity | cP | Pa·s | 1 cP = 0.001 Pa·s |
| Velocity | ft/day | m/s | 1 ft/day = 3.598 × 10⁻⁶ m/s |
| Capillary Number | Dimensionless | Dimensionless | Same |
References
- Fitch, P.J.R. Heterogeneity in the Petrophysical Properties of Carbonate Reservoirs. Ph.D. Thesis, The University of Leicester, Leicester, UK, 2010. [Google Scholar]
- Moritis, G. EOR Continues to Unlock Oil Resources. Report on Enhanced Oil Recovery. Oil Gas J. 2004, 12, 45–48. [Google Scholar]
- Dandekar, A.Y.; Kokal, S.L.; Maerefat, M. CO2-enhanced oil recovery (CO2-EOR): A review of the key parameters, modeling, and field applications. Energy Fuels 2015, 29, 4339–4361. [Google Scholar]
- Taber, J.J.; Martin, F.D.; Seright, R.S. EOR Screening Criteria Revisited—Part 1: Introduction to Screening Criteria and Enhanced Recovery Field Projects. SPE Reserv. Eng. 1997, 12, 189–198. [Google Scholar] [CrossRef]
- Khather, M.; Saeedi, A.; Myers, M.B.; Verrall, M. An experimental study for carbonate reservoirs on the impact of CO2-EOR on petrophysics and oil recovery. Fuel 2019, 235, 1019–1038. [Google Scholar] [CrossRef]
- Song, Z.; Song, Y.; Li, Y.; Bai, B.; Song, K.; Hou, J. A critical review of CO2 enhanced oil recovery in tight oil reservoirs of North America and China. Fuel 2020, 276, 118006. [Google Scholar] [CrossRef]
- Eyinla, D.S.; Leggett, S.; Badrouchi, F.; Emadi, H.; Adamolekun, O.J.; Akinsanpe, O.T. A comprehensive review of the potential of rock properties alteration during CO2 injection for EOR and storage. Fuel 2023, 353, 129219. [Google Scholar] [CrossRef]
- Rosenbauer, R.J.; Koksalan, T.; Palandri, J.L. Experimental investigation of CO2-brinerock interactions at elevated temperature and pressure: Implications for CO2 sequestration in deep-saline aquifers. Fuel Process. Technol. 2005, 86, 1581–1597. [Google Scholar] [CrossRef]
- Siqueira, T.A.; Iglesias, R.S.; Ketzer, J.M. Carbon dioxide injection in carbonate reservoirs—A review of CO2-water-rock interaction studies. Greenh. Gases Sci. Technol. 2017, 7, 802–816. [Google Scholar] [CrossRef]
- Green, D.W.; Willhite, G.P. Enhanced Oil Recovery; Society of Petroleum Engineers: Richardson, TX, USA, 1998; Volume 6. [Google Scholar]
- Strand, S. Wettability Alteration in Chalk—A Study of Surface Chemistry. Ph.D. Thesis, University of Stavanger, Stavanger, Norway, 2005. [Google Scholar]
- Zolotukhin, A.; Ursin, J. Introduction to Petroleum Reservoir Engineering; Høyskoleforlaget Norwegian Academic Press: Sandnes, Norway, 2000. [Google Scholar]
- Anderson, W.G. Wettability Literature Survey—Part 1: Rock/Oil/Brine Interactions and the Effects of Core Handling on Wettability. J. Pet. Technol. 1986, 38, 1125–1144. [Google Scholar] [CrossRef]
- Li, X.; Teklu, T.W.; Abass, H.; Cui, Q. The Impact of Water Salinity/Surfactant on Spontaneous Imbibition through Capillarity and Osmosis for Unconventional IOR. In Proceedings of the SPE/AAPG/SEG Unconventional Resources Technology Conference, San Antonio, TX, USA, 1–3 August 2016. [Google Scholar] [CrossRef]
- Chiquet, P.; Daridon, J.-L.; Broseta, D.; Thibeau, S. CO2/Brine Interfacial Tensions under Pressure and Temperature Conditions of CO2 Geological Storage. Energy Fuels 2007, 21, 656–662. [Google Scholar]
- Hjelmeland, O.S.; Larrondo, L.E. Experimental investigation of the effects of temperature, pressure, and crude oil composition on interfacial properties. SPE Reserv. Eng. 1986, 1, 321–328. [Google Scholar] [CrossRef]
- Chalbaud, C.; Robin, M.; Egermann, P. Interfacial tension data and correlations of brine/CO2 systems under reservoir conditions. In Proceedings of the SPE Annual Technical Conference and Exhibition, San Antonio, TX, USA, 24–27 September 2006. [Google Scholar]
- Potter, G.F. The effects of CO2 Flooding on Wettability of West Texas Dolomitic Formations. In Proceedings of the Annual Technical Conference and Exhibition, Dallas, TX, USA, 27–30 September 1987. [Google Scholar]
- Jackson, D.; Andrews, G.; Claridge, E. Optimum WAG Ratio vs. Rock Wettability in CO2 Flooding. In Proceedings of the Annual Technical Conference and Exhibition, Las Vegas, NV, USA, 22–25 September 1985. [Google Scholar]
- Zekri, A.; Shedid, S.; Almehaideb, R. Possible Alteration of Tight Limestone Rocks Properties and the Effect of Water Shielding on the Performance of Supercritical CO2 Flooding for Carbonate Formation. In Proceedings of the SPE Middle East Oil & Gas Show and Conference, Manama, Bahrain, 11–14 March 2007. [Google Scholar]
- Bashforth, F.; Adams, J.C. An Attempt to Test the Theories of Capillary Action: By Comparing the Theoretical and Measured Forms of Drops of Fluid; Cambridge University Press: Cambrdige, UK, 1883. [Google Scholar]
- Yakhshi-Tafti, E.; Kumar, R.; Cho, H.J. Measurement of surface interfacial tension as a function of temperature using pendant drop images. Int. J. Optomechatronics 2011, 5, 393–403. [Google Scholar] [CrossRef]
- Al-Ghnemi, M.; Ozkan, E.; Amini, K.; Kazemi, H. Numerical modeling assessment of CO2-EOR and sequestration potential in a light-oil carbonate reservoir. In Proceedings of the SPE Improved Oil Recovery Conference, Tulsa, OK, USA, 22–26 April 2024; Society of Petroleum Engineers: Richardson, TX, USA, 2024; p. SPE-218163-MS. [Google Scholar] [CrossRef]
- KRÜSS GmbH. Drop Shape Analyzer—DSA100: Precision Measurement of Contact Angle and Interfacial Tension; KRÜSS GmbH: Hamburg, Germany, 2019; Available online: https://www.kruss-scientific.com (accessed on 7 October 2025).
- Tagavifar, M.; Sharma, H.; Wang, D.; Jang, S.H.; Pope, G.A. Alkaline/Surfactant/Polymer Flooding with Sodium Hydroxide in Indiana Limestone: Analysis of Water/Rock Interactions and Surfactant Adsorption. SPE J. 2018, 23, 2279–2301. [Google Scholar] [CrossRef]
- Alghnemi, M. Created with BioRender.com. Available online: https://biorender.com/vz0gmyc (accessed on 21 September 2025).
- Amaefule, J.O.; Handy, L.L. The effect of interfacial tensions on relative oil/water permeabilities of consolidated porous media. Soc. Pet. Eng. J. 1982, 22, 371–381. [Google Scholar] [CrossRef]
- Morrow, N.R. Wettability and Its Effect on Oil Recovery. J. Pet. Technol. 1990, 42, 1476–1484. [Google Scholar] [CrossRef]
- Buckley, J.S.; Liu, Y. Some Mechanisms of Crude Oil–Brine–Solid Interactions. J. Pet. Sci. Eng. 1998, 20, 155–160. [Google Scholar] [CrossRef]

| Core Sample | Length [inch] | Diameter [inch] | Dried Weight [g] | Pore Volume [cc] | Porosity [%] | Permeability [md] |
|---|---|---|---|---|---|---|
| 1 | 1.92 | 1.49 | 118.2 | 8.241 | 15.03 | 24 |
| 2 | 1.99 | 1.49 | 126.3 | 8.594 | 15.15 | 19.3 |
| 3 | 1.98 | 1.49 | 126.7 | 8.347 | 14.76 | 23.6 |
| 4 | 1.97 | 1.48 | 123.3 | 8.879 | 15.92 | 23.4 |
| Fluid System | Viscosity (cP) |
|---|---|
| Synthetic Hydrocarbon Fluid—Without Naphthenic Acid | 0.52 |
| Synthetic Hydrocarbon Fluid—With Naphthenic Acid | 0.54 |
| Crude Oil—Diluted with 50% n-Pentane | 3.5 |
| Crude Oil—Diluted with 10% n-Pentane | 12.2 |
| Synthetic Fluid Composition Without Naphthenic Acid | Synthetic Fluid Composition with Naphthenic Acid | |
|---|---|---|
| Component | Mole % | Mole % |
| n-C5 | 0.19 | 0.188 |
| n-C8 | 0.49 | 0.49 |
| n-C10 | 0.32 | 0.32 |
| Naphthenic Acid | -- | 0.02 |
| Fluid System | Surrounding Phase | IFT Under Ambient Conditions | CV | Replicates | IFT Under Reservoir Conditions | CV | Replicates | IFT Reduction |
|---|---|---|---|---|---|---|---|---|
| [dynes/cm] | % | n | [dynes/cm] | % | n | [dynes/cm] | ||
| Synthetic Fluid with Naphthenic Acid | Brine System | 34.1 ± 0.69 | 2 | 3 | 30.78 ± 0.6 | 1.9 | 3 | 3.32 |
| Carbonated Brine System | 29.9 ± 0.55 | 1.88 | 4 | 27.13 ± 0.51 | 1.89 | 4 | 2.77 | |
| Synthetic Fluid without Naphthenic Acid | Brine System | 39.47 ± 0.39 | 1 | 3 | 36.5 ± 0.32 | 0.88 | 3 | 2.97 |
| Carbonated Brine System | 35.81 ± 0.56 | 1.57 | 2 | 34.65 ± 0.61 | 1.76 | 2 | 1.16 | |
| Crude oil diluted with 50% n-pentane | Brine System | 20.95 ± 0.57 | 2.71 | 3 | 19.6 ± 0.23 | 1.2 | 4 | 1.35 |
| Carbonated Brine System | 16.11 ± 0.12 | 0.74 | 4 | 15.49 ± 0.31 | 2.01 | 4 | 0.62 | |
| Crude oil diluted with 10% n-pentane | Brine System | 22.89 ± 0.33 | 1.4 | 5 | 20.9 ± 0.19 | 0.9 | 5 | 1.99 |
| Carbonated Brine System | 20.0 ± 0.47 | 2.36 | 4 | 18.13 ± 0.263 | 1.45 | 4 | 1.87 |
| Fluid System | Surrounding Phase | Contact Angle Under Ambient Conditions | CV | Replicates | Contact Angle Under Reservoir Conditions | CV | Replicates | Contact Angle Reduction |
|---|---|---|---|---|---|---|---|---|
| ° | % | n | ° | % | n | ° | ||
| Synthetic Fluid with Naphthenic Acid | Brine System | 75.6 ± 0.201 | 0.27 | 3 | 68.9 ± 0.59 | 0.77 | 3 | 6.7 |
| 58.0 ± 0.458 | 0.79 | 3 | 53.7 ± 2.35 | 4.37 | 3 | 4.3 | ||
| Carbonated Brine System | 78.9 ± 2.4 | 3.04 | 3 | 62.9 ± 1.73 | 2.75 | 3 | 16 | |
| Synthetic Fluid without Naphthenic Acid | Brine System | 58.6 ± 0.77 | 1.32 | 2 | 56.9 ± 0.93 | 1.63 | 3 | 1.7 |
| Carbonated Brine System | 66.8 ± 2.61 | 3.9 | 2 | 54.0 ± 1.80 | 3.3 | 4 | 12.8 | |
| Crude oil diluted with 50% n-pentane | Brine system | 165.3 ± 0.45 | 0.27 | 3 | 163.3 ± 1.21 | 0.74 | 4 | 2 |
| 165.1 ± 1.31 | 0.79 | 3 | 161.5 ± 1.13 | 0.7 | 3 | 3.6 | ||
| 168.6 ± 0.6 | 0.35 | 3 | 166.1 ± 0.15 | 0.09 | 3 | 2.5 | ||
| Carbonated brine system | 157.8 ± 1.73 | 1.1 | 3 | 145.8 ± 1.49 | 1 | 3 | 12 | |
| 156.8 ± 0.56 | 0.35 | 4 | 144.7 ± 0.66 | 0.45 | 4 | 12.1 | ||
| 155.2 ± 5.0 | 3.2 | 3 | 133.2 ± 9.12 | 6.8 | 2 | 22 | ||
| Crude oil diluted with 10% n-pentane | Brine system | 168 ± 1.35 | 0.8 | 4 | 164.1 ± 0.07 | 0.04 | 2 | 3.9 |
| 169.6 ± 0.33 | 0.19 | 4 | 168.0 ± 0.37 | 0.22 | 4 | 1.6 | ||
| Carbonated brine system | 155 ± 2.92 | 1.88 | 3 | 142.3 ± 1.95 | 1.37 | 3 | 12.7 | |
| 158.9 ± 1.04 | 1.04 | 3 | 147.0 ± 1.1 | 0.75 | 3 | 11.9 |
| Property | Unit |
|---|---|
| Velocity | 5 ft/day |
| Viscosity | 0.001 Pa.s |
| IFT for Brine (Experimental) | 19.63 dynes/cm |
| IFT for Carbonated Brine (Experimental) | 15.25 dynes/cm |
| Capillary Number (Brine) | 7.52 × 10⁻⁵ |
| Capillary Number (Carbonated Brine) | 1.08 × 10⁻⁴ |
| Property | Original | Carbonated Brine Effect | Effect |
|---|---|---|---|
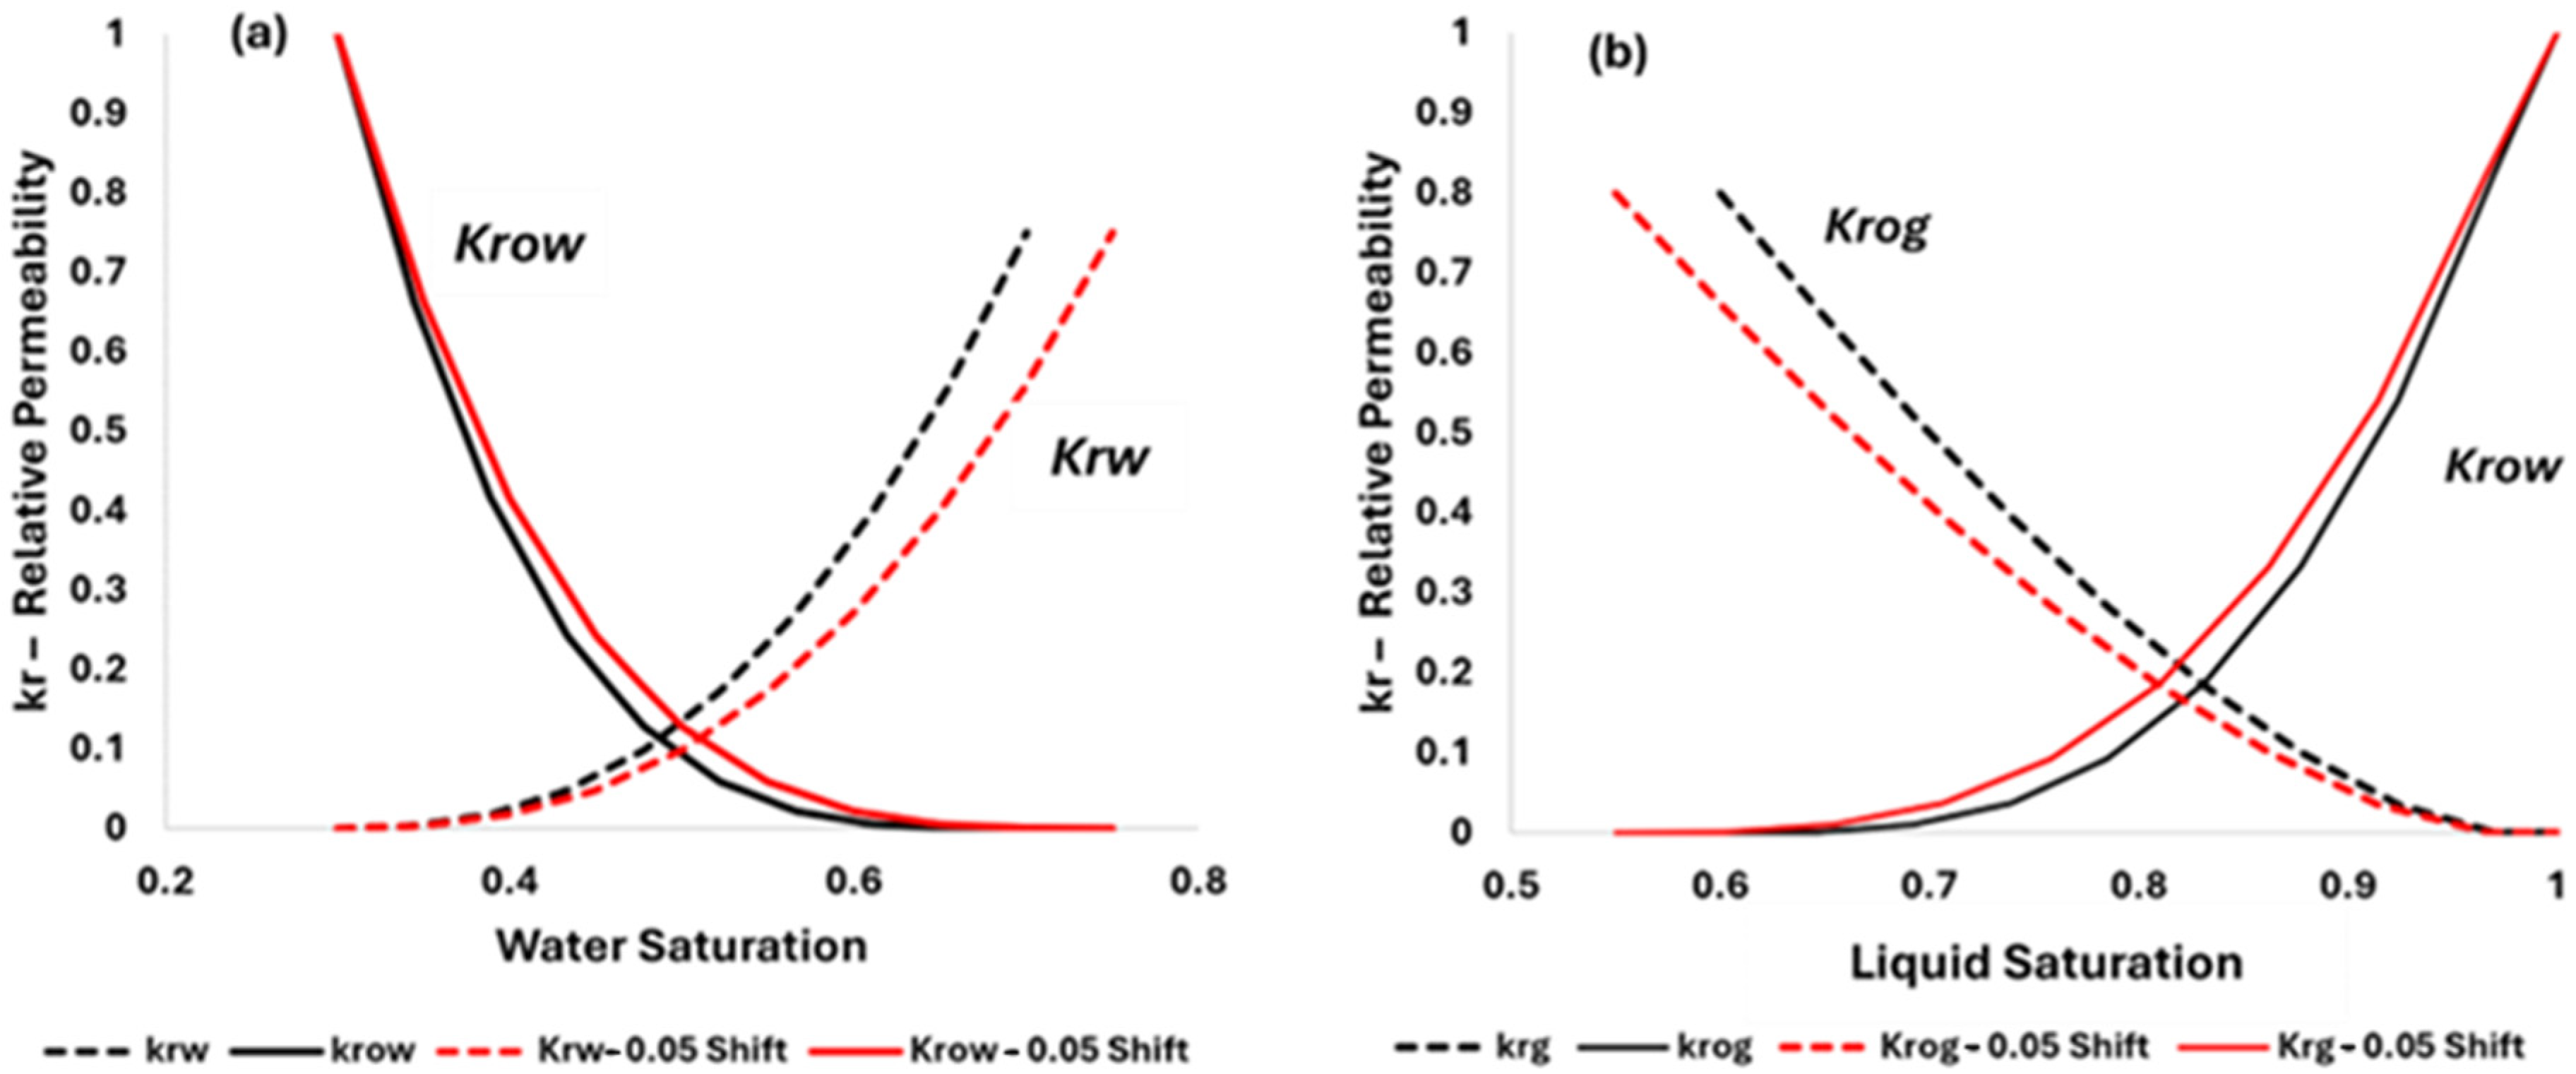
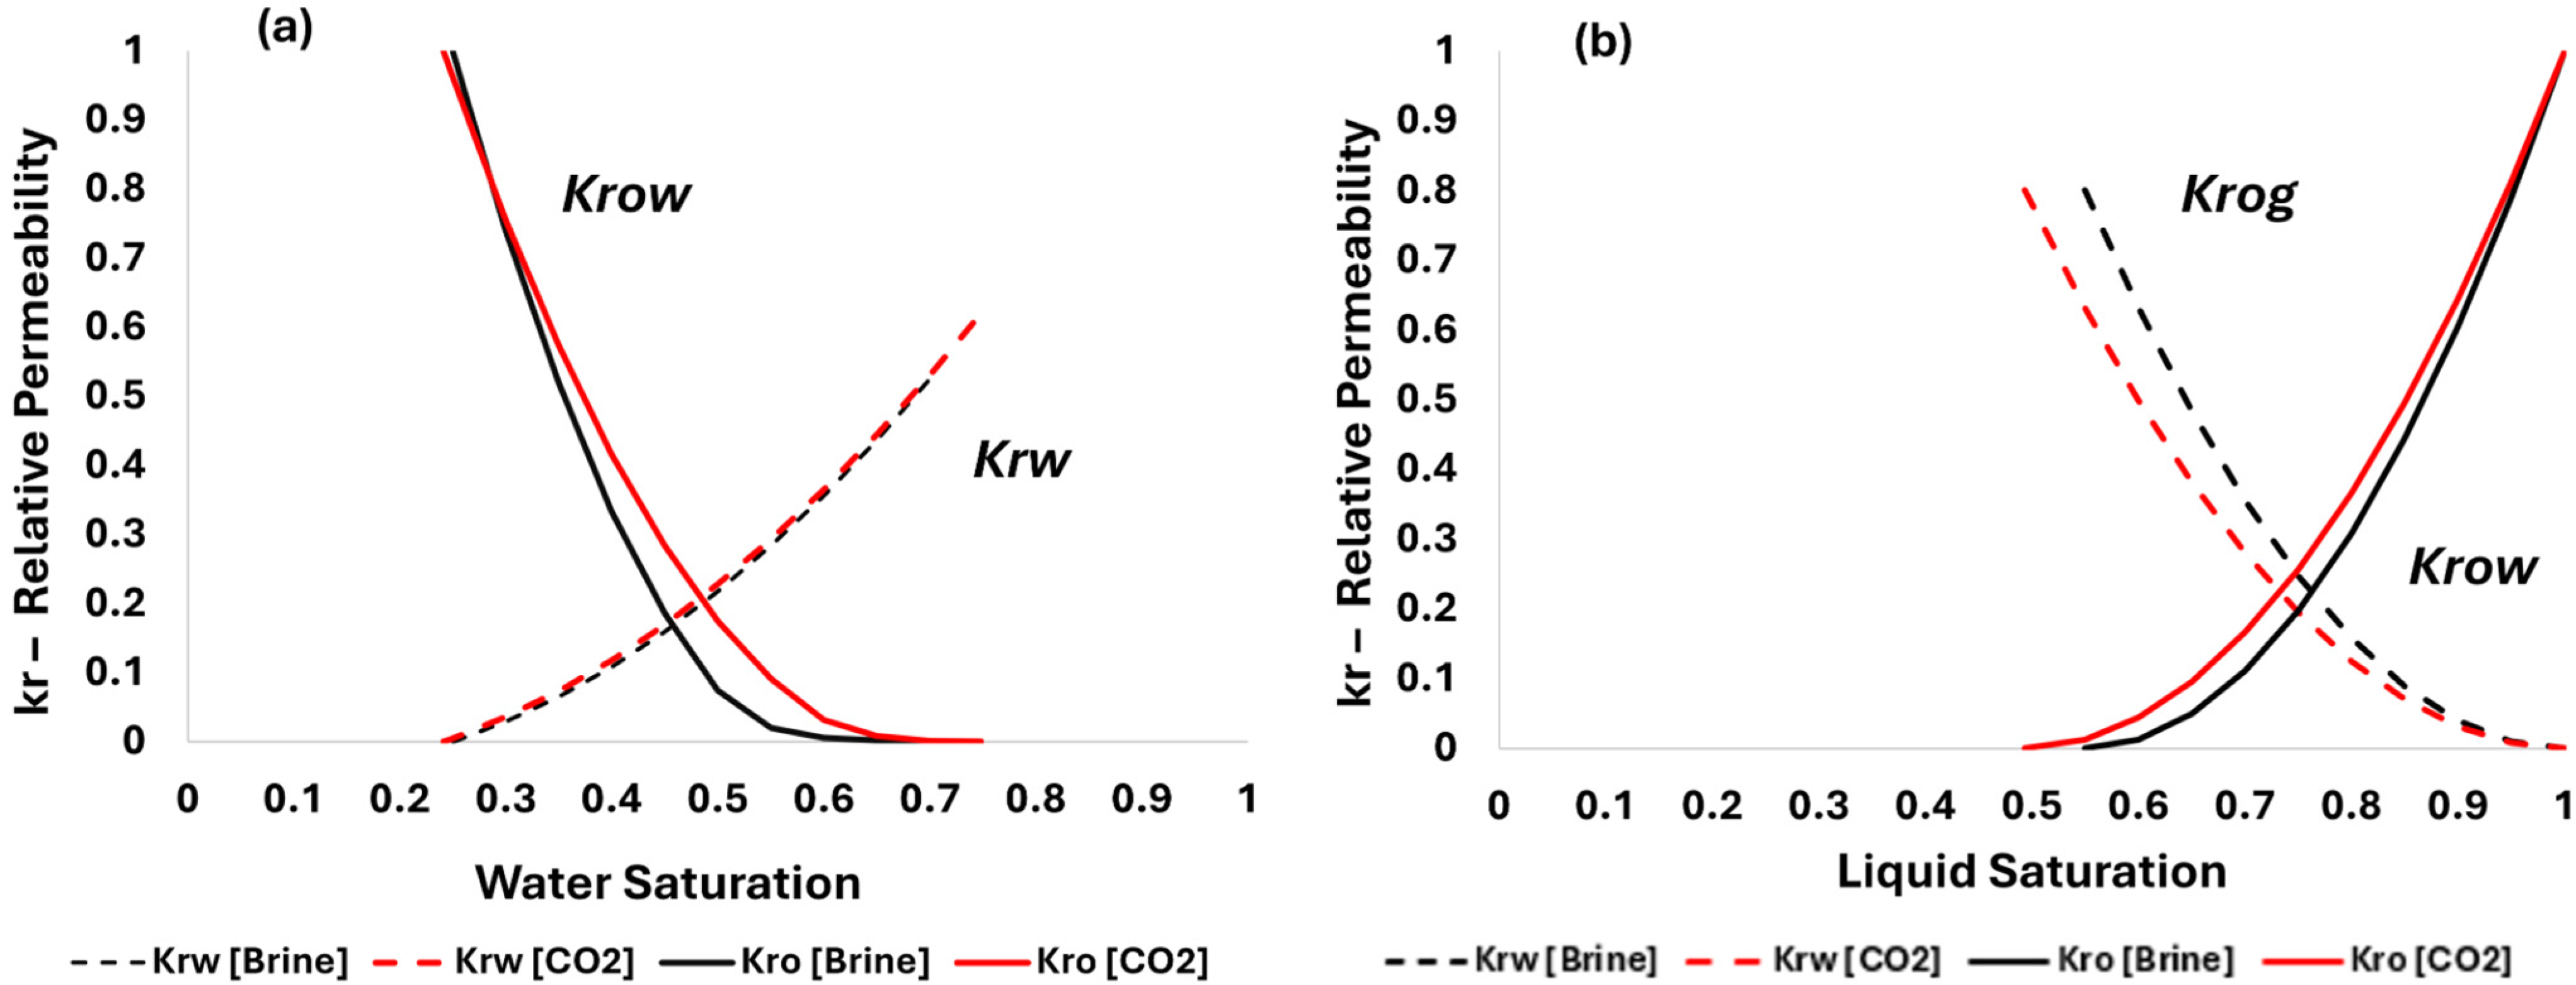
| Sor | 0.3 | 0.248 | −0.052 |
| Swr | 0.3 | 0.283 | −0.016 |
Disclaimer/Publisher’s Note: The statements, opinions and data contained in all publications are solely those of the individual author(s) and contributor(s) and not of MDPI and/or the editor(s). MDPI and/or the editor(s) disclaim responsibility for any injury to people or property resulting from any ideas, methods, instructions or products referred to in the content. |
© 2025 by the authors. Licensee MDPI, Basel, Switzerland. This article is an open access article distributed under the terms and conditions of the Creative Commons Attribution (CC BY) license (https://creativecommons.org/licenses/by/4.0/).
Share and Cite
Al-Ghnemi, M.; Ozkan, E.; Kazemi, H. Experimental and Numerical Evaluation of CO2-Induced Wettability Alteration in Carbonate Reservoir CCUS. Energies 2025, 18, 5529. https://doi.org/10.3390/en18205529
Al-Ghnemi M, Ozkan E, Kazemi H. Experimental and Numerical Evaluation of CO2-Induced Wettability Alteration in Carbonate Reservoir CCUS. Energies. 2025; 18(20):5529. https://doi.org/10.3390/en18205529
Chicago/Turabian StyleAl-Ghnemi, Mohammad, Erdal Ozkan, and Hossein Kazemi. 2025. "Experimental and Numerical Evaluation of CO2-Induced Wettability Alteration in Carbonate Reservoir CCUS" Energies 18, no. 20: 5529. https://doi.org/10.3390/en18205529
APA StyleAl-Ghnemi, M., Ozkan, E., & Kazemi, H. (2025). Experimental and Numerical Evaluation of CO2-Induced Wettability Alteration in Carbonate Reservoir CCUS. Energies, 18(20), 5529. https://doi.org/10.3390/en18205529


