Article

LightGBM Medium-Term Photovoltaic Power Prediction Integrating Meteorological Features and Historical Data

1
Department of Electrical Engineering, Dongshin University, Naju 58245, Republic of Korea
2
College of Electronic Engineering, Changchun College of Electronic Technology, Lan Jia Campus, Changchun 130000, China
*
Author to whom correspondence should be addressed.
Energies 2025, 18(20), 5526; https://doi.org/10.3390/en18205526
Submission received: 26 September 2025 / Revised: 14 October 2025 / Accepted: 15 October 2025 / Published: 20 October 2025
(This article belongs to the Special Issue AI Solutions for Energy Management: Smart Grids and EV Charging)

Abstract

This paper proposes a Light Gradient Boosting Machine (LightGBM) model for medium-term photovoltaic (PV) power forecasting by integrating meteorological features with historical generation data. This approach addresses prediction biases that often arise when relying solely on a single meteorological data source. Historical power output and meteorological variables (irradiance, temperature, humidity, etc.) were collected from a PV station and preprocessed through data cleaning, standardization, and temporal alignment to construct a multivariate prediction framework. A comprehensive feature set was then built, including meteorological, temporal, interaction, and lag features. Feature importance analysis and Recursive Feature Elimination (RFE) were employed for input optimization, while feature-layer concatenation was applied for data fusion. Finally, the LightGBM (Version 2.3.1) framework, combined with Bayesian optimization and time-series cross-validation, was used to enhance generalization and predictive robustness. Experimental results confirm that the model achieved an MAE of 37.49, RMSE of 64.67, and R2 of 0.89. The model effectively captured high-dimensional nonlinear relationships, thereby improving the accuracy of medium-term photovoltaic forecasts and providing reliable decision support for power system scheduling and renewable energy integration.

1. Introduction

Photovoltaic (PV) power generation, as a clean and inexhaustible renewable energy source, has become a key driver of the global energy transition and the pursuit of carbon neutrality. According to the International Energy Agency (IEA), newly installed global PV capacity reached 450 GW in 2024, representing a 15% year-on-year increase, while the cumulative installed capacity exceeded 1.5 TW. This rapid expansion underscores the strategic importance of PV power in mitigating climate change and fostering low-carbon energy systems. However, PV output is inherently intermittent and uncertain, as well as highly dependent on solar irradiance, temperature, humidity, wind speed, and module characteristics. Such variability poses significant challenges for grid stability, demand–supply balance, and electricity market operations.
In recent years, photovoltaic power generation prediction methods have been mainly divided into three categories: physical models, statistical models, and data-driven models [1]. With the development of intelligent algorithms, data-driven machine learning and deep learning models have gradually become mainstream. Researchers have proposed a variety of short-term prediction methods, such as time-series models based on LSTM and GRU [2,3], and deep structures that use CNN or Attention mechanisms to capture meteorological spatial features [4,5]. At the same time, integrated learning models (such as LightGBM, XGBoost, CatBoost) have also been widely used in photovoltaic power generation prediction due to their high efficiency and feature processing capabilities [6,7]. For example, Li et al. [8] used the LightGBM model to achieve hourly prediction of multiple meteorological features, significantly improving the prediction accuracy; Zhao et al. [9] combined CatBoost with feature selection methods for daily-scale photovoltaic power prediction, showing good generalization.
In order to further improve the accuracy and stability of the model, researchers began to introduce hybrid models and optimization algorithms. The LSTM-LightGBM combination model was used for medium-term prediction [10], and methods such as genetic algorithms, particle swarm optimization (PSO), and Bayesian optimization were used to adjust hyperparameters [11,12]; at the same time, feature selection methods were introduced to reduce feature redundancy and improve interpretability [13,14]. However, most current studies still have two shortcomings: (1) Research focuses on hourly or ultra-short-term forecasts, and lacks systematic exploration of medium-term (3–15 days) forecasts with daily resolution, and (2) existing models generally rely on complete meteorological inputs, lack robustness or have missing or noisy meteorological data, and have weak interpretability of model results [15,16].
To address the above issues, this study proposes a LightGBM medium-term photovoltaic power generation forecasting framework that combines meteorological and historical features. The main innovations are as follows: (1) For the daily resolution medium-term forecasting problem, a multi-dimensional feature engineering framework that integrates historical lag, rolling average, periodicity and holiday information is designed to capture the cross-day power generation characteristics and seasonal variation patterns, thereby improving the stability and accuracy of the model in medium-term forecasting [17]. (2) A meteorological data missing compensation mechanism is proposed. In the absence of future meteorological observations, the missing input is automatically filled by the historical average features of the same period, thereby improving the robustness of the model under incomplete meteorological data conditions. (3) At the model level, the optimized LightGBM regression framework is used, and the feature importance analysis is combined to achieve the interpretability and scalability of the model, providing a benchmark platform for the subsequent comparison of hybrid models and deep learning models. Experimental results show that the proposed model has higher prediction accuracy, robustness, and interpretability than traditional hybrid methods such as LightGBM and LSTM–LightGBM on multi-year measured data and can provide an effective reference for medium-term scheduling and operation decisions of photovoltaic power plants [18,19,20].

2. Data and Preprocessing

2.1. Introduction to the Dataset

The accuracy of photovoltaic (PV) power forecasting critically depends on the availability of extensive and reliable data. Among various sources, authentic historical generation records play a decisive role in ensuring forecasting accuracy. Comprehensive measurement data not only reflect the actual operating status of PV power stations but also capture diverse real-world conditions. Accordingly, this paper employs high-quality, validated data resources for both model training and validation.
To construct an efficient dataset for PV forecasting, historical generation data from a PV station in South Korea were meticulously screened, cleaned, and organized. The dataset spans the years 2021 to 2025, making it a scientifically robust and reliable foundation for model development. For experimental purposes, the dataset was divided into training and validation subsets based on research requirements. This strategy provides a solid foundation for the proposed forecasting framework, significantly enhancing predictive accuracy and credibility, while also offering strong data support for future applications in energy management and system optimization.

2.2. Data Preprocessing

The dataset employed in this paper was organized chronologically and stored in yearly Excel files, covering multiple years of recorded observations. Each file contained several feature dimensions, including date, average, maximum, and minimum temperature, diurnal temperature difference, total sunlight duration (hours), sunshine rate (%), total solar radiation (MJ/m2), and the target variable of power generation.
All datasets were aggregated at a daily resolution to ensure temporal consistency between meteorological and generation variables. Hourly meteorological measurements (e.g., irradiance, temperature, humidity) were averaged over each day, and the corresponding daily generation totals (kWh) were used as the target variable. Timestamp alignment was performed by matching the same calendar date across all data sources to construct a unified daily dataset. Lag and rolling features (e.g., 1–3-day lags, 3-day and 7-day moving averages) were subsequently computed based on this daily time step.
A strict chronological split was adopted to prevent lookahead bias: data from 2021 to 2024 were used for model training, January–February 2025 for validation, and March 2025 for testing. No shuffling or random sampling was performed at any stage. Lag and rolling features (e.g., pre-1day_gen, 3day.avg_gen, 7day.avg_gen) were computed exclusively from past observations within each time window to avoid data leakage.
For missing meteorological entries in the test period, daily averages were imputed using the mean values of the same calendar date from previous years (e.g., the average of 5 March from 2021 to 2024 was used to estimate 5 March 2025). This procedure ensured that no future information beyond the prediction date was incorporated into model training or feature generation.
The selection of these input features was guided by prior empirical and physical studies indicating that irradiance, temperature, and sunlight duration are the dominant meteorological determinants of PV generation. Incorporating lag and rolling features (e.g., previous-day and multi-day averages) enables the model to capture short- to medium-term temporal dependencies inherent in PV power generation.

2.3. Feature Importance Analysis

The feature importance scores reported in this study, exemplified by the high value for the 3-day rolling average (≈2500), correspond to the Gain importance metric, which is the default implementation in the LightGBM algorithm. Gain importance quantifies the total reduction in the squared error loss function attributable to splits made on each feature across all constituent trees in the ensemble. Consequently, the absolute magnitude of these scores can be substantial, as they represent cumulative contributions, and their primary utility lies in the relative ranking of features rather than the interpretation of their absolute values. It is critical to note that the current analysis did not incorporate a formal Recursive Feature Elimination (RFE) procedure. The feature set was constructed pragmatically by including all available temporal, meteorological, and engineered lag features (e.g., prev_1day_gen, 7day_avg_gen) present in the dataset, followed by model training without an iterative feature selection loop. Therefore, explicit stopping criteria for RFE were not applicable. For transparency and reproducibility, the final set of features used in the model is presented in Table 1, ranked by their gain importance. This ranking effectively serves as a proxy for the elimination order that would be generated by an RFE process, indicating that temporal autoregressive features (lagged and rolling generation values) were the most influential predictors, followed by key meteorological variables such as solar radiation and sunlight duration.
Figure 1 shows the results of the feature importance analysis in the proposed PV power forecasting model. Overall, these findings indicate that the model is built on a combined logic of “historical generation dynamics + illumination fundamentals”. This dual foundation enhances the model’s ability to forecast PV power across short- to medium-term horizons by leveraging both historical generation records and essential environmental drivers. Each feature contributes unique predictive value, and the exclusion of any single variable would reduce overall model accuracy.

2.4. Evaluation Metrics

The performance of the forecasting model is evaluated using several widely adopted regression metrics, including mean squared error (MSE), root mean squared error (RMSE), mean absolute error (MAE), and the coefficient of determination (R2).
  • MSE, defined as the average of the squared differences between predicted and actual values (Equation (1)), is particularly sensitive to large deviations because errors are magnified by squaring.
M S E = 1 n i = 1 n y i y i ^ 2
2.
RMSE, shown in Equation (2), is the square root of MSE and thus provides a more intuitive measure of prediction error in the same units as the target variable. Both MSE and RMSE indicate better performance when their values are smaller.
R M S E = 1 n i = 1 n y i y i ^ 2
3.
MAE, presented in Equation (3), calculates the average absolute difference between predicted and actual values. Unlike MSE and RMSE, MAE does not square the errors, making it less sensitive to outliers and therefore a robust indicator of general predictive accuracy.
M A E = 1 n i = 1 n y i y i ^
4.
Finally, R2, shown in Equation (4), measures the proportion of variance in the actual data explained by the model. An R2 value closer to 1 indicates stronger explanatory power, while a value near 0 suggests that the model performs no better than using the mean of the observations.
R 2 = 1 i = 1 n y i y i ^ 2 i = 1 n y i y ¯ 2
Together, these metrics provide a comprehensive assessment of forecasting performance: RMSE emphasizes the impact of extreme deviations, MAE evaluates overall accuracy, and R2 quantifies the explanatory capability of the model. By jointly considering these measures, the evaluation ensures both the reliability and robustness of the proposed PV power forecasting framework.

3. LightGBM Photovoltaic Power Generation Prediction Model

3.1. LightGBM Algorithm

The Light Gradient Boosting Machine (LightGBM) is an efficient framework for implementing the Gradient Boosting Decision Tree (GBDT) algorithm, offering faster training speed, lower memory consumption, and higher prediction accuracy compared with conventional boosting methods. LightGBM is particularly suitable for medium-term PV forecasting because it efficiently models nonlinear dependencies among diverse meteorological and temporal variables, exhibits strong generalization under limited or incomplete data, and provides interpretable feature importance scores. Its histogram-based tree construction and leaf-wise growth strategy enable high accuracy with reduced computational cost, making it ideal for daily-to-weekly forecasting tasks that require both reliability and explainability.
For PV power forecasting, LightGBM can be expressed as follows:
f p h o t o v o l t a i c G B M e = l L λ l Φ e , β l
where f p h o t o v o l t a i c G B M e denotes the predicted PV power from the ensemble model for a given sample e , L is the number of weak learners, λ l is the weight of the l-th learner, Φ e , β l is the prediction from the l-th weak learner, and β l represents its parameters.
Because PV generation data often exhibit distributional characteristics that approximate normality, LightGBM’s histogram-based discretization is well-suited for handling such features. Moreover, its high training speed makes it particularly effective for processing large datasets, such as those collected under sunny-weather conditions, thereby ensuring both efficiency and scalability in real-world forecasting applications.

3.2. Construction of LightGBM Model Integrating Meteorological Features and Historical Data

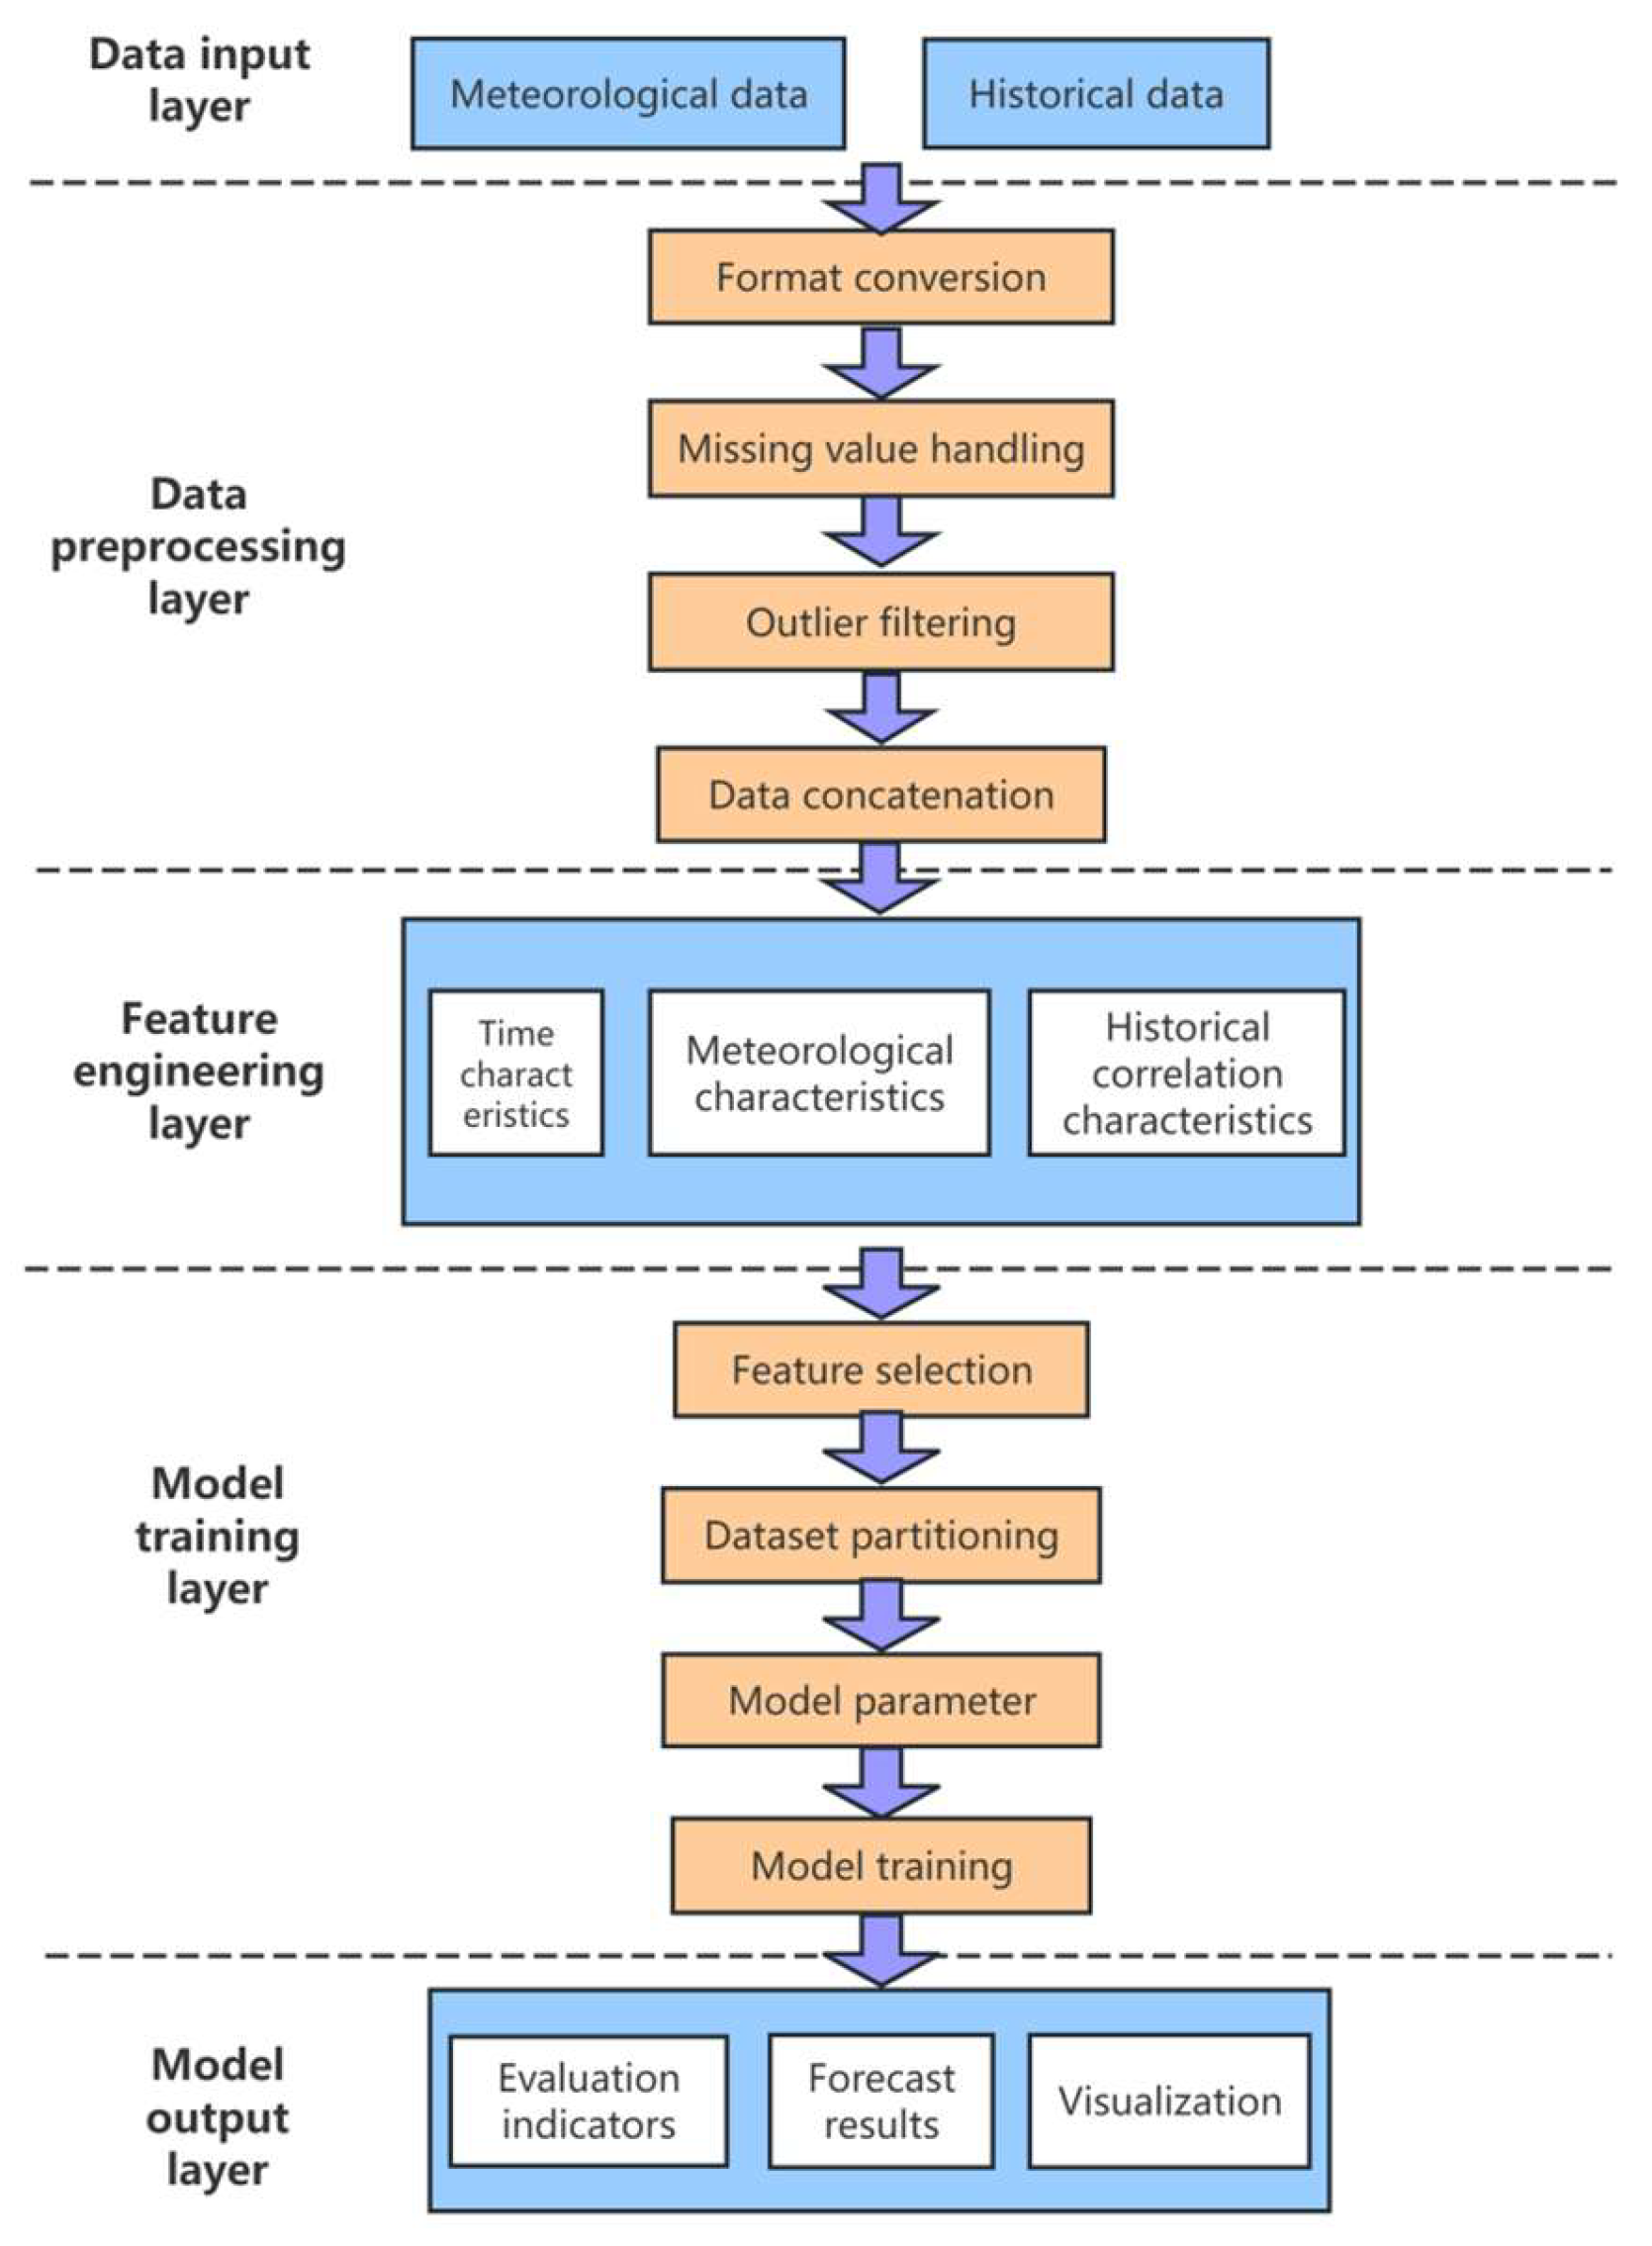
Figure 2 shows the overall framework of the proposed LightGBM-based PV power forecasting model, which is designed to integrate meteorological features with historical generation data. The data input layer includes both meteorological variables—such as average temperature, sunshine duration, and solar radiation—from 2021 to 2024 (training), January–February 2025 (validation), and March 2025 (forecasting), as well as aligned historical power generation data (kWh) that provide direct references for prediction. At the preprocessing stage, data formats are unified by converting dates into timestamp types and values into float types. Missing values in key features are removed to maintain data quality, while outliers are filtered to eliminate abnormal records. Datasets from different years are then merged and integrated into a single chronological series.
The LightGBM model utilizes the engineered temporal, meteorological, and historical features described in Section 2 to integrate meteorological information with historical generation records.
In the training stage, feature selection is automatically performed to reduce redundancy and improve efficiency. The dataset is divided such that the training set consists of data from 2021 to 2024 and January–February 2025, while the test set includes March 2025, thereby evaluating the model’s ability to generalize to unseen data. Model parameters are tuned to balance accuracy and computational efficiency, with the number of estimators set to 800 to avoid underfitting at lower values and overfitting at higher values.
Bayesian optimization was employed to fine-tune major LightGBM hyperparameters using a 5-fold time-series cross-validation scheme to prevent data leakage. The optimization targeted parameters with the greatest influence on model generalization: learning_rate (0.01–0.3), num_leaves (20–100), max_depth (3–10), feature_fraction (0.6–1.0), bagging_fraction (0.6–1.0), and lambda_l1/lambda_l2 regularization terms (0–0.5). The search space was explored using 50 Bayesian iterations, balancing computational cost and convergence stability.
Early stopping was incorporated during tuning, using a patience window of 50 rounds based on validation RMSE to prevent overfitting. After convergence, n_estimators were fixed at 800 to provide stable performance across validation folds, since the early-stopping rounds consistently ranged between 700 and 850. This fixed value ensures reproducibility and avoids variability between independent runs of Bayesian sampling.
The final optimized configuration yielded learning_rate = 0.05, num_leaves = 43, max_depth = 7, feature_fraction = 0.82, and bagging_fraction = 0.85, which provided a balanced trade-off between bias and variance for the medium-term PV dataset.
The output stage produces daily power generation forecasts (kWh) for March 2025. Model performance is assessed using evaluation indicators such as MAE, RMSE, R2, and overall accuracy. In addition, visualizations including predicted versus actual curves, feature importance rankings, and error distributions are generated to provide interpretability and facilitate model validation. Overall, the LightGBM forecasting framework is structured around the pipeline of “data processing → feature construction → model training → result output”, enabling effective integration of multidimensional inputs and reliable forecasting of PV power generation to support planning and operational scheduling.
Model performance was evaluated using Mean Absolute Error (MAE), Root Mean Square Error (RMSE), and the coefficient of determination (R2), All error values are reported in the same units as the target variable, i.e., kilowatt-hours (kWh).

4. Analysis of Experimental Results

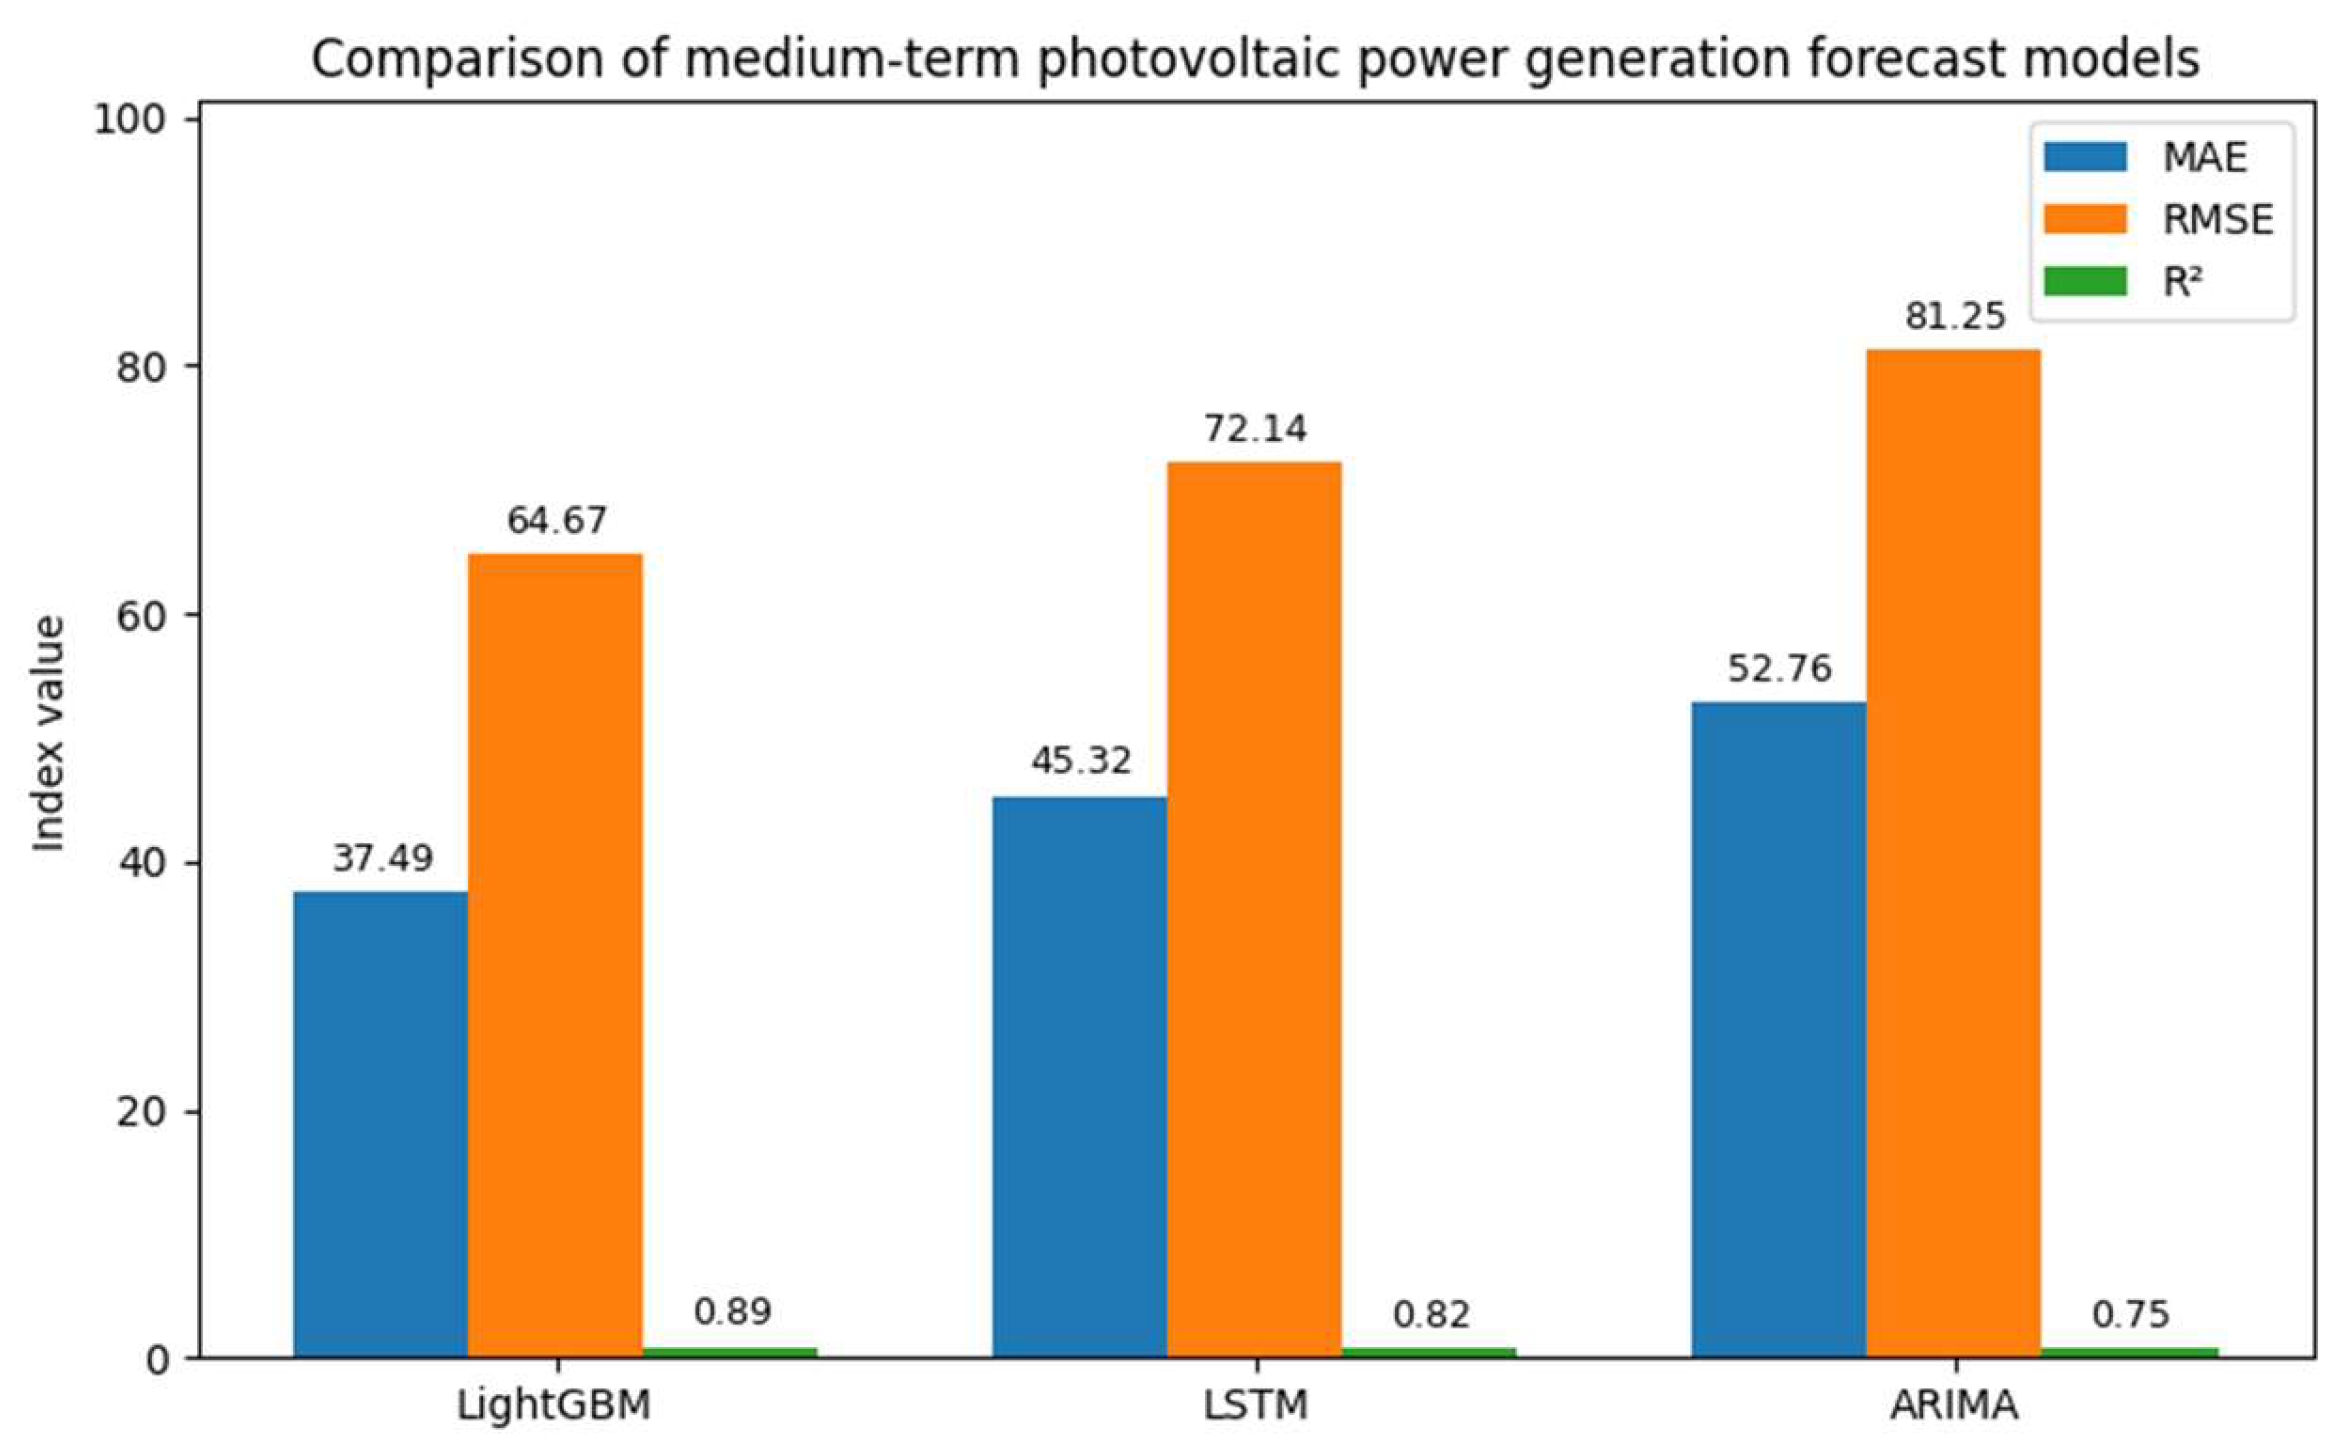
The performance of the proposed LightGBM model was first evaluated using standard regression metrics, including MAE, RMSE, and R2. The model achieved an MAE of 37.49, indicating relatively small deviations between predicted and actual power generation, and an RMSE of 64.67, reflecting the model’s sensitivity to occasional large errors. The coefficient of determination (R2) reached 0.89, showing that approximately 89% of the variance in actual power generation was explained by the model, with the remaining 11% attributable to unmodeled factors such as extreme weather or equipment failures. These results demonstrate that the model has a strong ability to capture both stable patterns and moderate fluctuations in PV generation.
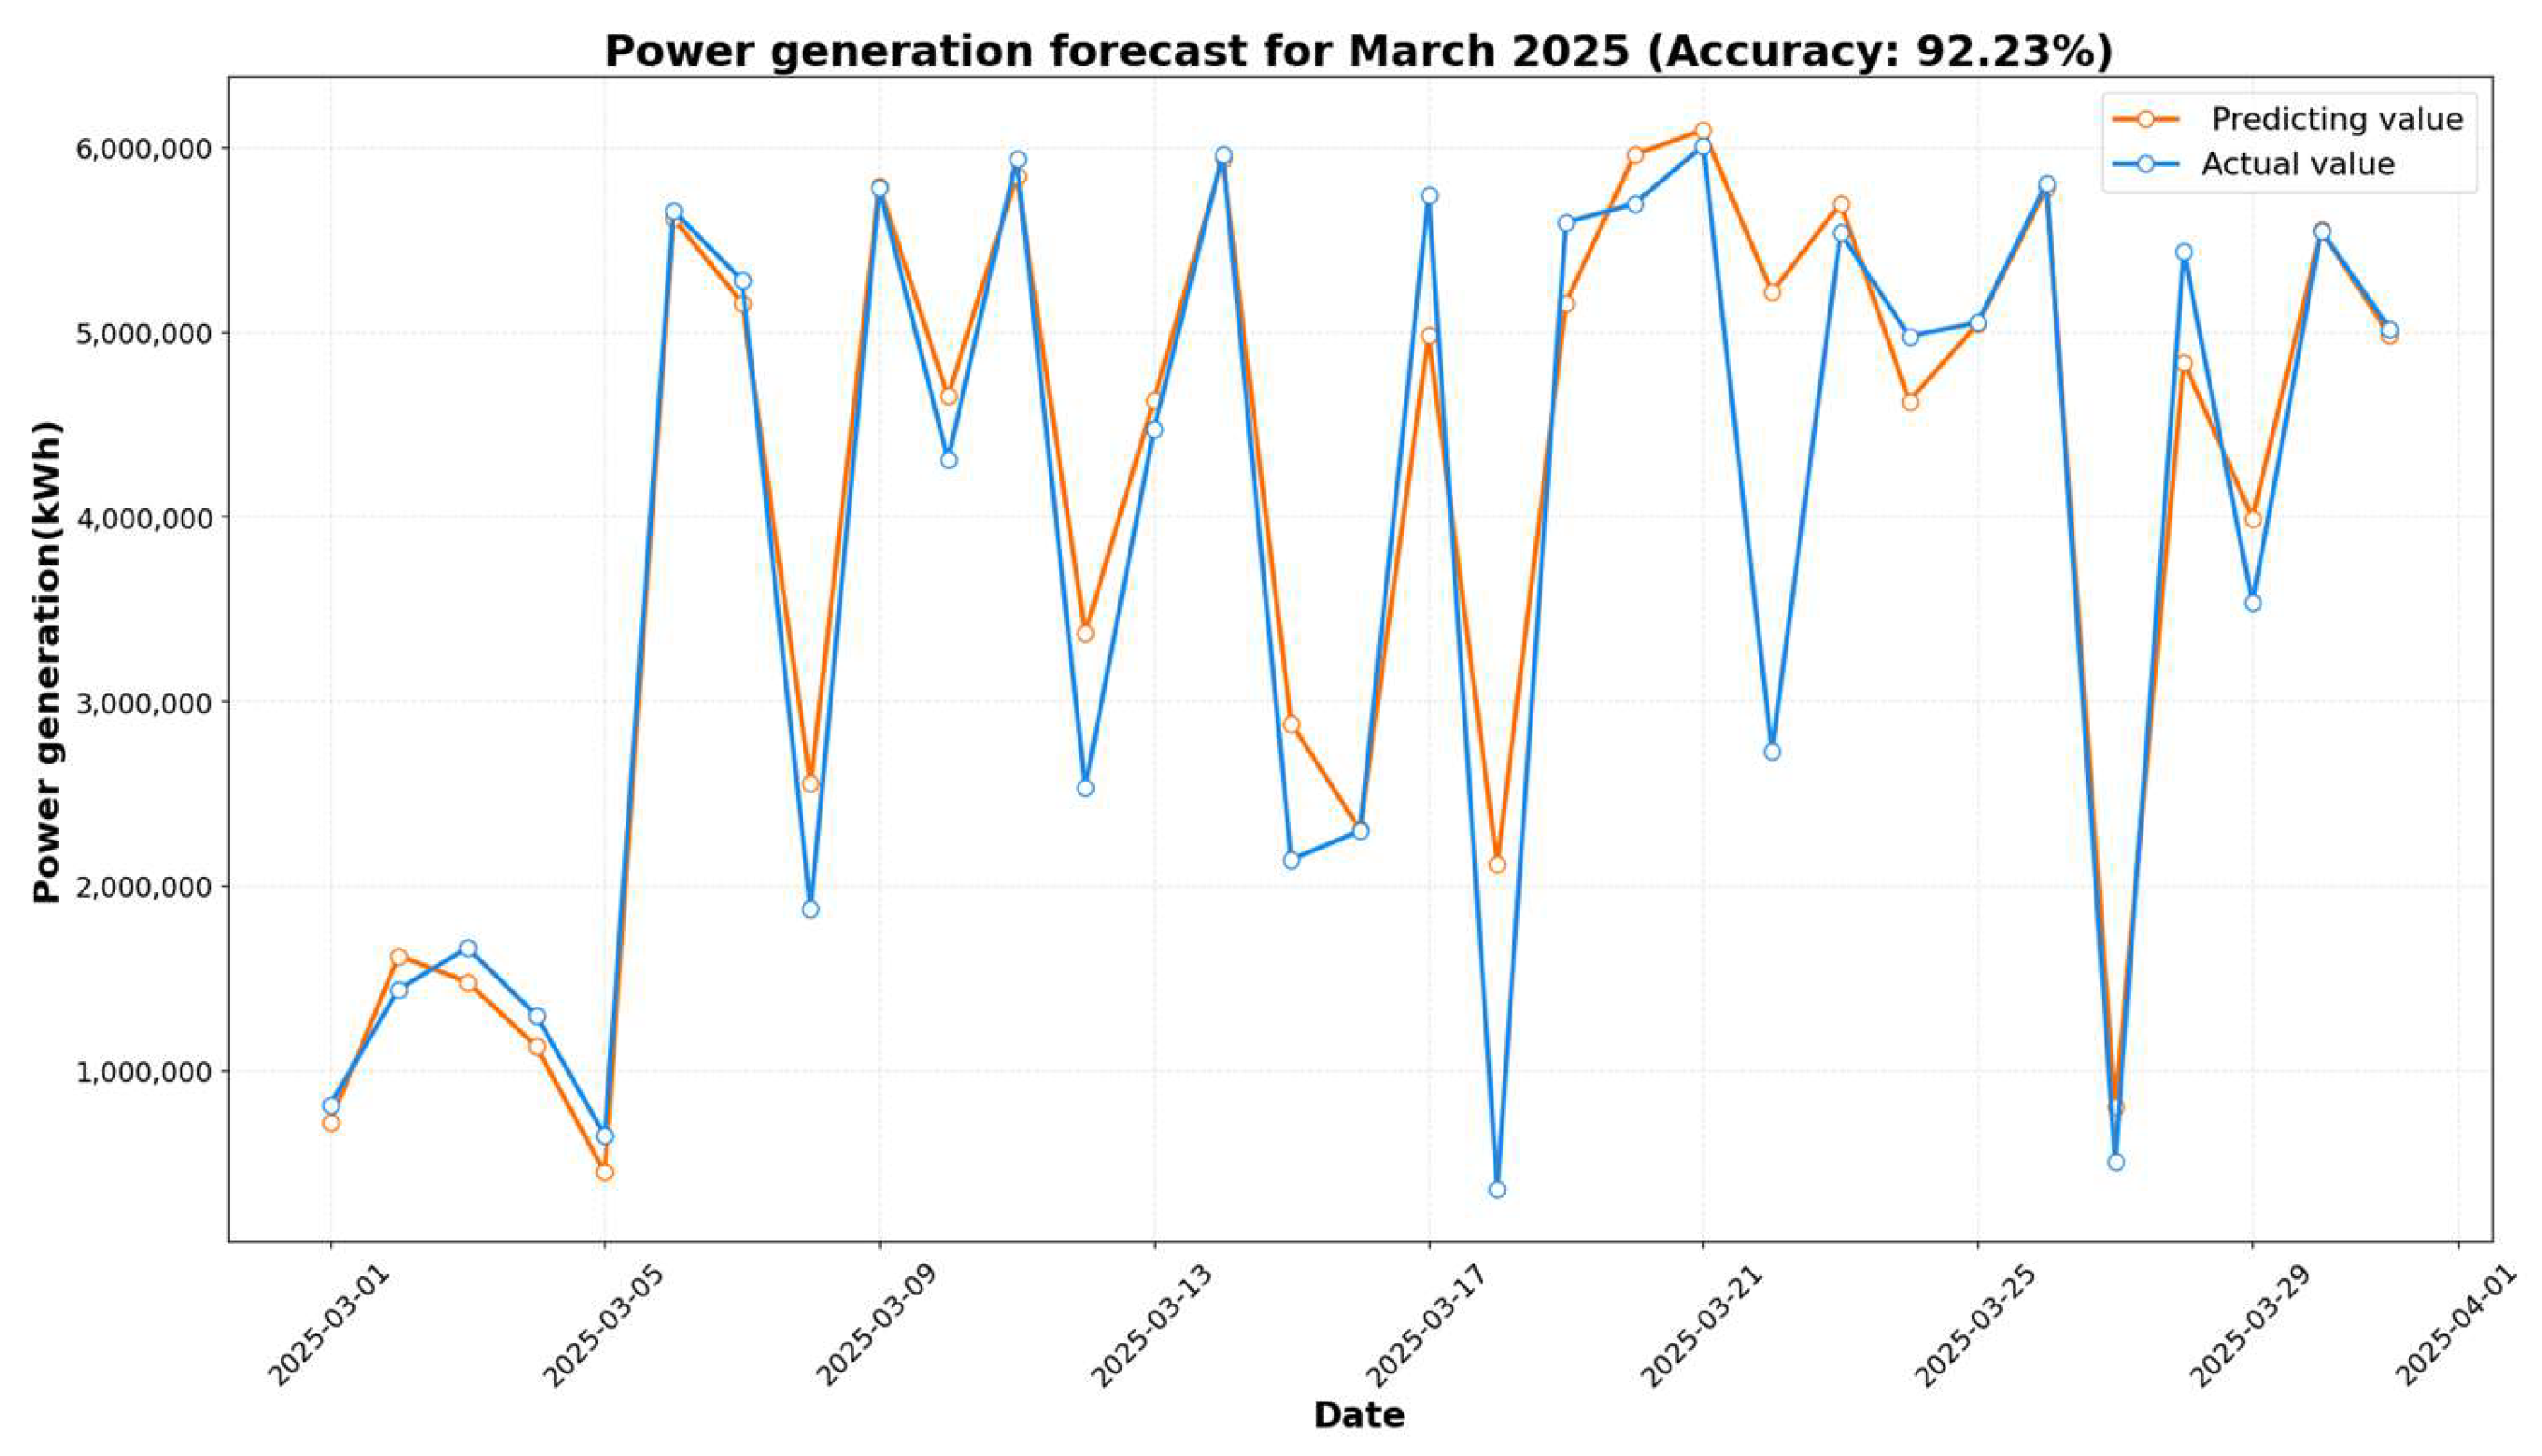
Figure 3 shows the comparison between predicted and actual PV power generation in March 2025. As seen in Figure 3, the two curves exhibit a high degree of consistency, with an overall prediction accuracy of 92.23%. The model effectively captures daily generation trends, although discrepancies remain under extreme conditions such as 5, 17, and 25 March, when sudden weather changes or technical faults caused sharp deviations.
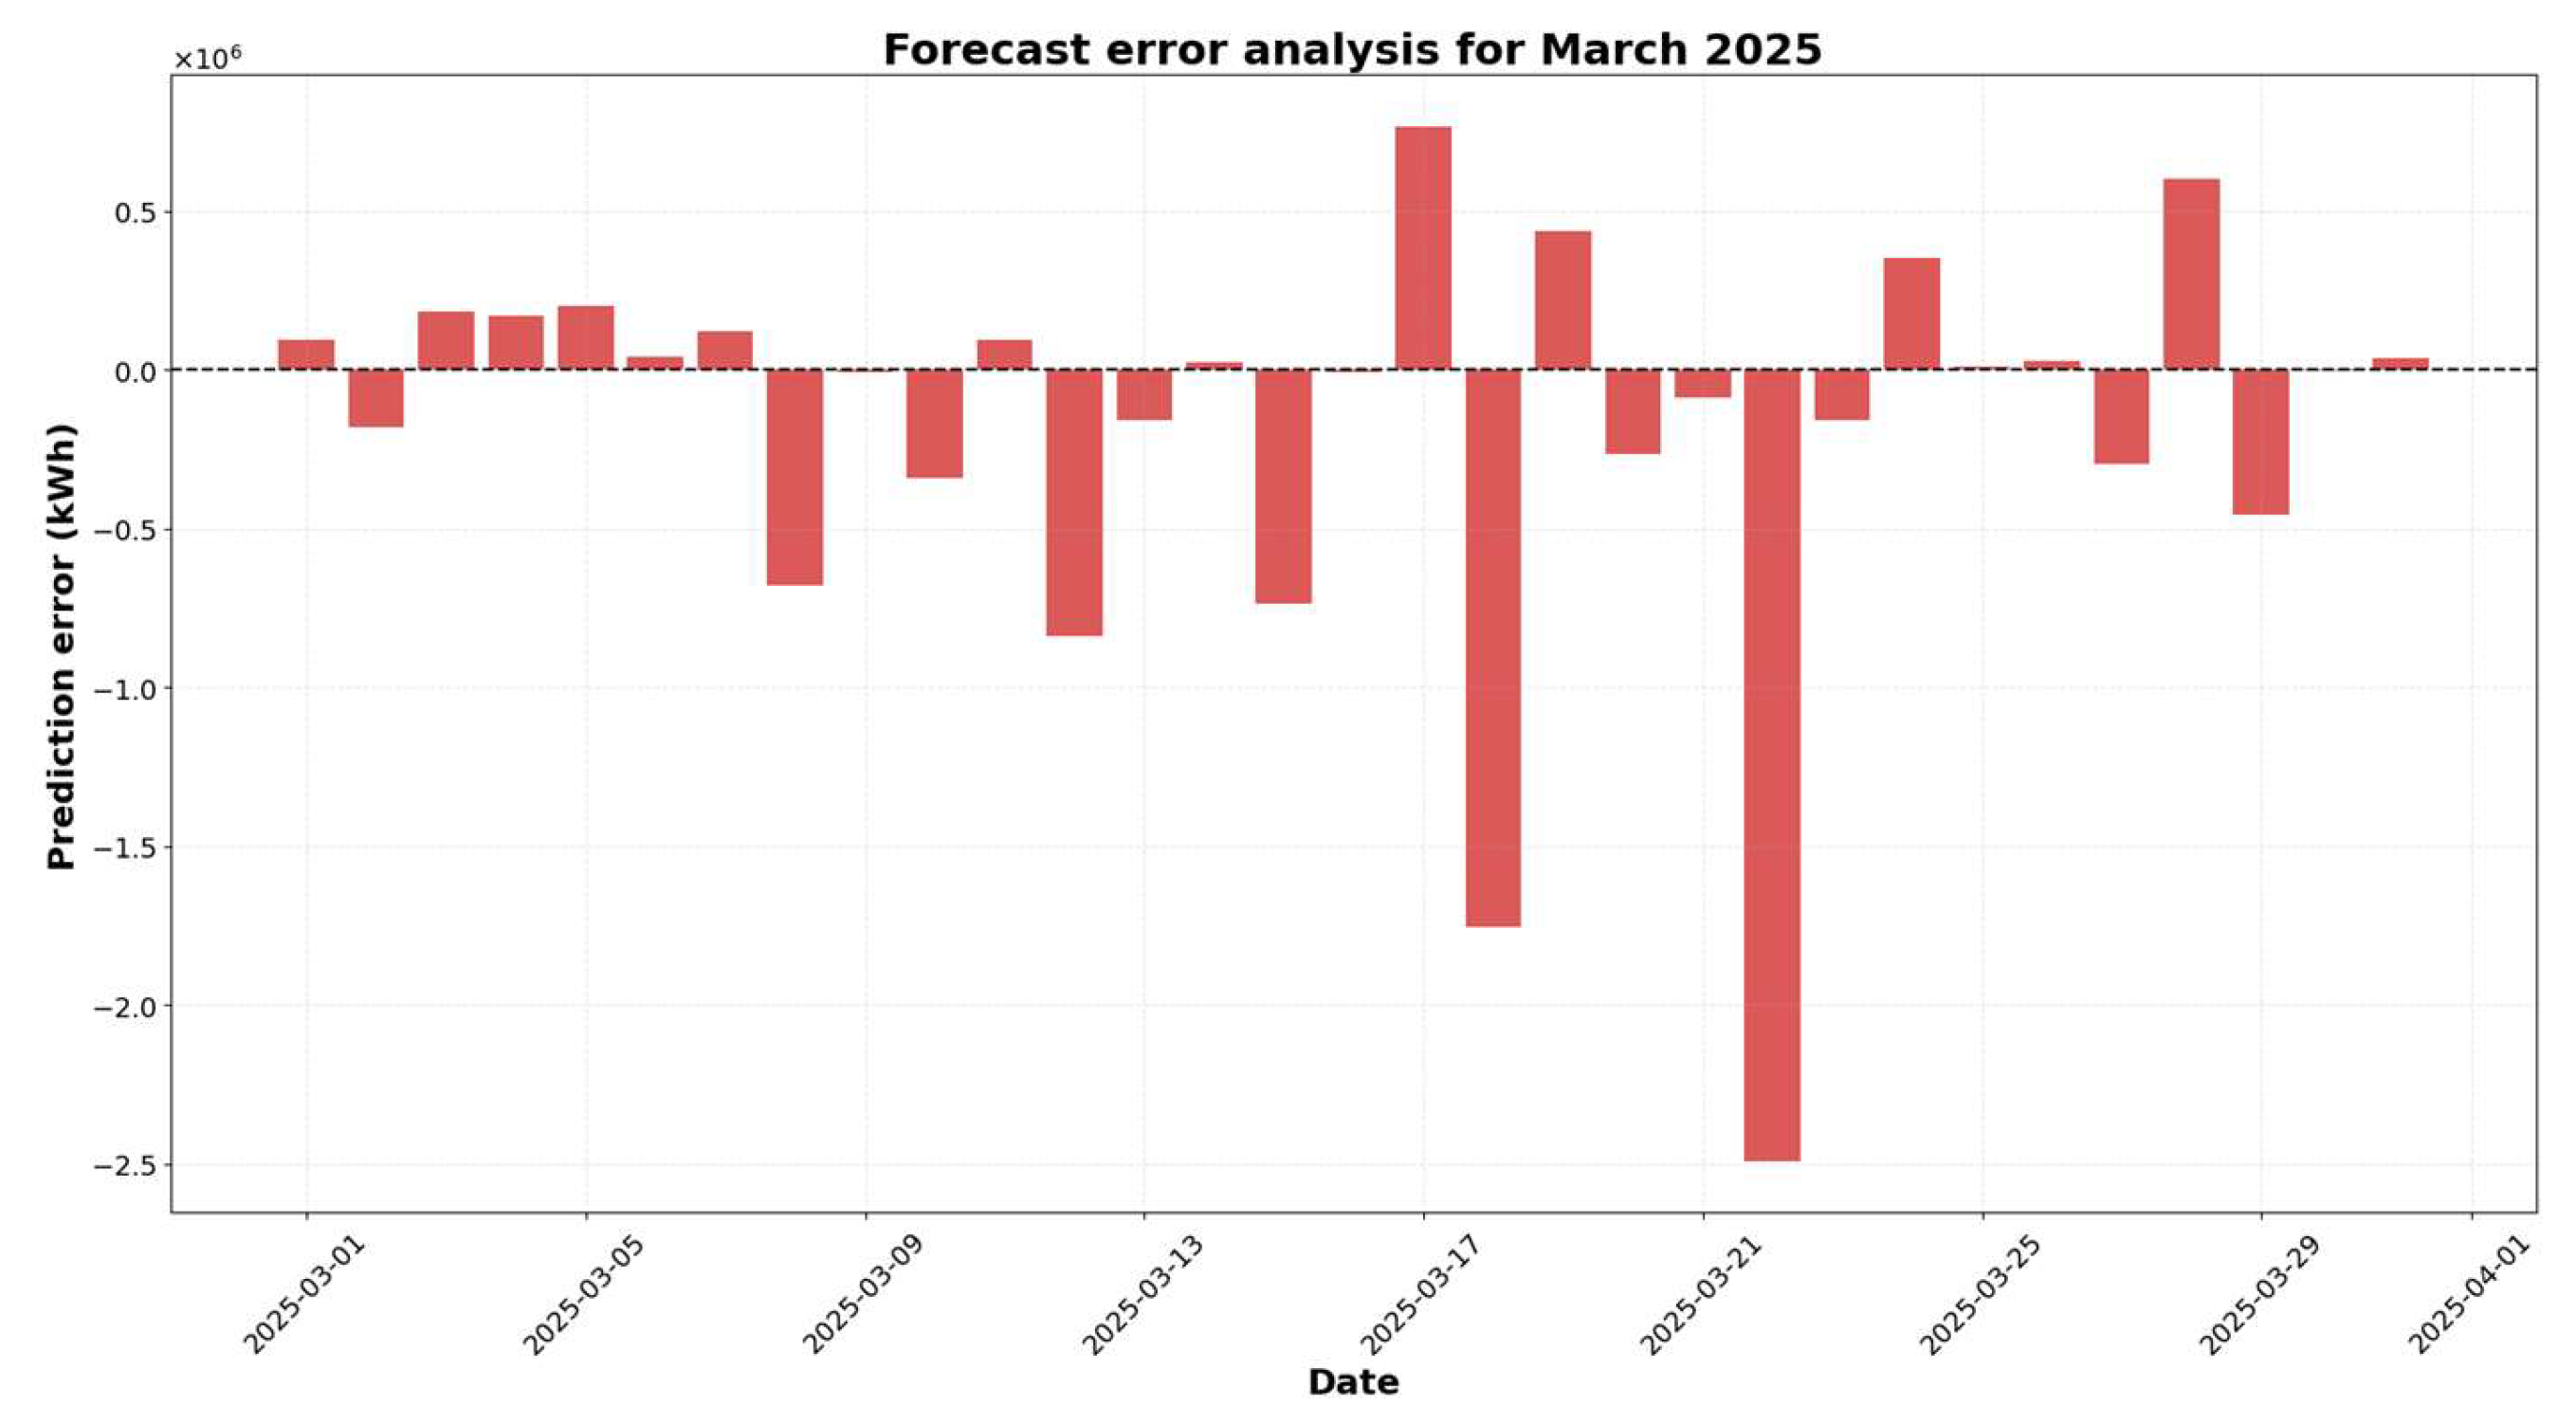
Figure 4 shows the daily error distribution, where positive values indicate underestimation and negative values indicate overestimation. Most errors remain stable within acceptable bounds, but significant deviations occur on specific dates, highlighting the need to further refine the model for extreme cases.
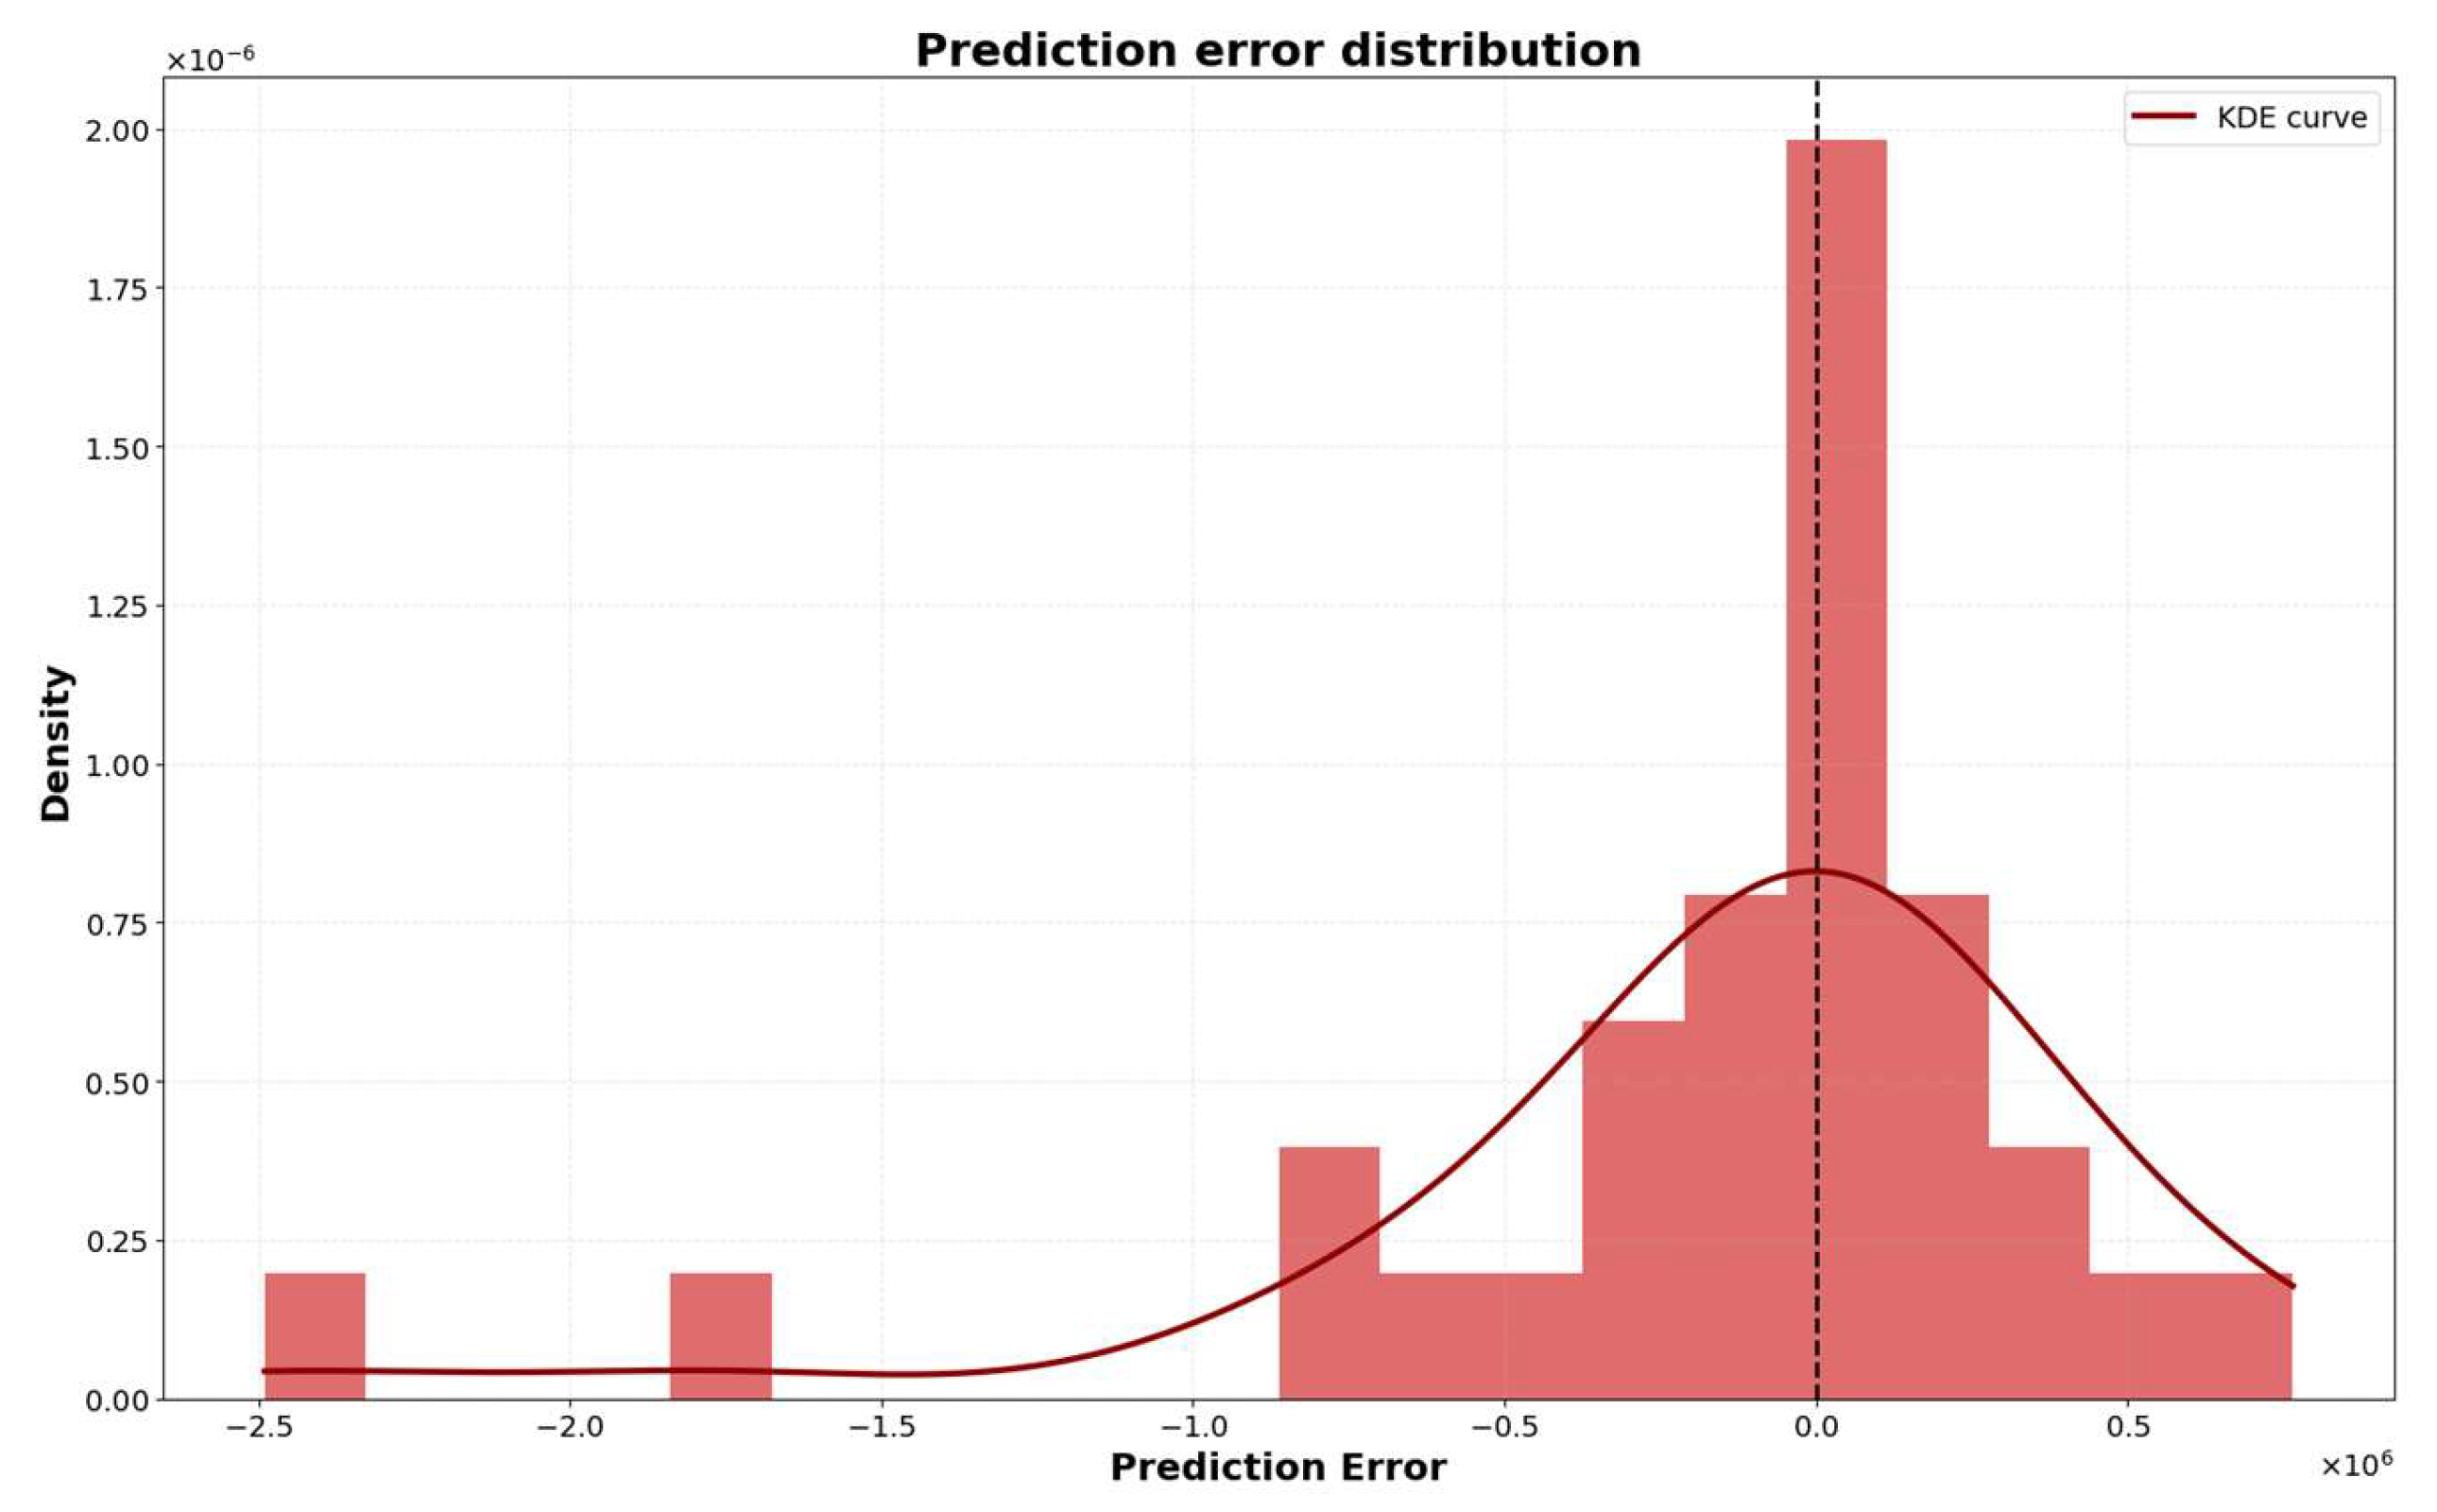
To better understand error characteristics, Figure 5 shows the histogram and kernel density estimation (KDE) of forecasting errors. The majority of errors are concentrated around zero, confirming the reliability of the model, though a small number of extreme deviations remain.
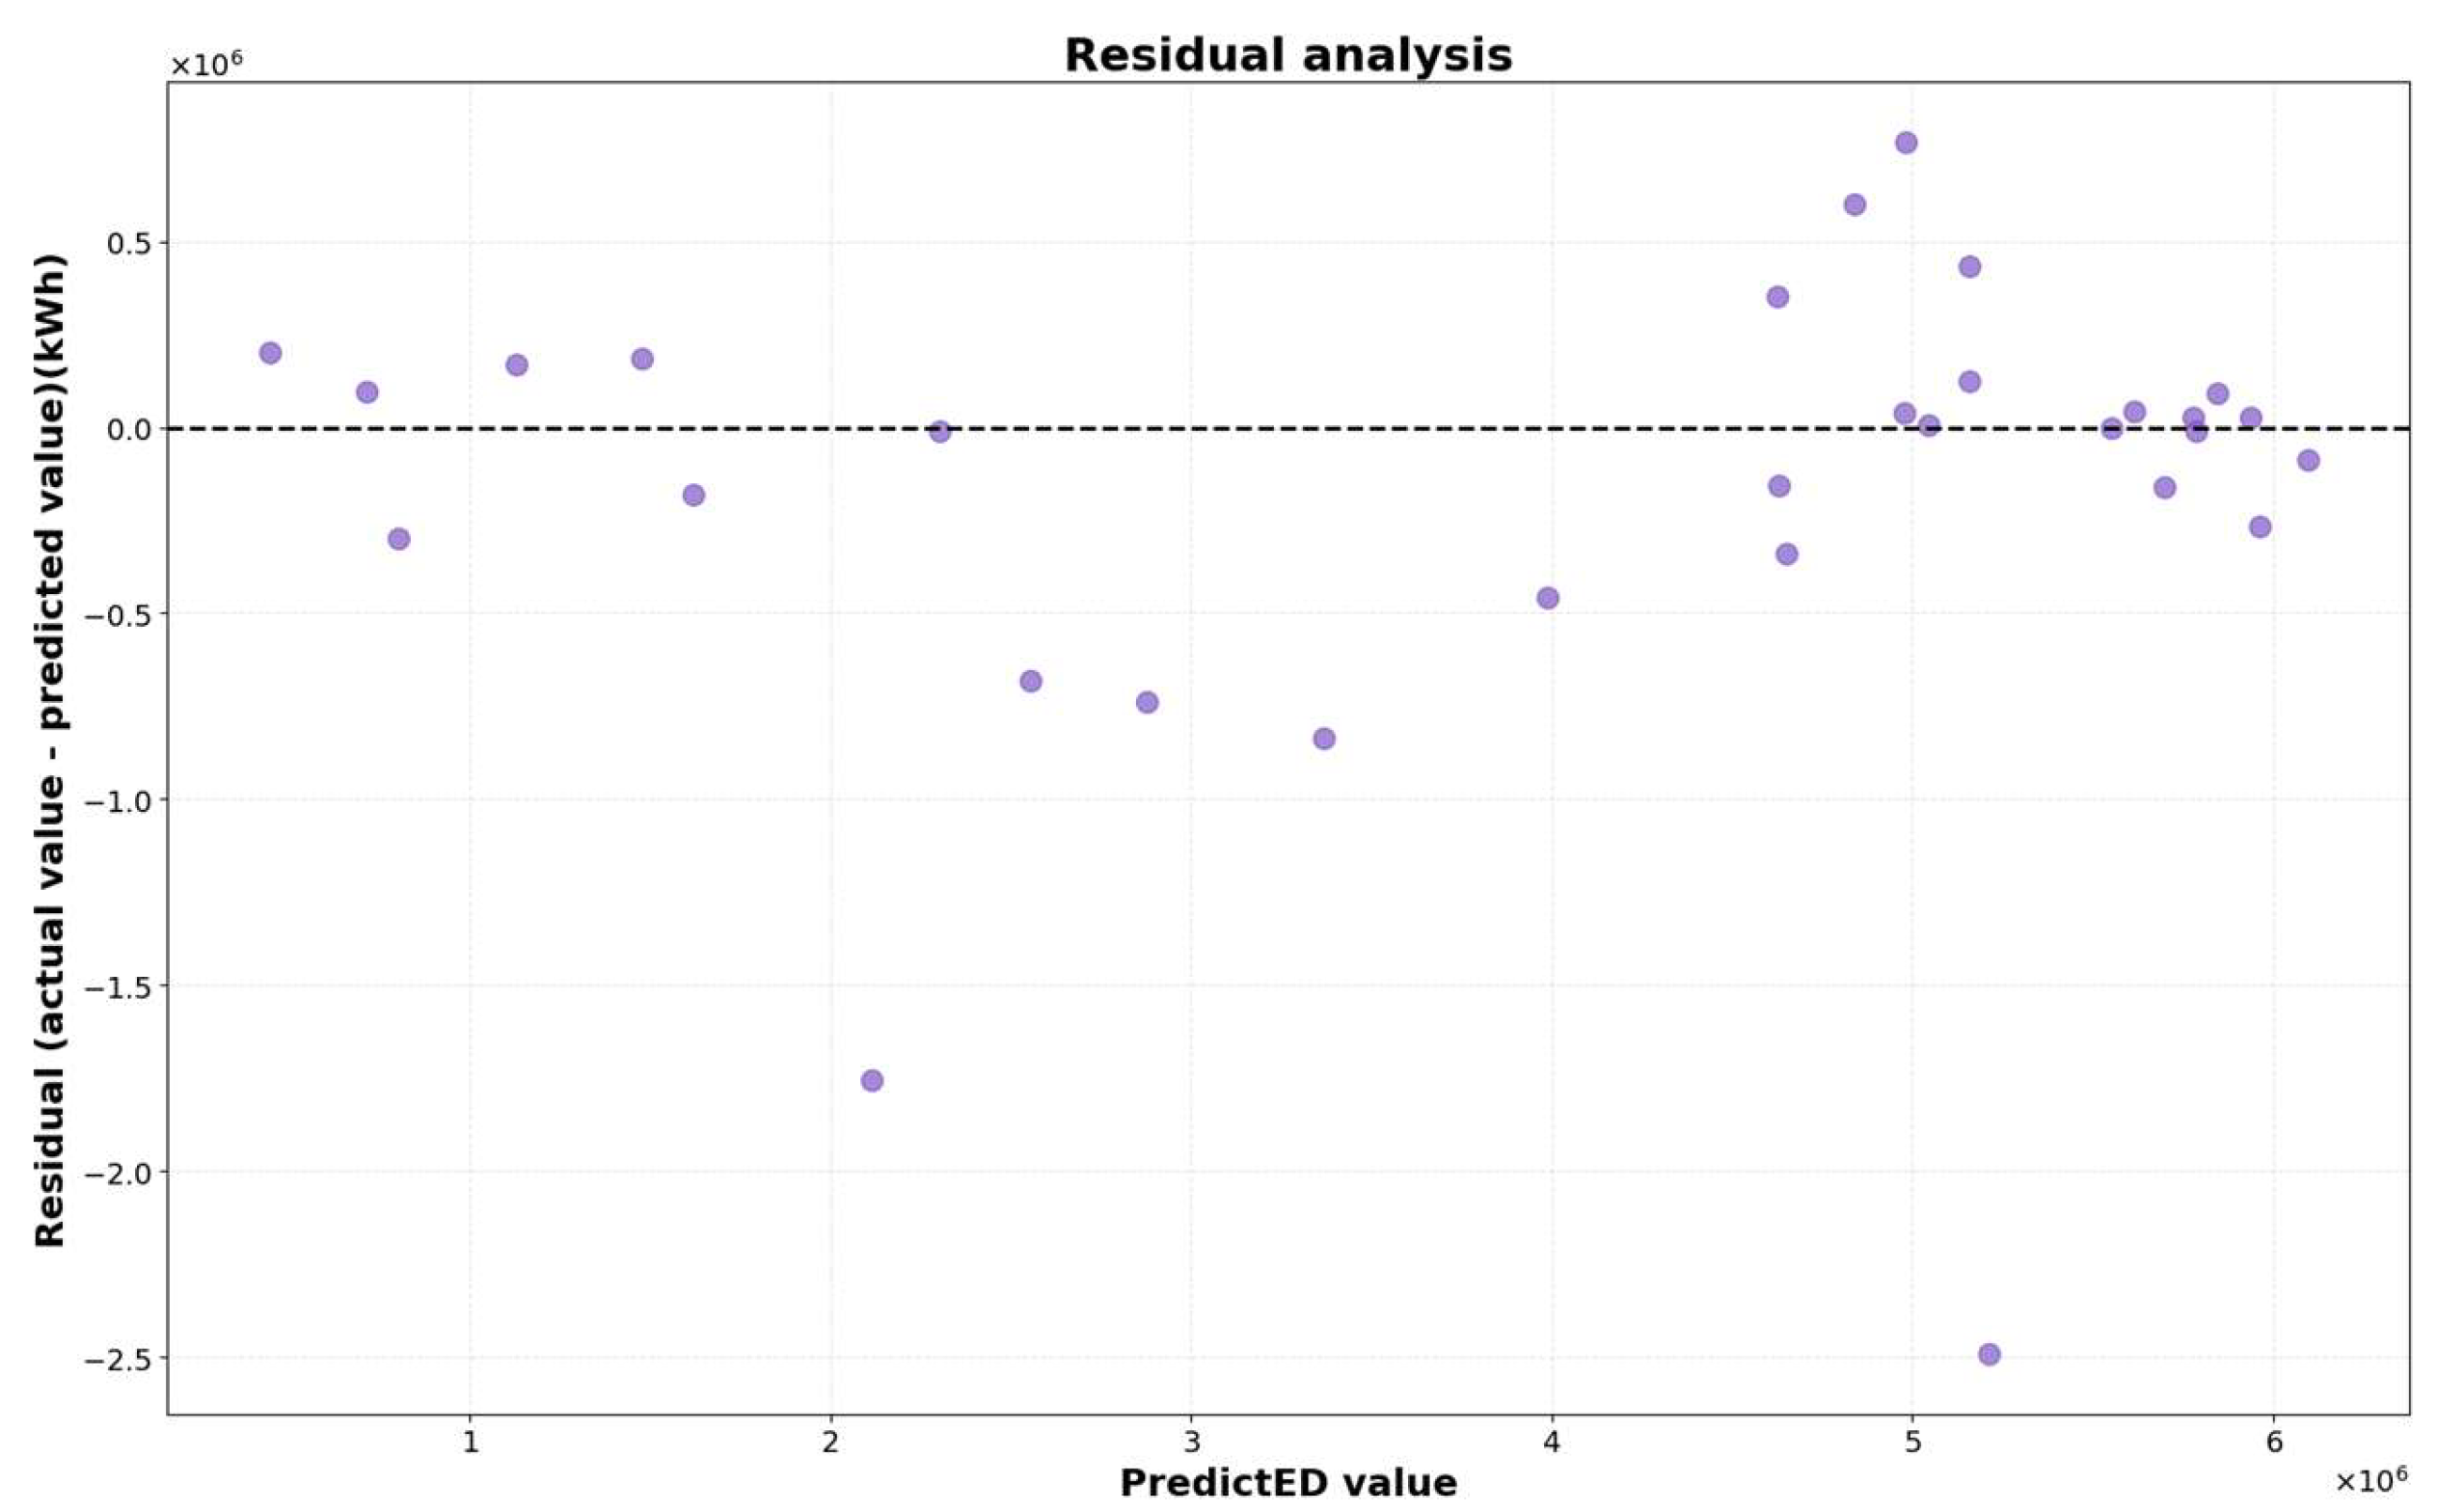
Figure 6 presents the residual analysis, where residuals are scattered around the zero-reference line without clear bias, further supporting the model’s stability. However, some outliers are observed far from the reference line, suggesting the influence of special conditions such as rare weather events.
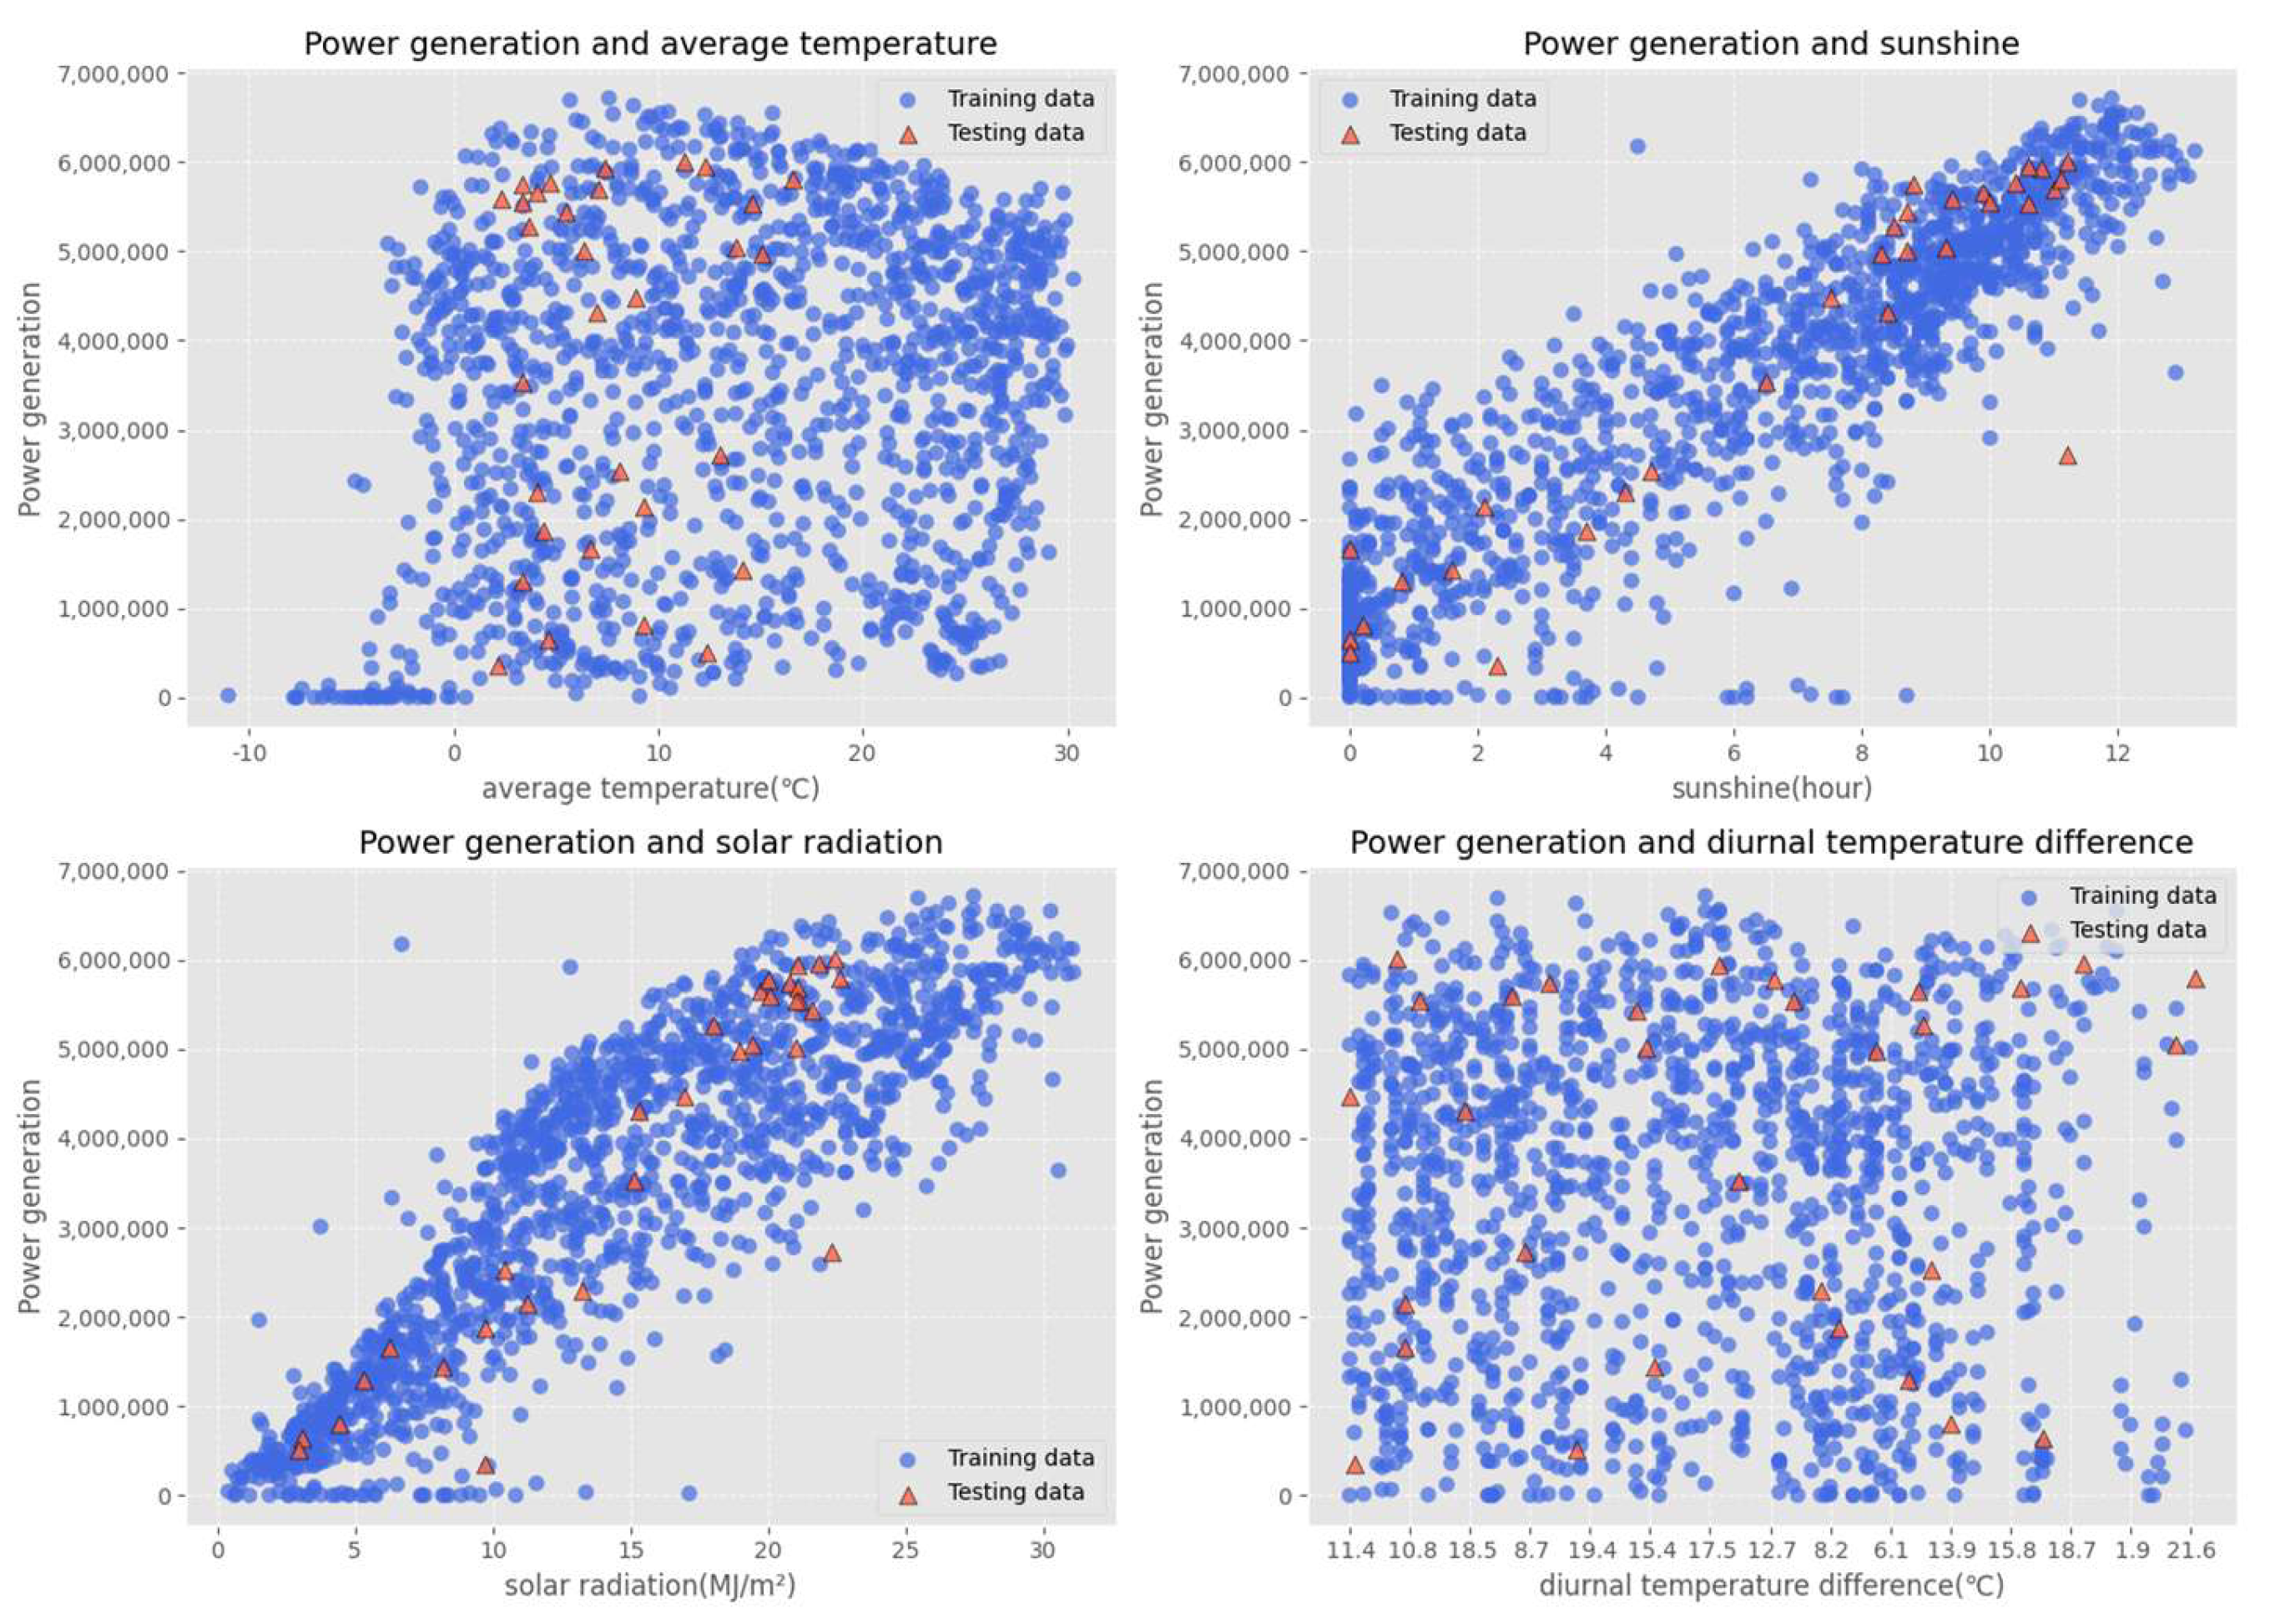
The relationship between PV generation and meteorological variables is shown in Figure 7. The scatter plots confirm that average temperature, sunlight duration, solar radiation, and diurnal temperature differences all contribute differently to power generation. For instance, solar radiation demonstrates a strong positive correlation with generation up to 10 MJ/m2, after which the effect saturates. Sunlight duration also shows a clear driving effect, with longer sunshine hours leading to higher output, while temperature effects appear weaker and more dispersed. These findings highlight the importance of incorporating diverse meteorological features into the forecasting framework.
To provide a benchmark, Figure 8 shows the comparison of forecasting performance among LightGBM, LSTM, and ARIMA models. LightGBM achieved the lowest errors (MAE = 37.49, RMSE = 64.67) and the highest explanatory power (R2 = 0.89), outperforming LSTM (MAE = 45.32, RMSE = 72.14, R2 = 0.82) and ARIMA (MAE = 52.76, RMSE = 81.25, R2 = 0.75). These results confirm the superiority of LightGBM in medium-term PV forecasting, demonstrating its robustness, accuracy, and efficiency in capturing generation fluctuations under varying conditions.
Overall, the results validate the effectiveness of the proposed LightGBM framework in integrating meteorological and historical features for medium-term PV power forecasting. The model not only achieves high accuracy under normal conditions but also identifies the key challenges posed by extreme weather and equipment anomalies, providing a solid foundation for future model improvements.

5. Conclusions

This paper proposed a Light Gradient Boosting Machine (LightGBM) framework for medium-term photovoltaic (PV) power forecasting by integrating meteorological features with historical generation data. A composite feature set, including temporal, meteorological, interaction, and lag variables, was constructed, and feature importance analysis with recursive feature elimination (RFE) was applied to optimize the inputs. Bayesian optimization and time-series cross-validation were further employed to enhance the robustness and generalization of the model.
Experimental results demonstrated that the proposed approach achieved strong predictive performance, with an MAE of 37.49, an RMSE of 64.67, an R2 of 0.89, and an overall accuracy of 92.23%. These results confirm that LightGBM effectively balances accuracy, interpretability, and computational efficiency. The analysis also revealed that the model performed particularly well under stable weather conditions, while larger deviations were observed during extreme weather events or equipment anomalies.
Future work will focus on further enhancing the model by incorporating additional features such as equipment operating status, satellite-based solar radiation data, and spatial information from multiple PV sites. In addition, hybrid approaches that combine LightGBM with deep learning architectures or ensemble learning strategies may improve resilience under complex meteorological conditions. Ultimately, the proposed framework provides a reliable solution for medium-term PV forecasting and offers valuable support for power system dispatch, renewable energy integration, and grid stability enhancement.

Author Contributions

methodology, Y.Y.; writing—original draft preparation, Y.Y.; supervision, S.-H.L.; formal analysis, Y.-S.C.; writing—review and editing, K.-M.L. All authors have read and agreed to the published version of the manuscript.

Funding

This work was supported by the Korea Institute of Energy Technology Evaluation and Planning (KETEP) and the Ministry of Trade, Industry & Energy (MOTIE) of the Republic of Korea. (No. RS-2025-07852969).

Data Availability Statement

The original contributions presented in this study are included in the article. Further inquiries can be directed to the corresponding author.

Acknowledgments

The authors would like to thank all those who provided valuable comments and suggestions to improve the quality of this study.

Conflicts of Interest

The authors declare no conflicts of interest.

Abbreviations

PVPhotovoltaic
RFERecursive feature elimination
IEAInternational energy agency
NWPNumerical weather prediction
SVMSupport vector machines
ANNArtificial neural networks
ELMExtreme learning machines
RNNsRecurrent neural networks
LSTMLong short-term memory
LightGBMLight gradient boosting machine
MAEMean absolute error
RMSERoot mean square error
KDEKernel density estimation

References

  1. Antonanzas, J.; Osorio, N.; Escobar, R.; Urraca, R.; Martinez-de-Pison, F.J.; Antonanzas-Torres, F. Review of Photovoltaic Power Forecasting. Sol. Energy 2016, 136, 78–111. [Google Scholar] [CrossRef]
  2. Hossain, M.S.; Mahmood, H. Short-Term Photovoltaic Power Forecasting Using an LSTM Neural Network and Synthetic Weather Forecast. IEEE Access 2020, 8, 172524–172533. [Google Scholar] [CrossRef]
  3. Wan, A.; Chang, Q.; AL-Bukhaiti, K.; He, J. Short-Term Power Load Forecasting for Combined Heat and Power Using CNN-LSTM Enhanced by Attention Mechanism. Energy 2023, 282, 128274. [Google Scholar] [CrossRef]
  4. Zhang, M.; Zhen, Z.; Liu, N.; Zhao, H.; Sun, Y.; Feng, C.; Wang, F. Optimal Graph Structure Based Short-Term Solar PV Power Forecasting Method Considering Surrounding Spatio-Temporal Correlations. IEEE Trans. Ind. Appl. 2023, 59, 345–357. [Google Scholar] [CrossRef]
  5. Alhussein, M.; Aurangzeb, K.; Haider, S.I. Hybrid CNN-LSTM Model for Short-Term Individual Household Load Forecasting. IEEE Access 2020, 8, 180544–180557. [Google Scholar] [CrossRef]
  6. Peng, Y.; Wang, S.; Chen, W.; Ma, J.; Wang, C.; Chen, J. LightGBM-Integrated PV Power Prediction Based on Multi-Resolution Similarity. Processes 2023, 11, 1141. [Google Scholar] [CrossRef]
  7. Kim, T.; Ko, W.; Kim, J. Analysis and impact evaluation of missing data imputation in day-ahead PV generation forecasting. Appl. Sci. 2019, 9, 204. [Google Scholar] [CrossRef]
  8. Hourly Photovoltaic Power Prediction Based on Signal Decomposition and Deep Learning. Available online: https://www.researchgate.net/publication/379104488_Hourly_photovoltaic_power_prediction_based_on_signal_decomposition_and_deep_learning (accessed on 12 October 2025).
  9. Huang, Y.; Wang, A.; Jiao, J.; Xie, J.; Chen, H. Short-Term PV Power Forecasting Based on CEEMDAN and Ensemble DeepTCN. IEEE Trans. Instrum. Meas. 2023, 72, 2526012. [Google Scholar] [CrossRef]
  10. Faruque, M.O.; Hossain, M.A.; Alam, S.M.M.; Islam, M.R.; Islam, M.R.; Guo, Y. A Hybrid LSTM-LightGBM Model for Precise Short-Term Wind Power Forecasting. In Proceedings of the 2023 IEEE International Conference on Applied Superconductivity and Electromagnetic Devices (ASEMD), Tianjin, China, 27–29 October 2023; pp. 1–2. [Google Scholar]
  11. Robust Photovoltaic Power Forecasting Model Under Complex Meteorological Conditions. Available online: https://www.mdpi.com/2227-7390/13/11/1783 (accessed on 12 October 2025).
  12. Onorato, G. Bayesian Optimization for Hyperparameters Tuning in Neural Networks. arXiv 2024, arXiv:2410.21886. [Google Scholar] [CrossRef]
  13. Macaire, J.; Zermani, S.; Linguet, L. New Feature Selection Approach for Photovoltaïc Power Forecasting Using KCDE. Energies 2023, 16, 6842. [Google Scholar] [CrossRef]
  14. Zhou, H.; Zheng, P.; Dong, J.; Liu, J.; Nakanishi, Y. Interpretable Feature Selection and Deep Learning for Short-Term Probabilistic PV Power Forecasting in Buildings Using Local Monitoring Data. Appl. Energy 2024, 376, 124271. [Google Scholar] [CrossRef]
  15. Mohammed, A.; Kora, R. A Comprehensive Review on Ensemble Deep Learning: Opportunities and Challenges. J. King Saud Univ. Comput. Inf. Sci. 2023, 35, 757–774. [Google Scholar] [CrossRef]
  16. Wang, K.; Shan, S.; Dou, W.; Wei, H.; Zhang, K. A Robust Photovoltaic Power Forecasting Method Based on Multimodal Learning Using Satellite Images and Time Series. IEEE Trans. Sustain. Energy 2025, 16, 970–980. [Google Scholar] [CrossRef]
  17. Xiang, X.; Li, X.; Zhang, Y.; Hu, J. A Short-Term Forecasting Method for Photovoltaic Power Generation Based on the TCN-ECANet-GRU Hybrid Model. Sci. Rep. 2024, 14, 6744. [Google Scholar] [CrossRef] [PubMed]
  18. Wan, C.; Xu, Z.; Pinson, P.; Dong, Z.Y.; Wong, K.P. Probabilistic Forecasting of Wind Power Generation Using Extreme Learning Machine. IEEE Trans. Power Syst. 2014, 29, 1033–1044. [Google Scholar] [CrossRef]
  19. Hyndman, R.J.; Athanasopoulos, G. Forecasting: Principles and Practice; Monash University: Clayton, VIC, Australia, 2018. [Google Scholar]
  20. Elsaraiti, M.; Merabet, A. Solar Power Forecasting Using Deep Learning Techniques. IEEE Access 2022, 10, 31692–31698. [Google Scholar] [CrossRef]
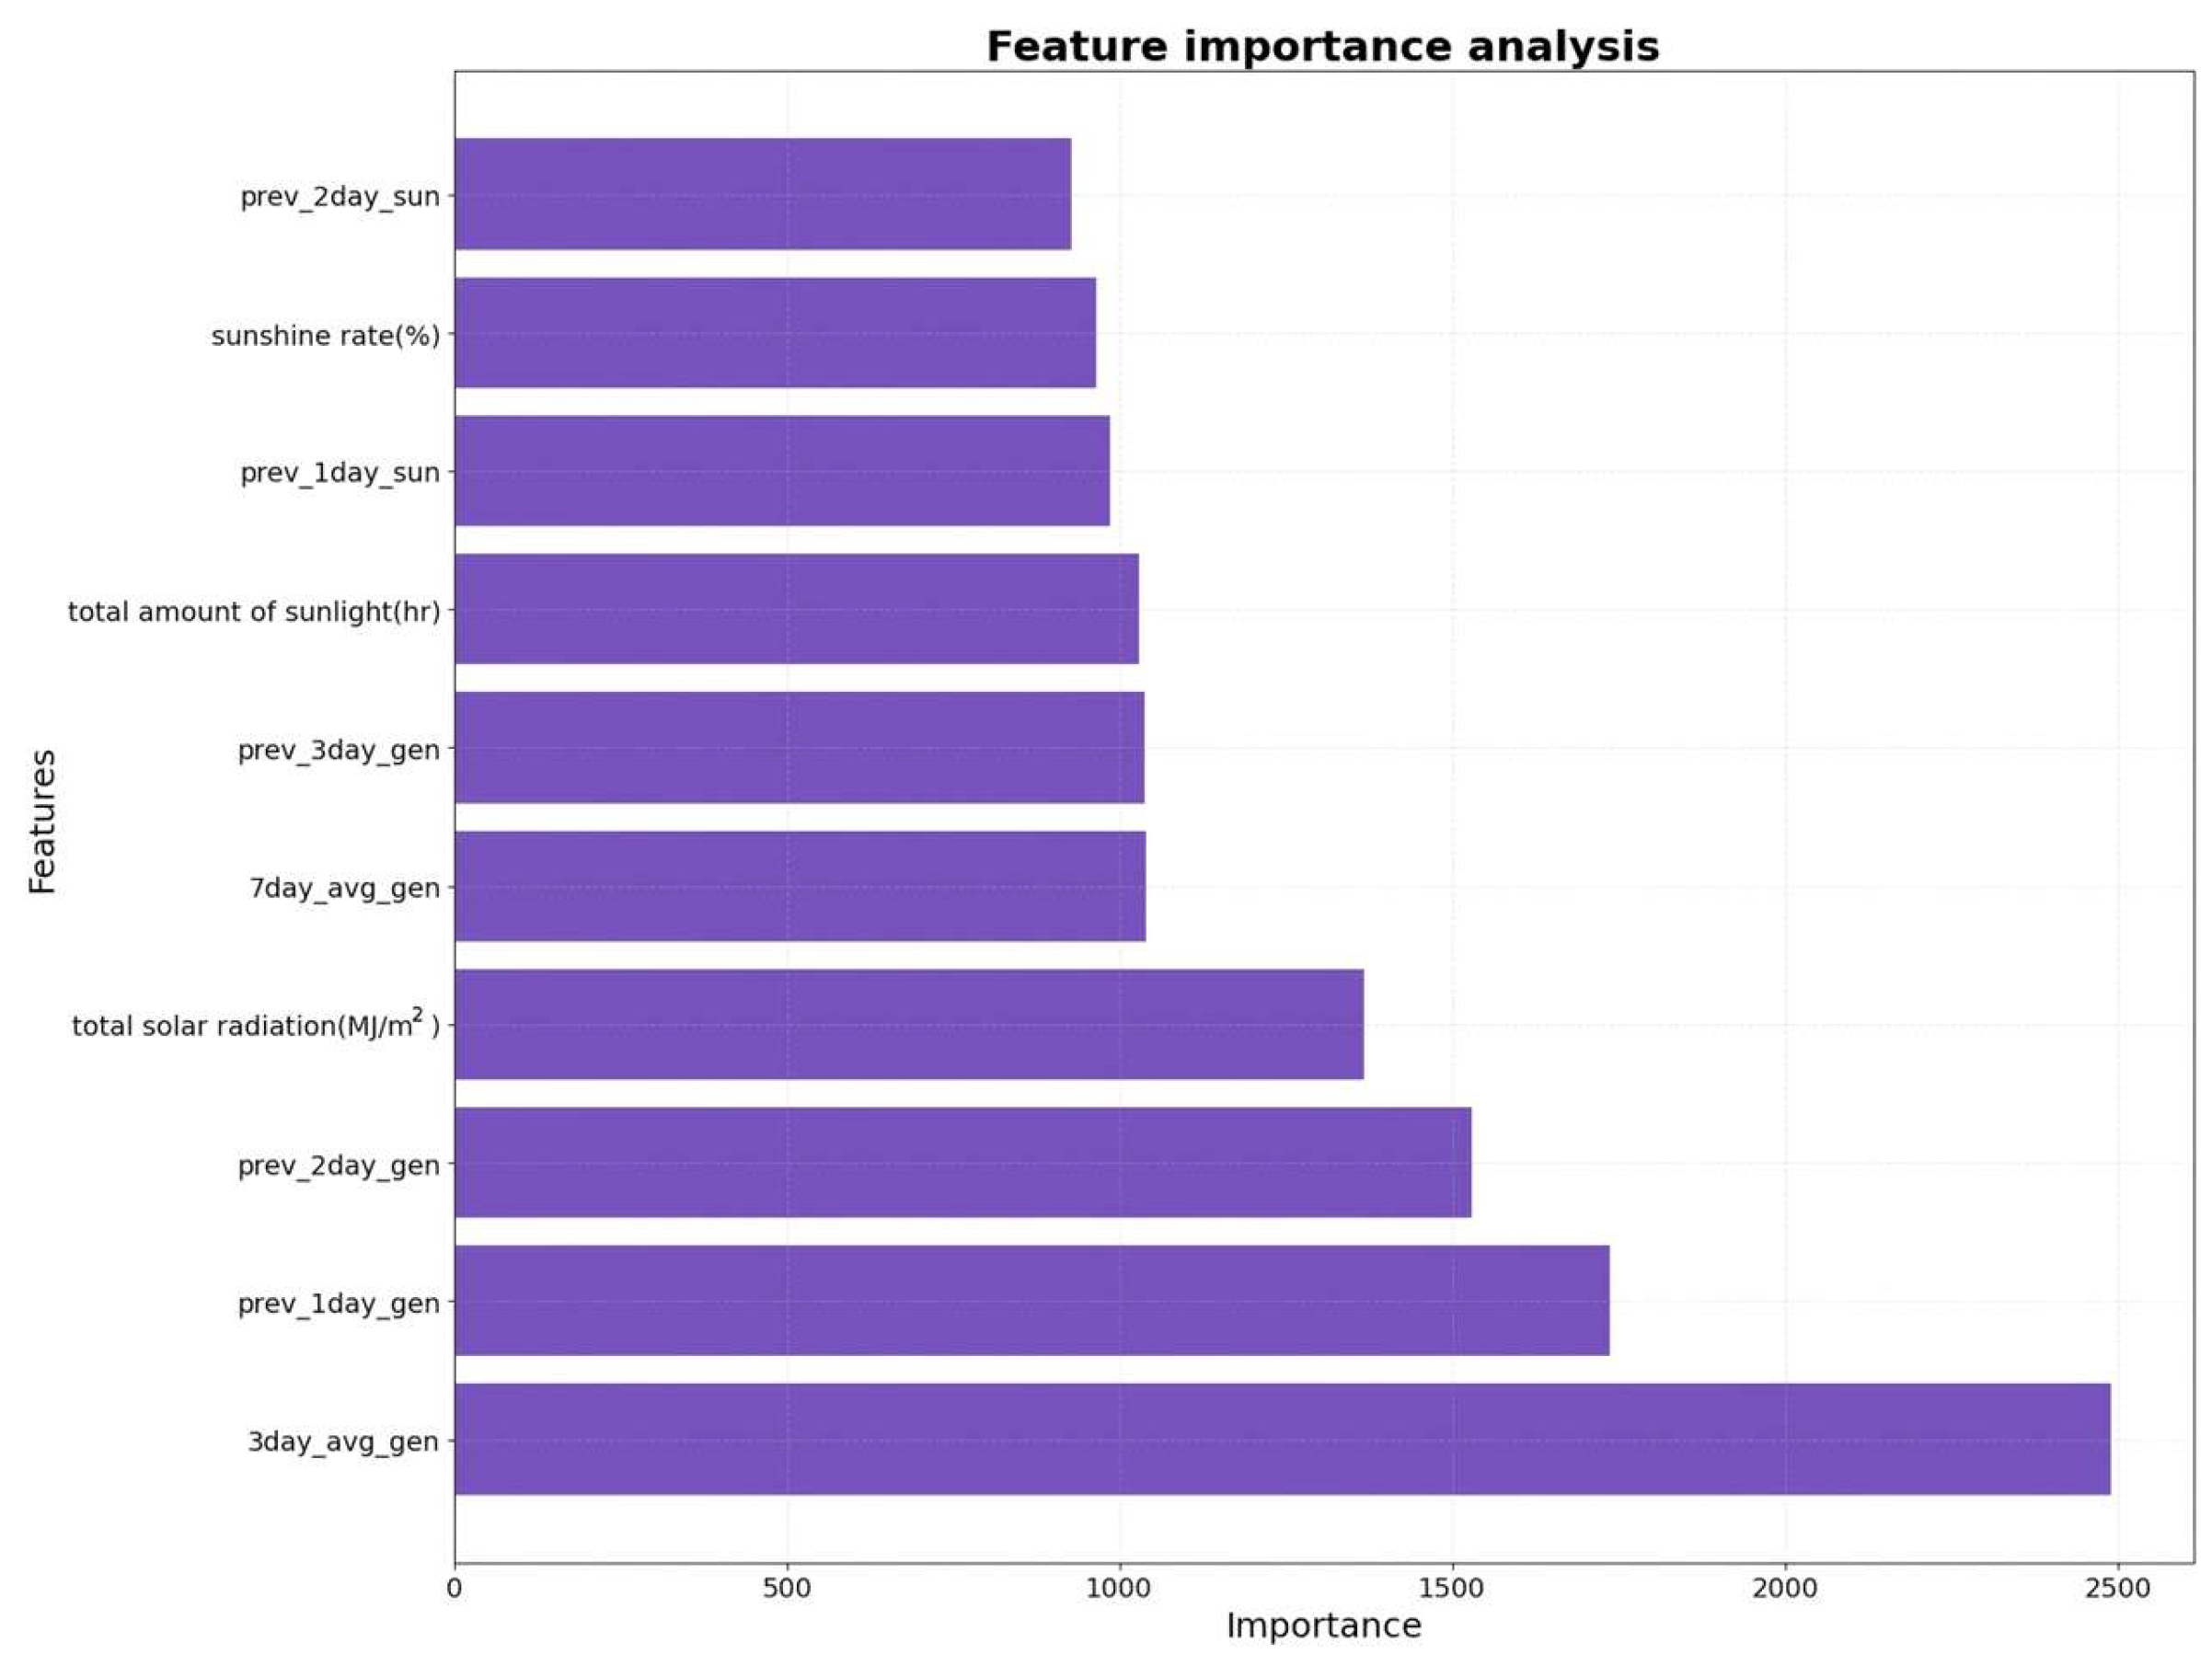
Figure 1. Feature importance analysis.
Energies 18 05526 g001
Figure 2. Construction of LightGBM model.
Energies 18 05526 g002
Figure 3. Power generation forecast for March 2025.
Energies 18 05526 g003
Figure 4. Forecast error analysis.
Energies 18 05526 g004
Figure 5. Prediction error distribution.
Energies 18 05526 g005
Figure 6. Residual analysis.
Energies 18 05526 g006
Figure 7. The relationship between power generation and weather factors.
Energies 18 05526 g007
Figure 8. Comparison of prediction indicators of three models.
Energies 18 05526 g008
Table 1. Feature Importance Ranking and Proxy Elimination Order.
RankFeature NameTypeRelative ImportanceProxy Elimination Order
1prev_1day_genLagged TargetHighestLast (Most Important)
27day_avg_genRolling StatisticVery High-
3prev_2day_genLagged TargetHigh-
43day_avg_genRolling StatisticHigh-
5prev_3day_genLagged TargetHigh-
6total solar radiation (MJ/m2)MeteorologicalMedium-
7total amount of sunlight (hr)MeteorologicalMedium-
Nis_holidayCalendarLowestFirst
Disclaimer/Publisher’s Note: The statements, opinions and data contained in all publications are solely those of the individual author(s) and contributor(s) and not of MDPI and/or the editor(s). MDPI and/or the editor(s) disclaim responsibility for any injury to people or property resulting from any ideas, methods, instructions or products referred to in the content.