Article

Multi-Objective Optimization of Mobile Battery Energy Storage and Dynamic Feeder Reconfiguration for Enhanced Voltage Profiles in Active Distribution Systems

by
Phuwanat Marksan
1,
Krittidet Buayai
1,
Ritthichai Ratchapan
2,
Wutthichai Sa-nga-ngam
1,
Krischonme Bhumkittipich
2,
Kaan Kerdchuen
1,
Ingo Stadler
3,4,
Supapradit Marsong
2,* and
Yuttana Kongjeen
1,*
1
Intelligent Power System and Energy Research (IPER), Department of Electrical Engineering, Faculty of Engineering and Technology, Rajamangala University of Technology Isan Nakhon Ratchasima, Nakhon Ratchasima 30000, Thailand
2
Department of Electrical Engineering, Faculty of Engineering, Rajamangala University of Technology Thanyaburi (RMUTT), Pathum Thani 12110, Thailand
3
Cologne Institute for Renewable Energies (CIRE), TH Köln, 50679 Cologne, Germany
4
Institute for Electrical Power Engineering, TH Köln, 50679 Cologne, Germany
*
Authors to whom correspondence should be addressed.
Energies 2025, 18(20), 5515; https://doi.org/10.3390/en18205515
Submission received: 4 September 2025 / Revised: 6 October 2025 / Accepted: 15 October 2025 / Published: 19 October 2025
(This article belongs to the Special Issue Advances and Optimization of Electric Energy System—2nd Edition)

Abstract

Active distribution systems (ADS) are increasingly strained by rising energy demand and the widespread deployment of distributed energy resources (DERs) and electric vehicle charging stations (EVCS), which intensify voltage deviations, power losses, and peak demand fluctuations. This study develops a coordinated optimization framework for Mobile Battery Energy Storage Systems (MBESS) and Dynamic Feeder Reconfiguration (DFR) to enhance network performance across technical, economic, and environmental dimensions. A Non-dominated Sorting Genetic Algorithm III (NSGA-III) is employed to minimize six objectives the active and reactive power losses, voltage deviation index (VDI), voltage stability index (FVSI), operating cost, and CO2 emissions while explicitly modeling the MBESS transportation constraints such as energy consumption and single-trip mobility within coupled IEEE 33-bus and 33-node transport networks, which provide realistic mobility modeling of energy storage operations. The Technique for Order Preference by Similarity to Ideal Solution (TOPSIS) is applied to select compromise solutions from Pareto fronts. Simulation results across six scenarios show that the coordinated MBESS–DFR operation reduces power losses by 27.8–30.1%, improves the VDI by 40.5–43.2%, and enhances the FVSI by 2.3–2.4%, maintaining all bus voltages within 0.95–1.05 p.u. with minimal cost (0.26–0.27%) and emission variations (0.31–0.71%). The MBESS alone provided limited benefits (5–12%), confirming that coordination is essential for improving efficiency, voltage regulation, and overall system sustainability in renewable-rich distribution networks.

1. Introduction

Electrical power systems in urban areas or premium zones are critical for maintaining a highly reliable and flexible power supply. Due to the high level of power consumption in these regions, it is not feasible to de-energize loads or rely solely on demand-side control. Therefore, energy management systems are required to provide the optimal energy demand and systems with the best solutions. Currently, active distribution systems (ADS) are undergoing rapid structural transformation, driven by the proliferation of distributed energy resource (DERs), particularly photovoltaic (PV) generation, and the accelerating adoption of electric vehicles (EVs) [1]. While these trends provide opportunities for decarbonization and operational flexibility, they also introduce significant challenges. These include midday reverse power flow, steep evening ramps, voltage excursions caused by variable PV output, thermal congestion on feeders, and intensified evening peaks from coincident charging demand. Conventional mitigation assets such as static capacitors, on-load tap changers, and fixed battery systems address some of these issues, but their effectiveness is often dependent on location and limited when operating conditions shift spatially across the network [1,2].

1.1. Background and Motivation

Urban areas or premium zones are characterized by complex infrastructures, electrical networks, and economic activities. Due to these limitations, the electrical power system in such areas often cannot be easily extended or upgraded. In the worst-case scenario, strict control conditions must be maintained and managed to ensure stability. In this context, the mobile battery energy storage system (MBESS) is a suitable solution, as it can enhance distribution-level flexibility by decoupling the location and timing of energy storage delivery. Unlike stationary systems, MBESS units can be charged at strategic nodes such as depots or substations with inexpensive or low-carbon energy and then transported to feeder segments where their services have the highest marginal value. These services include peak shaving, loss reduction, voltage regulation, and resilience support during contingencies [3,4]. The mobility of MBESS introduces a co-optimization challenge spanning both power and transportation networks, where dispatch decisions must account for travel time, state-of-charge (SOC) dynamics, and safe grid interconnection logistics [5]. A complementary strategy is dynamic feeder reconfiguration (DFR), which reshapes feeder topology through remotely controlled switches. The DFR redistributes power flows, alleviates thermal loading, and improves voltage profiles and reliability indices without requiring significant infrastructure upgrades [6]. However, reconfiguration alone may be insufficient to mitigate rapid fluctuations from the DERs and EV charging. Similarly, the MBESS may be underutilized if deployed in unfavorable topological conditions. This motivates a joint optimization of the MBESS operation and the DFR, enabling storage mobility and adaptive feeder topology to co-evolve with changing grid conditions [7].
As shown in Figure 1, the MBESS units are charged at designated charging stations during periods of renewable energy over-generation and are then dispatched via roadways to weak nodes in the distribution network. At the destination, the MBESS discharges energy to support grid voltage, improve reliability, and enhance renewable utilization. The energy management system (EMS) coordinates the MBESS charging, routing, and discharging based on grid conditions and voltage profiles.
In this study, we target single-day operations, a relevant horizon for distribution operators and aggregators where a mobile unit charges at a designated station and is dispatched once to an optimal load point (one-way movement) for discharge during the evening peak. This stylized but practical setup captures the core coupling between (i) energy arbitrage and peak shaving benefits, (ii) voltage and loss impacts under DERs variability, and (iii) transportation time/energy costs and operational risk. The overarching aim is to demonstrate how an integrated the MBESS–DFR strategy can yield system-level benefits that neither lever achieves alone.

1.2. Literature Review and Research Gaps

Energy management in the ADS is a critical issue that involves addressing challenges from both the energy demand side and the energy providers. Many researchers have focused on improving ADS performance and reducing its associated risks. The key perspectives of this study are presented through a review of the literature, identification of research gaps, and clarification of the purpose and contributions, as outlined below.

1.2.1. Literature Review

Recent research highlights the role of the MBESS as a flexible resource for addressing operational challenges in distribution networks. For instance, Tong et al. [8] proposed a multi-scenario and multi-objective collaborative optimization framework that integrates the spatiotemporal transfer of mobile storage with EV charging demand. Their findings indicated that coordinated scheduling improves renewable energy utilization, reduces operating costs, and alleviates voltage limit violations compared with stationary storage. Saboori and Jadid [9] presented a spatial temporal optimization model for a self-powered truck-mounted MBESS, incorporating transportation time, cost, and reactive power capabilities into daily scheduling. Their findings confirmed that mobile deployment yields greater reductions in operating costs, energy loss, and peak substation demand, while also improving voltage profiles, compared with stationary battery systems. In addition, Ahmed et al. [10] developed a stochastic planning model for optimal sizing and scheduling of MBESS in systems with high penetration of renewable energy and fast-charging stations. The model simultaneously determined the sizes and transportation schedules of mobile storage along with renewable generation and charging infrastructure, demonstrating significant cost savings and enhancing the hosting capacity of green technologies in benchmark distribution networks. Sun et al. [11] proposed an equivalent reconfiguration method (ERM) to simplify the economic scheduling of MBESS by introducing a “virtual switch” mechanism that transforms grid–traffic coupling into a pure distribution network reconfiguration problem. The scenario-based stochastic optimization model accounted for renewable and traffic uncertainties, and case studies on the IEEE 33-bus system demonstrated that MBESS deployment not only increased operator profit but also enhanced renewable energy absorption, maintained voltage stability, and reduced curtailment compared with stationary storage. Jeon and Choi [12] developed a joint optimization framework that co-optimizes Volt/VAR control devices such as OLTCs, capacitor banks, PV inverters together with MBESS routing and scheduling under PV output uncertainty. The model was formulated as a chance-constrained MILP and tested on IEEE 13- and 33-bus systems coupled with transportation networks. The results demonstrated that the coordinated Volt/VAR–MBESS scheduling reduced real power losses, peak load, and voltage deviations more effectively than methods relying solely on static storage, while accounting for traffic congestion, and PV forecast errors. Xia et al. [13] established an optimal planning model for MBESS in active distribution networks, aiming to minimize the annual system costs by incorporating investment, operation, renewable curtailment, and network loss costs, together with peak-valley arbitrage. The model introduced coupled constraints of energy and displacement based on a sliding time window and was solved using second-order cone relaxation with the large-M method. Simulation on the IEEE 33-bus system demonstrated that the optimized MBESS configuration effectively reduced operational costs, curtailed renewable spillage, enhanced voltage regulation, and smoothed load fluctuations. Liu et al. [14] formulated a multi-objective dispatch model for mobile energy storage vehicles (MESVs) in active distribution networks with the objectives of minimizing power losses, renewable curtailment, and total operating costs. A bilevel optimization framework was proposed, where the inner layer employed the normalized normal constraint method to generate Pareto-optimal solutions, and the outer layer applied an improved Nelder-Mead algorithm to directly obtain a compromise optimal solution. Case studies on modified IEEE 33-bus and large-scale 180-bus networks demonstrated that the proposed approach not only improved computational efficiency but also enhanced renewable energy accommodation, voltage regulation, and peak-load shaving compared with traditional methods. Ganivada et al. [15] proposed a bi-level multi-objective optimization framework for jointly siting and sizing mobile (MESS) and static (SESS) energy storage in distribution systems with high renewable penetration. The model maximized operator profit while minimizing the expected cost of lost load under contingencies, solved through a cooperative co-evolving particle swarm optimization (CC-PSO) algorithm. Case studies on the IEEE 33-bus system demonstrated that the hybrid MESS–SESS configuration reduced peak demand, ramp rates, reverse power flow, and energy losses compared with MESS-only or SESS-only strategies, while also enhancing resilience during internal and external outages. Kim and Lee [16] introduced a day-ahead scheduling strategy for distribution networks with offline-controlled PVs and MBESS to mitigate renewable energy curtailment caused by overvoltage. The framework modeled MBESS charging, discharging, idle, and moving states, while considering transportation time and power loss, and it incorporated OPF with probabilistic limits for PV outputs. Case studies on the IEEE 33 bus distribution network coupled with a 15-node transportation system demonstrated that the proposed approach significantly reduced PV curtailment under uncertainty with only marginal increases in operational costs. Feng et al. [17] proposed a coordinated two-layer optimization framework for fixed and mobile energy storage systems to enhance photovoltaic absorption under voltage offset constraints. The upper layer minimized the combined investment and operating costs of fixed and mobile storage, while the lower layer optimized 24 h charge–discharge scheduling to reduce voltage deviations. A hybrid particle swarm–gravitational search algorithm (PSO-GSA) was employed to address the model’s nonlinear complexity. Simulation on the IEEE 33 bus distribution system showed that coordinated fixed–mobile storage scheduling improved PV integration capacity, reduced voltage offsets, and enhanced overall system economy compared with single-storage strategies. Guo et al. [18] proposed a coordinated operation strategy for active distribution networks and MBESS using a Stackelberg game framework. The ADN, acting as the leader, determined dynamic reconfiguration, voltage regulation, and pricing mechanisms, while the MBESS, as the follower, optimizes charge–discharge scheduling and mobility decisions to maximize revenue. The bi-level problem was transformed into a single-layer MILP using KKT conditions. Simulations on an improved IEEE 33 bus system showed that the demonstrated approach reduced total social costs by 2.2%, decreased voltage deviation by 6%, and enhanced renewable utilization compared with non-game strategies, confirming the effectiveness of game-theoretic coordination between ADN and mobile storage. Lai et al. [19] introduced a mobile energy storage configuration method to enhance voltage stability and reduce power losses under varying generation and load conditions. A multi-objective optimization model was formulated with the objectives of minimizing power losses, improving voltage stability, and increasing the utilization of mobile energy storage devices. The problem was solved using a multi-objective particle swarm optimization (MOPSO) algorithm combined with TOPSIS for decision-making. Case studies on the IEEE 33 bus distribution system demonstrated that compared with stationary storage, the proposed method reduced voltage vulnerability by 29%, decreased power losses by 36%, and improved storage utilization by 33.5%, thereby confirming the operational benefits of mobility in storage deployment. Miao et al. [20] investigated the hybrid scheduling of mobile and stationary energy storage systems in active distribution networks while explicitly modeling real urban road topologies. A bi-objective optimization model was developed to maximize net scheduling benefit and minimize voltage deviations, incorporating MESS routing based on a Dijkstra algorithm applied to quantified traffic networks. The model was solved using NSGA-III, and case studies with realistic load and renewable profiles demonstrated improved profitability, enhanced voltage stability, and reduced power losses compared with traditional scheduling approaches. The results underscored the importance of considering real road constraints in hybrid ESS dispatch for practical deployment. Ji et al. [21] proposed a flexible distribution network dispatch strategy integrating MBESS with soft open points (SOPs) to improve both economic performance and stability under high renewable penetration. The co-scheduling model jointly optimized MBESS charge–discharge operations and SOP active reactive power flows with objectives of maximizing net scheduling benefit and minimizing total voltage deviations. Using NSGA-III, simulations on a coupled Chengdu regional road network and the IEEE 33-node system demonstrated that the joint SOP–MBESS dispatch reduced peak-to-valley load difference by 20.1%, decreased total voltage deviation by 52.9%, and yielded significant arbitrage revenue, confirming the complementary benefits of combining temporal flexibility from MBESS and spatial regulation from SOPs. Qiao et al. [22] proposed a coordinated optimization framework that integrates MBESS scheduling with dynamic network reconfiguration (DNR) to simultaneously manage active and reactive power in active distribution networks. The approach incorporated transportation constraints including traffic congestion by mapping MESS routing into equivalent virtual switches within the ADN. The problem was formulated as a mixed-integer second-order cone programming model and solved using a penalty alternating direction method to enhance computational efficiency. Case studies on the IEEE 33-bus system and extended IEEE 69-bus system demonstrated that the proposed method reduced network losses, improved voltage quality, decreased transportation costs, and promoted renewable energy consumption compared with independent DNR or MBESS strategies. Farzin et al. [23] presented a multi-objective planning framework for MBESS in active distribution networks that simultaneously considered investment, transportation, operating costs, and reliability improvement. The model jointly optimized capacity, spatial allocation, and charge–discharge scheduling under both normal and contingency conditions, with reliability measured by the expected energy not supplied (ENS) index. To incorporate network constraints, an iterative power flow integration method was proposed, while an analytical model was employed for ENS estimation. The framework was solved using NSGA-II and benchmarked against alternative multi-objective methods such as weighted-sum, ε-constraint, and goal programming. Case studies on IEEE 34 and 69 bus test systems demonstrated that the proposed approach effectively balanced annual costs and reliability, achieving ENS reductions of more than 20% while keeping costs within practical ranges.

1.2.2. Research Gaps

The literature review explains several significant deficiencies in the utilization of the MBESS integrated distribution networks. Most of the existing research is predominantly concentrated either on planning processes or operational methodologies, whereas integrated frameworks that simultaneously optimize both aspects are notably limited. Furthermore, the interrelationship between power and transportation networks on the roadway has been frequently oversimplified, neglecting to represent realistic variables accurately, such as road topology, travel durations, and mobility limitations. Concurrently, considerations surrounding reliability and resilience, including the anticipated energy not supplied (ENS), have garnered insufficient scholarly focus. The investigation into MBESS has, consequently, been markedly limited. Additionally, the mechanisms for decision support that facilitate the selection of a practical compromise solution from multi-objective Pareto sets remain inadequately developed.
Moreover, most current frameworks, including our proposed centralized optimization, do not consider privacy concerns between electricity and transportation operators. A decentralized optimization strategy, where sub-problems exchange only boundary variables, could enhance both realism and data protection. This remains an open research area [24].
Furthermore, resilience-oriented strategies for MBESS operation, such as degradation monitoring, fault isolation, and service recovery mechanisms, have received limited scholarly attention. Current studies focus primarily on economic and technical optimization, while system resilience under contingencies remains underexplored [25].
In response to these identified deficiencies, this research develops a comprehensive optimization framework for scheduling the MBESSs and DFR within ADS. The proposed framework explicitly incorporates 96 periods per day and one-trip mobility constraints, along with multiple operational objectives. The proposal aims to achieve cost reduction, minimize losses, enhance voltage profiles, and reduce carbon emissions. The Non-dominated Sorting Genetic Algorithm III (NSGA-III) is adapted to generate a varied Pareto front, while multi-criteria decision-making methodologies are utilized to ascertain the most appropriate solution for practical application. The main research gaps identified in the literature review are shown in Table 1.

1.3. Purpose, Contributions, and Structure

The aims of this study are focused on enhancing voltage profiles through the application of multi-objective optimization techniques, incorporating the MBESS and the DFR operations. Therefore, the purpose of this study and its primary contributions can be summarized as follows.

1.3.1. The Purpose of This Study

This article develops and evaluates a co-optimization framework that coordinates multi-MBESS operation and DFR to improve the operational performance of an active distribution network system. The wind turbine generator, PV system, and demand for EV charging are integrated by a fixed point in the grid that is used to evaluate the impact of power generation and load variation. The framework targets 96 periods per day in which a mobile unit charges at a root node station and moves once to an optimal discharge location during the evening peak or weakness point.

1.3.2. Primary Contributions

This work offers significant contributions to the optimization of power systems and the integration of MBESS into infrastructure.
  • An operational framework that integrates MBESS with DFR First item.
Researchers established several power-transport coupling constraints, which encompass restrictions on AC power flow, voltage profiles, feeder switch states (to maintain radiality during reconfiguration), the MBESS state of charge dynamics, and single-trip journey time/energy considerations from the depot to the vulnerable node or weakness point.
2.
NSGA-III for multi-objective co-optimization.
We provide a viable and comprehensive multi-objective optimization framework designed to simultaneously minimize (i) active power losses, (ii) voltage variations, and (iii) total operating costs. This encompasses expenses for energy procurement, transportation and processing of MBESS, and, if relevant, proxy fees for carbon pricing. The Non-Dominated Sorting Genetic Algorithm III (NSGA-III) is employed to effectively identify the Pareto-optimal frontier within the context of mixed-integer, nonconvex constraints associated with operating an active distribution system.
3.
Identifying compromises solution.
Normalization employs pipeline and a Technique for Order Preference by Similarity to Ideal Solution (TOPSIS) selector to transition from a Pareto set to a singular dispatch plan. This establishes a definitive “best-balanced” solution that effectively equilibrates cost, efficiency, and power quality.
4.
Proper testbed and circumstances.
We evaluate six scenarios utilizing a common radial distribution benchmark that encompasses attributes for photovoltaic generation and electric vehicle charging. The scenarios are as follows: (i) the basic ADS configuration; (ii) ADS integrated with MBESS; (iii) ADS including both MBESS and DFR; (iv) ADS integrated with DERs; (v) ADS with both DERs and MBESS; and (vi) ADS incorporating DERs, MBESS, and DFR integration. This methodical procedure enables systematic assessment of both the individual and collective synergy impacts of each lever.
5.
Practical recommendations for implementation.
The study evaluates the situations in which mobile battery energy storage is significantly more advantageous than stationary storage, examines how DFR modifies the ideal discharge position, and determines the extent to which time and energy limitations associated with mobility restrict the potential grid benefits. The findings highlight realistic guidelines for depot placement, optimal discharge time, and switch design in photovoltaic-centric environments.
The remainder of this study is organized as follows. Section 2 introduces the problem formulation and system modeling framework. Section 3 presents the solution methodology. Section 4 reports the results and discusses key findings. Section 5 concludes the study and outlines potential directions for future research.

2. Problem Formulation

This study focuses on the dispatch energy from the surplus energy. One of the most important computational tools in power system engineering is load flow analysis, which is also called power flow analysis. It uses a given set of loads and power sources.

2.1. Load Flow Analysis

One of the most important computational tools in power system engineering is load flow analysis, which is also called power flow analysis. With a given set of loads and power sources, the goal is to find the electrical network’s steady-state operating conditions. It is important for evaluating system dependability, voltage stability, and loss reduction tactics; these are the results of this study, which comprise voltages on buses, injections of active and reactive power, and power flows across transmission lines [26]. For large-scale and meshed power distribution networks, the Newton-Raphson approach is used in this study because of its computing efficiency and excellent convergence properties. Using this approach, we may find solutions to a system of nonlinear algebraic equations that are based on the power balancing circumstances at each bus.

2.1.1. Power Flow Calculation

The steady state power balance equations for each bus i in the system are formulated as follows [27]:
P i Grid + P i DER + P i MBESS , dis P i Load P i EVCS P i MBESS , cha = j = 1 N V i V j ( G ij cos θ ij + B ij sin θ ij )
Q i Grid + Q i DER + Q i MBESS , dis Q i Load Q i EVCS Q i MBESS , cha = j = 1 N V i V j ( G ij sin θ ij B ij cos θ ij )
The variables in the above power balance equations represent the electrical quantities at each bus in the distribution network. V i and V j denote the voltage magnitudes at buses i and j, respectively, while δ i is the voltage angle at bus i, making θ ij = δ i δ j the phase angle difference between buses. G ij and B ij are, respectively, the conductance and susceptance components of the admittance matrix Y ij , defining the electrical coupling between buses. P i Grid and Q i Grid represent the active and reactive power injections from the main grid, respectively, whereas P i DER and Q i DER denote the corresponding contributions from the DERs. The MBESS can either inject power during discharging, represented by P i MBESS , dis and Q i MBESS , dis , or absorb power during charging, expressed as P i MBESS , cha and Q i MBESS , cha . Meanwhile, P i EVCS and Q i EVCS indicate the active and reactive power consumed by the EVCS, respectively, and P i Load and Q i Load represent the conventional load demand at bus i.
These power flow equations are extended from the conventional steady-state AC power flow formulation in polar coordinates, incorporating various energy components such as the main grid, DERs, EVCS, and MBESS. The inclusion of MBESS charging/discharging terms enables the flexible modeling of bidirectional energy exchange, enhancing the adaptability and resilience of modern distribution networks. The angle difference θ ij = θ i θ j represents the phase shift between buses i and j , which directly influences both active and reactive power flow in the system.

2.1.2. Total Active Power Loss and Reactive Power Loss

The total system loss in balanced power flow can be preliminarily estimated by evaluating the net power at each bus. This is computed as the difference between the power injected into and consumed by each bus, as shown below:
E P ,   loss = f 1 = t = 1 96 i = 1 n P i , inj t + P i , WT t + P i , PV t ± P i , MBESS t P i , load t
E Q ,   loss = f 2 = t = 1 96 i = 1 n Q i , inj t + Q i , WT t + Q i , PV t ± Q i , MBESS t Q i , load t
The variables in the active and reactive energy loss functions represent the time-varying power flows and injections at each bus in the distribution network. E P ,   loss and E Q ,   loss denote the total active and reactive energy losses accumulated over all time steps. At each bus i and time t, P i , inj t and Q i , inj t represent the active and reactive power injections, respectively, while P i , WT t and Q i , inj t correspond to the active and reactive power generated by the wind turbine. Similarly, P i , PV t and Q i , PV t denote the active and reactive power outputs from the photovoltaic system. The MBESS contributes either by injecting or absorbing power, represented by P i , MBESS t and Q i , MBESS t , depending on whether it is in discharging or charging mode. Finally, P i , load t and Q i , load t indicate the active and reactive power consumed by the conventional loads at each bus, respectively, which are subtracted from the total network injections to determine the corresponding power and energy losses.

2.1.3. Voltage Deviation Index (VDI)

The VDI is a widely used metric for voltage quality in power system planning and operational studies. It quantifies the deviation of actual bus voltages from their nominal or reference values under steady-state conditions. Maintaining voltage levels within acceptable bounds is crucial for ensuring the reliable operation of both customer loads and grid equipment, particularly in low-voltage distribution networks with high penetration of DERs and MBESS. The VDI is computed as in [28]:
VDI   =   f 3 = 1 T 1 N i = 1 N V i V i r e f V i r e f
The variables in the voltage deviation index (VDI) expression quantify the overall voltage quality across the distribution network. N denotes the total number of buses in the system, and T represents the total number of time intervals considered in the evaluation. V i is the actual voltage magnitude at bus i, while V i ref is the corresponding reference or nominal voltage, typically set to 1.0 p.u. The VDI measures the average per-unit deviation of all bus voltages from their nominal values, thus reflecting the network’s voltage stability and regulation performance over time. Additionally, Z ij represents the magnitude of the line impedance between buses i and j , which influences voltage drops along the feeders and therefore affects the overall voltage deviation across the network.
Maintaining voltage levels within acceptable thresholds (typically 0.95–1.05 p.u.) is crucial to ensuring operational stability and protecting customer equipment [29]. VDI serves as a quality metric and is widely used in optimization models either as an objective function to minimize or as a constraint to enforce. In systems with high DERs or MBESS penetration, voltage deviations become more prevalent, making VDI critical for planning and control.

2.1.4. Fast Voltage Stability Index

The Fast Voltage Stability Index (FVSI) is an efficient and widely used voltage stability metric employed to evaluate the proximity of a power system to voltage collapse. It provides a rapid and intuitive assessment of voltage stability margins for each transmission or distribution line, particularly in real-time monitoring, contingency analysis, and preventive management techniques [30].
The FVSI is analytically determined from the power flow equations and impedance characteristics of a transmission line, reflecting the level of its loading in terms of reactive power transfer capacity. As the index nears 1.0, the line is considered to be on the brink of voltage instability. The FVSI between the transmitting bus i and the receiving bus j is computed using the following formula [27,31]:
FVSI = f 4 = max 4 Z ij 2 Q j V i 2 X ij t
The variables in the fast voltage stability index (FVSI) represent the electrical parameters that determine the voltage stability margin of each line in the distribution network. Z i j denotes the magnitude of the line impedance between buses i and j , while X ij represents its reactance component, which primarily governs the voltage drop and reactive power flow along the line. Q j is the reactive power at the receiving bus j , indicating the reactive demand that influences voltage stability at that point.
The FVSI is widely used for the fast checking of voltage stability margins in large networks. A value approaching 1 indicates that the line is close to voltage collapse, warranting preventive measures such as reactive power support or load shedding. However, the index represented by a simplified one-line model with the load at the receiving end may not fully represent meshed or heavily coupled systems. It is best used in conjunction with other indices, such as the L-index or continuation power flow, for comprehensive stability analysis [32].

2.2. Photovoltaic System Modeling

Photovoltaic (PV) generation is characterized as a time-dependent source, with its output depending on forecasted solar irradiation, cloud visibility, and panel efficiency. To eliminate dependence on actual meteorological records, the irradiance is synthetically produced using a sinusoidal model that simulates the solar elevation angle from dawn to sunset. The active power production from a photovoltaic system located at bus i and assessed at time t is defined as [33]:
P i PV t = C i PV η pv I norm t
The variables in the photovoltaic (PV) power generation model describe the relationship between the system’s capacity, efficiency, and available solar irradiance. C i PV represents the rated capacity of the PV system installed at bus i in kilowatts, defining its maximum possible output under standard test conditions. η pv denotes the panel efficiency, which accounts for the conversion effectiveness of solar irradiance into electrical power. I norm t is the normalized solar irradiance at time t, incorporating factors such as atmospheric attenuation, shading, and stochastic variations due to weather conditions. Together, these parameters determine the instantaneous active power output P i P V ( t ) , allowing time dependent modeling of PV generation under dynamic environmental conditions.

2.3. Wind Turbine System Modeling

In this study, wind speed is modeled using the two-parameter Weibull probability distribution [34], which has been widely validated for long-term wind energy assessment. The probability density function (PDF) of the Weibull distribution is given by:
f ( v ) = k c v c k 1 exp v c k
The wind turbine power output is computed using the standardized three-region power curve defined by [35] as follows:
P i WT ( t ) = 0 ,                                                                               C i WT · v v cut- in v rated v cut- in · η WT C i WT · η WT                                                         ,   v   <   v cut- in   or     v   >   v cut- out         v cut- in     v   <   v rated v rated     v   <   v cut- out    
The variables in the wind turbine generation model describe both the statistical characteristics of wind speed and the turbine’s electrical output behavior under varying wind conditions. The probability density function f ( v ) follows a Weibull distribution, where v is the wind speed (m/s), k is the shape parameter (typically between 1.5 and 3.0) that defines the distribution profile of wind speeds, and c is the scale parameter that depends on local site conditions and determines the average wind velocity. The power output of a wind turbine, P i WT ( t ) , is computed using the three-region power curve. C i WT represents the rated capacity of the turbine (kW), and η wt is its overall efficiency in per-unit form. The turbine starts generating power when the wind speed exceeds the cut-in threshold v cut- in , increases linearly with wind speed up to the rated value v rated , and maintains rated output until the cut-out speed v cut- out is reached, beyond which it shuts down for protection. This formulation enables accurate modeling of wind energy conversion under realistic, site dependent wind conditions.

2.4. Electric Vehicles Charging Station (EVCS) Modeling

The EVCS are treated as time-dependent loads driven by behavioral utilization patterns. Each station is categorized by type such as residential, workplace, or fast-charging and characterized by the number of chargers and rated power per charger. The total power charging demand at bus i and time t is given by:
P i EVC ( t ) = N i P rate U i ( t )
Q i EVC ( t ) = P i EVC ( t ) tan cos 1 ( ( PF )
The variables in the EVCS charging model describe the time-varying power demand of charging stations. N i is the number of chargers at bus i, P rate is the rated power of each charger, and U i ( t ) is the time-dependent utilization factor reflecting charging activity. The active power demand is given by P i EVC ( t ) , while the reactive power Q i EVC ( t ) is derived from the power factor.
Utilization profiles are generated using probabilistic functions that reflect realistic user behavior. For instance, residential stations show high demand in the evening, while fast-charging stations may exhibit multiple peaks aligned with traffic patterns. Random noise is incorporated to account for day-to-day fluctuations in usage, making the profiles suitable for stochastic simulation and grid impact assessment.

2.5. Mobile Battery Energy Storage System (MBESS) Modelling

The MBESS combines a battery energy storage System (BESS) integrated with an electric vehicle truck (EVT), providing mobility and grid-interactive capabilities as shown in Figure 2. This section describes the mathematical modelling of the main the MBESS components, ensuring optimal energy use, effective mobility, and a seam-less connection to the power grid.

2.5.1. Battery Energy Storage System (BESS) Modelling

The BESS serves as the core energy unit of the MBESS, responsible for charging, discharging, and managing power flows. The SOC, energy constraints, and charging/discharging efficiencies are mathematically modeled as follows:
SOC t + 1 = SOC t + P charge , t η charge P discharge , t η discharge B cap
The variables in the SOC equation describe the energy balance of the battery over time. SOC t represents the battery’s state of charge at time t , while P cha , t and P dis , t are the charging and discharging powers in kilowatts. η cha and η dis denote the charging and discharging efficiencies, typically ranging from 0.9 to 0.95. B c a p is the nominal battery capacity in kilowatt-hours. Together, these parameters define how the SOC evolves between time steps, accounting for energy input, output, and conversion losses.

2.5.2. Electric Vehicle Truck (EVT) Modelling

The EVT provides the mobility function of the MESS, transporting the BESS between locations as required for optimal energy distribution. The EVT model includes energy consumption, mobility constraints, and route optimization.
The energy required for the MBESS-equipped electric vehicle to travel between two locations i and j is modeled using a simplified linear consumption model that assumes constant energy consumption per unit distance [11]:
E mov , ij   =   d ij   ×   E C
The variables in the transportation energy model represent the energy required for the MBESS truck to move between two locations. E mov , ij denotes the total energy consumed when traveling from location i to j, d ij is the travel distance along the shortest path in kilometers, and E C is the truck’s energy consumption rate in kilowatt-hours per kilometer. This relationship allows estimation of transportation-related energy costs based on route length and vehicle efficiency.
The SOC update due to movement is given by:
SOC t + 1   =   SOC t     E move , ij B cap
The variables in this equation describe the reduction in the battery’s SOC due to transportation energy use. SOC start , i represents the updated SOC after movement, while SO C t is the SOC before travel. E move , ij is the energy consumed when the MBESS truck travels from location i to j , and B cap is the nominal battery capacity in kilowatt-hours. SOC start , i and SOC end , i indicate the SOC at the start and end of trip i , respectively, reflecting the decrease in available energy caused by vehicle motion.
Energy consumption for the electric truck is analyzed in terms of real-world performance, considering environmental and operational conditions. Energy consumption is expressed as [36]:
E C = SOC start , i SOC end , i × B cap km end , i km start , i
The variables in this equation define the electric truck’s energy consumption rate during travel. E C represents the average energy consumption in kilowatt-hours per kilometer, calculated from the change in the battery’s state of charge ( SO C start , i SO C end , i ) multiplied by the battery capacity B cap , divided by the travel distance between the starting and ending points ( k m end , i k m start , i ). This formulation provides a practical measure of how efficiently the MBESS vehicle uses energy per kilometer traveled.
The MBESS model integrates both stationary battery storage dynamics and EV mobility constraints to ensure optimal energy delivery. The combination of energy management equations, mobility constraints, and charging/discharging conditions enables efficient system operation for applications such as peak shaving, renewable energy integration, voltage improvement and emergency power supply.

2.5.3. The MESS Operating Cost Modeling

The total operating cost of the distribution system with integrated the MBESS, DERs, and DFR is computed by summing four major components: energy cost, demand charge, MBESS operating cost [37], and transportation and maintenance costs [38]. The formulation is given by:
Cos t total     = f 5 = t = 1 T P t · Δ t · r t + P peak · c dem 30 + s = 1 S t = 1 T P s , t dis · Δ t c deg + D tot · c trans + c maint
The variables in the total cost function represent the economic components associated with grid operation and MBESS utilization. P t is the grid power drawn at time t (kW), Δ t is the simulation time step (hours), and r t is the time-of-use (TOU) electricity rate ($/kWh). P peak denotes the system peak demand, with c dem representing the corresponding demand charge rate ($/kW·month). P s , t dis is the discharge power of MBESS unit s at time t, and c deg is the degradation cost per unit of discharged energy. D tot indicates the total transportation distance traveled by all MBESS units, while c trans and c maint denote the transportation and maintenance costs per kilometer, respectively. Together, these parameters quantify the total operational cost by combining electricity, demand, degradation, transport, and maintenance expenses.
The energy cost term accounts for the electricity purchased from the main grid, calculated using time of use (TOU) rates. The demand charge represents the cost associated with the system’s maximum power draw, converted to a daily equivalent. The battery degradation cost quantifies the lifecycle cost of the MBESS usage based on discharged energy and degradation rates. Finally, the transportation and maintenance cost capture the operational expenses for moving the MBESS units between locations and routine vehicle maintenance.
This cost structure enables the evaluation of both electrical and logistical economic impacts in integrated the MBESS and the DERs distribution networks, particularly under different operational strategies and feeder configurations.

2.5.4. Dynamic Feeder Reconfiguration (DFR) Background

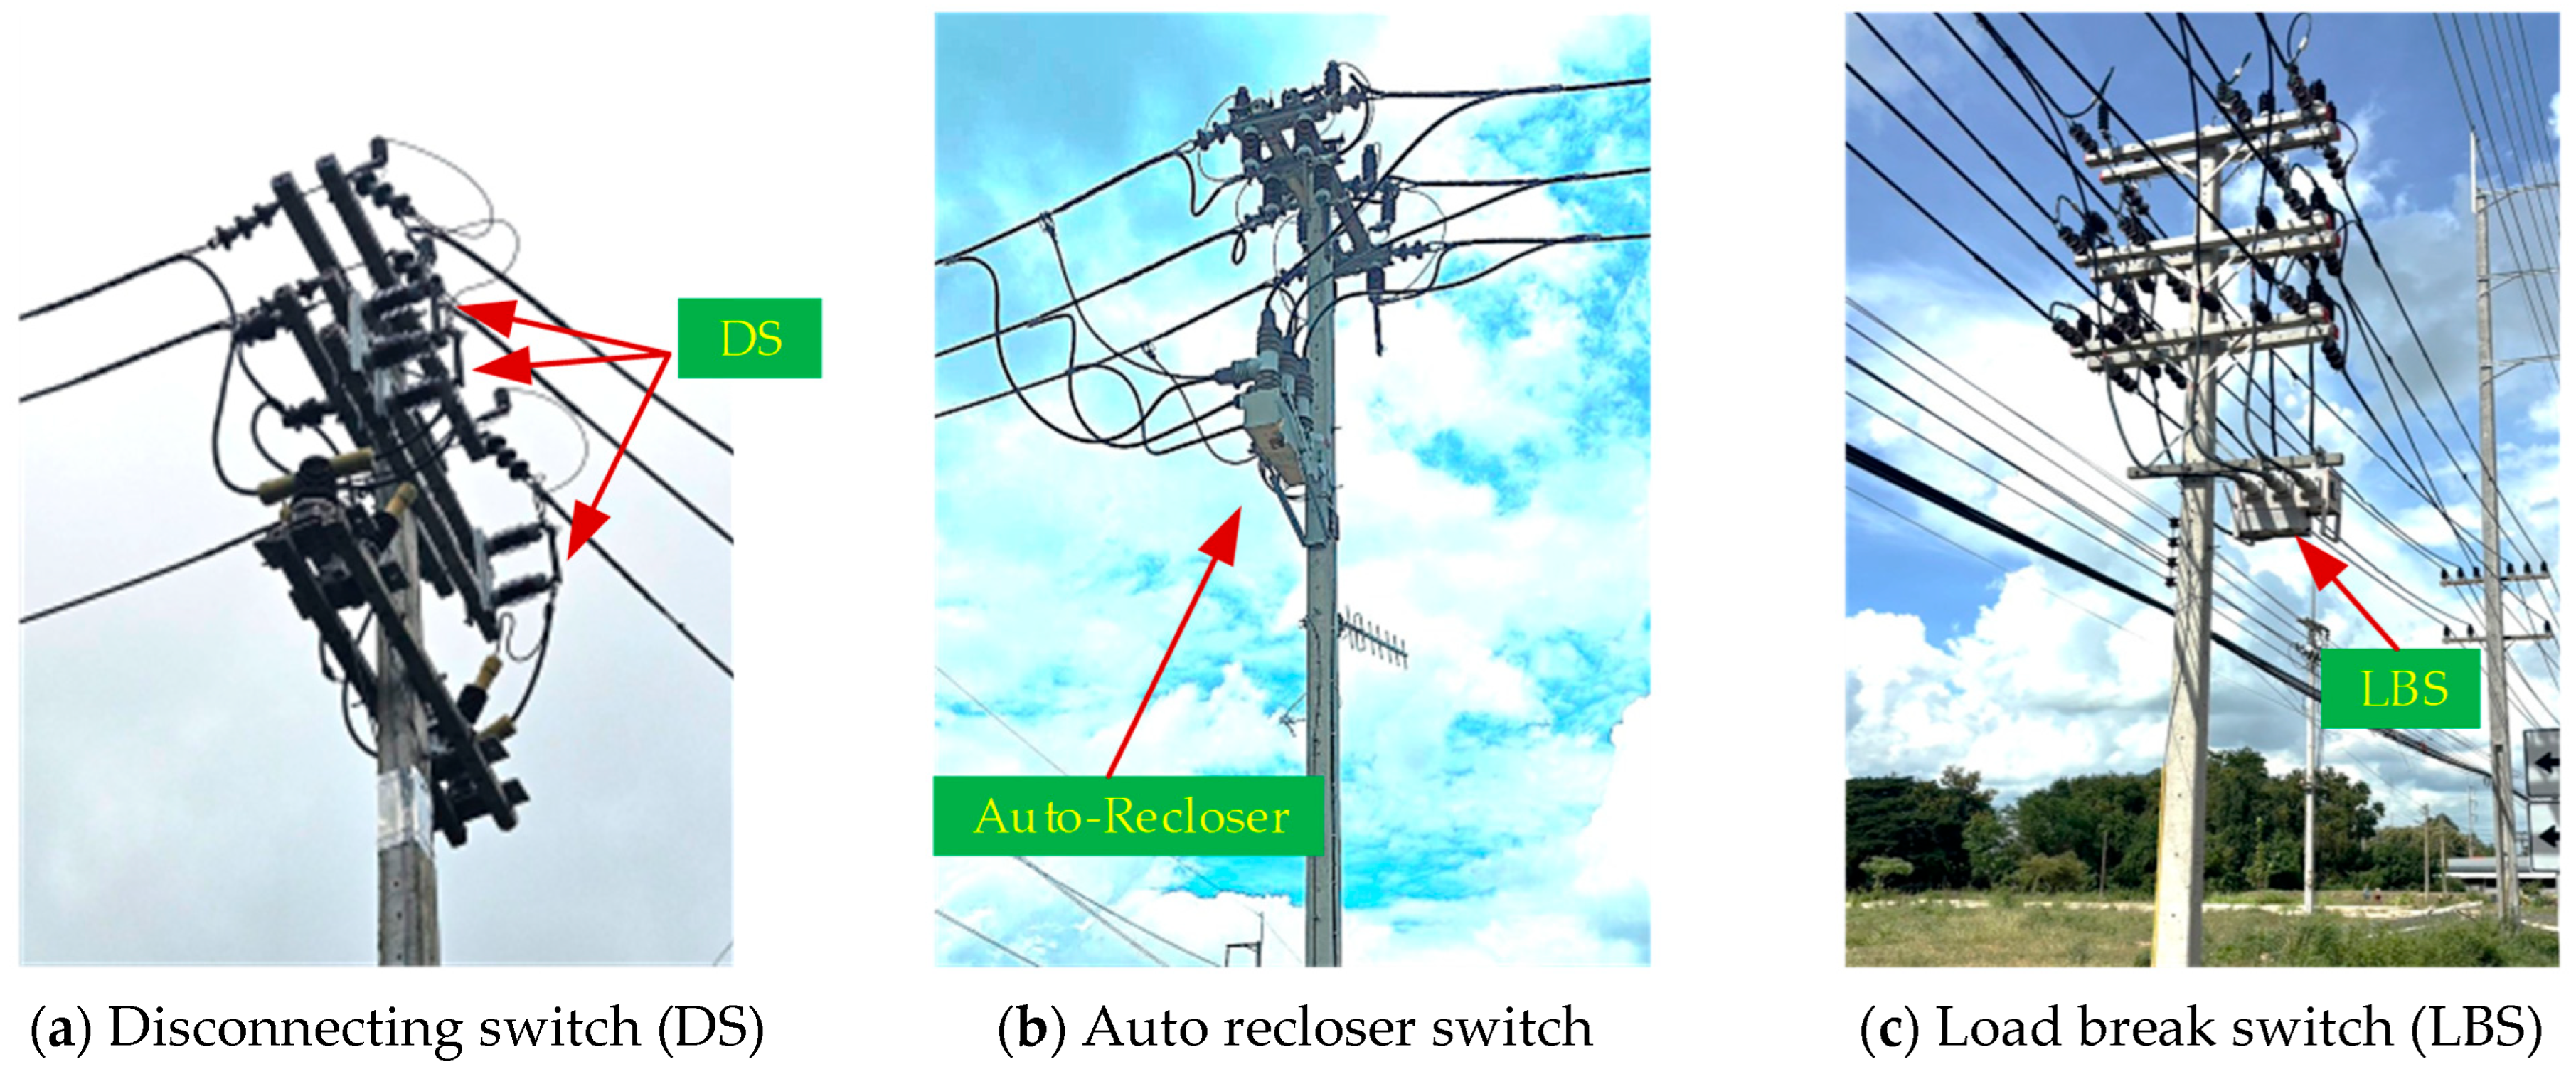
The EMS of the grid is required by the power consumption that needs to be prepared by the power grid to transfer the power to the load. The DFR concept is used to transfer power via the distribution line, which uses the high-voltage switch as shown in Figure 3. The type of feeder control equipment consists of three types as follows:
(A)
A disconnecting switch (DS) is used to control the transfer of power under off-load operation; that is the reason for using air insulation for breaking current interruptions.
(B)
A load break switch (LBS) is used to control and transfer the power to the load, the same as the DS, but can also operate under load with SF6 insulation for breaking current interruption and installation between feeders.
(C)
An auto recloser switch is used to control and transfer the power to the load, the same as the LBS, but with additional functions for the protection under fault control and installation from the root feeder and backup scheme.
The number of loops for controlling the DFR is derived by the number of loops as follows:
N Loop   = N Bus   + N Sub _ Br     N Br
where N loop is number loop. N Sub _ Br is number of sub-branches. N Br is number of branches or number of transmission lines. N B u s is number of buses.
L i = X 1 , X 2 , X 3 ,   X n
where L i is loop order i  N loop , X j is switch position in the loop j   n, n is total number of switches in the loop.

2.6. Transportation System Model Modeling

2.6.1. Bureau of Public Roads (BPR) Function

The BPR equation is widely used in transportation engineering to estimate travel time under varying traffic conditions. It models how congestion affects travel time by incorporating traffic volume and road capacity [39].
The general form of the BPR equation is:
T = T 0 1 + α V C β
where T is travelling time under current traffic conditions,   T 0 is free-flow travel time (i.e., travel time with no congestion), V is traffic volume (vehicles per hour), C is road capacity (vehicles per hour), α ,   β are empirical parameters that depend on the road type and traffic conditions.
This equation helps transportation planners predict congestion and evaluate the impact of traffic demand on roadway performance.

2.6.2. Travel Distance and Time Matrix

The travel distance and time matrix represents distances and expected travel times between multiple origin-destination (O-D) pairs in a transportation network. It is used for route optimization, cost estimation, and congestion analysis [40].
  • Travel Distance Matrix:
The nodes in a transportation network can be computed by the distance matrix D is defined as:
D   =   d ij
  • Travel Time Matrix (T) is presented as follows:
T = τ ij
where d ij is distance between nodes i and j, τ ij is travel time from node i to node j.
These matrices provide key inputs for shortest path calculations and transportation system modeling.

2.6.3. Shortest Path Analysis Based on the Dijkstra’s Algorithm

Dijkstra’s Algorithm is an essential method for finding the shortest path between nodes in a weighted graph. It is used in network routing, transportation optimization, and AI-based navigation.
Given a weighted graph G =   ( V ,   E ) where V is the set of nodes and E is the set of edges, each edge i ,   j has an associated weight w i ,   j representing cost, distance, or time [41]. The objective is to find the shortest path from a source node s to a target node t as Equation (22) and can be expressed by Algorithm 1.
d v = min d v , d u + w u , v
where d v is shortest known distance to node v, d u is shortest known distance to node u, w u , v is weight of edge u , v .
Algorithm 1 Dijkstra (Graph, source)
1. Initialize distances:
      - Set   d source   =   0
      - For each vertex v in Graph:
              - If   v     source ,   set   d v =  
      - Mark all nodes as unvisited
      - Create a priority queue (min-heap) and insert (source, 0)
2. While the priority queue is not empty:
      - Extract   node   u   with   the   smallest   d u from the priority queue
      - Mark node u as visited
3. Relaxation step:
      - For each adjacent node v of u:
              - If   v   is   unvisited   and   d u +   w u ,   v <   d v :
                      - Update   d v   =   d u +   w u ,   v
                      - Insert   v ,   d v into the priority queue
4. Repeat until all nodes are processed or the queue is empty
5. Return   d v for all nodes v (shortest distances from source)

2.7. Carbon Dioxide Emission Calculation

The total carbon dioxide ( CO 2 ) emissions of the studied power distribution system, which integrates DERs such as PV and WT units, MBESS, and DFR, are computed as the sum of grid-supplied electricity emissions and transportation-related emissions, minus the avoided emissions from DERs generation. The formulation is expressed as [42]:
CO 2   = f 6 = t = 1 T P t · Δ t · E F t grid + D tot · η EV · E F grid avg E PV + E WT · E F grid avg
where P t is grid power consumption at time step, E F t grid is grid emission factor at time, D tot is total transportation distance travelled by MBESS vehicles [km], η EV is electricity consumption rate of electric vehicles [kWh/km], E WT is PV energy generation [kWh], E WT is WT energy generation [kWh], E F grid avg is Everage grid emission factor [kgCO2/kWh].
The grid emissions term quantifies the CO2 emissions associated with electricity drawn from the main grid, accounting for time-varying emission factors due to changes in generation mix. The transport emissions term captures the indirect emissions from MBESS vehicle operations, assuming electric trucks charged from the grid. The DERs avoided emissions term represents the CO2 emissions offset by local renewable generation from PV and WT units, which reduces the net grid electricity demand.
This formulation enables a holistic evaluation of environmental impacts by incorporating both operational energy flows within the electrical network and the associated transportation requirements for mobile storage deployment.

3. Methodology

This section comprises six subsections outlining the proposed framework. Section 3.1 presents the energy management strategy using the NSGA-III algorithm and the compromised solution for optimal MBESS and DFR coordination. Section 3.2 formulates the objective function integrating technical, economic, and environmental factors. Section 3.3 defines the system constraints and operational limits. Section 3.4 introduces the ADS and transportation network test system. Section 3.5 specifies the simulation parameters. Finally, Section 3.6 provides the case study validating the proposed method.

3.1. Energy Management Using NSGA-III

This study was adopted as a multi-objective optimization framework based on the NSGA-III to determine optimal operational strategies for the ADS that integrates the MBESS, the DERs, and the DFR. The optimization simultaneously considers technical, economic, and environmental objectives: minimizing total operating cost, minimizing system power loss, and minimizing CO2 emissions.

3.1.1. NSGA-III Algorithms

The NSGA-III is a many-objective evolutionary algorithm designed to handle problems with three or more conflicting objectives efficiently. In this work, each individual (chromosome) in the population encodes the decision variables, including the MBESS charging/discharging schedules, the MBESS locations, the DERs dispatch, and feeder switching states, all subject to the operational constraints defined in Section 3.4. The optimization algorithms were presented as in [43]. The primary advantage of NSGA-III in this application is its ability to generate a diverse set of non-dominated solutions for three objectives, thereby providing decision makers with multiple operational trade-offs to consider. The TOPSIS is selected by using the objective normalization results and presented by optimal conditions from the propose.

3.1.2. Compromised Solution and Normalization

1.
Objective Normalization
Since the objectives considered in this study total operating cost, total power loss, and CO2 emissions are expressed in different units and scales, normalization is required to ensure fair comparison during the decision-making process. Min–max normalization is applied to scale each objective value f m from the Pareto set into a dimensionless range [0, 1], as given by [44]:
f m = f m   f m min f m max   f m min
This step ensures that all objectives contribute equally to the subsequent selection process, regardless of their original magnitude.
2.
Technique for Order Preference by Similarity to Ideal Solution (TOPSIS)
After normalization, the TOPSIS is employed to select a single compromised solution from the Pareto front. The ideal solution is defined as the point with the best value (minimum) for each objective, while the negative-ideal solution corresponds to the worst value (maximum) for each objective [45].
For each solution k in the Pareto set, the Euclidean distance to the ideal d k + and negative ideal d k points are calculated:
d k + = m = 1 M f m , k f m , ideal 2 ,   d k + = m = 1 M f m , k f m , neg- ideal 2
The relative closeness coefficient C k is then determined as:
C k = d k d k + + d k
A higher C k indicates that the solution is closer to the ideal point and further from the negative-ideal point. The solution with the maximum closeness coefficient is selected as the final compromised solution, providing a balanced trade-off among cost, loss, and emissions.

3.2. Objective Function

The optimization problem for coordinating MBESS and DFR in ADS is formulated as a multi-objective minimization problem with six key performance indicators as follows.
min   F ( x ) = [ f 1 ( x ) ,   f 2 ( x ) ,   f 3 ( x ) ,   f 3 ( x ) ,   f 5 ( x ) ,   f 6 ( x ) ]
During the NSGA-III optimization process, these objectives are evaluated simultaneously to generate a Pareto front of non-dominated solutions. Each solution represents a different trade-off between the objectives. The algorithm maintains population diversity through reference point-based selection, ensuring good coverage of the solution space.
After obtaining the Pareto set, normalization using Equation (24) scales each objective to [0, 1] range, enabling fair comparison. The TOPSIS method then selects the best-compromise solution based on its proximity to the ideal point (minimum values for all objectives) and distance from the negative-ideal point (maximum values).
This multi-objective approach is subject to operational constraints defined in Equations (30)–(34), including voltage limits, line thermal ratings, MBESS operational bounds, radiality requirements, and switching limitations.

3.3. Inequality Constraint and Limits

The optimization problem for the coordinated operation of the MBESS and the DFR in an active distribution network is subject to several technical, operational, and environmental constraints. These constraints ensure that the resulting operation is physically feasible, respects equipment limits, and meets economic and environmental targets. They cover voltage regulation, branch thermal limits, the MBESS energy and power limits, renewable generation bounds, feeder switching restrictions, budget caps, and emission limits. The key inequality constraints are listed below.
V i min     V i , t     V i max ,   i , t
The voltage magnitude at bus i at time t must remain within the specified range (e.g., 0.95–1.05 p.u.) to maintain acceptable power quality.
S ij , t     S ij max ,   ( i , j ) , t
The apparent power flow on line ij must not exceed its thermal rating to prevent overheating and prolong equipment lifespan.
E s min     E s , t     E s max ,   s , t
The state of charge (SoC) of each MBESS must be maintained within the specified limits to avoid over-discharge or overcharge, which could damage the battery.
0     P s , t ch     P s ch , max , 0     P s , t dis     P s dis , max ,   s , t
The charging and discharging power of each MBESS must not exceed its rated limits, and charging and discharging cannot occur simultaneously.
I ij , t     I ij max ,   ( i , j ) , t
The current in each distribution line must not exceed its maximum allowable current to prevent overheating and operational faults.
t SwitchOps t     N SW max
The total number of feeders switching operations during the scheduling horizon must not exceed the predefined limit to reduce equipment wear and ensure operational safety.
E s , t     E EVtruck , s , t     E s min ,   s , t
The remaining energy in the MBESS, after subtracting the energy consumed by the EV truck for transportation, must not fall below the minimum allowable state of charge. This ensures that the MBESS has sufficient energy to supply power immediately upon arrival at the designated location.

3.4. Test System for ADS and Transportation Network

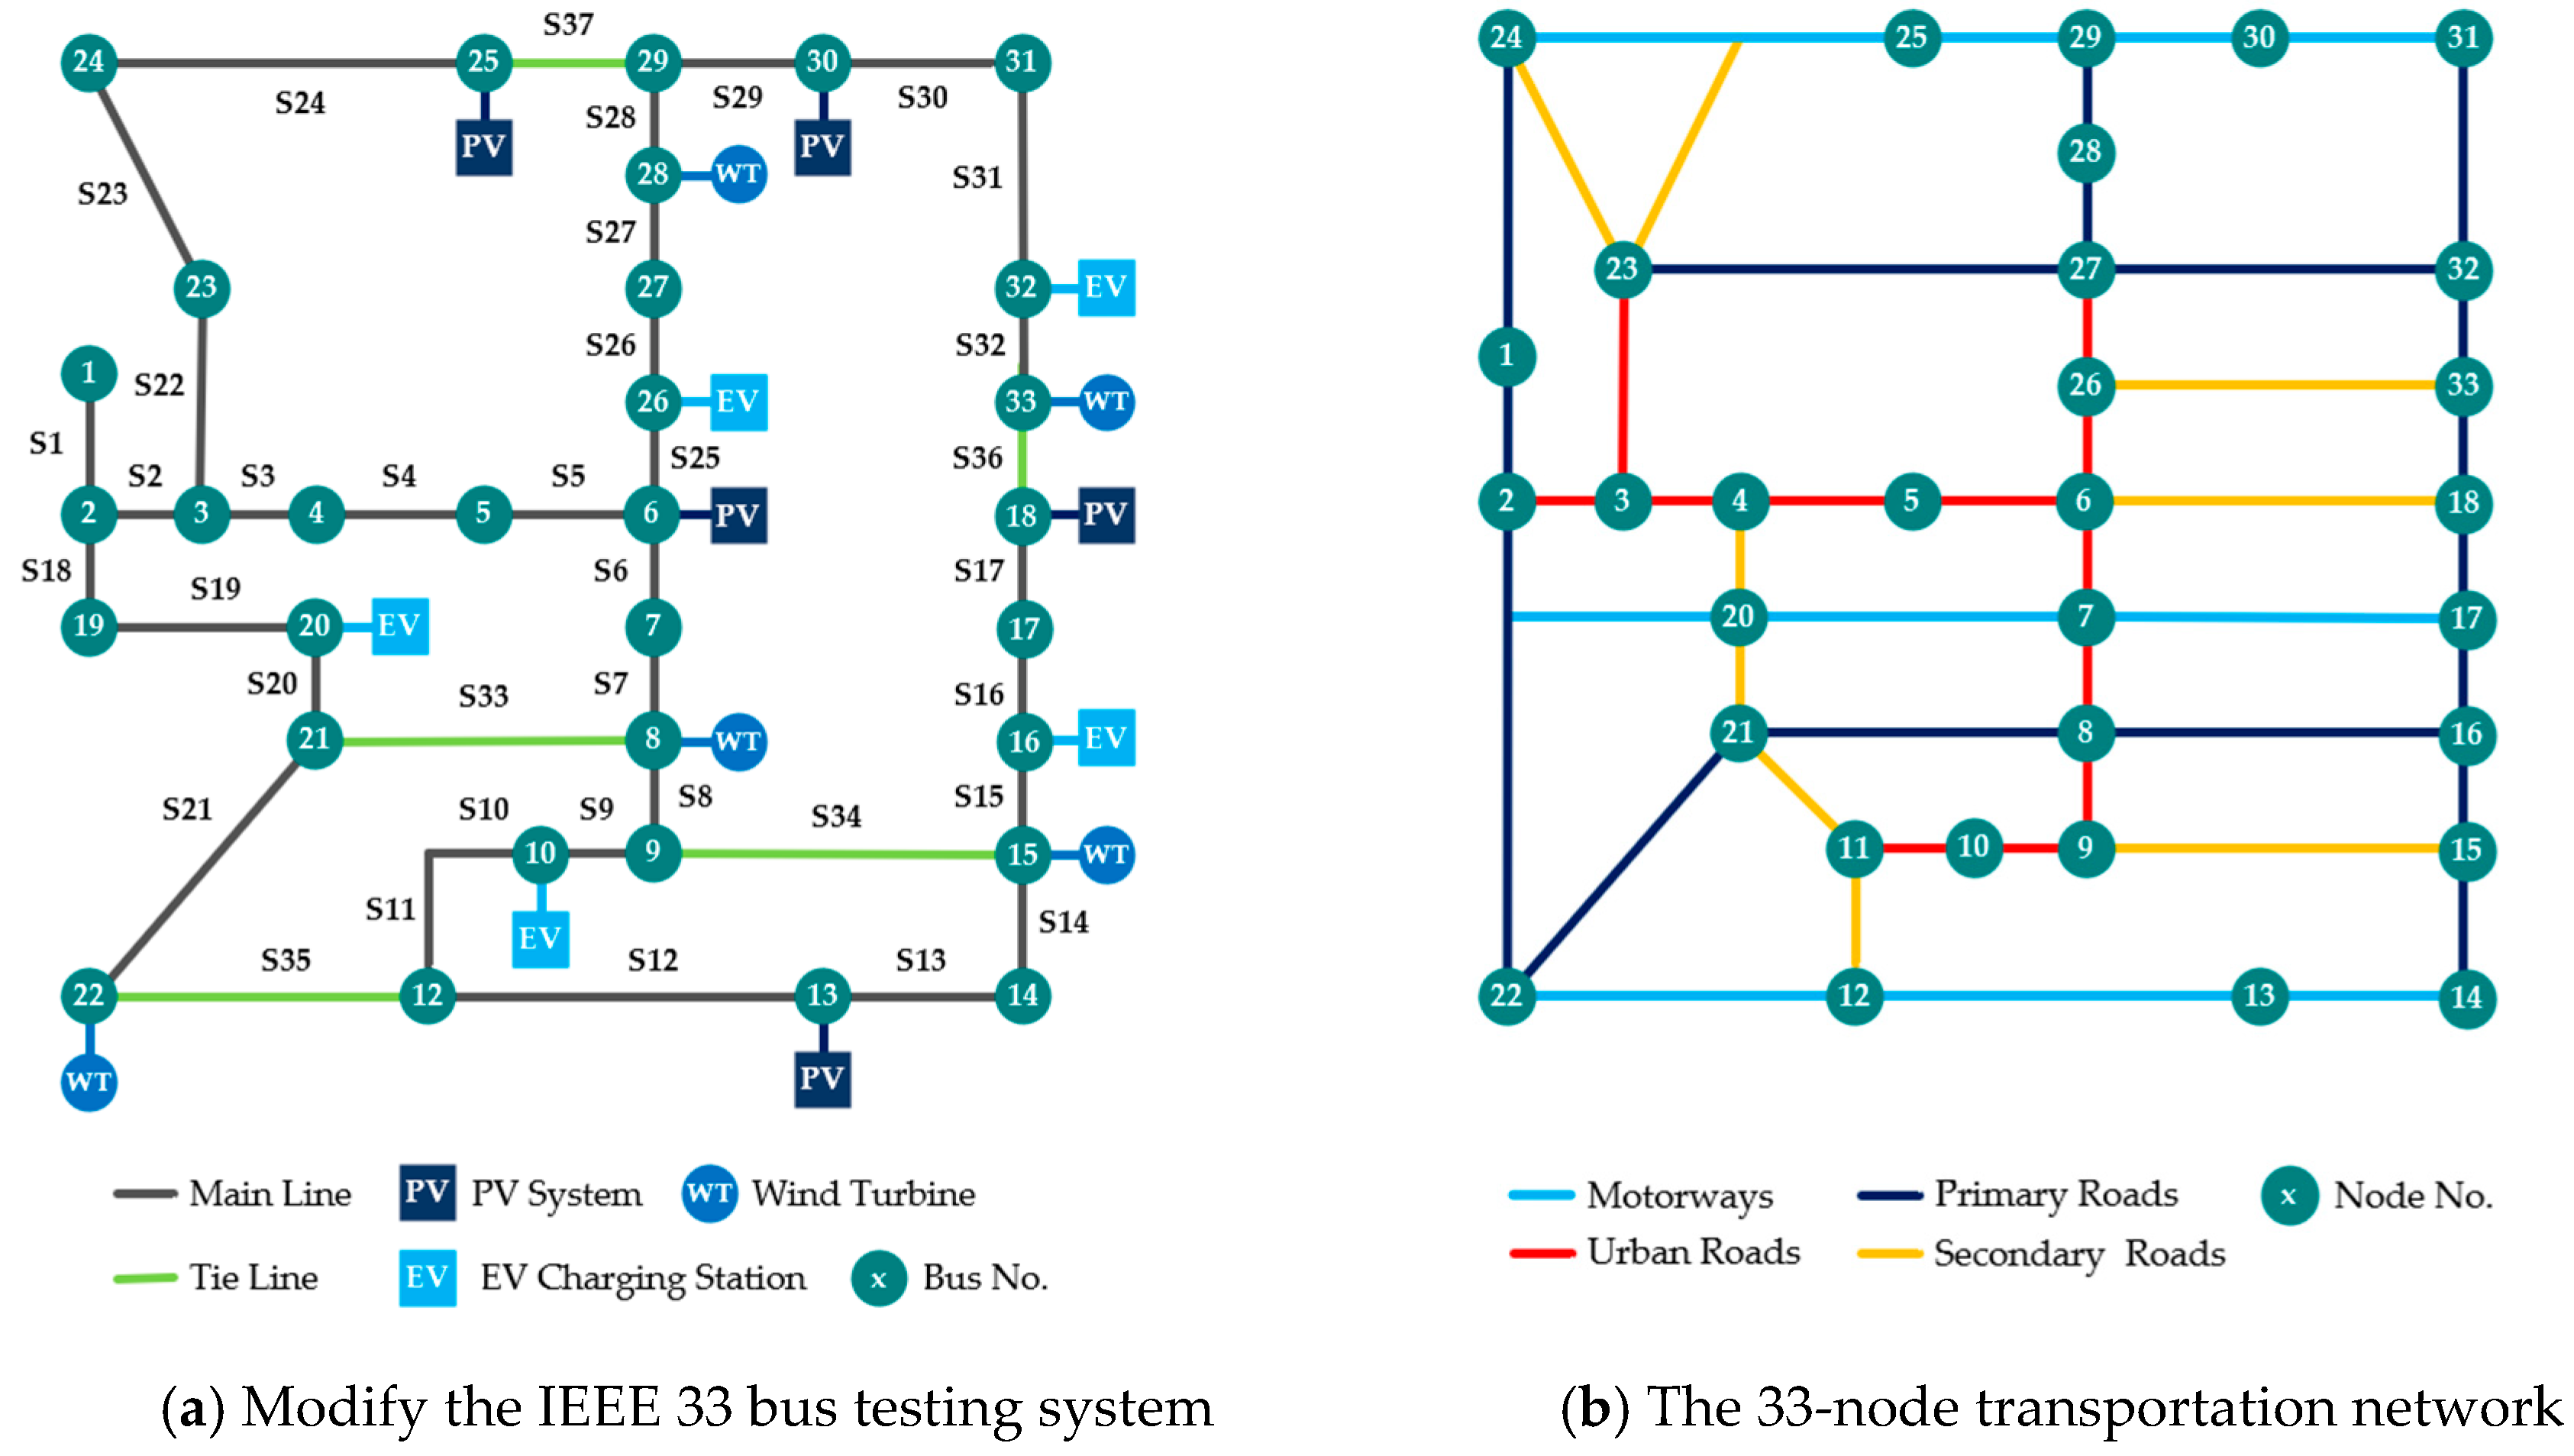
This study begins with the adaptation of the standard the IEEE 33 bus distribution system model, incorporating renewable energy generation from photovoltaic panels and wind turbines, as well as the locations of electric vehicle charging station (EVCS) charging stations. The system is then integrated with a 33-node transportation network, illustrated in Figure 4, by mapping each bus in the power system to a corresponding node in the road network, which serves as a connection point or service location for the MBESS. For the transportation network, information on road types, distances, and average speeds for each route is utilized to calculate the MBESS travel times between locations, while the shortest path method is applied to maximize the efficiency of the MBESS relocation [46].

3.5. Simulation Parameters

Table 2 presents the parameters of the multi-objective optimization techniques employed to determine the optimal operating conditions. These fundamental parameters are essential for conducting performance comparisons across the different optimization methods.
To ensure fair and rigorous comparisons across the six scenarios, the operational settings of MBESS and DFR were unified. The MBESS was scheduled to charge whenever the normalized feeder load was ≤0.55 p.u., to discharge when the load was ≥0.87 p.u., and to remain idle otherwise. Correspondingly, the DFR was permitted to perform a maximum of one switching operation in each of the three MBESS operating periods charging, idle (no-charge), and discharging thus allowing at most three switching actions per day. All additional parameters, including battery ratings, efficiency, state-of-charge limits, truck energy consumption model, and solver configurations, were held constant across all scenarios. Only three core variables differed by design: (i) DERs access, (ii) MBESS deployment, and (iii) DFR activation. This setup isolates the effect of each individual variable, thereby enhancing the rigor, fairness, and traceability of the comparative analysis.
Figure 5 shows daily load and generation profiles for the studied active distribution system. The system load profile (top left) exhibits typical variations with morning and evening peaks. Photovoltaic generation profiles (top right) follow a bell-shaped curve with maximum output during midday hours. Wind turbine generation profiles (bottom left) display high intermittency throughout the day, reflecting location-dependent wind conditions. The EV charging station demand profiles (bottom right) show multiple peaks during morning, afternoon, and evening periods, corresponding to user charging behavior. These diverse and time-varying profiles highlight the operational challenges of managing load, renewable integration, and the EV charging in distribution networks.

3.6. Case Study

To evaluate the performance of the proposed optimization framework, six different operational scenarios are considered for the ADS. These scenarios are designed to analyze the individual and combined impacts of the MBESS, the DFR, and the DERs.
Case 1: ADS Base Case
The standard active distribution system operates without MBESS, feeder reconfiguration, or DERs integration. This case serves as the reference for comparing system performance under other configurations.
Case 2: ADS with MBESS
The base system is enhanced with MBESS deployment. The MBESS units are scheduled optimally to charge and discharge according to load variations, but feeder topology remains unchanged, and no DERs is connected.
Case 3: ADS with MBESS and DFR
In addition to MBESS operation, feeder reconfiguration is applied dynamically to minimize system losses and improve voltage profiles. The network topology is adjusted within the operational constraints to achieve better performance.
Case 4: ADS and DERs Integration
PV and WT generation are integrated into the ADS without MBESS or DFR. The DERs units supply local loads and reduce power imports from the grid.
Case 5: ADS and DERs Integration with MBESS
The DERs-integrated ADS is further enhanced with MBESS units. The storage system is scheduled to store excess DERs generation and discharge during peak demand or high-cost periods.
Case 6: ADS and DERs Integration with MBESS and DFR
The full integration of DERs, MBESS, and feeder reconfiguration is implemented. MBESS units operate in coordination with DERs generation and dynamic feeder topology adjustments to achieve optimal technical, economic, and environmental performance.
These six cases allow a comprehensive comparison of the system’s operational performance, including voltage regulation, power losses, operational cost, and CO2 emission reduction under different technology combinations. Therefore, summary of the case study can be established by Table 3 as follows.

4. Results and Discussion

This section presents the results obtained from the proposed optimization framework and their corresponding analyses. It begins with the optimal MBESS placement and feeder reconfiguration outcomes, followed by the results of two simulation scenarios. The subsequent discussion interprets the findings in terms of technical, economic, and environmental performance, multi-objective optimization behavior, and practical implications.

4.1. MBESS Location and Feeder Reconfiguration

This section sequentially presents how the proposed optimization framework determines the optimal positioning of MBESS units and the corresponding feeder reconfiguration in the active distribution system. As summarized in Table 3, Scenarios 1 and 2 include six cases representing different combinations of MBESS, DERs, and DFR. Table 4 presents the operational scheduling of MBESS, which corresponds to Cases 2, 3, 5, and 6, where mobile storage units are actively dispatched. This sequential structure illustrates how switching states and mobility patterns evolve under various configurations to enhance overall system efficiency.
In Case 2 (ADS with MBESS only), three MBESS units were optimally dispatched to buses 15, 32, and 18. The transportation routes were designed to minimize travel distance and energy consumption while ensuring an adequate state-of-charge upon arrival. The unit assigned to bus 15 required the longest route (54.6 km) and the highest mobility energy consumption (60.06 kWh), whereas the unit dispatched to bus 32 followed the shortest route (32.8 km) with the lowest energy use (36.08 kWh). These results highlight the sensitivity of MBESS scheduling to transportation logistics and its impact on energy-delivery efficiency.
When DFR was additionally enabled in Case 3, the optimal locations shifted to buses 16, 18, and 32. This redistribution demonstrates the synergistic effect of combining MBESS with DFR: feeder-topology adjustments modified network weak points and consequently redefined the most beneficial MBESS locations. The relocation of the first unit from bus 15 (Case 2) to bus 16 (Case 3) reduced travel distance from 54.6 km to 46.4 km and mobility-energy consumption from 60.06 kWh to 51.04 kWh, while simultaneously improving voltage support in the corresponding feeder segment.
The fully integrated configuration (Case 6: ADS + DERs + MBESS + DFR) further emphasized this trend. The optimal MBESS positions were identified at buses 17, 18, and 32, strategically located near high-renewable-penetration nodes (e.g., bus 17 adjacent to PV and WT clusters). This placement facilitated localized balancing of generation variability, while DFR restructured the feeder topology to mitigate congestion. Case 6 achieved the most balanced trade-off among technical indices—loss reduction, Voltage Deviation Index (VDI), and Fast Voltage Stability Index (FVSI)—and overall operational feasibility.
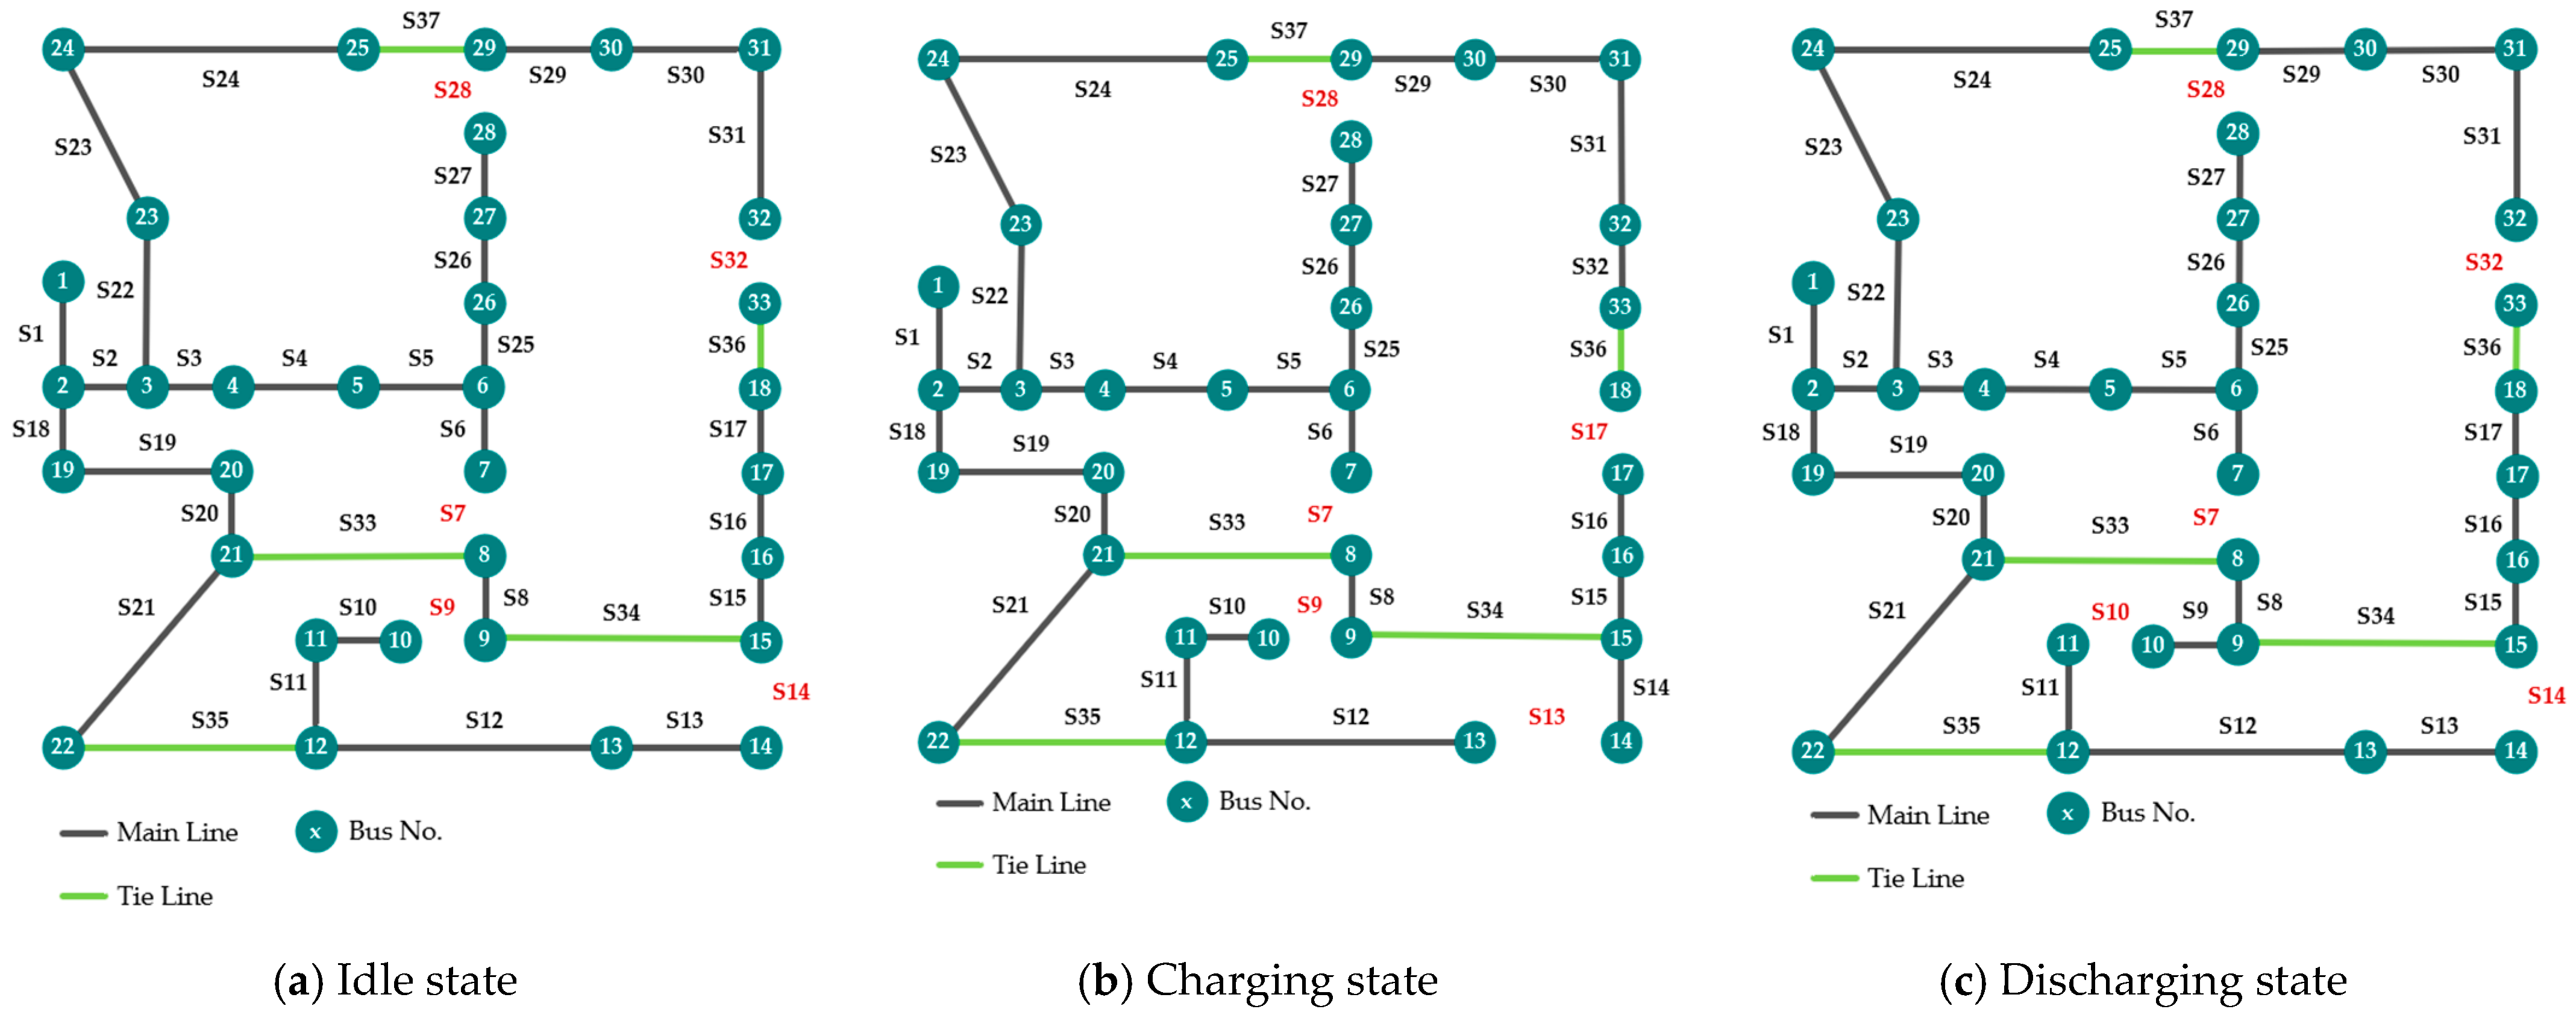
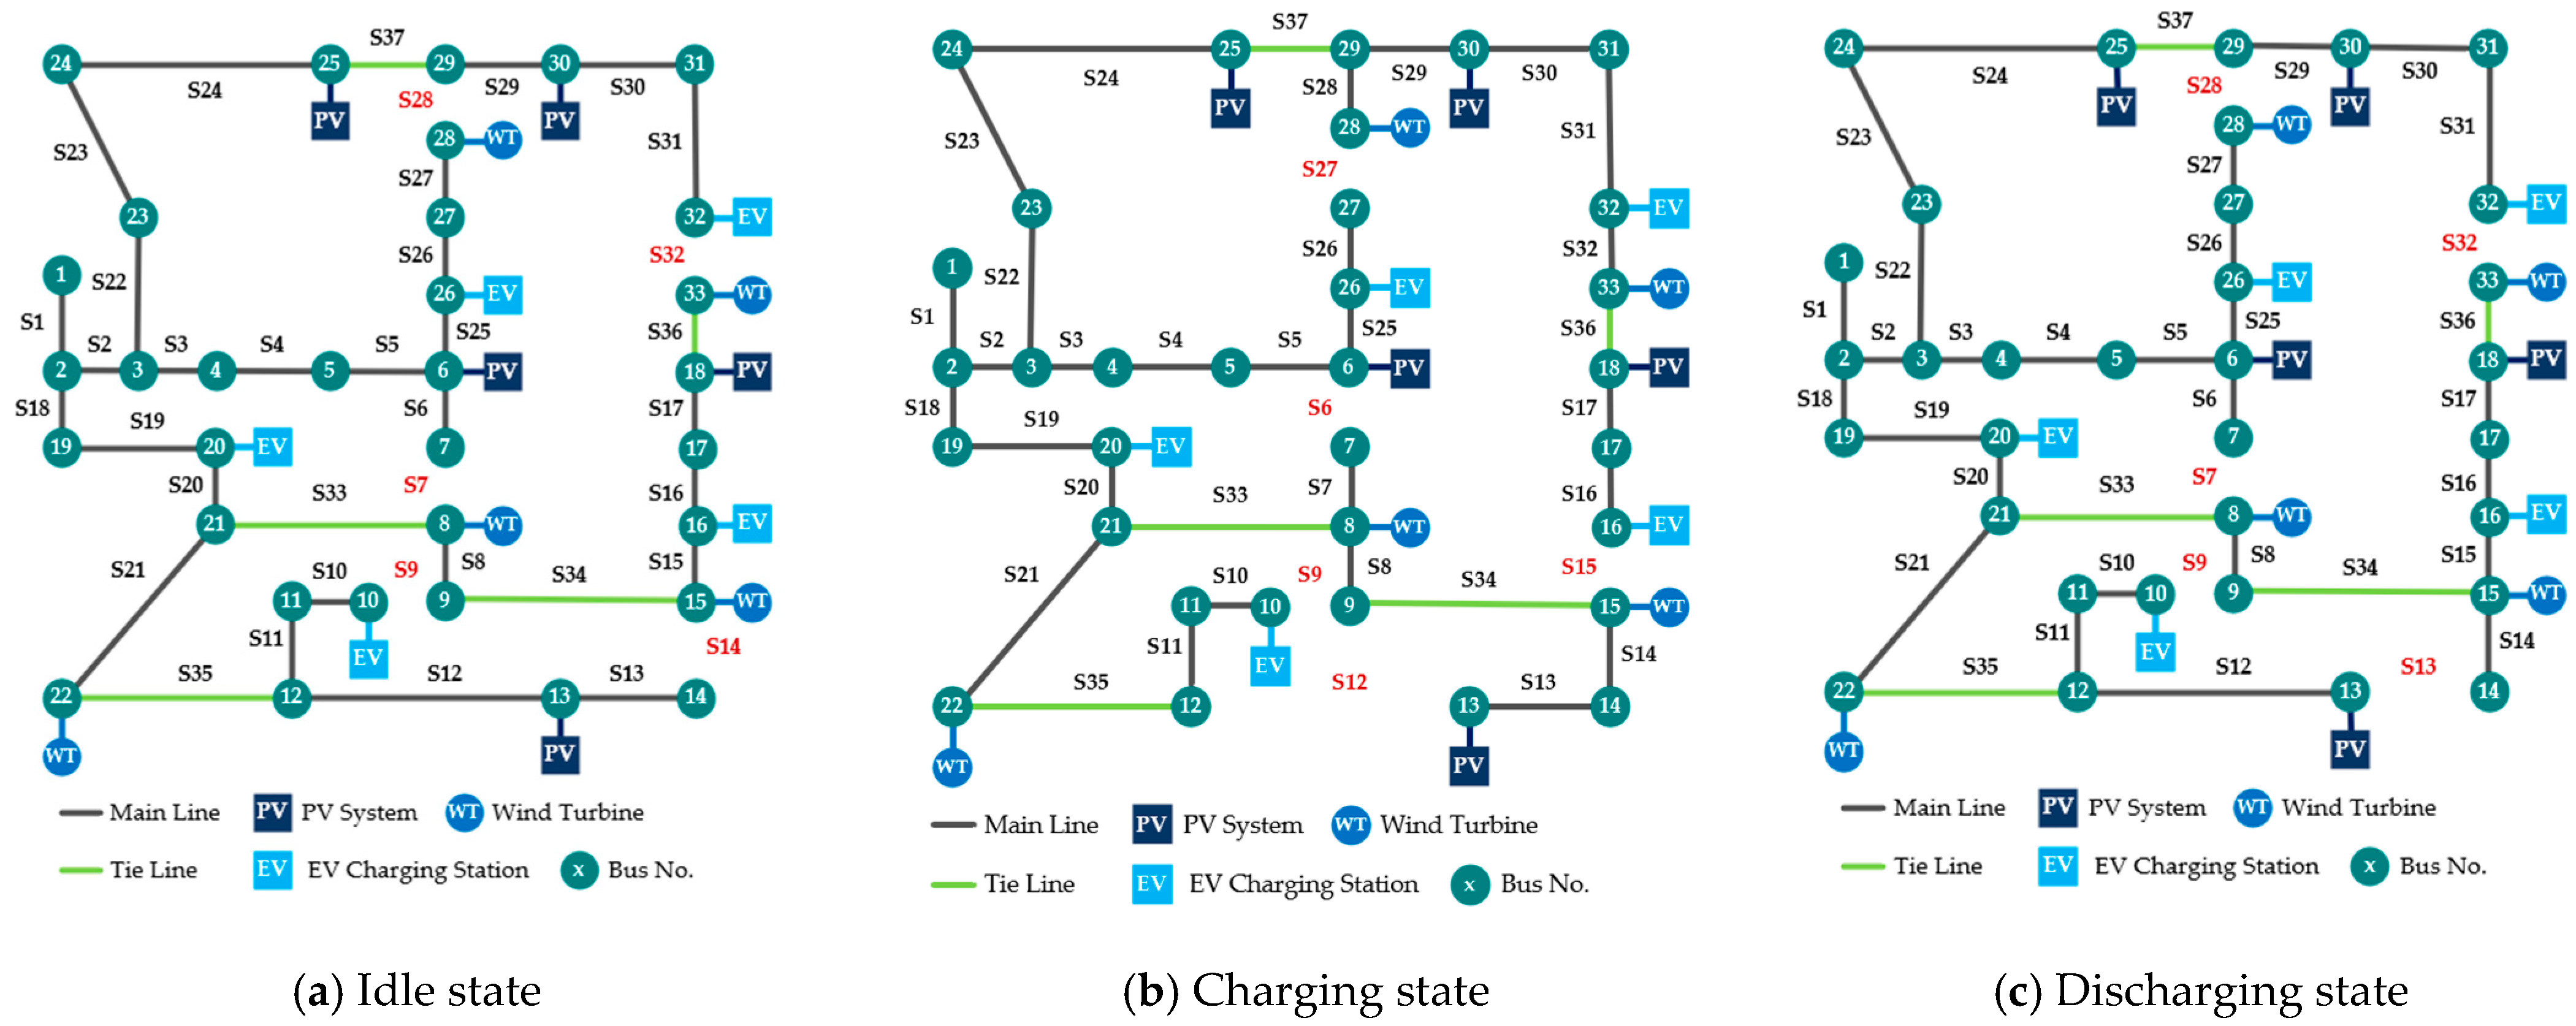
Table 5 summarizes the switching states adopted for feeder reconfiguration during idle, charging, and discharging periods, as illustrated in Figure 6a–c for Case 3 and Figure 7a–c for Case 4. The results reveal distinct switching patterns that adapt to different MBESS operating modes. In Case 3, switches {7, 9, 14, 32, 28} remained open during idle operation to maintain network radiality. During charging and discharging, the configuration adjusted dynamically—for example, switch 13 opened during charging and switch 10 during discharging—redistributing power flow and mitigating line overloads. A similar pattern was observed in Case 6, where the inclusion of DERs required a modified set of open switches, such as {6, 9, 12, 15, 27} during charging, to maintain system stability under variable renewable generation.
Overall, the results demonstrate that co-optimization of MBESS siting with feeder reconfiguration enables both efficient mobility utilization and enhanced network performance. The MBESS locations are not fixed but depend strongly on feeder topology, renewable generation patterns, and traffic-related travel constraints. Therefore, the coordinated MBESS–DFR approach yields superior performance compared with independent strategies, confirming its effectiveness for ADS.

4.2. Results of Scenario 1 (Case 1 to Case 3)

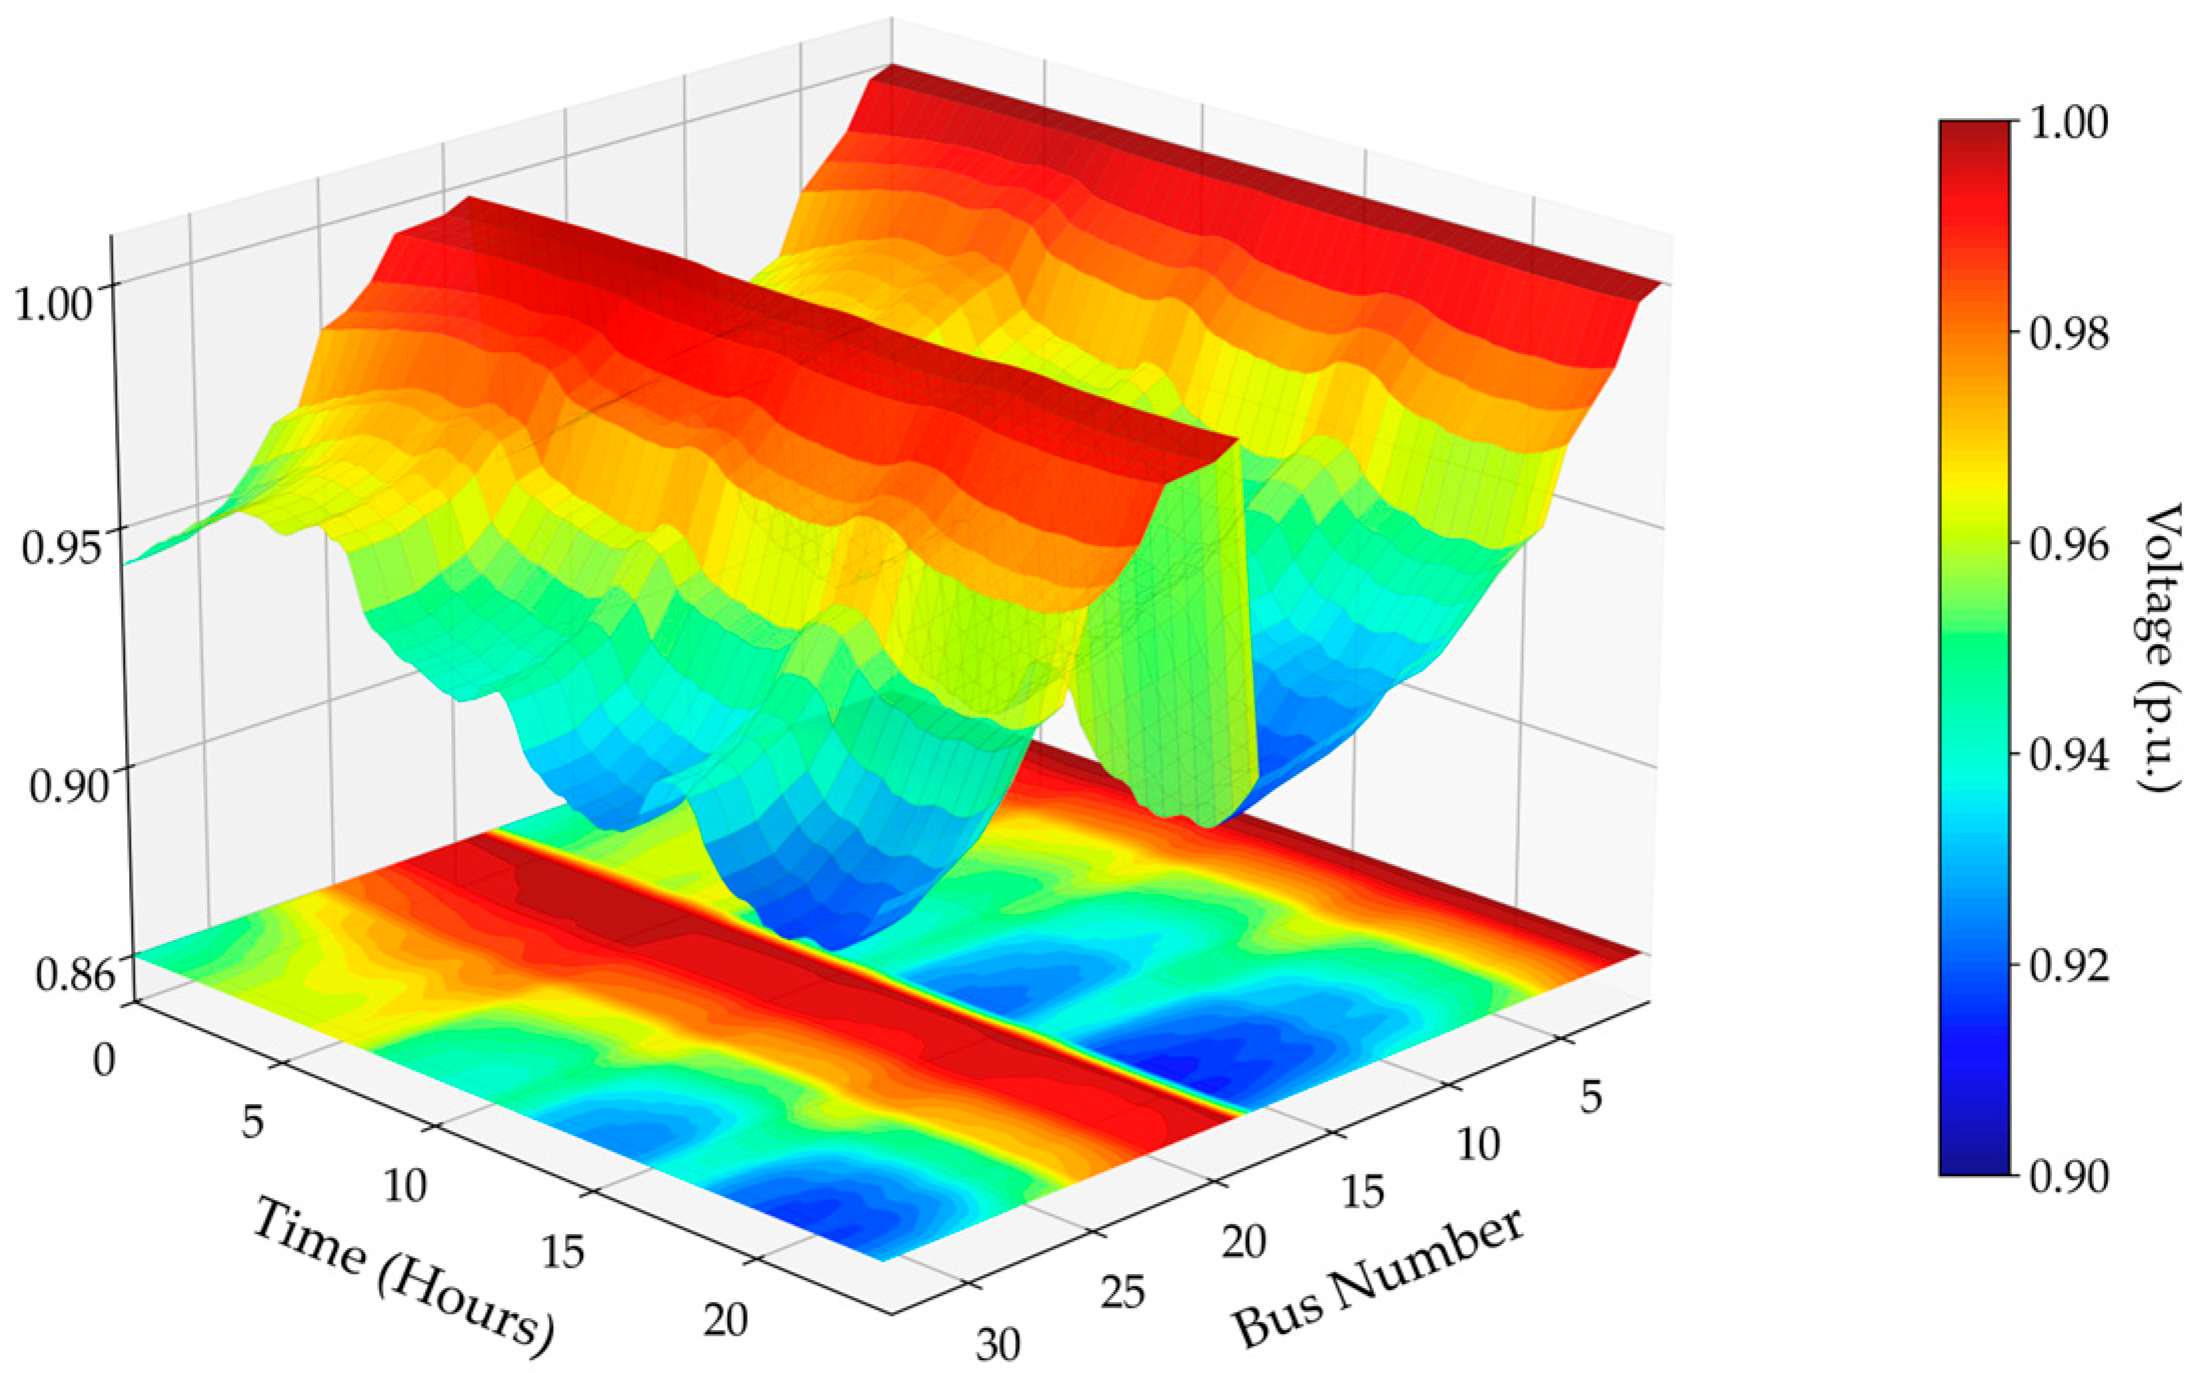
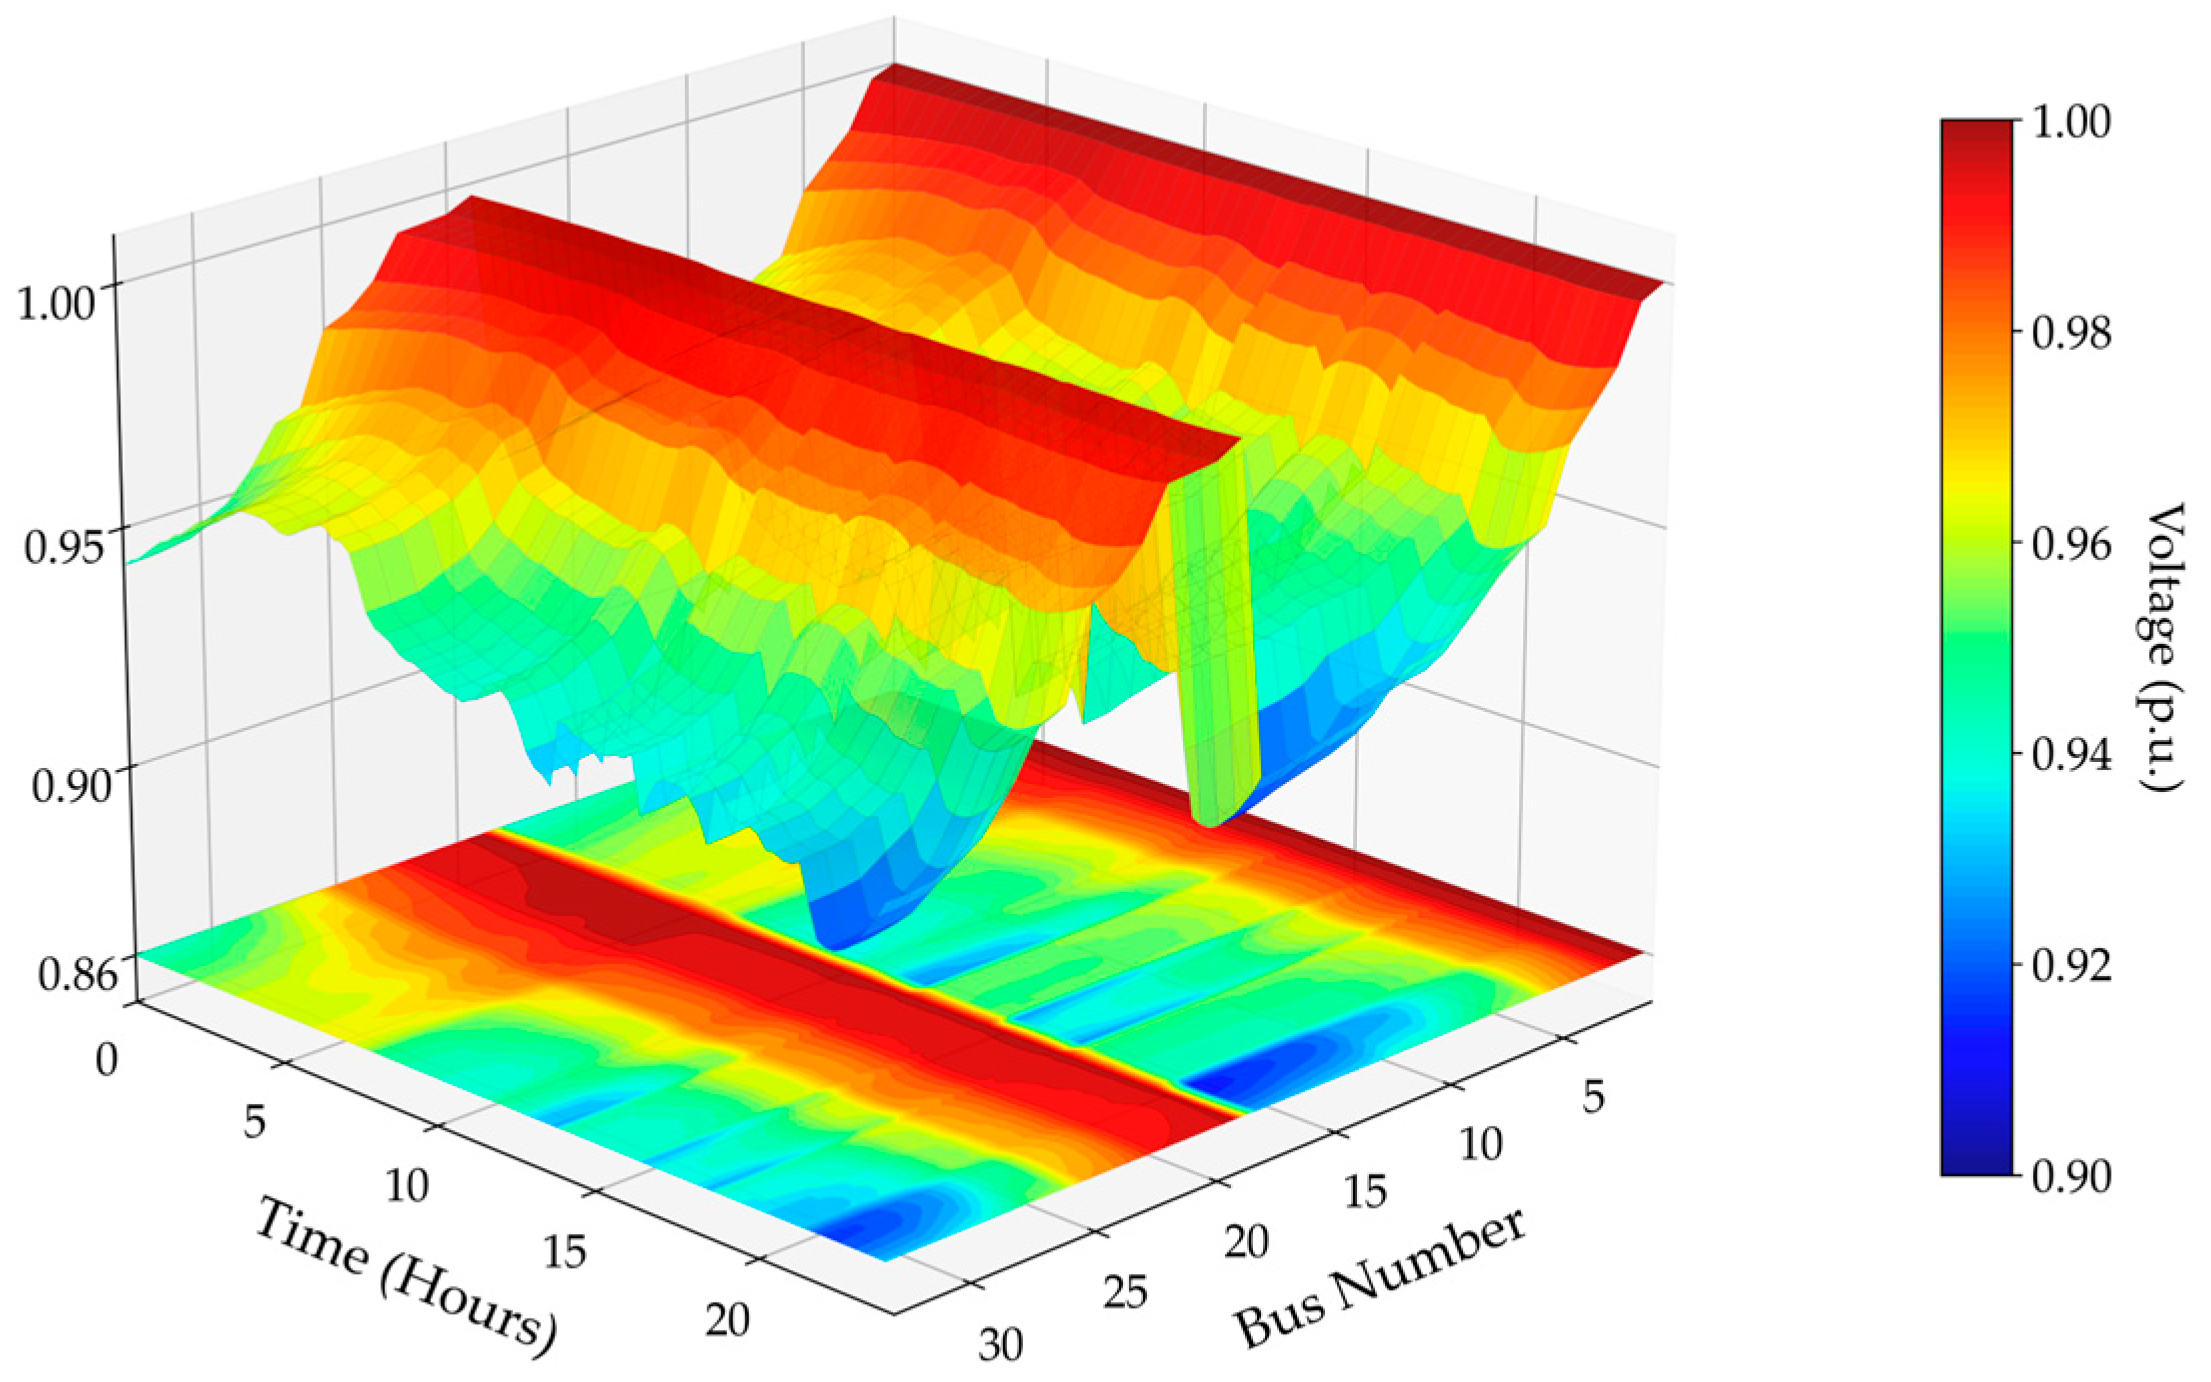
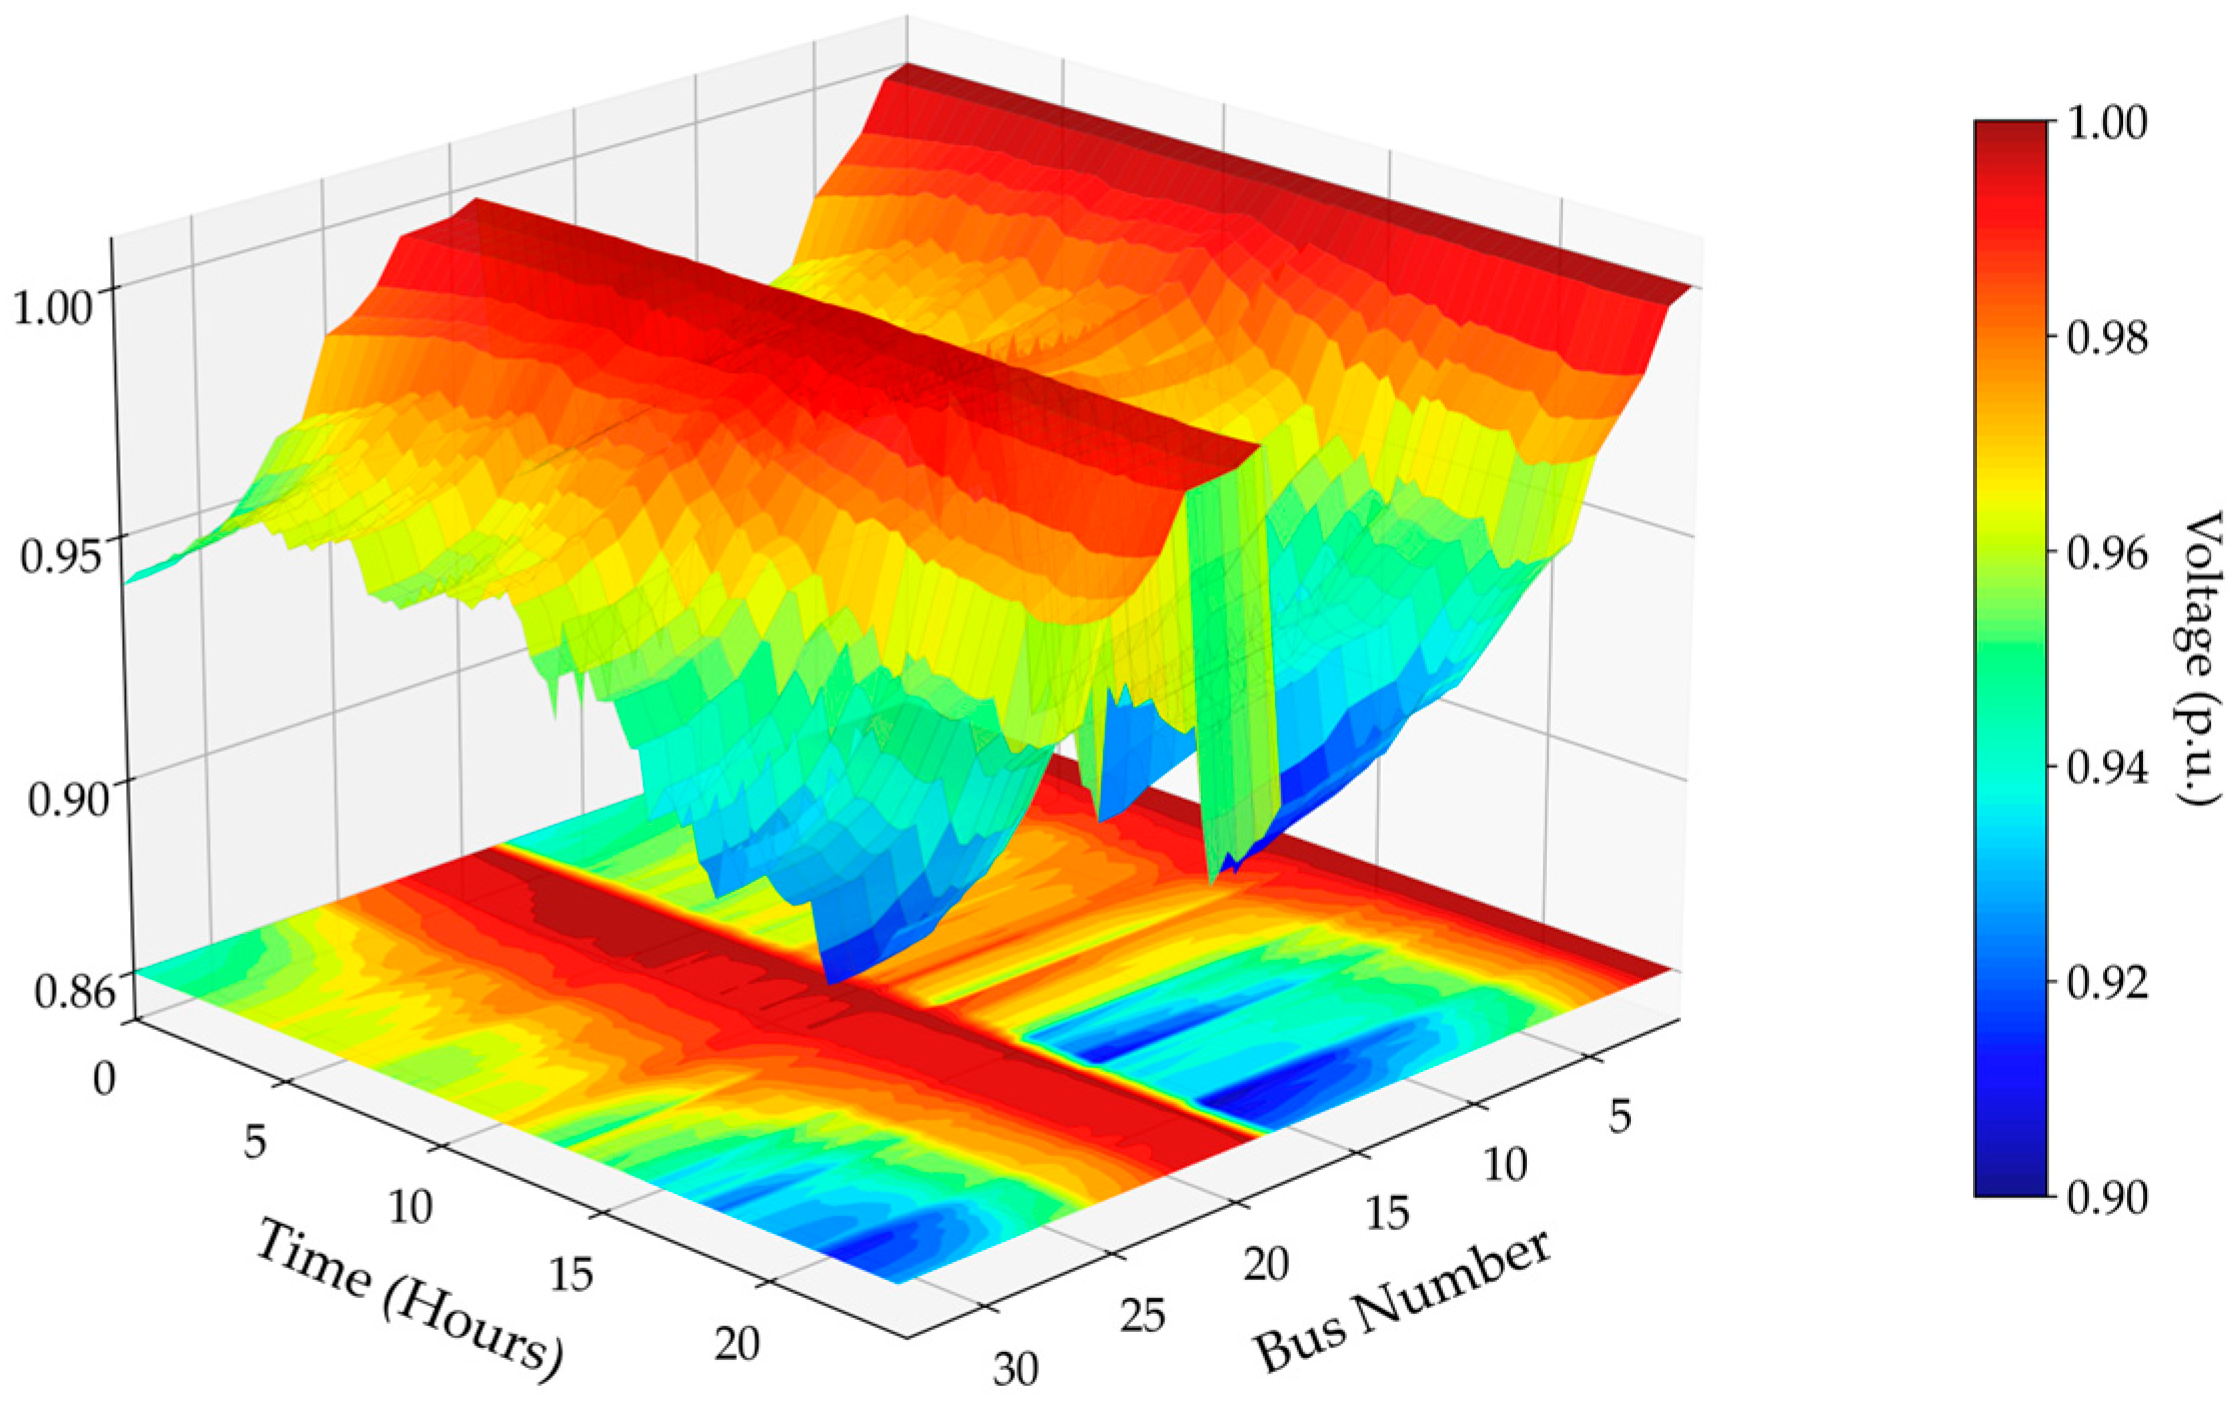
Scenario 1 was developed to evaluate the effectiveness of MBESS in both standalone operation and in coordination with DFR, under conditions where no the DERs are integrated into the ADS. The quantitative results are summarized in Table 6, while the three-dimensional voltage magnitude profiles in Figure 8, Figure 9 and Figure 10 collectively illustrate the corresponding network performance for each case.
In the base configuration (Case 1), the ADS exhibited the highest active and reactive power losses, recorded at 2.674 MWh and 1.782 Mvarh, respectively, together with the largest Voltage Deviation Index (VDI = 0.037), indicating poor voltage quality across the network. Several feeder-end buses experienced voltage magnitudes below 0.95 p.u., as illustrated in Figure 8, highlighting the vulnerability of the base system to excessive losses and voltage excursions.
When MBESS was integrated into the system (Case 2), active and reactive power losses decreased by approximately 5.1% and 11.7%, respectively, showing that mobile storage can partially alleviate feeder congestion and redistribute loading. However, the improvement in voltage quality was minimal (VDI = 0.035 compared with 0.037), indicating that MBESS alone cannot effectively regulate network voltage. The total operating cost increased from $13,596/day in the base case to $13,891/day due to additional expenses from battery degradation and transportation energy. CO2 emissions also rose slightly to 30,591 kg/day, reflecting the mobility energy consumption of the MBESS units. These findings demonstrate that MBESS alone offers limited system-wide benefits and may increase both economic and environmental burdens.
By contrast, the coordinated MBESS–DFR operation (Case 3) achieved substantial improvements across all performance indices. Active and reactive power losses were reduced to 1.870 MWh and 1.259 Mvarh, representing decreases of 30.07% and 29.35% compared with the base system, and 26.29% and 20.01% relative to MBESS-only operation. The VDI improved to 0.022, a 40.54% enhancement over the base case, confirming that voltage magnitudes were maintained close to the nominal 1.0 p.u. The FVSI also declined slightly (from 2.139 to 2.087), confirming the stabilizing influence of feeder reconfiguration on voltage profiles and overall system reliability.
From an economic and environmental perspective, the coordinated strategy achieved near parity with the base system. The total daily operating cost was $13,632/day, lower than the MBESS-only configuration and almost equivalent to the base case, demonstrating that mobility costs were offset by reduced energy losses and lower peak-demand charges. CO2 emissions were 30,289 kg/day, representing only a marginal increase of 0.31% over the base case and a 0.99% decrease relative to MBESS-only operation. These results confirm that the integrated MBESS–DFR framework improves system efficiency without introducing additional environmental penalties.
The voltage magnitude profiles further support these findings. In the base case (Figure 8), several buses experienced undervoltage conditions, whereas the MBESS-only case (Figure 9) provided only marginal improvements. By contrast, the combined MBESS–DFR strategy (Figure 10) produced the most uniform voltage distribution, maintaining all buses within the acceptable range of 0.95–1.05 p.u.
Figure 8 shows the voltage magnitude profile of the base system (Case 1). Several feeder-end buses experience undervoltage conditions below 0.95 p.u., indicating poor voltage regulation and highlighting the network’s weakness under load-only operation.
Figure 9 presents the voltage magnitude profile for Case 2 (MBESS-only). Minor improvements are observed as MBESS dispatch mitigates some undervoltage conditions; however, several buses still operate outside the acceptable range of 0.95–1.05 p.u., indicating limited voltage regulation capability.
Figure 10 shows the voltage magnitude profile for Case 3 (MBESS + DFR). The voltage distribution improves significantly, exhibiting a uniform profile across all buses, with voltages maintained within the acceptable range of 0.95–1.05 p.u.
In summary, the results of Scenario 1 indicate that MBESS alone provides limited technical benefits while increasing operational costs and emissions. In contrast, the coordinated MBESS–DFR strategy delivers significant system-level improvements, including reductions in power losses, improved voltage profiles, and enhanced voltage stability without imposing additional economic or environmental burdens. These outcomes highlight the importance of integrated optimization for achieving efficient ADS operation under load-only conditions.

4.3. Results of Scenario 2 (Case 4 to Case 6)

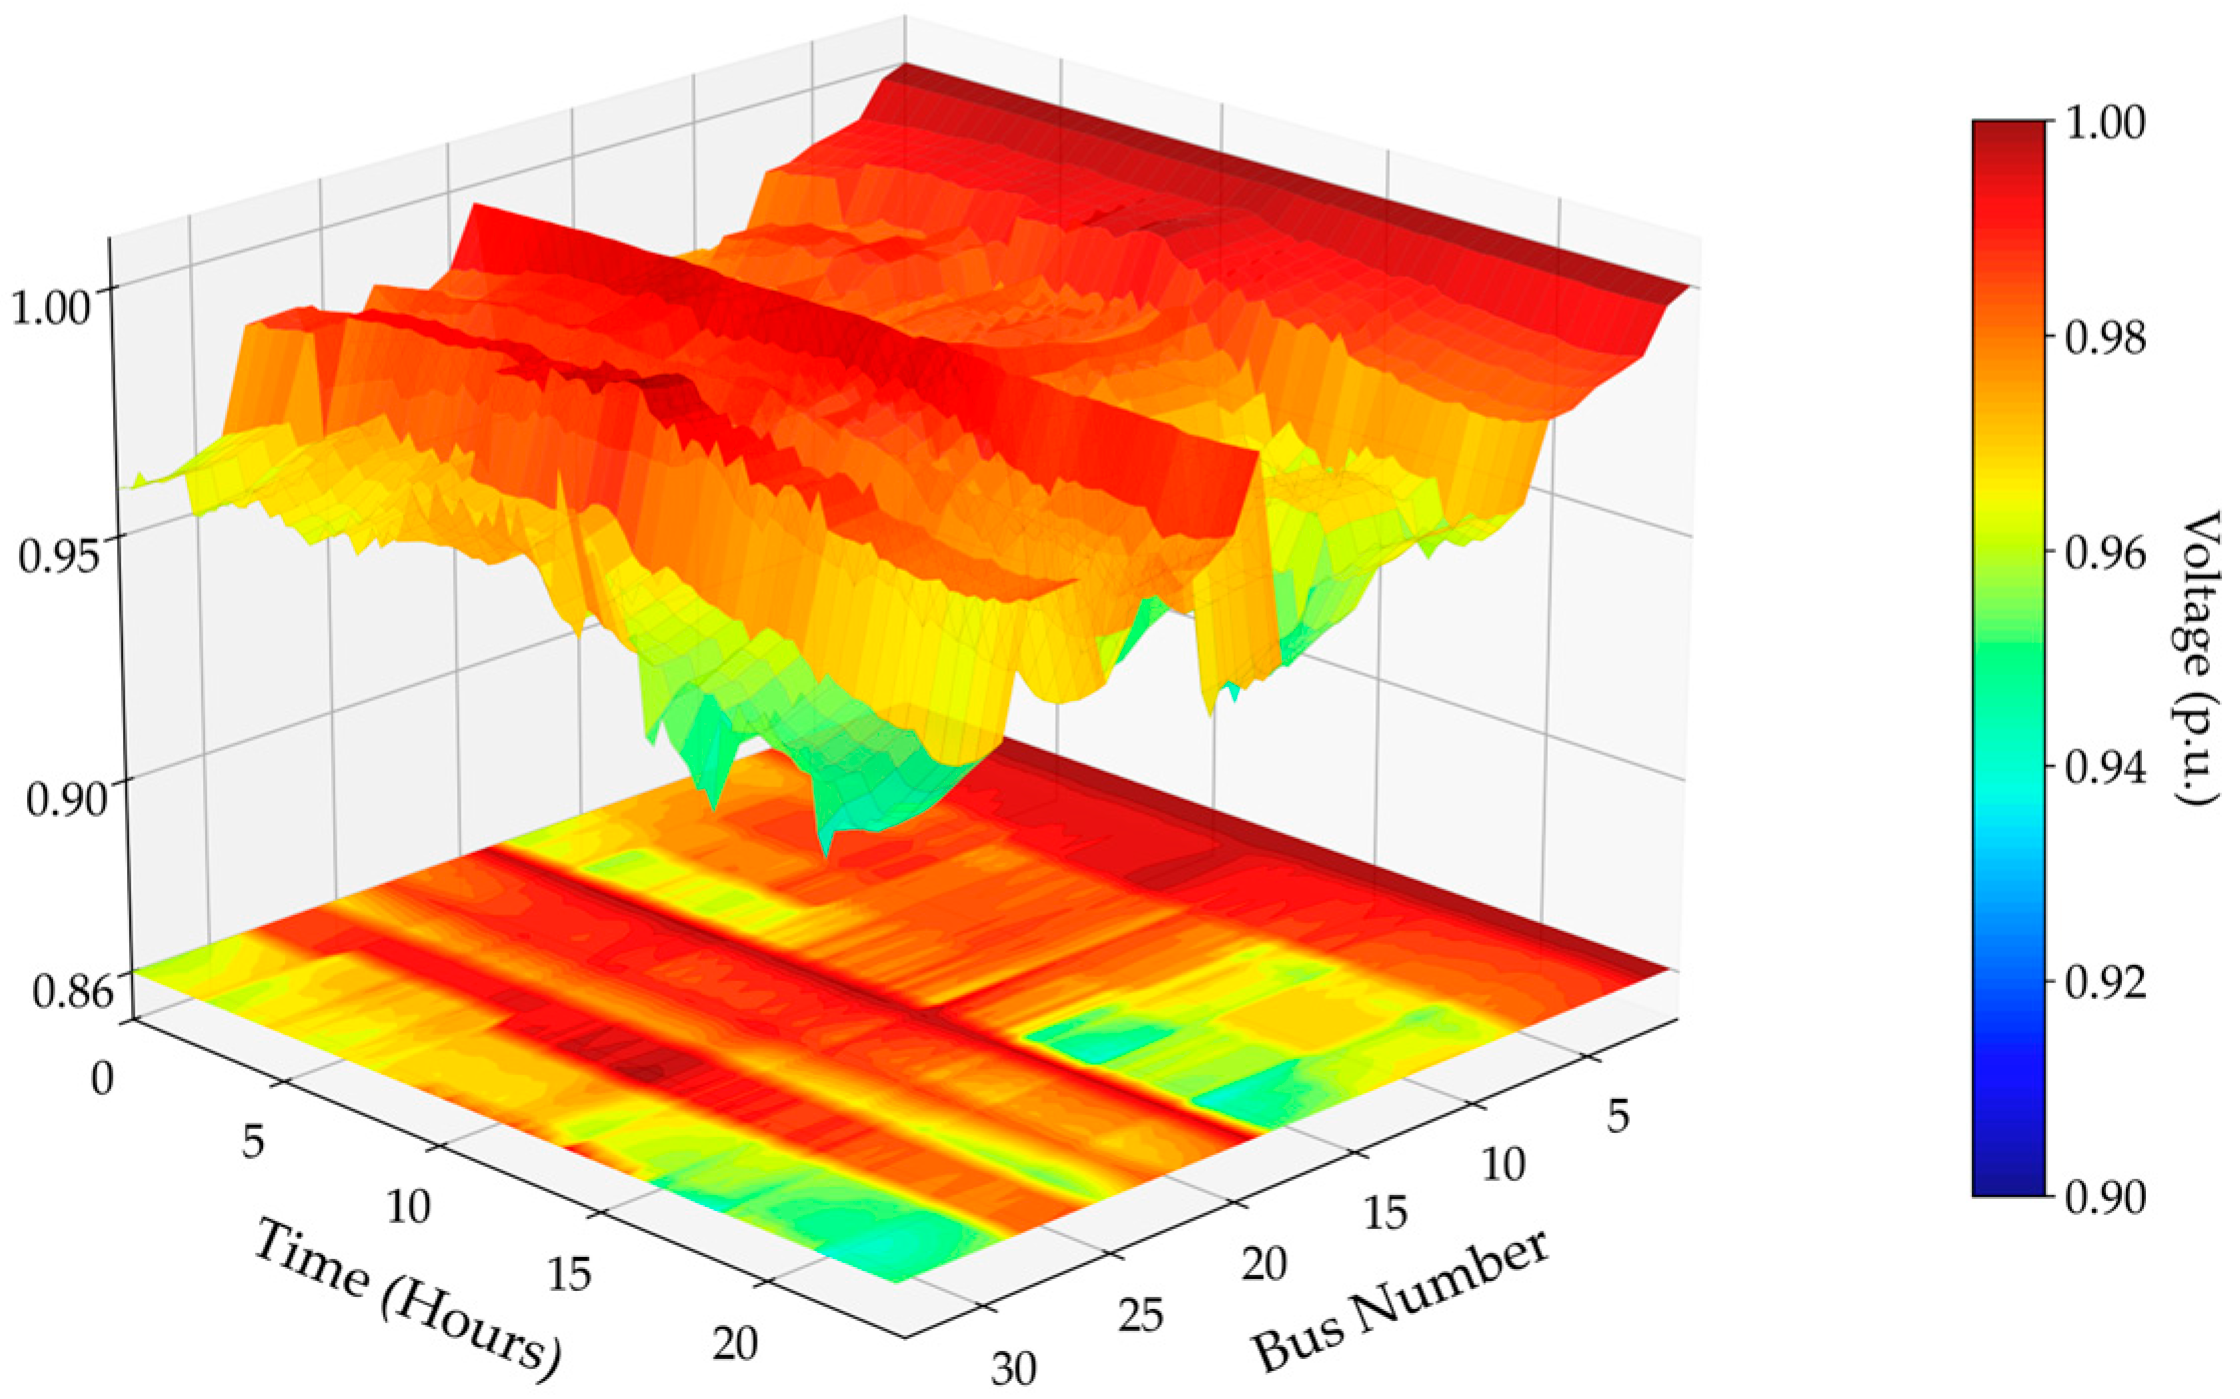
Scenario 2 extends the analysis by integrating DERs into the ADS. Three cases were evaluated to capture the incremental effects of MBESS and DFR as Case 4: ADS with DERs only as Case 5: ADS with DERs and MBESS, and as Case 6: ADS with DERs, MBESS, and DFR. The quantitative results are presented in Table 7, which demonstrates progressive improvement across technical, economic, and environmental indicators. Coordinated MBESS–DFR operation achieved the greatest reductions in active and reactive power losses, at 27.80% and 26.78%, respectively, compared with DERs only operation. The VDI and FVSI also improved, indicating stronger voltage regulation and enhanced system stability. Operating costs remained nearly unchanged as efficiency gains from the DFR offset the MBESS mobility expenses, while CO2 emissions declined slightly, reflecting improved environmental performance. These findings highlight the effectiveness of coordinated control in optimizing system operation under high renewable penetration.
The integration of DERs markedly affected the operational performance of the ADS. In the DERs-only case (Case 4), active and reactive power losses decreased compared with the base system in Scenario 1, reaching 2.428 MWh and 1.628 Mvarh, respectively, due to local generation support. However, the variability of renewable output introduced additional stress on voltage regulation, resulting in a VDI of 0.037, almost identical to that of the base system without DERs. This outcome highlights the challenge of maintaining voltage stability under fluctuating renewable generation.
When MBESS was added alongside DERs (Case 5), further improvements were achieved. Active and reactive power losses declined to 2.310 MWh and 1.433 Mvarh, corresponding to reductions of 4.9% and 12%, respectively, compared with DERs-only operation. The VDI improved to 0.031, reflecting enhanced voltage regulation through storage-based support. However, the total daily operating cost increased to $12,734/day due to battery degradation and transportation energy requirements, while CO2 emissions rose to 21,213 kg/day, compared with 20,807 kg/day in the DERs-only case. These results indicate that although MBESS effectively mitigates DER variability, its independent operation imposes additional economic and environmental costs similar to those observed in Scenario 1.
The most significant benefits were obtained when MBESS was coordinated with DFR (Case 6). Active and reactive power losses decreased to 1.753 MWh and 1.192 Mvarh, representing reductions of 27.80% and 26.78% relative to the DERs-only case and 24.11% and 16.82% compared with the DERs + MBESS configuration.
The VDI improved notably to 0.021, corresponding to a 43.24% enhancement over DERs-only operation, confirming that the combined flexibility of MBESS and DFR effectively stabilizes voltage even under high renewable penetration. The FVSI also decreased slightly from 2.134 to 2.086, indicating an improved stability margin against voltage collapse.
From an economic and environmental standpoint, the coordinated configuration achieved the lowest operating cost of $12,499/day, lower than the DERs + MBESS case and nearly equivalent to the DERs-only case. This demonstrates that DFR offsets the additional costs of MBESS mobility by improving system efficiency and reducing energy imports. CO2 emissions declined to 20,954 kg/day, closely matching the DERs-only case (−0.71%) and 1.22% lower than the DERs + MBESS case. These findings confirm that the coordinated integration of MBESS and DFR delivers simultaneous technical, economic, and environmental benefits without introducing significant cost penalties.
Figure 11 shows the voltage magnitude profile for Case 4 (DERs-only). Several buses exhibit voltage deviations beyond the acceptable range of 0.95–1.05 p.u., primarily due to the intermittent nature of renewable generation, confirming the challenge of maintaining voltage stability under fluctuating DER output.
Figure 12 presents the voltage magnitude profile for Case 5 (DERs + MBESS). The addition of MBESS improved voltage regulation compared with the DERs-only case; however, several buses still exhibited localized undervoltage conditions, indicating that MBESS alone provides only partial mitigation of renewable intermittency effects.
Figure 13 shows the voltage magnitude profile for Case 6 (DERs + MBESS + DFR). The coordinated operation achieved the most uniform voltage distribution, with all bus voltages maintained within the acceptable range of 0.95–1.05 p.u., confirming the effectiveness of the integrated MBESS–DFR control in enhancing network voltage stability.
In summary, the overall results demonstrate that coordinated operation between MBESS and DFR consistently enhances the technical, economic, and environmental performance of the ADS across all scenarios. While standalone MBESS or DER integration offers localized benefits, their independent application remains limited by higher operational costs and instability under fluctuating load and generation conditions. In contrast, the combined MBESS–DFR strategy achieves optimal performance by simultaneously reducing active and reactive power losses, improving voltage regulation, and maintaining cost efficiency. These results confirm that coordinated optimization is a key enabler for resilient, low-carbon, and renewable-rich distribution networks.

4.4. Discussion

The comparative evaluation of Scenarios 1 and 2 provides comprehensive insights into the coordinated role of the MBESS and the DFR in enhancing the operational performance of the ADS. The following discussion interprets these findings from technical, economic, and environmental perspectives, highlighting key practical implications and limitations.

4.4.1. Technical Performance Analysis

The coordinated MBESS–DFR strategy demonstrated significant improvements across both scenarios.
In Scenario 1 (Table 6), Case 3 reduced active power losses from 2.674 MWh to 1.870 MWh (a 30.07% reduction) and reactive losses from 1.782 Mvarh to 1.259 Mvarh (a 29.35% reduction) relative to the base case. These improvements substantially exceeded the MBESS-only configuration (Case 2), which achieved reductions of only 5.1% and 11.7%, respectively. The VDI improved from 0.037 to 0.022 (40.54% improvement), and Figure 8, Figure 9 and Figure 10 visually confirm that all bus voltages were maintained within 0.95–1.05 p.u., unlike the base case, which exhibited undervoltage conditions.
In Scenario 2 with DER integration (Table 7), Case 6 achieved comparable performance, reducing active losses by 27.80% (from 2.428 MWh to 1.753 MWh) and improving the VDI by 43.24% (from 0.037 to 0.021) compared with the DERs-only operation. When compared with Case 5 (DER + MBESS), Case 6 provided an additional 24.11% reduction in active losses and a 32.26% improvement in the VDI, demonstrating that the DFR significantly enhances the MBESS performance. Figure 11, Figure 12 and Figure 13 confirm these findings, with Figure 13 showing the most uniform voltage distribution across all buses and time intervals.
Although FVSI improvements were modest 2.43% in Scenario 1 and 2.25% in Scenario 2 they still indicate enhanced voltage stability and reduced risk of voltage collapse. These gains stem from the synergistic interaction between MBESS mobility and feeder reconfiguration. As presented in Table 4 and Figure 6 and Figure 7, optimal the MBESS locations varied with feeder topology. For example, in Case 6, MBESS units were positioned at buses 17, 18, and 32, near the high DER penetration nodes, while the DFR dynamically adjusted switching states during idle, charging, and discharging periods to minimize impedance paths and redistribute loading.

4.4.2. Economic and Environmental Performance

The economic results reveal that MBESS only deployment increases operational costs due to battery degradation and transportation expenses. In Scenario 1, daily costs rose from $13,596 to $13,891 (Case 2), and in Scenario 2, from $12,465 to $12,734 (Case 5). However, coordinated the MBESS–DFR operation achieved near cost parity: $13,632/day in Case 3 (0.26% above baseline) and $12,499/day in Case 6 (0.27% above the DERs only). The 1.85–2.2% cost reductions from the MBESS-only to coordinated configurations confirm that the DFR optimization offsets mobility costs by lowering energy imports, reducing peak demand charges, and minimizing system losses.
From an environmental perspective, CO2 emissions followed a similar trend. MBESS-only operation increased emissions to 30,591 kg/day in Scenario 1 and 21,213 kg/day in Scenario 2, mainly due to additional transportation energy consumption. In contrast, coordinated operation reduced emissions to 30,289 kg/day and 20,954 kg/day, representing 0.99% and 1.22% reductions relative to the MBESS-only cases. These findings indicate that energy savings from loss reduction effectively offset transportation-related emissions, confirming a net environmental benefit of the coordinated strategy.

4.4.3. Multi-Objective Optimization Insights

The NSGA-III algorithm effectively balanced six conflicting objectives, achieving simultaneous technical, economic, and environmental improvements. This performance enhancement results from three interdependent mechanisms:
  • Feeder reconfiguration (DFR) reshapes network topology to minimize impedance and create favorable operating conditions for MBESS deployment, as demonstrated by the varying switching configurations in Table 5.
  • Optimal MBESS siting leverages the reconfigured topology to maximize locational value, with siting locations shifting among buses 15, 16, 18, and 32 depending on scenario conditions (Table 4).
  • Transportation constraints including travel distances (32.8–54.6 km) and energy consumption (36.08–60.06 kWh) were explicitly modeled, ensuring practical mobility feasibility and preventing unrealistic dispatch behavior.
The TOPSIS-based compromise solution selection further improved decision quality by normalizing objective functions to a [0, 1] scale and calculating the relative closeness to the ideal solution, avoiding subjective weight assignments while accurately reflecting operator preferences.

4.4.4. Practical Implications

Integrated Planning Necessity: The 26.29% additional loss reduction from incorporating DFR into MBESS (Case 2 vs. Case 3, Table 6) and the 24.11% gain between Case 5 and Case 6 (Table 7) quantify the value of integrated planning. Traditional sequential optimization approaches cannot capture these synergies, confirming that MBESS should be treated as a system-level resource co-optimized with feeder reconfiguration rather than deployed in isolation.
DER Integration Considerations: Results from Scenario 2 highlight that high renewable penetration introduces voltage instability that neither DER curtailment nor MBESS alone can resolve. The identical VDI of 0.037 in Case 4 (DER-only) and Case 1 (base case) demonstrates that local generation alone provides limited voltage support. In contrast, Case 6 the VDI of 0.021 shows that coordinated control effectively mitigates voltage fluctuations while maximizing renewable utilization.
Transportation Logistics: Table 4 indicates that daily travel distances of 40–55 km and durations of 34–64 min are operationally feasible for single-trip MBESS movement. However, the associated transportation energy consumption (36–60 kWh, equivalent to 1.8–3.0% of storage capacity) suggests that multi-trip operations would require careful scheduling and energy management to maintain efficiency.

4.4.5. Study Limitations

The study’s single trip assumption, while representative of typical daily operations may underutilize the MBESS flexibility for rapid contingency response or multiple within-day relocations. The deterministic optimization framework does not explicitly address forecast uncertainties in renewable generation, load variations, or traffic conditions, although the consistency of results across both scenarios supports its robustness.

5. Conclusions

This paper presented a multi-objective optimization framework that integrates the MBESS with the DFR to enhance the performance of the ADS. The framework incorporates power transport coupling constraints, including power flow limits, feeder radiality, the MBESS state of charge dynamics, and single trip mobility restrictions, ensuring a realistic representation of mobile storage operation. Using the NSGA-III, six objectives were optimized simultaneously: active and reactive power losses, VDI, voltage stability, operating cost, and CO2 emissions.
The proposed approach was evaluated on the IEEE 33-bus test system coupled with a 33-node transport network across six scenarios, including photovoltaic generation and the EVCS. The results showed that the coordinated MBESS–DFR strategy reduced active power losses by 28.53%, improved the VDI by 40.54%, and enhanced voltage stability by 23.88% compared with the base case. The normalization pipeline combined with the TOPSIS method successfully selected compromise solutions from the Pareto fronts, providing balanced dispatch strategies that improved both technical performance and cost effectiveness.
Furthermore, the study offered practical recommendations for real-world implementation. The MBESS demonstrated greater flexibility than stationary systems, while the DFR significantly influenced optimal discharge locations. Transportation related time and energy constraints were found to limit grid benefits in certain cases, underscoring the importance of depot placement, discharge scheduling, and switching configuration in renewable rich environments. Overall, the coordinated MBESS–DFR framework advances both methodological and practical knowledge for the ADS, providing operators with a decision-support tool that enhances technical efficiency, ensures economic viability, and supports sustainable integration of renewable energy and the EVCS infrastructure.
Looking ahead, future research should extend the proposed framework to multi-trip and multi-unit MBESS logistics, incorporate stochastic optimization under renewable and traffic uncertainties, and integrate market based coordination mechanisms to further strengthen the role of the MBESS–DFR strategies in next generation distribution system operations.

Author Contributions

Conceptualization, K.B. (Krittidet Buayai), W.S.-n.-n., K.B. (Krischonme Bhumkittipich), K.K., S.M. and Y.K.; methodology, P.M., R.R., W.S.-n.-n., S.M. and Y.K.; validation, P.M., R.R., W.S.-n.-n., K.K., S.M. and Y.K.; formal analysis, K.B., R.R., W.S.-n.-n., K.B. (Krischonme Bhumkittipich), K.K., S.M. and Y.K.; investigation, P.M., K.B. (Krittidet Buayai), W.S.-n.-n. K.K., S.M. and Y.K.; resources, W.S.-n.-n., K.K., S.M. and Y.K.; data curation, P.M., S.M. and Y.K.; writing—original draft preparation, P.M., R.R., S.M. and Y.K.; writing—review and editing, P.M., K.B. (Krittidet Buayai), W.S.-n.-n., K.B. (Krischonme Bhumkittipich), K.K., S.M. and Y.K.; visualization, P.M., W.S.-n.-n., I.S., S.M. and Y.K.; supervision, K.B., W.S.-n.-n., K.K., I.S., S.M. and Y.K.; project administration, W.S.-n.-n., K.B. (Krischonme Bhumkittipich), K.K., I.S., S.M. and Y.K.; funding acquisition, R.R., K.B. (Krischonme Bhumkittipich), K.K., I.S. and S.M. All authors have read and agreed to the published version of the manuscript.

Funding

National Science and Technology Development Agency (NSTDA) [Contract code: 29/2565].

Data Availability Statement

The authors implemented the work on the simulator. The data presented in this study are available on request from the corresponding authors.

Acknowledgments

All authors are grateful for technical support from the Intelligent Power System and Energy Research (IPER), Department of Electrical engineering, Faculty of Engineering and Technology, Rajamangala University of Technology Isan, Nakhon Ratchasima 30000, Thailand.

Conflicts of Interest

The authors declare no conflicts of interest.

References

  1. Alonso, R.F.; Zambroni de Souza, A.C. Resilience of active networks with optimal mobile energy storage systems management. Electr. Power Syst. Res. 2023, 217, 109152. [Google Scholar] [CrossRef]
  2. Nick, M.; Cherkaoui, R.; Paolone, M. Optimal Planning of Distributed Energy Storage Systems in Active Distribution Networks Embedding Grid Reconfiguration. IEEE Trans. Power Syst. 2018, 33, 1577–1590. [Google Scholar] [CrossRef]
  3. Ma, J.; Feng, X.; Lei, J.; Ling, J.; Hua, M. Multi-objective Configuration Method for Mobile Energy Storage Aimed at Enhancing the Resilience of Regional Power Grid. J. Phys. Conf. Ser. 2023, 2662, 12002. [Google Scholar] [CrossRef]
  4. Gabash, A.; Li, P. Flexible Optimal Operation of Battery Storage Systems for Energy Supply Networks. IEEE Trans. Power Syst. 2013, 28, 2788–2797. [Google Scholar] [CrossRef]
  5. Abdeltawab, H.H.; Mohamed, Y.A.-R.I. Mobile Energy Storage Scheduling and Operation in Active Distribution Systems. IEEE Trans. Ind. Electron. 2017, 64, 6828–6840. [Google Scholar] [CrossRef]
  6. Lotfi, H.; Nikkhah, M.H.; Hajiabadi, M.E. Dynamic Reconfiguration for Energy Management in EV and RES-Based Grids Using IWOA. World Electr. Veh. J. 2025, 16, 412. [Google Scholar] [CrossRef]
  7. Jacob, R.A.; Bhattacharya, A.; Sharma, S. Feasibility study and analysis of battery energy storage system and network reconfiguration in active distribution network. In Proceedings of the 2017 IEEE Region 10 Symposium (TENSYMP), Cochin, India, 14–16 July 2017. [Google Scholar]
  8. Tong, L.; Zhao, S.; Jiang, H.; Zhou, J.; Xu, B. Multi-Scenario and Multi-Objective Collaborative Optimization of Distribution Network Considering Electric Vehicles and Mobile Energy Storage Systems. IEEE Access 2021, 9, 55690–55697. [Google Scholar] [CrossRef]
  9. Saboori, H.; Jadid, S. Mobile and self-powered battery energy storage system in distribution networks—Modeling, operation optimization, and comparison with stationary counterpart. J. Energy Storage 2021, 42, 103068. [Google Scholar] [CrossRef]
  10. Ahmed, H.M.A.; Sindi, H.F.; Azzouz, M.A.; Awad, A.S.A. Optimal Sizing and Scheduling of Mobile Energy Storage Toward High Penetration Levels of Renewable Energy and Fast Charging Stations. IEEE Trans. Energy Convers. 2022, 37, 1075–1086. [Google Scholar] [CrossRef]
  11. Sun, W.; Qiao, Y.; Liu, W. Economic scheduling of mobile energy storage in distribution networks based on equivalent reconfiguration method. Sustain. Energy Grids Netw. 2022, 32, 100879. [Google Scholar] [CrossRef]
  12. Jeon, S.; Choi, D.-H. Joint optimization of Volt/VAR control and mobile energy storage system scheduling in active power distribution networks under PV prediction uncertainty. Appl. Energy 2022, 310, 118488. [Google Scholar] [CrossRef]
  13. Xia, S.; Wang, Z.; Gao, X.; Li, W. Optimal planning of mobile energy storage in active distribution network. IET Smart Grid 2024, 7, 1–12. [Google Scholar] [CrossRef]
  14. Liu, J.; Lin, S.; He, S.; Liu, W.; Liu, M. Multiobjective Optimal Dispatch of Mobile Energy Storage Vehicles in Active Distribution Networks. IEEE Syst. J. 2023, 17, 804–815. [Google Scholar] [CrossRef]
  15. Ganivada, P.K.; El-Fouly, T.H.; Zeineldin, H.H.; Al-Durra, A. Optimal siting and sizing of mobile-static storage mix in distribution systems with high renewable energy resources penetration. Electr. Power Syst. Res. 2024, 226, 109860. [Google Scholar] [CrossRef]
  16. Kim, S.; Lee, J. Optimal Scheduling Strategy for Distribution Network with Mobile Energy Storage System and Offline Control PVs to Minimize the Solar Energy Curtailment. Energies 2024, 17, 2234. [Google Scholar] [CrossRef]
  17. Linag, F.; Ni, J.; Yu, Z.; Zhang, K.; Zhao, Q.; Wang, S. Fixed and mobile energy storage coordination optimization method for enhancing photovoltaic integration capacity considering voltage offset. Front. Energy Res. 2024, 12, 1351324. [Google Scholar] [CrossRef]
  18. Guo, H.; Wu, S.; Shi, T.; Wang, F.; Gong, D. Coordinated Operation of Active Distribution Network and Mobile Energy Storage Using Stackelberg Game. IEEE Trans. Ind. Inform. 2025, 21, 4423–4434. [Google Scholar] [CrossRef]
  19. Lai, X.; Du, H.; Long, F.; An, Y.; Cai, M. A Mobile Energy Storage Configuration Method for Power Grids Considering Power Losses and Voltage Stability. Processes 2025, 13, 1079. [Google Scholar] [CrossRef]
  20. Miao, L.; Di, L.; Zhao, J.; Liu, H.; Hu, Y.; Wei, X. Optimal Scheduling of Active Distribution Networks with Hybrid Energy Storage Systems Under Real Road Network Topology. Processes 2025, 13, 1492. [Google Scholar] [CrossRef]
  21. Ji, Y.; Zhang, Y.; Chen, L.; Zuo, J.; Wang, W.; Xu, C. The Optimal Dispatch for a Flexible Distribution Network Equipped with Mobile Energy Storage Systems and Soft Open Points. Energies 2025, 18, 2701. [Google Scholar] [CrossRef]
  22. Qiao, J.; Mi, Y.; Shen, J.; Xia, D.; Li, D.; Wang, P. Active and reactive power coordination optimization for active distribution network considering mobile energy storage system and dynamic network reconfiguration. Electr. Power Syst. Res. 2025, 238, 111080. [Google Scholar] [CrossRef]
  23. Farzin, H.; Chehrazi, F.; Saniei, M. Multi-objective planning of mobile energy storage unit in active distribution network considering reliability. J. Energy Storage 2025, 109, 115138. [Google Scholar] [CrossRef]
  24. Li, Z.; Sun, H.; Xue, Y.; Jin, X.; Wang, P. Resilience-Oriented Asynchronous Decentralized Restoration Considering Building and E-Bus Coresponse in Electricity-Transportation Networks. IEEE Trans. Transp. Electrif. 2025, 11, 11701–11713. [Google Scholar] [CrossRef]
  25. Wang, K.; Xue, Y.; Guo, Q.; Shahidehpour, M.; Zhou, Q.; Wang, B.; Sun, H. A Coordinated Reconfiguration Strategy for Multi-Stage Resilience Enhancement in Integrated Power Distribution and Heating Networks. IEEE Trans. Smart Grid 2023, 14, 2709–2722. [Google Scholar] [CrossRef]
  26. Nuamkoksung, P.; Sanga-ngam, W.; Suthamno, K.; Klayklueng, T.; Marsong, S.; Sonasang, S.; Bhumkittipich, K.; Ngoc Vo, D.; Buayai, K.; Kerdchuen, K.; et al. Integrated Control of DERs Placement and Network Reconfiguration in EV-Charging Distribution Systems Using Multi-Optimization Techniques. Eng. Access 2025, 11, 301–318. [Google Scholar]
  27. Kongjeen, Y.; Eiampong, W.; Buayai, K.; Kerdchuen, K. Voltage Stability Analysis in Microgrids System with Photovoltaic Solar Energy under Uncertainty of Loads Variation. GMSARN Int. J. 2023, 17, 156–162. [Google Scholar]
  28. Purlu, M.; Turkay, B.E. Optimal Allocation of Renewable Distributed Generations Using Heuristic Methods to Minimize Annual Energy Losses and Voltage Deviation Index. IEEE Access 2022, 10, 21455–21474. [Google Scholar] [CrossRef]
  29. Chitgreeyan, N.; Pilalum, P.; Kongjeen, Y.; Kongnok, R.; Buayai, K.; Kerdchuen, K. Modified MATPOWER for Multi-Period Power Flow Analysis with PV Integration. GMSARN Int. J. 2025, 19, 165–174. [Google Scholar]
  30. Jaramillo, M.D.; Carrión, D.F.; Muñoz, J.P. A Novel Methodology for Strengthening Stability in Electrical Power Systems by Considering Fast Voltage Stability Index under N − 1 Scenarios. Energies 2023, 16, 3396. [Google Scholar] [CrossRef]
  31. Gupta, S.K.; Mallik, S.K.; Kumar, D.; Kumar, S. Voltage stability assessment of the power system using novel line voltage collapse index. Eng. Res. Express 2024, 6, 25324. [Google Scholar] [CrossRef]
  32. Mokred, S.; Wang, Y.; Chen, T. Modern voltage stability index for prediction of voltage collapse and estimation of maximum load-ability for weak buses and critical lines identification. Int. J. Electr. Power Energy Syst. 2023, 145, 108596. [Google Scholar] [CrossRef]
  33. Pilalum, P.; Taksana, R.; Chitgreeyan, N.; Sa-nga-ngam, W.; Marsong, S.; Buayai, K.; Kerdchuen, K.; Kongjeen, Y.; Bhumkittipich, K. Mitigation of Voltage Magnitude Profiles Under High-Penetration-Level Fast-Charging Stations Using Optimal Capacitor Placement Integrated with Renewable Energy Resources in Unbalanced Distribution Networks. Smart Cities 2025, 8, 102. [Google Scholar] [CrossRef]
  34. Lencastre, P.; Yazidi, A.; Lind, P.G. Modeling Wind-Speed Statistics beyond the Weibull Distribution. Energies 2024, 17, 2621. [Google Scholar] [CrossRef]
  35. Lydia, M.; Kumar, S.S.; Selvakumar, A.I.; Kumar, G.E.P. A comprehensive review on wind turbine power curve modeling techniques. Renew. Sustain. Energy Rev. 2014, 30, 452–460. [Google Scholar] [CrossRef]
  36. Mao, S.; Zhang, Y.; Rodriguez, F.; Wang, S.; Hao, C. Real-World Performance of Battery Electric Heavy-Duty Vehicles in China; The International Council on Clean Transportation: Washington, DC, USA, 2023; Available online: https://theicct.org/publication/hdv-china-real-world-performance-apr23/ (accessed on 4 August 2025).
  37. Amini, M.; Nazari, M.H.; Hosseinian, S.H. Predictive energy management strategy for battery energy storage considering battery degradation cost. IET Renew. Power Gener. 2023, 17, 1119–1138. [Google Scholar] [CrossRef]
  38. Liu, S.; Yan, J.; Yan, Y.; Zhang, H.; Zhang, J.; Liu, Y.; Han, S. Joint operation of mobile battery, power system, and transportation system for improving the renewable energy penetration rate. Appl. Energy 2024, 357, 122455. [Google Scholar] [CrossRef]
  39. Gore, N.; Arkatkar, S.; Joshi, G.; Antoniou, C. Modified Bureau of Public Roads Link Function. Transp. Res. Rec. 2023, 2677, 966–990. [Google Scholar] [CrossRef]
  40. Zhang, J.; Liu, M.; Zhou, B. Analytical Model for Travel Time-Based BPR Function with Demand Fluctuation and Capacity Degradation. Math. Probl. Eng. 2019, 2019, 5916479. [Google Scholar] [CrossRef]
  41. Gu, Y.; Wang, Y.; Dong, S. Public Traffic Congestion Estimation Using an Artificial Neural Network. ISPRS Int. J. Geo-Inf. 2020, 9, 152. [Google Scholar] [CrossRef]
  42. Scarlat, N.; Prussi, M.; Padella, M. Quantification of the carbon intensity of electricity produced and used in Europe. Appl. Energy 2022, 305, 117901. [Google Scholar] [CrossRef]
  43. Blank, J.; Deb, K.; Roy, P.C. Investigating the Normalization Procedure of NSGA-III. In Evolutionary Multi-Criterion Optimization; Deb, K., Goodman, E., Coello Coello, C.A., Klamroth, K., Miettinen, K., Mostaghim, S., Reed, P., Eds.; Springer International Publishing: Cham, Switzerland, 2019; pp. 229–240. ISBN 978-3-030-12598-1. [Google Scholar]
  44. Tanabe, R. Investigating normalization in preference-based evolutionary multi-objective optimization using a reference point. Appl. Soft Comput. 2024, 159, 111646. [Google Scholar] [CrossRef]
  45. Chakraborty, S. TOPSIS and Modified TOPSIS: A comparative analysis. Decis. Anal. J. 2022, 2, 100021. [Google Scholar] [CrossRef]
  46. Fan, G.; Du, Z.; Lin, X.; Chen, N. Mobile power sources pre-allocation and dispatch strategy in power-transportation coupled network under extreme weather. IET Renew. Power Gener. 2024, 18, 1129–1148. [Google Scholar] [CrossRef]
  47. Global Petrol Prices. Electricity Prices. 2025. Available online: https://www.globalpetrolprices.com/electricity_prices/ (accessed on 5 August 2025).
  48. Schade, C.; Egging-Bratseth, R. Battery degradation: Impact on economic dispatch. Energy Storage 2024, 6, e588. [Google Scholar] [CrossRef]
  49. Basma, H.; Rodríguez, F. A Total Cost of Ownership Comparison of Truck Decarbonization Pathways in Europe. 2023. Available online: https://theicct.org/publication/total-cost-ownership-trucks-europe-nov23/ (accessed on 31 July 2025).
  50. IEA. Electricity 2025. 2025. Available online: https://www.iea.org/reports/electricity-2025 (accessed on 5 August 2025).
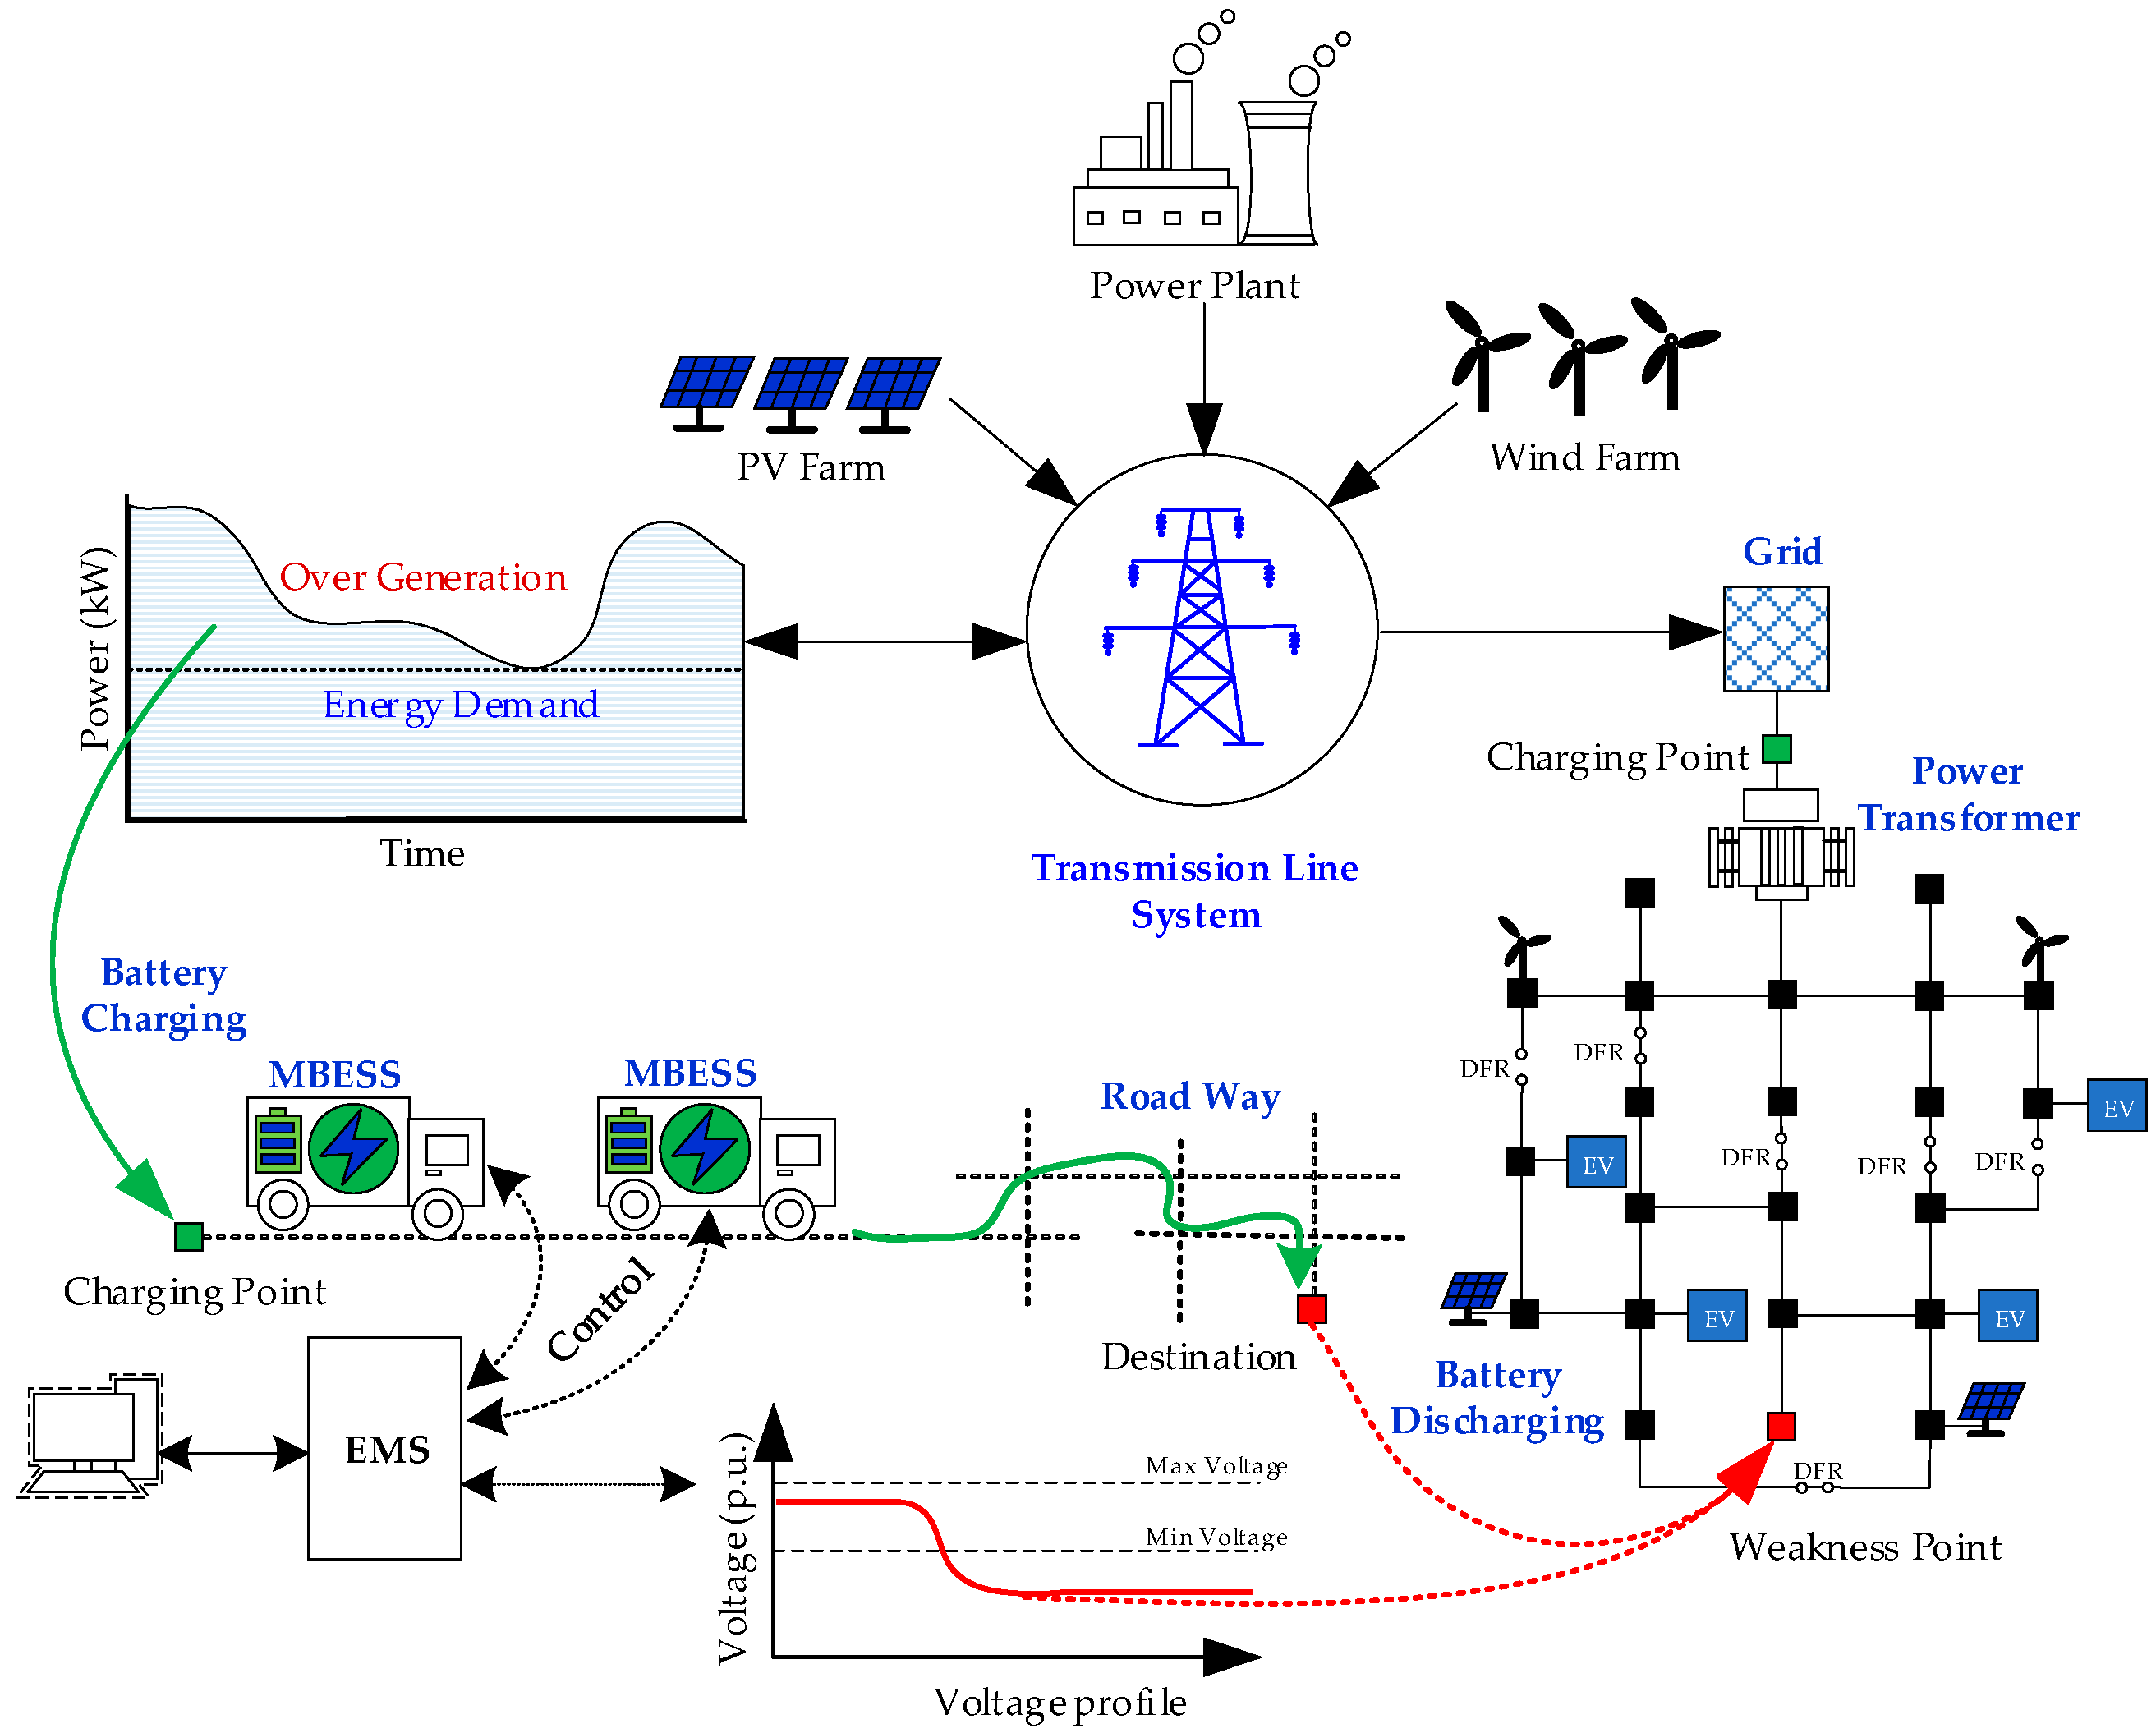
Figure 1. The MBESS integration into the grid.
Energies 18 05515 g001
Figure 2. The MBESS Modelling for integration into the grid.
Energies 18 05515 g002
Figure 3. Integration of dynamic feeder control using the medium voltage switch.
Energies 18 05515 g003
Figure 4. Modify IEEE 33 bus distribution network and coupled with 33 node transportation.
Energies 18 05515 g004
Figure 5. Power profiles of system loads, PV, WT and EVCS.
Energies 18 05515 g005
Figure 6. Open switches state of Case 3.
Energies 18 05515 g006
Figure 7. Open switches state of Case 4.
Energies 18 05515 g007
Figure 8. Voltage magnitude profiles of Case 1.
Energies 18 05515 g008
Figure 9. Voltage magnitude profiles of Case 2.
Energies 18 05515 g009
Figure 10. Voltage magnitude profiles of Case 3.
Energies 18 05515 g010
Figure 11. Voltage magnitude profile of Case 4.
Energies 18 05515 g011
Figure 12. Voltage magnitude profile of Case 5.
Energies 18 05515 g012
Figure 13. Voltage magnitude profile of Case 6.
Energies 18 05515 g013
Table 1. Comparative analysis of optimization frameworks for the MBESS in ADS.
ReferencesAuthors[8][9][10][11][12][13][14][15][16][17][18][19][20][21][22][23]Proposed
Year20212021202220222022202320232024202420242025202520252025202520252025
Objective
function
Loss
VDI
FVSI
Cost
CO2
Coordinated
with
PV
WT
EV Charger
DFR
Transportation ConstraintsDistance
Time
Traffic Delay
Routing
Optimizer CPLEXCPLEXGAGurobiCPLEXGurobiGurobiCC-PSO2MILPPSO-GSAMILPMOPSONSGA-IIINSGA-IIIPADMNSGA-IINSGA-III
Table 2. Parameters of the multi-objective for the MBESS and DFR.
DescriptionsParametersValue/Unit
Mobile Battery Energy Storage
- Battery capacity B MBESS 2000 kWh
- Power P MBESS 200 kW
- Efficiency ղ MBESS 0.95
EV Truck
- Battery capacity B EV 540 kWh
- Energy consumption E EV 1.1 kW/km
- Efficiency ղ EV 0.95
Photovoltaic system
- PV power P PV 400, 300, 350, 250, 200 kW
- Position of PV P V P o s Bus No. 6, 13, 18, 25, 30
Wind Turbine (WT)
- WT power P WT 300, 250, 200, 300, 250 kW
- Position of WT WT Pos Bus No. 8, 15, 22, 28, 33
EV charging station
- EV charging power P EVCS 176, 300, 110, 140, 150 kW
- Position of EV charging EVCS Pos Bus No. 10, 16, 20, 26, 32
Cost and emission
- Electricity price [47] E $ 0.165 $/kWh
- Battery degradation rate [48] B $ 0.04 $/kWh
- Transport rate [49] T $ 0.94 $/km
- Gride emission factor [50] E $ 0.445 kg CO 2 /kWh
NSGA-III algorithm
- PopulationsPop.100
- GenerationsGen.100
MBESS OperatingChargingLoad 0.55 p.u.
DischargingLoad 0.87 p.u.
IdleOtherwise
DFR OperatingOperating 1 Charging
Operating 2Discharging
Operating 3Idle
Table 3. Summary of the case study under integrated by WT, PV, EVCS, MBESS and DFR.
ScenariosCase StudyDERsMBESSDFR
WTPVEVCS
Scenario 1:Case:1 ADS Base Case-----
Case:2 ADS with MBESS ----
Case:3 ADS with MBESS and DFR---
Scenario 2:Case:4 ADS and DERs Integration--
Case:5 ADS and DERs Integration with MBESS-
Case:6 ADS and DERs Integration with MBESS and DFR
Remark: “-“ means not integrated. “✓” means integrated.
Table 4. MBESS Operational Scheduling.
CaseMBESSTarget Bus No.Route & Path
(Nodes)
Distance
(km)
Time
(min)
Energy
(kWh)
Case 2MBESS 115 1 2 19 20 21 8   9   15 54.664.360.06
MBESS 232 1 24 23 27 32 32.841.636.08
MBESS 318 1 24 23 27 32 33 18 47.859.952.58
Case 3MBESS 116 1 2 19 20 21 8   16 46.452.151.04
MBESS 218 1 24 23 27 32 33 18 47.859.952.58
MBESS 332 1 24 23 27 32 32.841.636.08
Case 5MBESS 115 1 2 19 20 21 8   9   15 54.664.360.06
MBESS 232 1 24 23 27 32 32.841.636.08
MBESS 318 1 24 23 27 32 33 18 47.859.952.58
Case 6MBESS 117 1 2 19 20 7 17 40.23444.22
MBESS 218 1 24 23 27 32 33 18 47.859.952.58
MBESS 332 1 24 23 27 32 32.841.636.08
Table 5. Feeder reconfiguration switches to open status control.
CaseOperating StateSwitches Open
Case 3Idle7, 9, 14, 32, 28
Charging7, 9, 13, 17, 28
Discharging7, 10, 14, 32, 28
Case 6Idle7, 9, 14, 32, 28
Charging6, 9, 12, 15, 27
Discharging7, 9, 13, 32, 28
Table 6. Results of the ADS without DERs.
ObjectiveCase 1Case 2Case 3Improvement
Case 1 & Case 2 (%)
Improvement
Case 1 & Case 3 (%)
Improvement
Case 2 & Case 3 (%)
F1: Active Power loss (MWh)2.6742.5371.8705.1230.0726.29
F2: Reactive Power loss (Mvarh)1.7821.5741.25911.6729.3520.01
F3: Voltage Deviation Index0.0370.0350.0225.4140.5437.14
F4: Fast Voltage Stability Index 2.1392.1022.0871.732.430.71
F5: Total Operating Cost ($/day)13,59613,89113,632−2.17−0.261.86
F6: CO2 Emissions (kg CO2/day)30,19530,59130,289−1.31−0.310.99
Table 7. Results of the ADS with DERs.
ObjectiveCase 4Case 5Case 6Improvement
Case 4 & Case 5 (%)
Improvement
Case 4 & Case 6 (%)
Improvement
Case 5 & Case 6 (%)
F1: Active Power loss (MWh)2.4282.3101.7534.8627.8024.11
F2: Reactive Power loss (Mvarh)1.6281.4331.19211.9826.7816.82
F3: Voltage Deviation Index 0.0370.0310.02116.2243.2432.26
F4: Fast Voltage Stability Index2.1342.0992.0861.642.250.62
F5: Total Operating Cost ($/day)12,46512,73412,499−2.16−0.271.85
F6: CO2 Emissions (kg CO2/day)20,80721,21320,954−1.95−0.711.22
Disclaimer/Publisher’s Note: The statements, opinions and data contained in all publications are solely those of the individual author(s) and contributor(s) and not of MDPI and/or the editor(s). MDPI and/or the editor(s) disclaim responsibility for any injury to people or property resulting from any ideas, methods, instructions or products referred to in the content.