Article

A Cable Partial Discharge Localization Method Based on Complete Ensemble Empirical Mode Decomposition with Adaptive Noise–Multiscale Permutation Entropy–Improved Wavelet Thresholding Denoising and Cross-Correlation Coefficient Filtering

1
College of Electrical Engineering and Automation, Xiamen University of Technology, Xiamen 361000, China
2
State Grid Fujian Electric Power Company, Xiamen Power Supply Company, Xiamen 361006, China
*
Author to whom correspondence should be addressed.
Energies 2025, 18(20), 5511; https://doi.org/10.3390/en18205511 (registering DOI)
Submission received: 3 September 2025 / Revised: 11 October 2025 / Accepted: 14 October 2025 / Published: 19 October 2025

Abstract

Partial discharge (PD) source localization is an essential technology to identify the location of defects in power cables. This paper presents a complete cable PD localization system. To improve localization accuracy and reduce computational cost, the Complete Ensemble Empirical Mode Decomposition with Adaptive Noise—Multiscale Permutation Entropy–Improved Wavelet Threshold (CEEMDAN-MPE-IWT) method is first employed to effectively suppress noise in PD signals. Subsequently, Cross-Correlation (CC) coefficients are calculated between the double-ended signals to eliminate low-quality signals with poor correlation. Furthermore, the retained signals are subjected to time-window cropping to minimize redundant data and enhance computational efficiency. Based on the processed signals, multiple time delay estimates are derived using the Generalized Cross-Correlation (GCC) algorithm, and the K-means clustering algorithm is subsequently applied to determine the final localization result. Finally, a cable PD experimental platform is established to validate the proposed method. Experimental results demonstrate that the proposed approach achieves a relative localization error of less than 3%, indicating high localization accuracy and strong potential for engineering applications.

1. Introduction

As a medium for power transmission, cables have seen widespread adoption in recent years due to their key advantages over overhead lines, such as smaller land occupancy, higher reliability, and easier maintenance. Numerous studies have demonstrated that Partial discharge (PD) is a major cause of insulation degradation in power cables. Prolonged PD activity can eventually lead to insulation breakdown and cable failure [1,2]. Therefore, it is particularly important to detect and localize PD sources within the cable to support the maintenance practice so that such failures can be effectively prevented.
Given the complexity of cable operating environments, PD monitoring data is often contaminated by noise, which can significantly affect, or even fail, the calculation for localization. Therefore, signal denoising is a critical step to ensure the reliability of monitoring systems. Currently, typical adopted denoising techniques for PD signals include Fast Fourier Transform (FFT) thresholding, wavelet transform, and Empirical Mode Decomposition (EMD) [3]. Among them, the FFT thresholding method is only effective for removing periodic narrowband interference; the performance of the wavelet transform heavily depends on the choice of wavelet basis and threshold values; and the EMD method suffers from mode mixing, where Intrinsic Mode Functions (IMFs) may contain components of different frequency characteristics [4].
Time delay extraction of PD signals plays a critical role in cable PD localization technologies. Currently, commonly used time delay estimation methods include the peak detection method, threshold method, energy accumulation method, and Cross-Correlation (CC) analysis [5]. Among these, the peak and threshold methods are highly susceptible to noise and waveform distortion, often resulting in inaccurate delay estimation and consequently localization errors [6]. While the energy accumulation method offers strong noise resistance, the selection of the energy inflection point is influenced by subjective human judgment [7]. In contrast, the CC method calculates the time delay by performing correlation analysis on PD signals collected from both ends of the cable. Since it relies on the overall waveform characteristics rather than specific feature points, it offers better robustness and noise immunity in noisy environments. The improved joint-weighted Generalized Cross-Correlation (GCC) algorithm proposed in [8] can achieve a time delay error of less than 1 ns in complex outdoor electromagnetic environments. In [9], multiple rounds of CC operations were performed to suppress interference, enabling accurate PD source localization within a 5 m error range and improving the detectability of weak PD signals. The distance-based CC algorithm used in [10] significantly reduced the influence of propagation distance, sampling rate, and white noise on localization accuracy. However, traditional GCC algorithms typically require multiple sets of signal sequences to be processed, resulting in a large computational load and low processing efficiency—making them difficult to apply in real-time engineering scenarios where fast response and high precision are required. Some recent studies have improved localization accuracy by optimizing the weighting functions and enhancing signal preprocessing [11]. Nevertheless, issues such as high susceptibility to noise and the negative impact of low-quality signals on overall accuracy still remain.
In parallel, the rapid development of machine learning (ML) and artificial intelligence (AI) techniques has opened new possibilities for PD localization. Recent studies have applied ML models such as support vector machines and convolutional neural networks to automatically extract features from PD signals and predict defect locations. In addition, AI-driven diagnostic frameworks that integrate intelligent feature selection, adaptive denoising, and automated defect classification have been proposed to enhance localization accuracy and decision-making efficiency in complex cable environments. Comparative analyses between ML/AI-based approaches and traditional methods have shown that data-driven models can achieve high accuracy under controlled laboratory conditions; however, they typically rely on large labeled datasets, long training times, and high computational costs [12,13]. In contrast, the proposed correlation-based cable PD localization method demonstrates strong interpretability, reproducibility, and robustness, while maintaining reliable localization accuracy with limited data. These characteristics make it a practical and data-efficient alternative to complex ML/AI models in real-world engineering applications.
To ensure localization accuracy while mitigating noise-induced errors and reducing hardware consumption from redundant sampling, the Complete Ensemble Empirical Mode Decomposition with Adaptive Noise—Multiscale Permutation Entropy–Improved Wavelet Threshold (CEEMDAN-MPE-IWT) algorithm is applied for PD signal denoising. To address the issue of low-quality PD signals affecting localization accuracy, CC coefficients between signals at both cable ends are computed, and data with low correlation are discarded. To reduce computational load, the time window is adaptively cropped based on the CC coefficient, retaining only the main components of a single PD pulse for localization calculation. By eliminating irrelevant signal segments, this approach significantly improves processing efficiency while maintaining localization accuracy. The processed signals are then used for cable PD localization based on the GCC algorithm. A K-means clustering algorithm is employed to analyze multiple localization results, with the centroid of the largest cluster selected as the final localization result. Finally, a cable PD experimental platform is built to validate the accuracy of the proposed method.

2. PD Signal Denoising Based on CEEMDAN-MPE-IWT

The cable operating environment is complex and prone to noise interference from surrounding equipment. Among the various noise types, white noise is particularly pervasive. Due to its high proportion and significant impact, white noise can easily mask the key parameters of PD signals, thus making accurate localization of PD sources more challenging. To address this issue, this paper extends the CEEMDAN framework by incorporating a novel IWT function to effectively suppress white noise interference in PD signals.

2.1. Denoising Algorithm Procedure

The CEEMDAN-MPE-IWT combined denoising algorithm mainly consists of three parts: PD signal decomposition based on the CEEMDAN algorithm, noisy IMFs selection using the MPE method, and denoising of the noisy IMFs via IWT. The algorithm flowchart is shown in Figure 1.
The specific implementation process is as follows: First, the original PD signal is decomposed into IMFs corresponding to different frequency bands using the CEEMDAN algorithm. Next, the MPE method is applied to classify the IMFs into main PD signal IMFs, noisy PD signal IMFs, and noise IMFs. By setting a threshold range, the noise IMFs are discarded while the main PD signal IMFs and the noisy PD signal IMFs are retained. Then, the noisy PD signal IMFs are denoised using the IWT algorithm. And finally, the denoised PD signal is reconstructed.

2.1.1. Decomposition of PD Signals Based on the CEEMDAN Algorithm

CEEMDAN is an enhanced version of Ensemble Empirical Mode Decomposition (EEMD), which itself extends the original EMD. The algorithm decomposes the original signal x(t) by iteratively adding pairs of positive and negative Gaussian white noise (with an amplitude set to 0.4 times the standard deviation of the signal) and applying EMD. In each iteration, an IMF and a residual are obtained, with the residual updated as the new input. After k iterations, the residual rk(t) is computed, and additional noise proportional to the residual amplitude is adaptively added to extract the subsequent IMF [14,15]. By introducing adaptive white noise and updating the residual after each decomposition iteration, CEEMDAN effectively reduces mode mixing and improves decomposition accuracy. Compared with the EEMD algorithm, CEEMDAN not only lowers computational complexity but also achieves higher precision.
In this study, the decomposition process was terminated when the maximum number of extracted IMFs reached 15. The number of ensembles was set to 100, which provides a good balance between computational efficiency and accuracy.

2.1.2. Selection of Noisy IMFs Based on the MPE Algorithm

After CEEMDAN decomposition, the obtained IMFs contain both PD features and noise components. To identify noisy IMFs, the MPE method is employed. Permutation entropy (PE) quantifies the complexity of a time series by analyzing ordinal patterns of reconstructed vectors [16,17,18]. Given a signal X = {xi|i = 1, 2, …, N}, the phase space reconstruction is first performed, and the probability distribution of permutation patterns is computed. The PE is then defined as
H p m = b = 1 m P b ln P b ,
where P is the probability of occurrence of a permutation pattern, m is permutation vector length, and b represents any permutation pattern. For convenience, the permutation entropy Hp(m) is usually normalized as
H p = H p m ln m ! ,
where Hp ranges from 0 to 1. To overcome the single-scale limitation of PE, MPE applies coarse-graining with a scale factor S, yielding
y s = 1 S l = N 1 s + 1 N s x i ,
and the PE values computed across different scales constitute the MPE profile [19].
In this work, the key MPE parameters were set as follows: permutation vector length m = 5, scale factor S = 5, and window length for entropy calculation is 1000.
Based on the MPE values, a threshold interval is defined to classify IMFs: those exceeding the interval are identified as major noise IMFs and should be removed; those within the interval are treated as noisy PD IMFs and need further denoising; and those below the range are regarded as primary PD IMFs and retained.

2.1.3. Denoising of Noisy PD Signal IMFs Based on IWT

To effectively denoise the noisy PD IMFs identified by the MPE algorithm, an IWT method is applied. Wavelet Transform (WT) is well suited for time-frequency analysis, allowing the decomposition of signals at multiple scales and enabling effective separation of main signal components from noise. In conventional wavelet thresholding denoising [20,21,22], the signal is first decomposed into approximation (low-frequency) and detail (high-frequency) coefficients. Noise suppression is then performed by applying a threshold function to the detail coefficients, and the denoised signal is reconstructed via inverse WT. Hard threshold retains coefficients above the threshold but introduces discontinuities, potentially causing oscillations, while the soft threshold produces smoother results at the cost of coefficient shrinkage and bias. To overcome these limitations, this study proposes an improved adaptive wavelet threshold function incorporating a smooth transition mechanism and noise-adaptive control, thereby preserving key signal features while avoiding discontinuities. Its mathematical formulation is given as
ω j , k = sgn ω j , k ω j , k 2 λ e ω j , k λ / k 2           ω j , k λ α ω j , k                             ω j , k < λ ,
λ = δ 2 ln N ln z + 1
where ωj,k represents the wavelet coefficient, ω j , k denotes the processed coefficient after thresholding, λ is the threshold value, while k (k > 0) and the shrinkage coefficient α (ranging from 0.05 to 0.5) are tunable parameters; δ represents the noise intensity, and z denotes the decomposition level.
In this study, the db4 wavelet basis was employed with four decomposition levels. An exponential decay term with decay coefficient β = 0.2 was introduced to gradually reduce the threshold value as the decomposition level increased. According to the recommendation of reference [23], the parameters were set to α = 0.05 and k = 1.

2.2. Effectiveness Verification of the Denoising Algorithm

To verify the effectiveness of the denoising algorithm used in this paper, white noise with a signal-to-noise ratio (SNR) of 5 dB was artificially added to PD signals generated from four different mathematical models. As shown in Figure 2, both the original PD signals and the corresponding noisy versions are presented.
To better perform a quantitative analysis of the denoising algorithm used in this paper, three evaluation metrics were introduced, namely SNR, Root Mean Square Error (RMSE), and Normalized Cross-Correlation (NCC). The SNR characterizes the relative strength between the original signal and the noise—the higher the SNR, the purer the signal and the less the noise interference. The RMSE measures the error between the original and denoised signals, reflecting the overall deviation of the signal—the smaller the RMSE, the smaller the error and the better the denoising performance. The NCC quantifies the similarity between the original and denoised signals—the closer the NCC is to 1, the higher the similarity between the two signals. The formulas for these metrics are as follows.
SNR = 10 log 10 i = 1 N x 2 i i = 1 N x i x d i 2 ,
RMSE = 1 N i = 1 N x i x d i 2 ,
NCC = i = 1 N x i x d i i = 1 N x 2 i i = 1 N x d 2 i ,
where x(i) denotes the original signal, and xd(i) denotes the denoised signal.
To further verify the superiority of the proposed denoising algorithm, it is compared with three other denoising methods: EMD with soft-threshold denoising, CEEMDAN with soft-threshold denoising, and CEEMDAN with hard-threshold denoising. As shown in Figure 3, although all three algorithms can partially restore the PD signal, varying degrees of residual noise remain, indicating limitations in their denoising capabilities. Furthermore, as shown in Table 1, the proposed algorithm outperforms the other three traditional denoising algorithms in terms of SNR, RMSE, and NCC, demonstrating its superior denoising performance.

3. Cable PD Localization Based on GCC Algorithm

3.1. Localization Algorithm Procedure

The dual-end localization algorithm designed in this work is presented in Figure 4. The denoised signal is subsequently processed through the following key step: (1) The Teager Energy Operator (TEO) is employed to capture the first wave of the PD signal, and one PD pulse is retained for further analysis. (2) A threshold is applied to filter out PD signals with low CC coefficients, thereby removing sporadic interference. (3) The time window of the PD signal is cropped based on the CC coefficient, effectively reducing the data volume while preserving a single PD pulse, and then the time delay Δt is estimated using the GCC. (4) The frequency-wave velocity curve of the PD signal is established according to the primary parameters of the cable, and the wave velocity v is determined based on the center frequency of the PD signal. (5) The localization result is calculated based on the signal time delay Δt and wave velocity v obtained from the above calculations. (6) The final localization result is determined using the K-means clustering algorithm.

3.2. PD First Wave Detection Based on the TEO

TEO is a nonlinear operator widely used in signal processing to extract the instantaneous energy and frequency characteristics of a signal. With low computational cost and strong signal-tracking capability, TEO is particularly suitable for real-time applications, such as locating traveling wave faults in cables [24]. For a discrete signal x(t), the TEO Ψ[x(t)] is defined as:
Ψ x t = x t 2 x t + 1 x t 1 ,
where x(t)2 represents the instantaneous energy of the signal at time t, while the x(t + 1)x(t − 1) reflects local variations in amplitude and frequency.
PD signals typically exhibit sudden spikes or pulse-like characteristics, corresponding to rapid amplitude changes. By computing the instantaneous energy, TEO can effectively capture these abrupt changes, particularly in the high-frequency components, enabling the extraction of the first PD pulse. Subsequently, the GCC algorithm can be used to calculate the time delay between double-ended PD signals from the same discharge event.
Figure 5 illustrates the effectiveness of TEO in capturing the first sudden change in a PD signal. The peak TEO energy, marked by the red circle, corresponds precisely to the abrupt change in the original signal, confirming TEO’s capability to accurately detect the first PD pulse.

3.3. Data Screening Based on CC Coefficient

In actual field conditions, factors such as equipment interference and environmental disturbances may cause the sensors to capture signals that are either unrelated to partial discharges or represent weak PD signals, thereby affecting the accuracy of time delay calculations. Therefore, it is necessary to eliminate such signals through appropriate methods. In this paper, the CC coefficient between signals from both ends of the cable is used as a criterion to remove low-quality PD signals, thereby improving localization accuracy. For two-end signals X1(t) and X2(t), the CC coefficient is defined as
ρ X 1 X 2 τ = R X 1 X 2 τ μ X 1 μ X 2 σ X 1 σ X 2 ,
where RX1X2(τ) represents the CC function, μX1, μX2 are the mean values of the signals X1(t) and X2(t), respectively, and σX1, σX2 are the standard deviations of X1(t) and X2(t), respectively. When |ρX1X2(τ)| = 1, the two signals are considered fully correlated, whereas |ρX1X2(τ)| = 0 indicates a complete lack of correlation.
To determine the appropriate threshold, a large number of PD signals were collected under the experimental conditions described in Section 4.1 (with a 101.3 m cable), and the corresponding localization errors for different CC coefficient thresholds were calculated, as shown in Table 2. As the CC coefficient threshold increased from 0.25 to 0.3, the localization error decreased rapidly, whereas further increasing the threshold caused the error to remain nearly unchanged. Based on these results, the threshold was ultimately determined to be 0.3, which effectively balances accuracy and data retention—that is, it filters out random noise signals while preserving most valid PD pulses.
After the above processing, it is still necessary to crop the time window of each captured PD pulse using an adaptive method. Traditionally, the window length W is determined based on the maximum propagation time of the PD signal along the cable of length L. Although this method is simple, it may retain redundant data, thereby increasing both storage requirements and computational load during CC calculation. To address this, a cropping strategy is proposed. The retained PD signals are segmented into overlapping windows (shifted every 20 sampling points). For each segment, the CC coefficient is calculated, and the window with the maximum correlation coefficient is selected to determine the optimal time window length. Importantly, the relationship between the correlation coefficient and the window length is nonlinear. When the selected time window fully contains one complete PD pulse, the correlation coefficient reaches its maximum value, which corresponds to the optimal extraction of the PD waveform. This mechanism ensures that the cropped window preserves the main PD energy while minimizing redundant data.
To quantitatively evaluate the effect of the correlation threshold on the system’s sensitivity and specificity, an additional analysis was conducted. Among 50 groups of PD signals, 7 groups were rejected by the correlation-based filtering process, while 50 groups of interference signals were all correctly excluded. Accordingly, the sensitivity and specificity of the proposed threshold-based filtering method are 0.86 and 1, respectively. These results demonstrate that the chosen correlation threshold of 0.3 provides a strong balance between detection sensitivity and noise suppression, effectively removing all non-PD interference signals while preserving most valid PD signals.
In this study, the time window corresponding to the maximum CC coefficient is selected to crop the PD signals, thereby retaining the most relevant signal features. Figure 6 compares the traditional fixed time window method with the proposed method. The results show that the proposed approach effectively reduces redundant data, shortening the signal length from 4.5 μs to 1.8 μs, while maintaining high localization accuracy and reducing the computational load of the CC algorithm.
Quantitative analyses of computational cost have been conducted, including computational complexity, memory requirements, and elapsed time, as summarized in Table 3, which compares the proposed method with the traditional fixed-window approach using 50 PD samples.
It should be noted that the denoising stage (CEEMDAN-IWT) is executed before window cropping; therefore, its computational complexity and memory consumption remain identical for both methods. However, after applying the proposed window cropping and low-correlation signal rejection, the amount of data passed to the GCC stage is substantially reduced. As a result, the proposed method achieves significantly faster computation while maintaining localization accuracy. Both the computational complexity and memory requirements of the GCC process decrease notably, and the total processing time becomes shorter. The performance advantage becomes increasingly evident with larger datasets.
Taking the elapsed time as an example, the GCC stage in the traditional method was used as the time benchmark. Under this reference, the denoising stage requires approximately twice the computation time of the GCC process, whereas the K-means clustering stage consumes only about 0.13 times that of the GCC process. After introducing the proposed method, the elapsed time of the GCC stage is reduced by one-third, while the denoising and K-means clustering stages remain unchanged. These results quantitatively confirm that the proposed approach effectively reduces computational cost and improves processing efficiency without compromising localization accuracy.

3.4. Wave Velocity Determination Based on PD Signal Frequency–Wave Velocity Curve

Accurate determination of the PD signal wave velocity is one of the key factors for achieving precise localization. The frequency-wave velocity curve of the PD signal is expressed as
v = ω 1 2 ω 2 L C R G + 1 2 R 2 + ω 2 L 2 G 2 + ω 2 C 2 ,
where ω denotes the angular frequency; R, L, C, and G represent the distributed resistance, inductance, capacitance, and conductance per unit length, respectively.
To validate the consistency between the theoretical and laboratory relationships of wave velocity and frequency, a signal generator was used in the laboratory to inject signals of 1 MHz to 25 MHz into a cable. The experimental wiring diagram is shown in Figure 7. High-Frequency Current Transformers (HFCTs) were installed at both ends to record the arrival times of the pulses, from which the propagation velocity at different frequencies was calculated.
The frequency–wave velocity characteristic curves obtained from theoretical calculations and experimental measurements are shown in Figure 8. The black solid line represents the theoretical results, while the red dashed line corresponds to the experimental measurements. The propagation velocity changes markedly at low frequencies and gradually reaches a stable value as the frequency increases. Beyond 5 MHz, the theoretical velocity approaches 1.784 × 10⁸ m/s, while the experimental value stabilizes at approximately 1.791 × 10⁸ m/s, with a deviation of only 0.39%. Although minor experimental interference is observed, the results still show a close agreement with the theoretical predictions. It is further observed that in the 0–3 MHz range the velocity fluctuates considerably, which reduces localization accuracy.
Table 4 presents the localization accuracy of signals in different frequency bands. When using the full 1–30 MHz range, the localization error reaches 8.76% due to the instability and distortion of the low-frequency components below 3 MHz. In contrast, limiting the signal to the 3–30 MHz and 5–30 MHz ranges significantly improve accuracy, with relative errors of 0.43% and 0.44%, respectively.
These results indicate that frequency components below 3 MHz contribute little useful information for localization and instead introduce low-frequency interference and delay estimation errors. Therefore, the 3–30 MHz band is selected as the optimal range.
In practical engineering applications, the propagation velocity v of PD signals in the cable is obtained by determining the signal’s center frequency and mapping it to the frequency–wave velocity curve calculated from the cable’s structural parameters.

3.5. Double-Ended Localization Method for Cable PD Based on GCC

CC is a time delay estimation algorithm that evaluates the similarity between two signals in the time domain [25]. Assuming the original PD signal is s(t), and the signals received at both ends of the cable are x1(t) and x2(t), respectively, then
x 1 t = s t τ 1 + n 1 t x 2 t = s t τ 2 + n 2 t ,
where n1(t) and n2(t) represent noise, τ1 and τ2 are the time delays at which the sensors at both ends receive the signal. Let D = τ2τ1, the CC function of the signals at both ends is given by
R 12 τ = E x 1 t x 2 t + τ = R ss τ D + R s n 2 τ + R s n 1 τ D + R n 1 n 2 τ .
Under ideal conditions, assuming the noise is uncorrelated with the PD signal, only RSS(τ + D) remains. The time delay Δt can thus be obtained from the τ value corresponding to the maximum of R12(τ). However, in practical situations, due to the presence of noise, n1(t) and n2(t) may not be entirely uncorrelation, causing the terms Rsn2(τ) and Rsn1(τD) in Equation (13) to be nonzero. As a result, the CC function R12(τ) exhibits multiple local maxima. If any spurious peak exceeds the true peak of the signal, it may result in inaccurate time delay estimation. Therefore, improvements to the CC algorithm are necessary.
The GCC algorithm builds upon the basic CC method by transforming signals into the frequency domain, applying a weighting function φ(f) to their cross power spectral density G12(f), and then transforming back to the time domain to detect the peak value [26]. R12(τ) can be expressed as
R 12 τ = + φ f G 12 f e j 2 π f τ d f .
The φ(f) enhances spectral components with minimal interference, improving peak localization and delay estimation accuracy. Among various weighting functions, the Phase Transform (PHAT) weighting function emphasizes phase information while ignoring amplitude, providing stronger noise resistance. Therefore, PHAT is adopted in this study for GCC-based time delay estimation.

3.6. PD Source Localization Using K-Means Clustering Algorithm

To reduce randomness in single PD signal localization results, multiple repeated discharge results are analyzed using the K-means clustering algorithm, an unsupervised learning method [27]. The procedure is as follows:
(1) Initially, k samples are randomly selected from the PD localization results dataset as the initial cluster centers. The distances between all samples and each of the k cluster centers are then calculated as follows
L k = x i ω i x i m j 2       j = 1 , 2 , , k ,
where mj denotes the j-th cluster center; xi represents the remaining sample points, where i = 1, 2, ⋯, n.
(2) Assign each sample to the nearest cluster and update each cluster centroid as the mean of its assigned samples:
m j = x i ω i x i n j ,
where nj denotes the number of samples contained in the j-th cluster.
(3) Repeat steps 1–2 until cluster centers converge.
Using the K-means clustering algorithm to analyze multiple sets of positioning data can eliminate results with large errors, thereby further improving the positioning accuracy. In the K-means clustering process, 20 random initializations were performed to ensure robustness. After testing clustering with different values of k, k = 3 was chosen as the number of clusters since it achieved relatively good performance in the clustering quality metrics. The detailed analysis is presented in Section 4.2.

4. Experimental Study of the Dual-Ended Cable PD Signal Localization

To verify the reliability and accuracy of the proposed localization algorithm, a cable PD experimental platform was established, and the collected PD signals were analyzed using the designed algorithm.

4.1. Experimental Platform

As shown in Figure 9, the experimental platform mainly consists of a step-up transformer, protective resistor R, voltage divider capacitor Ck, detection impedance Zk, power cable, and PD localization system. The cable length is 101.3 m, with a semi-conductive discontinuity defect (surface discharge) introduced at a location 11 m from the high-voltage end. Additional tests were conducted on cables with lengths of 27.1 m and 52 m, where the PD sources were located 1.5 m and 14 m from the high-voltage end, respectively. Furthermore, a surface protrusion defect (tip discharge) was simulated inside a 22.2 m cable under different noise conditions, where the PD source was positioned 10.5 m from the high-voltage end. The following analysis is conducted using the first set of experimental data as an example.

4.2. Experimental Results Analysis

Figure 10 shows the raw PD signals collected from both ends during the experiment, along with the corresponding signals after being processed by the proposed denoising algorithm. By comparing the waveform characteristics of the original and denoised signals, it is evident that the proposed denoising algorithm effectively removes most of the background noise while preserving the main features of the PD signals. This ensures the accuracy of subsequent signal positioning calculations.
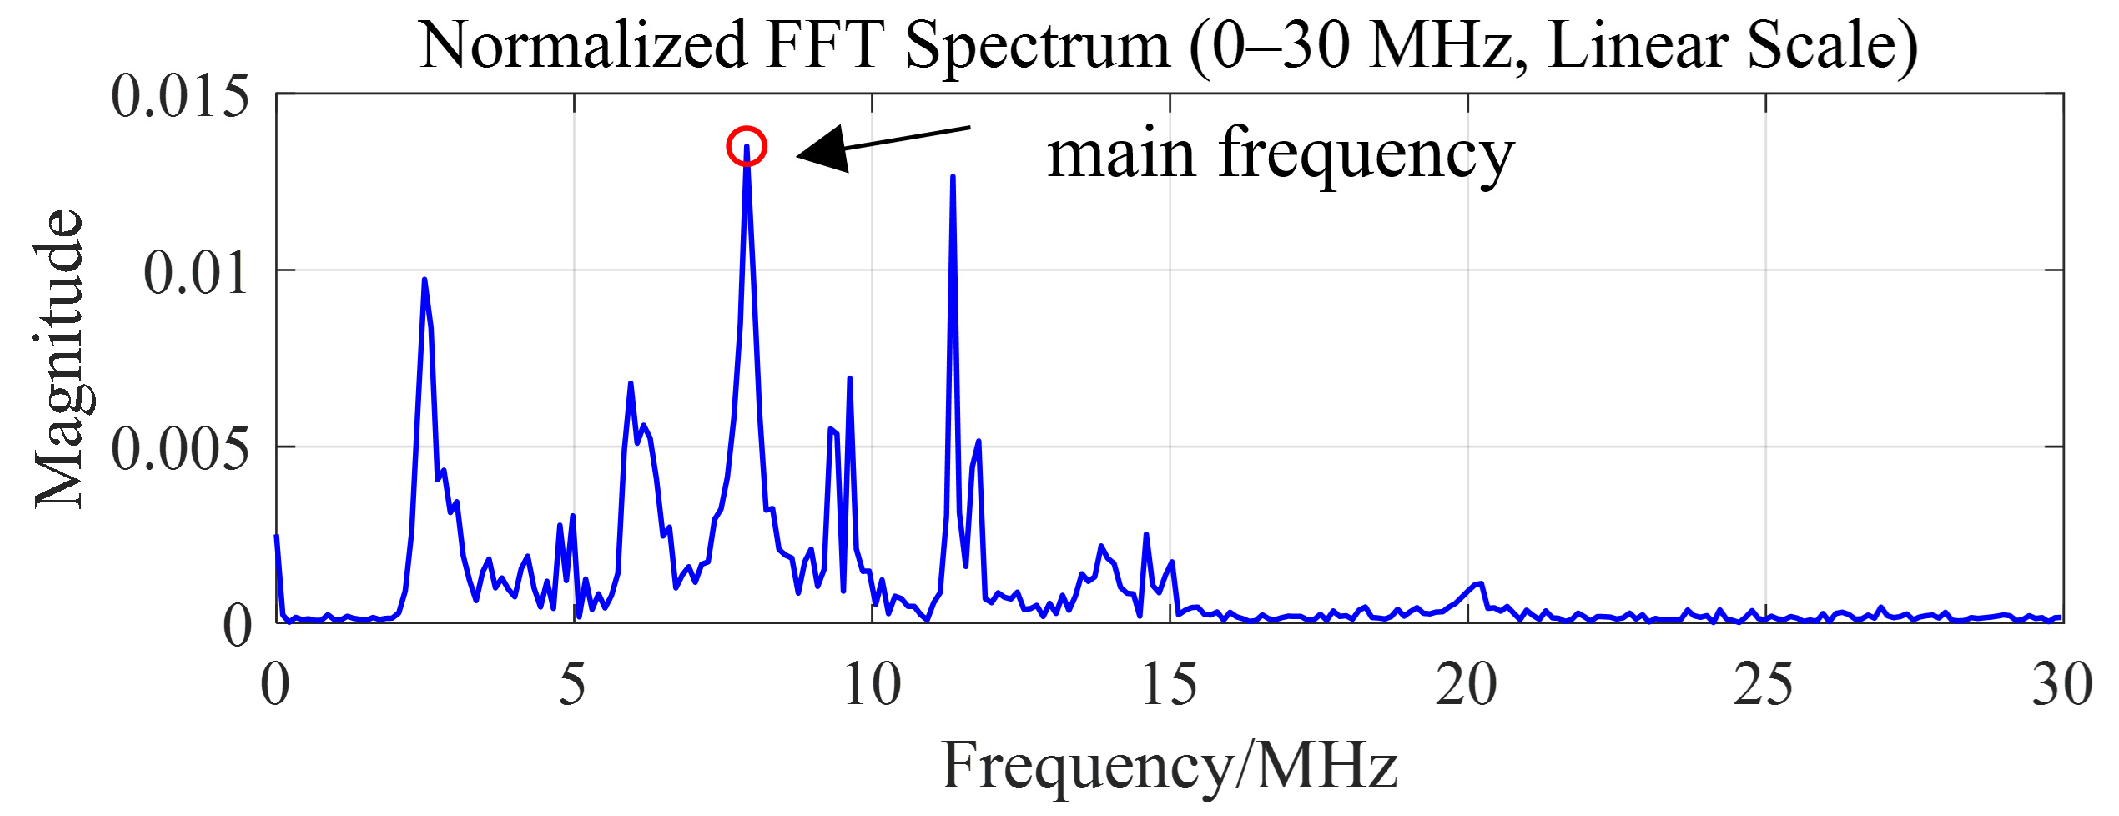
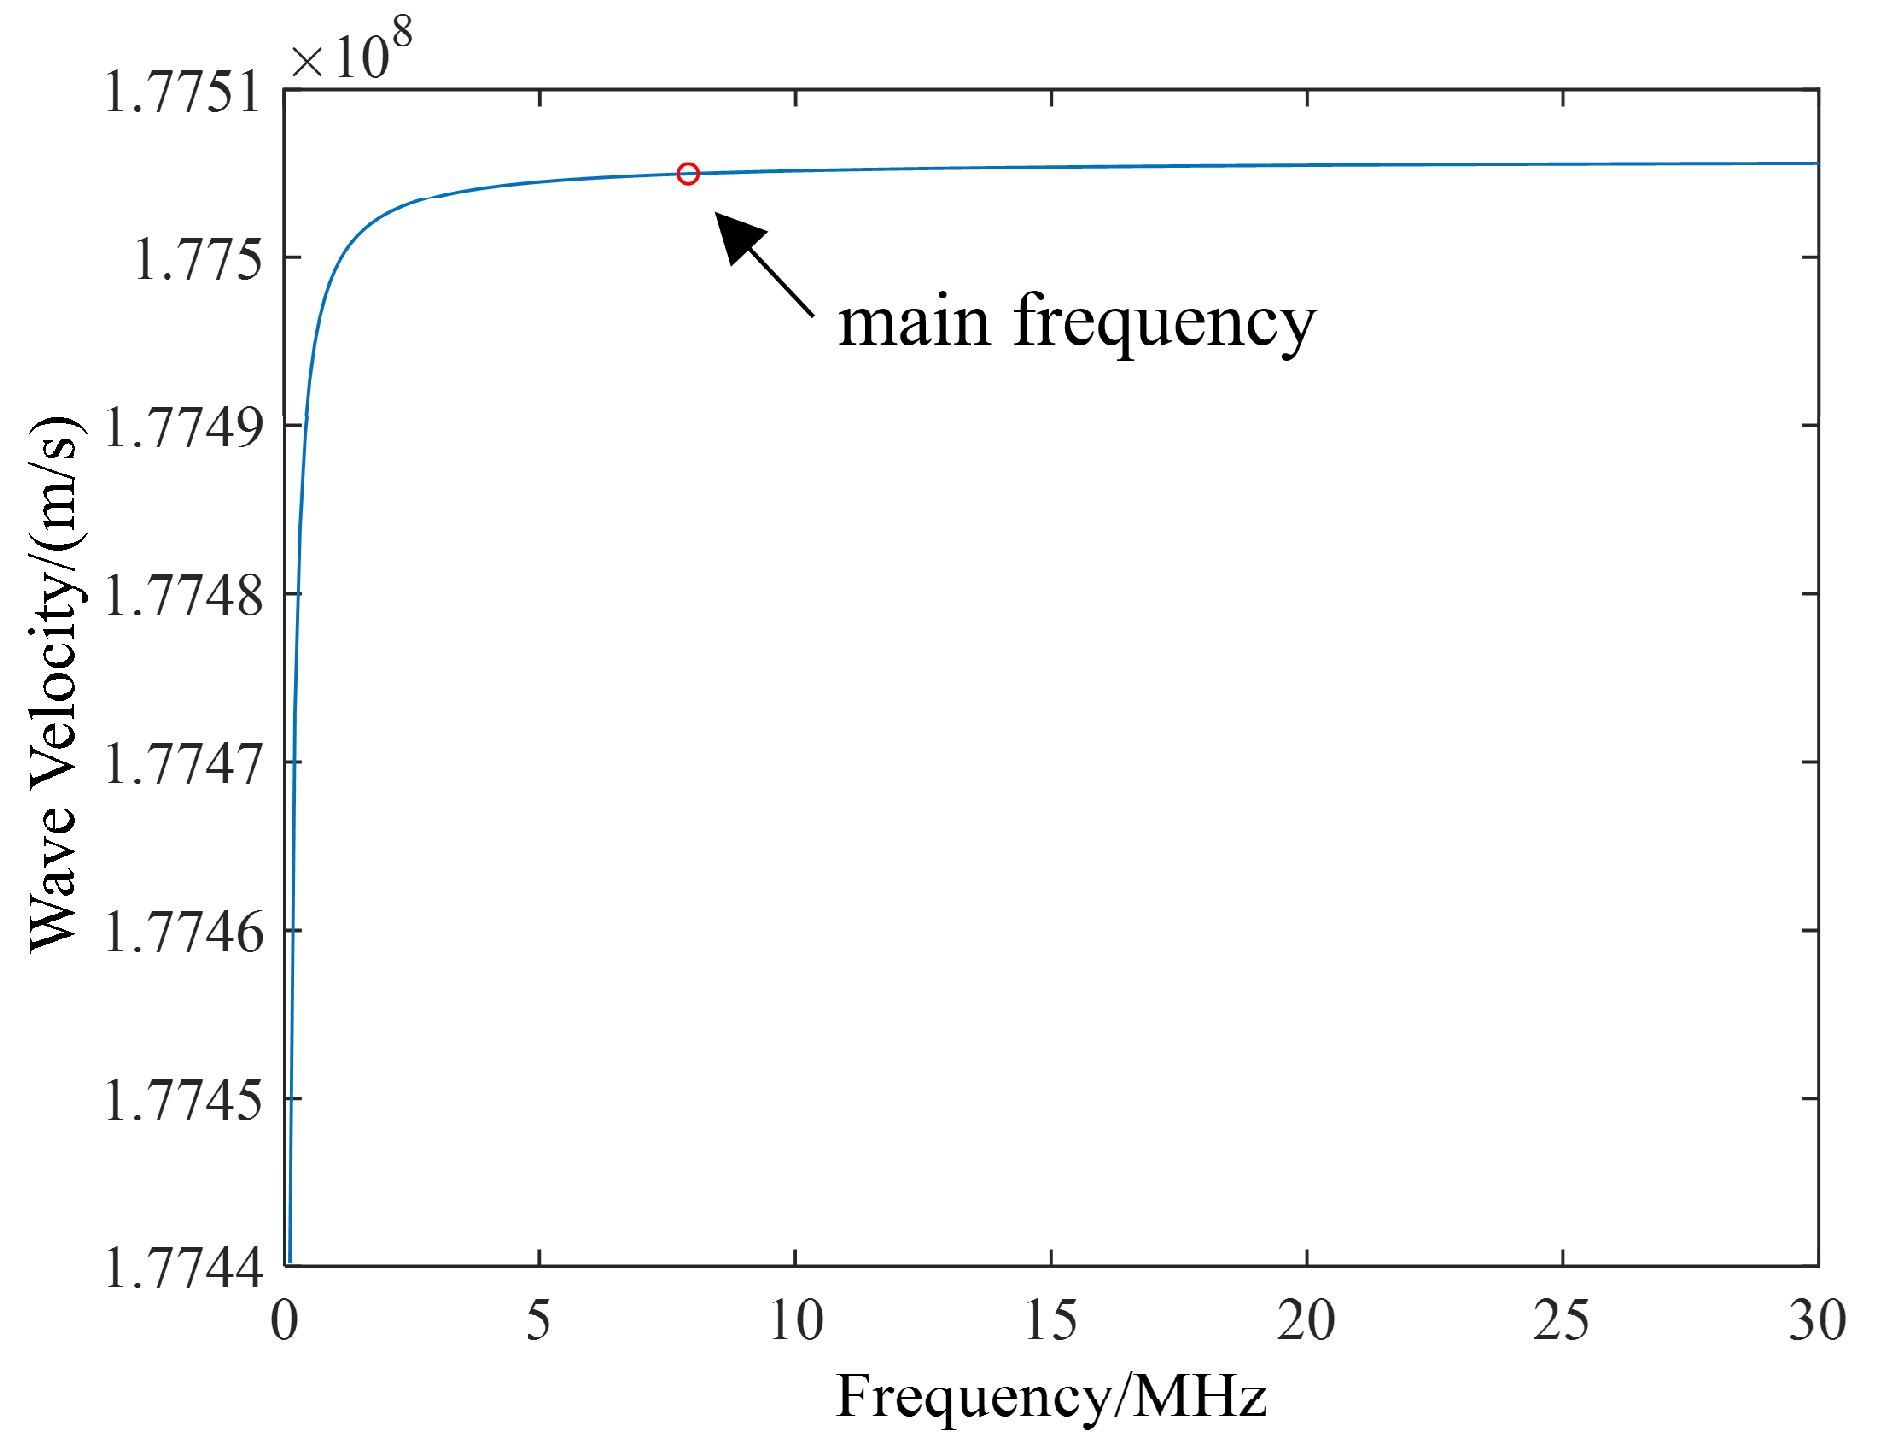
To locate multiple sets of collected PD signals, it is first necessary to determine the propagation velocity based on the center frequency of the PD signals. FFT analysis is performed on the primary PD signal to obtain its frequency spectrum within the 0–30 MHz range, as shown in Figure 11. It can be observed that the component of this PD signal sample is 7.9 MHz. According to the frequency–wave velocity curve established in Figure 12, the propagation velocity of the PD signal at 7.9 MHz is determined to be 1.77505 × 10⁸ m/s.
Taking the cable with a total length of 101.3 m, in which a semi-conductive discontinuity defect was introduced 11 m from the high-voltage end, as an example, the corresponding clustering results are illustrated in Figure 13. After correlation-based elimination, 43 out of the 50 collected datasets were retained for clustering analysis.
To justify the selection of k = 3 in Section 3.6, internal cluster quality metrics were calculated for this case. The analysis divided the retained data into three clusters, among which the blue cluster contained the largest number of data points. The clustering results were evaluated using internal quality metrics, yielding an average silhouette coefficient of 0.8274, indicating well-separated and compact clusters. The Calinski–Harabasz index was 204.7769, suggesting a high ratio of between-cluster dispersion to within-cluster dispersion. The Davies–Bouldin index was 0.4055, which is relatively low and further confirms that the clusters are compact and well separated. Compared with the results obtained for k = 2 and k = 4, the above quality metrics show the best performance when k = 3.
By calculating the cluster center of the blue cluster, the final localization result was determined to be 10.86 m, with an absolute error of 0.44 m and a relative error of only 0.43%.
Additional experiments were conducted on cables with different lengths, various defect types, and different noise environments to verify the generality and stability of the proposed method. The corresponding localization results are summarized in Table 5.
For experimental convenience, surface discharge and tip discharge were selected for detailed validation in this paper. As shown in Table 5, all cable samples under surface discharge conditions maintained excellent localization accuracy, with relative errors below 1%. In contrast, the tip discharge exhibited slightly larger errors, reaching 2.7%. However, for this type of discharge, both the standard deviation and median error were smaller, indicating more consistent results. Regarding the influence of the noise level, the two sets of experiments conducted under tip discharge conditions show that a higher noise level has little impact on the localization accuracy.
A comparison between the proposed method and several traditional localization algorithms was conducted in terms of localization error and computation time, and the summarized results are presented in Table 6. It can be observed that the simple peak-picking method achieves the fastest computation but exhibits the highest localization error. The energy accumulation method also shows relatively large errors. The GCC method improves accuracy at the expense of longer computation time. In contrast, the proposed method achieves the lowest localization error (0.43–0.98%) while maintaining a computation time comparable to that of the other methods. This demonstrates that our approach effectively balances accuracy and efficiency, achieving substantially higher precision without significantly increasing computational cost.

5. Conclusions and Outlook

This paper proposes a comprehensive PD localization system for power cables, which includes signal denoising using the CEEMDAN algorithm, elimination of redundant and low-quality data based on CC coefficients, time delay estimation via GCC, and PD source localization through a K-means clustering algorithm. The main research contributions are as follows:
(1)
Based on the CEEMDAN algorithm, an IWT function was introduced for PD signal denoising. Compared with traditional denoising algorithms, the proposed method demonstrates superior performance in terms of SNR, RMSE, and NCC, thereby validating its effectiveness.
(2)
A cable PD localization scheme was designed. During signal preprocessing, the TEO was employed to extract the first pulse waveform of the PD signal. Subsequently, signals with low correlation were removed by calculating the CC coefficient of the signals at both cable ends, and an effective time window was cropped. This approach effectively eliminated information irrelevant to the main discharge pulse, thereby significantly reducing the computational load of the CC algorithm and improving localization efficiency.
(3)
A cable PD experimental platform was established to verify the proposed algorithm. Experimental results demonstrate that the proposed approach achieves a relative localization error of less than 3%, indicating high localization accuracy and strong potential for engineering applications.
(4)
In the future, the algorithm proposed in this paper will be further applied and validated in real engineering environments. Through field implementation and practical operation, its performance, stability, and reliability can be comprehensively evaluated, thereby providing effective solutions to practical engineering problems.

Author Contributions

Conceptualization, T.Z. and H.T.; methodology, T.Z. and H.T.; software, Y.L.; validation, Y.L.; formal analysis, T.Z.; investigation, Y.Y.; resources, Y.Y.; data curation, Y.L.; writing—original draft preparation, Y.L.; writing—review and editing, T.Z. and Y.Y.; visualization, Y.L.; supervision, T.Z. and H.T.; project administration, Y.Y.; funding acquisition, T.Z. All authors have read and agreed to the published version of the manuscript.

Funding

This research was funded by Fujian Provincial Natural Science Foundation General Project, grant number 2022J011259.

Data Availability Statement

Data are contained within the article.

Conflicts of Interest

Author Youxiang Yan was employed by the company State Grid Fujian Electric Power Company Xiamen Power Supply Company. The remaining authors declare that the research was conducted in the absence of any commercial or financial relationships that could be construed as a potential conflict of interest.

Abbreviations

The following abbreviations are used in this manuscript:
CEEMDANComplete Ensemble Empirical Mode Decomposition with Adaptive Noise
MPEMultiscale Permutation Entropy
IWTImproved Wavelet Threshold
PDPartial Discharge
SNRSignal-to-Noise Ratio
RMSERoot Mean Square Error
NCCNormalized Cross-Correlation
CCCross-correlation
GCCGeneralized Cross-Correlation
PHATPhase Transform
AIArtificial Intelligence
SVMsSupport Vector Machines
CNNsConvolutional Neural Networks
MLMachine Learning
FFTFast Fourier Transform

References

  1. Govindarajan, S.; Morales, A.; Ardila-Rey, J.A.; Purushothaman, N. A review on partial discharge diagnosis in cables: Theory, techniques, and trends. Measurement 2023, 216, 112882. [Google Scholar] [CrossRef]
  2. Yii, C.C.; Rohani, M.; Isa, M.; Hassan, S.I.S. Multi-end PD location algorithm using segmented correlation and trimmed mean data filtering techniques for MV Underground Cable. IEEE Trans. Dielectr. Electr. Insul. 2017, 24, 92–98. [Google Scholar] [CrossRef]
  3. Hussain, M.R.; Refaat, S.S.; Abu-Rub, H. Overview and partial discharge analysis of power transformers: A literature review. IEEE Access 2021, 9, 64587–64605. [Google Scholar] [CrossRef]
  4. Thuc, V.C.; Lee, H.S. Partial discharge (PD) signal detection and isolation on high voltage equipment using improved complete EEMD method. Energies 2022, 15, 5819. [Google Scholar] [CrossRef]
  5. Xavier, G.V.R.; Coelho, R.A.; Silva, H.S.; Serres, A.J.; da Costa, E.G.; Oliveira, A.S. Partial discharge location through application of stationary discrete wavelet transform on UHF signals. IEEE Sens. J. 2021, 21, 24644–24652. [Google Scholar] [CrossRef]
  6. Fern, C.K.; Yii, C.C.; Bakar, A.A.; Saad, I.; Kin, K.T.T.; Hasnan, M.M.I.M.; Mohamad, N.A. Fault localization on power cables using time delay estimation of partial discharge signals. Int. J. Electr. Comput. Eng. 2023, 13, 6000–6015. [Google Scholar] [CrossRef]
  7. Wang, J.; Wu, K.; Sim, A.; Hwangbo, S. Locating partial discharges in power transformers with convolutional iterative filtering. Sensors 2023, 23, 1789. [Google Scholar] [CrossRef]
  8. Liu, W.; Li, M.; Wang, T.; Jin, M.; Fang, Q. Research on Time Delay Estimation Method of Partial Discharges Signal with Improved Weighted Function. Electronics 2023, 12, 4196. [Google Scholar] [CrossRef]
  9. Guo, N.; Feng, Z.; Chen, D. PD location and interference suppression method of power cable based on cross-correlation. Int. J. High Speed Electron. Syst. 2025, 2540315. [Google Scholar] [CrossRef]
  10. Rao, X.; Zhou, K.; Li, Y.; Zhu, G.; Meng, P. A new cross-correlation algorithm based on distance for improving localization accuracy of partial discharge in cables lines. Energies 2020, 13, 4549. [Google Scholar] [CrossRef]
  11. Qiang, H.; Wang, Q.; Niu, H.; Wang, Z.; Zheng, J. A partial discharge localization method based on the improved artificial fish swarms algorithm. Energies 2023, 16, 2928. [Google Scholar] [CrossRef]
  12. Chan, J.Q.; Raymond, W.J.K.; Illias, H.A.; Othman, M. Partial Discharge Localization Techniques: A Review of Recent Progress. Energies 2023, 16, 2863. [Google Scholar] [CrossRef]
  13. Khodaveisi, F.; Karami, H.; Zarei Karimpour, M.; Rubinstein, M.; Rachidi, F. Partial Discharge Localization in Power Transformer Tanks Using Machine Learning Methods. Sci. Rep. 2024, 14, 11785. [Google Scholar] [CrossRef] [PubMed]
  14. Li, K.; Huang, D.; Li, P.; Tang, D. ECG Signal Denoising Method Based on CEEMDAN Algorithm and Strong Adaptive Wavelet Threshold. In Proceedings of the 2024 IEEE 8th International Conference on Vision, Image and Signal Processing (ICVISP), Kunming, China, 27–29 December 2024; IEEE: New York, NY, USA, 2024; pp. 1–12. [Google Scholar]
  15. Li, Z.; Xu, H.; Jiang, B.; Han, F. Wavelet threshold ultrasound echo signal denoising algorithm based on CEEMDAN. Electronics 2023, 12, 3026. [Google Scholar] [CrossRef]
  16. Bandt, C.; Pompe, B. Permutation entropy: A natural complexity measure for time series. Phys. Rev. Lett. 2002, 88, 174102. [Google Scholar] [CrossRef]
  17. Chen, Z.; Li, Y.; Liang, H.; Yu, J. Improved permutation entropy for measuring complexity of time series under noisy condition. Complexity 2019, 2019, 1403829. [Google Scholar] [CrossRef]
  18. Zhang, X.; Wang, H.; Ren, M.; He, M.; Jin, L. Rolling bearing fault diagnosis based on multiscale permutation entropy and SOA-SVM. Machines 2022, 10, 485. [Google Scholar] [CrossRef]
  19. Kang, Y.; Yao, Y.; Dong, R.; Jia, Y.-S.; Xie, Q.-M.; Wang, J.-N. Improved complete ensemble empirical mode decomposition with adaptive noise and composite multiscale permutation entropy for denoising blast vibration signal. Heliyon 2024, 10, e37339. [Google Scholar] [CrossRef]
  20. Donoho, D.L.; Johnstone, I.M. Adapting to unknown smoothness via wavelet shrinkage. J. Am. Stat. Assoc. 1995, 90, 1200–1224. [Google Scholar] [CrossRef]
  21. Li, H.; Shi, J.; Li, L.; Tuo, X.; Qu, K.; Rong, W. Novel wavelet threshold denoising method to highlight the first break of noisy microseismic recordings. IEEE Trans. Geosci. Remote Sens. 2022, 60, 5910110. [Google Scholar] [CrossRef]
  22. Hu, H.; Ao, Y.; Yan, H.; Bai, Y.; Shi, N. Signal denoising based on wavelet threshold denoising and optimized variational mode decomposition. J. Sens. 2021, 2021, 5599096. [Google Scholar]
  23. Wang, Y.; Xu, C.; Wang, Y.; Cheng, X. A comprehensive diagnosis method of rolling bearing fault based on CEEMDAN-DFA-improved wavelet threshold function and QPSO-MPE-SVM. Entropy 2021, 23, 1142. [Google Scholar] [CrossRef] [PubMed]
  24. Cao, W.; Zhang, F.; Chen, X.; Zhang, B.; Li, J.; Xu, M. A Study on Fault Localization Method of Three-Terminal Multi-Section Overhead Line–Cable Hybrid Line Using MEEMD Combined with Teager Energy Operator Algorithm. Processes 2024, 12, 1360. [Google Scholar] [CrossRef]
  25. Pang, Z.; Wang, G.; Wang, B.; Wang, L. Comparison between time shifting deviation and cross-correlation methods. J. Light. Technol. 2022, 40, 3003–3009. [Google Scholar] [CrossRef]
  26. Wang, X.; Li, J. Cable External Breakage Source Localization Method Based on Improved Generalized Cross-Correlation Phase Transform with Multi-Sensor Fusion. Energies 2025, 18, 2628. [Google Scholar] [CrossRef]
  27. Ikotun, A.M.; Ezugwu, A.E.; Abualigah, L.; Abuhaija, B.; Heming, J. K-means clustering algorithms: A comprehensive review, variants analysis, and advances in the era of big data. Inf. Sci. 2023, 622, 178–210. [Google Scholar]
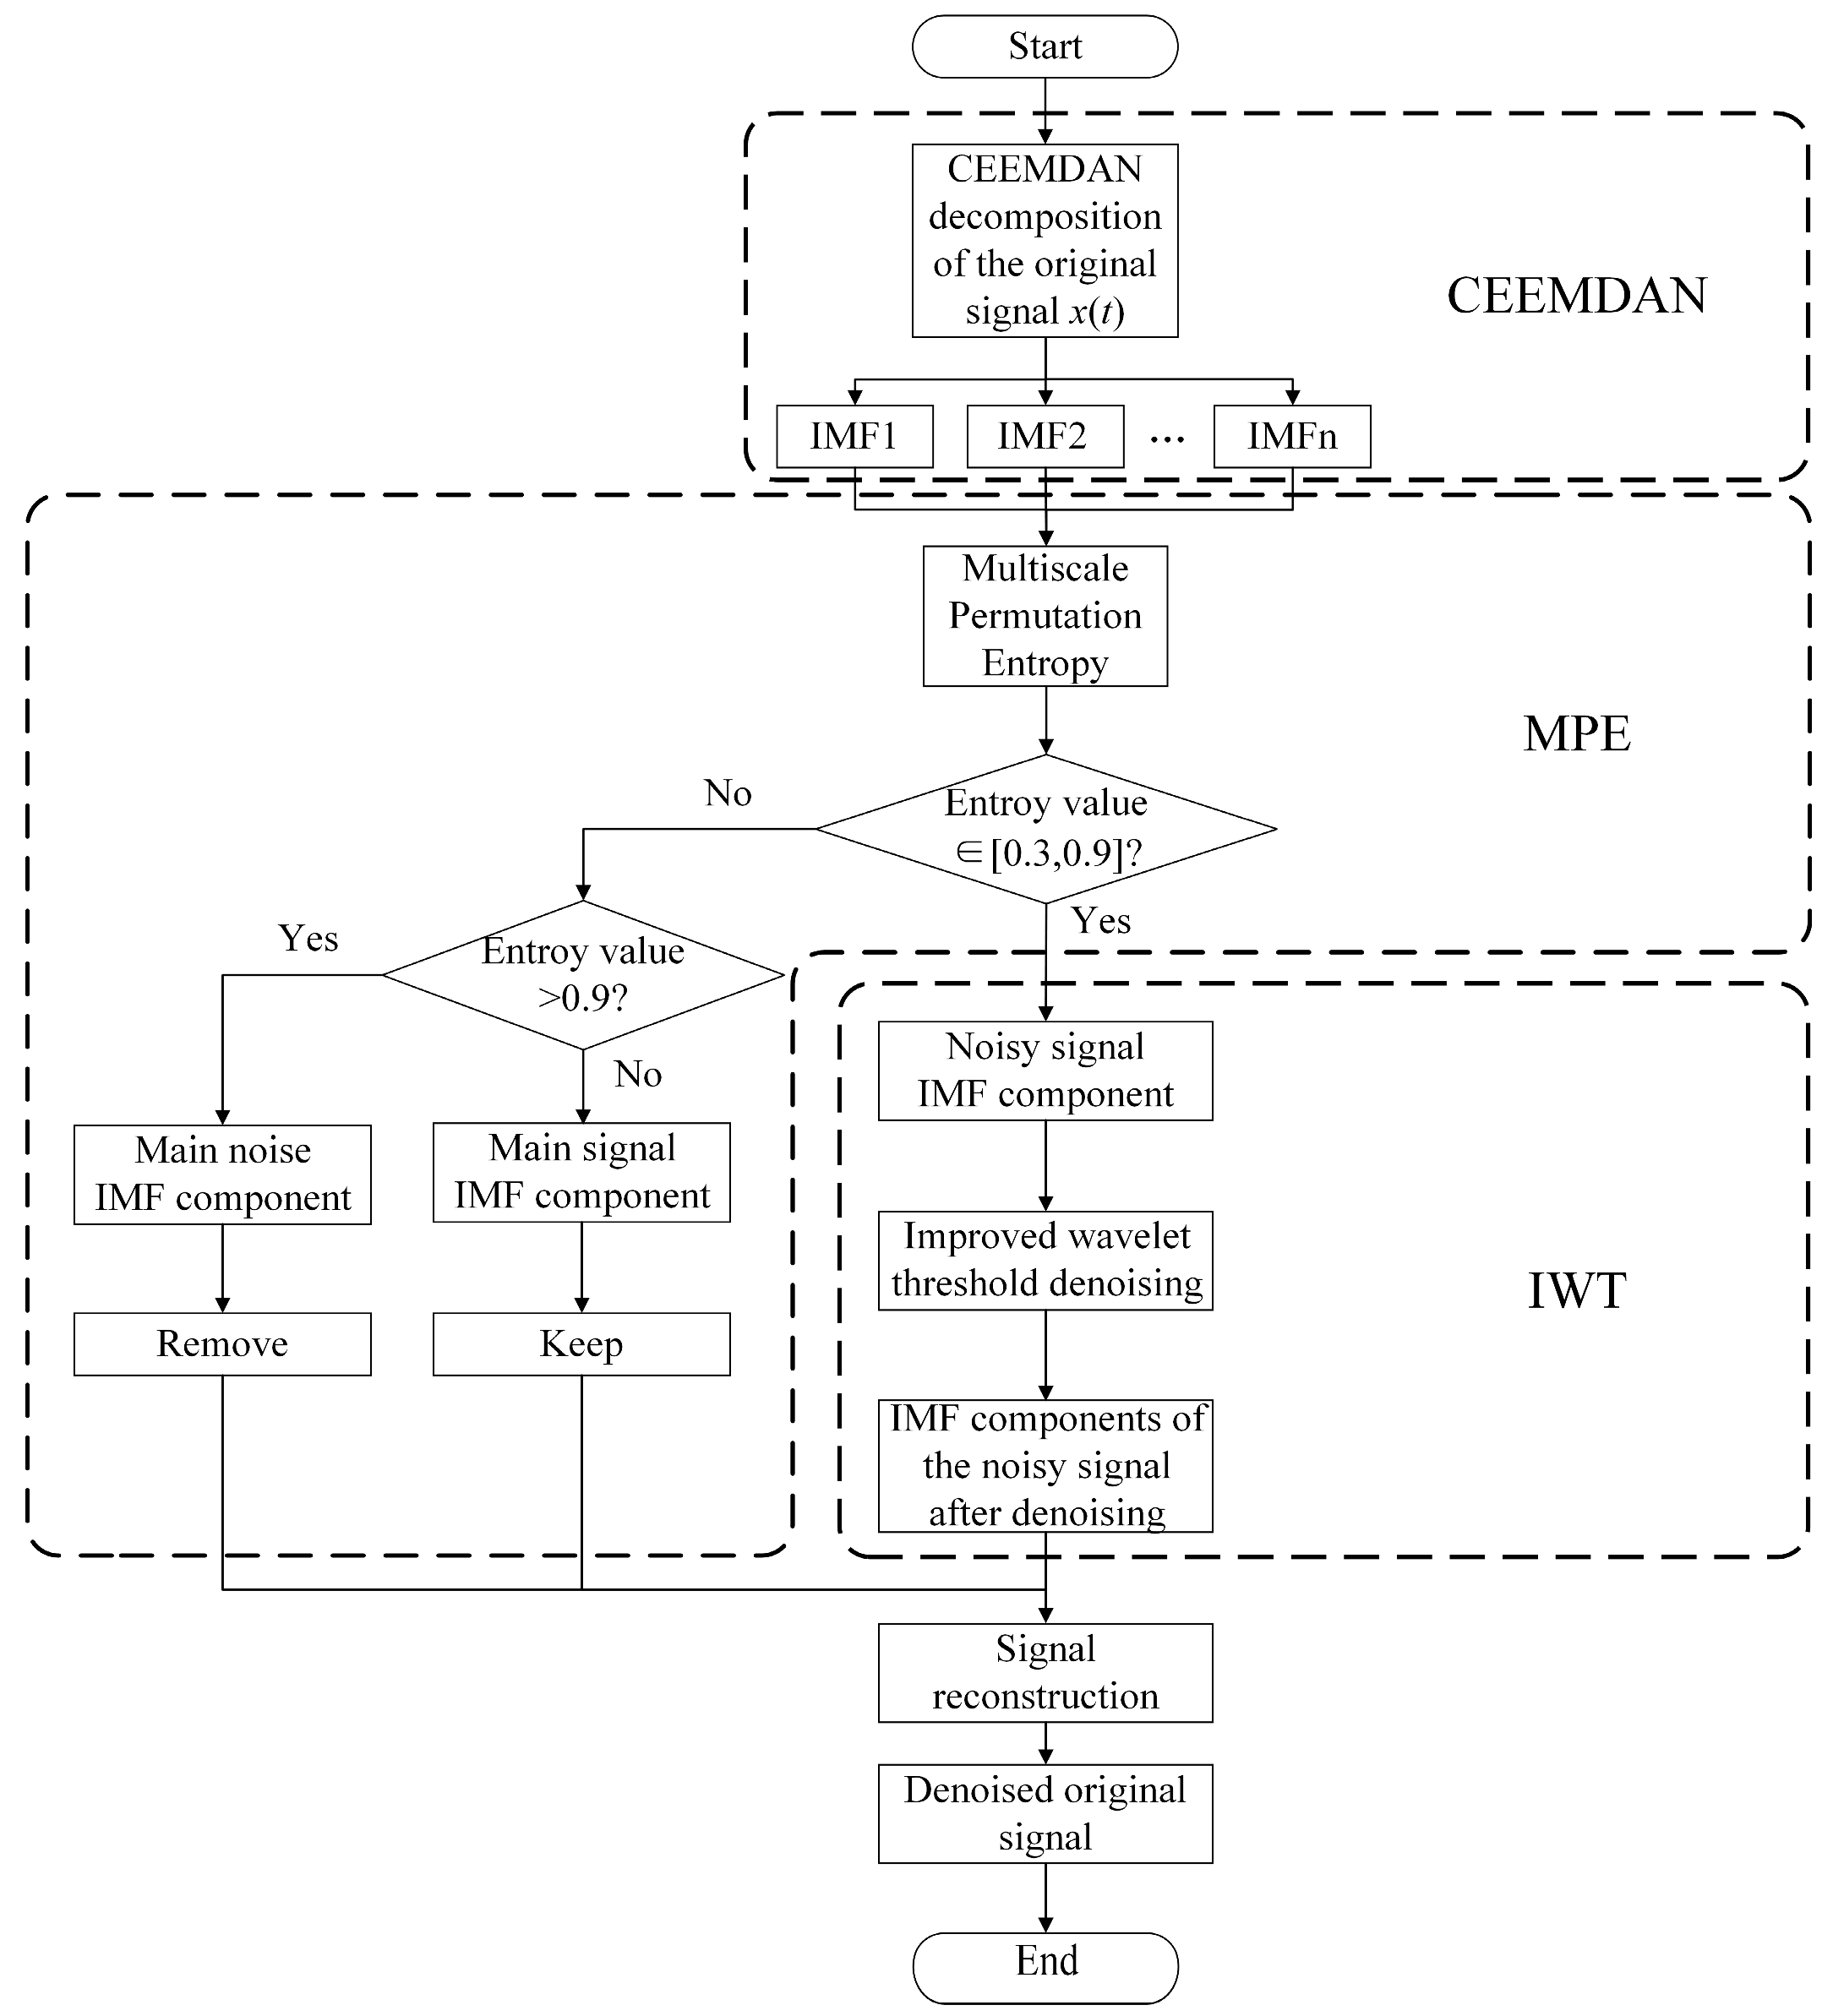
Figure 1. Flowchart of the Denoising Algorithm.
Energies 18 05511 g001
Figure 2. Simulated PD waveforms before and after noise contamination.
Energies 18 05511 g002
Figure 3. Comparison of Denoising Effects of Four Algorithms.
Energies 18 05511 g003aEnergies 18 05511 g003b
Figure 4. Flowchart of the Dual-End Localization Algorithm.
Energies 18 05511 g004
Figure 5. Demonstration of TEO Capturing the Initial Moment of PD Signal.
Energies 18 05511 g005
Figure 6. Comparison of Time Window Trimming Performance.
Energies 18 05511 g006
Figure 7. Wiring Diagram of Wave Velocity Measurement Experiment.
Energies 18 05511 g007
Figure 8. Cable Propagation Velocity–Frequency Curve Measured in Experiment.
Energies 18 05511 g008
Figure 9. Experimental Platform.
Energies 18 05511 g009
Figure 10. Dual-End PD Signals and Denoised Results.
Energies 18 05511 g010
Figure 11. FFT-based Frequency Spectrum of the Measured PD Signal.
Energies 18 05511 g011
Figure 12. Frequency–Wave Velocity Characteristic Curve of PD Signal.
Energies 18 05511 g012
Figure 13. Cluster Diagram of PD Signals.
Energies 18 05511 g013
Table 1. Evaluation of Denoising Performance on Simulated Signals.
Denoising MethodSNRRMSENCC
CEEMDAN + MPE + IWT6.586.63 × 10−50.86
EMD + Wavelet Soft Thresholding6.017.8 × 10−50.78
CEEMDAN + Wavelet Soft Thresholding5.966.94 × 10−50.74
CEEMDAN + Wavelet Hard Thresholding5.286.87 × 10−50.68
Table 2. Localization Error Corresponding to Different CC Coefficient Thresholds.
CC Coefficient ThresholdRelative Error/%
0.257.56
0.31.49
0.351.49
0.41.49
Table 3. Time Consumed by Different Methods.
MethodStepComputational
Complexity
Memory
Requirements/KB
Computation Time/s
traditional methodDenoising12,276,00069,59130
GCC12,276542715
K-means15001.552
proposed methodDenoising12,276,00069,59130
GCC2469217010
K-means15001.552
Table 4. Localization Accuracy of Signals in Different Frequency Bands.
Signal Frequency Band/MHzRelative Error/%
1–308.76%
3–300.43%
5–300.44%
Table 5. Errors of the Methods Used in This Study.
TestSNR/dBLocalization Result/mRelative Error/%Standard Deviation/mMedian Error/m
Cable Length 101.3 m, PD Source Location 11.3 m (surface discharge)3.8510.860.43%3.922.11
Cable Length 27.1 m, PD Source Location 1.5 m (surface discharge)2.691.310.7%2.372.59
Cable Length 52 m, PD Source Location 14 m (surface discharge)3.6414.510.98%3.341
Cable Length 22.2 m, PD Source Location 10.5 m (tip discharge)14.8511.12.7%0.051340.6
Cable Length 22.2 m, PD Source Location 10.5 m (tip discharge)11.4911.12.7%00.6
Table 6. Localization Results.
TestMethodLocalization Result/mRelative
Error/%
Computation Time/s
Cable Length 101.3 m PD Source Location 11.3 msimple peak picking19.688.27%25
energy accumulation23.4511.99%30
GCC 13.782.45%40
proposed method10.860.43%32
Cable Length 27.1 m PD Source Location 1.5 msimple peak picking3.678%22
energy accumulation4.4310.81%23
GCC 2.363.17%25
proposed method1.310.7%22
Cable Length 52 m PD Source Location 14 msimple peak picking18.89.23%23
energy accumulation17.56.73%26
GCC 14.961.85%25
proposed method14.510.98%24
Disclaimer/Publisher’s Note: The statements, opinions and data contained in all publications are solely those of the individual author(s) and contributor(s) and not of MDPI and/or the editor(s). MDPI and/or the editor(s) disclaim responsibility for any injury to people or property resulting from any ideas, methods, instructions or products referred to in the content.